Q2 2020 EARNINGS PRESENTATION August 7, 2020
Disclaimer This presentation may contain forward-looking statements within the meaning of the federal securities laws. Forward-looking statements relate to expectations, beliefs, projections, future plans and strategies, anticipated events or trends and similar expressions concerning matters that are not historical facts. In some cases, you can identify forward-looking statements by the use of forward-looking terminology such as “may,” “will,” “should,” “expects,” “intends,” “plans,” “anticipates,” “believes,” “estimates,” “predicts,” or “potential” or the negative of these words and phrases or similar words or phrases which are predictions of or indicate future events or trends and which do not relate solely to historical matters. You can also identify forward-looking statements by discussions of strategy, plans or intentions. Forward-looking statements involve known and unknown risks, uncertainties, assumptions and contingencies, many of which are beyond the control of Colony Capital, Inc. (the “Company” or “Colony Capital”), and may cause the Company’s actual results to differ significantly from those expressed in any forward-looking statement. Factors that might cause such a difference include, without limitation, the Company’s ability to execute on its digital transformation in the manner and within the timeframe contemplated if at all, the demand for and growth in the digital infrastructure market, the earnings profile for digital investments and the predictability of such earnings, the potential impact of COVID-19 on the Company’s business and operations, including the ability to execute on or accelerate the Company’s initiatives related to its strategic pivot to digital real estate and infrastructure, whether the Company will achieve its projected deployment rate in digital infrastructure, whether the Company will realize the anticipated benefits of Wafra’s strategic investment in the Company’s digital investment management business, including whether the Wafra investment will become subject to redemption and the amount of commitments Wafra will make to the Company’s digital investment products, whether the Company will realize the anticipated benefits of its investment in Vantage Data Centers, including the performance and stability of its portfolio, the impact of the Company’s capital structure on the trading price of its stock, whether the Company’s liquidity will be sufficient to fund growth in digital transformation, the Company’s ability to monetize certain legacy assets, simplify its business and continue to grow its digital assets under management, whether balance sheet investments combined with investment management will result in anticipated benefits for the Company’s stockholders, the impact of management changes at Colony Credit Real Estate, Inc. (CLNC), whether the Company’s operations of its non-digital business units will result in maximizing cash flows and value over time, including the impact of COVID-19 on such operations and cash flows, the impact of impairments, the mix of the Company’s digital and legacy asset portfolios, the impact of changes to the Company’s management or board of directors, employee and organizational structure, the Company’s financial flexibility and liquidity, including borrowing capacity under its revolving credit facility (including as a result of the impact of COVID-19), the use of sales proceeds and available liquidity, the performance of the Company’s investment in CLNC (including as a result of the impact of COVID-19), the Company’s ability to minimize balance sheet commitments to its managed investment vehicles, the performance of the Company’s investment in DataBank and whether the Company will continue to invest in edge/ colocation data center sector and support future growth opportunities through potential add-on acquisitions and greenfield edge data center developments, and whether if consummated such additional investments and growth opportunities result in any of the benefits the Company anticipates or at all, rent escalators, whether the Company’s future investments will be accretive, the Company’s ability to raise third party capital in new vehicles including through new strategies, whether the Company will continue to generate liquidity by additional sales of assets in its Other Equity and Debt segment (other than Digital related investments) within the timeframe, in the amounts targeted or at all, the Company's expected taxable income and net cash flows, excluding the contribution of gains, whether the Company will maintain or produce higher Core FFO per share (including or excluding gains and losses from sales of certain investments) in the coming quarters, or ever, the Company’s fee earning equity under management (FEEUM) and its ability to continue growth at the current pace or at all, the Company’s ability to pay or grow the dividend at all in the future, whether the Company will continue to pay preferred dividends, the Company’s trading multiples, the ability to achieve targeted G&A savings including the impact of such savings of the Company’s operations, the impact of any changes to the Company’s management agreements with NorthStar Healthcare Income, Inc. and CLNC and other managed investment vehicles, whether Colony Capital will be able to maintain its qualification as a REIT for U.S. federal income tax purposes, the timing of and ability to deploy available capital, including whether any redeployment of capital will generate higher total returns, the Company’s ability to maintain inclusion and relative performance on the RMZ, Colony Capital’s leverage, including the Company’s ability to reduce debt and the timing and amount of borrowings under its credit facility, increased interest rates and operating costs, adverse economic or real estate developments in Colony Capital’s markets, Colony Capital’s failure to successfully operate or lease acquired properties, decreased rental rates, increased vacancy rates or failure to renew or replace expiring leases, increased costs of capital expenditures, defaults on or non-renewal of leases by tenants, the impact of economic conditions on the borrowers of Colony Capital’s commercial real estate debt investments and the commercial mortgage loans underlying its commercial mortgage backed securities, adverse general and local economic conditions, an unfavorable capital market environment, decreased leasing activity or lease renewals, and other risks and uncertainties, including those detailed in the Company’s Annual Report on Form 10-K for the fiscal year ended December 31, 2019 and Quarterly Report on Form 10-Q for the quarter ended March 31, 2020, under the heading “Risk Factors,” as such factors may be updated from time to time in our subsequent periodic filings with the U.S. Securities and Exchange Commission (“SEC”). All forward-looking statements reflect Colony Capital’s good faith beliefs, assumptions and expectations, but they are not guarantees of future performance. Additional information about these and other factors can be found in Colony Capital’s reports filed from time to time with the SEC. Colony Capital cautions investors not to unduly rely on any forward-looking statements. The forward-looking statements speak only as of the date of this presentation. Colony Capital is under no duty to update any of these forward-looking statements after the date of this presentation, nor to conform prior statements to actual results or revised expectations, and Colony Capital does not intend to do so. This presentation may contain statistics and other data that has been obtained or compiled from information made available by third-party service providers. Colony Capital has not independently verified such statistics or data. This presentation is for informational purposes only and does not constitute an offer to sell or a solicitation of an offer to buy any securities of Colony Capital. This information is not intended to be indicative of future results. Actual performance of Colony Capital may vary materially. 2
Agenda # Section 1 Current State of Digital Infrastructure 2 Delivering On Our Commitments 3 Q2 Financial Results 4 Executing The Digital Playbook 5 Why Own CLNY Today 6 Q&A Session 3
1 Current State Of Digital Infrastructure
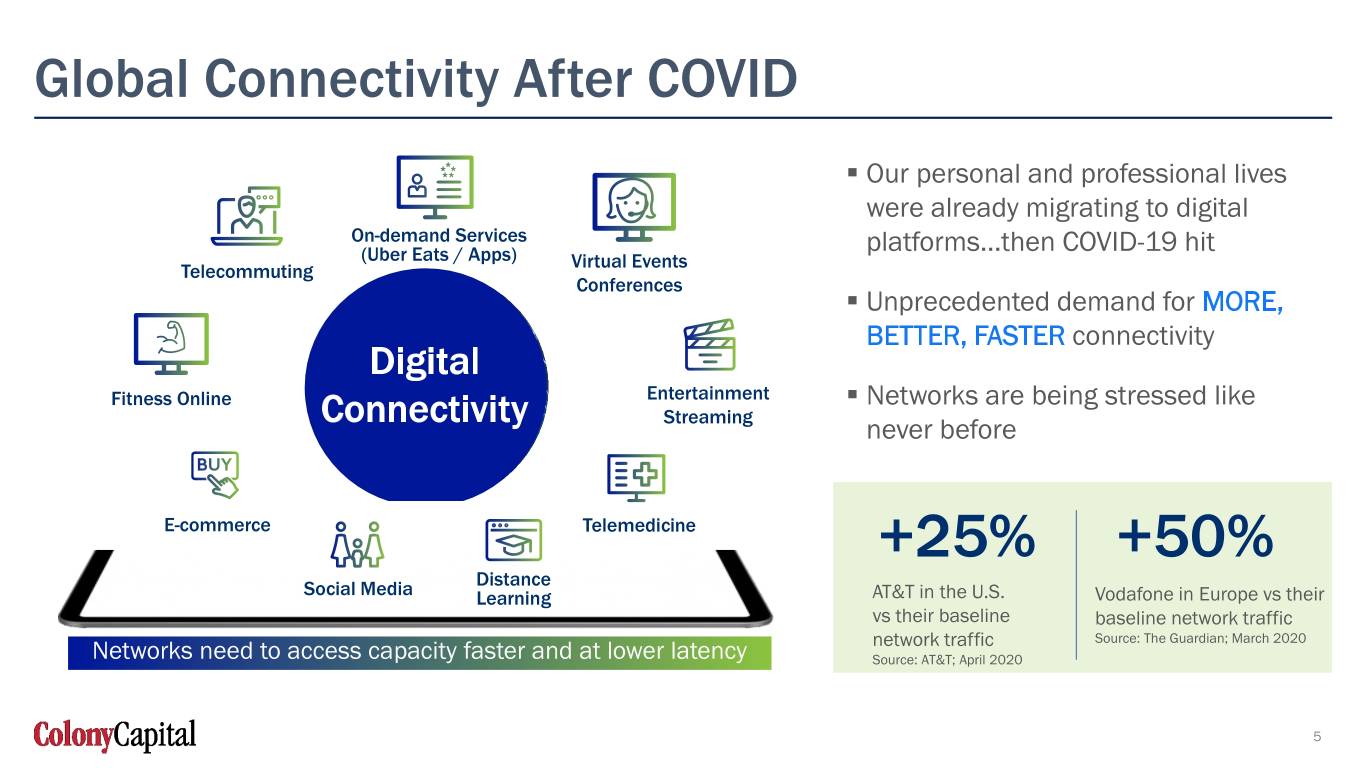
Global Connectivity After COVID . Our personal and professional lives were already migrating to digital On-demand Services platforms…then COVID-19 hit (Uber Eats / Apps) Virtual Events Telecommuting Conferences . Unprecedented demand for MORE, BETTER, FASTER connectivity Digital Fitness Online Entertainment . Networks are being stressed like Connectivity Streaming never before E-commerce Telemedicine +25% +50% Distance Social Media Learning AT&T in the U.S. Vodafone in Europe vs their vs their baseline baseline network traffic network traffic Source: The Guardian; March 2020 Networks need to access capacity faster and at lower latency Source: AT&T; April 2020 5
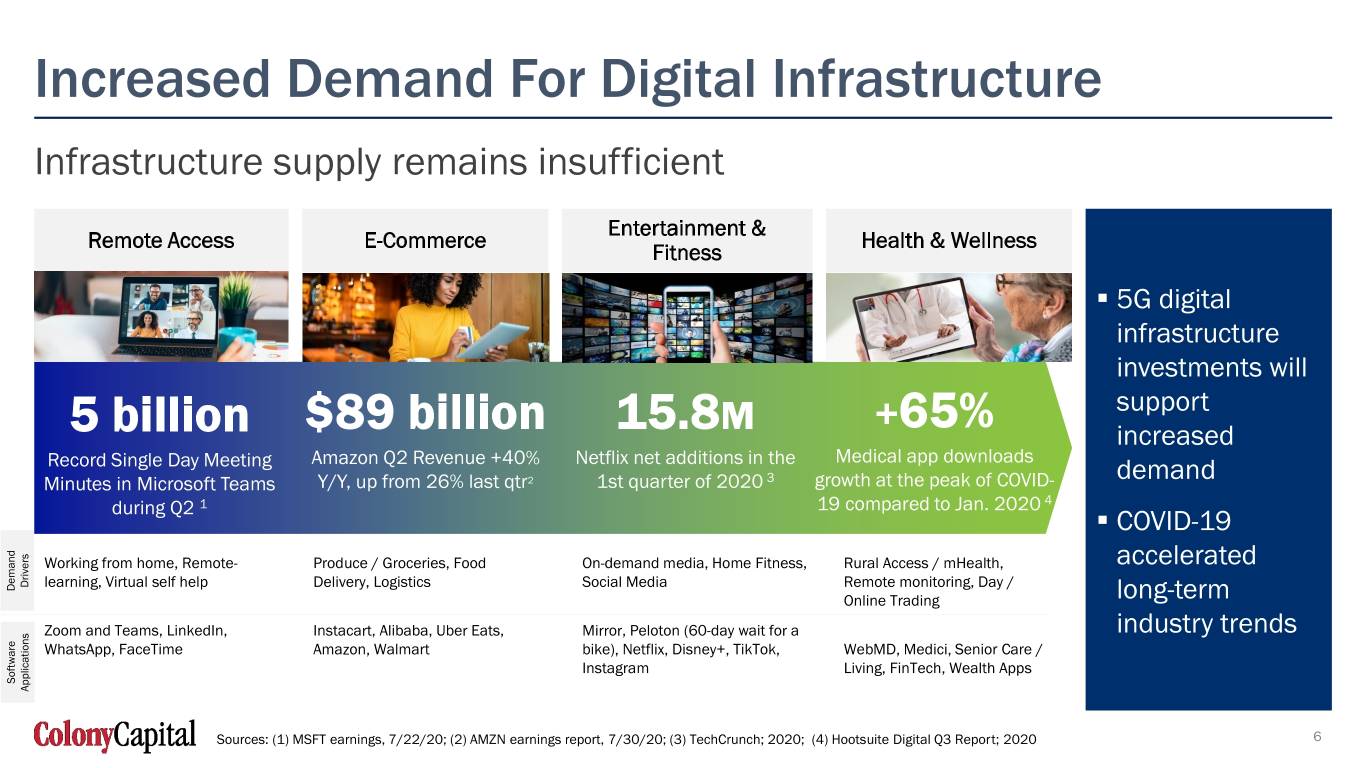
Increased Demand For Digital Infrastructure Infrastructure supply remains insufficient Entertainment & Remote Access E-Commerce Health & Wellness Fitness . 5G digital infrastructure investments will + support 5 billion $89 billion 15.8M 65% increased Record Single Day Meeting Amazon Q2 Revenue +40% Netflix net additions in the Medical app downloads demand Minutes in Microsoft Teams Y/Y, up from 26% last qtr2 1st quarter of 2020 3 growth at the peak of COVID- 1 19 compared to Jan. 2020 4 during Q2 . COVID-19 Working from home, Remote- Produce / Groceries, Food On-demand media, Home Fitness, Rural Access / mHealth, accelerated Drivers learning, Virtual self help Delivery, Logistics Social Media Remote monitoring, Day / Demand Demand Online Trading long-term Zoom and Teams, LinkedIn, Instacart, Alibaba, Uber Eats, Mirror, Peloton (60-day wait for a industry trends WhatsApp, FaceTime Amazon, Walmart bike), Netflix, Disney+, TikTok, WebMD, Medici, Senior Care / Instagram Living, FinTech, Wealth Apps Software Applications Sources: (1) MSFT earnings, 7/22/20; (2) AMZN earnings report, 7/30/20; (3) TechCrunch; 2020; (4) Hootsuite Digital Q3 Report; 2020 6
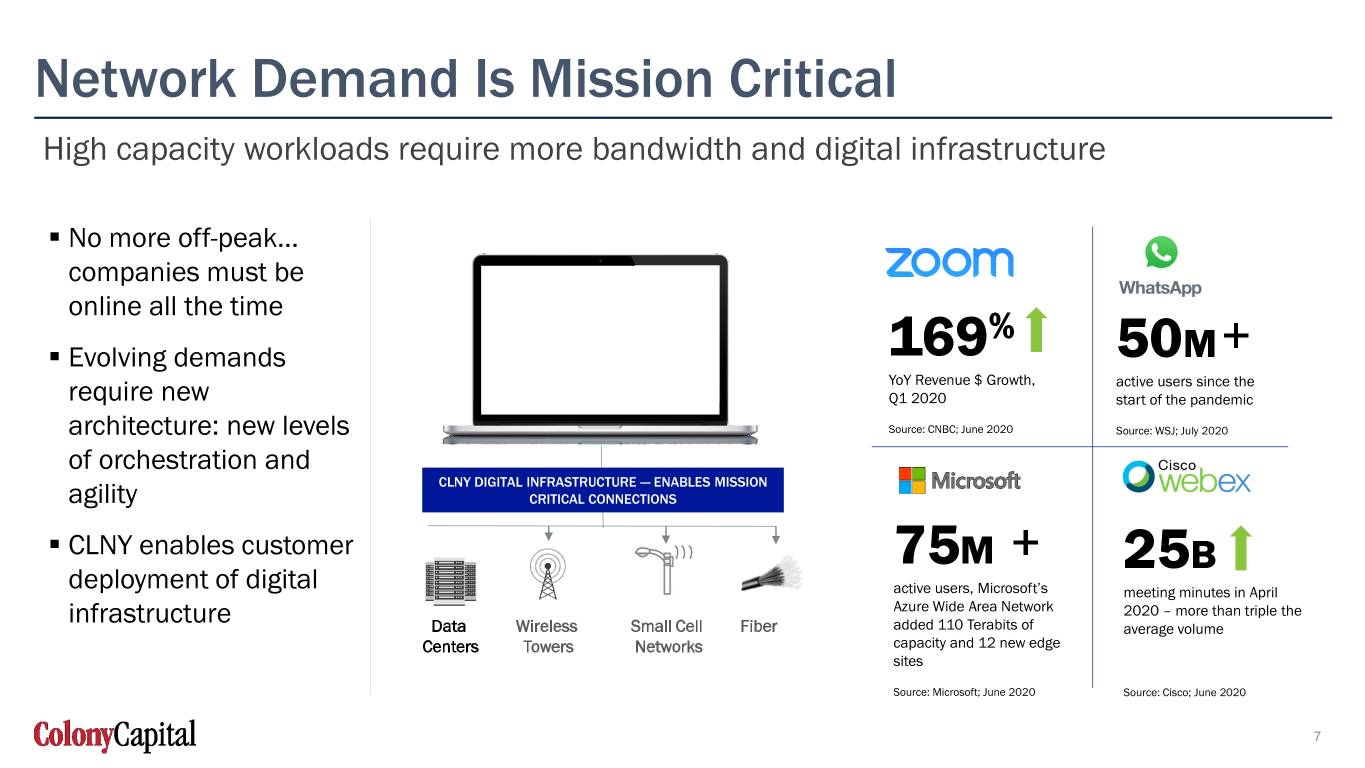
Network Demand Is Mission Critical High capacity workloads require more bandwidth and digital infrastructure . No more off-peak… companies must be online all the time % . Evolving demands 169 50M+ YoY Revenue $ Growth, active users since the require new Q1 2020 start of the pandemic architecture: new levels Source: CNBC; June 2020 Source: WSJ; July 2020 of orchestration and CLNY DIGITAL INFRASTRUCTURE — ENABLES MISSION agility CRITICAL CONNECTIONS . CLNY enables customer 75M + 25B deployment of digital active users, Microsoft’s meeting minutes in April infrastructure Azure Wide Area Network 2020 – more than triple the Data Wireless Small Cell Fiber added 110 Terabits of average volume Centers Towers Networks capacity and 12 new edge sites Source: Microsoft; June 2020 Source: Cisco; June 2020 7
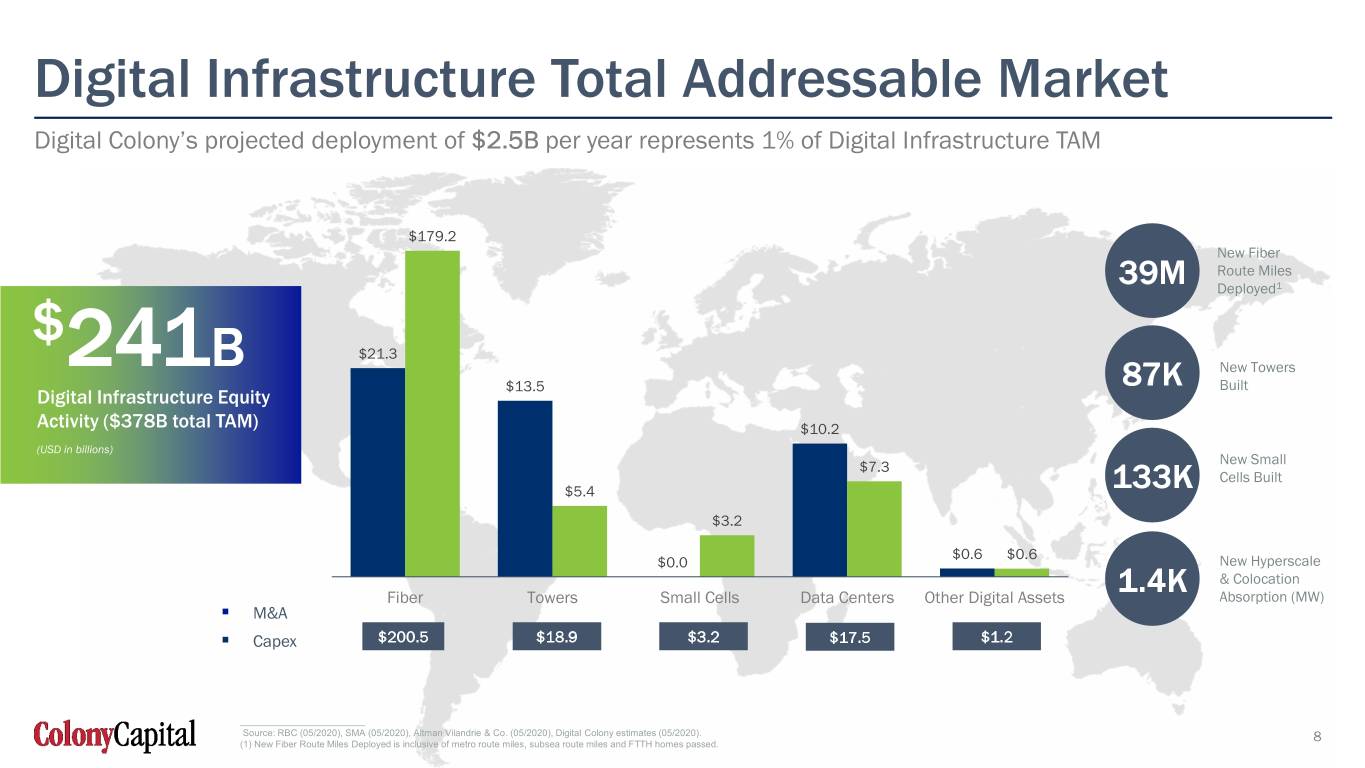
Digital Infrastructure Total Addressable Market Digital Colony’s projected deployment of $2.5B per year represents 1% of Digital Infrastructure TAM $179.2 New Fiber Route Miles 39M Deployed1 $ $21.3 241B New Towers $13.5 87K Built Digital Infrastructure Equity Activity ($378B total TAM) $10.2 (USD in billions) New Small $7.3 Cells Built $5.4 133K $3.2 $0.6 $0.6 $0.0 New Hyperscale & Colocation Fiber Towers Small Cells Data Centers Other Digital Assets 1.4K Absorption (MW) . M&A . Capex $200.5 $18.9 $3.2 $17.5 $1.2 ___________________________ Source: RBC (05/2020), SMA (05/2020), Altman Vilandrie & Co. (05/2020), Digital Colony estimates (05/2020). 8 (1) New Fiber Route Miles Deployed is inclusive of metro route miles, subsea route miles and FTTH homes passed.
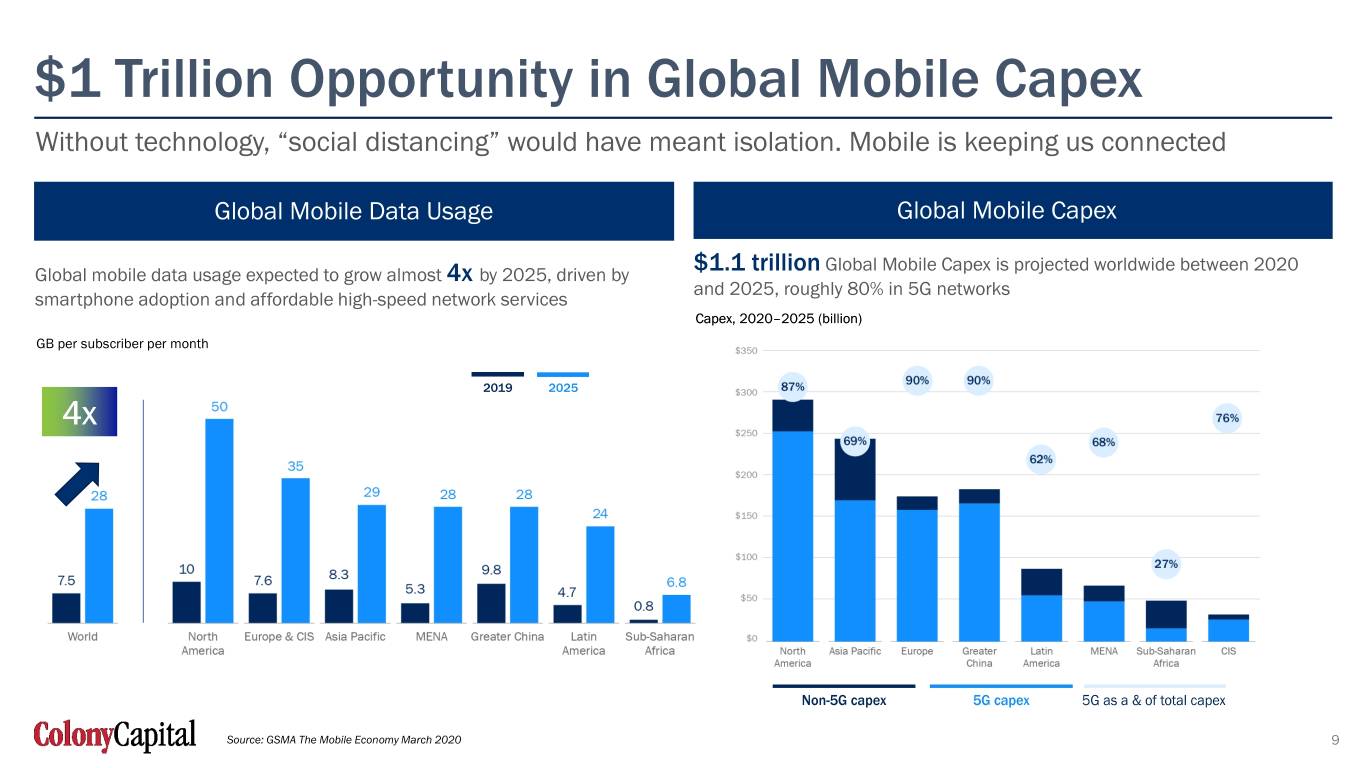
$1 Trillion Opportunity in Global Mobile Capex Without technology, “social distancing” would have meant isolation. Mobile is keeping us connected Global Mobile Data Usage Global Mobile Capex $1.1 trillion Global Mobile Capex is projected worldwide between 2020 Global mobile data usage expected to grow almost 4x by 2025, driven by and 2025, roughly 80% in 5G networks smartphone adoption and affordable high-speed network services Capex, 2020–2025 (billion) GB per subscriber per month 4x Source: GSMA The Mobile Economy March 2020 9
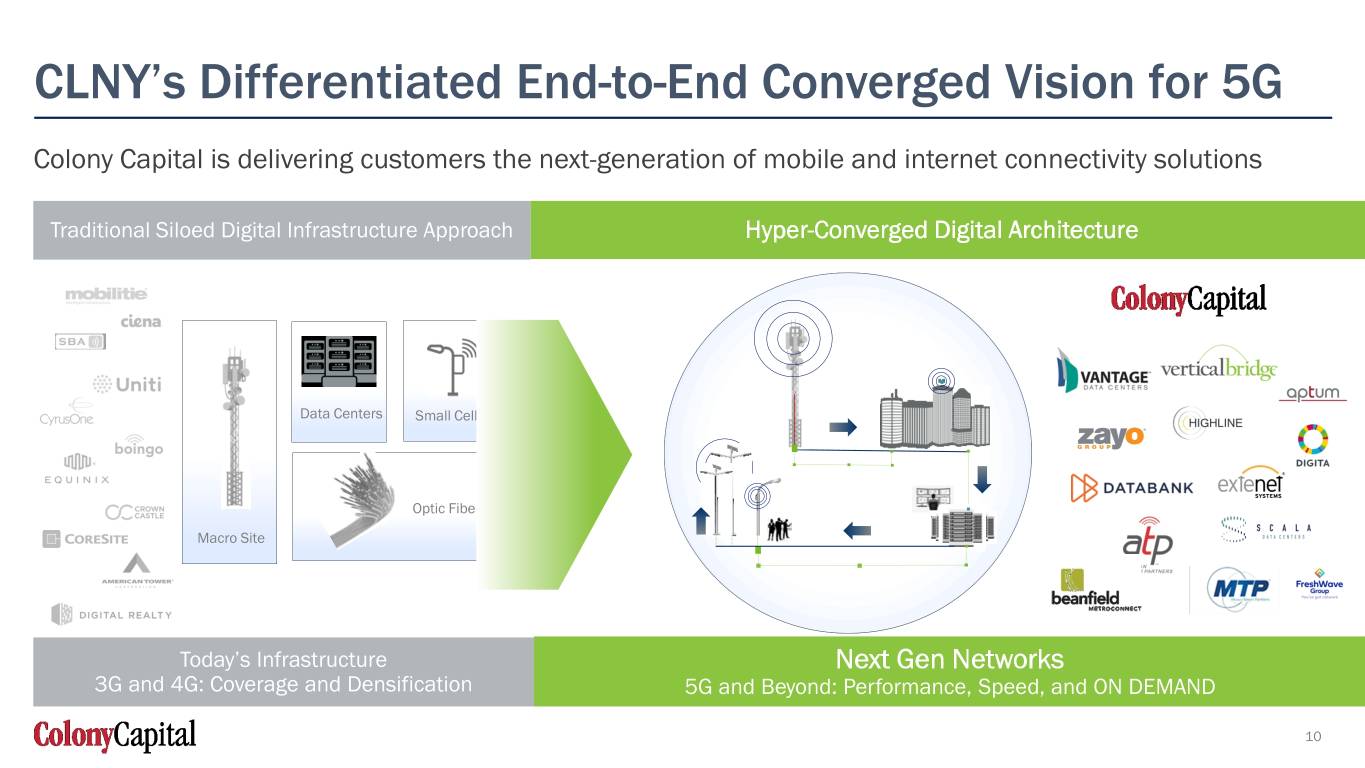
CLNY’s Differentiated End-to-End Converged Vision for 5G Colony Capital is delivering customers the next-generation of mobile and internet connectivity solutions Traditional Siloed Digital Infrastructure Approach Hyper-Converged Digital Architecture Data Centers Small Cells Optic Fiber Macro Site Today’s Infrastructure Next Gen Networks 3G and 4G: Coverage and Densification 5G and Beyond: Performance, Speed, and ON DEMAND 10
2 Delivering On Our Commitments
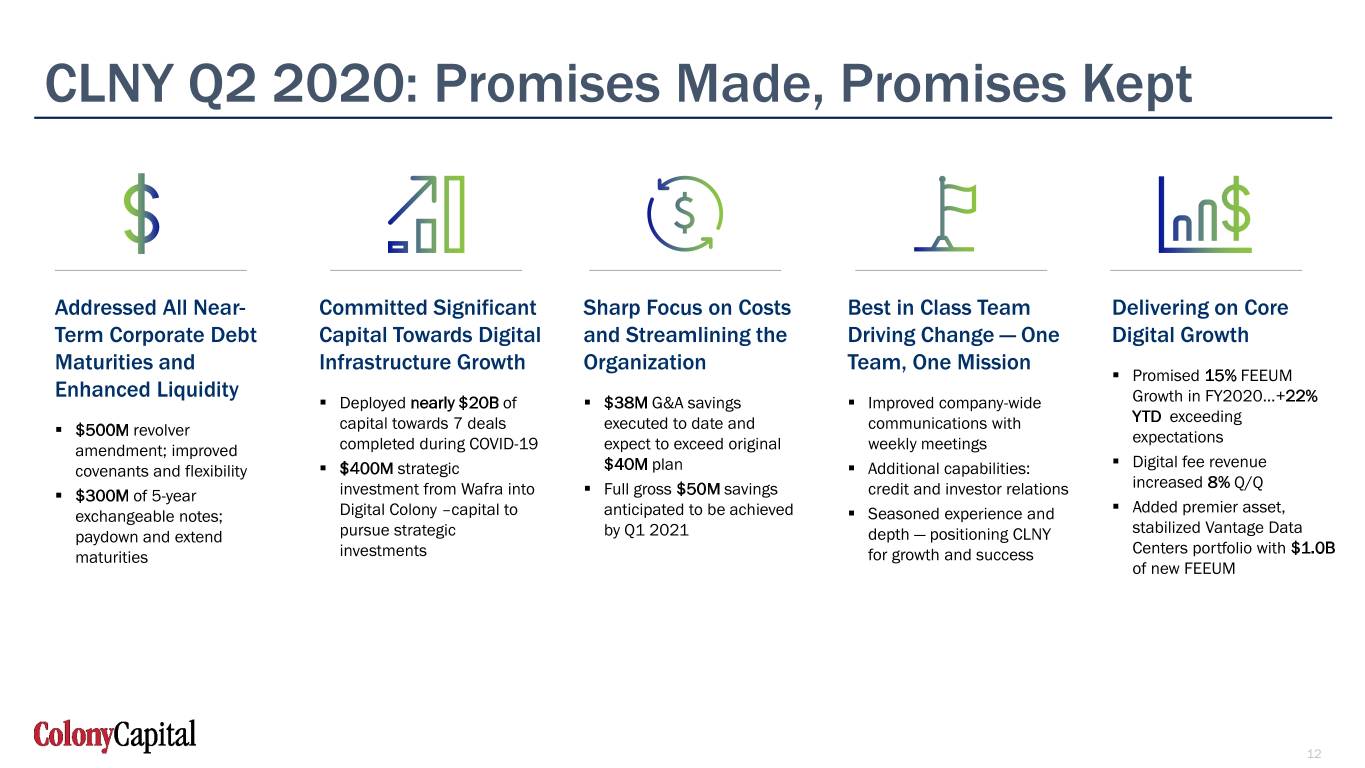
CLNY Q2 2020: Promises Made, Promises Kept Addressed All Near- Committed Significant Sharp Focus on Costs Best in Class Team Delivering on Core Term Corporate Debt Capital Towards Digital and Streamlining the Driving Change — One Digital Growth Maturities and Infrastructure Growth Organization Team, One Mission . Promised 15% FEEUM Enhanced Liquidity . Deployed nearly $20B of . $38M G&A savings . Improved company-wide Growth in FY2020…+22% capital towards 7 deals executed to date and communications with YTD exceeding . $500M revolver expectations amendment; improved completed during COVID-19 expect to exceed original weekly meetings . Digital fee revenue covenants and flexibility . $400M strategic $40M plan . Additional capabilities: increased 8% Q/Q . $300M of 5-year investment from Wafra into . Full gross $50M savings credit and investor relations . Added premier asset, exchangeable notes; Digital Colony –capital to anticipated to be achieved . Seasoned experience and stabilized Vantage Data paydown and extend pursue strategic by Q1 2021 depth — positioning CLNY Centers portfolio with $1.0B maturities investments for growth and success of new FEEUM 12
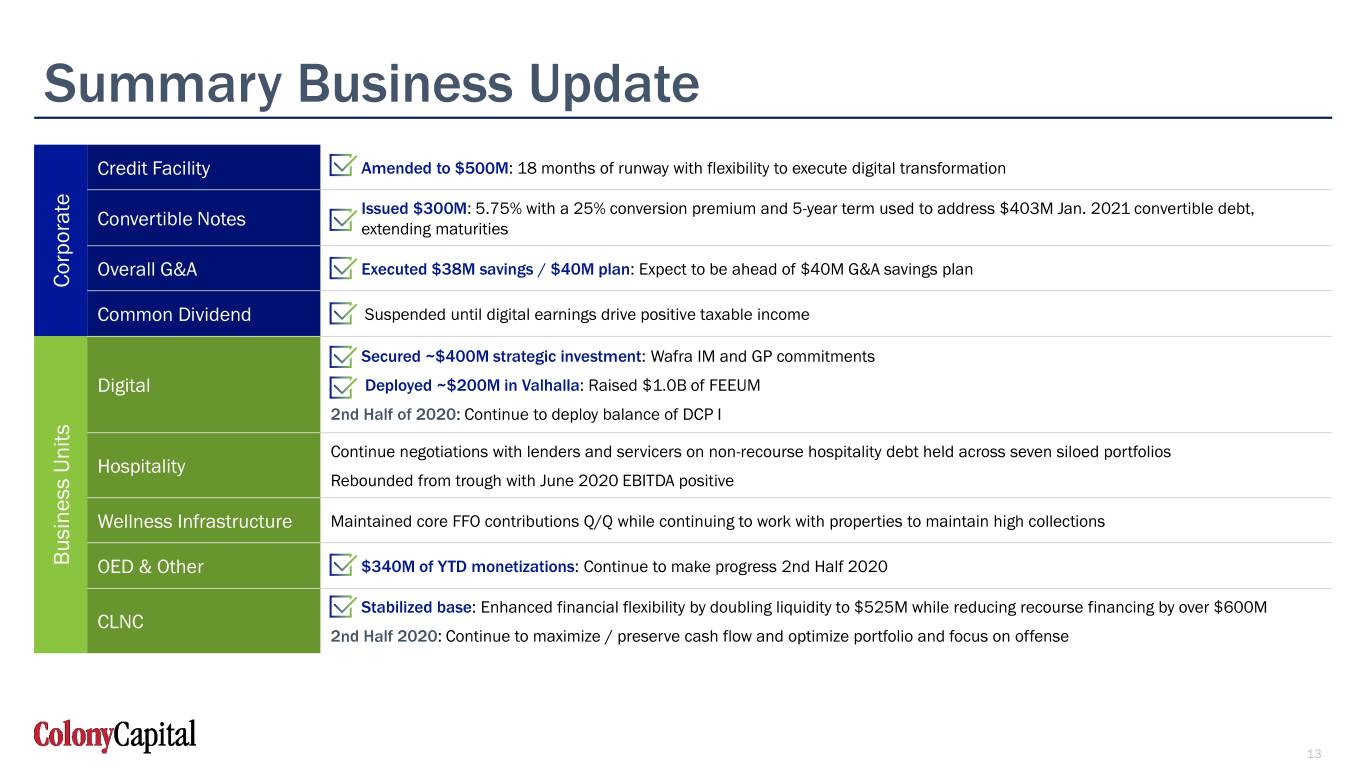
Summary Business Update Credit Facility Amended to $500M: 18 months of runway with flexibility to execute digital transformation Issued $300M: 5.75% with a 25% conversion premium and 5-year term used to address $403M Jan. 2021 convertible debt, Convertible Notes extending maturities Overall G&A Executed $38M savings / $40M plan: Expect to be ahead of $40M G&A savings plan Corporate Common Dividend Suspended until digital earnings drive positive taxable income Secured ~$400M strategic investment: Wafra IM and GP commitments Digital Deployed ~$200M in Valhalla: Raised $1.0B of FEEUM 2nd Half of 2020: Continue to deploy balance of DCP I Continue negotiations with lenders and servicers on non-recourse hospitality debt held across seven siloed portfolios Hospitality Rebounded from trough with June 2020 EBITDA positive Wellness Infrastructure Maintained core FFO contributions Q/Q while continuing to work with properties to maintain high collections Business Units Business OED & Other $340M of YTD monetizations: Continue to make progress 2nd Half 2020 Stabilized base: Enhanced financial flexibility by doubling liquidity to $525M while reducing recourse financing by over $600M CLNC 2nd Half 2020: Continue to maximize / preserve cash flow and optimize portfolio and focus on offense 13
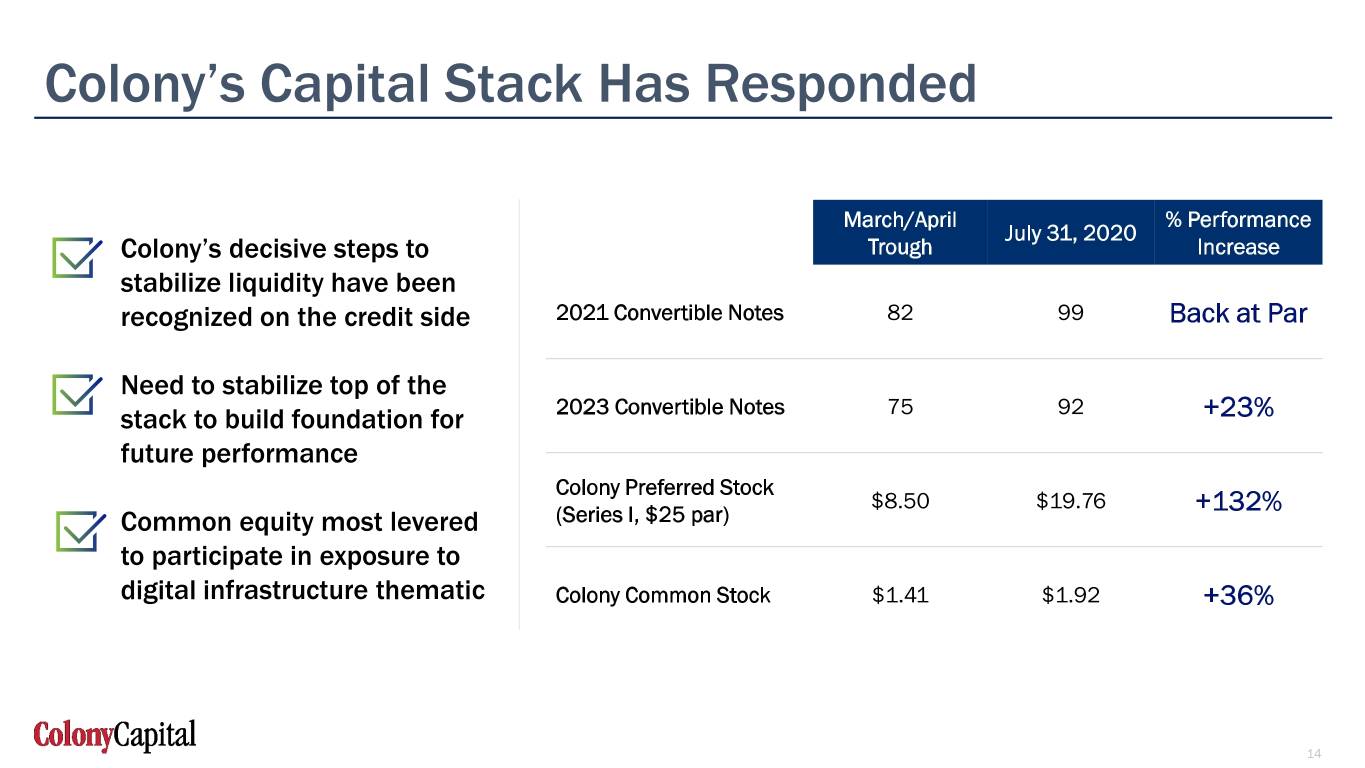
Colony’s Capital Stack Has Responded March/April % Performance July 31, 2020 Colony’s decisive steps to Trough Increase stabilize liquidity have been recognized on the credit side 2021 Convertible Notes 82 99 Back at Par Need to stabilize top of the stack to build foundation for 2023 Convertible Notes 75 92 +23% future performance Colony Preferred Stock $8.50 $19.76 +132% Common equity most levered (Series I, $25 par) to participate in exposure to digital infrastructure thematic Colony Common Stock $1.41 $1.92 +36% 14
3 Q2 Financial Results
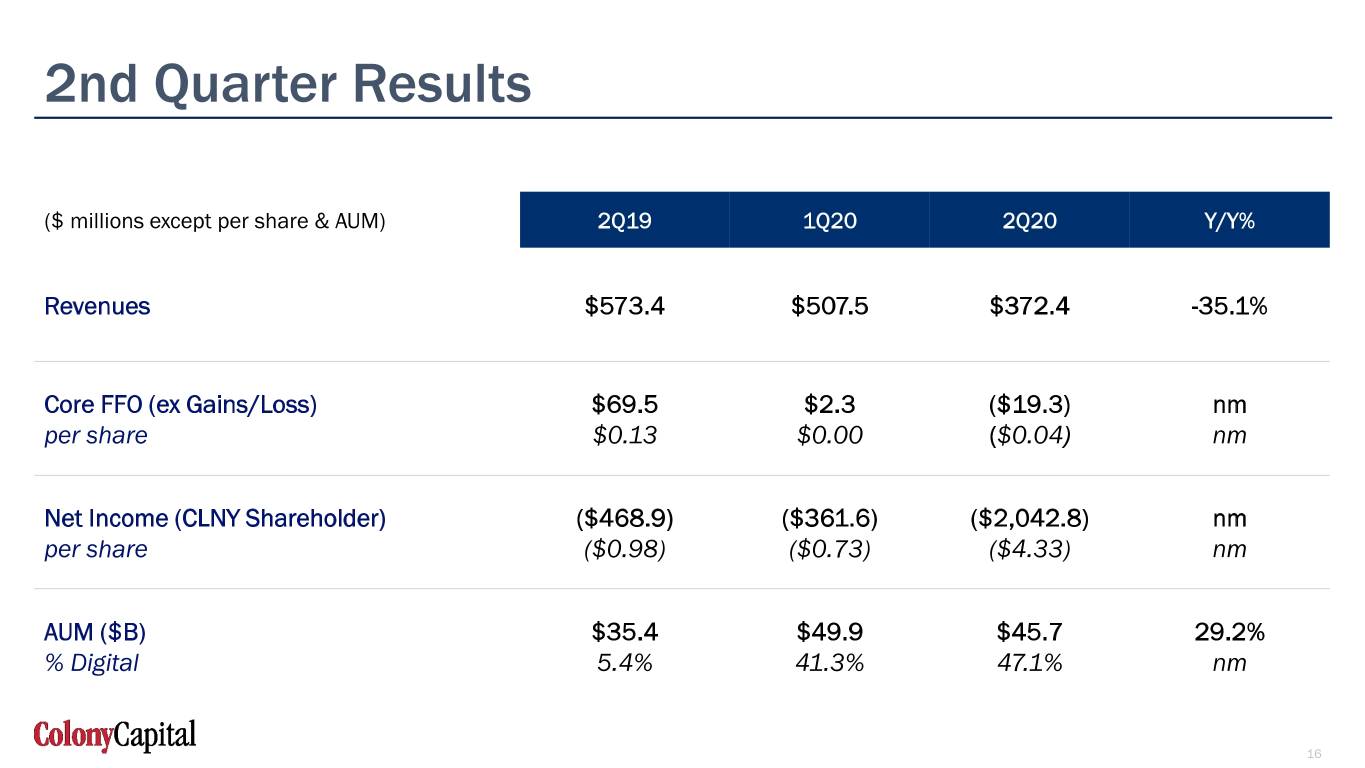
2nd Quarter Results ($ millions except per share & AUM) 2Q19 1Q20 2Q20 Y/Y% Revenues $573.4 $507.5 $372.4 -35.1% Core FFO (ex Gains/Loss) $69.5 $2.3 ($19.3) nm per share $0.13 $0.00 ($0.04) nm Net Income (CLNY Shareholder) ($468.9) ($361.6) ($2,042.8) nm per share ($0.98) ($0.73) ($4.33) nm AUM ($B) $35.4 $49.9 $45.7 29.2% % Digital 5.4% 41.3% 47.1% nm 16
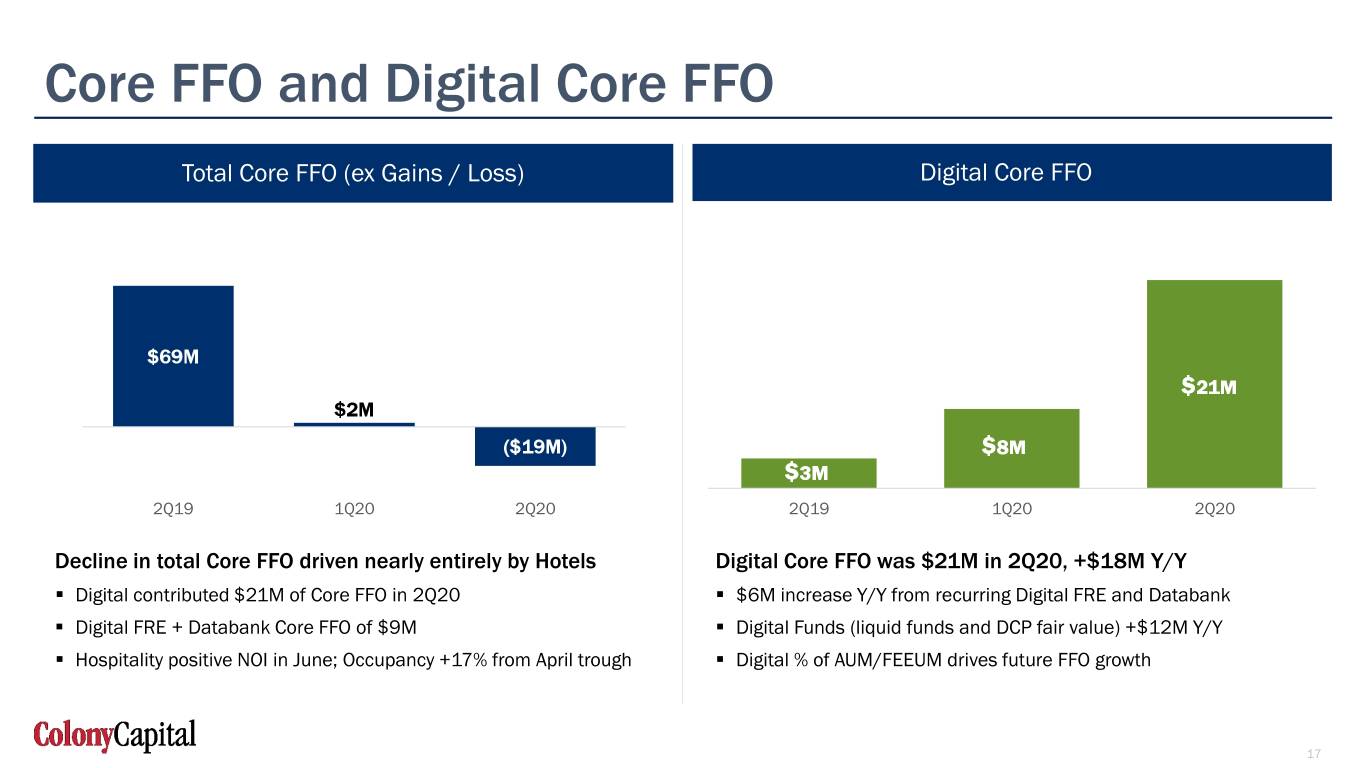
Core FFO and Digital Core FFO Total Core FFO (ex Gains / Loss) Digital Core FFO $69M $21M $2M ($19M) $8M $3M 2Q19 1Q20 2Q20 2Q19 1Q20 2Q20 Decline in total Core FFO driven nearly entirely by Hotels Digital Core FFO was $21M in 2Q20, +$18M Y/Y . Digital contributed $21M of Core FFO in 2Q20 . $6M increase Y/Y from recurring Digital FRE and Databank . Digital FRE + Databank Core FFO of $9M . Digital Funds (liquid funds and DCP fair value) +$12M Y/Y . Hospitality positive NOI in June; Occupancy +17% from April trough . Digital % of AUM/FEEUM drives future FFO growth 17
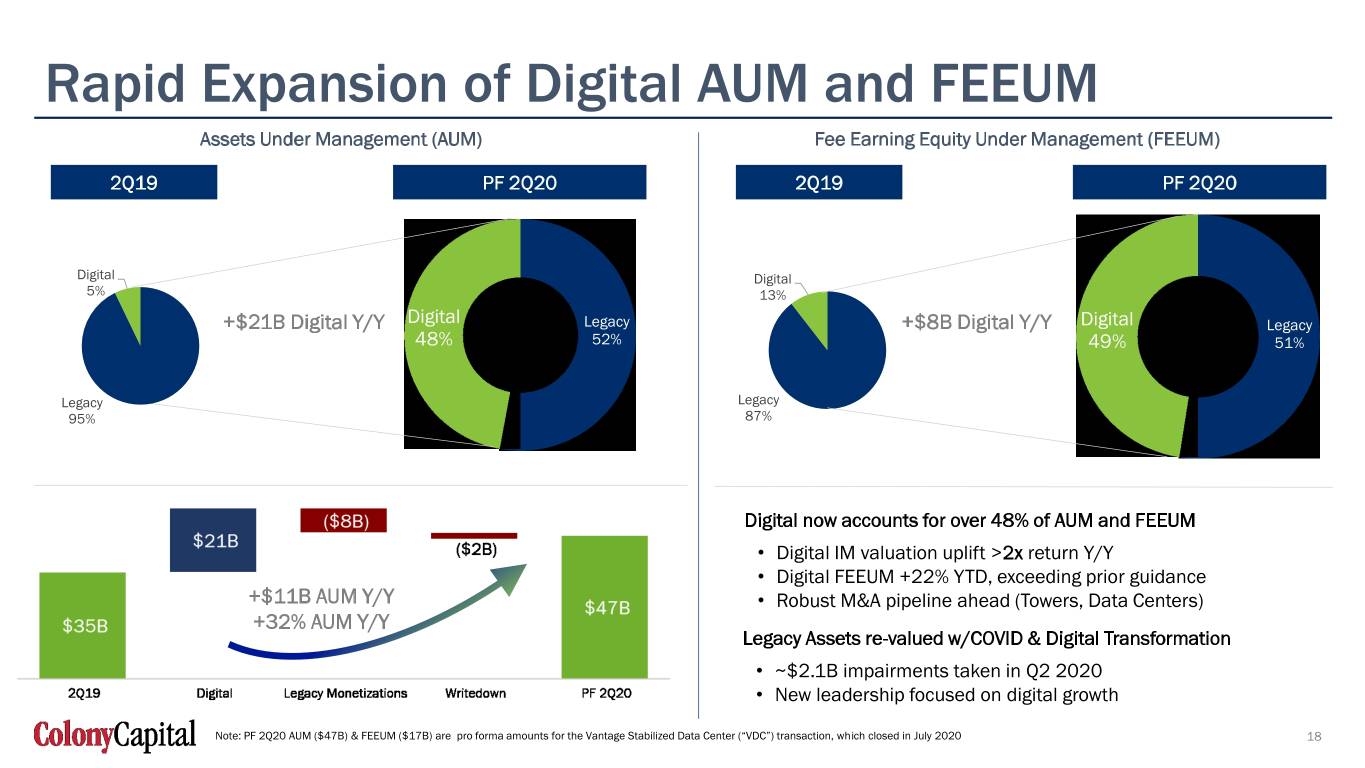
Rapid Expansion of Digital AUM and FEEUM Assets Under Management (AUM) Fee Earning Equity Under Management (FEEUM) 2Q19 PF 2Q20 2Q19 PF 2Q20 Digital Digital 5% 13% +$21B Digital Y/Y Digital Legacy +$8B Digital Y/Y Digital Legacy 48% $47B 52% 49% $17B 51% Legacy Legacy 95% 87% Digital now accounts for over 48% of AUM and FEEUM • Digital IM valuation uplift >2x return Y/Y • Digital FEEUM +22% YTD, exceeding prior guidance +$11B AUM Y/Y • Robust M&A pipeline ahead (Towers, Data Centers) +32% AUM Y/Y Legacy Assets re-valued w/COVID & Digital Transformation • ~$2.1B impairments taken in Q2 2020 • New leadership focused on digital growth Note: PF 2Q20 AUM ($47B) & FEEUM ($17B) are pro forma amounts for the Vantage Stabilized Data Center (“VDC”) transaction, which closed in July 2020 18
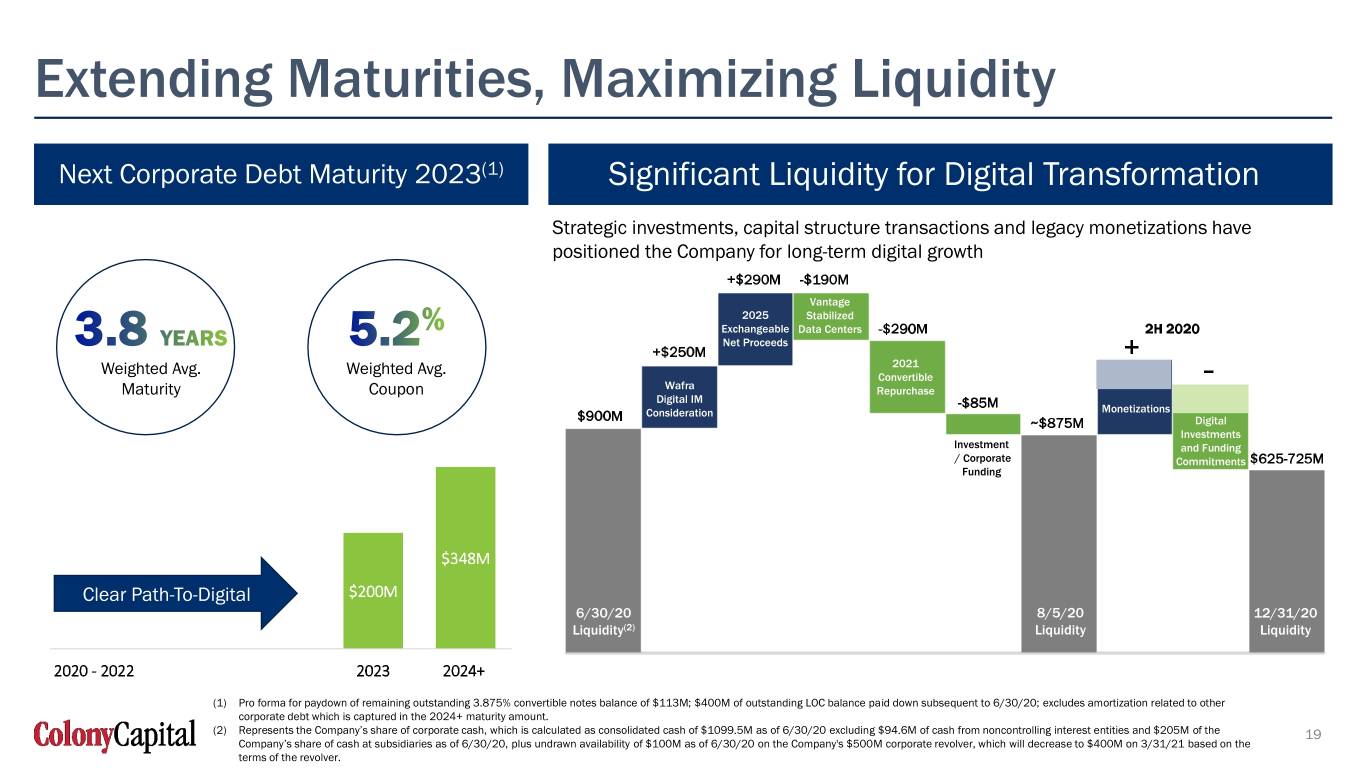
Extending Maturities, Maximizing Liquidity Next Corporate Debt Maturity 2023(1) Significant Liquidity for Digital Transformation Strategic investments, capital structure transactions and legacy monetizations have positioned the Company for long-term digital growth +$290M -$190M Vantage 2025 Stabilized Exchangeable Data Centers -$290M 2H 2020 Net Proceeds +$250M + Weighted Avg. Weighted Avg. 2021 Convertible - Maturity Coupon Wafra Repurchase Digital IM -$85M Monetizations $900M Consideration ~$875M Digital Investments Investment and Funding / Corporate Commitments $625-725M Funding $348M Clear Path-To-Digital $200M 6/30/20 8/5/20 12/31/20 Liquidity(2) Liquidity Liquidity 2020 - 2022 2023 2024+ (1) Pro forma for paydown of remaining outstanding 3.875% convertible notes balance of $113M; $400M of outstanding LOC balance paid down subsequent to 6/30/20; excludes amortization related to other corporate debt which is captured in the 2024+ maturity amount. (2) Represents the Company’s share of corporate cash, which is calculated as consolidated cash of $1099.5M as of 6/30/20 excluding $94.6M of cash from noncontrolling interest entities and $205M of the 19 Company’s share of cash at subsidiaries as of 6/30/20, plus undrawn availability of $100M as of 6/30/20 on the Company's $500M corporate revolver, which will decrease to $400M on 3/31/21 based on the terms of the revolver.
4 Executing The Digital Playbook
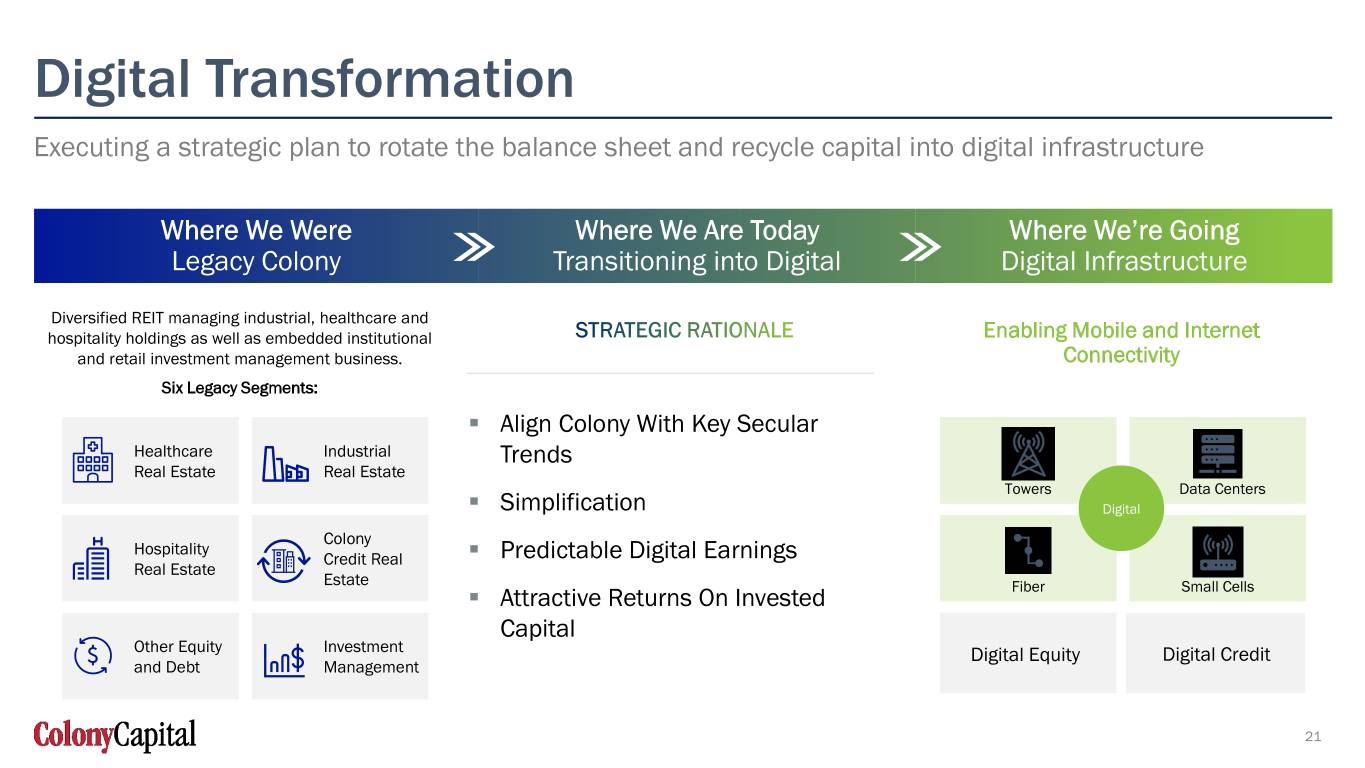
Digital Transformation Executing a strategic plan to rotate the balance sheet and recycle capital into digital infrastructure Where We Were Where We Are Today Where We’re Going Legacy Colony Transitioning into Digital Digital Infrastructure Diversified REIT managing industrial, healthcare and hospitality holdings as well as embedded institutional Enabling Mobile and Internet and retail investment management business. Connectivity Six Legacy Segments: . Align Colony With Key Secular Healthcare Industrial Trends Real Estate Real Estate Towers Data Centers . Simplification Digital Colony Hospitality Credit Real . Predictable Digital Earnings Real Estate Estate . Attractive Returns On Invested Fiber Small Cells Capital Other Equity Investment Digital Equity Digital Credit and Debt Management 21
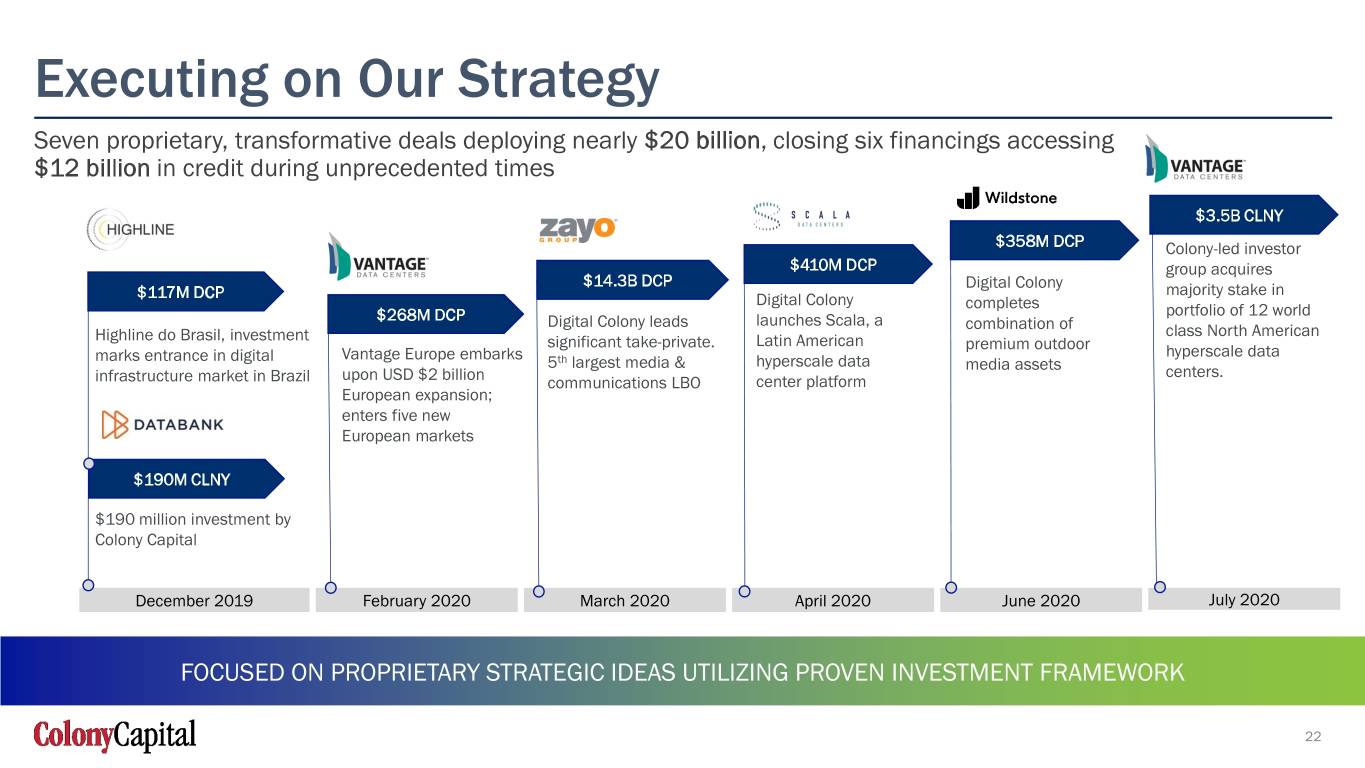
Executing on Our Strategy Seven proprietary, transformative deals deploying nearly $20 billion, closing six financings accessing $12 billion in credit during unprecedented times $3.5B CLNY $358M DCP Colony-led investor $410M DCP group acquires $14.3B DCP Digital Colony majority stake in $117M DCP Digital Colony completes portfolio of 12 world $268M DCP Digital Colony leads launches Scala, a combination of class North American Highline do Brasil, investment significant take-private. Latin American premium outdoor hyperscale data marks entrance in digital Vantage Europe embarks 5th largest media & hyperscale data media assets centers. infrastructure market in Brazil upon USD $2 billion communications LBO center platform European expansion; enters five new European markets $190M CLNY $190 million investment by Colony Capital December 2019 February 2020 March 2020 April 2020 June 2020 July 2020 FOCUSED ON PROPRIETARY STRATEGIC IDEAS UTILIZING PROVEN INVESTMENT FRAMEWORK 22
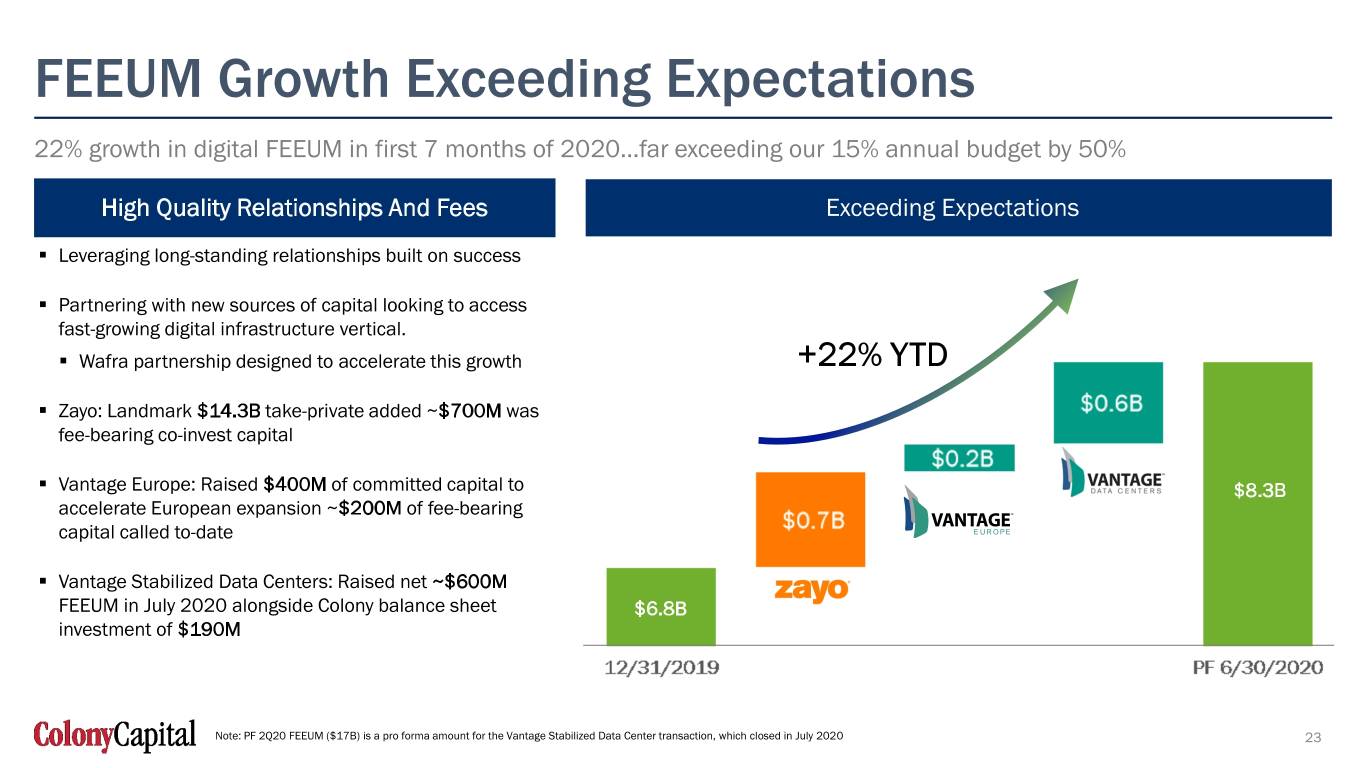
FEEUM Growth Exceeding Expectations 22% growth in digital FEEUM in first 7 months of 2020…far exceeding our 15% annual budget by 50% High Quality Relationships And Fees Exceeding Expectations . Leveraging long-standing relationships built on success . Partnering with new sources of capital looking to access fast-growing digital infrastructure vertical. . Wafra partnership designed to accelerate this growth +22% YTD . Zayo: Landmark $14.3B take-private added ~$700M was fee-bearing co-invest capital . Vantage Europe: Raised $400M of committed capital to $8.3B accelerate European expansion ~$200M of fee-bearing capital called to-date . Vantage Stabilized Data Centers: Raised net ~$600M FEEUM in July 2020 alongside Colony balance sheet $6.8B investment of $190M Note: PF 2Q20 FEEUM ($17B) is a pro forma amount for the Vantage Stabilized Data Center transaction, which closed in July 2020 23
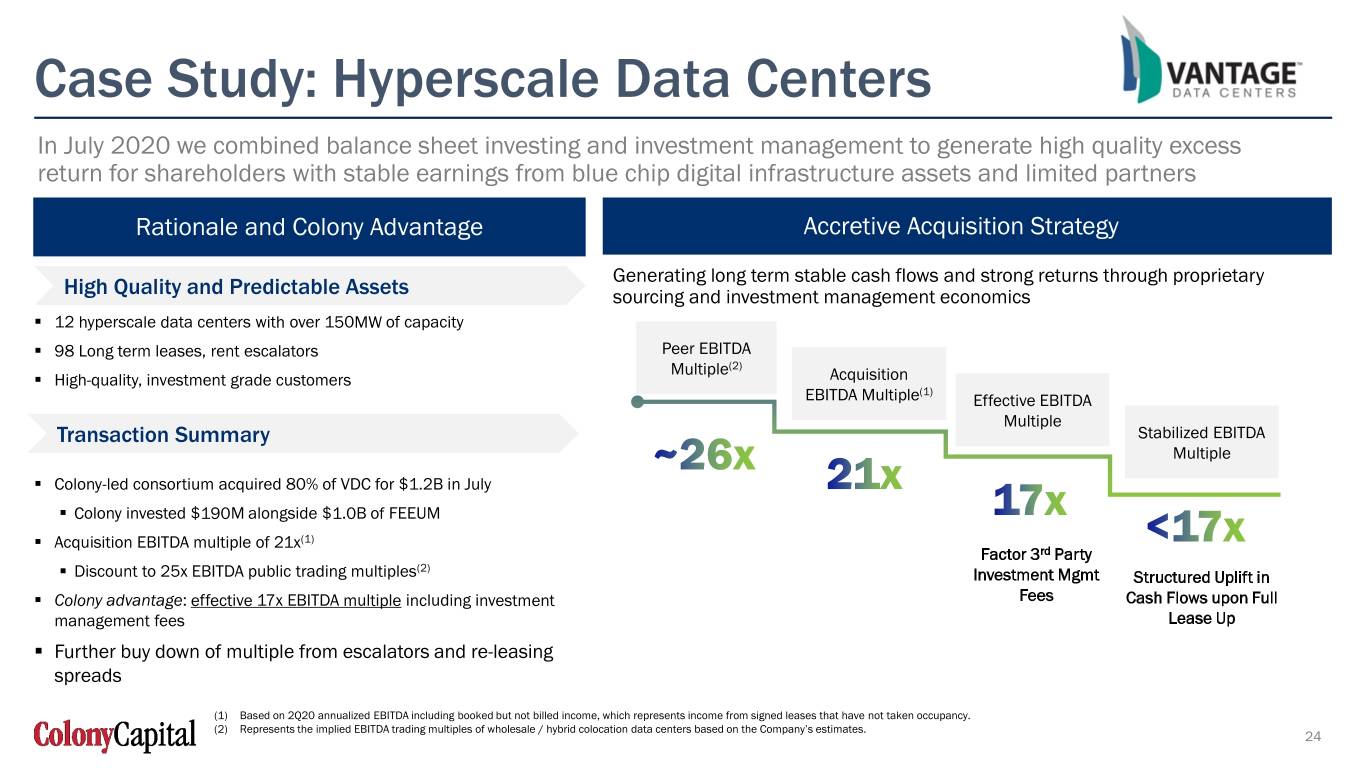
Case Study: Hyperscale Data Centers In July 2020 we combined balance sheet investing and investment management to generate high quality excess return for shareholders with stable earnings from blue chip digital infrastructure assets and limited partners Rationale and Colony Advantage Accretive Acquisition Strategy Generating long term stable cash flows and strong returns through proprietary High Quality and Predictable Assets sourcing and investment management economics . 12 hyperscale data centers with over 150MW of capacity . 98 Long term leases, rent escalators Peer EBITDA Multiple(2) . High-quality, investment grade customers Acquisition (1) EBITDA Multiple Effective EBITDA Multiple Transaction Summary Stabilized EBITDA Multiple . Colony-led consortium acquired 80% of VDC for $1.2B in July . Colony invested $190M alongside $1.0B of FEEUM . Acquisition EBITDA multiple of 21x(1) Factor 3rd Party (2) . Discount to 25x EBITDA public trading multiples Investment Mgmt Structured Uplift in . Colony advantage: effective 17x EBITDA multiple including investment Fees Cash Flows upon Full management fees Lease Up . Further buy down of multiple from escalators and re-leasing spreads (1) Based on 2Q20 annualized EBITDA including booked but not billed income, which represents income from signed leases that have not taken occupancy. (2) Represents the implied EBITDA trading multiples of wholesale / hybrid colocation data centers based on the Company’s estimates. 24
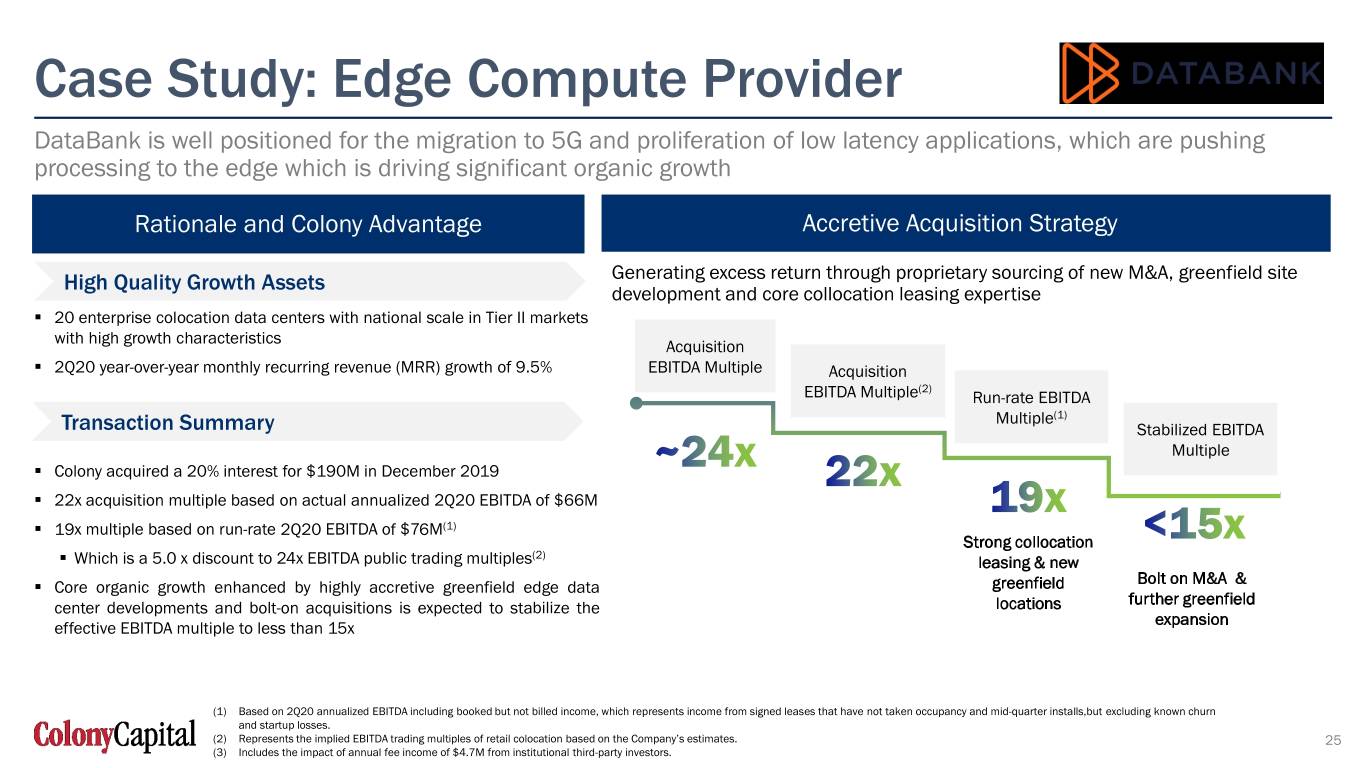
Case Study: Edge Compute Provider DataBank is well positioned for the migration to 5G and proliferation of low latency applications, which are pushing processing to the edge which is driving significant organic growth Rationale and Colony Advantage Accretive Acquisition Strategy High Quality Growth Assets Generating excess return through proprietary sourcing of new M&A, greenfield site development and core collocation leasing expertise . 20 enterprise colocation data centers with national scale in Tier II markets with high growth characteristics Acquisition . 2Q20 year-over-year monthly recurring revenue (MRR) growth of 9.5% EBITDA Multiple Acquisition (2) EBITDA Multiple Run-rate EBITDA Multiple(1) Transaction Summary Stabilized EBITDA Multiple . Colony acquired a 20% interest for $190M in December 2019 . 22x acquisition multiple based on actual annualized 2Q20 EBITDA of $66M . 19x multiple based on run-rate 2Q20 EBITDA of $76M(1) Strong collocation . Which is a 5.0 x discount to 24x EBITDA public trading multiples(2) leasing & new Bolt on M&A & . Core organic growth enhanced by highly accretive greenfield edge data greenfield further greenfield center developments and bolt-on acquisitions is expected to stabilize the locations expansion effective EBITDA multiple to less than 15x (1) Based on 2Q20 annualized EBITDA including booked but not billed income, which represents income from signed leases that have not taken occupancy and mid-quarter installs,but excluding known churn and startup losses. (2) Represents the implied EBITDA trading multiples of retail colocation based on the Company’s estimates. 25 (3) Includes the impact of annual fee income of $4.7M from institutional third-party investors.
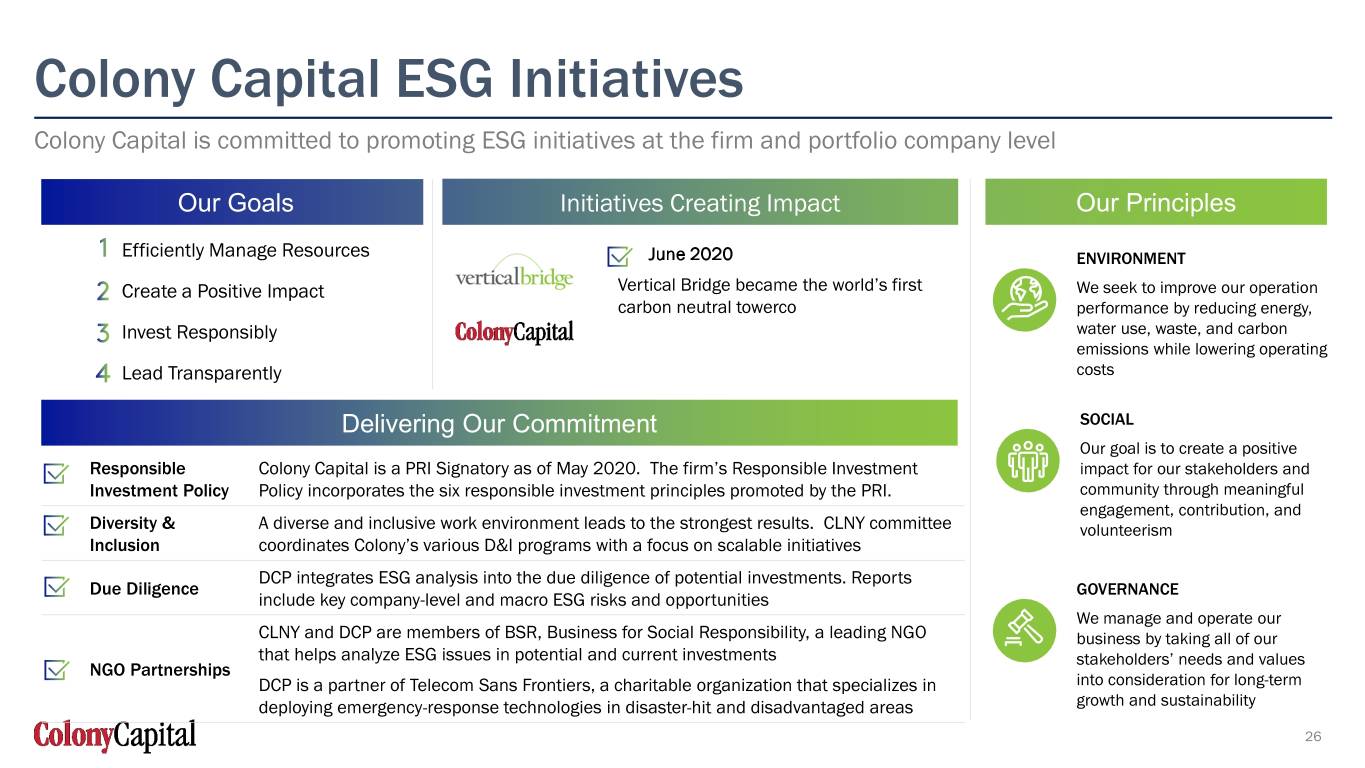
Colony Capital ESG Initiatives Colony Capital is committed to promoting ESG initiatives at the firm and portfolio company level Our Goals Initiatives Creating Impact Our Principles Efficiently Manage Resources June 2020 ENVIRONMENT Create a Positive Impact Vertical Bridge became the world’s first We seek to improve our operation carbon neutral towerco performance by reducing energy, Invest Responsibly water use, waste, and carbon emissions while lowering operating Lead Transparently costs Delivering Our Commitment SOCIAL Our goal is to create a positive Responsible Colony Capital is a PRI Signatory as of May 2020. The firm’s Responsible Investment impact for our stakeholders and Investment Policy Policy incorporates the six responsible investment principles promoted by the PRI. community through meaningful engagement, contribution, and Diversity & A diverse and inclusive work environment leads to the strongest results. CLNY committee volunteerism Inclusion coordinates Colony’s various D&I programs with a focus on scalable initiatives DCP integrates ESG analysis into the due diligence of potential investments. Reports Due Diligence GOVERNANCE include key company-level and macro ESG risks and opportunities We manage and operate our CLNY and DCP are members of BSR, Business for Social Responsibility, a leading NGO business by taking all of our that helps analyze ESG issues in potential and current investments stakeholders’ needs and values NGO Partnerships DCP is a partner of Telecom Sans Frontiers, a charitable organization that specializes in into consideration for long-term growth and sustainability deploying emergency-response technologies in disaster-hit and disadvantaged areas 26 26
Why Own CLNY Today 5 Investment Case
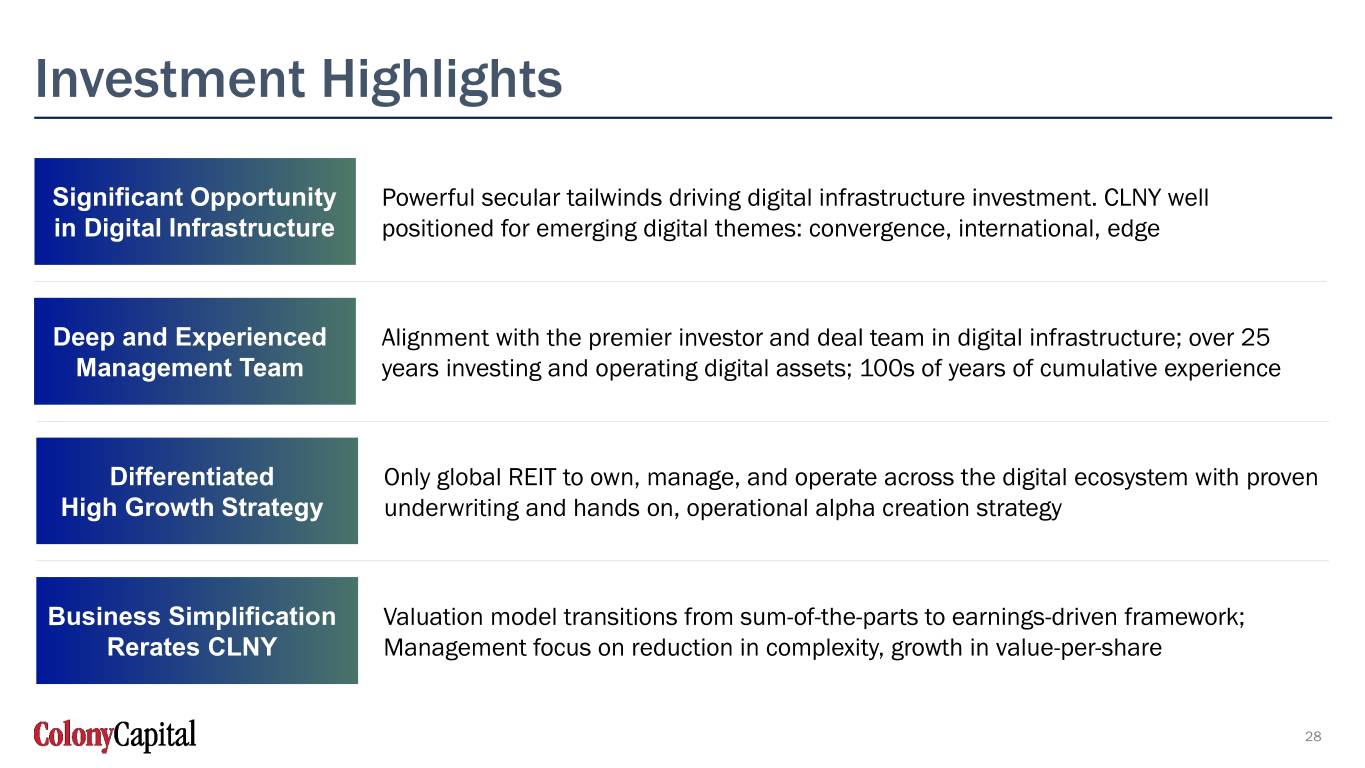
Investment Highlights Significant Opportunity Powerful secular tailwinds driving digital infrastructure investment. CLNY well in Digital Infrastructure positioned for emerging digital themes: convergence, international, edge Deep and Experienced Alignment with the premier investor and deal team in digital infrastructure; over 25 Management Team years investing and operating digital assets; 100s of years of cumulative experience Differentiated Only global REIT to own, manage, and operate across the digital ecosystem with proven High Growth Strategy underwriting and hands on, operational alpha creation strategy Business Simplification Valuation model transitions from sum-of-the-parts to earnings-driven framework; Rerates CLNY Management focus on reduction in complexity, growth in value-per-share 28
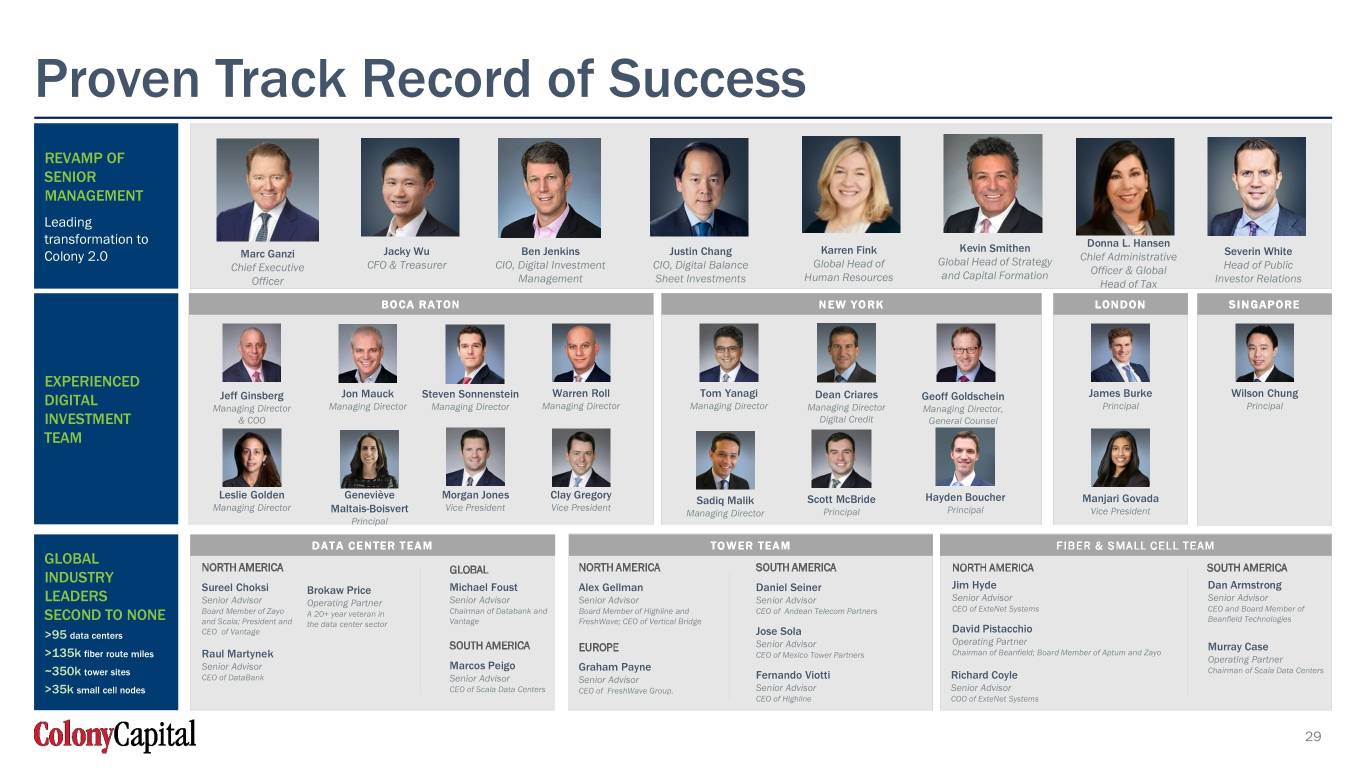
Proven Track Record of Success REVAMP OF SENIOR MANAGEMENT Leading transformation to Donna L. Hansen Karren Fink Kevin Smithen Colony 2.0 Marc Ganzi Jacky Wu Ben Jenkins Justin Chang Chief Administrative Severin White Global Head of Global Head of Strategy Chief Executive CFO & Treasurer CIO, Digital Investment CIO, Digital Balance Officer & Global Head of Public Human Resources and Capital Formation Officer Management Sheet Investments Head of Tax Investor Relations B O CA R ATON N E W YO RK LONDON SINGAPORE EXPERIENCED DIGITAL Jeff Ginsberg Jon Mauck Steven Sonnenstein Warren Roll Tom Yanagi Dean Criares Geoff Goldschein James Burke Wilson Chung Managing Director Managing Director Managing Director Managing Director Managing Director Managing Director Managing Director, Principal Principal INVESTMENT & COO Digital Credit General Counsel TEAM Leslie Golden Geneviève Morgan Jones Clay Gregory Sadiq Malik Scott McBride Hayden Boucher Manjari Govada Managing Director Vice President Vice President Maltais-Boisvert Managing Director Principal Principal Vice President Principal DATA CENTER TEAM TO W ER TEAM FIBER & SMALL CELL TEAM GLOBAL NORTH AMERICA NORTH AMERICA SOUTH AMERICA NORTH AMERICA SOUTH AMERICA INDUSTRY GLOBAL Sureel Choksi Brokaw Price Michael Foust Alex Gellman Daniel Seiner Jim Hyde Dan Armstrong Senior Advisor Senior Advisor LEADERS Senior Advisor Operating Partner Senior Advisor Senior Advisor Senior Advisor CEO of ExteNet Systems CEO and Board Member of Board Member of Zayo A 20+ year veteran in Chairman of Databank and Board Member of Highline and CEO of Andean Telecom Partners SECOND TO NONE and Scala; President and Vantage FreshWave; CEO of Vertical Bridge Beanfield Technologies the data center sector David Pistacchio >95 data centers CEO of Vantage Jose Sola Operating Partner SOUTH AMERICA EUROPE Senior Advisor Murray Case >135k fiber route miles CEO of Mexico Tower Partners Chairman of Beanfield; Board Member of Aptum and Zayo Raul Martynek Operating Partner Senior Advisor Marcos Peigo ~350k tower sites Graham Payne Chairman of Scala Data Centers CEO of DataBank Senior Advisor Senior Advisor Fernando Viotti Richard Coyle >35k small cell nodes CEO of Scala Data Centers CEO of FreshWave Group. Senior Advisor Senior Advisor CEO of Highline COO of ExteNet Systems 29
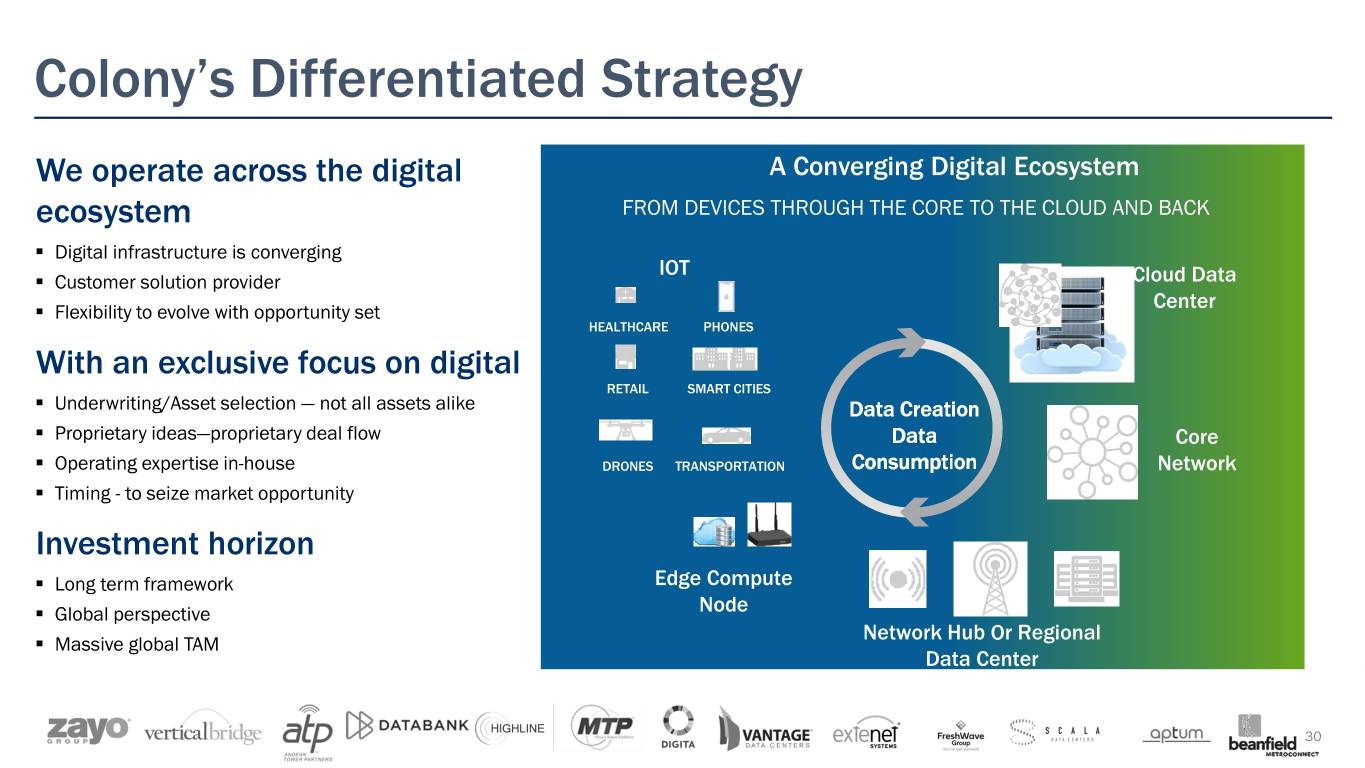
Colony’s Differentiated Strategy We operate across the digital A Converging Digital Ecosystem ecosystem FROM DEVICES THROUGH THE CORE TO THE CLOUD AND BACK . Digital infrastructure is converging IOT . Customer solution provider Cloud Data Center . Flexibility to evolve with opportunity set HEALTHCARE PHONES With an exclusive focus on digital RETAIL SMART CITIES . Underwriting/Asset selection — not all assets alike Data Creation . Proprietary ideas—proprietary deal flow Data Core . Operating expertise in-house DRONES TRANSPORTATION Consumption Network . Timing - to seize market opportunity Investment horizon . Long term framework Edge Compute . Global perspective Node Network Hub Or Regional . Massive global TAM Data Center 30 30
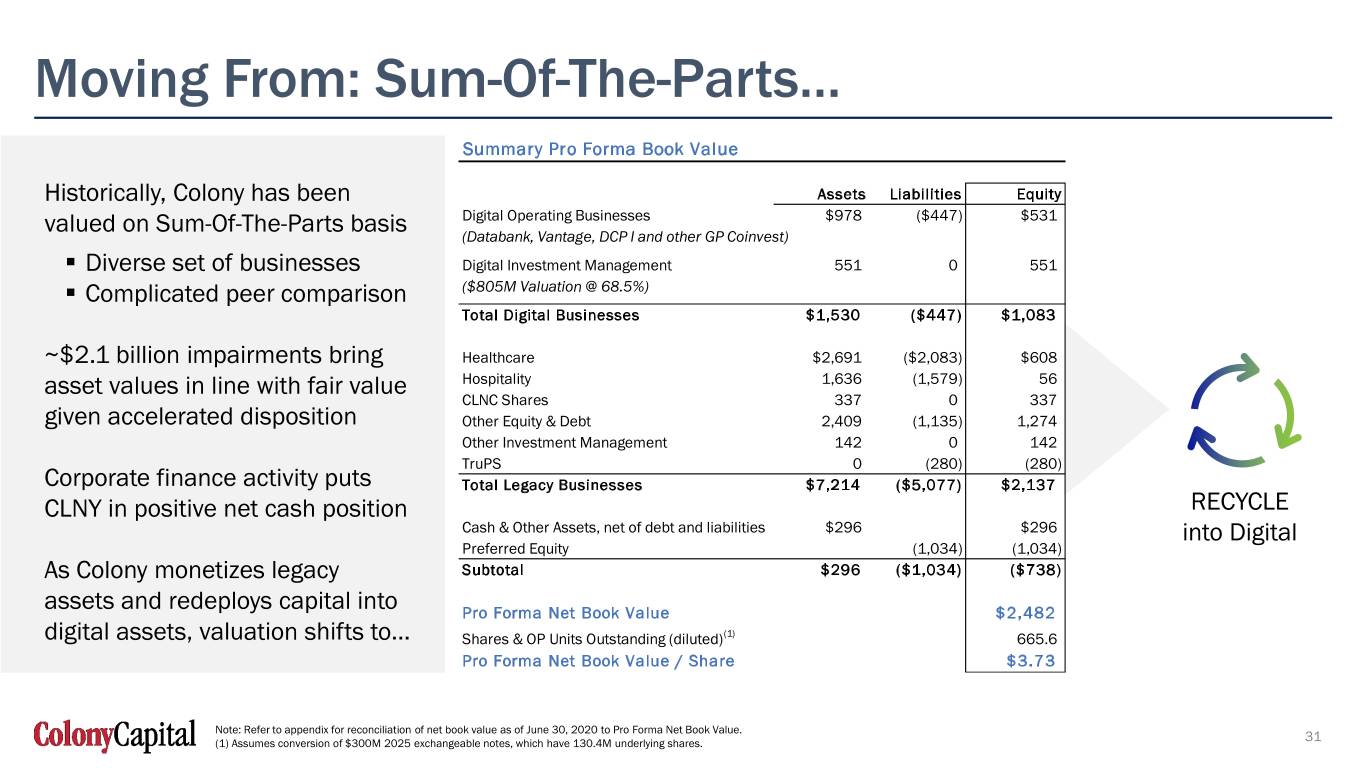
Moving From: Sum-Of-The-Parts… Summary Pro Forma Book Value Historically, Colony has been Assets Liabilities Equity valued on Sum-Of-The-Parts basis Digital Operating Businesses $978 ($447) $531 (Databank, Vantage, DCP I and other GP Coinvest) . Diverse set of businesses Digital Investment Management 551 0 551 . Complicated peer comparison ($805M Valuation @ 68.5%) Total Digital Businesses $1,530 ($447) $1,083 ~$2.1 billion impairments bring Healthcare $2,691 ($2,083) $608 asset values in line with fair value Hospitality 1,636 (1,579) 56 CLNC Shares 337 0 337 given accelerated disposition Other Equity & Debt 2,409 (1,135) 1,274 Other Investment Management 142 0 142 TruPS 0 (280) (280) Corporate finance activity puts Total Legacy Businesses $7,214 ($5,077) $2,137 CLNY in positive net cash position RECYCLE Cash & Other Assets, net of debt and liabilities $296 $296 into Digital Preferred Equity (1,034) (1,034) As Colony monetizes legacy Subtotal $296 ($1,034) ($738) assets and redeploys capital into Pro Forma Net Book Value $2,482 digital assets, valuation shifts to… Shares & OP Units Outstanding (diluted)(1) 665.6 Pro Forma Net Book Value / Share $3.73 Note: Refer to appendix for reconciliation of net book value as of June 30, 2020 to Pro Forma Net Book Value. 31 (1) Assumes conversion of $300M 2025 exchangeable notes, which have 130.4M underlying shares. Digital AUM
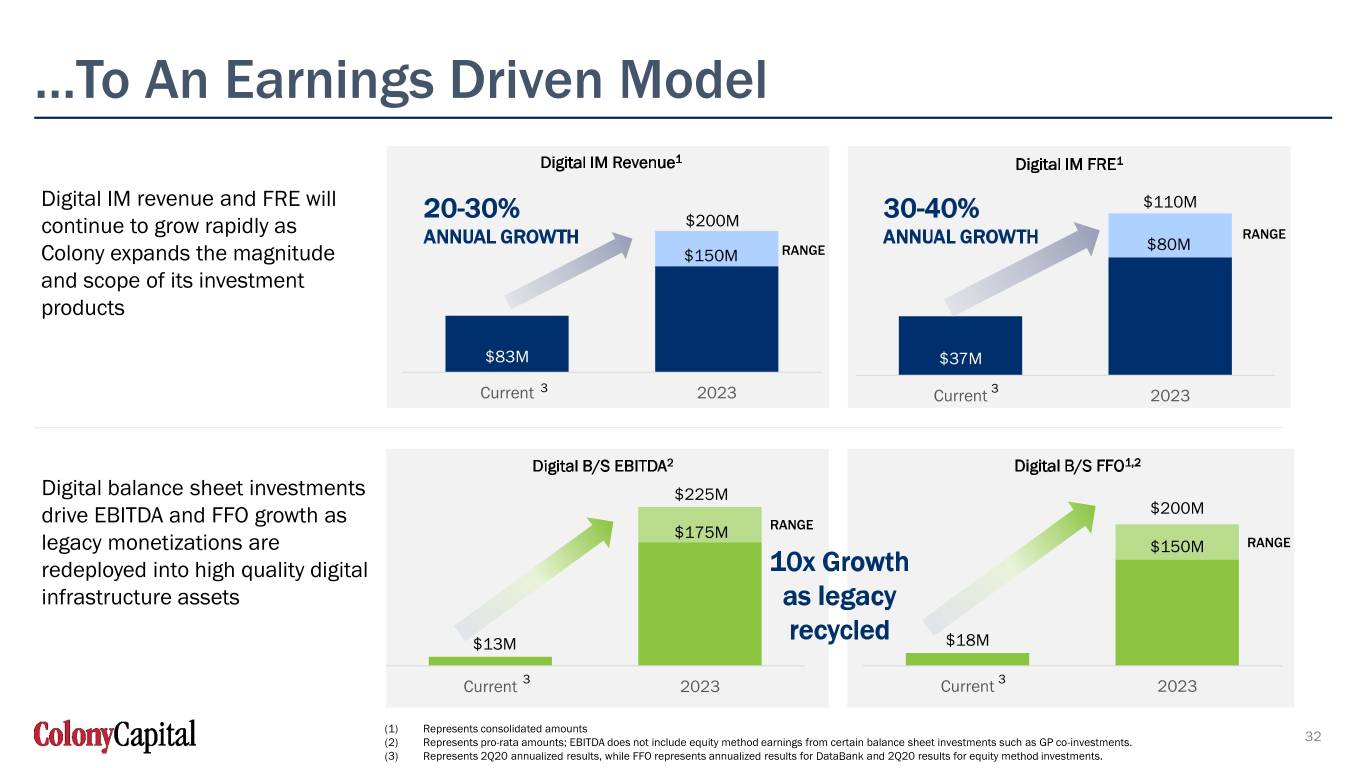
…To An Earnings Driven Model Digital IM Revenue1 Digital IM FRE1 Digital IM revenue and FRE will $110M 20-30% $200M 30-40% continue to grow rapidly as RANGE ANNUAL GROWTH ANNUAL GROWTH $80M Colony expands the magnitude $150M RANGE and scope of its investment products $83M $40$37MM Current 3 2023 Current 3 2023 Digital B/S EBITDA2 Digital B/S FFO1,2 Digital balance sheet investments $225M drive EBITDA and FFO growth as $200M $175M RANGE legacy monetizations are $150M RANGE redeployed into high quality digital 10x Growth infrastructure assets as legacy $13M recycled $18M Current 3 2023 Current 3 2023 (1) Represents consolidated amounts (2) Represents pro-rata amounts; EBITDA does not include equity method earnings from certain balance sheet investments such as GP co-investments. 32 (3) Represents 2Q20 annualized results, while FFO represents annualized results for DataBank and 2Q20 results for equity method investments.
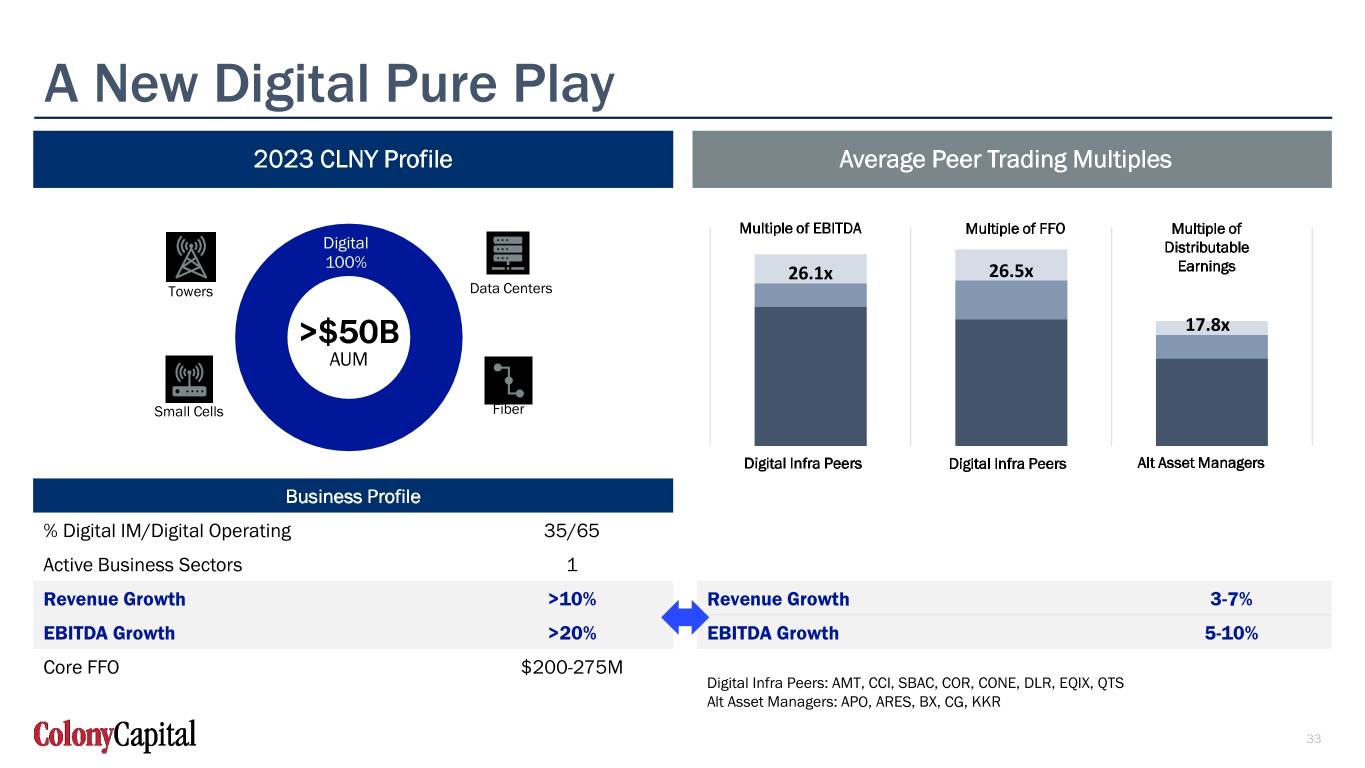
A New Digital Pure Play 2023 CLNY Profile Average Peer Trading Multiples Multiple of EBITDA Multiple of FFO Multiple of Digital Distributable 100% 26.1x 26.5x Earnings Towers Data Centers >$50B 17.8x AUM Small Cells Fiber Digital Infra Peers Digital Infra Peers Alt Asset Managers Business Profile % Digital IM/Digital Operating 35/65 Active Business Sectors 1 Revenue Growth >10% Revenue Growth 3-7% EBITDA Growth >20% EBITDA Growth 5-10% Core FFO $200-275M Digital Infra Peers: AMT, CCI, SBAC, COR, CONE, DLR, EQIX, QTS Alt Asset Managers: APO, ARES, BX, CG, KKR 33
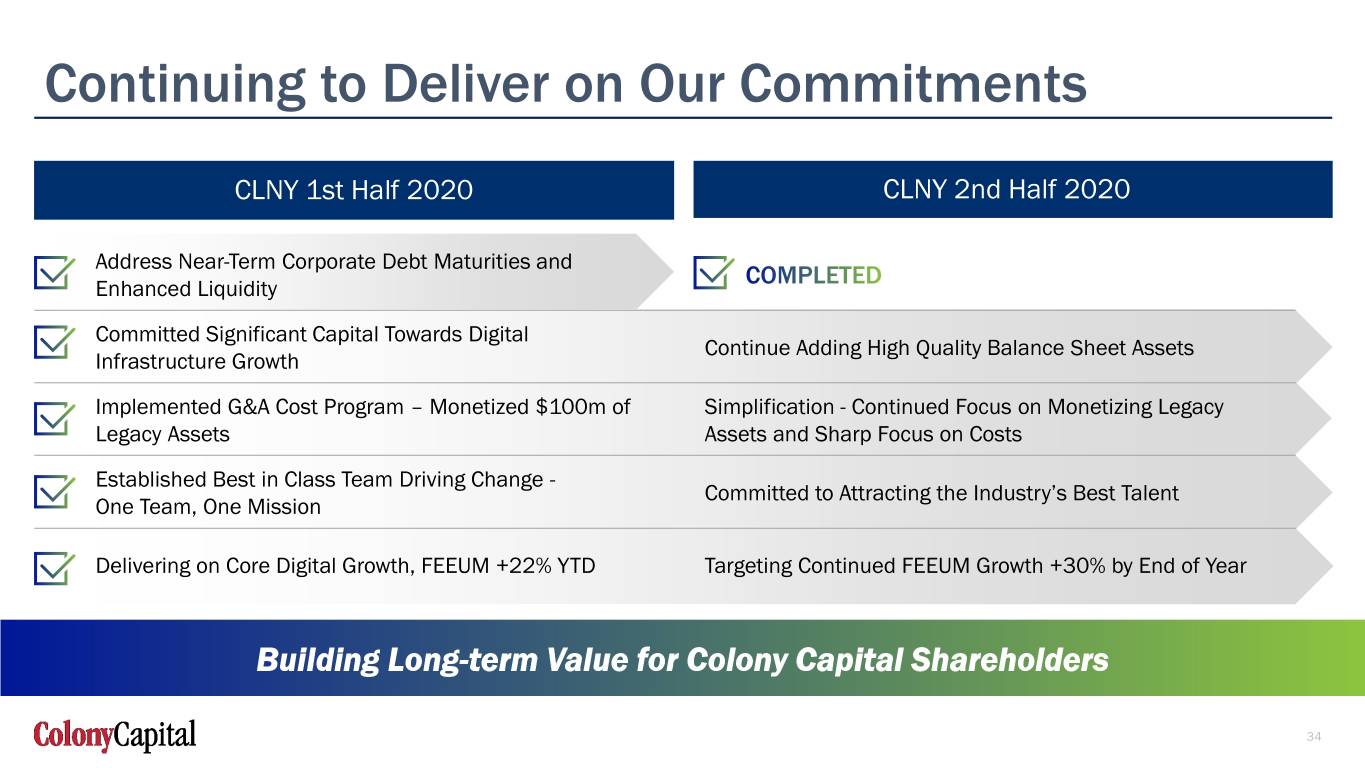
Continuing to Deliver on Our Commitments CLNY 1st Half 2020 CLNY 2nd Half 2020 Address Near-Term Corporate Debt Maturities and Enhanced Liquidity Committed Significant Capital Towards Digital Continue Adding High Quality Balance Sheet Assets Infrastructure Growth Implemented G&A Cost Program – Monetized $100m of Simplification - Continued Focus on Monetizing Legacy Legacy Assets Assets and Sharp Focus on Costs Established Best in Class Team Driving Change - Committed to Attracting the Industry’s Best Talent One Team, One Mission Delivering on Core Digital Growth, FEEUM +22% YTD Targeting Continued FEEUM Growth +30% by End of Year Building Long-term Value for Colony Capital Shareholders 34

6 Q&A Session

Pro Forma Book Value Reconciliation Net Book Value as of June 30, 2020 Notes: Total Stockholders' Equity $2,740 Noncontrolling Interests in Operating Company 188 less: Preferred Equity Liquidation Preference (1,034) Net Book Value: CLNY OP $1,894 deduct: Carrying value of debt discount (138) Difference between carrying value and par value of debt deduct: Transaction costs (16) Estimated transaction costs: exchangeable notes and Wafra add: Wafra valuation uplift(1) 358 Difference between $805M Wafra valuation and 6/30 carrying value of Digital IM add: 2025 Exchangeable notes 300 Assumes conversion of exchangeable notes add: Negative equity value of hospitality(2) 85 Add back negative book value of two hotel portfolios as all debt is non-recourse Total Pro Forma Adjustments $588 PF Net Book Value: CLNY OP 2,482 (1) PF Net Book Value gives credit to the $805 million valuation from the Wafra transaction, but actual book value as of 9/30/20 will not reflect the full valuation uplift. (2) Pro forma book value excludes CLNY OP’s share of carrying value of the assets and debt of two hotel portfolios with negative equity value composed of $832 million of assets and $917 million of debt. 3636
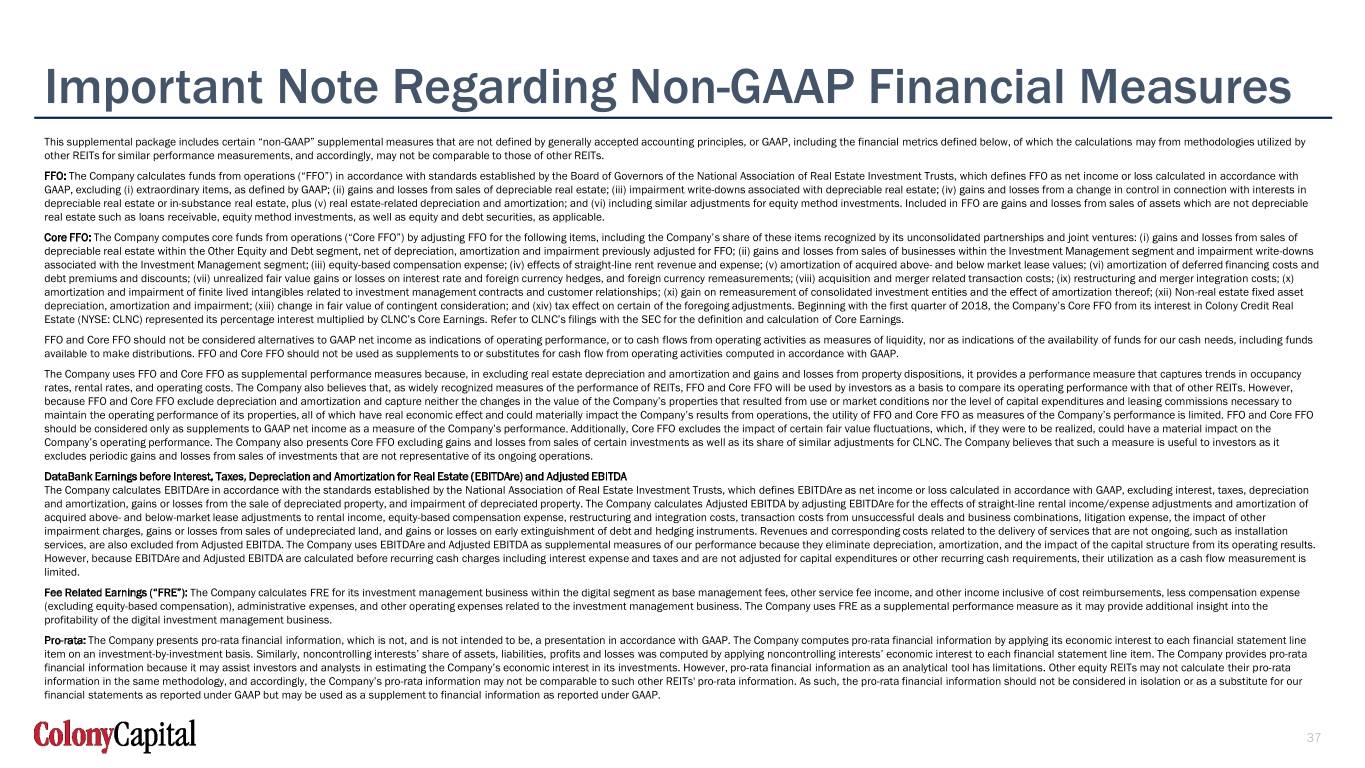
Important Note Regarding Non-GAAP Financial Measures This supplemental package includes certain “non-GAAP” supplemental measures that are not defined by generally accepted accounting principles, or GAAP, including the financial metrics defined below, of which the calculations may from methodologies utilized by other REITs for similar performance measurements, and accordingly, may not be comparable to those of other REITs. FFO: The Company calculates funds from operations (“FFO”) in accordance with standards established by the Board of Governors of the National Association of Real Estate Investment Trusts, which defines FFO as net income or loss calculated in accordance with GAAP, excluding (i) extraordinary items, as defined by GAAP; (ii) gains and losses from sales of depreciable real estate; (iii) impairment write-downs associated with depreciable real estate; (iv) gains and losses from a change in control in connection with interests in depreciable real estate or in-substance real estate, plus (v) real estate-related depreciation and amortization; and (vi) including similar adjustments for equity method investments. Included in FFO are gains and losses from sales of assets which are not depreciable real estate such as loans receivable, equity method investments, as well as equity and debt securities, as applicable. Core FFO: The Company computes core funds from operations (“Core FFO”) by adjusting FFO for the following items, including the Company’s share of these items recognized by its unconsolidated partnerships and joint ventures: (i) gains and losses from sales of depreciable real estate within the Other Equity and Debt segment, net of depreciation, amortization and impairment previously adjusted for FFO; (ii) gains and losses from sales of businesses within the Investment Management segment and impairment write-downs associated with the Investment Management segment; (iii) equity-based compensation expense; (iv) effects of straight-line rent revenue and expense; (v) amortization of acquired above- and below market lease values; (vi) amortization of deferred financing costs and debt premiums and discounts; (vii) unrealized fair value gains or losses on interest rate and foreign currency hedges, and foreign currency remeasurements; (viii) acquisition and merger related transaction costs; (ix) restructuring and merger integration costs; (x) amortization and impairment of finite lived intangibles related to investment management contracts and customer relationships; (xi) gain on remeasurement of consolidated investment entities and the effect of amortization thereof; (xii) Non-real estate fixed asset depreciation, amortization and impairment; (xiii) change in fair value of contingent consideration; and (xiv) tax effect on certain of the foregoing adjustments. Beginning with the first quarter of 2018, the Company’s Core FFO from its interest in Colony Credit Real Estate (NYSE: CLNC) represented its percentage interest multiplied by CLNC’s Core Earnings. Refer to CLNC’s filings with the SEC for the definition and calculation of Core Earnings. FFO and Core FFO should not be considered alternatives to GAAP net income as indications of operating performance, or to cash flows from operating activities as measures of liquidity, nor as indications of the availability of funds for our cash needs, including funds available to make distributions. FFO and Core FFO should not be used as supplements to or substitutes for cash flow from operating activities computed in accordance with GAAP. The Company uses FFO and Core FFO as supplemental performance measures because, in excluding real estate depreciation and amortization and gains and losses from property dispositions, it provides a performance measure that captures trends in occupancy rates, rental rates, and operating costs. The Company also believes that, as widely recognized measures of the performance of REITs, FFO and Core FFO will be used by investors as a basis to compare its operating performance with that of other REITs. However, because FFO and Core FFO exclude depreciation and amortization and capture neither the changes in the value of the Company’s properties that resulted from use or market conditions nor the level of capital expenditures and leasing commissions necessary to maintain the operating performance of its properties, all of which have real economic effect and could materially impact the Company’s results from operations, the utility of FFO and Core FFO as measures of the Company’s performance is limited. FFO and Core FFO should be considered only as supplements to GAAP net income as a measure of the Company’s performance. Additionally, Core FFO excludes the impact of certain fair value fluctuations, which, if they were to be realized, could have a material impact on the Company’s operating performance. The Company also presents Core FFO excluding gains and losses from sales of certain investments as well as its share of similar adjustments for CLNC. The Company believes that such a measure is useful to investors as it excludes periodic gains and losses from sales of investments that are not representative of its ongoing operations. DataBank Earnings before Interest, Taxes, Depreciation and Amortization for Real Estate (EBITDAre) and Adjusted EBITDA The Company calculates EBITDAre in accordance with the standards established by the National Association of Real Estate Investment Trusts, which defines EBITDAre as net income or loss calculated in accordance with GAAP, excluding interest, taxes, depreciation and amortization, gains or losses from the sale of depreciated property, and impairment of depreciated property. The Company calculates Adjusted EBITDA by adjusting EBITDAre for the effects of straight-line rental income/expense adjustments and amortization of acquired above- and below-market lease adjustments to rental income, equity-based compensation expense, restructuring and integration costs, transaction costs from unsuccessful deals and business combinations, litigation expense, the impact of other impairment charges, gains or losses from sales of undepreciated land, and gains or losses on early extinguishment of debt and hedging instruments. Revenues and corresponding costs related to the delivery of services that are not ongoing, such as installation services, are also excluded from Adjusted EBITDA. The Company uses EBITDAre and Adjusted EBITDA as supplemental measures of our performance because they eliminate depreciation, amortization, and the impact of the capital structure from its operating results. However, because EBITDAre and Adjusted EBITDA are calculated before recurring cash charges including interest expense and taxes and are not adjusted for capital expenditures or other recurring cash requirements, their utilization as a cash flow measurement is limited. Fee Related Earnings (“FRE”): The Company calculates FRE for its investment management business within the digital segment as base management fees, other service fee income, and other income inclusive of cost reimbursements, less compensation expense (excluding equity-based compensation), administrative expenses, and other operating expenses related to the investment management business. The Company uses FRE as a supplemental performance measure as it may provide additional insight into the profitability of the digital investment management business. Pro-rata: The Company presents pro-rata financial information, which is not, and is not intended to be, a presentation in accordance with GAAP. The Company computes pro-rata financial information by applying its economic interest to each financial statement line item on an investment-by-investment basis. Similarly, noncontrolling interests’ share of assets, liabilities, profits and losses was computed by applying noncontrolling interests’ economic interest to each financial statement line item. The Company provides pro-rata financial information because it may assist investors and analysts in estimating the Company’s economic interest in its investments. However, pro-rata financial information as an analytical tool has limitations. Other equity REITs may not calculate their pro-rata information in the same methodology, and accordingly, the Company’s pro-rata information may not be comparable to such other REITs' pro-rata information. As such, the pro-rata financial information should not be considered in isolation or as a substitute for our financial statements as reported under GAAP but may be used as a supplement to financial information as reported under GAAP. 37
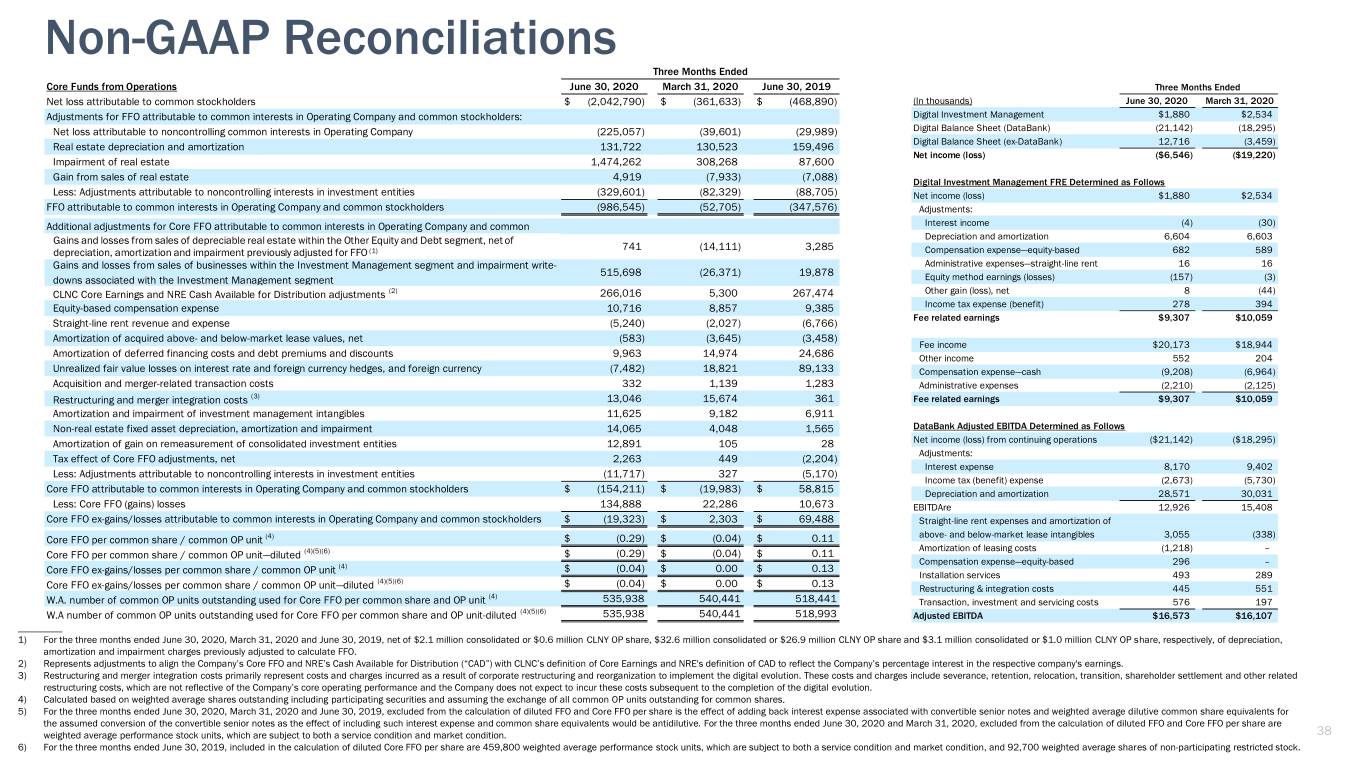
Non-GAAP Reconciliations Three Months Ended Core Funds from Operations June 30, 2020 March 31, 2020 June 30, 2019 Three Months Ended Net loss attributable to common stockholders $ (2,042,790) $ (361,633) $ (468,890) (In thousands) June 30, 2020 March 31, 2020 Adjustments for FFO attributable to common interests in Operating Company and common stockholders: Digital Investment Management $1,880 $2,534 Net loss attributable to noncontrolling common interests in Operating Company (225,057) (39,601) (29,989) Digital Balance Sheet (DataBank) (21,142) (18,295) Real estate depreciation and amortization 131,722 130,523 159,496 Digital Balance Sheet (ex-DataBank) 12,716 (3,459) Net income (loss) ($6,546) ($19,220) Impairment of real estate 1,474,262 308,268 87,600 Gain from sales of real estate 4,919 (7,933) (7,088) Digital Investment Management FRE Determined as Follows Less: Adjustments attributable to noncontrolling interests in investment entities (329,601) (82,329) (88,705) Net income (loss) $1,880 $2,534 FFO attributable to common interests in Operating Company and common stockholders (986,545) (52,705) (347,576) Adjustments: Additional adjustments for Core FFO attributable to common interests in Operating Company and common Interest income (4) (30) Gains and losses fromfrom salessales of of depreciable depreciable real real estate estate within within the the Other Other Equity Equity and and Debt Debt segment, segment, net net of of Depreciation and amortization 6,604 6,603 (1) 741 (14,111) 3,285 Compensation expense—equity-based 682 589 depreciation, amortization and impairmentimpairment previouslypreviously adjusted adjusted for for FFO FFO (1) Gains and losses from sales of businesses within the Investment Management segment and impairment write- Administrative expenses—straight-line rent 16 16 515,698 (26,371) 19,878 downs associated with the Investment Management segment Equity method earnings (losses) (157) (3) CLNC Core Earnings and NRE Cash Available for Distribution adjustments (2) 266,016 5,300 267,474 Other gain (loss), net 8 (44) Equity-based compensation expense 10,716 8,857 9,385 Income tax expense (benefit) 278 394 Fee related earnings $9,307 $10,059 Straight-line rent revenue and expense (5,240) (2,027) (6,766) Amortization of acquired above- and below-market lease values, net (583) (3,645) (3,458) Fee income $20,173 $18,944 Amortization of deferred financing costs and debt premiums and discounts 9,963 14,974 24,686 Other income 552 204 Unrealized fair value losses on interest rate and foreign currency hedges, and foreign currency (7,482) 18,821 89,133 Compensation expense—cash (9,208) (6,964) Acquisition and merger-related transaction costs 332 1,139 1,283 Administrative expenses (2,210) (2,125) Restructuring and merger integration costs (3) 13,046 15,674 361 Fee related earnings $9,307 $10,059 Amortization and impairment of investment management intangibles 11,625 9,182 6,911 Non-real estate fixed asset depreciation, amortization and impairment 14,065 4,048 1,565 DataBank Adjusted EBITDA Determined as Follows Amortization of gain on remeasurement of consolidated investment entities 12,891 105 28 Net income (loss) from continuing operations ($21,142) ($18,295) Adjustments: Tax effect of Core FFO adjustments, net 2,263 449 (2,204) Interest expense 8,170 9,402 Less: Adjustments attributable to noncontrolling interests in investment entities (11,717) 327 (5,170) Income tax (benefit) expense (2,673) (5,730) Core FFO attributable to common interests in Operating Company and common stockholders $ (154,211) $ (19,983) $ 58,815 Depreciation and amortization 28,571 30,031 Less: Core FFO (gains) losses 134,888 22,286 10,673 EBITDAre 12,926 15,408 Core FFO ex-gains/losses attributable to common interests in Operating Company and common stockholders $ (19,323) $ 2,303 $ 69,488 Straight-line rent expenses and amortization of above- and below-market lease intangibles 3,055 (338) Core FFO per common share / common OP unit (4) $ (0.29) $ (0.04) $ 0.11 Amortization of leasing costs (1,218) – Core FFO per common share / common OP unit—diluted (4)(5)(6) $ (0.29) $ (0.04) $ 0.11 Compensation expense—equity-based 296 – (4) $ (0.04) $ 0.00 $ 0.13 Core FFO ex-gains/losses per common share / common OP unit Installation services 493 289 (4)(5)(6) Core FFO ex-gains/losses per common share / common OP unit—diluted $ (0.04) $ 0.00 $ 0.13 Restructuring & integration costs 445 551 (4) W.A. number of common OP units outstanding used for Core FFO per common share and OP unit 535,938 540,441 518,441 Transaction, investment and servicing costs 576 197 W.A number of common OP units outstanding used for Core FFO per common share and OP unit-diluted (4)(5)(6) 535,938 540,441 518,993 Adjusted EBITDA $16,573 $16,107 _________ 1) For_________ the three months ended June 30, 2020, March 31, 2020 and June 30, 2019, net of $2.1 million consolidated or $0.6 million CLNY OP share, $32.6 million consolidated or $26.9 million CLNY OP share and $3.1 million consolidated or $1.0 million CLNY OP share, respectively, of depreciation, amortization and impairment charges previously adjusted to calculate FFO. 2) Represents adjustments to align the Company’s Core FFO and NRE’s Cash Available for Distribution (“CAD”) with CLNC’s definition of Core Earnings and NRE's definition of CAD to reflect the Company’s percentage interest in the respective company's earnings. 3) Restructuring and merger integration costs primarily represent costs and charges incurred as a result of corporate restructuring and reorganization to implement the digital evolution. These costs and charges include severance, retention, relocation, transition, shareholder settlement and other related restructuring costs, which are not reflective of the Company’s core operating performance and the Company does not expect to incur these costs subsequent to the completion of the digital evolution. 4) Calculated based on weighted average shares outstanding including participating securities and assuming the exchange of all common OP units outstanding for common shares. 5) For the three months ended June 30, 2020, March 31, 2020 and June 30, 2019, excluded from the calculation of diluted FFO and Core FFO per share is the effect of adding back interest expense associated with convertible senior notes and weighted average dilutive common share equivalents for the assumed conversion of the convertible senior notes as the effect of including such interest expense and common share equivalents would be antidilutive. For the three months ended June 30, 2020 and March 31, 2020, excluded from the calculation of diluted FFO and Core FFO per share are weighted average performance stock units, which are subject to both a service condition and market condition. 38 6) For the three months ended June 30, 2019, included in the calculation of diluted Core FFO per share are 459,800 weighted average performance stock units, which are subject to both a service condition and market condition, and 92,700 weighted average shares of non-participating restricted stock.


