1 EARNINGS PRESENTATION 2Q 2021 A u g u s t 5 , 2 0 2 1
2 DISCLAIMER This presentation may contain forward-looking statements within the meaning of the federal securities laws, including statements related to our digital transformation. Forward-looking statements relate to expectations, beliefs, projections, future plans and strategies, anticipated events or trends and similar expressions concerning matters that are not historical facts. In some cases, you can identify forward-looking statements by the use of forward-looking terminology such as “may,” “will,” “should,” “expects,” “intends,” “plans,” “anticipates,” “believes,” “estimates,” “predicts,” or “potential” or the negative of these words and phrases or similar words or phrases which are predictions of or indicate future events or trends and which do not relate solely to historical matters. You can also identify forward-looking statements by discussions of strategy, plans or intentions. Forward-looking statements involve known and unknown risks, uncertainties, assumptions and contingencies, many of which are beyond the Company’s control, and may cause the Company’s actual results to differ significantly from those expressed in any forward-looking statement. Factors that might cause such a difference include, without limitation, the duration and severity of the current novel coronavirus (COVID-19) pandemic, and its impact on the global market, economic and environmental conditions generally and in the digital and communications technology, wellness infrastructure and hospitality real estate, other commercial real estate equity and debt, and investment management sectors; the effect of COVID-19 on the Company's operating cash flows, debt service obligations and covenants, liquidity position and valuations of its real estate investments; whether we will successfully execute our strategic transformation to become a digital infrastructure and real estate focused company within the timeframe contemplated or at all, and the impact of such transformation on the Company's legacy portfolios and assets, including whether such transformation will be consistent with the Company’s REIT status; our ability to obtain and maintain financing arrangements, including securitizations, on favorable or comparable terms or at all; the Company's ability to complete anticipated monetizations of non-core assets within the timeframe and on the terms contemplated, if at all; the impact of the completion of the sale of the Company's hospitality portfolios and whether we will realize the anticipated benefits of our exit from our hospitality business; the impact of completed or anticipated initiatives related to our digital transformation, including the strategic investment by Wafra and the formation of certain other investment management platforms, on our company's growth and earnings profile; whether we will realize any of the anticipated benefits of our strategic partnership with Wafra, including whether Wafra will make additional investments in our Digital Other and Digital Operating segments; our ability to integrate and maintain consistent standards and controls, including our ability to manage our acquisitions in the digital industry effectively; the ability to realize anticipated strategic and financial benefits from terminating the management agreement with Brightspire Capital, Inc. (NYSE:BRSP; formerly, Colony Credit Real Estate, Inc. or CLNC); the impact to our business operations and financial condition of realized or anticipated compensation and administrative savings through cost reduction programs; our ability to redeploy any proceeds received from the sale of our non-digital or other legacy assets within the timeframe and manner contemplated or at all; our business and investment strategy, including the ability of the businesses in which we have a significant investment (such as BRSP) to execute their business strategies; BRSP's trading price and its impact on the carrying value of the Company's investment in BRSP; performance of our investments relative to our expectations and the impact on our actual return on invested equity; our ability to grow our business by raising capital for the companies that we manage; our ability to deploy capital into new investments consistent with our digital business strategies, including the earnings profile of such new investments; the impact of adverse conditions affecting a specific asset class in which we have investments; the availability of, and competition for, attractive investment opportunities; our ability to achieve any of the anticipated benefits of certain joint ventures, including any ability for such ventures to create and/or distribute new investment products; our ability to satisfy and manage our capital requirements; our expected hold period for our assets and the impact of any changes in our expectations on the carrying value of such assets; the general volatility of the securities markets in which we participate; stability of the capital structure of our wellness infrastructure portfolio and remaining hospitality portfolio; changes in interest rates and the market value of our assets; interest rate mismatches between our assets and any borrowings used to fund such assets; effects of hedging instruments on our assets; the impact of economic conditions on third parties on which we rely; any litigation and contractual claims against us and our affiliates, including potential settlement and litigation of such claims; our levels of leverage; adverse domestic or international economic conditions, including those resulting from the COVID-19 pandemic, and the impact on the commercial real estate or real-estate related sectors; the impact of legislative, regulatory and competitive changes; actions, initiatives and policies of the U.S. and non-U.S. governments and changes to U.S. or non-U.S. government policies and the execution and impact of these actions, initiatives and policies; whether we will maintain our qualification as a real estate investment trust for U.S. federal income tax purposes and our ability to do so; our ability to maintain our exemption from registration as an investment company under the Investment Company Act of 1940, as amended; changes in our board of directors or management team, and availability of qualified personnel; our ability to make or maintain distributions to our stockholders; our understanding of our competition, and other risks and uncertainties, including those detailed in the Company’s Annual Report on Form 10-K for the fiscal year ended December 31, 2020 and Quarterly Report on Form 10-Q for the quarter ended June 30, 2021, each under the heading “Risk Factors,” as such factors may be updated from time to time in the Company’s subsequent periodic filings with the U.S. Securities and Exchange Commission (“SEC”). All forward-looking statements reflect the Company’s good faith beliefs, assumptions and expectations, but they are not guarantees of future performance. Additional information about these and other factors can be found in the Company’s reports filed from time to time with the SEC. The Company cautions investors not to unduly rely on any forward-looking statements. The forward-looking statements speak only as of the date of this press release. The Company is under no duty to update any of these forward-looking statements after the date of this press release, nor to conform prior statements to actual results or revised expectations, and the Company does not intend to do so. This presentation may contain statistics and other data that has been obtained or compiled from information made available by third-party service providers. The Company has not independently verified such statistics or data. This presentation is for informational purposes only and does not constitute an offer to sell or a solicitation of an offer to buy any securities of the Company. This information is not intended to be indicative of future results. Actual performance of the Company may vary materially.
3 AGENDA 1. Corporate Overview 2. 2Q Highlights 3. Financial Results 4. Executing the Digital Playbook 5. Q&A
4 1 CORPORATE OVERVIEW
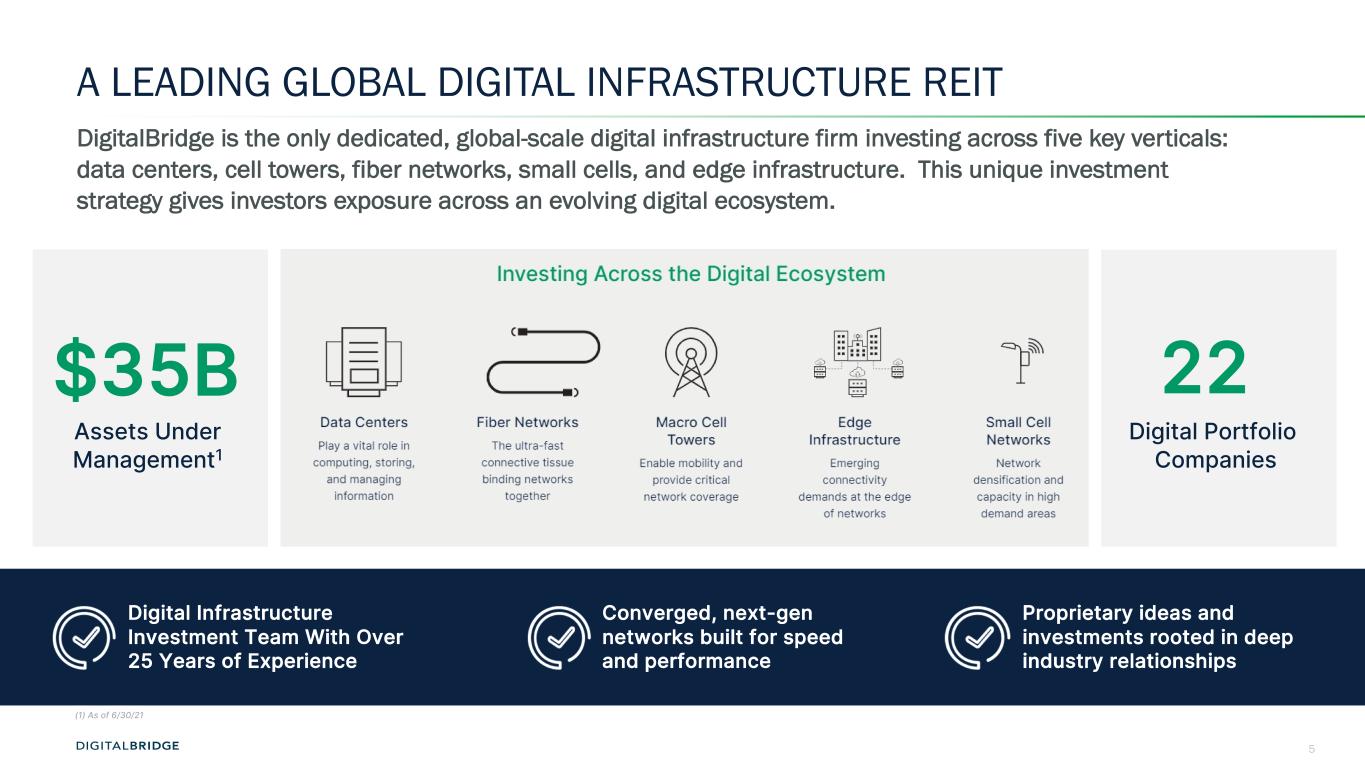
5 A LEADING GLOBAL DIGITAL INFRASTRUCTURE REIT DigitalBridge is the only dedicated, global-scale digital infrastructure firm investing across five key verticals: data centers, cell towers, fiber networks, small cells, and edge infrastructure. This unique investment strategy gives investors exposure across an evolving digital ecosystem. Digital Infrastructure Investment Team With Over 25 Years of Experience Converged, next-gen networks built for speed and performance Proprietary ideas and investments rooted in deep industry relationships $35B Assets Under Management1 22 Digital Portfolio Companies (1) As of 6/30/21

6 THE DIGITALBRIDGE DIFFERENCE: INVESTOR–OPERATOR–BUILDER With a heritage of investing capital efficiently, operating digital assets, and building businesses, we take an innovative approach to growth and value creation on behalf of our customers and investors DIGITAL REITs DIGITAL INFRASTRUCTURE ASSET MANAGERS/ INVESTORS DigitalBridge actively invests and operates 22 portfolio and affiliated companies across the digital infrastructure ecosystem DigitalBridge Digital Infrastructure Assets DigitalBridge Portfolio Companies ~30,000 Tower Assets Active Sites > 80,000 Small Cells Assets Nodes > 130,000 Fiber Assets Route Miles Edge InfrastructureData Centers Enterprise & Hyperscale>100 Edge Facilities > 400 DATA CENTERS
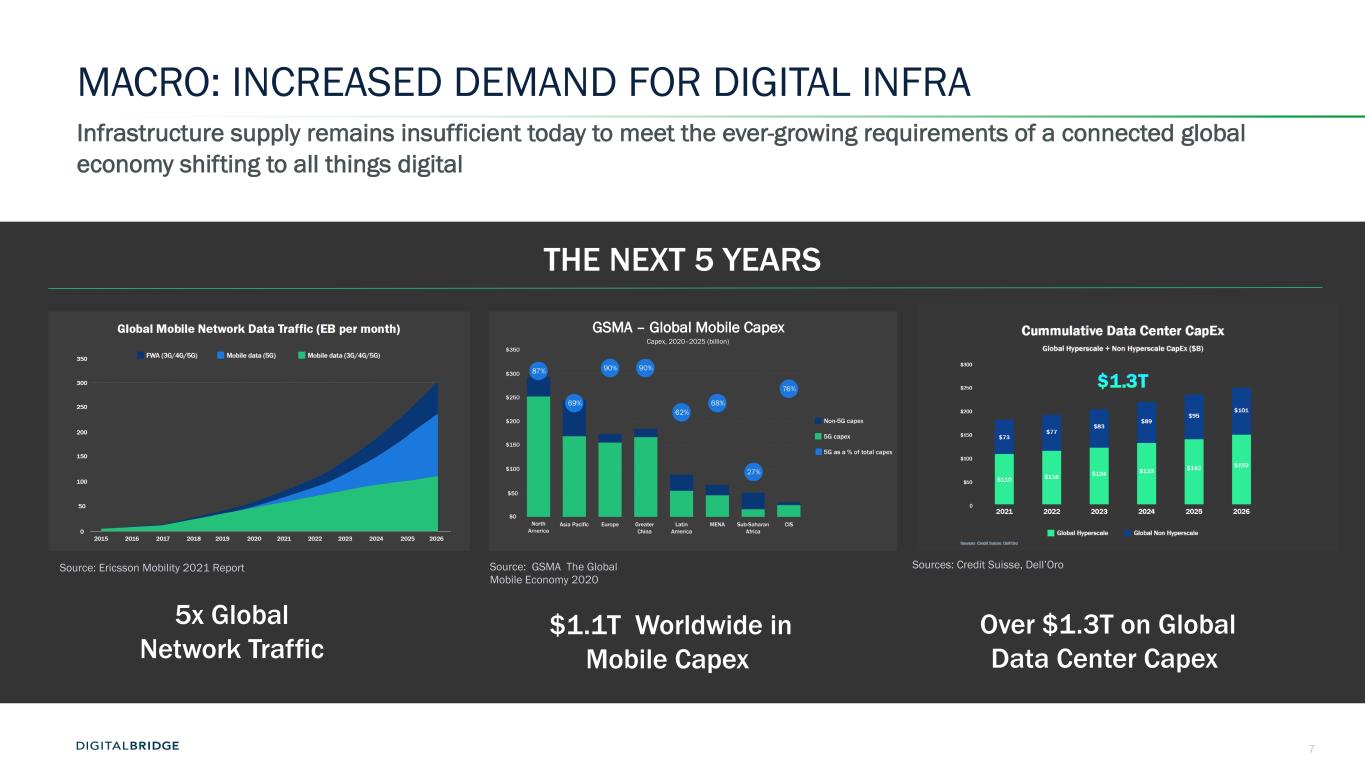
7 MACRO: INCREASED DEMAND FOR DIGITAL INFRA Infrastructure supply remains insufficient today to meet the ever-growing requirements of a connected global economy shifting to all things digital GSMA – Global Mobile Capex Capex, 2020–2025 (billion) $1.1T Worldwide in Mobile Capex Over $1.3T on Global Data Center Capex 5x Global Network Traffic THE NEXT 5 YEARS Source: Ericsson Mobility 2021 Report Source: GSMA The Global Mobile Economy 2020 Sources: Credit Suisse, Dell’Oro
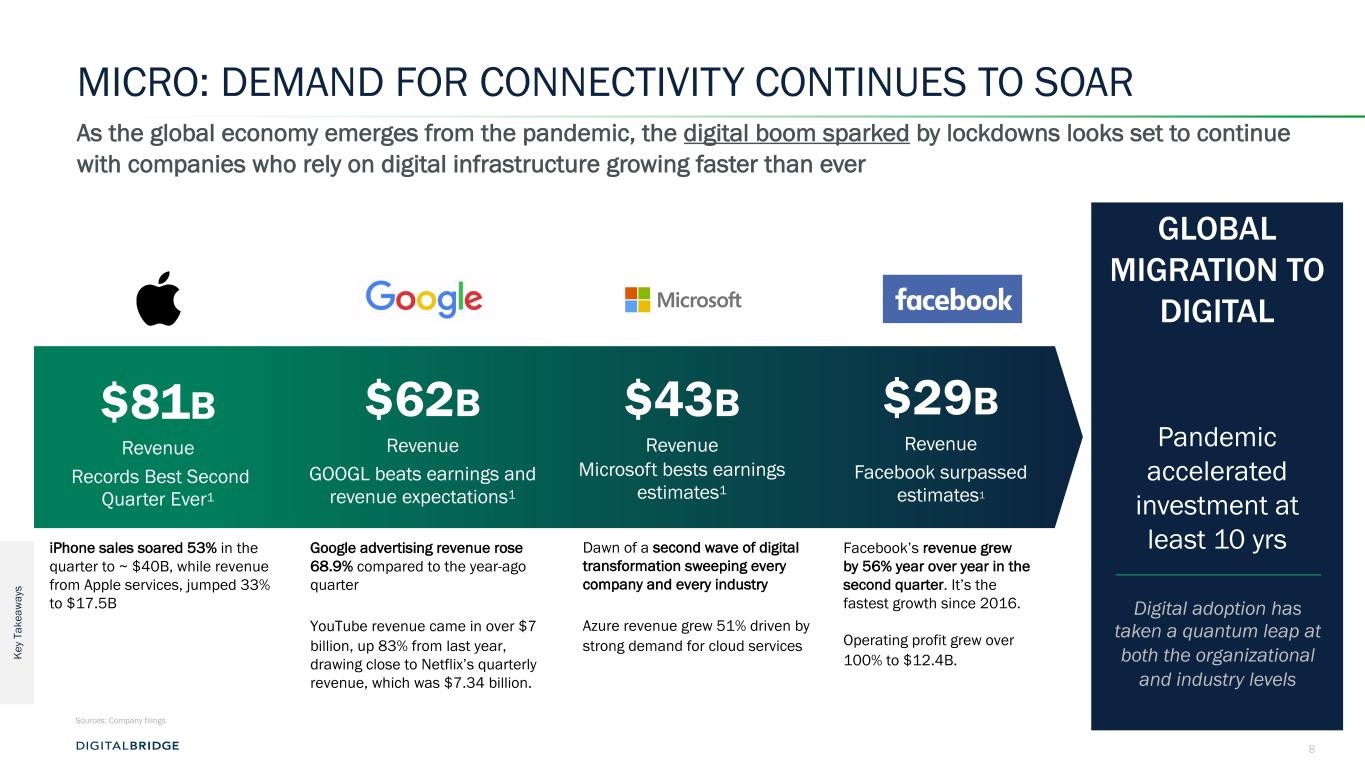
8 GLOBAL MIGRATION TO DIGITAL Pandemic accelerated investment at least 10 yrs MICRO: DEMAND FOR CONNECTIVITY CONTINUES TO SOAR As the global economy emerges from the pandemic, the digital boom sparked by lockdowns looks set to continue with companies who rely on digital infrastructure growing faster than ever $81B Revenue Records Best Second Quarter Ever1 $62B Revenue GOOGL beats earnings and revenue expectations1 $43B Revenue Microsoft bests earnings estimates1 $29B Revenue Facebook surpassed estimates1 Google advertising revenue rose 68.9% compared to the year-ago quarter YouTube revenue came in over $7 billion, up 83% from last year, drawing close to Netflix’s quarterly revenue, which was $7.34 billion. Dawn of a second wave of digital transformation sweeping every company and every industry Azure revenue grew 51% driven by strong demand for cloud services Facebook’s revenue grew by 56% year over year in the second quarter. It’s the fastest growth since 2016. Operating profit grew over 100% to $12.4B.Ke y Ta ke aw ay s Sources: Company filings iPhone sales soared 53% in the quarter to ~ $40B, while revenue from Apple services, jumped 33% to $17.5B Digital adoption has taken a quantum leap at both the organizational and industry levels
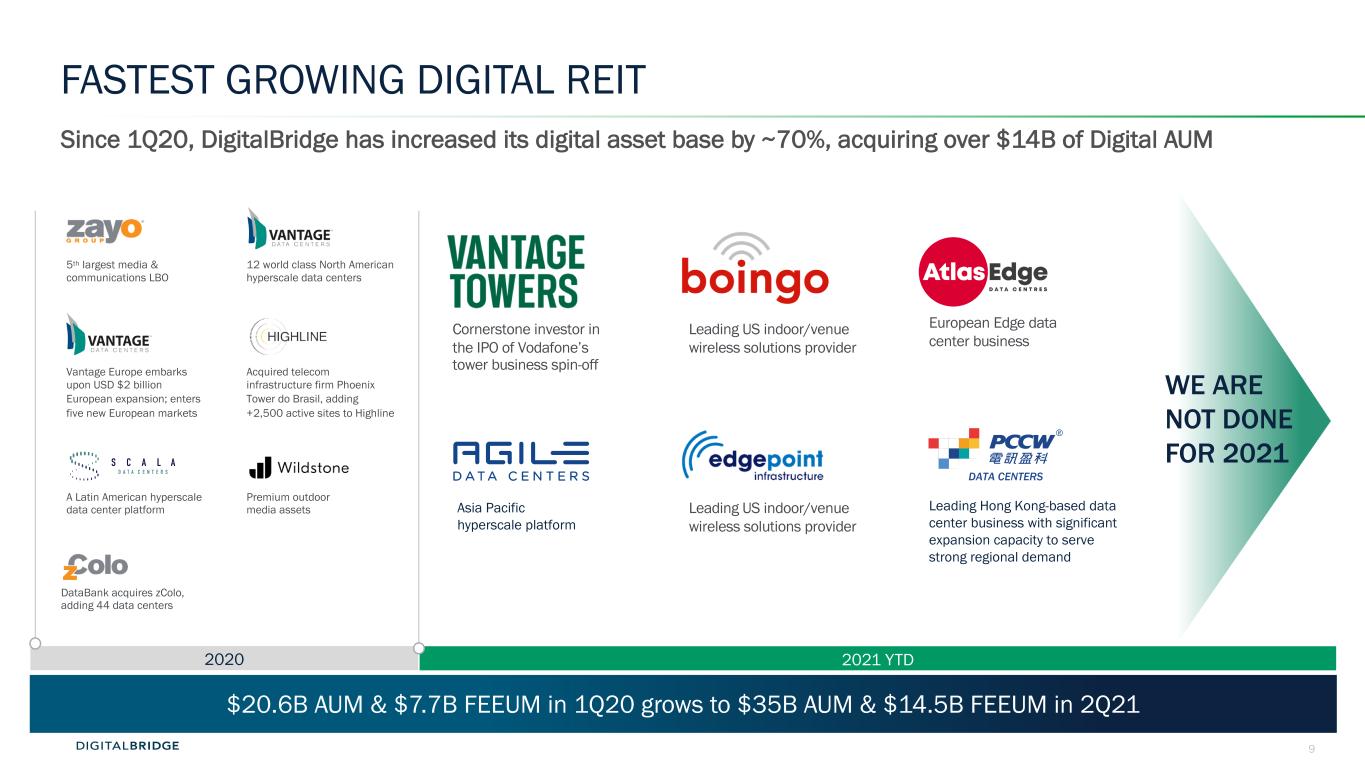
9 Since 1Q20, DigitalBridge has increased its digital asset base by ~70%, acquiring over $14B of Digital AUM FASTEST GROWING DIGITAL REIT 2021 YTD European Edge data center business $20.6B AUM & $7.7B FEEUM in 1Q20 grows to $35B AUM & $14.5B FEEUM in 2Q21 2020 Acquired telecom infrastructure firm Phoenix Tower do Brasil, adding +2,500 active sites to Highline Cornerstone investor in the IPO of Vodafone’s tower business spin-off Leading US indoor/venue wireless solutions provider Vantage Europe embarks upon USD $2 billion European expansion; enters five new European markets 5th largest media & communications LBO A Latin American hyperscale data center platform Premium outdoor media assets 12 world class North American hyperscale data centers DataBank acquires zColo, adding 44 data centers Leading US indoor/venue wireless solutions provider Asia Pacific hyperscale platform Leading Hong Kong-based data center business with significant expansion capacity to serve strong regional demand WE ARE NOT DONE FOR 2021 DATA CENTERS
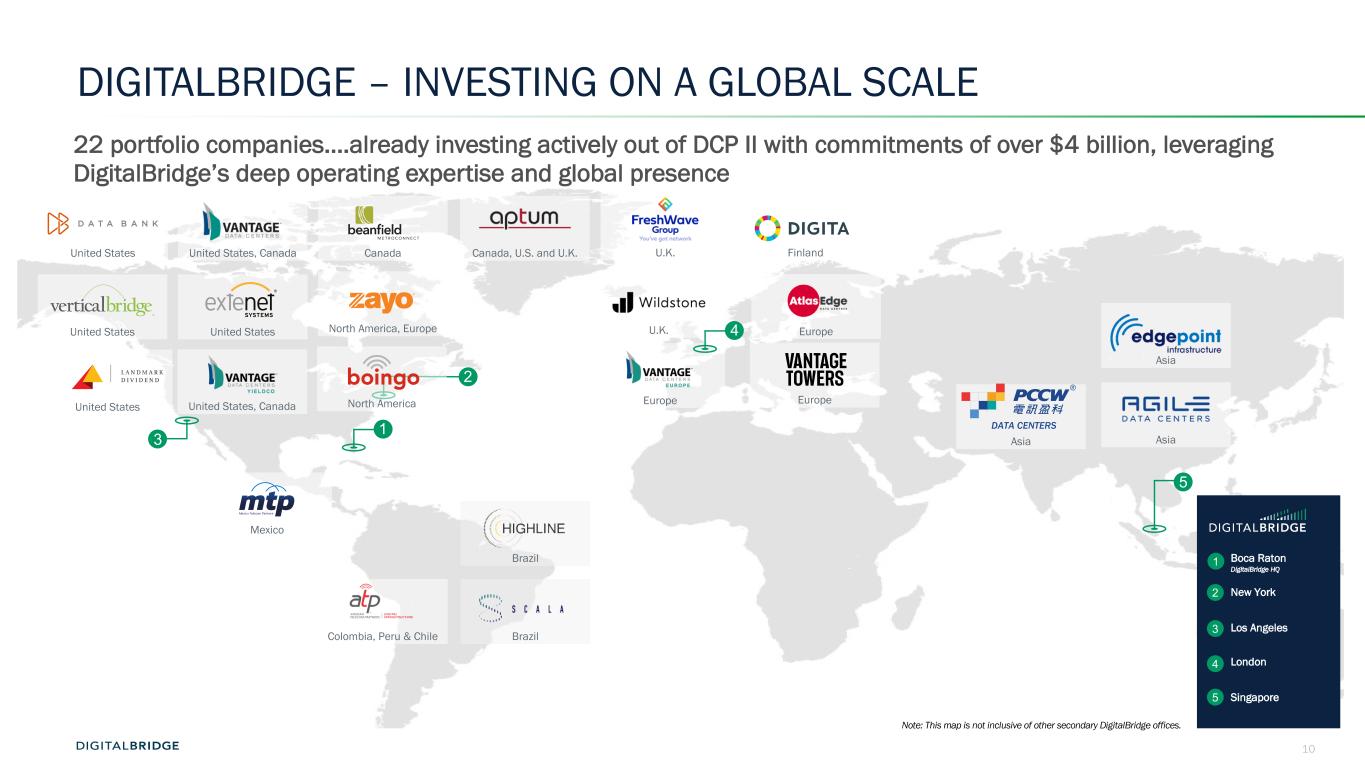
10 Asia DIGITALBRIDGE – INVESTING ON A GLOBAL SCALE 22 portfolio companies….already investing actively out of DCP II with commitments of over $4 billion, leveraging DigitalBridge’s deep operating expertise and global presence Note: This map is not inclusive of other secondary DigitalBridge offices. 2 Colombia, Peru & Chile Mexico FinlandCanada, U.S. and U.K. U.K. Europe U.K.CanadaUnited States United StatesUnited States North America, Europe Brazil Brazil Asia Asia United States, Canada United States, Canada Boca Raton DigitalBridge HQ New York Los Angeles London Singapore 2 3 4 5 1 EuropeUnited States 3 Europe 13 4 North America 2 5 DATA CENTERS

11 2 2Q HIGHLIGHTS

12 NEW PLATFORM INVESTMENTS ADVANCE STRATEGIC VISION Investments announced or closed in 2Q21 highlight DigitalBridge’s expanding global scope and leadership investing in next generation networks that support the proliferation of 5G and IOT enabled devices Asia Cell Towers § Asian tower platform - leveraged to strong regional growth dynamics § Partnering with established mgmt team to build Asean tower platform § Already assembled 9,000+ tower portfolio via 5 acquisitions § Ability to apply DigitalBridge playbook from other markets and prior investment cycles Asia Hyperscale Data Centers § Asia Pacific hyperscale platform § Backing experienced mgmt team to capitalize on persistent, strong growth in cloud infrastructure demand across AsiaPac region AsiaNext-Generation Networks United States Small Cells / DAS § Leading US indoor/venue wireless solutions provider § DCP II take-private investment at $14/share, $840M TEV § Leveraged to emerging demand for converged indoor wireless solutions (5G, Wifi6, CBRS) Europe Edge Data Centers § European ‘edge infrastructure’ joint venture with Liberty Global § Emerging digital infra vertical blends various elements of traditional digital infra § Designed to bring connectivity closer to consumers and enterprises, driving down latency and improving customer experience § Significant opportunities to extend reach across Europe and partner with other tech/telcos to unlock and grow value Asia Hyperscale/Colo Data Centers Towers Small Cells Data Centers Fiber Edge Infrastructure Launched North America South America Europe Launched § Acquiring leading Hong Kong-based data center business to anchor regional strategy § Strong development pipeline with significant expansion capacity to serve strong regional demand from hyperscalers and large enterprises. Expanding key logos. DATA CENTERS
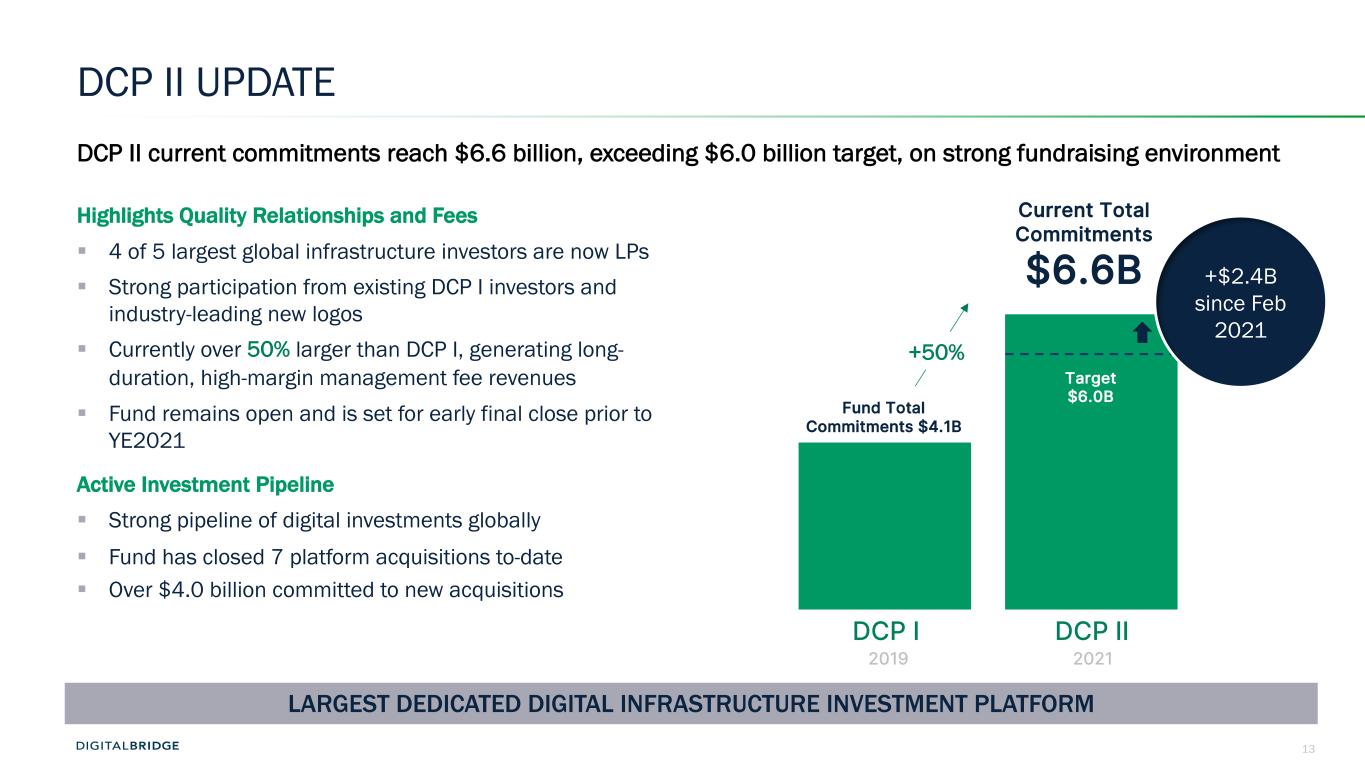
13 DCP II UPDATE DCP II current commitments reach $6.6 billion, exceeding $6.0 billion target, on strong fundraising environment Highlights Quality Relationships and Fees § 4 of 5 largest global infrastructure investors are now LPs § Strong participation from existing DCP I investors and industry-leading new logos § Currently over 50% larger than DCP I, generating long- duration, high-margin management fee revenues § Fund remains open and is set for early final close prior to YE2021 Active Investment Pipeline § Strong pipeline of digital investments globally § Fund has closed 7 platform acquisitions to-date § Over $4.0 billion committed to new acquisitions DCP I DCP II Fund Total Commitments $4.1B Current Total Commitments $6.6B Target $6.0B +$2.4B since Feb 2021 20212019 LARGEST DEDICATED DIGITAL INFRASTRUCTURE INVESTMENT PLATFORM +50%

14 Long-term contracted fee streams drive stable, predictable earnings that compound over time, similar to our digital operating revenues CONTINUING TO GROW OUR DIGITAL IM FRANCHISE + + Credit•Former the original base for growth 2019 2020 2021 $17B Digital Bridge DCP I DCP II •6 separately capitalized companies •Actively deploying Credit Liquid Note: Individual components of graph are not to scale $15.3B NEW STRATEGIES Q2 •Flagship equity fund •Now almost fully committed +30% $13B 2Q Update +$2B New Capital Formation DCPII success places on track to meet/exceed 2021 fundraising target Co Invest •An important commitment to our investors •Boosts our firepower (1) Includes ~$800M raised subsequent to 6/30/21 1
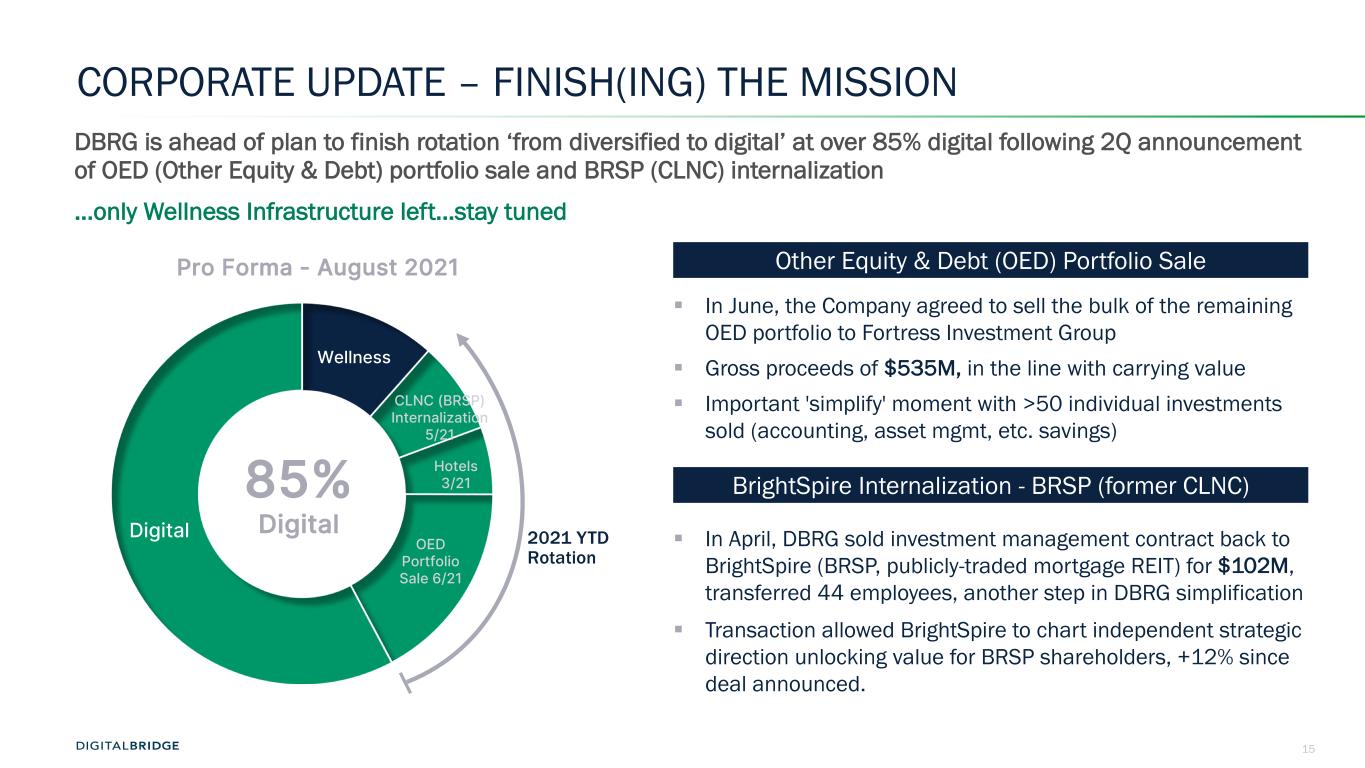
15 Wellness CLNC (BRSP) Internalization 5/21 Hotels 3/21 OED Portfolio Sale 6/21 Digital CORPORATE UPDATE – FINISH(ING) THE MISSION DBRG is ahead of plan to finish rotation ‘from diversified to digital’ at over 85% digital following 2Q announcement of OED (Other Equity & Debt) portfolio sale and BRSP (CLNC) internalization …only Wellness Infrastructure left…stay tuned Pro Forma - August 2021 85% Digital 2021 YTD Rotation Other Equity & Debt (OED) Portfolio Sale § In June, the Company agreed to sell the bulk of the remaining OED portfolio to Fortress Investment Group § Gross proceeds of $535M, in the line with carrying value § Important 'simplify' moment with >50 individual investments sold (accounting, asset mgmt, etc. savings) § In April, DBRG sold investment management contract back to BrightSpire (BRSP, publicly-traded mortgage REIT) for $102M, transferred 44 employees, another step in DBRG simplification § Transaction allowed BrightSpire to chart independent strategic direction unlocking value for BRSP shareholders, +12% since deal announced. BrightSpire Internalization - BRSP (former CLNC)

16 JUNE 2021 REBRANDING TO DIGITALBRIDGE - INAUGURAL INVESTOR DAY § DigitalBridge…a new name with a rich heritage. Introduce the fastest-growing global digital infra REIT, a business with unique characteristics § Operating DNA § Access to institutional capital § Levered to strong, secular industry tailwinds § New logo § New NYSE ticker: DBRG § Present our executive management’s team unique digital expertise, developed over the last 25+ years § Meet the broadest, deepest team singularly focused on the massive opportunity in digital infrastructure THE DIGITALBRIDGE DIFFERENCE Established Category Leader Trusted Financial Partner Compound Value for Investors Growing Markets Challenging the Status Quo Strong Entrepreneurial Drive Make a difference Resilient Markets INVESTOR DAY MICROSITE - details investment strategy across verticals and introduction to key mgmt. team and operating partners
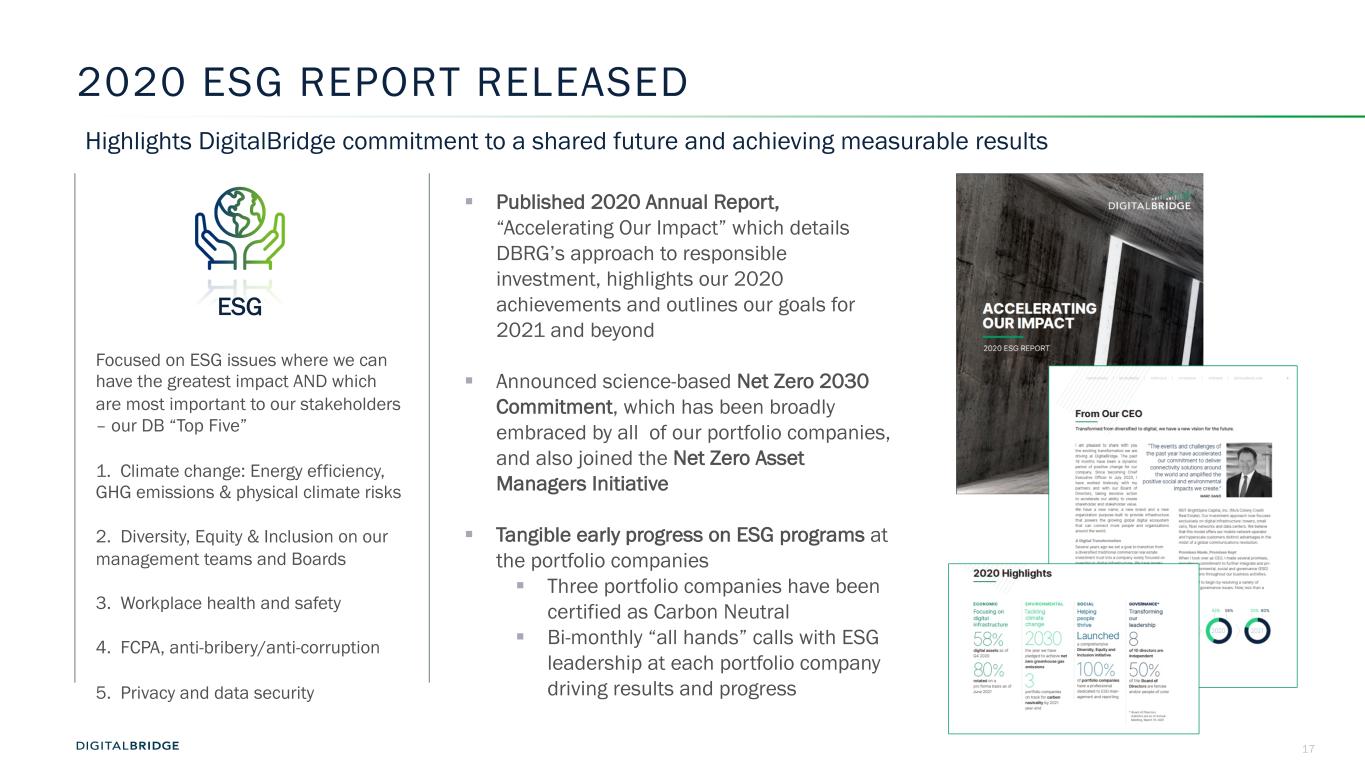
17 2020 ESG REPORT RELEASED ESG Focused on ESG issues where we can have the greatest impact AND which are most important to our stakeholders – our DB “Top Five” 1. Climate change: Energy efficiency, GHG emissions & physical climate risks 2. Diversity, Equity & Inclusion on our management teams and Boards 3. Workplace health and safety 4. FCPA, anti-bribery/anti-corruption 5. Privacy and data security Highlights DigitalBridge commitment to a shared future and achieving measurable results § Published 2020 Annual Report, “Accelerating Our Impact” which details DBRG’s approach to responsible investment, highlights our 2020 achievements and outlines our goals for 2021 and beyond § Announced science-based Net Zero 2030 Commitment, which has been broadly embraced by all of our portfolio companies, and also joined the Net Zero Asset Managers Initiative § Tangible early progress on ESG programs at the portfolio companies § Three portfolio companies have been certified as Carbon Neutral § Bi-monthly “all hands” calls with ESG leadership at each portfolio company driving results and progress

18Strictly Private and Confidential 3 2Q FINANCIAL RESULTS
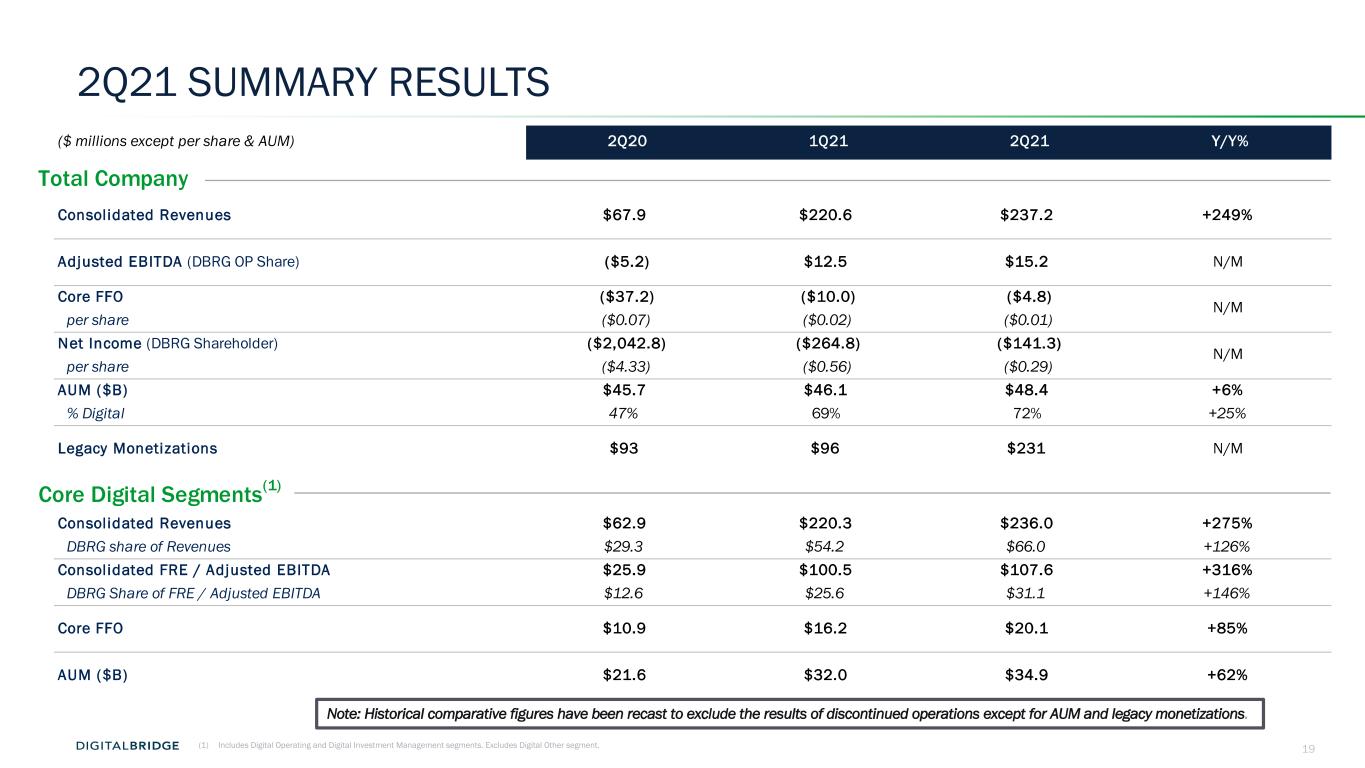
19 2Q21 SUMMARY RESULTS (1) Includes Digital Operating and Digital Investment Management segments. Excludes Digital Other segment. ($ millions except per share & AUM) 2Q20 1Q21 2Q21 Y/Y% Total Company Consolidated Revenues $67.9 $220.6 $237.2 +249% Adjusted EBITDA (DBRG OP Share) ($5.2) $12.5 $15.2 N/M Core FFO ($37.2) ($10.0) ($4.8) per share ($0.07) ($0.02) ($0.01) Net Income (DBRG Shareholder) ($2,042.8) ($264.8) ($141.3) per share ($4.33) ($0.56) ($0.29) AUM ($B) $45.7 $46.1 $48.4 +6% % Digital 47% 69% 72% +25% Legacy Monetizations $93 $96 $231 N/M Core Digital Segments(1) Consolidated Revenues $62.9 $220.3 $236.0 +275% DBRG share of Revenues $29.3 $54.2 $66.0 +126% Consolidated FRE / Adjusted EBITDA $25.9 $100.5 $107.6 +316% DBRG Share of FRE / Adjusted EBITDA $12.6 $25.6 $31.1 +146% Core FFO $10.9 $16.2 $20.1 +85% AUM ($B) $21.6 $32.0 $34.9 +62% N/M N/M Note: Historical comparative figures have been recast to exclude the results of discontinued operations except for AUM and legacy monetizations.
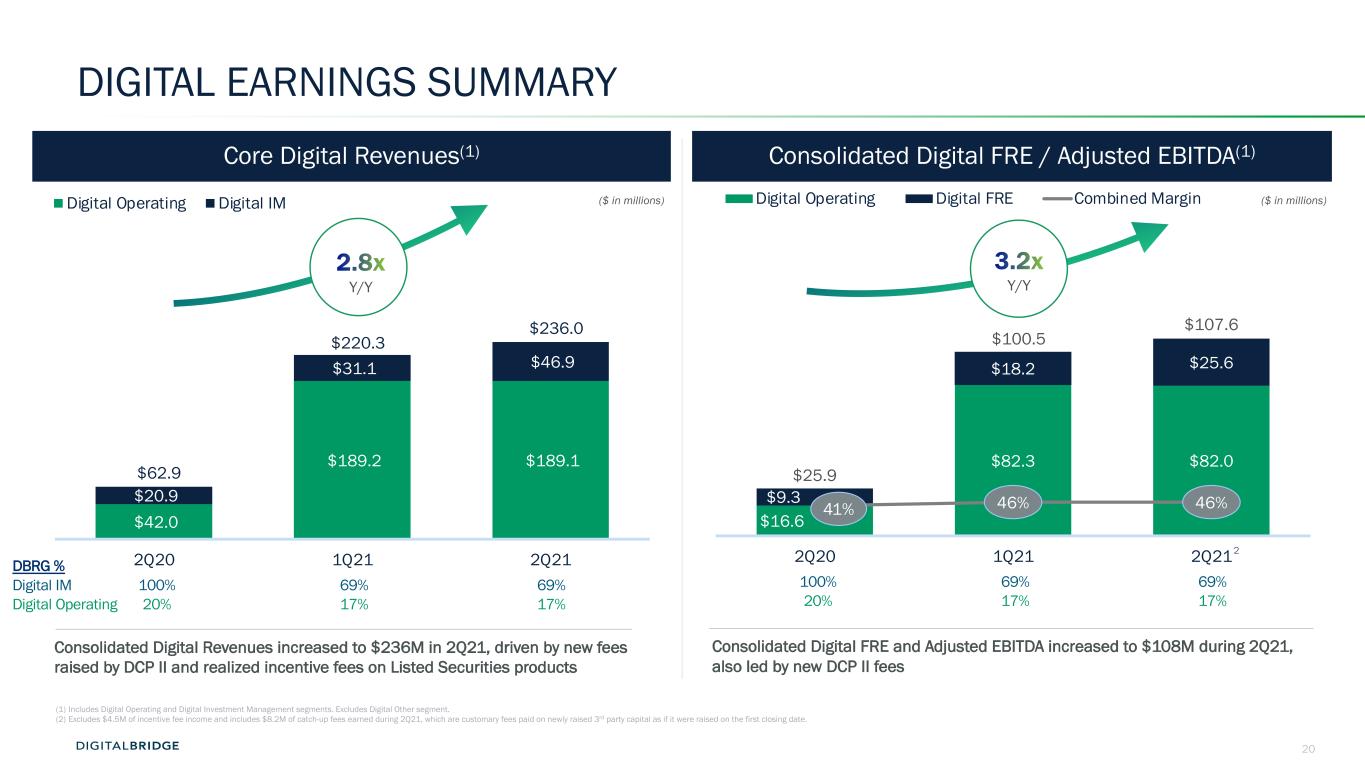
20 $16.6 $82.3 $82.0 $9.3 $18.2 $25.6 $25.9 $100.5 $107.6 41% 46% 46% 2Q20 1Q21 2Q21 Digital Operating Digital FRE Combined Margin $42.0 $189.2 $189.1 $20.9 $31.1 $46.9 $62.9 $220.3 $236.0 2Q20 1Q21 2Q21 Digital Operating Digital IM DIGITAL EARNINGS SUMMARY Consolidated Digital FRE / Adjusted EBITDA(1)Core Digital Revenues(1) (1) Includes Digital Operating and Digital Investment Management segments. Excludes Digital Other segment. (2) Excludes $4.5M of incentive fee income and includes $8.2M of catch-up fees earned during 2Q21, which are customary fees paid on newly raised 3rd party capital as if it were raised on the first closing date. Consolidated Digital Revenues increased to $236M in 2Q21, driven by new fees raised by DCP II and realized incentive fees on Listed Securities products Consolidated Digital FRE and Adjusted EBITDA increased to $108M during 2Q21, also led by new DCP II fees ($ in millions) ($ in millions) 100% 69% 69% 20% 17% 17% DBRG % Digital IM Digital Operating 100% 69% 69% 20% 17% 17% Y/Y Y/Y 2
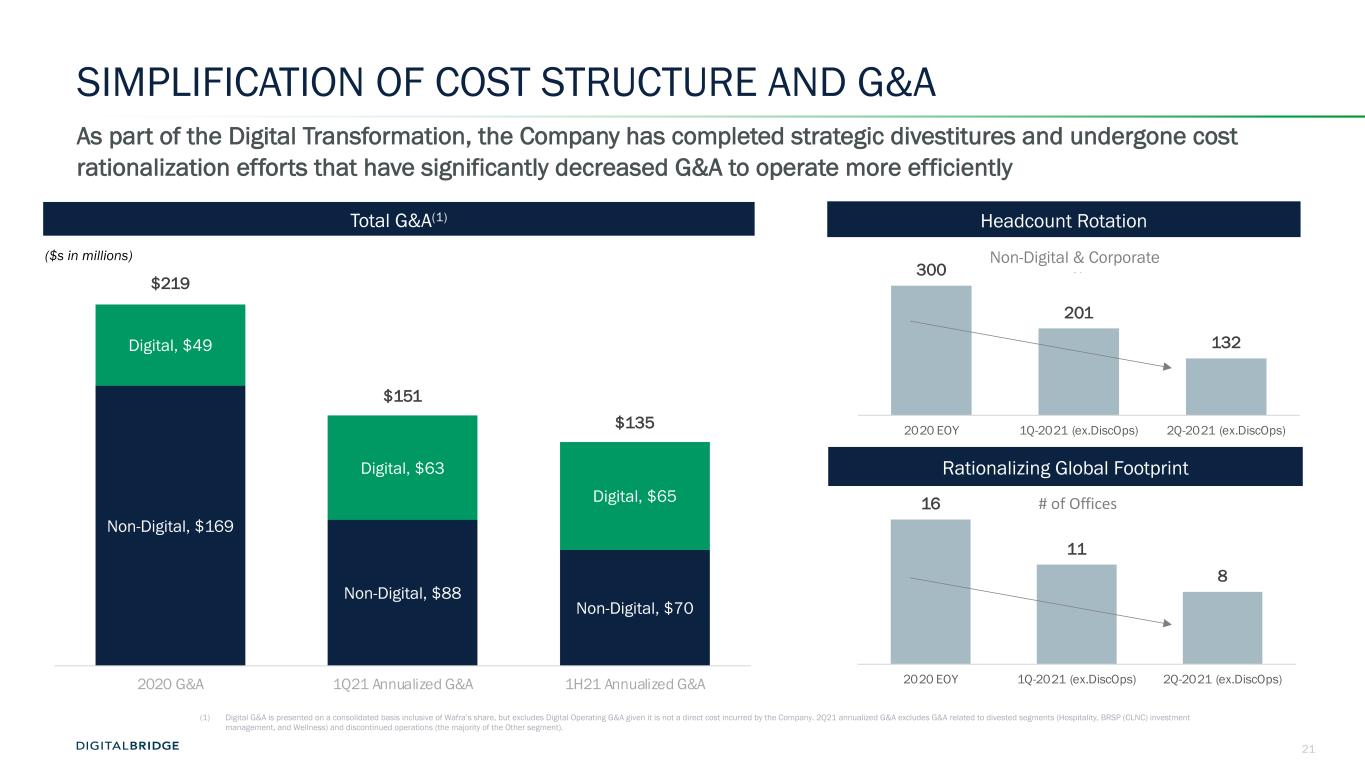
21 16 11 8 2020 EOY 1Q-2021 (ex.DiscOps) 2Q-2021 (ex.DiscOps) # of Offices 300 201 132 2020 EOY 1Q-2021 (ex.DiscOps) 2Q-2021 (ex.DiscOps) N SIMPLIFICATION OF COST STRUCTURE AND G&A As part of the Digital Transformation, the Company has completed strategic divestitures and undergone cost rationalization efforts that have significantly decreased G&A to operate more efficiently Total G&A(1) (1) Digital G&A is presented on a consolidated basis inclusive of Wafra’s share, but excludes Digital Operating G&A given it is not a direct cost incurred by the Company. 2Q21 annualized G&A excludes G&A related to divested segments (Hospitality, BRSP (CLNC) investment management, and Wellness) and discontinued operations (the majority of the Other segment). Rationalizing Global Footprint Headcount Rotation ($s in millions) Non-Digital & Corporate Non-Digital, $169 Non-Digital, $88 Non-Digital, $70 Digital, $49 Digital, $63 Digital, $65 $219 $151 $135 2020 G&A 1Q21 Annualized G&A 1H21 Annualized G&A
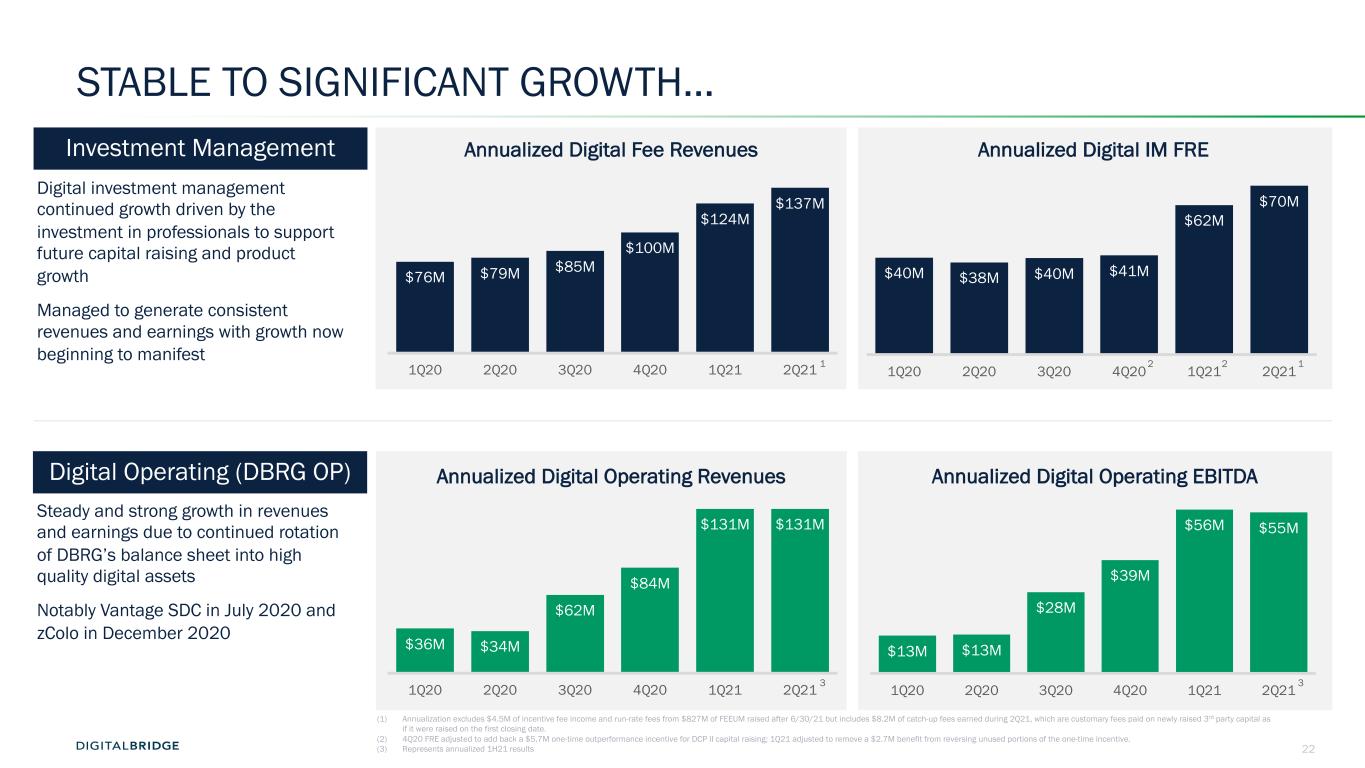
22 STABLE TO SIGNIFICANT GROWTH… $40M $38M $40M $41M $62M $70M 1Q20 2Q20 3Q20 4Q20 1Q21 2Q21 $76M $79M $85M $100M $124M $137M 1Q20 2Q20 3Q20 4Q20 1Q21 2Q21 $36M $34M $62M $84M $131M $131M 1Q20 2Q20 3Q20 4Q20 1Q21 2Q21 $13M $13M $28M $39M $56M $55M 1Q20 2Q20 3Q20 4Q20 1Q21 2Q21 Digital investment management continued growth driven by the investment in professionals to support future capital raising and product growth Managed to generate consistent revenues and earnings with growth now beginning to manifest Steady and strong growth in revenues and earnings due to continued rotation of DBRG’s balance sheet into high quality digital assets Notably Vantage SDC in July 2020 and zColo in December 2020 Annualized Digital Fee Revenues Annualized Digital IM FRE Annualized Digital Operating Revenues Annualized Digital Operating EBITDA Investment Management Digital Operating (DBRG OP) (1) Annualization excludes $4.5M of incentive fee income and run-rate fees from $827M of FEEUM raised after 6/30/21 but includes $8.2M of catch-up fees earned during 2Q21, which are customary fees paid on newly raised 3rd party capital as if it were raised on the first closing date. (2) 4Q20 FRE adjusted to add back a $5.7M one-time outperformance incentive for DCP II capital raising; 1Q21 adjusted to remove a $2.7M benefit from reversing unused portions of the one-time incentive. (3) Represents annualized 1H21 results 221 1 3 3
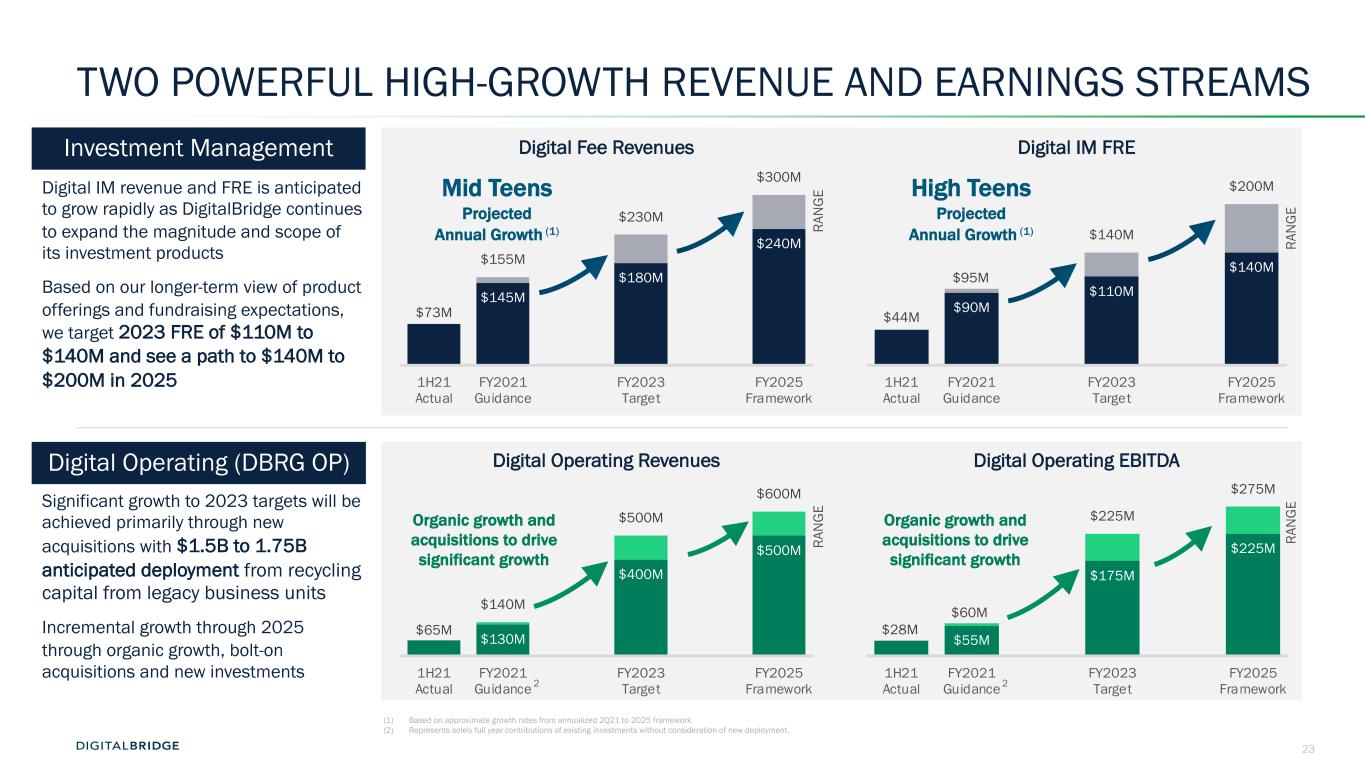
23 TWO POWERFUL HIGH-GROWTH REVENUE AND EARNINGS STREAMS $44M $90M $110M $140M $95M $140M $200M 1H21 Actual FY2021 Guidance FY2023 Target FY2025 Framework $73M $145M $180M $240M $155M $230M $300M 1H21 Actual FY2021 Guidance FY2023 Target FY2025 Framework $28M $55M $175M $225M $60M $225M $275M 1H21 Actual FY2021 Guidance FY2023 Target FY2025 Framework $65M $130M $400M $500M $140M $500M $600M 1H21 Actual FY2021 Guidance FY2023 Target FY2025 Framework Digital IM revenue and FRE is anticipated to grow rapidly as DigitalBridge continues to expand the magnitude and scope of its investment products Based on our longer-term view of product offerings and fundraising expectations, we target 2023 FRE of $110M to $140M and see a path to $140M to $200M in 2025 Significant growth to 2023 targets will be achieved primarily through new acquisitions with $1.5B to 1.75B anticipated deployment from recycling capital from legacy business units Incremental growth through 2025 through organic growth, bolt-on acquisitions and new investments Digital Fee Revenues Digital IM FRE RA N G E RA N G E RA N G E RA N G E High Teens Projected Annual Growth (1) Digital Operating Revenues Digital Operating EBITDA 2 Organic growth and acquisitions to drive significant growth Mid Teens Projected Annual Growth (1) (1) Based on approximate growth rates from annualized 2Q21 to 2025 framework (2) Represents solely full year contributions of existing investments without consideration of new deployment. Organic growth and acquisitions to drive significant growth 2 Investment Management Digital Operating (DBRG OP)
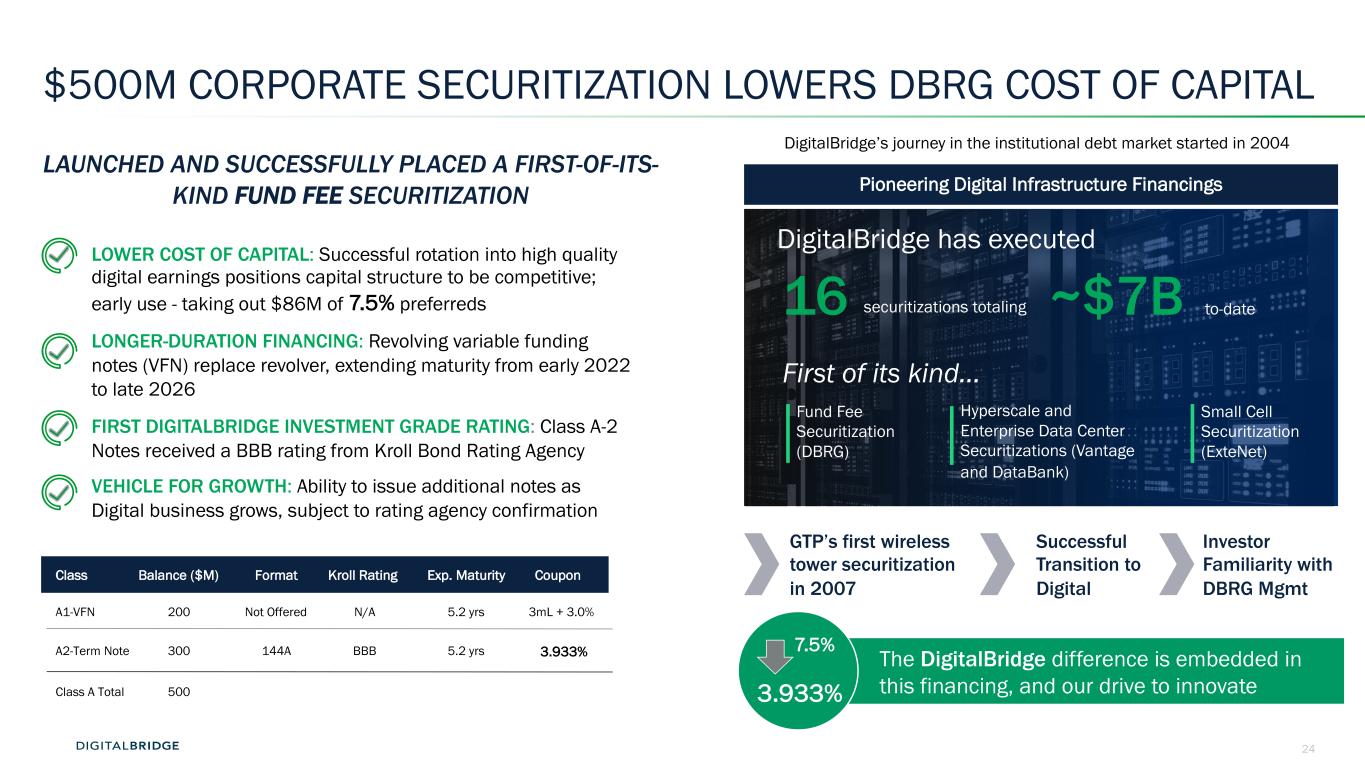
24 $500M CORPORATE SECURITIZATION LOWERS DBRG COST OF CAPITAL • LOWER COST OF CAPITAL: Successful rotation into high quality digital earnings positions capital structure to be competitive; early use - taking out $86M of 7.5% preferreds • LONGER-DURATION FINANCING: Revolving variable funding notes (VFN) replace revolver, extending maturity from early 2022 to late 2026 • FIRST DIGITALBRIDGE INVESTMENT GRADE RATING: Class A-2 Notes received a BBB rating from Kroll Bond Rating Agency • VEHICLE FOR GROWTH: Ability to issue additional notes as Digital business grows, subject to rating agency confirmation Class Balance ($M) Format Kroll Rating Exp. Maturity Coupon A1-VFN 200 Not Offered N/A 5.2 yrs 3mL + 3.0% A2-Term Note 300 144A BBB 5.2 yrs 3.933% Class A Total 500 Pioneering Digital Infrastructure Financings DigitalBridge has executed securitizations totaling16 ~$7B to-date First of its kind… Fund Fee Securitization (DBRG) Hyperscale and Enterprise Data Center Securitizations (Vantage and DataBank) Small Cell Securitization (ExteNet) Investor Familiarity with DBRG Mgmt Successful Transition to Digital LAUNCHED AND SUCCESSFULLY PLACED A FIRST-OF-ITS- KIND FUND FEE SECURITIZATION DigitalBridge’s journey in the institutional debt market started in 2004 The DigitalBridge difference is embedded in this financing, and our drive to innovate GTP’s first wireless tower securitization in 2007 3.933% 7.5%
25 4 Executing The Digital Playbook
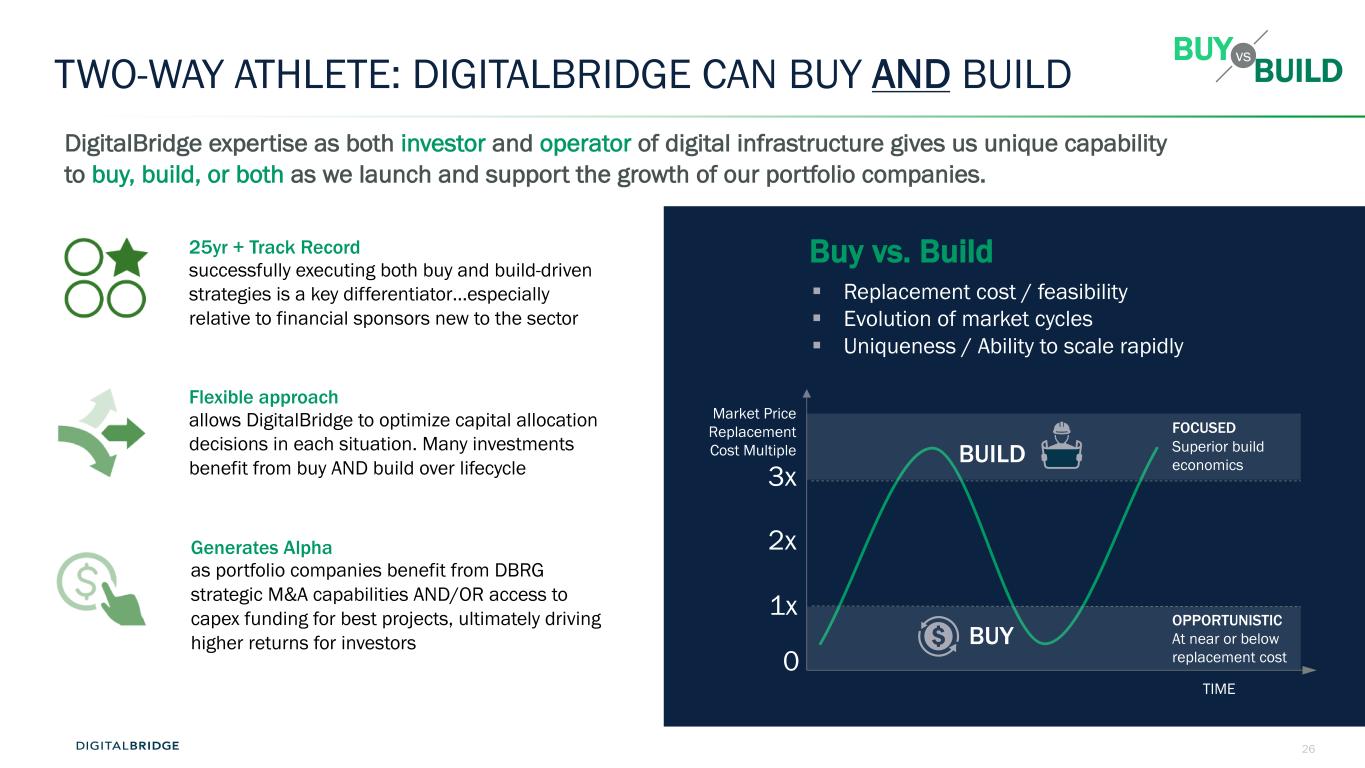
26 TWO-WAY ATHLETE: DIGITALBRIDGE CAN BUY AND BUILD 25yr + Track Record successfully executing both buy and build-driven strategies is a key differentiator…especially relative to financial sponsors new to the sector DigitalBridge expertise as both investor and operator of digital infrastructure gives us unique capability to buy, build, or both as we launch and support the growth of our portfolio companies. Buy vs. Build § Replacement cost / feasibility § Evolution of market cycles § Uniqueness / Ability to scale rapidly Flexible approach allows DigitalBridge to optimize capital allocation decisions in each situation. Many investments benefit from buy AND build over lifecycle Generates Alpha as portfolio companies benefit from DBRG strategic M&A capabilities AND/OR access to capex funding for best projects, ultimately driving higher returns for investors vsBUY BUILD 3x 2x 1x Market Price Replacement Cost Multiple BUILD BUY FOCUSED Superior build economics OPPORTUNISTIC At near or below replacement cost TIME 0
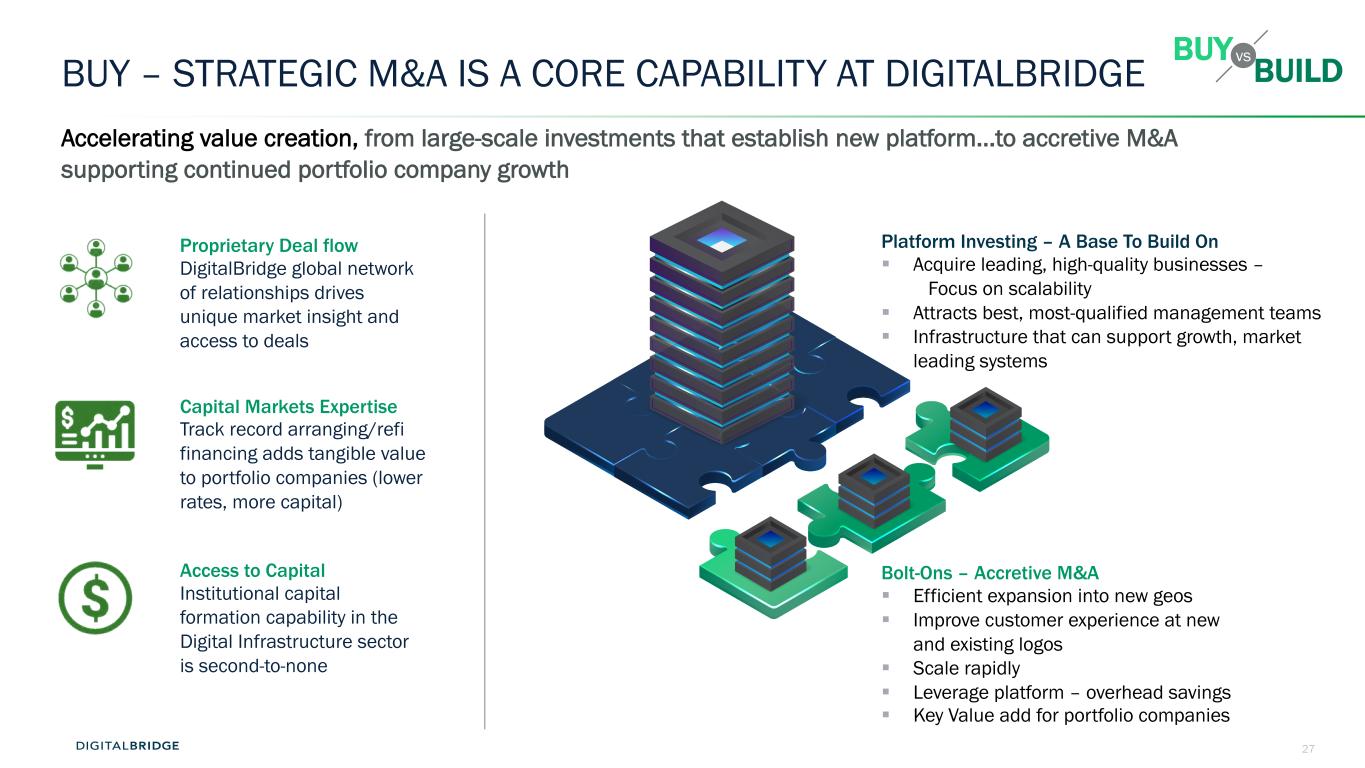
27 BUY – STRATEGIC M&A IS A CORE CAPABILITY AT DIGITALBRIDGE Accelerating value creation, from large-scale investments that establish new platform…to accretive M&A supporting continued portfolio company growth Buy When:- Ability to execute ‘carve outs’ vsBUY BUILD Proprietary Deal flow DigitalBridge global network of relationships drives unique market insight and access to deals Capital Markets Expertise Track record arranging/refi financing adds tangible value to portfolio companies (lower rates, more capital) Access to Capital Institutional capital formation capability in the Digital Infrastructure sector is second-to-none Bolt-Ons – Accretive M&A § Efficient expansion into new geos § Improve customer experience at new and existing logos § Scale rapidly § Leverage platform – overhead savings § Key Value add for portfolio companies Platform Investing – A Base To Build On § Acquire leading, high-quality businesses – Focus on scalability § Attracts best, most-qualified management teams § Infrastructure that can support growth, market leading systems

28 SLC5 Data Center BUILD – THE EXPERTISE TO MAKE OUR VISION A REALITY DigitalBridge companies are always building – delivering for customers cements strong relationships and generates superior returns for investors, especially when markets are elevated Superior Economics Returns from building are generally superior, particularly when markets are elevated We Are Builders DigitalBridge management teams have multi-decade track records managing construction, adding value from the ground up Follow The Logos Great customer relationships drive DBRG build decisions. Where, when, and what to build are all informed by steady feedback vsBUY BUILD 2021 on track to build +360 sites Beanfield builds its own infrastructure V6 Data Center DigitalBridge Builds Across all Subsectors of Digital Infra GloballyNew Site Construction Site Selection Site Acquisition Zoning / Permitting Construction Site Installation (by carrier/Operator) Site Acceptance (by Carrier/Operator) Maintenance Market Analysis
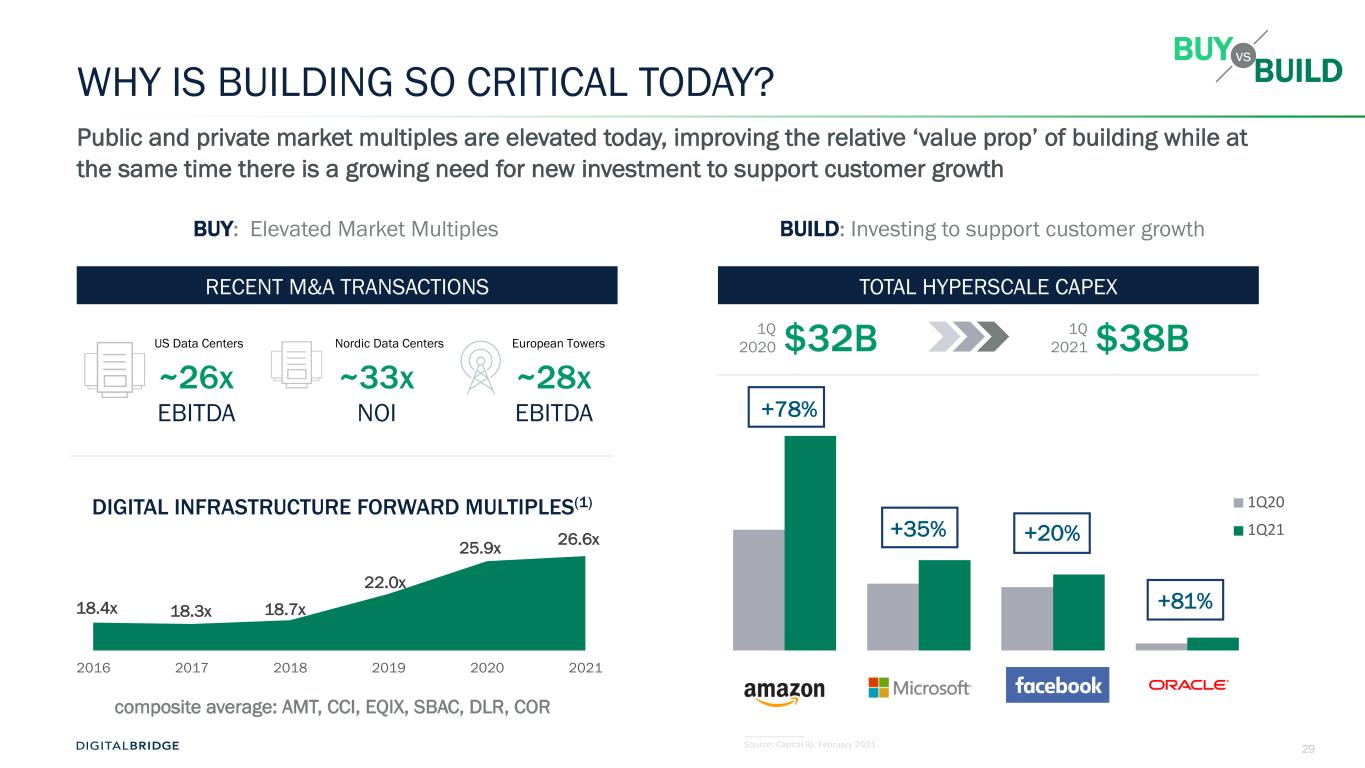
29 1Q20 1Q21 WHY IS BUILDING SO CRITICAL TODAY? Public and private market multiples are elevated today, improving the relative ‘value prop’ of building while at the same time there is a growing need for new investment to support customer growth BUILD: Investing to support customer growthBUY: Elevated Market Multiples RECENT M&A TRANSACTIONS US Data Centers Nordic Data Centers European Towers 18.4x 18.3x 18.7x 22.0x 25.9x 26.6x 2016 2017 2018 2019 2020 2021 +35% +20% +81% +78% _____________ Source: Capital IQ, February 2021 composite average: AMT, CCI, EQIX, SBAC, DLR, COR ~26x EBITDA ~33x NOI ~28x EBITDA DIGITAL INFRASTRUCTURE FORWARD MULTIPLES(1) TOTAL HYPERSCALE CAPEX $32B1Q 2020 $38B1Q 2021 vsBUY BUILD
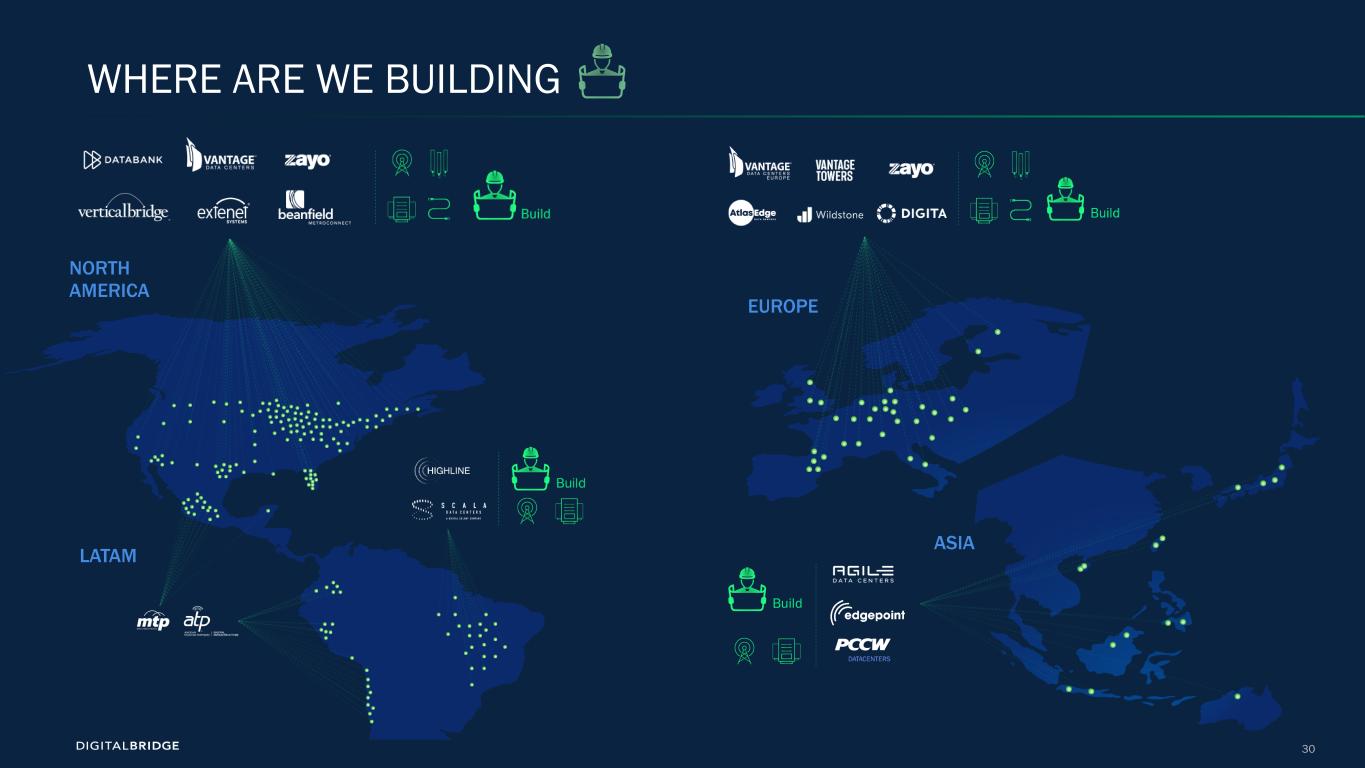
30 WHERE ARE WE BUILDING EUROPE ASIA NORTH AMERICA LATAM
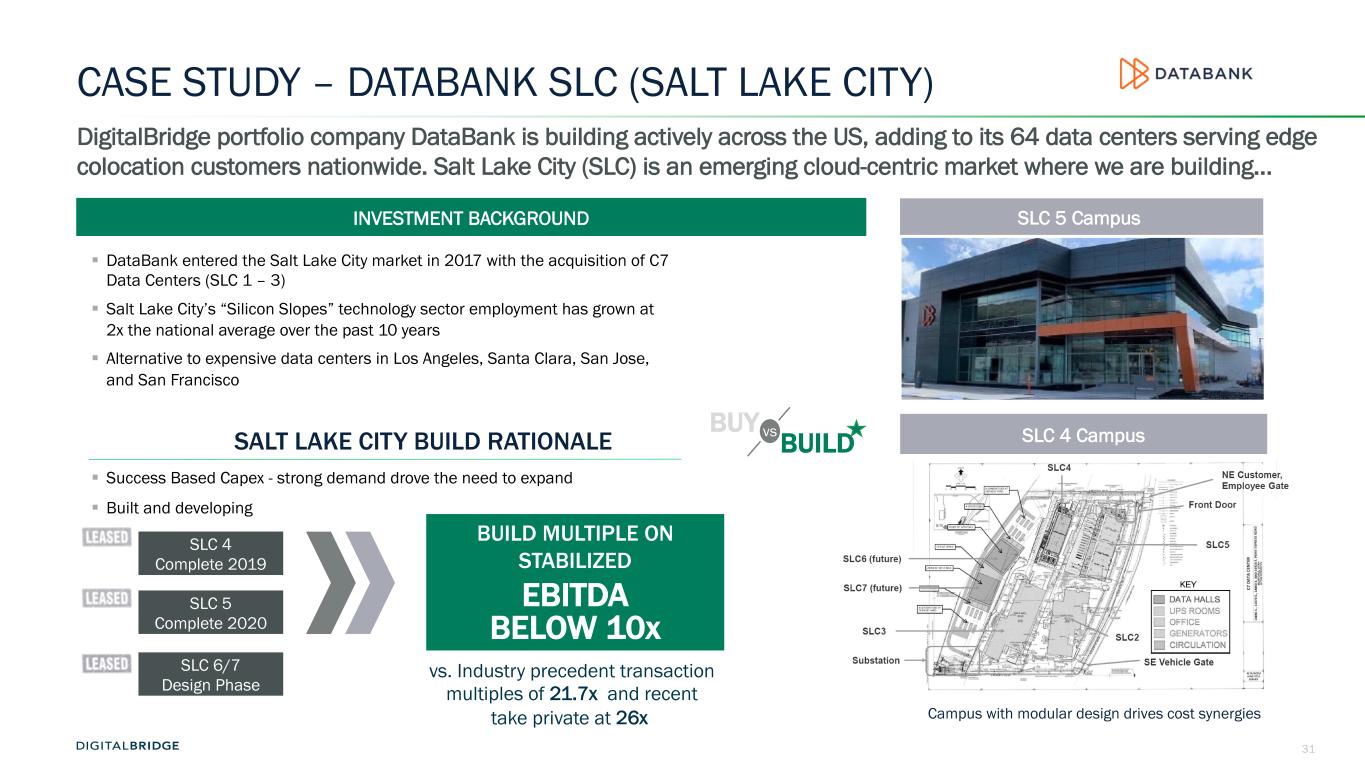
31 INVESTMENT BACKGROUND SLC 5 Campus § DataBank entered the Salt Lake City market in 2017 with the acquisition of C7 Data Centers (SLC 1 – 3) § Salt Lake City’s “Silicon Slopes” technology sector employment has grown at 2x the national average over the past 10 years § Alternative to expensive data centers in Los Angeles, Santa Clara, San Jose, and San Francisco § Success Based Capex - strong demand drove the need to expand § Built and developing DigitalBridge portfolio company DataBank is building actively across the US, adding to its 64 data centers serving edge colocation customers nationwide. Salt Lake City (SLC) is an emerging cloud-centric market where we are building… CASE STUDY – DATABANK SLC (SALT LAKE CITY) BUILD MULTIPLE ON STABILIZED EBITDA BELOW 10x Campus with modular design drives cost synergies SLC 4 Complete 2019 SLC 5 Complete 2020 SLC 6/7 Design Phase vs. Industry precedent transaction multiples of 21.7x and recent take private at 26x SLC 4 CampusSALT LAKE CITY BUILD RATIONALE vsBUY BUILD
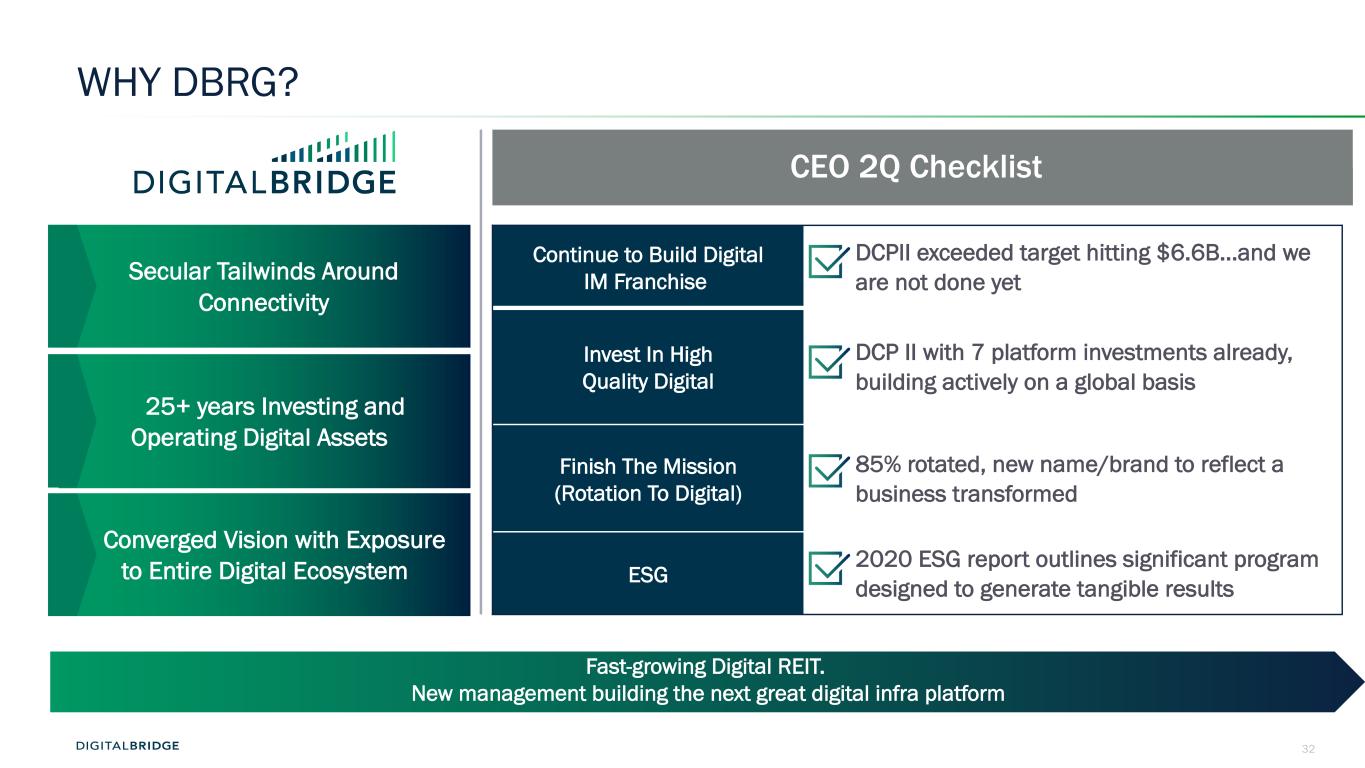
32 WHY DBRG? CEO 2Q Checklist Secular Tailwinds Around Connectivity 25+ years Investing and Operating Digital Assets Converged Vision with Exposure to Entire Digital Ecosystem Continue to Build Digital IM Franchise DCPII exceeded target hitting $6.6B…and we are not done yet Invest In High Quality Digital DCP II with 7 platform investments already, building actively on a global basis Finish The Mission (Rotation To Digital) 85% rotated, new name/brand to reflect a business transformed ESG 2020 ESG report outlines significant program designed to generate tangible results Fast-growing Digital REIT. New management building the next great digital infra platform

33 5 Q&A SESSION
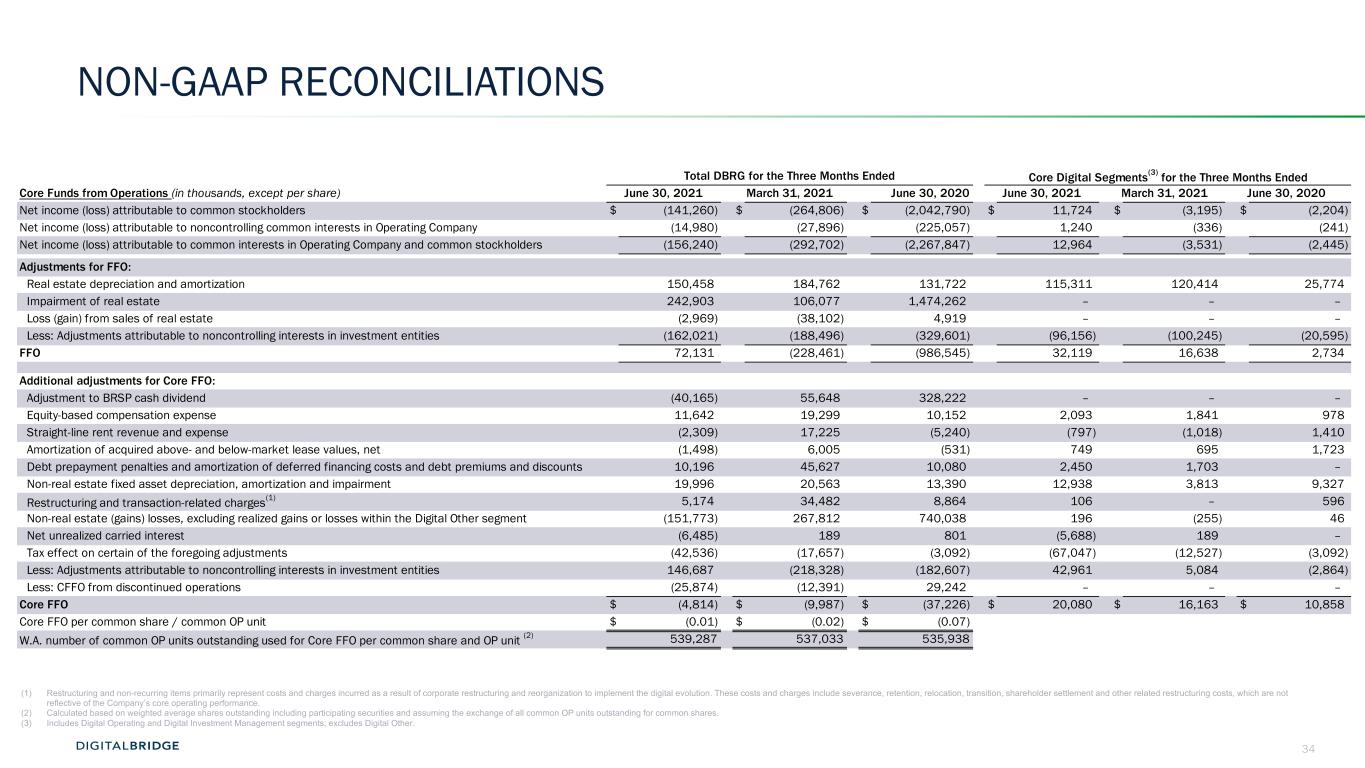
34 NON-GAAP RECONCILIATIONS Total DBRG for the Three Months Ended Core Digital Segments(3) for the Three Months Ended Core Funds from Operations (in thousands, except per share) June 30, 2021 March 31, 2021 June 30, 2020 June 30, 2021 March 31, 2021 June 30, 2020 Net income (loss) attributable to common stockholders $ (141,260) $ (264,806) $ (2,042,790) $ 11,724 $ (3,195) $ (2,204) Net income (loss) attributable to noncontrolling common interests in Operating Company (14,980) (27,896) (225,057) 1,240 (336) (241) Net income (loss) attributable to common interests in Operating Company and common stockholders (156,240) (292,702) (2,267,847) 12,964 (3,531) (2,445) Adjustments for FFO: Real estate depreciation and amortization 150,458 184,762 131,722 115,311 120,414 25,774 Impairment of real estate 242,903 106,077 1,474,262 – – – Loss (gain) from sales of real estate (2,969) (38,102) 4,919 – – – Less: Adjustments attributable to noncontrolling interests in investment entities (162,021) (188,496) (329,601) (96,156) (100,245) (20,595) FFO 72,131 (228,461) (986,545) 32,119 16,638 2,734 Additional adjustments for Core FFO: Adjustment to BRSP cash dividend (40,165) 55,648 328,222 – – – Equity-based compensation expense 11,642 19,299 10,152 2,093 1,841 978 Straight-line rent revenue and expense (2,309) 17,225 (5,240) (797) (1,018) 1,410 Amortization of acquired above- and below-market lease values, net (1,498) 6,005 (531) 749 695 1,723 Debt prepayment penalties and amortization of deferred financing costs and debt premiums and discounts 10,196 45,627 10,080 2,450 1,703 – Non-real estate fixed asset depreciation, amortization and impairment 19,996 20,563 13,390 12,938 3,813 9,327 Restructuring and transaction-related charges(1) 5,174 34,482 8,864 106 – 596 Non-real estate (gains) losses, excluding realized gains or losses within the Digital Other segment (151,773) 267,812 740,038 196 (255) 46 Net unrealized carried interest (6,485) 189 801 (5,688) 189 – Tax effect on certain of the foregoing adjustments (42,536) (17,657) (3,092) (67,047) (12,527) (3,092) Less: Adjustments attributable to noncontrolling interests in investment entities 146,687 (218,328) (182,607) 42,961 5,084 (2,864) Less: CFFO from discontinued operations (25,874) (12,391) 29,242 – – – Core FFO $ (4,814) $ (9,987) $ (37,226) $ 20,080 $ 16,163 $ 10,858 Core FFO per common share / common OP unit $ (0.01) $ (0.02) $ (0.07) W.A. number of common OP units outstanding used for Core FFO per common share and OP unit (2) 539,287 537,033 535,938 (1) Restructuring and non-recurring items primarily represent costs and charges incurred as a result of corporate restructuring and reorganization to implement the digital evolution. These costs and charges include severance, retention, relocation, transition, shareholder settlement and other related restructuring costs, which are not reflective of the Company’s core operating performance. (2) Calculated based on weighted average shares outstanding including participating securities and assuming the exchange of all common OP units outstanding for common shares. (3) Includes Digital Operating and Digital Investment Management segments; excludes Digital Other.
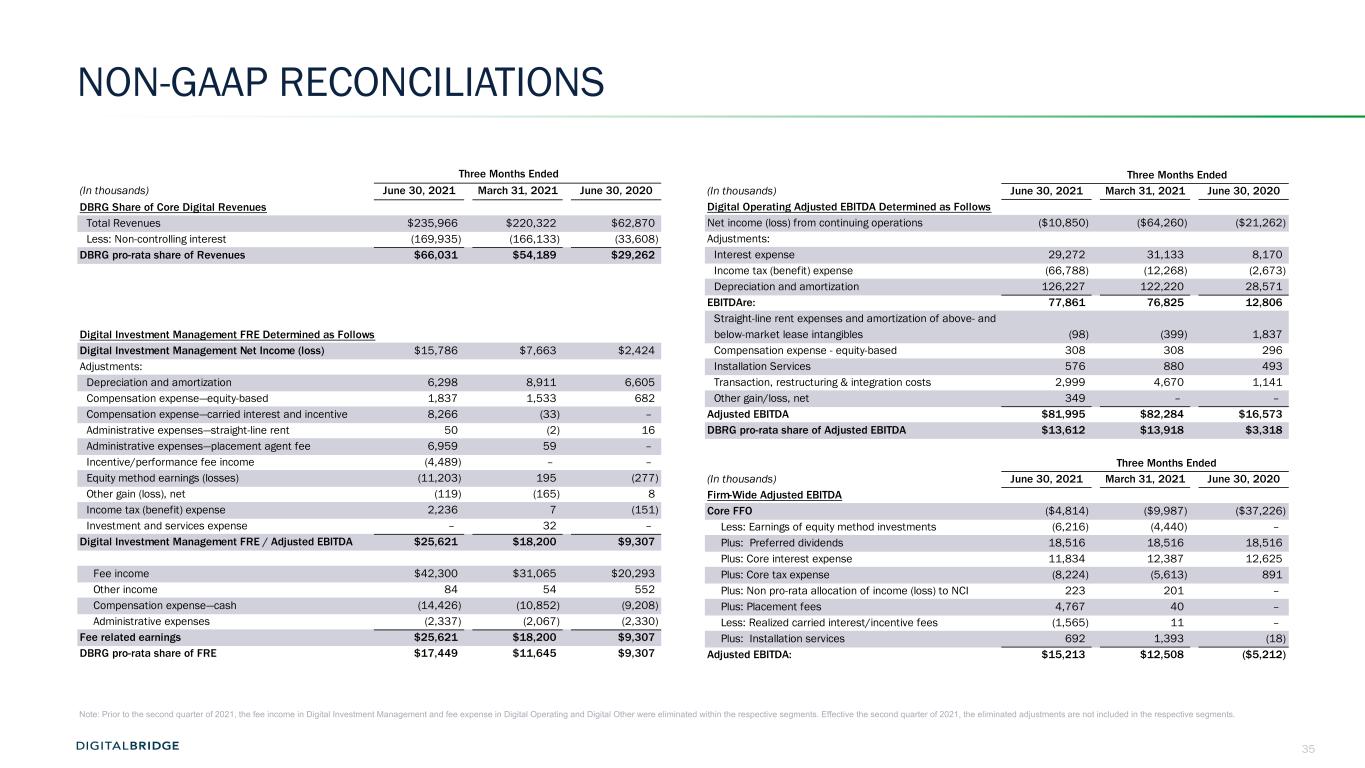
35 NON-GAAP RECONCILIATIONS Three Months Ended (In thousands) June 30, 2021 March 31, 2021 June 30, 2020 DBRG Share of Core Digital Revenues Total Revenues $235,966 $220,322 $62,870 Less: Non-controlling interest (169,935) (166,133) (33,608) DBRG pro-rata share of Revenues $66,031 $54,189 $29,262 Digital Investment Management FRE Determined as Follows Digital Investment Management Net Income (loss) $15,786 $7,663 $2,424 Adjustments: Depreciation and amortization 6,298 8,911 6,605 Compensation expense—equity-based 1,837 1,533 682 Compensation expense—carried interest and incentive 8,266 (33) – Administrative expenses—straight-line rent 50 (2) 16 Administrative expenses—placement agent fee 6,959 59 – Incentive/performance fee income (4,489) – – Equity method earnings (losses) (11,203) 195 (277) Other gain (loss), net (119) (165) 8 Income tax (benefit) expense 2,236 7 (151) Investment and services expense – 32 – Digital Investment Management FRE / Adjusted EBITDA $25,621 $18,200 $9,307 Fee income $42,300 $31,065 $20,293 Other income 84 54 552 Compensation expense—cash (14,426) (10,852) (9,208) Administrative expenses (2,337) (2,067) (2,330) Fee related earnings $25,621 $18,200 $9,307 DBRG pro-rata share of FRE $17,449 $11,645 $9,307 Three Months Ended (In thousands) June 30, 2021 March 31, 2021 June 30, 2020 Digital Operating Adjusted EBITDA Determined as Follows Net income (loss) from continuing operations ($10,850) ($64,260) ($21,262) Adjustments: Interest expense 29,272 31,133 8,170 Income tax (benefit) expense (66,788) (12,268) (2,673) Depreciation and amortization 126,227 122,220 28,571 EBITDAre: 77,861 76,825 12,806 Straight-line rent expenses and amortization of above- and below-market lease intangibles (98) (399) 1,837 Compensation expense - equity-based 308 308 296 Installation Services 576 880 493 Transaction, restructuring & integration costs 2,999 4,670 1,141 Other gain/loss, net 349 – – Adjusted EBITDA $81,995 $82,284 $16,573 DBRG pro-rata share of Adjusted EBITDA $13,612 $13,918 $3,318 Three Months Ended Three Months Ende (In thousands) June 30, 2021 March 31, 2021 June 30, 2020 Firm-Wide Adjusted EBITDA Core FFO ($4,814) ($9,987) ($37,226) Less: Earnings of equity method investments (6,216) (4,440) – Plus: Preferred dividends 18,516 18,516 18,516 Plus: Core interest expense 11,834 12,387 12,625 Plus: Core tax expense (8,224) (5,613) 891 Plus: Non pro-rata allocation of income (loss) to NCI 223 201 – Plus: Placement fees 4,767 40 – Less: Realized carried interest/incentive fees (1,565) 11 – Plus: Installation services 692 1,393 (18) Adjusted EBITDA: $15,213 $12,508 ($5,212) Note: Prior to the second quarter of 2021, the fee income in Digital Investment Management and fee expense in Digital Operating and Digital Other were eliminated within the respective segments. Effective the second quarter of 2021, the eliminated adjustments are not included in the respective segments.
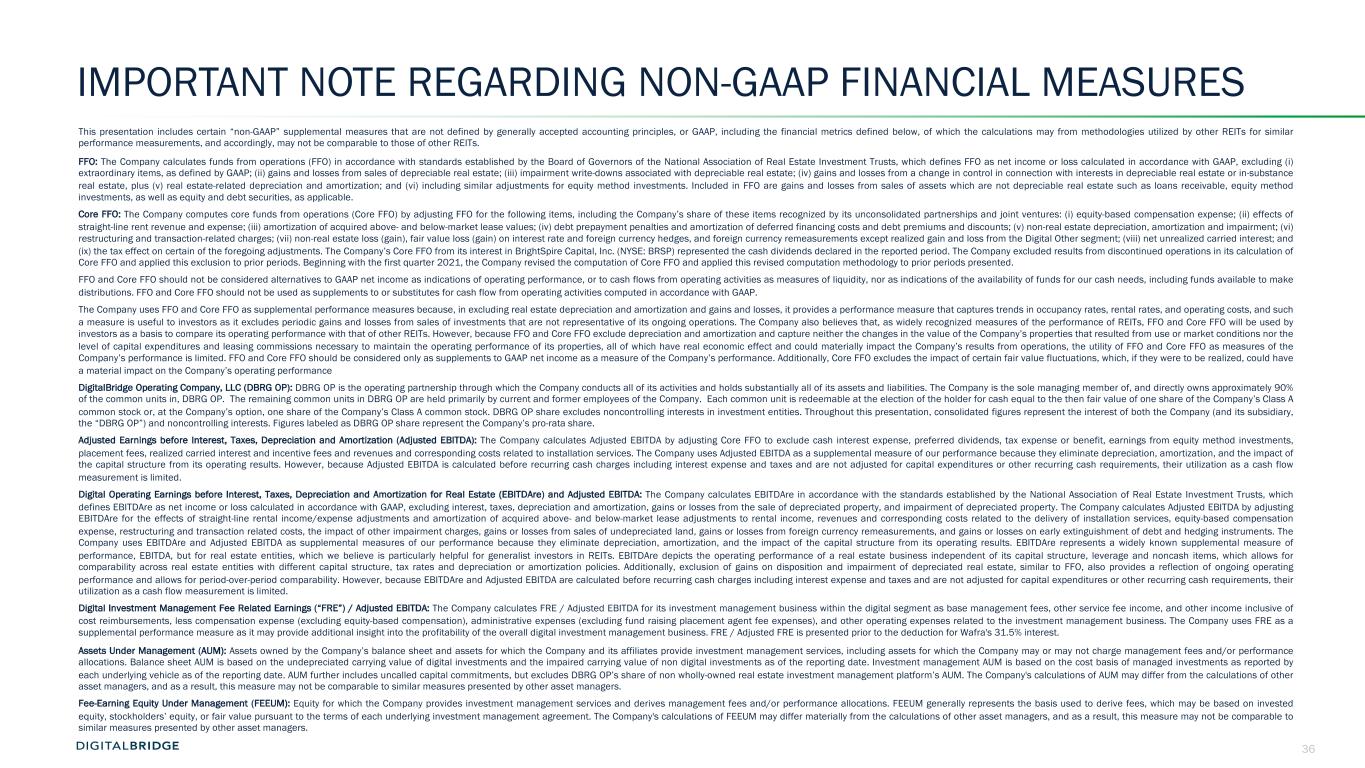
36 IMPORTANT NOTE REGARDING NON-GAAP FINANCIAL MEASURES This presentation includes certain “non-GAAP” supplemental measures that are not defined by generally accepted accounting principles, or GAAP, including the financial metrics defined below, of which the calculations may from methodologies utilized by other REITs for similar performance measurements, and accordingly, may not be comparable to those of other REITs. FFO: The Company calculates funds from operations (FFO) in accordance with standards established by the Board of Governors of the National Association of Real Estate Investment Trusts, which defines FFO as net income or loss calculated in accordance with GAAP, excluding (i) extraordinary items, as defined by GAAP; (ii) gains and losses from sales of depreciable real estate; (iii) impairment write-downs associated with depreciable real estate; (iv) gains and losses from a change in control in connection with interests in depreciable real estate or in-substance real estate, plus (v) real estate-related depreciation and amortization; and (vi) including similar adjustments for equity method investments. Included in FFO are gains and losses from sales of assets which are not depreciable real estate such as loans receivable, equity method investments, as well as equity and debt securities, as applicable. Core FFO: The Company computes core funds from operations (Core FFO) by adjusting FFO for the following items, including the Company’s share of these items recognized by its unconsolidated partnerships and joint ventures: (i) equity-based compensation expense; (ii) effects of straight-line rent revenue and expense; (iii) amortization of acquired above- and below-market lease values; (iv) debt prepayment penalties and amortization of deferred financing costs and debt premiums and discounts; (v) non-real estate depreciation, amortization and impairment; (vi) restructuring and transaction-related charges; (vii) non-real estate loss (gain), fair value loss (gain) on interest rate and foreign currency hedges, and foreign currency remeasurements except realized gain and loss from the Digital Other segment; (viii) net unrealized carried interest; and (ix) the tax effect on certain of the foregoing adjustments. The Company’s Core FFO from its interest in BrightSpire Capital, Inc. (NYSE: BRSP) represented the cash dividends declared in the reported period. The Company excluded results from discontinued operations in its calculation of Core FFO and applied this exclusion to prior periods. Beginning with the first quarter 2021, the Company revised the computation of Core FFO and applied this revised computation methodology to prior periods presented. FFO and Core FFO should not be considered alternatives to GAAP net income as indications of operating performance, or to cash flows from operating activities as measures of liquidity, nor as indications of the availability of funds for our cash needs, including funds available to make distributions. FFO and Core FFO should not be used as supplements to or substitutes for cash flow from operating activities computed in accordance with GAAP. The Company uses FFO and Core FFO as supplemental performance measures because, in excluding real estate depreciation and amortization and gains and losses, it provides a performance measure that captures trends in occupancy rates, rental rates, and operating costs, and such a measure is useful to investors as it excludes periodic gains and losses from sales of investments that are not representative of its ongoing operations. The Company also believes that, as widely recognized measures of the performance of REITs, FFO and Core FFO will be used by investors as a basis to compare its operating performance with that of other REITs. However, because FFO and Core FFO exclude depreciation and amortization and capture neither the changes in the value of the Company’s properties that resulted from use or market conditions nor the level of capital expenditures and leasing commissions necessary to maintain the operating performance of its properties, all of which have real economic effect and could materially impact the Company’s results from operations, the utility of FFO and Core FFO as measures of the Company’s performance is limited. FFO and Core FFO should be considered only as supplements to GAAP net income as a measure of the Company’s performance. Additionally, Core FFO excludes the impact of certain fair value fluctuations, which, if they were to be realized, could have a material impact on the Company’s operating performance DigitalBridge Operating Company, LLC (DBRG OP): DBRG OP is the operating partnership through which the Company conducts all of its activities and holds substantially all of its assets and liabilities. The Company is the sole managing member of, and directly owns approximately 90% of the common units in, DBRG OP. The remaining common units in DBRG OP are held primarily by current and former employees of the Company. Each common unit is redeemable at the election of the holder for cash equal to the then fair value of one share of the Company’s Class A common stock or, at the Company’s option, one share of the Company’s Class A common stock. DBRG OP share excludes noncontrolling interests in investment entities. Throughout this presentation, consolidated figures represent the interest of both the Company (and its subsidiary, the “DBRG OP”) and noncontrolling interests. Figures labeled as DBRG OP share represent the Company’s pro-rata share. Adjusted Earnings before Interest, Taxes, Depreciation and Amortization (Adjusted EBITDA): The Company calculates Adjusted EBITDA by adjusting Core FFO to exclude cash interest expense, preferred dividends, tax expense or benefit, earnings from equity method investments, placement fees, realized carried interest and incentive fees and revenues and corresponding costs related to installation services. The Company uses Adjusted EBITDA as a supplemental measure of our performance because they eliminate depreciation, amortization, and the impact of the capital structure from its operating results. However, because Adjusted EBITDA is calculated before recurring cash charges including interest expense and taxes and are not adjusted for capital expenditures or other recurring cash requirements, their utilization as a cash flow measurement is limited. Digital Operating Earnings before Interest, Taxes, Depreciation and Amortization for Real Estate (EBITDAre) and Adjusted EBITDA: The Company calculates EBITDAre in accordance with the standards established by the National Association of Real Estate Investment Trusts, which defines EBITDAre as net income or loss calculated in accordance with GAAP, excluding interest, taxes, depreciation and amortization, gains or losses from the sale of depreciated property, and impairment of depreciated property. The Company calculates Adjusted EBITDA by adjusting EBITDAre for the effects of straight-line rental income/expense adjustments and amortization of acquired above- and below-market lease adjustments to rental income, revenues and corresponding costs related to the delivery of installation services, equity-based compensation expense, restructuring and transaction related costs, the impact of other impairment charges, gains or losses from sales of undepreciated land, gains or losses from foreign currency remeasurements, and gains or losses on early extinguishment of debt and hedging instruments. The Company uses EBITDAre and Adjusted EBITDA as supplemental measures of our performance because they eliminate depreciation, amortization, and the impact of the capital structure from its operating results. EBITDAre represents a widely known supplemental measure of performance, EBITDA, but for real estate entities, which we believe is particularly helpful for generalist investors in REITs. EBITDAre depicts the operating performance of a real estate business independent of its capital structure, leverage and noncash items, which allows for comparability across real estate entities with different capital structure, tax rates and depreciation or amortization policies. Additionally, exclusion of gains on disposition and impairment of depreciated real estate, similar to FFO, also provides a reflection of ongoing operating performance and allows for period-over-period comparability. However, because EBITDAre and Adjusted EBITDA are calculated before recurring cash charges including interest expense and taxes and are not adjusted for capital expenditures or other recurring cash requirements, their utilization as a cash flow measurement is limited. Digital Investment Management Fee Related Earnings (“FRE”) / Adjusted EBITDA: The Company calculates FRE / Adjusted EBITDA for its investment management business within the digital segment as base management fees, other service fee income, and other income inclusive of cost reimbursements, less compensation expense (excluding equity-based compensation), administrative expenses (excluding fund raising placement agent fee expenses), and other operating expenses related to the investment management business. The Company uses FRE as a supplemental performance measure as it may provide additional insight into the profitability of the overall digital investment management business. FRE / Adjusted FRE is presented prior to the deduction for Wafra's 31.5% interest. Assets Under Management (AUM): Assets owned by the Company’s balance sheet and assets for which the Company and its affiliates provide investment management services, including assets for which the Company may or may not charge management fees and/or performance allocations. Balance sheet AUM is based on the undepreciated carrying value of digital investments and the impaired carrying value of non digital investments as of the reporting date. Investment management AUM is based on the cost basis of managed investments as reported by each underlying vehicle as of the reporting date. AUM further includes uncalled capital commitments, but excludes DBRG OP’s share of non wholly-owned real estate investment management platform’s AUM. The Company's calculations of AUM may differ from the calculations of other asset managers, and as a result, this measure may not be comparable to similar measures presented by other asset managers. Fee-Earning Equity Under Management (FEEUM): Equity for which the Company provides investment management services and derives management fees and/or performance allocations. FEEUM generally represents the basis used to derive fees, which may be based on invested equity, stockholders’ equity, or fair value pursuant to the terms of each underlying investment management agreement. The Company's calculations of FEEUM may differ materially from the calculations of other asset managers, and as a result, this measure may not be comparable to similar measures presented by other asset managers.

37


