
1 EARNINGS PRESENTATION 3Q 2022 N o v e m b e r 4 , 2 0 2 2
2 This presentation may contain forward-looking statements within the meaning of the federal securities laws, including statements relating to (i) our strategy, outlook and growth prospects; (ii) our operational and financial targets and (iii) general economic trends and trends in our industry and markets. Forward-looking statements relate to expectations, beliefs, projections, future plans and strategies, anticipated events or trends and similar expressions concerning matters that are not historical facts. In some cases, you can identify forward-looking statements by the use of forward-looking terminology such as “may,” “will,” “should,” “expects,” “intends,” “plans,” “anticipates,” “believes,” “estimates,” “predicts,” or “potential” or the negative of these words and phrases or similar words or phrases which are predictions of or indicate future events or trends and which do not relate solely to historical matters. You can also identify forward-looking statements by discussions of strategy, plans or intentions. Forward-looking statements involve known and unknown risks, uncertainties, assumptions and contingencies, many of which are beyond the Company’s control, and may cause the Company’s actual results to differ significantly from those expressed in any forward-looking statement. Factors that might cause such a difference include, without limitation, the duration and severity of the current novel coronavirus (COVID-19) pandemic, driven by, among other factors, the treatment developments and public adoption rates and effectiveness of COVID-19 vaccines against emerging variants of COVID-19; the impact of the COVID-19 pandemic on the global market, economic and environmental conditions generally and in the digital and communications technology and investment management sectors; the effect of COVID-19 on the Company's operating cash flows, debt service obligations and covenants, liquidity position and valuations of its real estate investments, as well as the increased risk of claims, litigation and regulatory proceedings and uncertainty that may adversely affect the Company; our status as an owner, operator and investment manager of digital infrastructure and real estate and our ability to manage any related conflicts of interest; our ability to obtain and maintain financing arrangements, including securitizations, on favorable or comparable terms or at all; the impact of initiatives related to our digital transformation, including the strategic investment by Wafra and the formation of certain other investment management platforms, on our growth and earnings profile; whether the transaction with AMP Capital will be completed within the time frame and on the terms anticipated or at all, and whether we will realize any of the anticipated benefits from the transaction; our ability to continue to achieve the same levels of AUM growth we have achieved over the last 3 years; the ability of our future returns on investment to match our recent returns on investment; our ability to achieve our projected FFEUM growth at all or on the timing anticipated; whether we will realize any of the anticipated benefits of our strategic partnership with Wafra, including whether Wafra will make additional investments in our IM and Operating segments; our ability to integrate and maintain consistent standards and controls, including our ability to manage our acquisitions in the digital industry effectively; the impact to our business operations and financial condition of realized or anticipated compensation and administrative savings through cost reduction programs; our business and investment strategy, including the ability of the businesses in which we have a significant investment (such as BRSP) to execute their business strategies; BRSP's trading price and its impact on the carrying value of the Company's investment in BRSP, including whether the Company will recognize further other-than-temporary impairment on its investment in BRSP; performance of our investments relative to our expectations and the impact on our actual return on invested equity, as well as the cash provided by these investments and available for distribution; our ability to raise new investment funds and vehicles and transfer warehoused investments; our ability to grow our business by raising capital for the companies that we manage; our ability to deploy capital into new investments consistent with our digital business strategies, including the earnings profile of such new investments; the availability of, and competition for, attractive investment opportunities; our ability to achieve any of the anticipated benefits of certain joint ventures, including any ability for such ventures to create and/or distribute new investment products; our ability to satisfy and manage our capital requirements; our expected hold period for our assets and the impact of any changes in our expectations on the carrying value of such assets; the general volatility of the securities markets in which we participate; our ability to achieve anticipated MOIC and balance sheet proceeds from the DataBank transaction; changes in interest rates and the market value of our assets; interest rate mismatches between our assets and any borrowings used to fund such assets; effects of hedging instruments on our assets; the expected warehouse fees for holding such assets; the impact of economic conditions on third parties on which we rely; any litigation and contractual claims against us and our affiliates, including potential settlement and litigation of such claims; our levels of leverage; adverse domestic or international macroeconomic factors, including those resulting from the COVID-19 pandemic, supply chain difficulties, inflation, a potential economic slowdown or recession; the impact of legislative, regulatory and competitive changes; the impact of our transition from a REIT to a C-corporation for tax purposes, and the related liability for corporate and other taxes; whether we will be able to utilize existing tax attributes to offset taxable income to the extent contemplated; our ability to maintain our exemption from registration as an investment company under the Investment Company Act of 1940, as amended (the “1940 Act”); changes in our board of directors or management team, and availability of qualified personnel; our ability to make or maintain distributions to our stockholders; and our understanding of our competition; and other risks and uncertainties, including those detailed in the Company’s Annual Report on Form 10-K for the fiscal year ended December 31, 2021 and Quarterly Reports on Form 10-Q for the fiscal quarters ended March 31, 2022 and June 30, 2022, each under the heading “Risk Factors,” as such factors may be updated from time to time in the Company’s subsequent periodic filings with the U.S. Securities and Exchange Commission (“SEC”). All forward-looking statements reflect the Company’s good faith beliefs, assumptions and expectations, but they are not guarantees of future performance. Additional information about these and other factors can be found in the Company’s reports filed from time to time with the SEC. The Company cautions investors not to unduly rely on any forward-looking statements. The forward-looking statements speak only as of the date of this presentation. The Company is under no duty to update any of these forward-looking statements after the date of this presentation, nor to conform prior statements to actual results or revised expectations, and the Company does not intend to do so. This presentation is for informational purposes only and does not constitute an offer to sell or a solicitation of an offer to buy any securities of the Company. This information is not intended to be indicative of future results. Actual performance of the Company may vary materially. The appendices herein contain important information that is material to an understanding of this presentation and you should read this presentation only with and in context of the appendices. CAUTIONARY STATEMENT REGARDING FORWARD-LOOKING STATEMENTS
3 AGENDA 1 2 3BUSINESS UPDATE FINANCIAL RESULTS EXECUTING THE DIGITAL PLAYBOOK

4 1 BUSINESS UPDATE
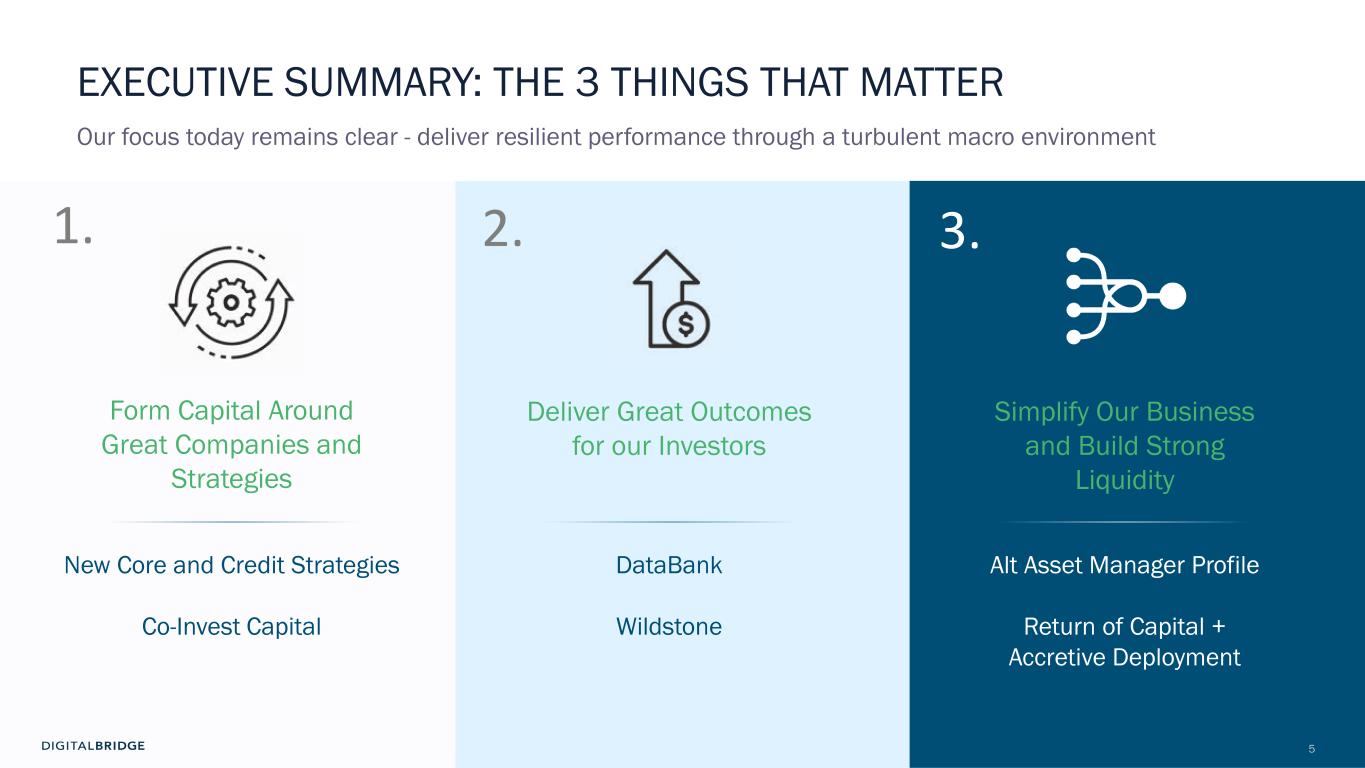
5 EXECUTIVE SUMMARY: THE 3 THINGS THAT MATTER Our focus today remains clear - deliver resilient performance through a turbulent macro environment Form Capital Around Great Companies and Strategies Deliver Great Outcomes for our Investors Simplify Our Business and Build Strong Liquidity New Core and Credit Strategies Co-Invest Capital DataBank Wildstone Alt Asset Manager Profile Return of Capital + Accretive Deployment 1. 2. 3.
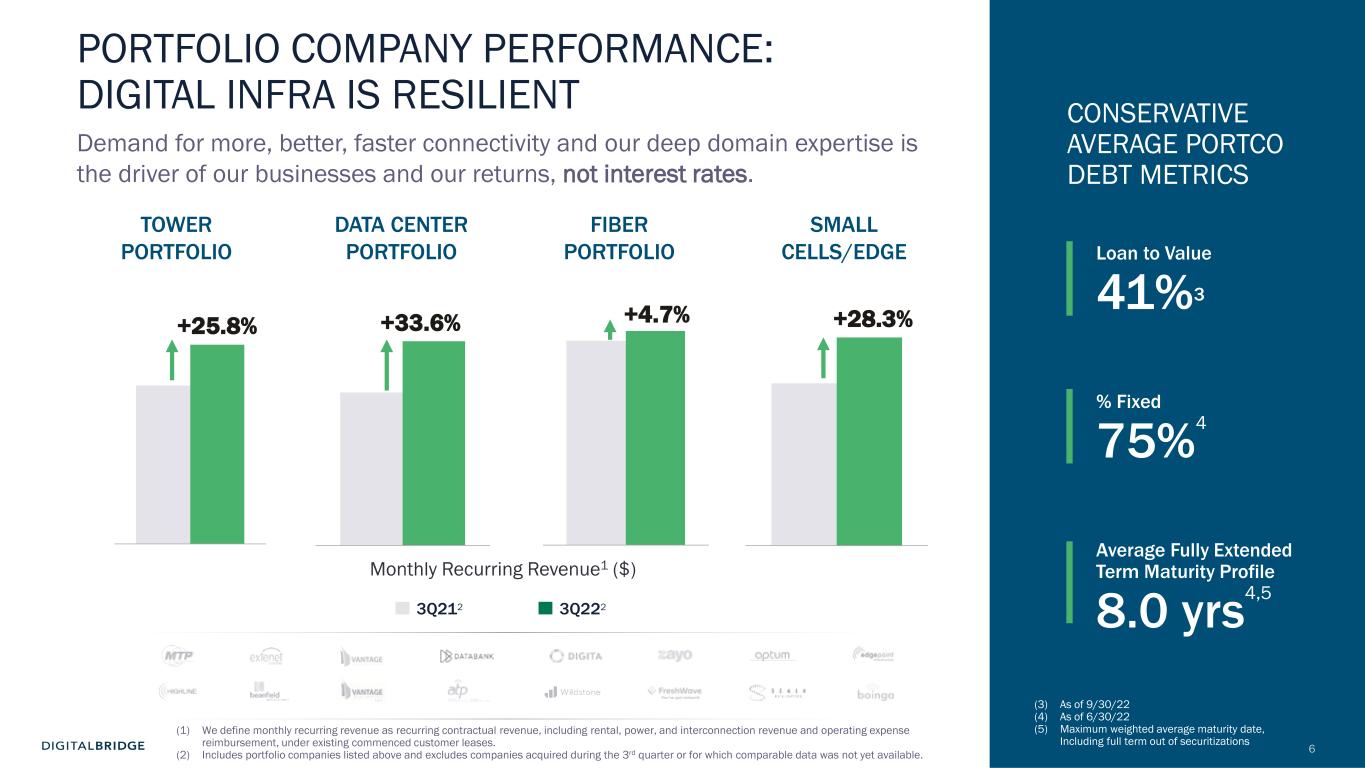
6 PORTFOLIO COMPANY PERFORMANCE: DIGITAL INFRA IS RESILIENT Demand for more, better, faster connectivity and our deep domain expertise is the driver of our businesses and our returns, not interest rates. (1) We define monthly recurring revenue as recurring contractual revenue, including rental, power, and interconnection revenue and operating expense reimbursement, under existing commenced customer leases. (2) Includes portfolio companies listed above and excludes companies acquired during the 3rd quarter or for which comparable data was not yet available. 3Q2223Q212 +25.8% - 10,000,000 20,000,000 30,000,000 40,000,000 50,000,000 60,000,000 Total Portfolio CONSERVATIVE AVERAGE PORTCO DEBT METRICS Loan to Value 41%3 % Fixed 75%4 Average Fully Extended Term Maturity Profile 8.0 yrs4,5 TOWER PORTFOLIO +33.6% - 20 40 60 80 100 120 140 Total Portfolio +4.7% Total Portfolio +28.3% - 5 10 15 20 25 30 Total Portfolio DATA CENTER PORTFOLIO SMALL CELLS/EDGE FIBER PORTFOLIO Monthly Recurring Revenue1 ($) (3) As of 9/30/22 (4) As of 6/30/22 (5) Maximum weighted average maturity date, Including full term out of securitizations
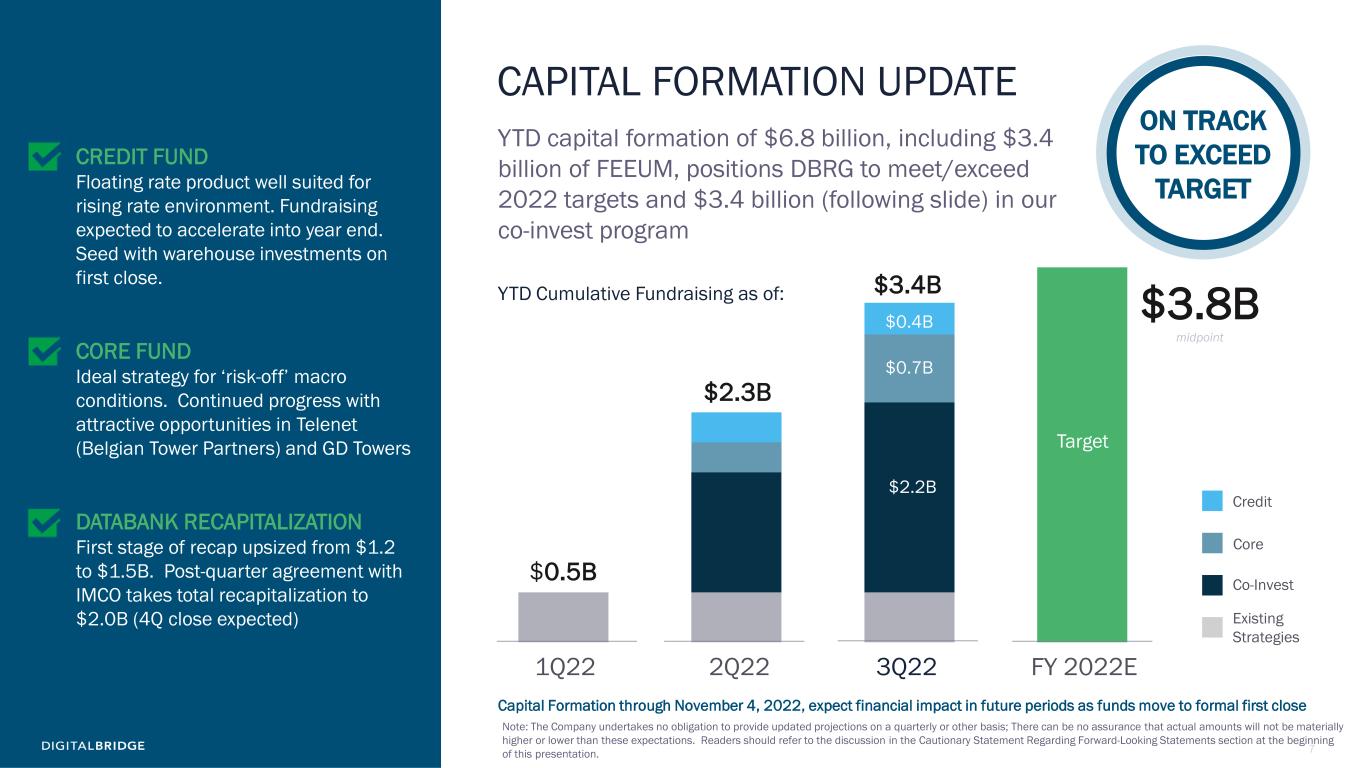
7 CAPITAL FORMATION UPDATE YTD capital formation of $6.8 billion, including $3.4 billion of FEEUM, positions DBRG to meet/exceed 2022 targets and $3.4 billion (following slide) in our co-invest program CREDIT FUND Floating rate product well suited for rising rate environment. Fundraising expected to accelerate into year end. Seed with warehouse investments on first close. CORE FUND Ideal strategy for ‘risk-off’ macro conditions. Continued progress with attractive opportunities in Telenet (Belgian Tower Partners) and GD Towers DATABANK RECAPITALIZATION First stage of recap upsized from $1.2 to $1.5B. Post-quarter agreement with IMCO takes total recapitalization to $2.0B (4Q close expected) $0.7B $2.2B Credit Core Co-Invest 1Q22 FY 2022E $3.8B midpoint ON TRACK TO EXCEED TARGET 2Q22 Existing Strategies $0.5B $2.3B $0.4B Note: The Company undertakes no obligation to provide updated projections on a quarterly or other basis; There can be no assurance that actual amounts will not be materially higher or lower than these expectations. Readers should refer to the discussion in the Cautionary Statement Regarding Forward-Looking Statements section at the beginning of this presentation. 3Q22 $3.4B Capital Formation through November 4, 2022, expect financial impact in future periods as funds move to formal first close Target YTD Cumulative Fundraising as of:
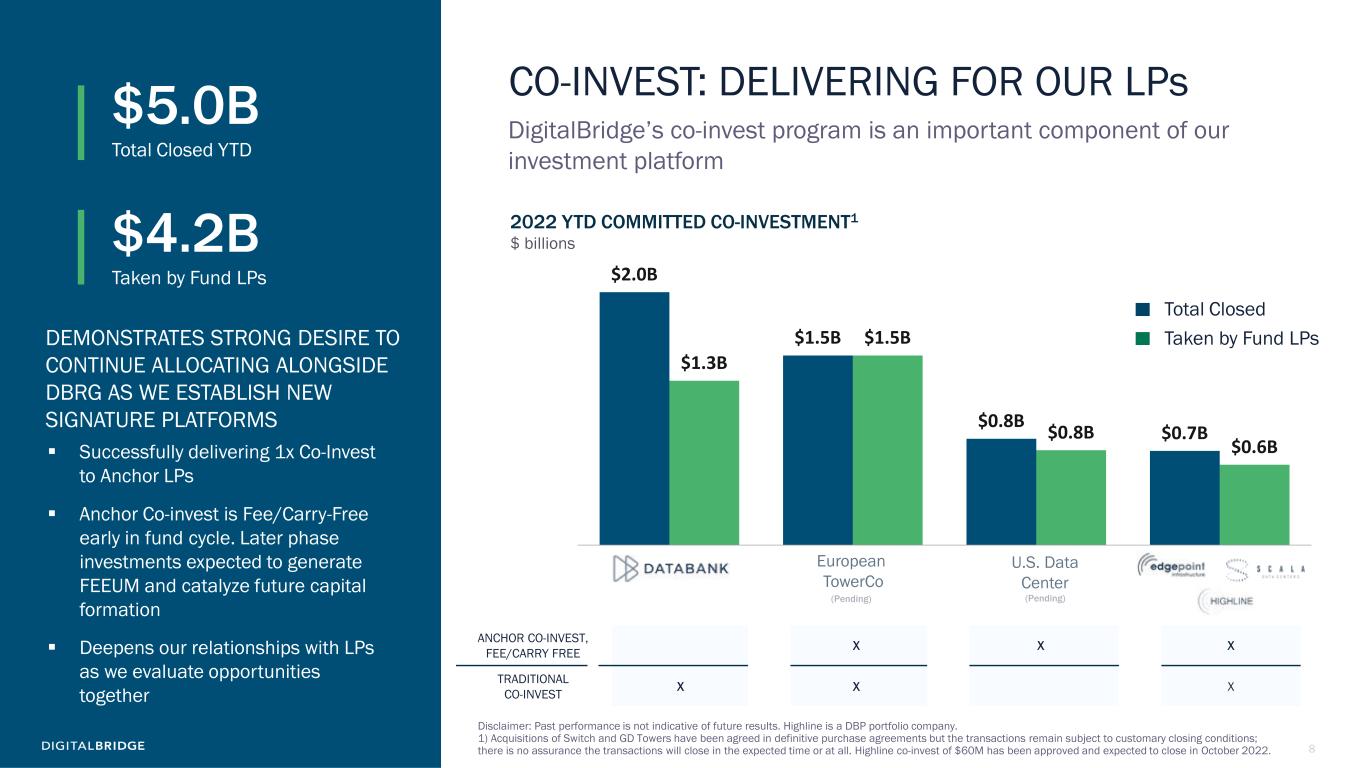
8 CO-INVEST: DELIVERING FOR OUR LPs DigitalBridge’s co-invest program is an important component of our investment platform $2.0B $1.5B $0.8B $0.7B $1.3B $1.5B $0.8B $0.6B DataBank GD Towers Switch EdgePoint Taken by Fund LPs Total Closed Disclaimer: Past performance is not indicative of future results. Highline is a DBP portfolio company. 1) Acquisitions of Switch and GD Towers have been agreed in definitive purchase agreements but the transactions remain subject to customary closing conditions; there is no assurance the transactions will close in the expected time or at all. Highline co-invest of $60M has been approved and expected to close in October 2022. 2022 YTD COMMITTED CO-INVESTMENT1 $ billions$4.2B Taken by Fund LPs $5.0B Total Closed YTD Successfully delivering 1x Co-Invest to Anchor LPs Anchor Co-invest is Fee/Carry-Free early in fund cycle. Later phase investments expected to generate FEEUM and catalyze future capital formation Deepens our relationships with LPs as we evaluate opportunities together DEMONSTRATES STRONG DESIRE TO CONTINUE ALLOCATING ALONGSIDE DBRG AS WE ESTABLISH NEW SIGNATURE PLATFORMS ANCHOR CO-INVEST, FEE/CARRY FREE X X X TRADITIONAL CO-INVEST X X X (Pending)(Pending) European TowerCo U.S. Data Center
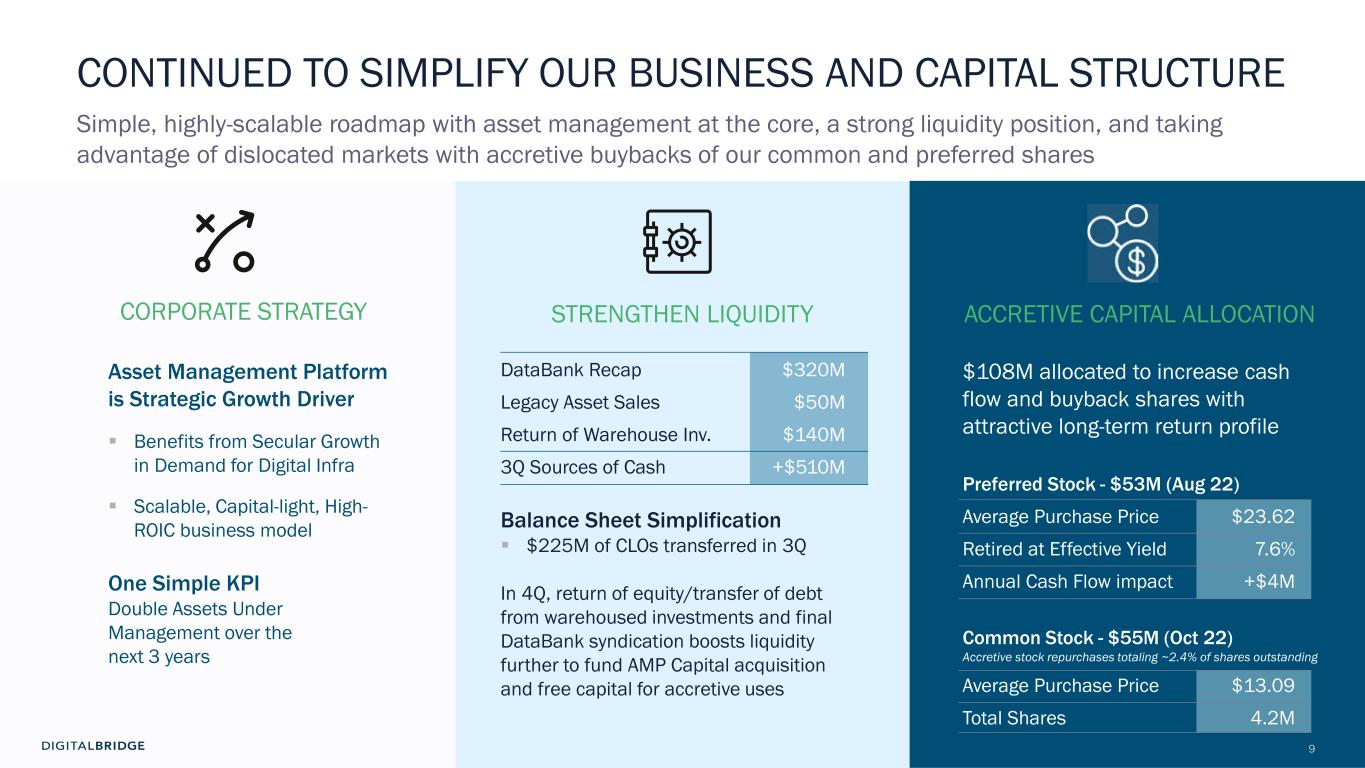
9 CONTINUED TO SIMPLIFY OUR BUSINESS AND CAPITAL STRUCTURE Simple, highly-scalable roadmap with asset management at the core, a strong liquidity position, and taking advantage of dislocated markets with accretive buybacks of our common and preferred shares Asset Management Platform is Strategic Growth Driver Benefits from Secular Growth in Demand for Digital Infra Scalable, Capital-light, High- ROIC business model One Simple KPI Double Assets Under Management over the next 3 years DataBank Recap $320M Legacy Asset Sales $50M Return of Warehouse Inv. $140M 3Q Sources of Cash +$510M Balance Sheet Simplification $225M of CLOs transferred in 3Q In 4Q, return of equity/transfer of debt from warehoused investments and final DataBank syndication boosts liquidity further to fund AMP Capital acquisition and free capital for accretive uses $108M allocated to increase cash flow and buyback shares with attractive long-term return profile Preferred Stock - $53M (Aug 22) Average Purchase Price $23.62 Retired at Effective Yield 7.6% Annual Cash Flow impact +$4M Common Stock - $55M (Oct 22) Accretive stock repurchases totaling ~2.4% of shares outstanding Average Purchase Price $13.09 Total Shares 4.2M ACCRETIVE CAPITAL ALLOCATIONSTRENGTHEN LIQUIDITYCORPORATE STRATEGY
10 2 FINANCIAL RESULTS

11 3Q 2022 FINANCIAL OVERVIEW Note: All $ in millions except per share & AUM TOTAL COMPANY 3Q21 3Q22 % Change from 3Q21 3Q21 LTM 3Q22 LTM % Change from 3Q21 LTM Consolidated Revenues $252.2 $296.6 +18% $865.3 $1,099.3 +27% DBRG OP Share of Revenues $73.6 $99.7 +35% $229.1 $345.2 +51% Net Income (DBRG Shareholder) $41.0 ($63.3) ($505.6) ($383.6) Per Share $0.33 ($0.39) ($4.23) ($2.60) Adjusted EBITDA (DBRG OP Share) $17.6 $29.1 +65% $43.1 $101.5 +135% Distributable Earnings $0.7 $39.3 ($40.5) $43.1 Per Share $0.01 $0.22 ($0.30) $0.27 AUM ($B) $37.8 $50.3 +33% $37.8 $50.3 +33% Revenues, earnings and cash flows continue their positive trajectory on a year-over-year basis with Warehouse Investments, Operating Segment acquisitions, and Performance Fees contributing to growth
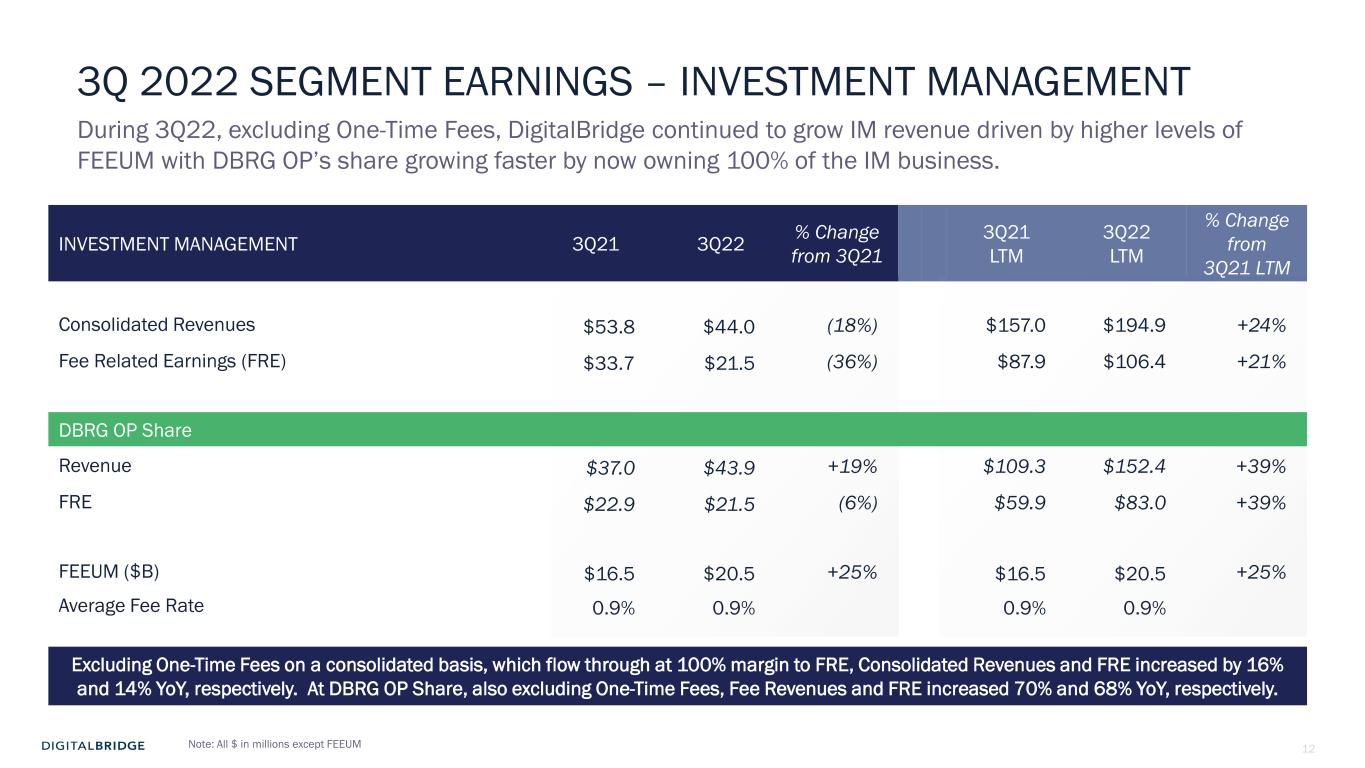
12 3Q 2022 SEGMENT EARNINGS – INVESTMENT MANAGEMENT Note: All $ in millions except FEEUM INVESTMENT MANAGEMENT 3Q21 3Q22 % Change from 3Q21 3Q21 LTM 3Q22 LTM % Change from 3Q21 LTM Consolidated Revenues $53.8 $44.0 (18%) $157.0 $194.9 +24% Fee Related Earnings (FRE) $33.7 $21.5 (36%) $87.9 $106.4 +21% DBRG OP Share Revenue $37.0 $43.9 +19% $109.3 $152.4 +39% FRE $22.9 $21.5 (6%) $59.9 $83.0 +39% FEEUM ($B) $16.5 $20.5 +25% $16.5 $20.5 +25% Average Fee Rate 0.9% 0.9% 0.9% 0.9% During 3Q22, excluding One-Time Fees, DigitalBridge continued to grow IM revenue driven by higher levels of FEEUM with DBRG OP’s share growing faster by now owning 100% of the IM business. Excluding One-Time Fees on a consolidated basis, which flow through at 100% margin to FRE, Consolidated Revenues and FRE increased by 16% and 14% YoY, respectively. At DBRG OP Share, also excluding One-Time Fees, Fee Revenues and FRE increased 70% and 68% YoY, respectively.
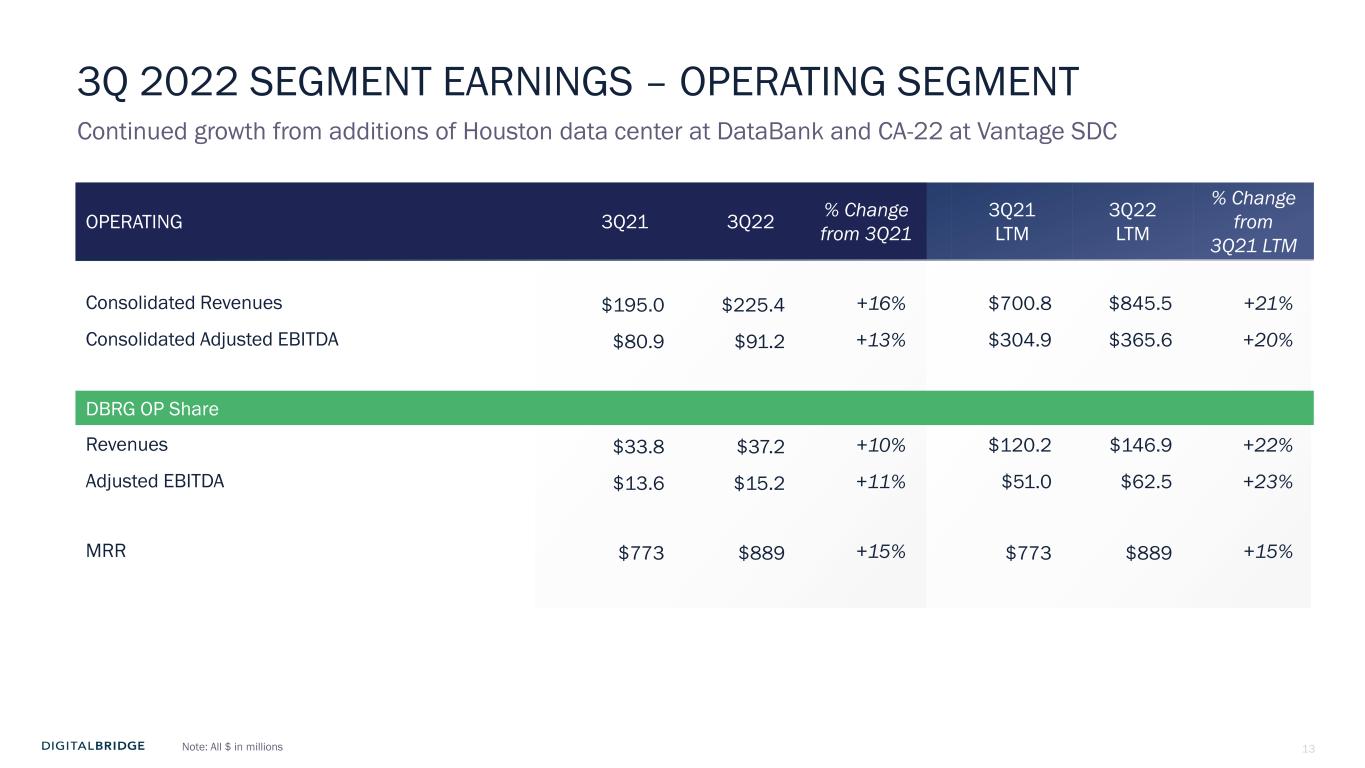
13 3Q 2022 SEGMENT EARNINGS – OPERATING SEGMENT Note: All $ in millions Continued growth from additions of Houston data center at DataBank and CA-22 at Vantage SDC OPERATING 3Q21 3Q22 % Change from 3Q21 3Q21 LTM 3Q22 LTM % Change from 3Q21 LTM Consolidated Revenues $195.0 $225.4 +16% $700.8 $845.5 +21% Consolidated Adjusted EBITDA $80.9 $91.2 +13% $304.9 $365.6 +20% DBRG OP Share Revenues $33.8 $37.2 +10% $120.2 $146.9 +22% Adjusted EBITDA $13.6 $15.2 +11% $51.0 $62.5 +23% MRR $773 $889 +15% $773 $889 +15%

14 STABILIZED GROWTH Investment Management and Operating segments continue to grow consistently with ‘lower left to upper right trajectory’ (1) Includes run-rate adjustments for closing of the AMP Capital transaction. The purchase of the AMP Capital business is currently under contract and is subject to customary regulatory closing conditions. We can provide no assurance that it will close on the timing anticipated or at all. (2) Adjusted to reflect the second stage of the DataBank recapitalization closed in October 2022, reducing the Company’s ownership in DataBank to 12.4% compared to 21.8% prior to the recapitalization. $62M $84M $131M $131M $132M $138M $145M $160M $114M $28M $39M $56M $55M $56M $60M $62M $68M $47M 3Q20 4Q20 1Q21 2Q21 3Q21 4Q21 1Q22 2Q22 3Q22 Annualized Revenue Annualized EBITDA As a result of the successful recapitalization of DataBank, annualized Operating Revenue and Adjusted EBITDA decreased in line with forecasts DBRG SHARE 100% ATTRIBUTABLE TO DBRG Operating $58M $69M $85M $94M $106M $120M $120M $148M $182M $235M $32M $33M $48M $53M $60M $73M $69M $83M $100M $123M 3Q20 4Q20 1Q21 2Q21 3Q21 4Q21 1Q22 2Q22 3Q22 w/AMP Annualized Fee Revenue Annualized FRE Upon closing of the purchase of the Global Infrastructure business from AMP Capital, we expect annualized FRE now to exceed the $120M midpoint of 2022 FRE guidance DBRG SHARE EXCLUDES 31.5% MINORITY INTEREST UNTIL MAY 2022 CONVERSION EXCLUDES 1X ITEMS Investment Management (1) (2) Recapitalization of DataBank reduces Operating contribution; DBRG collected $318M and $48M of cash in August and October, respectively Note: There can be no assurance that actual amounts will not be materially higher or lower than these expectations. Readers should refer to the discussion in the Cautionary Statement Regarding Forward-Looking Statements section at the beginning of this presentation.
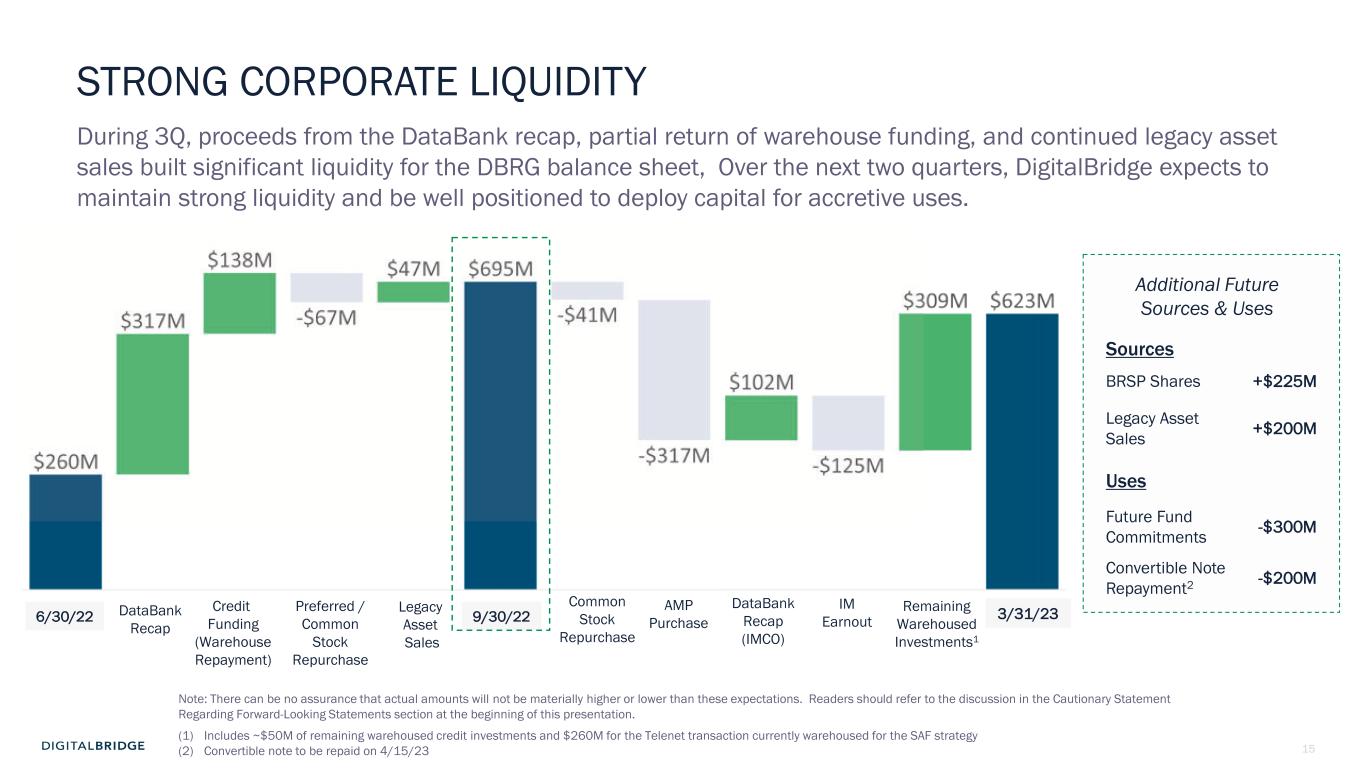
15 STRONG CORPORATE LIQUIDITY During 3Q, proceeds from the DataBank recap, partial return of warehouse funding, and continued legacy asset sales built significant liquidity for the DBRG balance sheet, Over the next two quarters, DigitalBridge expects to maintain strong liquidity and be well positioned to deploy capital for accretive uses. 6/30/22 DataBank Recap Credit Funding (Warehouse Repayment) Legacy Asset Sales 9/30/22 AMP Purchase Remaining Warehoused Investments1 Preferred / Common Stock Repurchase Common Stock Repurchase DataBank Recap (IMCO) 3/31/23 Sources BRSP Shares +$225M Legacy Asset Sales +$200M Uses Future Fund Commitments -$300M Convertible Note Repayment2 -$200M Additional Future Sources & Uses (1) Includes ~$50M of remaining warehoused credit investments and $260M for the Telenet transaction currently warehoused for the SAF strategy (2) Convertible note to be repaid on 4/15/23 IM Earnout Note: There can be no assurance that actual amounts will not be materially higher or lower than these expectations. Readers should refer to the discussion in the Cautionary Statement Regarding Forward-Looking Statements section at the beginning of this presentation.
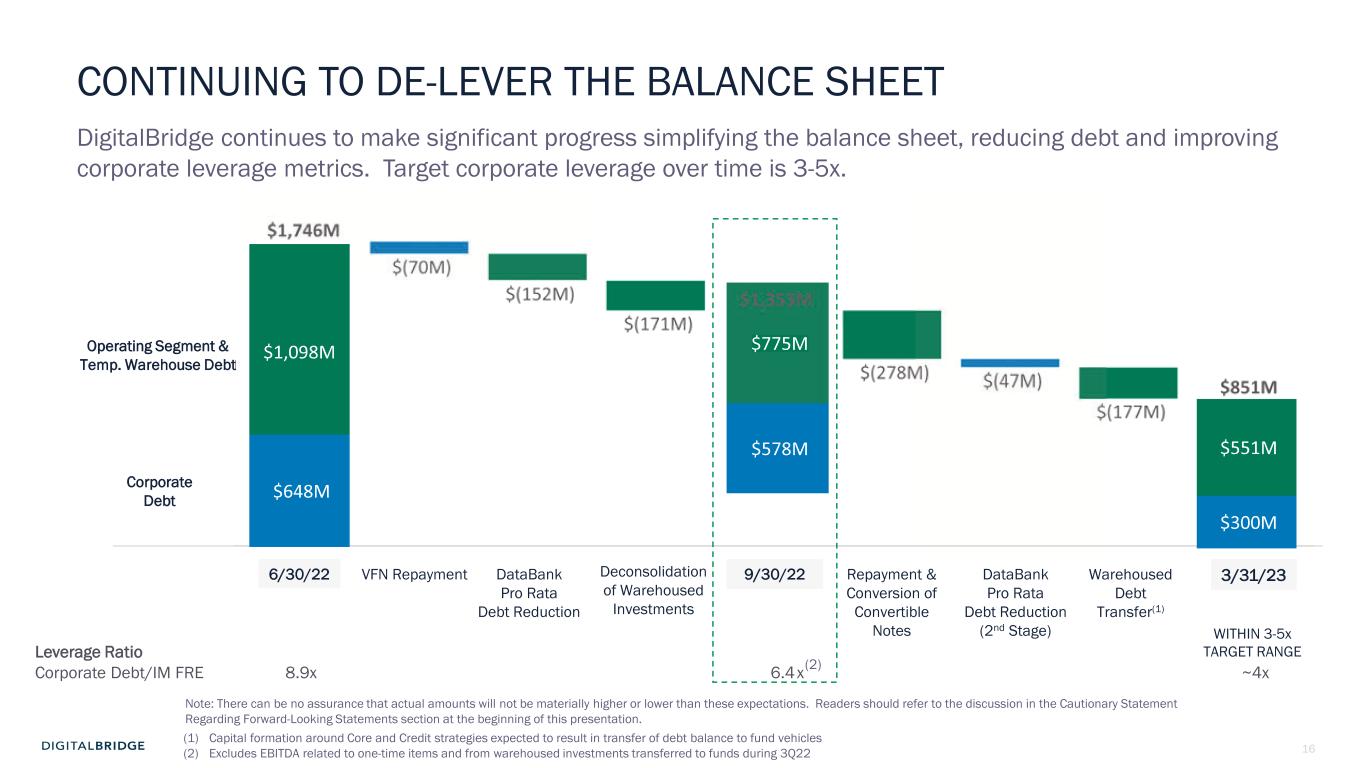
16 CONTINUING TO DE-LEVER THE BALANCE SHEET 6/30/22 VFN Repayment DataBank Pro Rata Debt Reduction 9/30/22 DataBank Pro Rata Debt Reduction (2nd Stage) Deconsolidation of Warehoused Investments Repayment & Conversion of Convertible Notes Warehoused Debt Transfer(1) 3/31/23 Operating Segment & Temp. Warehouse Debt Corporate Debt DigitalBridge continues to make significant progress simplifying the balance sheet, reducing debt and improving corporate leverage metrics. Target corporate leverage over time is 3-5x. (1) Capital formation around Core and Credit strategies expected to result in transfer of debt balance to fund vehicles (2) Excludes EBITDA related to one-time items and from warehoused investments transferred to funds during 3Q22 Leverage Ratio Corporate Debt/IM FRE 8.9x 6.4x ~4x $648M $1,098M $578M $775M $300M $551M (2) WITHIN 3-5x TARGET RANGE Note: There can be no assurance that actual amounts will not be materially higher or lower than these expectations. Readers should refer to the discussion in the Cautionary Statement Regarding Forward-Looking Statements section at the beginning of this presentation.

17 3 EXECUTING THE DIGITAL PLAYBOOK
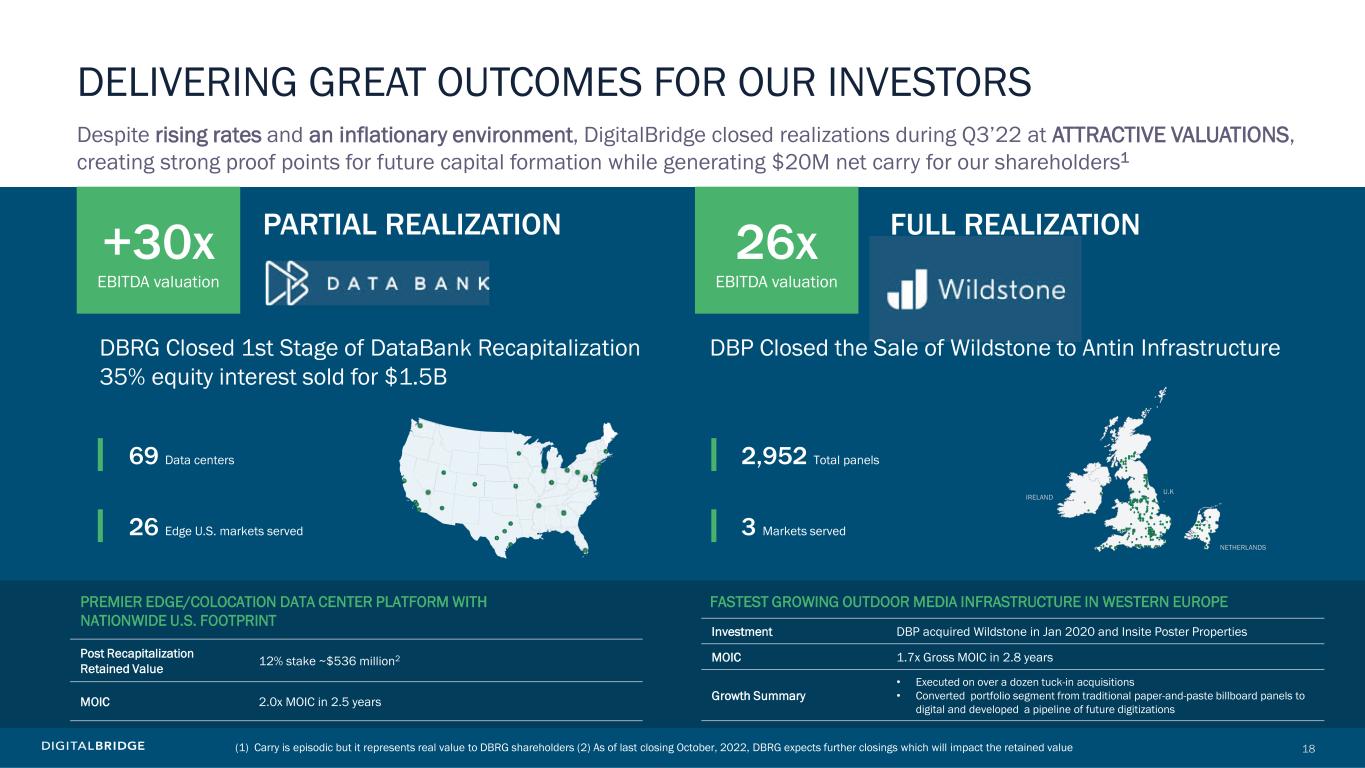
18 DELIVERING GREAT OUTCOMES FOR OUR INVESTORS Despite rising rates and an inflationary environment, DigitalBridge closed realizations during Q3’22 at ATTRACTIVE VALUATIONS, creating strong proof points for future capital formation while generating $20M net carry for our shareholders1 PREMIER EDGE/COLOCATION DATA CENTER PLATFORM WITH NATIONWIDE U.S. FOOTPRINT Post Recapitalization Retained Value 12% stake ~$536 million2 MOIC 2.0x MOIC in 2.5 years 69 Data centers 26 Edge U.S. markets served (1) Carry is episodic but it represents real value to DBRG shareholders (2) As of last closing October, 2022, DBRG expects further closings which will impact the retained value PARTIAL REALIZATION FASTEST GROWING OUTDOOR MEDIA INFRASTRUCTURE IN WESTERN EUROPE Investment DBP acquired Wildstone in Jan 2020 and Insite Poster Properties MOIC 1.7x Gross MOIC in 2.8 years Growth Summary • Executed on over a dozen tuck-in acquisitions, • Converted portfolio segment from traditional paper-and-paste billboard panels to digital and developed a pipeline of future digitizations 2,952 Total panels 3 Markets served FULL REALIZATION DBRG Closed 1st Stage of DataBank Recapitalization 35% equity interest sold for $1.5B DBP Closed the Sale of Wildstone to Antin Infrastructure +30x EBITDA valuation 26x EBITDA valuation U.K .IRELAND NETHERLANDS
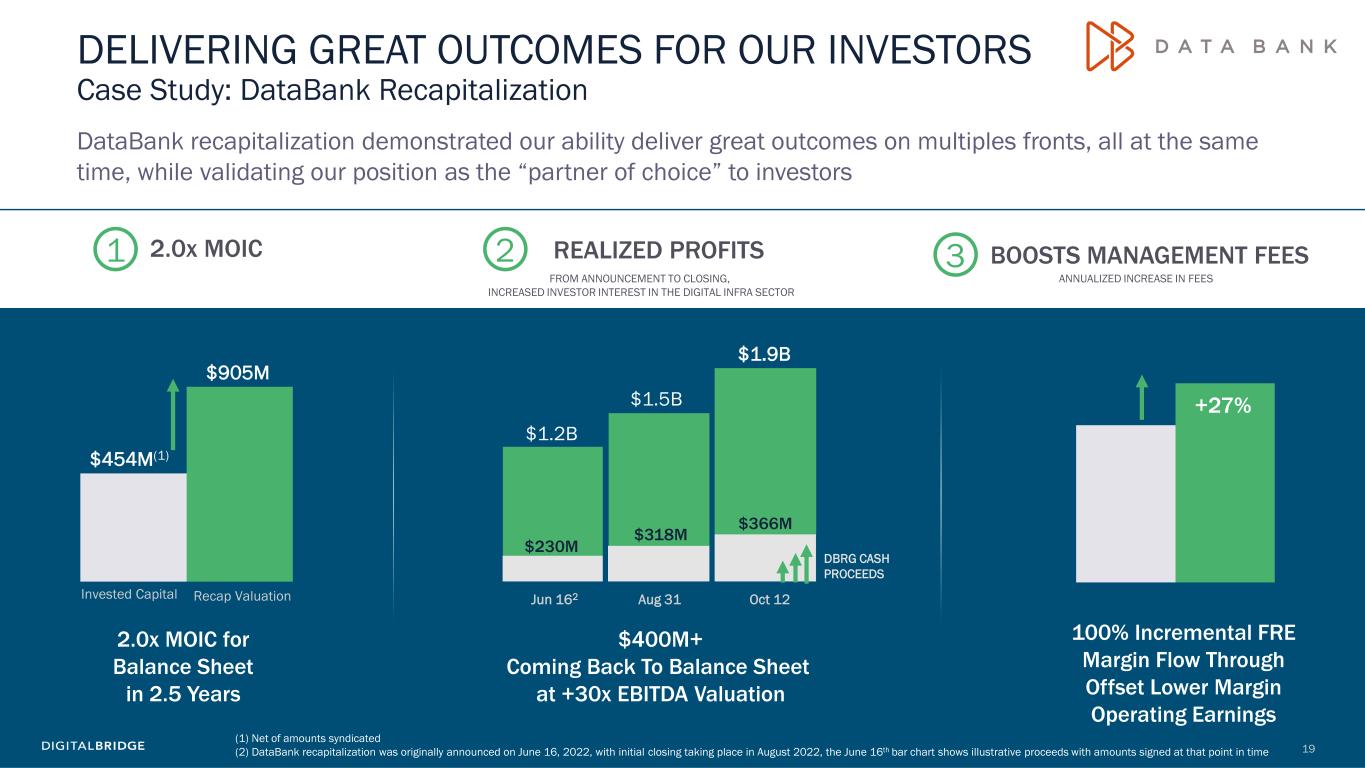
19 DELIVERING GREAT OUTCOMES FOR OUR INVESTORS Case Study: DataBank Recapitalization DataBank recapitalization demonstrated our ability deliver great outcomes on multiples fronts, all at the same time, while validating our position as the “partner of choice” to investors $454M(1) $905M Invested Capital 2.0x MOIC Recap Valuation 2.0x MOIC for Balance Sheet in 2.5 Years REALIZED PROFITS $400M+ Coming Back To Balance Sheet at +30x EBITDA Valuation BOOSTS MANAGEMENT FEES 100% Incremental FRE Margin Flow Through Offset Lower Margin Operating Earnings +27% 1 2 3 $230M $318M $366M $1.2B $1.5B $1.9B FROM ANNOUNCEMENT TO CLOSING, INCREASED INVESTOR INTEREST IN THE DIGITAL INFRA SECTOR Jun 162 Aug 31 Oct 12 DBRG CASH PROCEEDS (1) Net of amounts syndicated (2) DataBank recapitalization was originally announced on June 16, 2022, with initial closing taking place in August 2022, the June 16th bar chart shows illustrative proceeds with amounts signed at that point in time ANNUALIZED INCREASE IN FEES

20 DBRG ACCELERATES INTO TOP 10 Source: Infrastructure Investor, October 2022. Ranking based on capital raised for infrastructure over past 5-years. DBRG’s ranking excludes pro-forma impact of AMP Capital as the transaction has not closed yet, which if included, would push DBRG into rank #7. $7B $13B $18B $20B $27B 2019 2020 2021 2022 3Q 2022E DigitalBridge has established itself as one of the top 10 infrastructure investors globally and is the only sector specialist in the group AMP acquisition takes us to #7 TOP INFRA GPs DBRG FEEUM $ billions 1 $86B Macquarie 2 $77B Brookfield 3 $72B GIP 4 $62B KKR 5 $43B EQT 6 $42B Stonepeak 7 $27B IFM 8 $27B Blackstone 9 $26B I Squared Capital 10 $22B DIGITALBRIDGE Note: There can be no assurance that actual amounts will not be materially higher or lower than these expectations. Readers should refer to the discussion in the Cautionary Statement Regarding Forward-Looking Statements section at the beginning of this presentation. (1) 2022E FEEUM includes pending AMP Capital acquisition and other signed commitments which were not yet charging fees as of 9/30/22. (1)
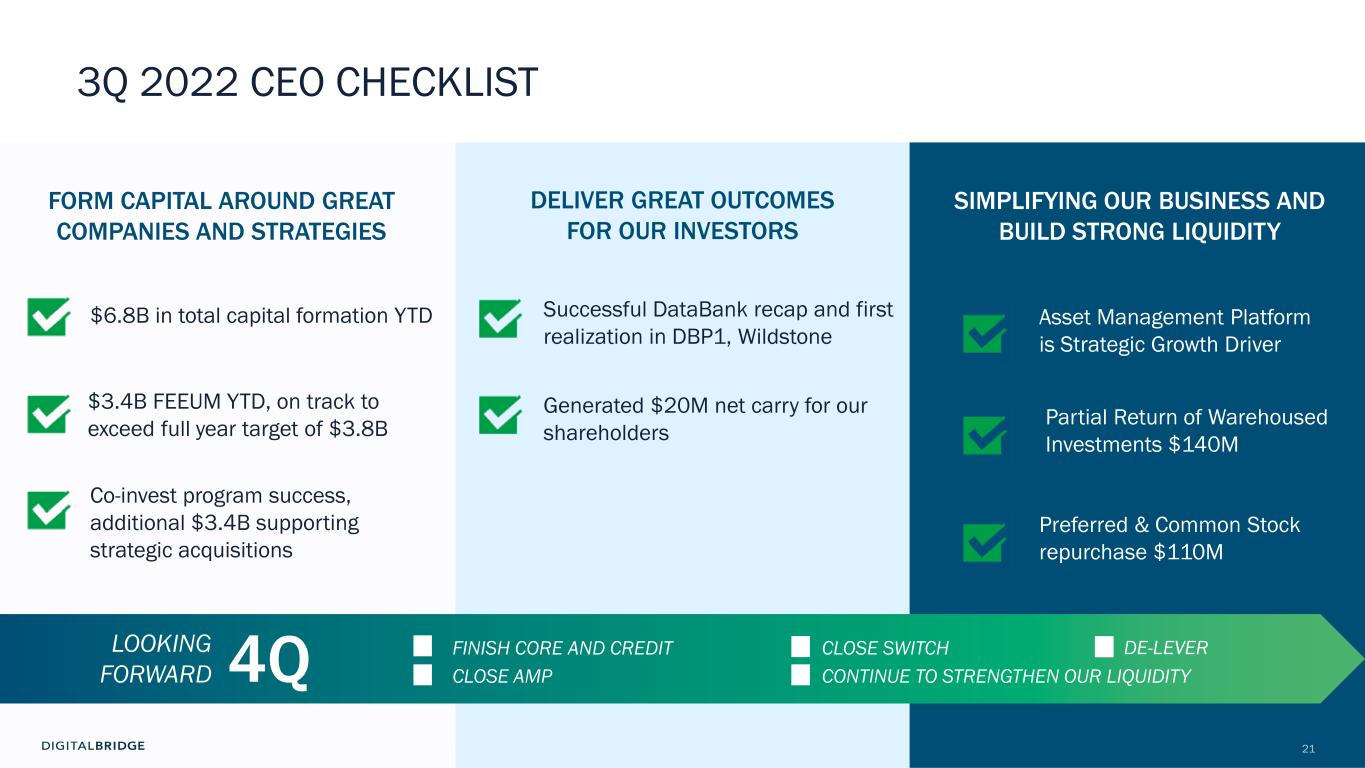
21 3Q 2022 CEO CHECKLIST FORM CAPITAL AROUND GREAT COMPANIES AND STRATEGIES SIMPLIFYING OUR BUSINESS AND BUILD STRONG LIQUIDITY o FINISH CORE AND CREDIT o CLOSE AMP LOOKING FORWARD o CLOSE SWITCH o CONTINUE TO STRENGTHEN OUR LIQUIDITY DELIVER GREAT OUTCOMES FOR OUR INVESTORS 4Q $3.4B FEEUM YTD, on track to exceed full year target of $3.8B Co-invest program success, additional $3.4B supporting strategic acquisitions Generated $20M net carry for our shareholders Partial Return of Warehoused Investments $140M Preferred & Common Stock repurchase $110M Asset Management Platform is Strategic Growth Driver $6.8B in total capital formation YTD Successful DataBank recap and first realization in DBP1, Wildstone DE-LEVER

22 4 Q&A SESSION

23 5 APPENDIX
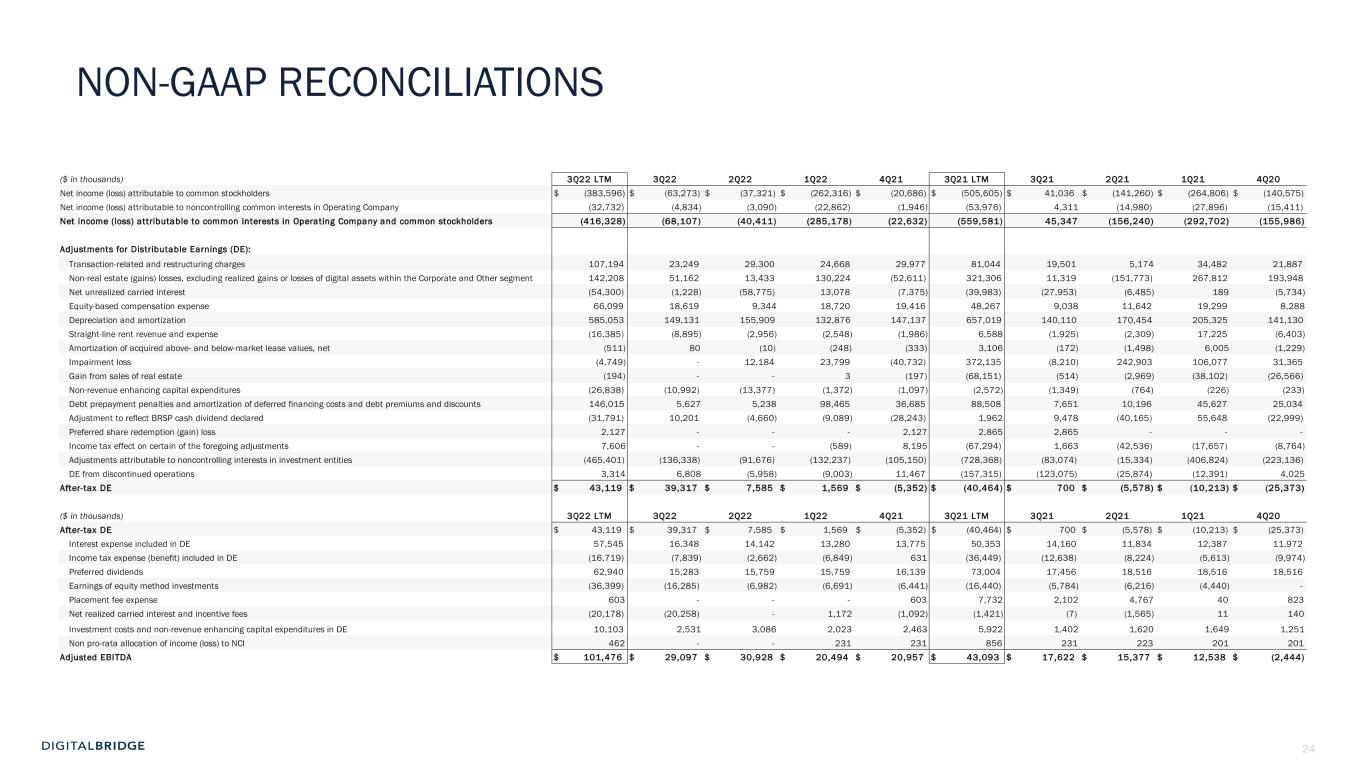
24 3Q22 LTM 3Q22 2Q22 1Q22 4Q21 3Q21 LTM 3Q21 2Q21 1Q21 4Q20 Net income (loss) attributable to common stockholders $ (383,596) $ (63,273) $ (37,321) $ (262,316) $ (20,686) $ (505,605) $ 41,036 $ (141,260) $ (264,806) $ (140,575) Net income (loss) attributable to noncontrolling common interests in Operating Company (32,732) (4,834) (3,090) (22,862) (1,946) (53,976) 4,311 (14,980) (27,896) (15,411) Net income (loss) attributable to common interests in Operating Company and common stockholders (416,328) (68,107) (40,411) (285,178) (22,632) (559,581) 45,347 (156,240) (292,702) (155,986) Adjustments for Distributable Earnings (DE): Transaction-related and restructuring charges 107,194 23,249 29,300 24,668 29,977 81,044 19,501 5,174 34,482 21,887 Non-real estate (gains) losses, excluding realized gains or losses of digital assets within the Corporate and Other segment 142,208 51,162 13,433 130,224 (52,611) 321,306 11,319 (151,773) 267,812 193,948 Net unrealized carried interest (54,300) (1,228) (58,775) 13,078 (7,375) (39,983) (27,953) (6,485) 189 (5,734) Equity-based compensation expense 66,099 18,619 9,344 18,720 19,416 48,267 9,038 11,642 19,299 8,288 Depreciation and amortization 585,053 149,131 155,909 132,876 147,137 657,019 140,110 170,454 205,325 141,130 Straight-line rent revenue and expense (16,385) (8,895) (2,956) (2,548) (1,986) 6,588 (1,925) (2,309) 17,225 (6,403) Amortization of acquired above- and below-market lease values, net (511) 80 (10) (248) (333) 3,106 (172) (1,498) 6,005 (1,229) Impairment loss (4,749) - 12,184 23,799 (40,732) 372,135 (8,210) 242,903 106,077 31,365 Gain from sales of real estate (194) - - 3 (197) (68,151) (514) (2,969) (38,102) (26,566) Non-revenue enhancing capital expenditures (26,838) (10,992) (13,377) (1,372) (1,097) (2,572) (1,349) (764) (226) (233) Debt prepayment penalties and amortization of deferred financing costs and debt premiums and discounts 146,015 5,627 5,238 98,465 36,685 88,508 7,651 10,196 45,627 25,034 Adjustment to reflect BRSP cash dividend declared (31,791) 10,201 (4,660) (9,089) (28,243) 1,962 9,478 (40,165) 55,648 (22,999) Preferred share redemption (gain) loss 2,127 - - - 2,127 2,865 2,865 - - - Income tax effect on certain of the foregoing adjustments 7,606 - - (589) 8,195 (67,294) 1,663 (42,536) (17,657) (8,764) Adjustments attributable to noncontrolling interests in investment entities (465,401) (136,338) (91,676) (132,237) (105,150) (728,368) (83,074) (15,334) (406,824) (223,136) DE from discontinued operations 3,314 6,808 (5,958) (9,003) 11,467 (157,315) (123,075) (25,874) (12,391) 4,025 After-tax DE $ 43,119 $ 39,317 $ 7,585 $ 1,569 $ (5,352) $ (40,464) $ 700 $ (5,578) $ (10,213) $ (25,373) 3Q22 LTM 3Q22 2Q22 1Q22 4Q21 3Q21 LTM 3Q21 2Q21 1Q21 4Q20 After-tax DE $ 43,119 $ 39,317 $ 7,585 $ 1,569 $ (5,352) $ (40,464) $ 700 $ (5,578) $ (10,213) $ (25,373) Interest expense included in DE 57,545 16,348 14,142 13,280 13,775 50,353 14,160 11,834 12,387 11,972 Income tax expense (benefit) included in DE (16,719) (7,839) (2,662) (6,849) 631 (36,449) (12,638) (8,224) (5,613) (9,974) Preferred dividends 62,940 15,283 15,759 15,759 16,139 73,004 17,456 18,516 18,516 18,516 Earnings of equity method investments (36,399) (16,285) (6,982) (6,691) (6,441) (16,440) (5,784) (6,216) (4,440) - Placement fee expense 603 - - - 603 7,732 2,102 4,767 40 823 Net realized carried interest and incentive fees (20,178) (20,258) - 1,172 (1,092) (1,421) (7) (1,565) 11 140 Investment costs and non-revenue enhancing capital expenditures in DE 10,103 2,531 3,086 2,023 2,463 5,922 1,402 1,620 1,649 1,251 Non pro-rata allocation of income (loss) to NCI 462 - - 231 231 856 231 223 201 201 Adjusted EBITDA $ 101,476 $ 29,097 $ 30,928 $ 20,494 $ 20,957 $ 43,093 $ 17,622 $ 15,377 $ 12,538 $ (2,444) NON-GAAP RECONCILIATIONS
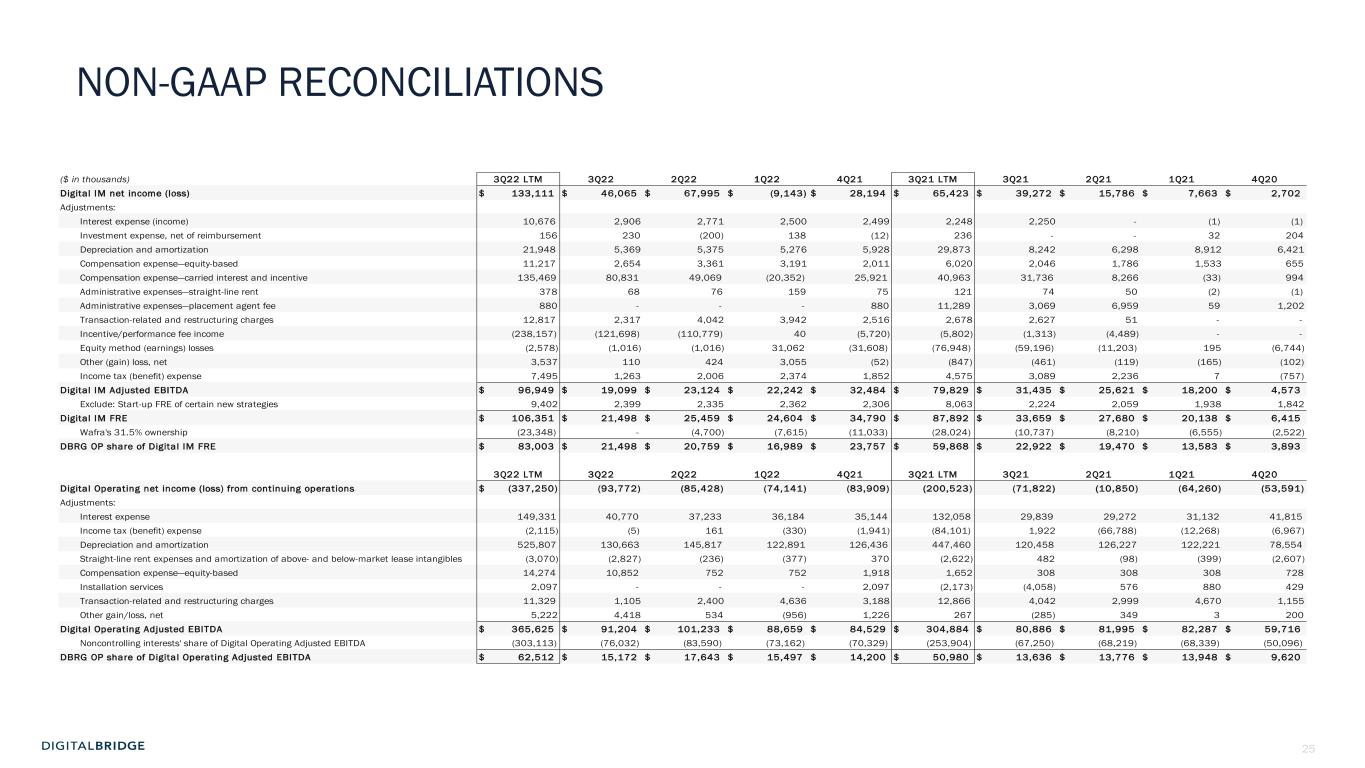
25 NON-GAAP RECONCILIATIONS ($ in thousands) 3Q22 LTM 3Q22 2Q22 1Q22 4Q21 3Q21 LTM 3Q21 2Q21 1Q21 4Q20 Digital IM net income (loss) $ 133,111 $ 46,065 $ 67,995 $ (9,143) $ 28,194 $ 65,423 $ 39,272 $ 15,786 $ 7,663 $ 2,702 Adjustments: Interest expense (income) 10,676 2,906 2,771 2,500 2,499 2,248 2,250 - (1) (1) Investment expense, net of reimbursement 156 230 (200) 138 (12) 236 - - 32 204 Depreciation and amortization 21,948 5,369 5,375 5,276 5,928 29,873 8,242 6,298 8,912 6,421 Compensation expense—equity-based 11,217 2,654 3,361 3,191 2,011 6,020 2,046 1,786 1,533 655 Compensation expense—carried interest and incentive 135,469 80,831 49,069 (20,352) 25,921 40,963 31,736 8,266 (33) 994 Administrative expenses—straight-line rent 378 68 76 159 75 121 74 50 (2) (1) Administrative expenses—placement agent fee 880 - - - 880 11,289 3,069 6,959 59 1,202 Transaction-related and restructuring charges 12,817 2,317 4,042 3,942 2,516 2,678 2,627 51 - - Incentive/performance fee income (238,157) (121,698) (110,779) 40 (5,720) (5,802) (1,313) (4,489) - - Equity method (earnings) losses (2,578) (1,016) (1,016) 31,062 (31,608) (76,948) (59,196) (11,203) 195 (6,744) Other (gain) loss, net 3,537 110 424 3,055 (52) (847) (461) (119) (165) (102) Income tax (benefit) expense 7,495 1,263 2,006 2,374 1,852 4,575 3,089 2,236 7 (757) Digital IM Adjusted EBITDA $ 96,949 $ 19,099 $ 23,124 $ 22,242 $ 32,484 $ 79,829 $ 31,435 $ 25,621 $ 18,200 $ 4,573 Exclude: Start-up FRE of certain new strategies 9,402 2,399 2,335 2,362 2,306 8,063 2,224 2,059 1,938 1,842 Digital IM FRE $ 106,351 $ 21,498 $ 25,459 $ 24,604 $ 34,790 $ 87,892 $ 33,659 $ 27,680 $ 20,138 $ 6,415 Wafra's 31.5% ownership (23,348) - (4,700) (7,615) (11,033) (28,024) (10,737) (8,210) (6,555) (2,522) DBRG OP share of Digital IM FRE $ 83,003 $ 21,498 $ 20,759 $ 16,989 $ 23,757 $ 59,868 $ 22,922 $ 19,470 $ 13,583 $ 3,893 3Q22 LTM 3Q22 2Q22 1Q22 4Q21 3Q21 LTM 3Q21 2Q21 1Q21 4Q20 Digital Operating net income (loss) from continuing operations $ (337,250) (93,772) (85,428) (74,141) (83,909) (200,523) (71,822) (10,850) (64,260) (53,591) Adjustments: Interest expense 149,331 40,770 37,233 36,184 35,144 132,058 29,839 29,272 31,132 41,815 Income tax (benefit) expense (2,115) (5) 161 (330) (1,941) (84,101) 1,922 (66,788) (12,268) (6,967) Depreciation and amortization 525,807 130,663 145,817 122,891 126,436 447,460 120,458 126,227 122,221 78,554 Straight-line rent expenses and amortization of above- and below-market lease intangibles (3,070) (2,827) (236) (377) 370 (2,622) 482 (98) (399) (2,607) Compensation expense—equity-based 14,274 10,852 752 752 1,918 1,652 308 308 308 728 Installation services 2,097 - - - 2,097 (2,173) (4,058) 576 880 429 Transaction-related and restructuring charges 11,329 1,105 2,400 4,636 3,188 12,866 4,042 2,999 4,670 1,155 Other gain/loss, net 5,222 4,418 534 (956) 1,226 267 (285) 349 3 200 Digital Operating Adjusted EBITDA $ 365,625 $ 91,204 $ 101,233 $ 88,659 $ 84,529 $ 304,884 $ 80,886 $ 81,995 $ 82,287 $ 59,716 Noncontrolling interests' share of Digital Operating Adjusted EBITDA (303,113) (76,032) (83,590) (73,162) (70,329) (253,904) (67,250) (68,219) (68,339) (50,096) DBRG OP share of Digital Operating Adjusted EBITDA $ 62,512 $ 15,172 $ 17,643 $ 15,497 $ 14,200 $ 50,980 $ 13,636 $ 13,776 $ 13,948 $ 9,620

26 IMPORTANT NOTE REGARDING NON-GAAP FINANCIAL MEASURES This presentation includes certain “non-GAAP” supplemental measures that are not defined by generally accepted accounting principles, or GAAP, including the financial metrics defined below, of which the calculations may from methodologies utilized by other REITs for similar performance measurements, and accordingly, may not be comparable to those of other REITs. Adjusted Earnings before Interest, Taxes, Depreciation and Amortization (Adjusted EBITDA): Adjusted EBITDA represents DE adjusted to exclude the following items: interest expense as included in DE, income tax expense or benefit as included in DE, preferred stock dividends, equity method earnings, placement fee expense, our share of realized carried interest and incentive fees net of associated compensation expense, certain investment costs for capital raising that are not reimbursable by our sponsored funds, and capital expenditures as deducted in DE. Adjusted EBITDA is presented on a reportable segment basis and for the Company in total. We believe that Adjusted EBITDA is a meaningful supplemental measure of performance because it presents the Company’s operating performance independent of its capital structure, leverage and non-cash items, which allows for better comparability against entities with different capital structures and income tax rates. However, because Adjusted EBITDA is calculated before recurring cash charges including interest expense and taxes and does not deduct capital expenditures or other recurring cash requirements, its usefulness as a performance measure may be limited. Distributable Earnings (DE): DE is an after-tax measure that differs from GAAP net income or loss from continuing operations as a result of the following adjustments, including adjustment for our share of similar items recognized by our equity method investments: transaction-related and restructuring charges; realized and unrealized gains and losses, except realized gains and losses from digital assets in Corporate and Other; depreciation, amortization and impairment charges; debt prepayment penalties, and amortization of deferred financing costs, debt premiums and debt discounts; our share of unrealized carried interest, net of associated compensation expense; equity-based compensation expense; equity method earnings from BRSP which is replaced with dividends declared by BRSP; effect of straight-line lease income and expense; impairment of equity investments directly attributable to decrease in value of depreciable real estate held by the investee; non-revenue enhancing capital expenditures; income tax effect on certain of the foregoing adjustments. Income taxes included in DE reflect the benefit of deductions arising from certain expenses that are excluded from the calculation of DE, such as equity-based compensation, as these deductions do decrease actual income tax paid or payable by the Company in any one period. There are no differences in the Company’s measurement of DE and AFFO. Therefore, previously reported AFFO is the equivalent to DE and prior period information has not been recast. DE is presented on a reportable segment basis and for the Company in total. We believe that DE is a meaningful supplemental measure as it reflects the ongoing operating performance of our core business by generally excluding items that are non-core operational in nature and allows for better comparability of operating results period-over-period and to other companies in similar lines of business. Digital Operating Earnings before Interest, Taxes, Depreciation and Amortization for Real Estate (EBITDAre) and Adjusted EBITDA: The Company calculates EBITDAre in accordance with the standards established by the National Association of Real Estate Investment Trusts, which defines EBITDAre as net income or loss calculated in accordance with GAAP, excluding interest, taxes, depreciation and amortization, gains or losses from the sale of depreciated property, and impairment of depreciated property. The Company calculates Adjusted EBITDA by adjusting EBITDAre for the effects of straight-line rental income/expense adjustments and amortization of acquired above- and below-market lease adjustments to rental income, revenues and corresponding costs related to the delivery of installation services, equity-based compensation expense, restructuring and transaction related costs, the impact of other impairment charges, gains or losses from sales of undepreciated land, gains or losses from foreign currency remeasurements, and gains or losses on early extinguishment of debt and hedging instruments. The Company uses EBITDAre and Adjusted EBITDA as supplemental measures of our performance because they eliminate depreciation, amortization, and the impact of the capital structure from its operating results. EBITDAre represents a widely known supplemental measure of performance, EBITDA, but for real estate entities, which we believe is particularly helpful for generalist investors in REITs. EBITDAre depicts the operating performance of a real estate business independent of its capital structure, leverage and non-cash items, which allows for comparability across real estate entities with different capital structure, tax rates and depreciation or amortization policies. Additionally, exclusion of gains on disposition and impairment of depreciated real estate, similar to FFO, also provides a reflection of ongoing operating performance and allows for period-over-period comparability. However, because EBITDAre and Adjusted EBITDA are calculated before recurring cash charges including interest expense and taxes and are not adjusted for capital expenditures or other recurring cash requirements, their utilization as a cash flow measurement is limited. Digital Investment Management Fee Related Earnings (Digital IM FRE): Digital IM FRE is calculated as recurring fee income and other income inclusive of cost reimbursements (related to administrative expenses), and net of compensation expense (excluding equity-based compensation, carried interest and incentive compensation) and administrative expense (excluding placement fees and straight-line rent). Digital IM FRE is used to assess the extent to which direct base compensation and operating expenses are covered by recurring fee revenues in the digital investment management business. We believe that Digital IM FRE is a useful supplemental performance measure because it may provide additional insight into the profitability of the overall digital investment management business. Digital IM FRE is measured as Adjusted EBITDA for the Digital IM segment, adjusted to reflect the Company’s Digital IM segment as a stabilized business by excluding FRE associated with new investment strategies that have 1) not yet held a first close raising FEEUM; or 2) not yet achieved break- even Adjusted EBITDA only for investment products that may be terminated solely at the Company’s discretion, collectively referred to as “Start-up FRE.” The Company evaluates new investment strategies on a regular basis and excludes Start-Up FRE from Digital IM FRE until such time a new strategy is determined to form part of the Company’s core investment management business. Assets Under Management (“AUM”): Assets owned by the Company’s balance sheet and assets for which the Company and its affiliates provide investment management services, including assets for which the Company may or may not charge management fees and/or performance allocations. Balance sheet AUM is based on the undepreciated carrying value of digital investments and the impaired carrying value of non digital investments as of the report date. Investment management AUM is based on the cost basis of managed investments as reported by each underlying vehicle as of the report date. AUM further includes uncalled capital commitments but excludes DBRG OP’s share of non wholly-owned real estate investment management platform’s AUM. The Company's calculations of AUM may differ from the calculations of other asset managers, and as a result, this measure may not be comparable to similar measures presented by other asset managers. DigitalBridge Operating Company, LLC (“DBRG OP”): The operating partnership through which the Company conducts all of its activities and holds substantially all of its assets and liabilities. DBRG OP share excludes noncontrolling interests in investment entities. Fee-Earning Equity Under Management (“FEEUM”): Equity for which the Company and its affiliates provides investment management services and derives management fees and/or performance allocations. FEEUM generally represents the basis used to derive fees, which may be based on invested equity, stockholders’ equity, or fair value pursuant to the terms of each underlying investment management agreement. The Company's calculations of FEEUM may differ materially from the calculations of other asset managers, and as a result, this measure may not be comparable to similar measures presented by other asset managers. Monthly Recurring Revenue (“MRR”): The Company defines MRR as revenue from ongoing services that is generally fixed in price and contracted for longer than 30 days. This presentation includes forward-looking guidance for certain non-GAAP financial measures, including Adjusted EBITDA and FRE. These measures will differ from net income, determined in accordance with GAAP, in ways similar to those described in the reconciliations of historical Adjusted EBITDA and FRE to net income. We do not provide guidance for net income, determined in accordance with GAAP, or a reconciliation of guidance for Adjusted EBITDA or FRE to the most directly comparable GAAP measure because the Company is not able to predict with reasonable certainty the amount or nature of all items that will be included in net income. In evaluating the information presented throughout this presentation see definitions and reconciliations of non-GAAP financial measures to GAAP measures. For purposes of comparability, historical data in this presentation may include certain adjustments from prior reported data at the historical period.

27


