
Shareholder Letter Fourth Quarter and Full-Year 2021 February 24, 2022 Exhibit 99.1
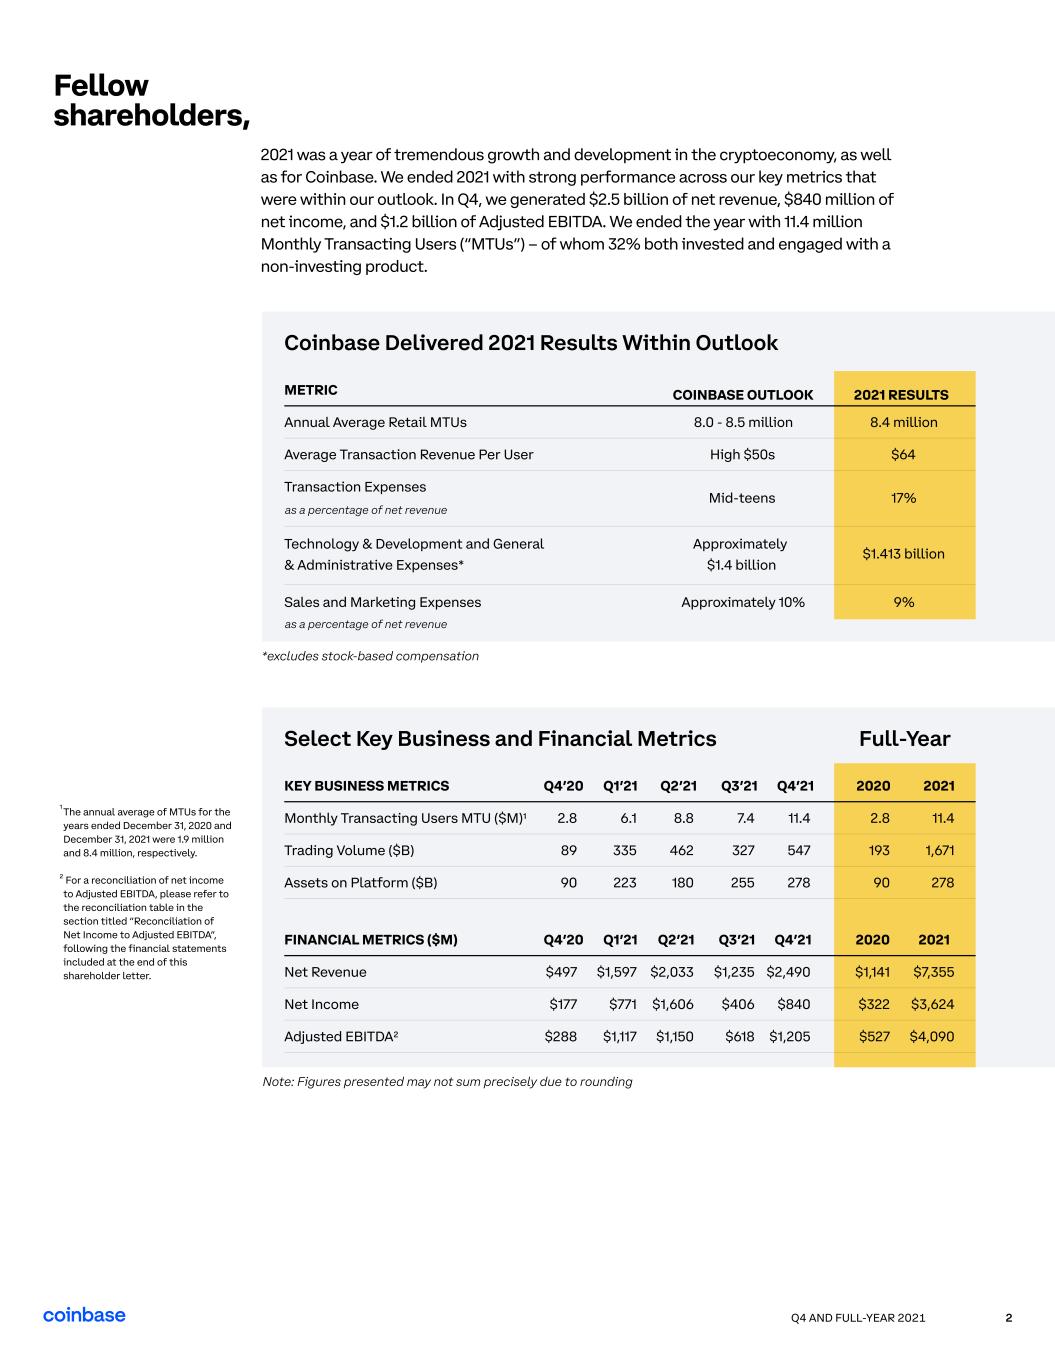
Q4 AND FULL-YEAR 2021 2 2021 was a year of tremendous growth and development in the cryptoeconomy, as well as for Coinbase. We ended 2021 with strong performance across our key metrics that were within our outlook. In Q4, we generated $2.5 billion of net revenue, $840 million of net income, and $1.2 billion of Adjusted EBITDA. We ended the year with 11.4 million Monthly Transacting Users (“MTUs”) – of whom 32% both invested and engaged with a non-investing product. *excludes stock-based compensation Note: Figures presented may not sum precisely due to rounding Fellow shareholders, Coinbase Delivered 2021 Results Within Outlook Metric Annual Average Retail MTUs Average Transaction Revenue Per User Transaction Expenses
as a percentage of net revenue Technology & Development and General & Administrative Expenses* Sales and Marketing Expenses
as a percentage of net revenue 8.0 - 8.5 million High $50s Mid-teens Approximately $1.4 billion Approximately 10% Coinbase Outlook 8.4 million $64 17% $1.413 billion 9% 2021 Results For a reconciliation of net income to Adjusted EBITDA, please refer to the reconciliation table in the section titled “Reconciliation of Net Income to Adjusted EBITDA”, following the financial statements included at the end of this shareholder letter. The annual average of MTUs for the years ended December 31, 2020 and December 31, 2021 were 1.9 million and 8.4 million, respectively. 2 1 Select Key Business and Financial Metrics Full-Year KEY BUSINESS METRICS Monthly Transacting Users MTU ($M)1 Trading Volume ($B) Assets on Platform ($B) 8.8 462 180 $2,033 $1,606 $1,150 Q2’21 Q2’21Financial Metrics ($M) Net Revenue Net Income Adjusted EBITDA2 Q4’20 2.8 89 90 Q4’20 $497 $177 $288 Q1’21 6.1 335 223 Q1’21 $1,597 $771 $1,117 7.4 327 255 $1,235 $406 $618 Q3’21 Q3’21 11.4 547 278 $2,490 $840 $1,205 Q4’21 Q4’21 11.4 1,671 278 $7,355 $3,624 $4,090 2021 2021 2.8 193 90 $1,141 $322 $527 2020 2020

Q4 AND FULL-YEAR 2021 3 $123B
2018 $192B
2019 $782B
2020 $2,321B
2021 Total Crypto Market Cap3 The total crypto market capitalization at the end of Q4 was $2.3 trillion – up nearly three-fold from approximately $800 billion at the end of 2020 – and hit a peak of $3.1 trillion in November 2021. Bitcoin and Ethereum prices reached new highs that were 247% and 457% higher, respectively, than prior peaks seen in 2017, with Bitcoin itself nearly reaching $1.3 trillion in market capitalization in Q4. Moreover, the number of crypto owners continued to climb in 2021 to nearly 1 in 4 U.S. households, according
to a recent study. Figures indicate total crypto market capitalization as of December 31 of respective years. 3
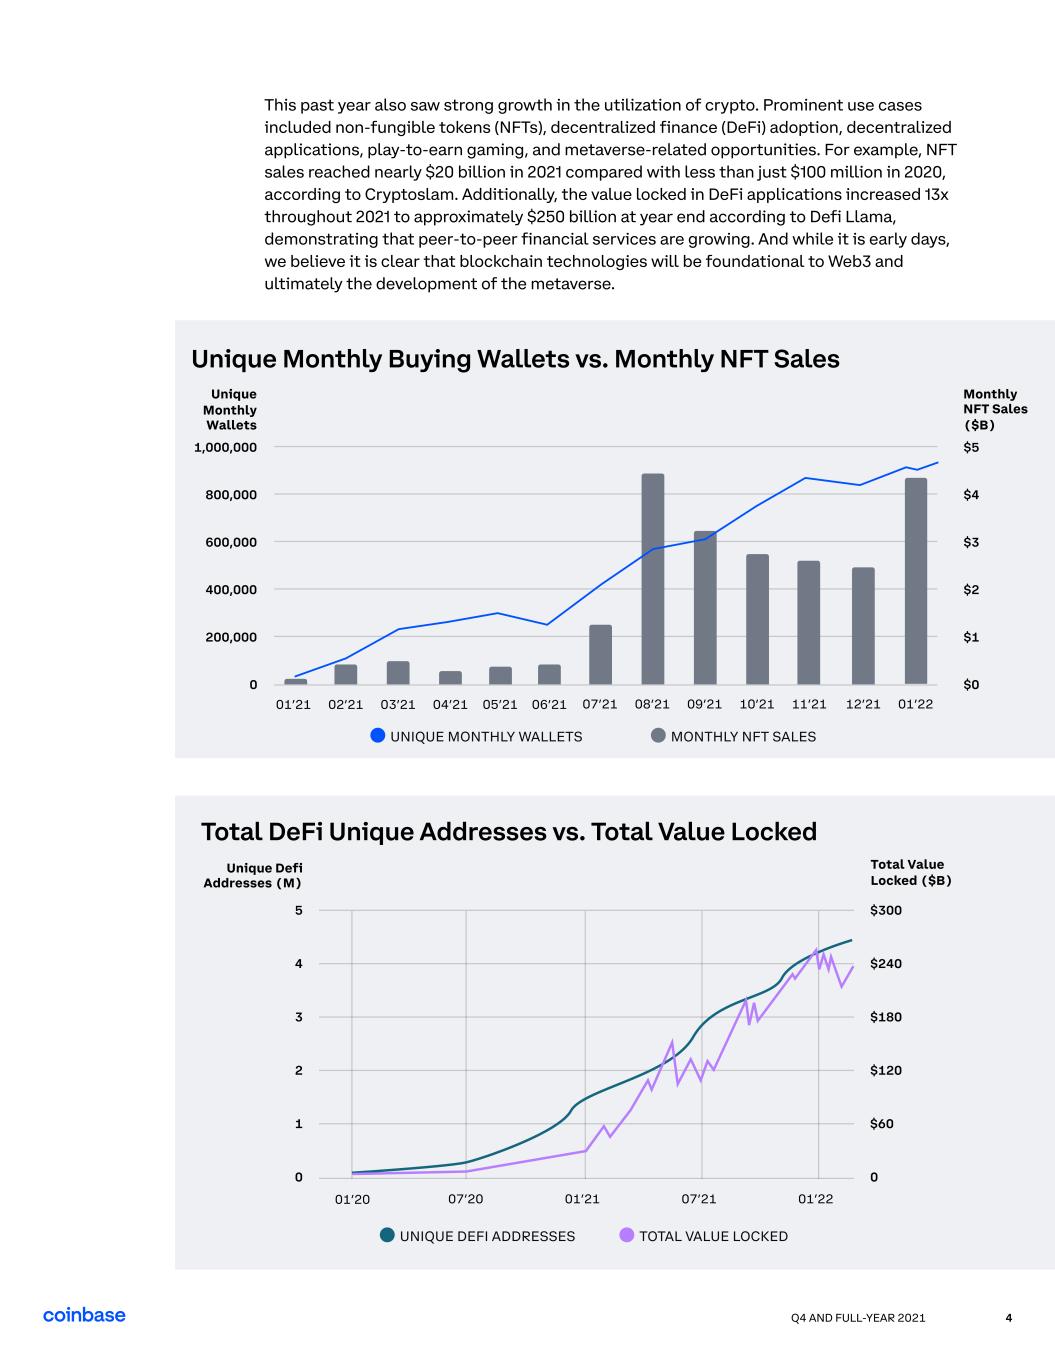
Q4 AND FULL-YEAR 2021 4 Unique DEFI ADDRESSES TOTAL value locked 01’20 07’20 01’2207’2101’21 Unique Defi Addresses (M) 3 4 5 2 1 Total Value Locked ($B) $60 $120 $180 $240 $300 00 Total DeFi Unique Addresses vs. Total Value Locked Unique Monthly wallets Monthly NFt sales 06’2105’2104’2102’21 03’2101’21 07’21 12’21 01’2211’2110’2109’2108’21 Unique Monthly Wallets 200,000 400,000 600,000 800,000 1,000,000 0 Monthly NFT Sales ($B) $3 $4 $5 $2 $1 $0 Unique Monthly Buying Wallets vs. Monthly NFT Sales This past year also saw strong growth in the utilization of crypto. Prominent use cases included non-fungible tokens (NFTs), decentralized finance (DeFi) adoption, decentralized applications, play-to-earn gaming, and metaverse-related opportunities. For example, NFT sales reached nearly $20 billion in 2021 compared with less than just $100 million in 2020, according to Cryptoslam. Additionally, the value locked in DeFi applications increased 13x throughout 2021 to approximately $250 billion at year end according to Defi Llama, demonstrating that peer-to-peer financial services are growing. And while it is early days, we believe it is clear that blockchain technologies will be foundational to Web3 and ultimately the development of the metaverse.

Q4 AND FULL-YEAR 2021 5 Made Key Investments to Drive Future Growth Ecosystem investments: Further expanded the number of ecosystem partners using Coinbase through such initiatives as the launch of Coinbase Cloud and build-out of APIs to enable businesses of all kinds to leverage our platform. Headcount growth: We ended 2021 with 3,730 full-time employees, up 3x compared to 2020, including an expanded engineering presence in India, Canada, Brazil and Singapore. Strong balance sheet: We ended the year with $7.1 billion in cash and cash equivalents - including proceeds from $3.4 billion in long-term debt we issued in 2021 at attractive terms. We believe our strong balance sheet will enable us to continue to invest in long- term growth opportunities regardless of crypto market conditions. Expanded access to crypto and grew user base User growth: Grew MTUs to 11.4 million – over 4x compared to 2020 – and Verified Users to
89 million.
Asset addition: Added trading and custody support for 95 and 72 new crypto assets, respectively. Other crypto assets beyond Bitcoin and Ethereum contributed 55% of total Trading Volume in 2021. Expanded access: More than doubled the number of countries where users can buy and sell crypto via fiat rails to 90+, and added Apple Pay, Google Pay, and PayPal as payment methods. Grew Market Share, Revenues, and Profits Grew market share of Trading Volume: In 2021, our Trading Volume grew more than 8.5x compared to 2020, and our market share of Trading Volume increased in virtually all assets. Revenue diversification Generated over $500 million in Subscription and services revenues – including over
$200 million in the fourth quarter – with traction in products including Staking,
Earn, and Custody Grew our Institutional customer base by over 50%, including doubling the number
of Custody customers, and launched Coinbase Prime, our integrated solution for institutional crypto needs. Profitable growth: In 2021, we generated $3.6 billion in net income, up 11x compared to 2020. 2021 Highlights Amid this extraordinary pace of development, Coinbase had a strong year as well. In 2021, millions of new users joined the cryptoeconomy through Coinbase; we generated $7.4 billion in net revenue – including $2.5 billion in the fourth quarter; we became the first publicly traded crypto asset trading platform; and we made substantial progress in building a best-in-class infrastructure to enable easy, safe, and secure on-ramps and access into the global cryptoeconomy. Among our highlights for the year:

Q4 AND FULL-YEAR 2021 6 Retail MTUs in Q4 were 11.4 million, an increase of 4.0 million or 54% compared to Q3. Full-year average annual MTUs in 2021 – a straight average across all four quarters – were 8.4 million and within our outlook range. Strong market conditions, our consumer marketing efforts, asset addition, and product development all contributed to strong MTU trends in Q4. We continued to see a growing percentage of our users deepen their engagement with our product portfolio. In Q4, 32% of our MTUs were using both investing and non-investing products, up from 22% at the end of 2020. The most widely adopted non-investing products are Staking and Earn, which have higher levels of retention than investing. We believe adoption of these products should help support MTU levels in 2022 as we expand those offerings. At the end of Q4 2021, we had 3.6 million users who were earning yield on their crypto assets. On the institutional side, a major theme throughout 2021 was adoption by a broader range of clients seeking to engage with crypto – beyond asset managers and financial services firms to corporate treasuries and institutional allocators. We were proud to welcome or expand relationships with Anheuser-Busch, Brex, Enfusion, and Franklin Templeton on the Coinbase institutional platform in Q4. As part of our strategy to serve as the primary crypto account and give our customers the greatest amount of choice, we want to list all legal assets. Over the course of 2021, we accelerated our asset listing efforts. In Q4, we added custody and trading support for 14 and 36 assets, respectively. We ended 2021 with support for 172 assets for custody and 139 assets for trading. Looking ahead, we will continue to invest in our asset review process, including expanding our team, improving automation and tooling, and emphasizing our rigorous process where we evaluate security, legality, and compliance. Listing More Assets and Trading Pairs Coinbase Wallet
In Q4, we made improvements to our self-hosted Wallet product to make it easier for our users to participate in DeFi and NFTs, as well as natively trade more than 5,500 crypto assets via decentralized exchanges - all of which have unique access and participation complexities. Now, Coinbase Wallet can be used to interact with decentralized crypto applications via the mobile app as well as a browser extension, which works with third-party browsers such as Chrome. Building
Innovative Products User Growth & Engagement
Q4 AND FULL-YEAR 2021 7 Coinbase Payroll
In Q4, we launched our payroll product, which allows employees to receive a percentage of their compensation in crypto. Tens of thousands of users have signed up to date, including New York City Mayor Eric Adams. This product is available to all users in the U.S. and we look forward to expanding access to international customers in the future. Tax Center
In Q4, we launched the Coinbase Tax Center to help simplify the crypto tax filing experience for our U.S. retail customers by providing the reports, information, and education they need. Coinbase customers can leverage the Tax Center to get the resources they need to file their crypto taxes, and advanced users with multiple wallets can leverage a partnership with CoinTracker. For the first time, taxpayers can also receive tax refunds in crypto or USDC into their Coinbase account when they file with TurboTax. Customer education
Crypto is a complex and rapidly evolving industry and it is important to bring our users along with the industry innovation. We have expanded our content offering to help our customers learn more about the crypto ecosystem Coinbase Bytes, our weekly newsletter, now reaches nearly 23 million users weekly BUIDL Crypto is a weekly Twitter Spaces series we began in Q3, where we bring together leading builders from around the ecosystem to discuss some of crypto's challenges and opportunities Around the Block sheds light on the biggest trends in crypto and Web3 through long form research and a weekly podcast featuring discussions with some of the best minds in the industry.

Coinbase Shareholder Letter Financial Overview
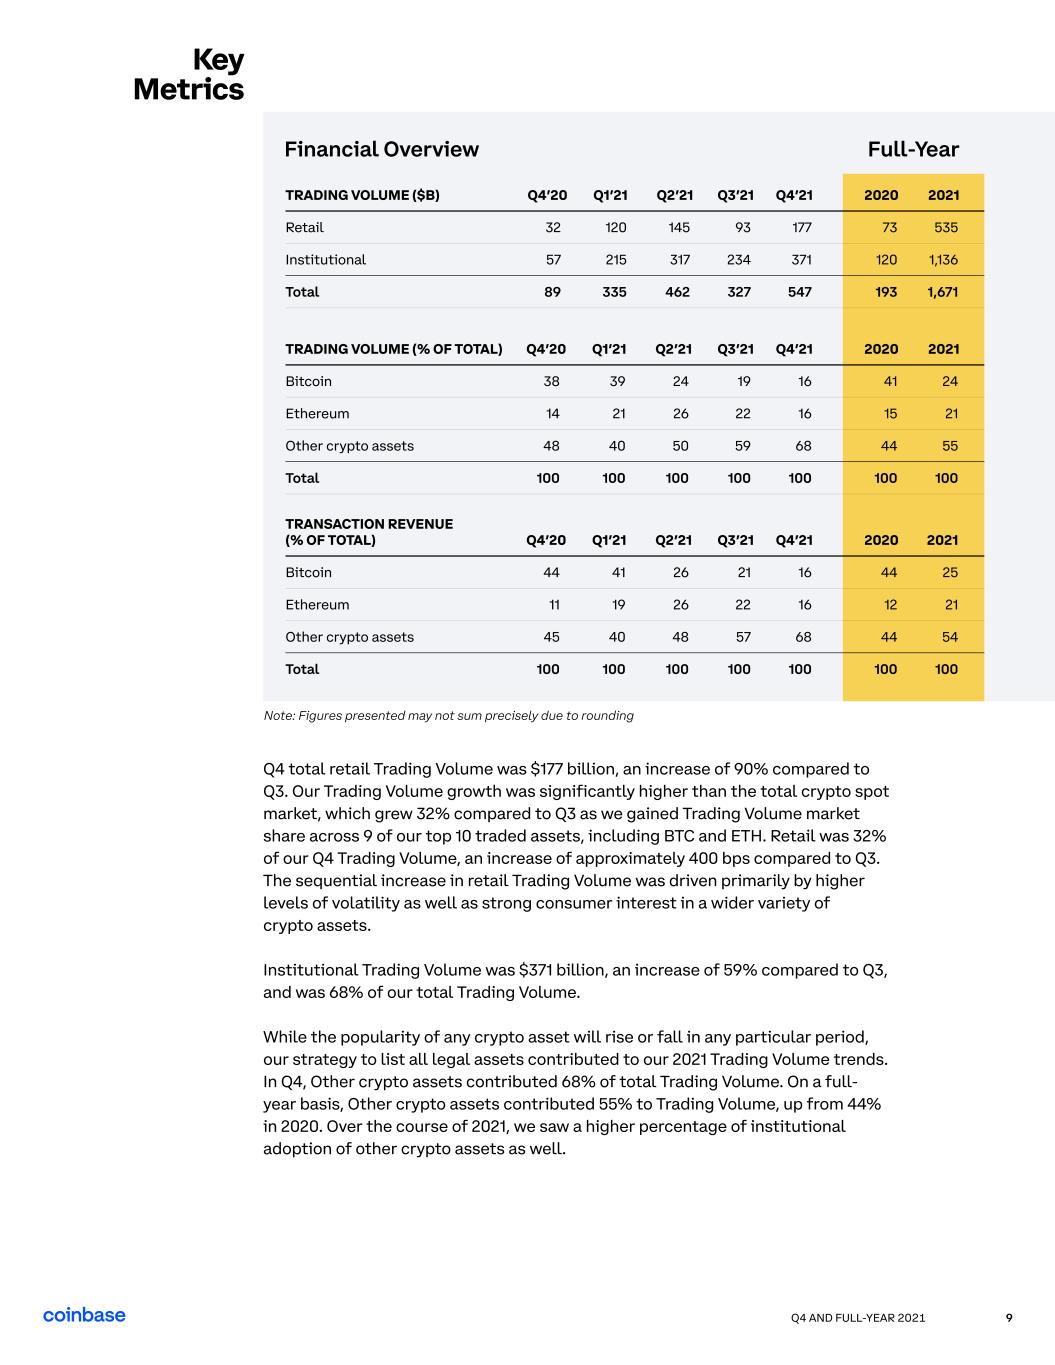
Q4 AND FULL-YEAR 2021 9 Q4 total retail Trading Volume was $177 billion, an increase of 90% compared to Q3. Our Trading Volume growth was significantly higher than the total crypto spot market, which grew 32% compared to Q3 as we gained Trading Volume market share across 9 of our top 10 traded assets, including BTC and ETH. Retail was 32% of our Q4 Trading Volume, an increase of approximately 400 bps compared to Q3. The sequential increase in retail Trading Volume was driven primarily by higher levels of volatility as well as strong consumer interest in a wider variety of
crypto assets. Institutional Trading Volume was $371 billion, an increase of 59% compared to Q3, and was 68% of our total Trading Volume. While the popularity of any crypto asset will rise or fall in any particular period, our strategy to list all legal assets contributed to our 2021 Trading Volume trends. In Q4, Other crypto assets contributed 68% of total Trading Volume. On a full- year basis, Other crypto assets contributed 55% to Trading Volume, up from 44% in 2020. Over the course of 2021, we saw a higher percentage of institutional adoption of other crypto assets as well. Key Metrics TRADING VOLUME ($B) Retail Institutional Total TRADING VOLUME (% OF TOTAL) Bitcoin Ethereum Other crypto assets Total TRANSACTION REVENUE
(% OF TOTAL) Bitcoin Ethereum Other crypto assets Total Q4’20 32 57 89 Q4’20 38 14 48 100 Q4’20 44 11 45 100 Q1’21 120 215 335 Q1’21 39 21 40 100 Q1’21 41 19 40 100 Q2’21 145 317 462 Q2’21 24 26 50 100 Q2’21 26 26 48 100 Q3’21 93 234 327 Q3’21 19 22 59 100 Q3’21 21 22 57 100 Q4’21 177 371 547 Q4’21 16 16 68 100 Q4’21 16 16 68 100 2020 73 120 193 2020 41 15 44 100 2020 44 12 44 100 2021 535 1,136 1,671 2021 24 21 55 100 2021 25 21 54 100 Financial Overview Full-Year Note: Figures presented may not sum precisely due to rounding
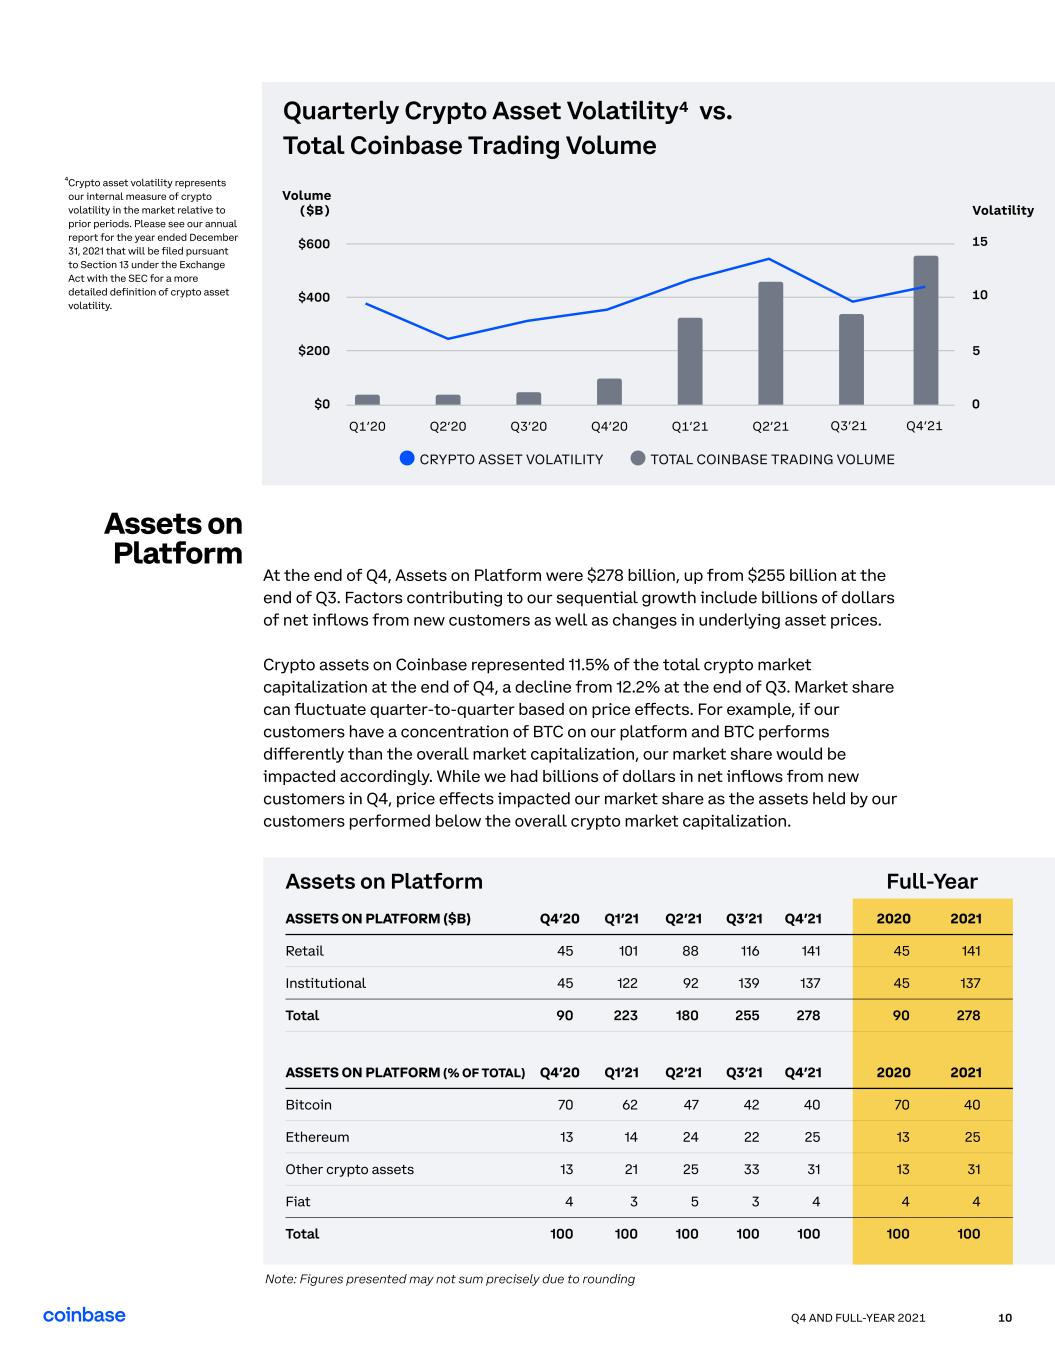
Q4 AND FULL-YEAR 2021 10 At the end of Q4, Assets on Platform were $278 billion, up from $255 billion at the end of Q3. Factors contributing to our sequential growth include billions of dollars of net inflows from new customers as well as changes in underlying asset prices. Crypto assets on Coinbase represented 11.5% of the total crypto market capitalization at the end of Q4, a decline from 12.2% at the end of Q3. Market share can fluctuate quarter-to-quarter based on price effects. For example, if our customers have a concentration of BTC on our platform and BTC performs differently than the overall market capitalization, our market share would be impacted accordingly. While we had billions of dollars in net inflows from new customers in Q4, price effects impacted our market share as the assets held by our customers performed below the overall crypto market capitalization. Assets on
Platform ASSETS ON PLATFORM ($B) Retail Institutional Total ASSETS ON PLATFORM (% OF TOTAL) Bitcoin Ethereum Other crypto assets Fiat Total Q4’20 45 45 90 Q4’20 4 70 13 13 100 Q1’21 101 122 223 3 Q1’21 62 14 21 100 Q3’21 116 139 255 3 Q3’21 42 22 33 100 Q4’21 141 137 278 4 Q4’21 40 25 31 100 2020 45 45 90 4 2020 70 13 13 100 2021 141 137 278 4 2021 40 25 31 100 Q2’21 88 92 180 5 Q2’21 47 24 25 100 Full-YearAssets on Platform Q2’21Q1’21Q4’20Q2’20 Q3’20Q1’20 Q3’21 Q4’21 Volume ($B) $600 $400 $200 15 Volatility 10 5 0$0 Quarterly Crypto Asset Volatility4 vs. Total Coinbase Trading Volume crypto asset volatility total Coinbase Trading volume Crypto asset volatility represents our internal measure of crypto volatility in the market relative to prior periods. Please see our annual report for the year ended December 31, 2021 that will be filed pursuant to Section 13 under the Exchange Act with the SEC for a more detailed definition of crypto asset volatility. 4 Note: Figures presented may not sum precisely due to rounding
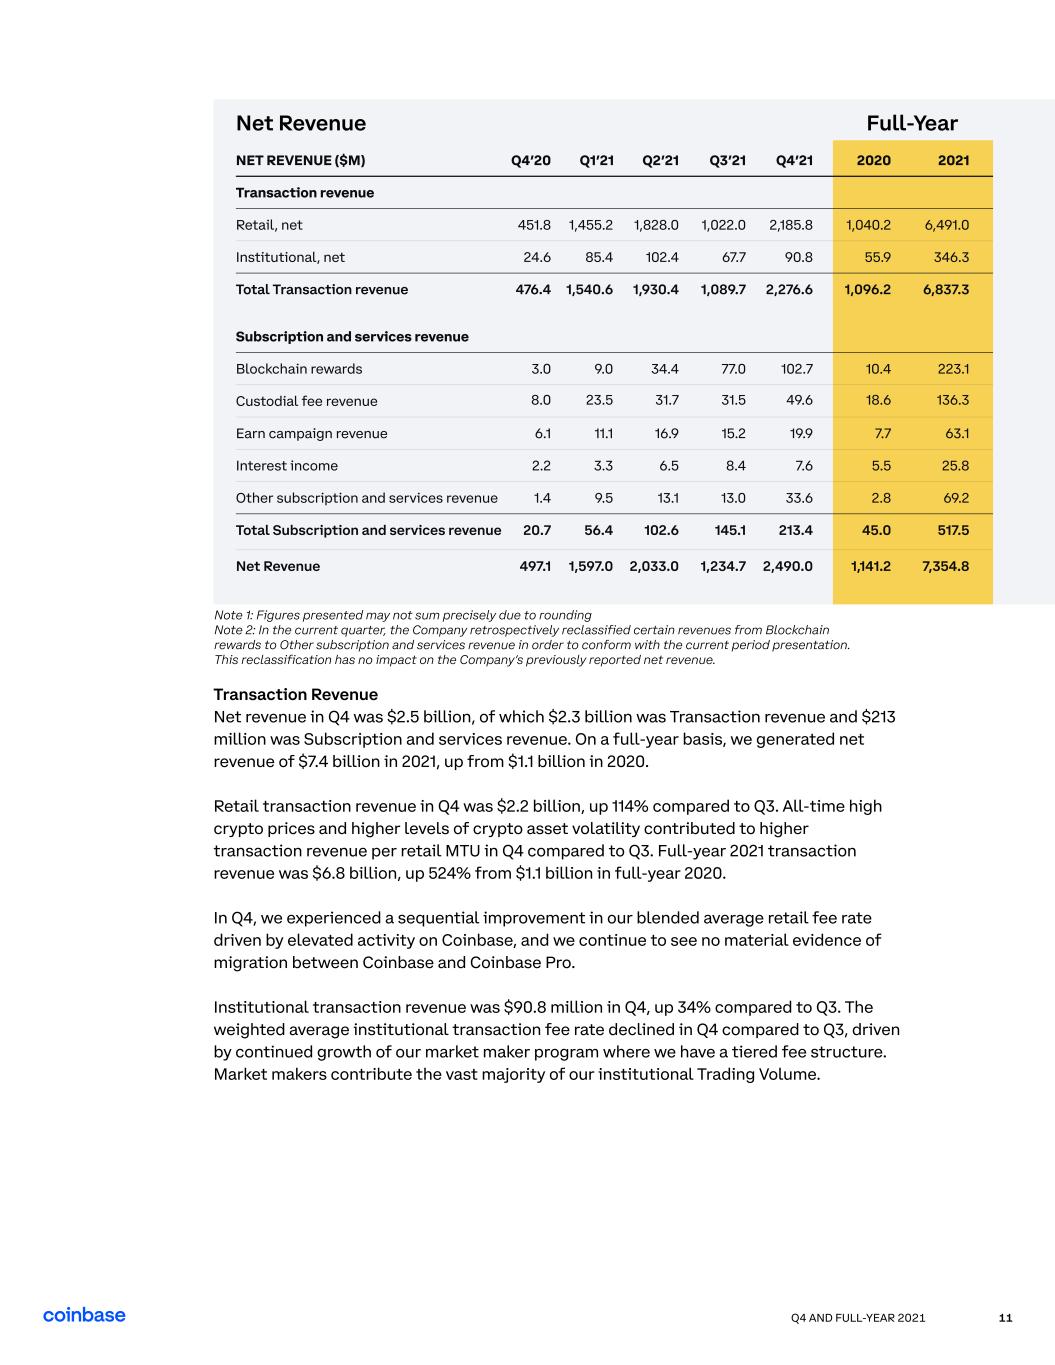
Q4 AND FULL-YEAR 2021 11 NET REVENUE ($M) Transaction revenue Retail, net Institutional, net Total Transaction revenue Subscription and services revenue Blockchain rewards Custodial fee revenue Interest income Earn campaign revenue Other subscription and services revenue Total Subscription and services revenue Net Revenue 451.8 24.6 476.4 3.0 2.2 Q4’20 8.0 6.1 1.4 20.7 497.1 1,455.2 85.4 1,540.6 9.0 3.3 Q1’21 23.5 11.1 9.5 56.4 1,597.0 1,828.0 102.4 1,930.4 34.4 6.5 Q2’21 31.7 16.9 13.1 102.6 2,033.0 1,022.0 67.7 1,089.7 77.0 8.4 Q3’21 31.5 15.2 13.0 145.1 1,234.7 2,185.8 90.8 2,276.6 102.7 7.6 Q4’21 49.6 19.9 33.6 213.4 2,490.0 1,040.2 55.9 1,096.2 10.4 5.5 2020 18.6 7.7 2.8 45.0 1,141.2 6,491.0 346.3 6,837.3 223.1 25.8 2021 136.3 63.1 69.2 517.5 7,354.8 Full-YearNet Revenue Transaction Revenue Net revenue in Q4 was $2.5 billion, of which $2.3 billion was Transaction revenue and $213 million was Subscription and services revenue. On a full-year basis, we generated net revenue of $7.4 billion in 2021, up from $1.1 billion in 2020. Retail transaction revenue in Q4 was $2.2 billion, up 114% compared to Q3. All-time high crypto prices and higher levels of crypto asset volatility contributed to higher transaction revenue per retail MTU in Q4 compared to Q3. Full-year 2021 transaction revenue was $6.8 billion, up 524% from $1.1 billion in full-year 2020. In Q4, we experienced a sequential improvement in our blended average retail fee rate driven by elevated activity on Coinbase, and we continue to see no material evidence of migration between Coinbase and Coinbase Pro. Institutional transaction revenue was $90.8 million in Q4, up 34% compared to Q3. The weighted average institutional transaction fee rate declined in Q4 compared to Q3, driven by continued growth of our market maker program where we have a tiered fee structure. Market makers contribute the vast majority of our institutional Trading Volume. Note 1: Figures presented may not sum precisely due to rounding
Note 2: In the current quarter, the Company retrospectively reclassified certain revenues from Blockchain rewards to Other subscription and services revenue in order to conform with the current period presentation. This reclassification has no impact on the Company’s previously reported net revenue.
Q4 AND FULL-YEAR 2021 12 Subscription and Services Revenue Subscription and services revenue was $213.4 million in Q4, up 47% compared to Q3. On a full-year basis, Subscription and services revenues were $517 million in 2021, an increase of over 10x from $45 million in full-year 2020. While these revenues are subject to movements in crypto asset prices, most are recurring by nature as compared to transaction revenues and therefore provide incremental stability to our revenue base as they grow. Blockchain rewards revenue was $102.7 million in Q4, up 33% compared to Q3. Growth was largely driven by staking – notably ETH2 – which comprises the majority of our staked assets. Interest in ETH2 staking for institutional clients remains high, and we intend to make that capability available later this year. Custodial fee revenue was $49.6 million in Q4, up 58% from Q3. The primary factor driving the sequential increase was higher average crypto asset prices in Q4 compared to Q3. In addition, we continued to see billions of dollars of net inflows from new customers. On a full-year basis, we generated $136.3 million of Custodial fee revenue in 2021, up from $18.6 million in 2020. We added custody support for 72 assets throughout 2021 and more than doubled our custody customers in 2021 as more and more institutions choose Coinbase for our best-in-class storage solutions. Earn campaign revenues were $19.9 million in Q4, up 31% compared to Q3. Growth was driven by both an increase in retail MTUs that engaged with Earn campaigns and an increase in amounts allocated by asset issuers for distribution. As we continue to add more assets to our platform, we believe that our Earn program serves as a compelling channel for both new and seasoned users alike to learn about new assets and
earn rewards. Operating Expenses Total Q4 operating expenses were $1.6 billion, an increase of 55% compared to Q3. The increase was primarily driven by higher transaction expenses. Transaction expenses were $501.1 million in Q4, an increase of 154% compared to Q3. Transaction expenses are correlated to net revenues, which increased 102% in Q4 compared to Q3. In addition, we experienced higher miner fee expenses associated with high network congestion in Q4. Lastly, the increased adoption of ETH2 staking also contributed to transaction expense growth, which includes staking rewards paid to users. Technology and development expenses were $459.6 million in Q4, an increase of 29% compared to Q3, and were driven primarily by hiring to invest in our product innovation and platform infrastructure efforts. Sales and marketing expenses were $244.6 million in Q4, or approximately 10% of net revenue. We deployed higher levels of spend towards performance and brand marketing in Q4 in connection with stronger market conditions compared to Q3.
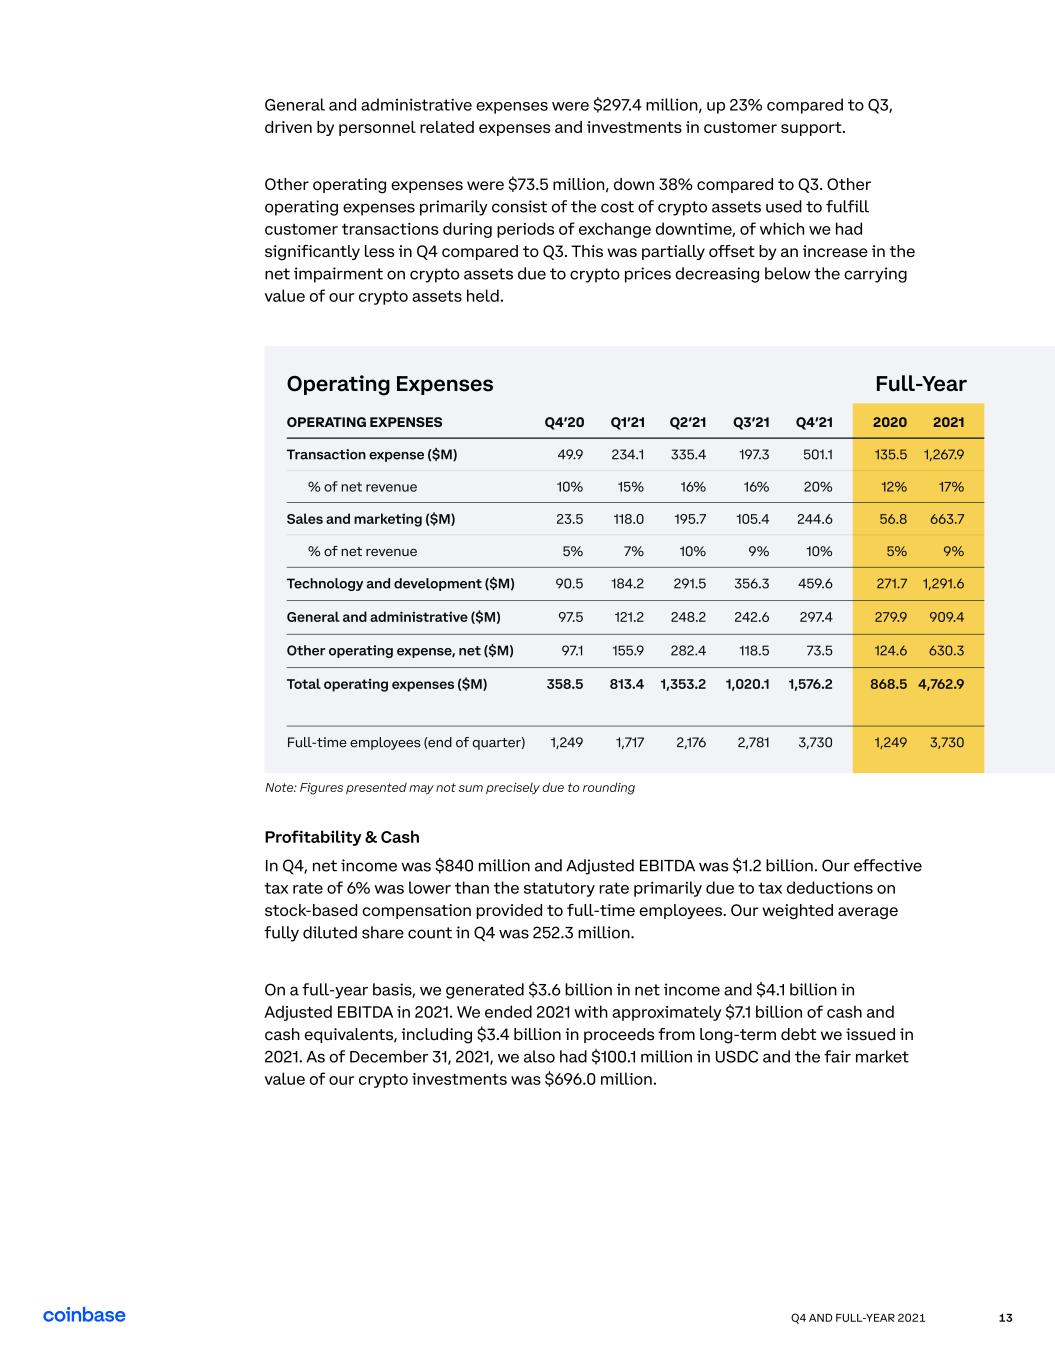
Q4 AND FULL-YEAR 2021 13 General and administrative expenses were $297.4 million, up 23% compared to Q3, driven by personnel related expenses and investments in customer support. Other operating expenses were $73.5 million, down 38% compared to Q3. Other operating expenses primarily consist of the cost of crypto assets used to fulfill customer transactions during periods of exchange downtime, of which we had significantly less in Q4 compared to Q3. This was partially offset by an increase in the net impairment on crypto assets due to crypto prices decreasing below the carrying value of our crypto assets held. OPERATING EXPENSES % of net revenue % of net revenue Technology and development ($M) Sales and marketing ($M) Transaction expense ($M) General and administrative ($M) Other operating expense, net ($M) Total operating expenses ($M) Full-time employees (end of quarter) 10% 90.5 23.5 5% 49.9 97.5 97.1 Q4’20 358.5 1,249 15% 184.2 118.0 7% 234.1 121.2 155.9 Q1’21 813.4 1,717 16% 356.3 105.4 9% 197.3 242.6 118.5 Q3’21 1,020.1 2,781 20% 459.6 244.6 10% 501.1 297.4 73.5 Q4’21 1,576.2 3,730 12% 271.7 56.8 5% 135.5 279.9 124.6 2020 868.5 1,249 17% 1,291.6 663.7 9% 1,267.9 909.4 630.3 2021 4,762.9 3,730 16% 291.5 195.7 10% 335.4 248.2 282.4 Q2’21 1,353.2 2,176 Full-YearOperating Expenses Profitability & Cash In Q4, net income was $840 million and Adjusted EBITDA was $1.2 billion. Our effective tax rate of 6% was lower than the statutory rate primarily due to tax deductions on stock-based compensation provided to full-time employees. Our weighted average fully diluted share count in Q4 was 252.3 million. On a full-year basis, we generated $3.6 billion in net income and $4.1 billion in Adjusted EBITDA in 2021. We ended 2021 with approximately $7.1 billion of cash and cash equivalents, including $3.4 billion in proceeds from long-term debt we issued in 2021. As of December 31, 2021, we also had $100.1 million in USDC and the fair market value of our crypto investments was $696.0 million. Note: Figures presented may not sum precisely due to rounding

Outlook Coinbase Shareholder Letter
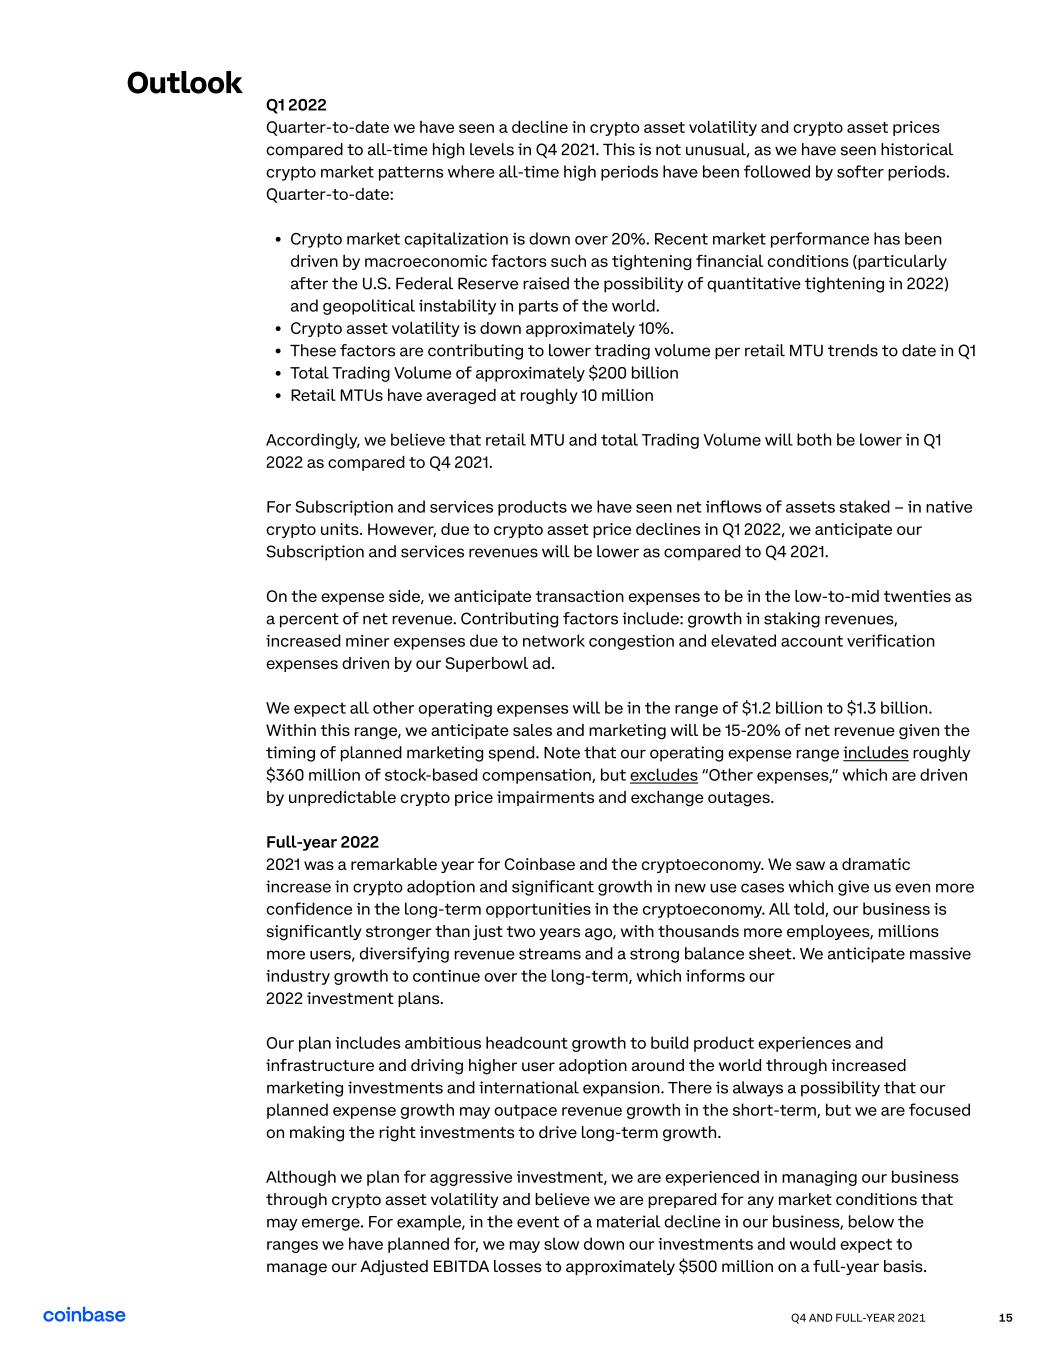
Q2 2021Q4 AND FULL-YEAR 15 Outlook Q1 2022 Quarter-to-date we have seen a decline in crypto asset volatility and crypto asset prices compared to all-time high levels in Q4 2021. This is not unusual, as we have seen historical crypto market patterns where all-time high periods have been followed by softer periods. Quarter-to-date: Crypto market capitalization is down over 20%. Recent market performance has been driven by macroeconomic factors such as tightening financial conditions (particularly after the U.S. Federal Reserve raised the possibility of quantitative tightening in 2022)
and geopolitical instability in parts of the world. Crypto asset volatility is down approximately 10% These factors are contributing to lower trading volume per retail MTU trends to date in Q Total Trading Volume of approximately $200 billio Retail MTUs have averaged at roughly 10 million Accordingly, we believe that retail MTU and total Trading Volume will both be lower in Q1 2022 as compared to Q4 2021. For Subscription and services products we have seen net inflows of assets staked – in native crypto units. However, due to crypto asset price declines in Q1 2022, we anticipate our Subscription and services revenues will be lower as compared to Q4 2021. On the expense side, we anticipate transaction expenses to be in the low-to-mid twenties as a percent of net revenue. Contributing factors include: growth in staking revenues, increased miner expenses due to network congestion and elevated account verification expenses driven by our Superbowl ad. We expect all other operating expenses will be in the range of $1.2 billion to $1.3 billion. Within this range, we anticipate sales and marketing will be 15-20% of net revenue given the timing of planned marketing spend. Note that our operating expense range includes roughly $360 million of stock-based compensation, but excludes “Other expenses,” which are driven by unpredictable crypto price impairments and exchange outages. Full-year 2022 2021 was a remarkable year for Coinbase and the cryptoeconomy. We saw a dramatic increase in crypto adoption and significant growth in new use cases which give us even more confidence in the long-term opportunities in the cryptoeconomy. All told, our business is significantly stronger than just two years ago, with thousands more employees, millions more users, diversifying revenue streams and a strong balance sheet. We anticipate massive industry growth to continue over the long-term, which informs our
2022 investment plans. Our plan includes ambitious headcount growth to build product experiences and infrastructure and driving higher user adoption around the world through increased marketing investments and international expansion. There is always a possibility that our planned expense growth may outpace revenue growth in the short-term, but we are focused on making the right investments to drive long-term growth. Although we plan for aggressive investment, we are experienced in managing our business through crypto asset volatility and believe we are prepared for any market conditions that may emerge. For example, in the event of a material decline in our business, below the ranges we have planned for, we may slow down our investments and would expect to manage our Adjusted EBITDA losses to approximately $500 million on a full-year basis.

Q4 AND FULL-YEAR 2021 16 We enter 2022 with even more unknowns which make our business all the more difficult to forecast. On one hand, in addition to the unpredictability of crypto asset prices and volatility, we also face global macroeconomic headwinds, rising interest rates, inflation, and more recently, geopolitical instability. On the other hand, global crypto adoption is accelerating and diversifying. We are seeing new and exciting use cases for crypto and more market participants helping grow the global cryptoeconomy. Coinbase Full-Year 2022 Outlook Metric Annual Average Retail MTUs Average Transaction Revenue Per User (ATRPU) Subscription and services Revenue Transaction Expenses
As a percentage of net revenue Sales and Marketing Expenses As a percentage of net revenue, including stock-based compensation Technology & Development + General & Administrative Expenses Including stock-based compensation 5.0 - 15.0 million Pre-2021 Levels Strong growth compared to 2021 Low 20%s 12-15% $4.25 - $5.25 billion Outlook This wider than normal set of factors results in a wider range of potential outcomes for 2022. Simply put, we have less near-term visibility, and it is currently too early to provide a more precise range. Most importantly, we are confident, experienced, and prepared to manage our business through either end of this range. Driven by ambitious plans to hire 6,000 employees in 2022, largely technology & development teams to execute on product innovation, international expansion, platform scaling and reliability. Additionally, we plan to migrate a portion of customer support from a vendor to employees which accounts for more than 1,500 of the planned hires, however we plan this to be roughly cost neutral. We expect over $1.5 billion of stock based compensation expenses of which, due to our vesting schedules, over 80% will be expensed in the first 3 quarters. Quarter-to-date in Q1 2022, ATRPU has trended closer to pre-2021 levels and we assume this trend will continue throughout 2022. See chart below for more details. Outlook assumes no material price effects Driven primarily by growth in in Blockchain Rewards revenue Increased brand marketing efforts, building on the momentum from our first ever Super Bowl ad in February 2022 Commentary Other Expenses Tax N/A High teens to low 20s We do not forecast these as they are driven by crypto asset price impairments and exchange outages. If crypto asset prices drop below our impaired value we recognize a non-cash impairment expense. In the event of meaningful strength or weakness in our business over the course of the year, our tax rate could trend lower or higher than this range.

Q4 AND FULL-YEAR 2021 17 2022 Average Transaction Revenue Per User (ATRPU) ATRPU fluctuates on a monthly basis due to crypto volatility. As a result, we focus on an annual ATRPU to smooth out short term volatility. Historically, our ATRPU has been driven by our investing product. Going forward, we plan to add to our product suite by investing in products like Coinbase Wallet and Coinbase NFT, as well as international expansion, which we believe will generate more MTUs, but likely have lower levels of ATRPU. 2017 2018 202120202019 $25 $50 $75 $100 0 Historical Transaction Revenue Per User4 Actuals ‘21 AVG.
($64) ‘17 AVG.
($55) ‘18 AVG.
($45) ‘19 AVG.
($34) ‘20 AVG.
($45) Calculated as Retail Transaction
Fee Revenue divided by Retail MTUs in each period. Annual averages reflect full-year Retail Transaction Fee Revenue divided by the average monthly Retail MTUs, divided by
12 months. Note : 2017 - 2018 data is unaudited. 4

8 Coinbase Shareholder Letter Q3 2021 Looking Ahead
Q4 AND FULL-YEAR 2021 19 Looking
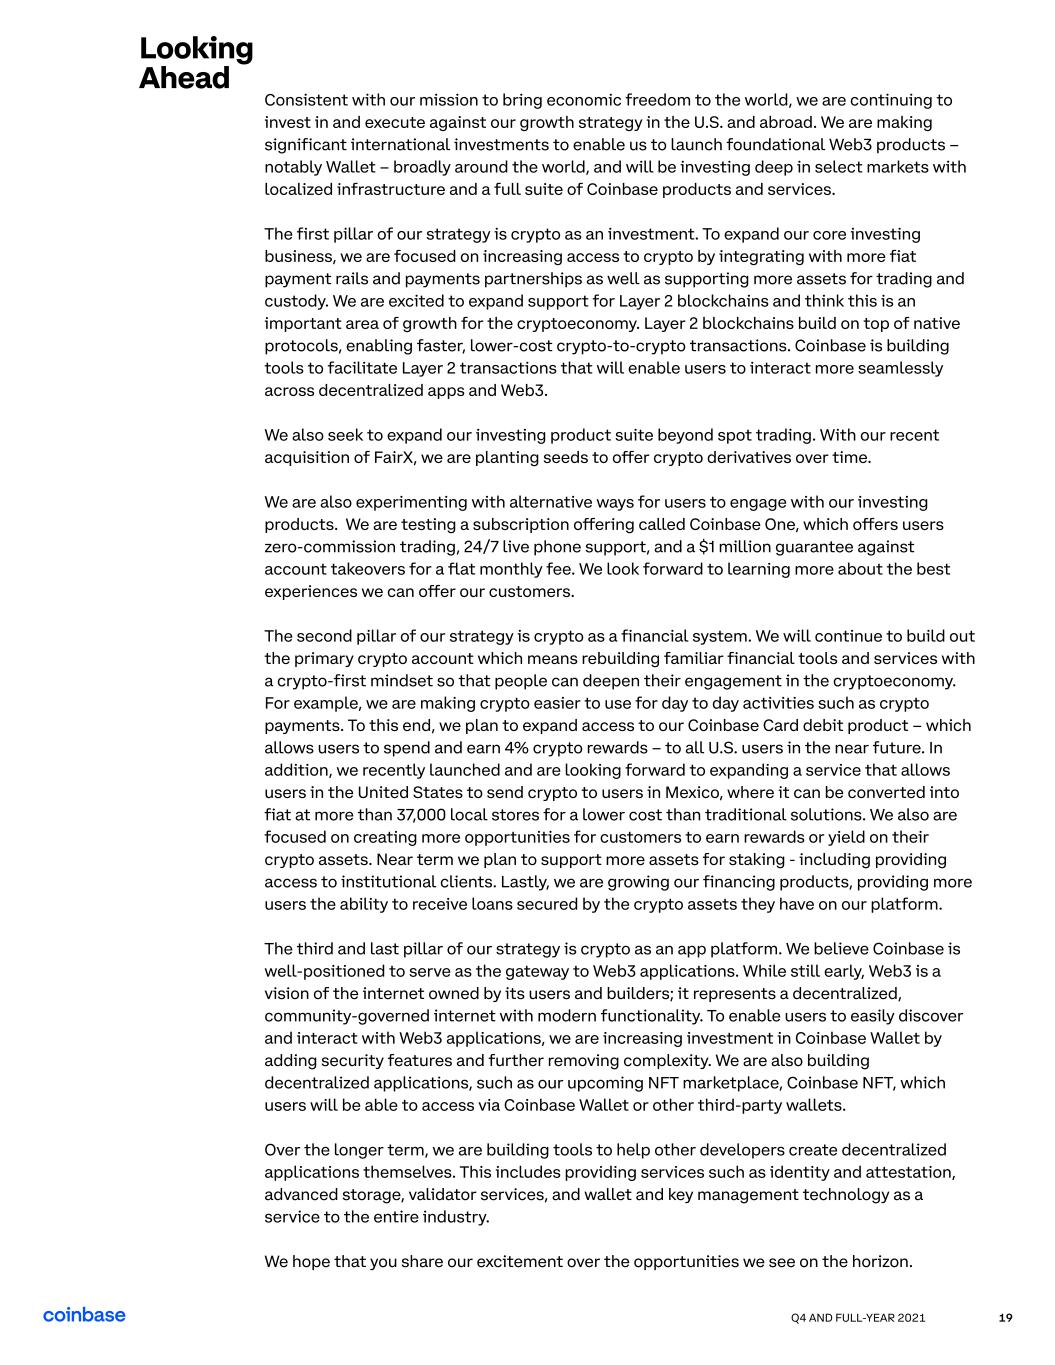
Ahead Consistent with our mission to bring economic freedom to the world, we are continuing to invest in and execute against our growth strategy in the U.S. and abroad. We are making significant international investments to enable us to launch foundational Web3 products – notably Wallet – broadly around the world, and will be investing deep in select markets with localized infrastructure and a full suite of Coinbase products and services. The first pillar of our strategy is crypto as an investment. To expand our core investing business, we are focused on increasing access to crypto by integrating with more fiat payment rails and payments partnerships as well as supporting more assets for trading and custody. We are excited to expand support for Layer 2 blockchains and think this is an important area of growth for the cryptoeconomy. Layer 2 blockchains build on top of native protocols, enabling faster, lower-cost crypto-to-crypto transactions. Coinbase is building tools to facilitate Layer 2 transactions that will enable users to interact more seamlessly across decentralized apps and Web3. We also seek to expand our investing product suite beyond spot trading. With our recent acquisition of FairX, we are planting seeds to offer crypto derivatives over time. We are also experimenting with alternative ways for users to engage with our investing products. We are testing a subscription offering called Coinbase One, which offers users zero-commission trading, 24/7 live phone support, and a $1 million guarantee against account takeovers for a flat monthly fee. We look forward to learning more about the best experiences we can offer our customers. The second pillar of our strategy is crypto as a financial system. We will continue to build out the primary crypto account which means rebuilding familiar financial tools and services with a crypto-first mindset so that people can deepen their engagement in the cryptoeconomy. For example, we are making crypto easier to use for day to day activities such as crypto payments. To this end, we plan to expand access to our Coinbase Card debit product – which allows users to spend and earn 4% crypto rewards – to all U.S. users in the near future. In addition, we recently launched and are looking forward to expanding a service that allows users in the United States to send crypto to users in Mexico, where it can be converted into fiat at more than 37,000 local stores for a lower cost than traditional solutions. We also are focused on creating more opportunities for customers to earn rewards or yield on their crypto assets. Near term we plan to support more assets for staking - including providing access to institutional clients. Lastly, we are growing our financing products, providing more users the ability to receive loans secured by the crypto assets they have on our platform. The third and last pillar of our strategy is crypto as an app platform. We believe Coinbase is well-positioned to serve as the gateway to Web3 applications. While still early, Web3 is a vision of the internet owned by its users and builders; it represents a decentralized, community-governed internet with modern functionality. To enable users to easily discover and interact with Web3 applications, we are increasing investment in Coinbase Wallet by adding security features and further removing complexity. We are also building decentralized applications, such as our upcoming NFT marketplace, Coinbase NFT, which users will be able to access via Coinbase Wallet or other third-party wallets. Over the longer term, we are building tools to help other developers create decentralized applications themselves. This includes providing services such as identity and attestation, advanced storage, validator services, and wallet and key management technology as a service to the entire industry. We hope that you share our excitement over the opportunities we see on the horizon.

Q4 AND FULL-YEAR 2021 20 This communication contains forward-looking statements within the meaning of the Private Securities Litigation Reform Act of 1995. All statements other than statements of historical fact are forward-looking statements. These statements include, but are not limited to, statements regarding our future operating results and financial position, including for our quarter ending March 31, 2022, anticipated future expenses and investments, expectations relating to certain of our key financial and operating metrics, our business strategy and plans, market growth, our market position and potential market opportunities, and our objectives for future operations. The words "believe," "may," "will," "estimate," "potential," "continue," "anticipate,'' "intend," "expect," "could," "would," "project," "plan," "target," and similar expressions are intended to identify forward-looking statements. Forward-looking statements are based on management's expectations, assumptions, and projections based on information available at the time the statements were made. These forward-looking statements are subject to a number of risks, uncertainties, and assumptions, including risks and uncertainties related to: our ability to successfully execute our business and growth strategy and maintain future profitability, market acceptance of our products and services, our ability to further penetrate our existing customer base and expand our customer base, our ability to develop new products and services, our ability to expand internationally, the success of any acquisitions or investments that we make, the effects of increased competition in our markets, our ability to stay in compliance with applicable laws and regulations, and market conditions across the cryptoeconomy. It is not possible for our management to predict all risks, nor can we assess the impact of all factors on our business or the extent to which any factor, or combination of factors, may cause actual results to differ materially from those contained in any forward- looking statements we may make. In light of these risks, uncertainties, and assumptions, our actual results could differ materially and adversely from those anticipated or implied in the forward-looking statements. Further information on risks that could cause actual results to differ materially from forecasted results are, or will be included in our filings with the Securities and Exchange Commission (SEC) including our Quarterly Report on Form 10-Q for the quarter ended September 30, 2021 and our Annual Report on Form 10-K for the year ended December 31, 2021 that will be filed with the SEC. Except as required by law, we assume no obligation to update these forward-looking statements, or to update the reasons if actual results differ materially from those anticipated in the forward-looking statements. Forward Looking Statements Webcast Information We will host a question and answer session to discuss the results for the fourth quarter and full-year of 2021 on February 24, 2022 at 2:30 pm PT. The live webcast of the call will be available on the Investor Relations section of Coinbase’s website at https://investor.coinbase.com. A replay of the call as well as a transcript will be available on the same website.
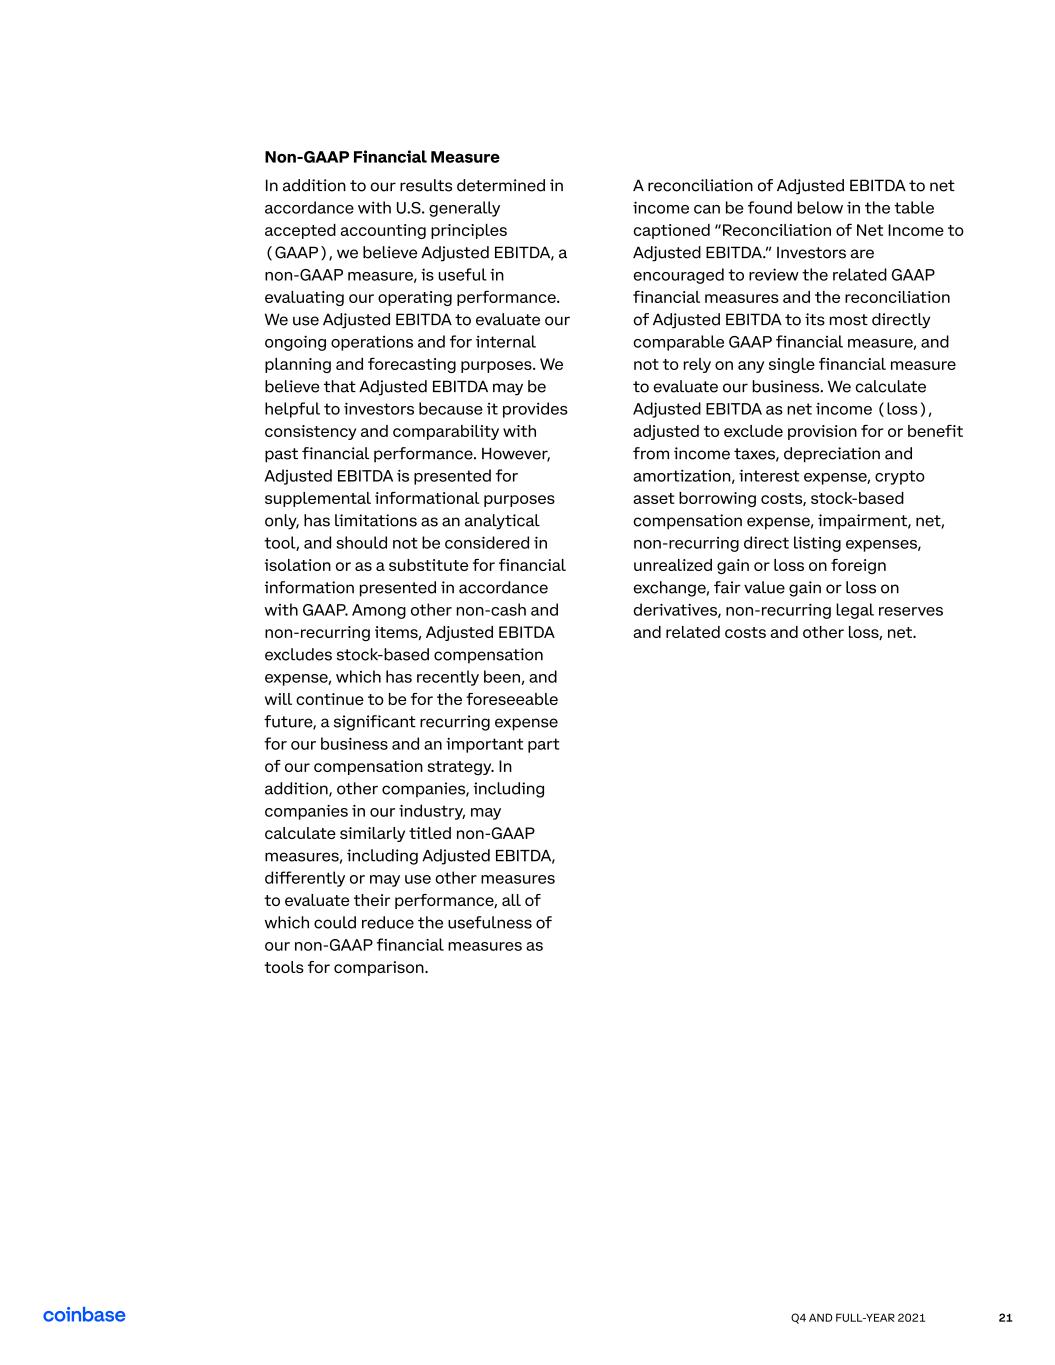
Q4 AND FULL-YEAR 2021 21 Non-GAAP Financial Measure In addition to our results determined in accordance with U.S. generally accepted accounting principles (GAAP), we believe Adjusted EBITDA, a non-GAAP measure, is useful in evaluating our operating performance. We use Adjusted EBITDA to evaluate our ongoing operations and for internal planning and forecasting purposes. We believe that Adjusted EBITDA may be helpful to investors because it provides consistency and comparability with past financial performance. However, Adjusted EBITDA is presented for supplemental informational purposes only, has limitations as an analytical tool, and should not be considered in isolation or as a substitute for financial information presented in accordance with GAAP. Among other non-cash and non-recurring items, Adjusted EBITDA excludes stock-based compensation expense, which has recently been, and will continue to be for the foreseeable future, a significant recurring expense for our business and an important part of our compensation strategy. In addition, other companies, including companies in our industry, may calculate similarly titled non-GAAP measures, including Adjusted EBITDA, differently or may use other measures to evaluate their performance, all of which could reduce the usefulness of our non-GAAP financial measures as tools for comparison. A reconciliation of Adjusted EBITDA to net income can be found below in the table captioned “Reconciliation of Net Income to Adjusted EBITDA.” Investors are encouraged to review the related GAAP financial measures and the reconciliation of Adjusted EBITDA to its most directly comparable GAAP financial measure, and not to rely on any single financial measure to evaluate our business. We calculate Adjusted EBITDA as net income (loss), adjusted to exclude provision for or benefit from income taxes, depreciation and amortization, interest expense, crypto asset borrowing costs, stock-based compensation expense, impairment, net, non-recurring direct listing expenses, unrealized gain or loss on foreign exchange, fair value gain or loss on derivatives, non-recurring legal reserves and related costs and other loss, net.
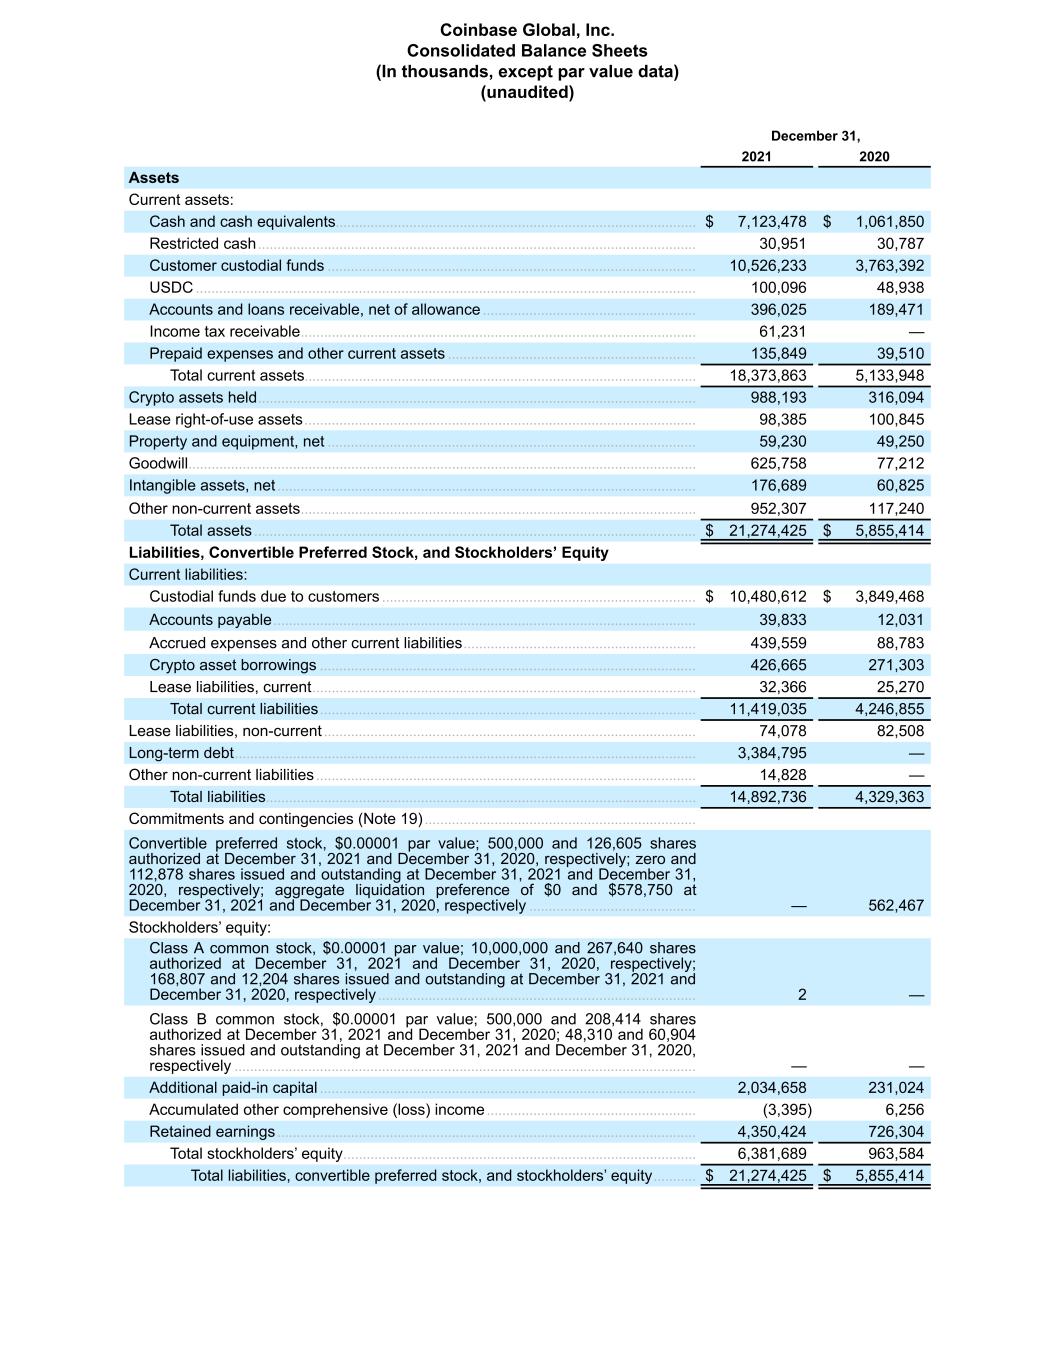
December 31, 2021 2020 Assets Current assets: Cash and cash equivalents ............................................................................................. $ 7,123,478 $ 1,061,850 Restricted cash ................................................................................................................. 30,951 30,787 Customer custodial funds ............................................................................................... 10,526,233 3,763,392 USDC ................................................................................................................................. 100,096 48,938 Accounts and loans receivable, net of allowance ....................................................... 396,025 189,471 Income tax receivable ...................................................................................................... 61,231 — Prepaid expenses and other current assets ................................................................ 135,849 39,510 Total current assets ..................................................................................................... 18,373,863 5,133,948 Crypto assets held ................................................................................................................. 988,193 316,094 Lease right-of-use assets ..................................................................................................... 98,385 100,845 Property and equipment, net ............................................................................................... 59,230 49,250 Goodwill ................................................................................................................................... 625,758 77,212 Intangible assets, net ............................................................................................................ 176,689 60,825 Other non-current assets ...................................................................................................... 952,307 117,240 Total assets .................................................................................................................. $ 21,274,425 $ 5,855,414 Liabilities, Convertible Preferred Stock, and Stockholders’ Equity Current liabilities: Custodial funds due to customers ................................................................................. $ 10,480,612 $ 3,849,468 Accounts payable ............................................................................................................. 39,833 12,031 Accrued expenses and other current liabilities ............................................................ 439,559 88,783 Crypto asset borrowings ................................................................................................. 426,665 271,303 Lease liabilities, current ................................................................................................... 32,366 25,270 Total current liabilities ................................................................................................. 11,419,035 4,246,855 Lease liabilities, non-current ................................................................................................ 74,078 82,508 Long-term debt ....................................................................................................................... 3,384,795 — Other non-current liabilities .................................................................................................. 14,828 — Total liabilities ............................................................................................................... 14,892,736 4,329,363 Commitments and contingencies (Note 19) ...................................................................... Convertible preferred stock, $0.00001 par value; 500,000 and 126,605 shares authorized at December 31, 2021 and December 31, 2020, respectively; zero and 112,878 shares issued and outstanding at December 31, 2021 and December 31, 2020, respectively; aggregate liquidation preference of $0 and $578,750 at December 31, 2021 and December 31, 2020, respectively ........................................... — 562,467 Stockholders’ equity: Class A common stock, $0.00001 par value; 10,000,000 and 267,640 shares authorized at December 31, 2021 and December 31, 2020, respectively; 168,807 and 12,204 shares issued and outstanding at December 31, 2021 and December 31, 2020, respectively .................................................................................. 2 — Class B common stock, $0.00001 par value; 500,000 and 208,414 shares authorized at December 31, 2021 and December 31, 2020; 48,310 and 60,904 shares issued and outstanding at December 31, 2021 and December 31, 2020, respectively ....................................................................................................................... — — Additional paid-in capital ................................................................................................. 2,034,658 231,024 Accumulated other comprehensive (loss) income ...................................................... (3,395) 6,256 Retained earnings ............................................................................................................ 4,350,424 726,304 Total stockholders’ equity ........................................................................................... 6,381,689 963,584 Total liabilities, convertible preferred stock, and stockholders’ equity ........... $ 21,274,425 $ 5,855,414 Coinbase Global, Inc. Consolidated Balance Sheets (In thousands, except par value data) (unaudited)
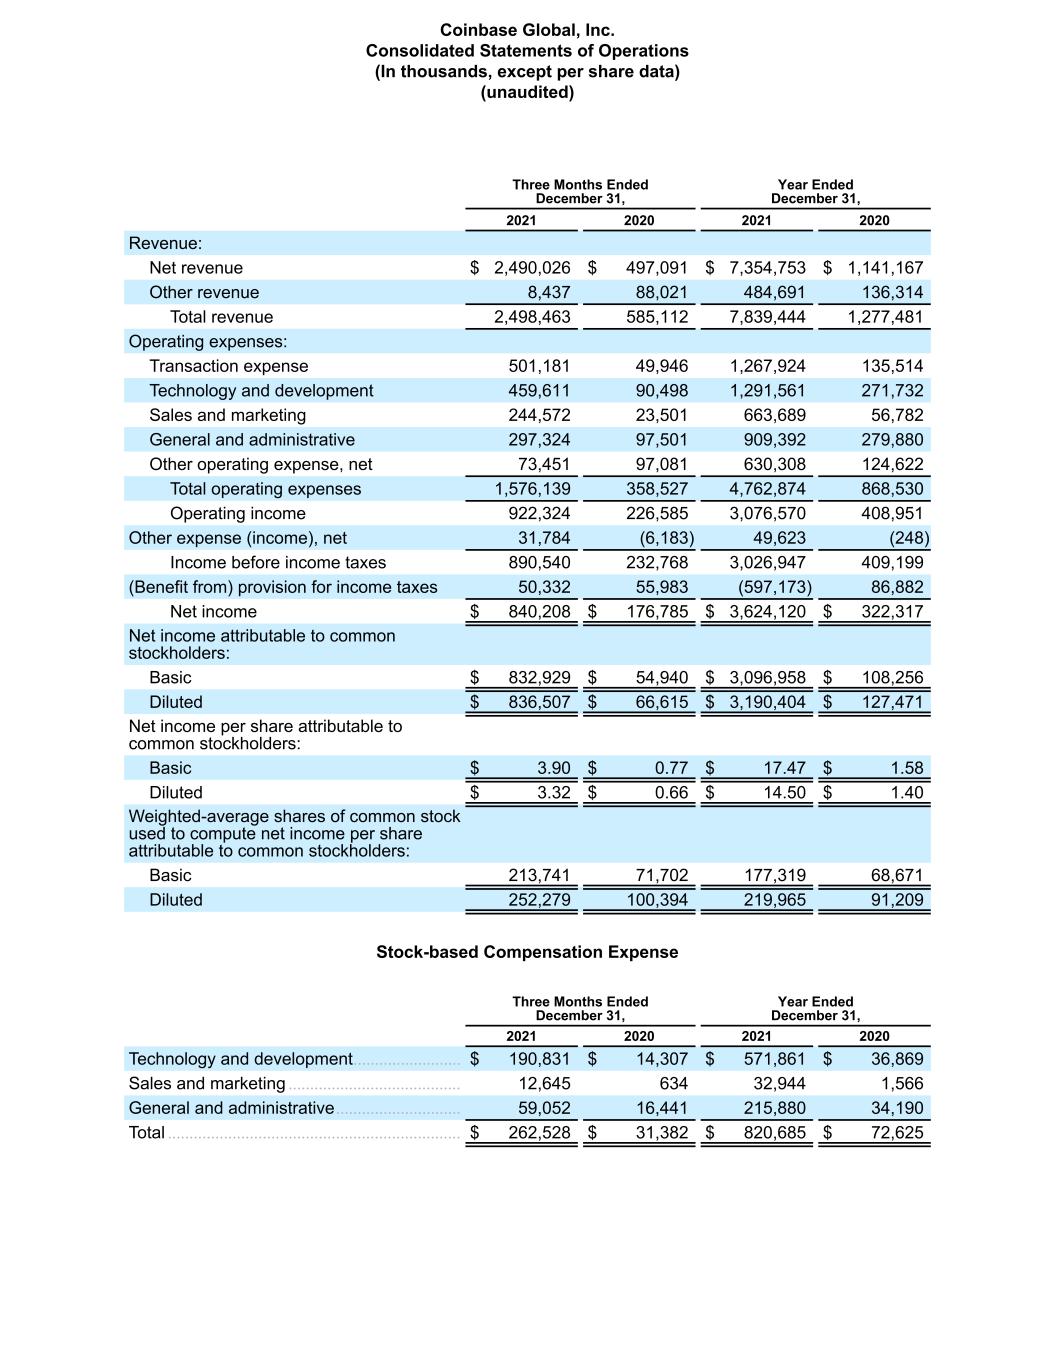
Three Months Ended December 31, Year Ended December 31, 2021 2020 2021 2020 Revenue: Net revenue $ 2,490,026 $ 497,091 $ 7,354,753 $ 1,141,167 Other revenue 8,437 88,021 484,691 136,314 Total revenue 2,498,463 585,112 7,839,444 1,277,481 Operating expenses: Transaction expense 501,181 49,946 1,267,924 135,514 Technology and development 459,611 90,498 1,291,561 271,732 Sales and marketing 244,572 23,501 663,689 56,782 General and administrative 297,324 97,501 909,392 279,880 Other operating expense, net 73,451 97,081 630,308 124,622 Total operating expenses 1,576,139 358,527 4,762,874 868,530 Operating income 922,324 226,585 3,076,570 408,951 Other expense (income), net 31,784 (6,183) 49,623 (248) Income before income taxes 890,540 232,768 3,026,947 409,199 (Benefit from) provision for income taxes 50,332 55,983 (597,173) 86,882 Net income $ 840,208 $ 176,785 $ 3,624,120 $ 322,317 Net income attributable to common stockholders: Basic $ 832,929 $ 54,940 $ 3,096,958 $ 108,256 Diluted $ 836,507 $ 66,615 $ 3,190,404 $ 127,471 Net income per share attributable to common stockholders: Basic $ 3.90 $ 0.77 $ 17.47 $ 1.58 Diluted $ 3.32 $ 0.66 $ 14.50 $ 1.40 Weighted-average shares of common stock used to compute net income per share attributable to common stockholders: Basic 213,741 71,702 177,319 68,671 Diluted 252,279 100,394 219,965 91,209 Stock-based Compensation Expense Three Months Ended December 31, Year Ended December 31, 2021 2020 2021 2020 Technology and development ......................... $ 190,831 $ 14,307 $ 571,861 $ 36,869 Sales and marketing ........................................ 12,645 634 32,944 1,566 General and administrative ............................. 59,052 16,441 215,880 34,190 Total .................................................................... $ 262,528 $ 31,382 $ 820,685 $ 72,625 Coinbase Global, Inc. Consolidated Statements of Operations (In thousands, except per share data) (unaudited)

Cash flows from operating activities Net income ............................................................................................................. $ 3,624,120 $ 322,317 Adjustments to reconcile net income to net cash provided by operating activities Depreciation and amortization ....................................................................... 63,651 30,962 Impairment expense ........................................................................................ 329,652 8,355 Stock-based compensation expense ............................................................ 820,685 70,548 Provision for transaction losses and doubtful accounts ............................ 22,390 (2,966) Loss on disposal of property and equipment .............................................. 1,425 355 Deferred income taxes .................................................................................... (558,329) 474 Unrealized (gain) loss on foreign exchange ................................................ (14,944) 1,057 Non-cash lease expense ................................................................................ 34,542 25,012 Change in fair value of contingent consideration ........................................ (924) 3,281 Realized gain on crypto assets ...................................................................... (178,234) (23,682) Crypto assets received as revenue .............................................................. (1,015,920) (94,158) Crypto asset payments for expenses ........................................................... 815,783 40,205 Fair value (gain) loss on derivatives ............................................................. (32,056) 5,254 Amortization of debt discount and issuance costs ..................................... 5,031 — (Gain) loss on investments ............................................................................. (20,138) 150 Changes in operating assets and liabilities: USDC ................................................................................................................. (77,471) 37,936 Accounts and loans receivable ...................................................................... (8,016) (157,156) Income taxes, net ............................................................................................ (62,145) 86,791 Other current and non-current assets .......................................................... (20,060) (48,677) Custodial funds due to customers ................................................................. 6,691,859 2,710,522 Accounts payable ............................................................................................ 27,330 6,090 Lease liabilities ................................................................................................. (20,596) (24,998) Other current and non-current liabilities ....................................................... 302,396 6,398 Net cash provided by operating activities ........................................................... 10,730,031 3,004,070 Cash flows from investing activities Purchase of property and equipment .............................................................. (2,910) (9,913) Proceeds from sale of property and equipment ............................................ 31 — Capitalized internal-use software development costs .................................. (22,073) (8,889) Business combination, net of cash acquired ................................................. (70,911) 33,615 Purchase of investments ................................................................................... (326,513) (10,329) Purchase of assembled workforce .................................................................. (60,800) — Proceeds from settlement of investments ...................................................... 5,159 303 Purchase of crypto assets held ........................................................................ (3,009,086) (528,080) Disposal of crypto assets held ......................................................................... 2,574,032 574,115 Loans originated ................................................................................................. (336,189) — Proceeds from repayment of loans ................................................................. 124,520 — Net cash (used in) provided by investing activities ............................................ (1,124,740) 50,822 Year Ended December 31, 2021 2020 Coinbase Global, Inc. Consolidated Statements of Cash Flows (In thousands) (unaudited)
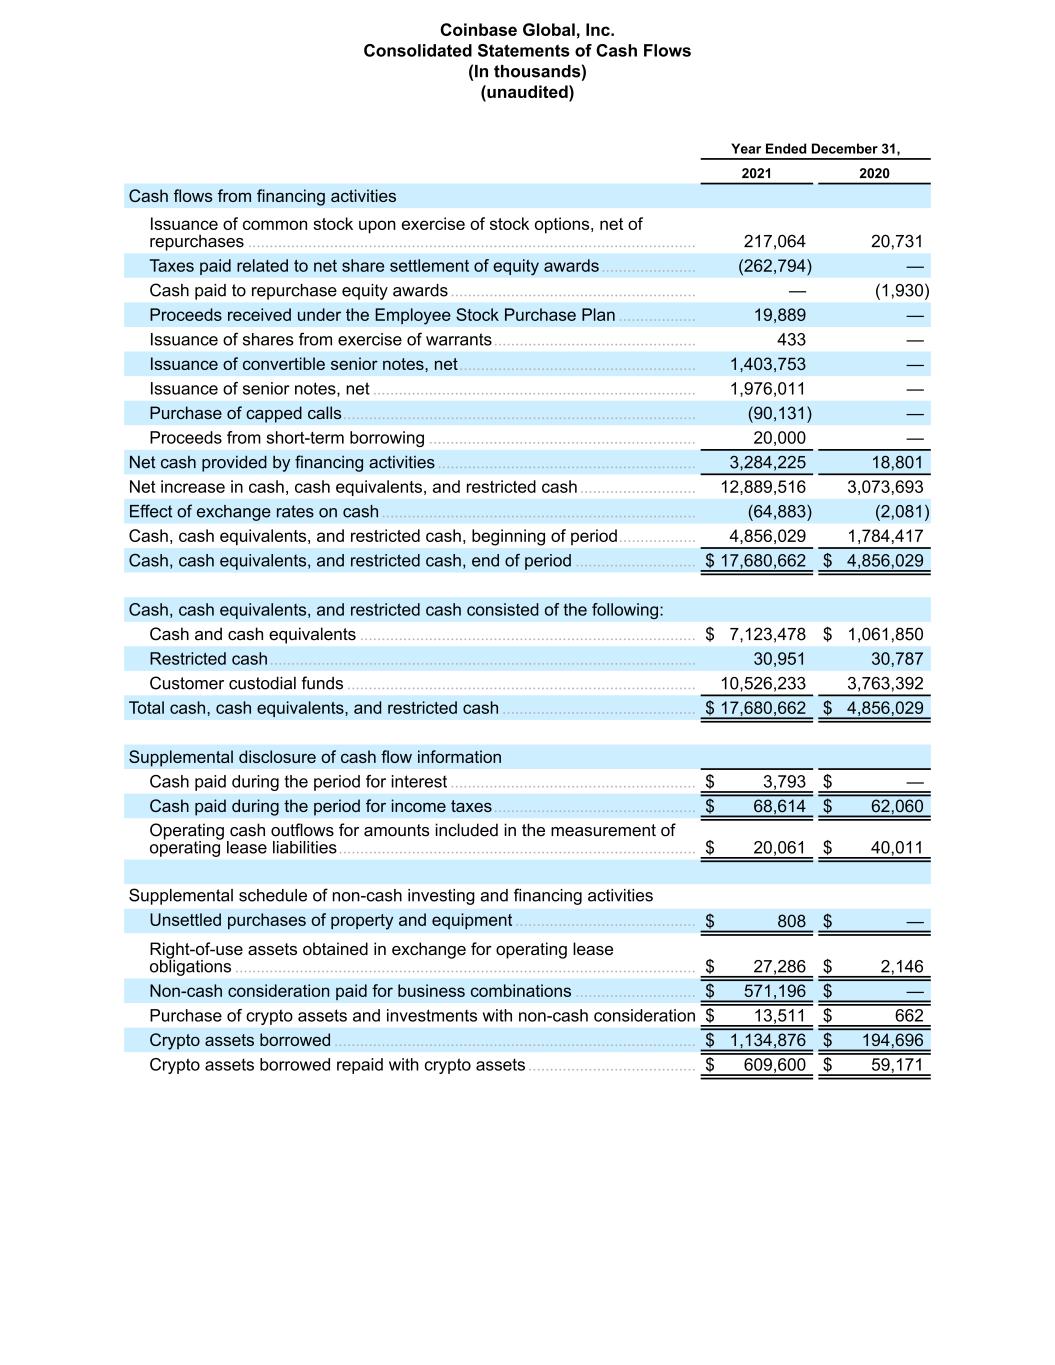
Cash flows from financing activities Issuance of common stock upon exercise of stock options, net of repurchases ........................................................................................................ 217,064 20,731 Taxes paid related to net share settlement of equity awards ...................... (262,794) — Cash paid to repurchase equity awards ......................................................... — (1,930) Proceeds received under the Employee Stock Purchase Plan .................. 19,889 — Issuance of shares from exercise of warrants ............................................... 433 — Issuance of convertible senior notes, net ....................................................... 1,403,753 — Issuance of senior notes, net ........................................................................... 1,976,011 — Purchase of capped calls .................................................................................. (90,131) — Proceeds from short-term borrowing .............................................................. 20,000 — Net cash provided by financing activities ............................................................ 3,284,225 18,801 Net increase in cash, cash equivalents, and restricted cash ........................... 12,889,516 3,073,693 Effect of exchange rates on cash ......................................................................... (64,883) (2,081) Cash, cash equivalents, and restricted cash, beginning of period .................. 4,856,029 1,784,417 Cash, cash equivalents, and restricted cash, end of period ............................ $ 17,680,662 $ 4,856,029 Cash, cash equivalents, and restricted cash consisted of the following: Cash and cash equivalents .............................................................................. $ 7,123,478 $ 1,061,850 Restricted cash ................................................................................................... 30,951 30,787 Customer custodial funds ................................................................................. 10,526,233 3,763,392 Total cash, cash equivalents, and restricted cash ............................................. $ 17,680,662 $ 4,856,029 Supplemental disclosure of cash flow information Cash paid during the period for interest ......................................................... $ 3,793 $ — Cash paid during the period for income taxes ............................................... $ 68,614 $ 62,060 Operating cash outflows for amounts included in the measurement of operating lease liabilities ................................................................................... $ 20,061 $ 40,011 Supplemental schedule of non-cash investing and financing activities Unsettled purchases of property and equipment .......................................... $ 808 $ — Right-of-use assets obtained in exchange for operating lease obligations ........................................................................................................... $ 27,286 $ 2,146 Non-cash consideration paid for business combinations ............................ $ 571,196 $ — Purchase of crypto assets and investments with non-cash consideration $ 13,511 $ 662 Crypto assets borrowed .................................................................................... $ 1,134,876 $ 194,696 Crypto assets borrowed repaid with crypto assets ....................................... $ 609,600 $ 59,171 Year Ended December 31, 2021 2020 Coinbase Global, Inc. Consolidated Statements of Cash Flows (In thousands) (unaudited)
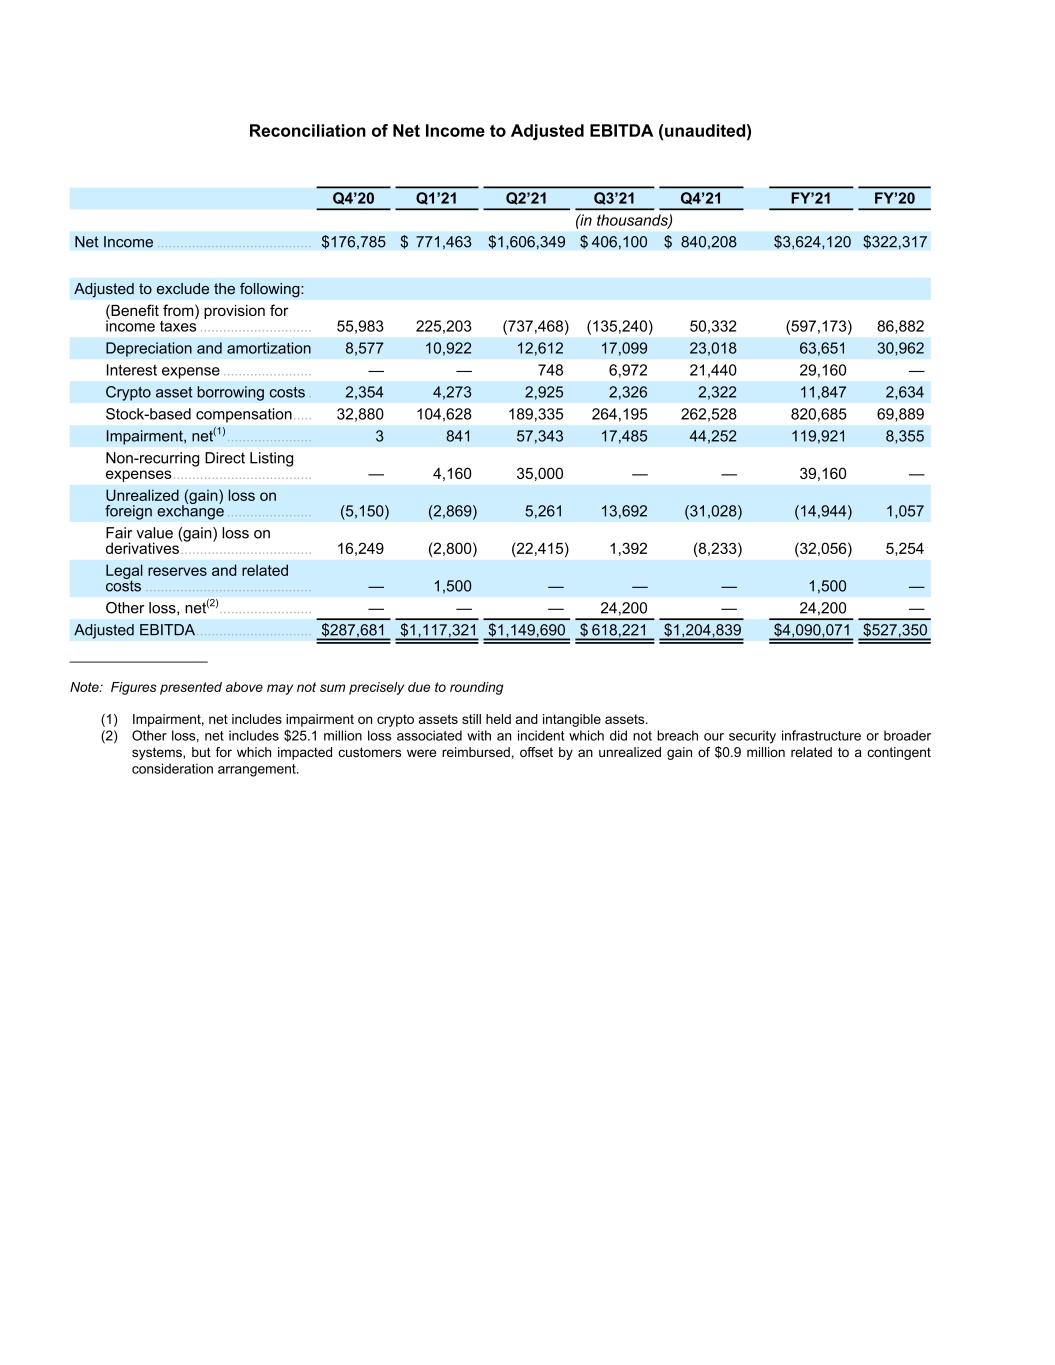
Reconciliation of Net Income to Adjusted EBITDA (unaudited) Q4’20 Q1’21 Q2’21 Q3’21 Q4’21 FY’21 FY’20 (in thousands) Net Income ........................................ $ 176,785 $ 771,463 $ 1,606,349 $ 406,100 $ 840,208 $ 3,624,120 $ 322,317 Adjusted to exclude the following: (Benefit from) provision for income taxes ............................. 55,983 225,203 (737,468) (135,240) 50,332 (597,173) 86,882 Depreciation and amortization 8,577 10,922 12,612 17,099 23,018 63,651 30,962 Interest expense ....................... — — 748 6,972 21,440 29,160 — Crypto asset borrowing costs . 2,354 4,273 2,925 2,326 2,322 11,847 2,634 Stock-based compensation ..... 32,880 104,628 189,335 264,195 262,528 820,685 69,889 Impairment, net(1) ...................... 3 841 57,343 17,485 44,252 119,921 8,355 Non-recurring Direct Listing expenses .................................... — 4,160 35,000 — — 39,160 — Unrealized (gain) loss on foreign exchange ...................... (5,150) (2,869) 5,261 13,692 (31,028) (14,944) 1,057 Fair value (gain) loss on derivatives .................................. 16,249 (2,800) (22,415) 1,392 (8,233) (32,056) 5,254 Legal reserves and related costs ........................................... — 1,500 — — — 1,500 — Other loss, net(2) ........................ — — — 24,200 — 24,200 — Adjusted EBITDA .............................. $ 287,681 $ 1,117,321 $ 1,149,690 $ 618,221 $ 1,204,839 $ 4,090,071 $ 527,350 __________________ Note: Figures presented above may not sum precisely due to rounding (1) Impairment, net includes impairment on crypto assets still held and intangible assets. (2) Other loss, net includes $25.1 million loss associated with an incident which did not breach our security infrastructure or broader systems, but for which impacted customers were reimbursed, offset by an unrealized gain of $0.9 million related to a contingent consideration arrangement.


