As filed with the Securities and Exchange Commission on September 7, 2023
UNITED STATES
SECURITIES AND EXCHANGE COMMISSION
Washington, D.C. 20549
FORM N-CSR
CERTIFIED SHAREHOLDER REPORT OF REGISTERED
MANAGEMENT INVESTMENT COMPANIES
Investment Company Act file number 811-23175
MATRIX ADVISORS FUNDS TRUST
(Exact name of registrant as specified in charter)
10 Bank Street, Suite 590, White Plains, NY 10606
(Address of principal executive offices) (Zip code)
David A. Katz
10 Bank Street, Suite 590
White Plains, NY 10606
(Name and address of agent for service)
1(800) 366-6223
Registrant's telephone number, including area code
Date of fiscal year end: June 30
Date of reporting period: June 30, 2023
Item 1. Reports to Stockholders.
(a)
MATRIX ADVISORS
DIVIDEND FUND
10 Bank Street, Suite 590 • White Plains, NY 10606 • Tel. (212) 486-2004 • Fax (212) 486-1822
August 1, 2023
Dear Fellow Shareholder:
After a very good relative year in 2022, defending well in the market's sharp decline, the Matrix Advisors Dividend Fund performance declined by -0.14% in the second quarter and -1.65% for the first six months of 2023, underperforming the S&P 500® and Russell 1000 Value® Indexes in both periods.
Very few of the mega-cap technology stocks that have driven the market in 2023 are dividend payers and thus are not candidates for inclusion in the Fund's dividend income strategy.
Disclosure Note:
For your information, for the period ended June 30, 2023, the Fund's average annual total returns for the one and five year and for the periods from October 13, 2016, the inception of Matrix Asset Advisors' involvement with the Fund was +3.17%, +9.77% and +7.48%, respectively. For the same periods, the return for the S&P 500® Index was +19.59%, +14.60% and +12.31%. For the same periods, the return for the Russell 1000® Value Index was +11.54%. + 14.30% and +8.11%.
Gross Expense Ratio: | | | 1.23 | % | |
Net Expense Ratio: | | | 0.90 | %** | |
Performance data quoted represents past performance; past performance does not guarantee future results. The investment return and principal value of an investment will fluctuate so that an investor's shares, when redeemed, may be worth less than their original cost. Current performance of the Fund may be lower or higher than the performance quoted. Performance data current to the most recent month end may be obtained by calling 800-366-6223 or by visiting www.matrixadvisorsvaluefund.com. Please see the Financial Highlights in this report for the most recent expense ratio.
** The Advisor has contractually agreed to reduce fees through 10/31/23.
Investment performance reflects fee waivers in effect. In the absence of such waivers, total return would be reduced. Matrix Asset Advisors became the sub-advisor on July 1, 1996, and Advisor to the Fund on May 11, 1997. Prior to those dates, the Fund was managed by another advisor.
The Fund's Net Asset Value on 6/30/23 was $26.61.
For the fiscal year (7/1/22 - 6/30/23), the Fund was up +3.17% versus the S&P 500® Index's gain of +19.59% and the Russell 1000 Value®'s gain of +11.54%. This modest increase vs. the indexes gave back our strong relative advantage in the previous fiscal year.
Dividend strategies in aggregate have struggled year-to-date through June 30, and are flat to down modestly1. According to Ned Davis Research, the past six months have been the worst first-half performance for dividend payers relative to nonpayers since 20092. We believe this significant short-term lag is likely to be followed by an equally powerful reversal and catch-up period for dividend payors and the Fund.
1
MATRIX ADVISORS
DIVIDEND FUND
During the second quarter, we added a new position in Pfizer, a leading global pharmaceutical company. The company is in a transition from a Covid to a post-Covid world with revenues and earnings expected to grow again in 2024 after declining in 2023. The company's stock price stock peaked at more than $61 in December 2021. Now below $40, Pfizer's valuation is attractive at 11 times earnings with a healthy and sustainable 4.4% dividend yield. We sold out of the position in Coca-Cola to fund a more attractive opportunity in General Dynamics.
In the second quarter, four of our companies increased their dividends with an average raise of 7.4%. For the first six months of the year, 12 of our portfolio holdings increased their dividends by 6.7%.
While the Fund's performance has been frustrating so far this year, the underlying operations, cash flows, and fundamentals of the companies within are strong and valuations are very attractive with average P/E multiples of 16.2x and 14.4x estimated 2023 and 2024 earnings on June 30, discounts compared to the S&P 500 Index's 20.3x and 18.1x. The median P/E is at an even more compelling 13.7x and 12.3x 2023 and 2024 estimated earnings.
This leads us to be upbeat about the Fund's prospects for the balance of the year. Its portfolio should rebound strongly as the market rally broadens. Insiders seem to agree, with 28% of the positions in the portfolio showing healthy levels of insider buying (as of June 30, 2023).
Matrix partners and associates are among the Fund's largest shareholders and our interests are directly aligned with yours. We thank you for your continued support and confidence in the Fund.
Sincerely,

David A. Katz, CFA
Fund Manager
Past performance is not a guarantee of future results.
Earnings growth is not representative of the Fund's future performance.
Please refer to the Schedule of Investments in this report for details on Fund holdings. Fund holdings are subject to change at any time and are not recommendations to buy or sell any security.
The information provided herein represents the opinion of the Matrix Advisors Dividend Fund management and is not intended to be a forecast of future events, a guarantee of future results, nor investment advice.
The S&P 500® Index is a broad-based unmanaged index of 500 stocks, which is widely recognized as representative of the equity market in general. You cannot invest directly in an index.
The Russell 1000® Value Index measures the performance of those Russell 1000® Index companies with lower price-to-book ratios and lower forecasted growth values. You cannot invest directly in an index.
1 Source: VMY Equity return was down -0.47% and the SDY Equity return was down -0.78% YTD through June 30, 2023.
2 Source: WSJ, July 2, 2023, Investors Spurn Dividend Paying Stocks as AI Booms.
2
MATRIX ADVISORS
DIVIDEND FUND
Vanguard High Yield Dividend ETF (VMY) High Dividend Yield Index Fund seeks to track the performance of a benchmark index that measures the investment return of common stocks of companies that are characterized by high dividend yields.
SPDR S&P Dividend ETF (SDY) designed to measure the performance of the highest dividend yielding S&P Composite 1500® Index constituents that have followed a managed-dividends policy of consistently increasing dividends every year for at least 20 consecutive years.
Dividend yield refers to a stock's annual dividend payments to shareholders, expressed as a percentage of the stock's current price.
Mega cap is a designation for the largest companies in the investment universe as measured by market capitalization.
Price to earnings (P/E) ratio is a common tool for comparing the prices of different common stocks and is calculated by dividing the current market price of a stock by the earnings per share.
Information Technology businesses that sell goods and services in electronics, software, computers, artificial intelligence, and other industries related to information technology (IT).
Must be preceded or accompanied by a prospectus.
Mutual fund investing involves risk. Principal loss is possible. The stock of value companies can continue to be undervalued for long periods of time and not realize its expected value. The value of the Fund may decrease in response to the activities and financial prospects of an individual company. Growth stocks typically are more volatile than value stocks; however, value stocks have a lower expected growth rate in earnings and sales. Strategies focusing on dividend-paying stocks may fall out of investor favor, which may negatively affect the performance of stocks that pay dividends. In addition, the Advisor may incorrectly judge whether a company will be able to continue paying dividends or the amount of such dividends, which may cause losses for the Fund.
TOP TEN HOLDINGS AS OF JUNE 30, 2023: | |
Microsoft Corporation | | | 5.4 | % | |
Air Products & Chemicals, Inc. | | | 4.6 | % | |
Medtronic | | | 4.5 | % | |
U.S. Bancorp | | | 4.5 | % | |
J.P. Morgan Chase & Co. | | | 4.4 | % | |
Bank of New York Mellon Corp. | | | 4.4 | % | |
Home Depot | | | 4.4 | % | |
Qualcomm | | | 4.4 | % | |
Cisco Systems, Inc. | | | 4.3 | % | |
American Electric Power Co, Inc. | | | 4.3 | % | |
Fund holdings and sector allocations are subject to change and are not recommendations to buy or sell any security.
The Matrix Advisors Dividend Fund is distributed by Quasar Distributors, LLC.
3
MATRIX ADVISORS
DIVIDEND FUND
| | | Average Annualized Total Return
Periods Ended June 30, 2023 | |
| | | One Year | | Five Years | | Since
Commencement* | |
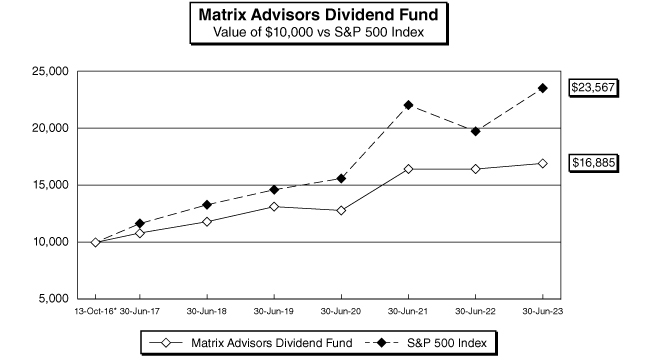
Matrix Advisors Dividend Fund | | | 3.17 | % | | | 9.77 | % | | | 8.12 | % | |
S&P 500 Index** | | | 19.59 | % | | | 14.60 | % | | | 13.62 | % | |
The graph above illustrates the performance of a hypothetical $10,000 investment made in the Fund and the S&P 500 Index on 10/13/16 (commencement of operations). All returns in the graph and table above reflect the reinvestment of dividends and distributions, but do not reflect the deduction of taxes that an investor would pay on distributions. The graph and table above do not imply any future performance.
Performance data quoted represents past performance and does not guarantee future results. The investment return and principal value of an investment will fluctuate so that an investor's shares, when redeemed, may be worth more or less than their original cost. Current performance of the Fund may be lower or higher than the performance quoted. Performance data current to the most recent month end may be obtained by visiting www.matrixadvisorsdividendfund.com.
* The Fund commenced operations on October 13, 2016.
** The S&P 500 Index is a broad based unmanaged index of 500 stocks, which is widely recognized as representative of the equity market in general.
4
MATRIX ADVISORS
DIVIDEND FUND
Matrix Advisors Dividend Fund
Capital Markets Commentary and Quarterly Report:
2nd Quarter 2023 and Annual Review
The S&P 5003 continued its 2023 rally in the second quarter, rising by 8.7%. The return for the first six months of the year was up 16.9%. The index's gain in the second quarter and year-to-date through June 30 has been driven by a small number of technology stocks with outsized increases ("the magnificent seven") rebounding from 2022's sharp selloff and boosted by investor enthusiasm for stocks that are expected to benefit from advances in artificial intelligence (AI). The remaining 493 stocks in the S&P 500 were only modestly higher year-to-date, through June 30. Below is a chart that highlights this divergence4.
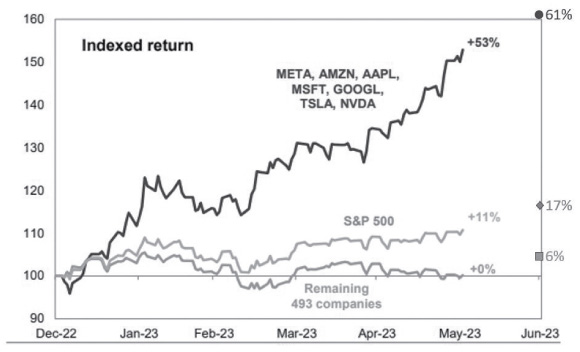
y-axis- based on hypothetical $100 initial investment
Growth stocks5 led the market higher in the second quarter and year-to-date through June 30, with the broader market and stocks with higher dividends lagging. Among market sectors, Technology, Consumer Discretionary, and Communications Services stocks have been the best performers while Energy, Utilities, and Healthcare have been the worst-performing sectors. This is the opposite of the leaderboard in 2022.
3 All references to the stock market are the S&P 500® Index unless otherwise noted.
4 Source: Goldman Sachs 12/31/22-6/1/23, updated by Matrix through 6/30/23.
5 Source: This and future references to Sector or Asset class specific returns are from J.P. Morgan Market Insights "Guide to the Markets®" US 3Q/2023 as of June 30, 2023
5
MATRIX ADVISORS
DIVIDEND FUND
During the second quarter of calendar year 2023, the Federal Reserve raised interest rates by another 0.25%, increasing the Fed Funds rate at their May meeting to 5.00%-5.25%. The Fed left the Fed Funds rate unchanged at their June meeting but left open the possibility of one or two more interest rate hikes before calendar year-end.
Oil and many other commodities have declined this year, a surprising development for those who expected a rebound following China's post-Covid economic reopening, OPEC's decision to reduce oil production, and the ever-present threat of supply disruption from the war in Ukraine. In the U.S., the crude oil price benchmark ended the quarter at $69.86 per barrel, down from $80.16 on 12/31/22. International oil prices have fallen for four quarters in a row6, and the S&P GSCI Commodities Index is down about 9% this year7.
Market Outlook
We remain optimistic about the stock market's prospects for the balance of the year, even in the face of significant economic and geopolitical uncertainty. Though the economy is showing some signs of deceleration after the Fed's rapid increase in interest rates over the past 15 months, and the resumption of student loan payments later this year is likely to slow consumer spending, the economy has proved to be more resilient than many expected. With the job market remaining strong, government spending elevated, consumer credit in good shape, and consumer confidence at an 18-month high, we believe the economic slowdown will be manageable, and we do not expect a significant recession.
If the economy avoids a significant recession and the Fed completes its interest rate increase cycle this year, we believe the market will quickly shift its focus to the next period of economic growth, which should be bullish for stocks.
Coming into 2023, we believed last year's stock market decline left the overall market and many individual stocks at attractive price levels, as investors overly discounted a significant downside case for stocks and the economy. We also believed many of the weakest-performing sectors in 2022 were poised to bounce back this year in a market rotation. Returns in the first half of 2023 suggest this has most likely played out.
Looking forward, however, we expect the stock market rally to broaden. We don't believe that the performance difference between the market's favorite few Technology stocks and the rest of the market will continue and expect the performance gap to narrow as the AI mania subsides and investors increasingly focus on the relative attractiveness of many stocks with good business fundamentals that have been left behind. We expect some of the laggards in the first half of 2023, like Financials, Healthcare, and Industrials, to make meaningful contributions to the market's upside in the back half of the year.
One very bullish signal for our Fund's holdings is the level of insider buying. Insider buying activity during 2023 for companies in the Fund's portfolio at 28% was at the highest level in many years.
6 Barron's June 30, 2023, Oil is on Track for Record losing Streak.
7 Barron's July 3, 2023, Stocks are Running Hot. Your Portfolio Needs a Tuneup.
6
MATRIX ADVISORS
DIVIDEND FUND
While corporate insiders have many reasons to sell shares they own, they primarily buy based on a belief that the stock is attractively priced with favorable prospects. Insiders generally have the best insight into their company's prospects, and academic studies have highlighted the excess returns that can follow healthy insider buying. We believe this elevated level of insider buying strongly supports our bullish outlook for these stocks and the Fund's portfolio.
Finally, the inflation outlook is showing signs of significant improvement, and we believe that the Fed is nearing the end of its rate hiking cycle, which should be positive for corporate earnings and stock prices. Reported inflation and inflation expectations data have improved meaningfully, although not in a straight line, with most Covid-related manufacturing and distribution logistics issues resolved. The Fed paused its rate increases in June, but its statement on future monetary policy was hawkish and will likely evolve based on additional inflation and employment data. While the Fed may increase the Fed Funds rate one or even two more times for insurance, we believe they are near the end of raising interest rates for this cycle.
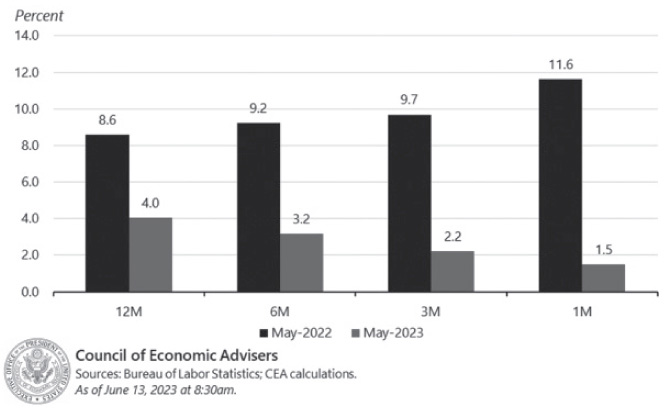
Below is a chart showing the decline in the Consumer Price Index over the past 12 months. The May CPI was up +0.1% (annualized up +1.5%), with the 3-month annualized rate at +2.2% and the 6-month annualized rate at +3.2%.
Figure 3. Annualized Growth Rates of Total CPI
7
MATRIX ADVISORS
DIVIDEND FUND
Fund Annual Fiscal Year Review
For the fiscal year (7/1/22 - 6/30/23), the Fund was up +3.17% trailing the S&P 500 Index's gain of +19.59%. and the Russell 1000 Value®'s gain of +11.54%. The Fund's modest gain versus the benchmarks gave back our large relative advantage from the 2022 fiscal year, where we were near breakeven compared to the larger declines in the S&P 500 and the Russell 1000 Value Index.
Over the 1 year, the portfolio sectors that contributed the most to the Fund's return were Technology, Consumer Discretionary, and Materials. The stocks owned in the Financial sector were the biggest drag on the Fund's return over the period. We believe that Financials is one of the most undervalued sectors in the market and expect our stocks in this sector to make meaningful contributions to the Fund's portfolio in upcoming periods.
Second Quarter and YTD Review and Outlook
After a very good relative year in 2022, defending well in the market's sharp decline, the Matrix Advisors Dividend Fund's performance was about unchanged in the second quarter and showed a modest decline for the first six months of 2023, underperforming the S&P 500® and the Russell 1000® Value Indexes in both periods.
Very few of the mega-cap Technology stocks that have driven the market in 2023 are dividend payers and thus are not candidates for inclusion in the Fund. For that reason, dividend strategies in aggregate have struggled year-to-date through June 30, and are flat to down modestly8. According to Ned Davis Research, the past six months have been the worst first-half performance for dividend payers relative to nonpayers since 20099. We believe this significant short-term lag is likely to be followed by an equally powerful reversal and catch-up period for dividend payors.
While the Fund's performance has been frustrating so far this year, the underlying operations, cash flows, and fundamentals of the companies within the Fund's portfolio are strong and valuations are very attractive. This leads Matrix to be upbeat about the portfolio's prospects for the balance of the year. Insiders seem to agree, with 28% of the positions in the portfolio showing healthy levels of insider buying.
We have used the market's volatility to start new positions, add to existing holdings at compelling prices, and opportunistically trim/exit positions that achieved our goals. This should position the Fund's portfolio to rebound strongly as the market's rally broadens.
During the second quarter, we added a new position in Pfizer, a leading global pharmaceutical company. Key product areas for Pfizer are cardiovascular, metabolic, migraine, and women's health, a vaccine portfolio across all ages with a pipeline focus on infectious diseases with significant unmet medical needs. Pfizer sales and earnings grew significantly during the pandemic, benefitting from its Covid vaccines and treatment products. The company is in a transition from a Covid to a post-Covid world with revenues and earnings declining in 2023. After this post-Covid reset, Pfizer is expected to grow sales by 3% to 4% per year and earnings as of June 30, 2023 by 6%+ per year. The company's stock price stock peaked at more than $61 in December 2021. Now below $40, Pfizer's valuation is attractive at 11 times earnings with a healthy and sustainable 4.4% dividend yield.
8 VMY Equity return was down -0.47% and the SDY Equity return was down -0.78% YTD through June 30, 2023.
9 WSJ, July 2, 2023, Investors Spurn Dividend Paying Stocks as AI Booms.
8
MATRIX ADVISORS
DIVIDEND FUND
We sold out of the position in Coca-Cola to fund a more attractive opportunity in General Dynamics. We modestly scaled back Microsoft and Starbucks, as they became oversized due to strong gains in the past few months. We also made some trades among the Fund's financial holdings as part of our tax mitigation strategy while maintaining our desired exposure to the sector. We had generally reversed these trades by the end of the quarter.
The Dividend Fund is very attractively priced on June 30, with average P/E multiples of 16.2x and 14.4x estimated 2023 and 2024 earnings, compared to the S&P 500's 20.3x and 18.1x for the same periods. The median P/E is at an even more compelling 13.7x and 12.3x 2023 and 2024 estimated earnings.
In the second quarter, four of the Fund's holdings increased their dividends with an average raise of 7.4%. For the first six months of the year, 12 of the Fund's holdings increased their dividends by 6.7%.
The Fund's largest sector concentrations were unchanged from the previous quarter: Financials, Healthcare, and Technology.
For our Financial holdings, credit profiles remain strong and interest income robust, even as valuations have continued to decline. We believe their P/E multiples can expand significantly when forecasts of forward economic conditions improve and current overhangs ease. All of the Fund's Financial holdings passed the most recent Fed stress test with most already following up with healthy dividend increases. Insider buying in Financials is well above average and is another data point that strongly supports our upbeat outlook for this area.
After its very strong absolute 2022 performance, Healthcare stocks have been one of 2023's weakest sectors. We believe this pullback has set the stage for the next meaningful move higher, and we are very upbeat about their prospects for the balance of the year. Beyond their significant upside potential, we believe our Healthcare stocks can be helpful as stable, defensive plays with strong dividend yields in an uncertain economy.
Our expectation that Technology would bounce back in 2023 has generally come to pass, though performance has been uneven. While the sector is up nicely overall in the Fund's portfolio, we believe our technology holdings still have good additional upside potential and should continue to move higher, even when the upside slows for technology stocks overall.
Although the Fund's performance has been frustrating in the first half of the year, this comes after a very strong relative performance in 2022 when it achieved its goal of being more protective during a tumultuous market and is in line with a peer group of Dividend Income strategies. The Fund's portfolio continues to generate a strong and growing income stream, and we believe it is poised for solid gains in the second half.
We remain confident that 2023 will be a good year for stocks and that the Fund's portfolio is well-positioned for the second half of calendar 2023. Its companies showed solid operating performance vs. expectations in their recent quarterly reports, even as the economic environment becomes more challenging, and they trade at very attractive valuations. We expect stocks that lagged in the first part of the year to lead the Fund's portfolio higher as the year progresses.
If you have any questions about any parts of this commentary, please do not hesitate to call. Thank you for your continued confidence in the Matrix team.
Best regards.
9
MATRIX ADVISORS
DIVIDEND FUND
Expense Example (Unaudited)
As a shareholder of the Fund, you incur ongoing costs including advisory fees and other Fund expenses. This Example is intended to help you understand your ongoing costs (in dollars) of investing in the Fund and to compare these costs with the ongoing costs of investing in other mutual funds.
The Example is based on an investment of $1,000 invested at the beginning of the period indicated and held for the entire period from January 1, 2023 to June 30, 2023.
Actual Expenses
The information in the table under the heading "Actual Performance" provides information about actual account values and actual expenses. You may use the information in this column, together with the amount you invested, to estimate the expenses that you paid over the period. Simply divide your account value by $1,000 (for example, an $8,600 account value divided by $1,000 = 8.6), then multiply the result by the number in the row entitled "Expenses Paid During Period" to estimate the expenses you paid on your account during this period.
Hypothetical Example for Comparison Purposes
The information in the table under the heading "Hypothetical Performance (5% Return Before Expenses)" provides information about hypothetical account values and hypothetical expenses based on the Fund's actual expense ratio and an assumed rate of return of 5% per year before expenses, which is not the Fund's actual return. The hypothetical account values and expenses may not be used to estimate the actual ending account balance or expenses you paid for the period. You may use the information in this column to compare the ongoing costs of investing in the Fund and other funds. To do so, compare this 5% hypothetical example with the 5% hypothetical examples that appear in the shareholder reports of the other funds.
Please note that the expenses shown in the table are meant to highlight your ongoing costs only. Therefore, the information under the heading "Hypothetical Performance (5% return before expenses)" is useful in comparing ongoing costs only, and will not help you determine the relative total costs of owning different funds.
| EXPENSE EXAMPLE | | ACTUAL
PERFORMANCE | | HYPOTHETICAL PERFORMANCE
(5% RETURN BEFORE EXPENSES) | |
Beginning Account Value (1/1/23) | | $ | 1,000.00 | | | $ | 1,000.00 | | |
Ending Account Value (6/30/23) | | $ | 983.50 | | | $ | 1,020.33 | | |
Expenses Paid During Period(1) | | $ | 4.43 | | | $ | 4.51 | | |
(1) Expenses are equal to the Fund's annualized expense ratio of 0.90% multiplied by the average account value over the period, multiplied by 181/365 (to reflect the one-half year period).
10
MATRIX ADVISORS
DIVIDEND FUND
SECTOR BREAKDOWN | |
Financials | | | 24.0 | % | |
Health Care | | | 22.6 | % | |
Information Technology | | | 17.9 | % | |
Consumer Discretionary | | | 7.7 | % | |
Industrials | | | 7.7 | % | |
Consumer Staples | | | 6.6 | % | |
Materials | | | 4.6 | % | |
Utilities | | | 4.3 | % | |
Communication Services | | | 3.9 | % | |
Total Investments | | | 99.3 | % | |
Other Assets(1) | | | 0.7 | % | |
Total Net Assets | | | 100.0 | % | |
The table above lists sector allocations as a percentage of the Fund's total investments as of June 30, 2023.
(1) Represents short-term investments and other assets and liabilities (net).
11
MATRIX ADVISORS
DIVIDEND FUND
Schedule of Investments
June 30, 2023
SHARES | | VALUE | |
COMMON STOCKS - 99.4% | |
AEROSPACE/DEFENSE: 3.7% | |
| 6,300 General Dynamics Corp. | | $ | 1,355,445 | | |
BANK (MONEY CENTER): 4.5% | |
| 11,200 JPMorgan Chase & Co. | | | 1,628,928 | | |
BANK (PROCESSING): 4.4% | |
| 36,500 The Bank of New York Mellon Corp. | | | 1,624,980 | | |
BANK (REGIONAL): 3.2% | |
| 9,450 M&T Bank Corp. | | | 1,169,532 | | |
BANK (SUPER REGIONAL): 8.2% | |
| 10,950 The PNC Financial Services Group, Inc. | | | 1,379,153 | | |
| 49,400 US Bancorp | | | 1,632,176 | | |
| | | | 3,011,329 | | |
BIOTECHNOLOGY: 8.4% | |
| 7,000 Amgen, Inc. | | | 1,554,140 | | |
| 19,800 Gilead Sciences, Inc. | | | 1,525,986 | | |
| | | | 3,080,126 | | |
BUILDING MATERIAL AND SUPPLIES DEALERS: 4.4% | |
| 5,200 The Home Depot, Inc. | | | 1,615,328 | | |
CABLE TV: 3.9% | |
| 34,400 Comcast Corp. - Class A | | | 1,429,320 | | |
CHEMICALS: 4.6% | |
| 5,600 Air Products and Chemicals, Inc. | | | 1,677,368 | | |
COMPUTER SOFTWARE AND SERVICES: 5.4% | |
| 5,850 Microsoft Corp. | | | 1,992,159 | | |
DRUG: 5.8% | |
| 11,400 AbbVie, Inc. | | | 1,535,922 | | |
| 15,500 Pfizer, Inc. | | | 568,540 | | |
| | | | 2,104,462 | | |
The accompanying notes are an integral part of these financial statements.
12
MATRIX ADVISORS
DIVIDEND FUND
Schedule of Investments
June 30, 2023 – Continued
SHARES | | VALUE | |
DRUG STORE: 4.0% | |
| 21,000 CVS Health Corp. | | $ | 1,451,730 | | |
ELECTRIC UTILITY: 4.3% | |
| 18,500 American Electric Power Co., Inc. | | | 1,557,700 | | |
FOOD PRODUCTS: 3.9% | |
| 28,200 Tyson Foods, Inc. - Class A | | | 1,439,328 | | |
HOTELS, RESTAURANTS & LEISURE: 3.3% | |
| 12,000 Starbucks Corp. | | | 1,188,720 | | |
HOUSEHOLD PRODUCTS: 2.7% | |
| 19,000 Unilever PLC - ADR | | | 990,470 | | |
MEDICAL - BIOMEDICAL: 4.5% | |
| 18,700 Medtronic PLC | | | 1,647,470 | | |
RAIL TRANSPORTATION: 4.0% | |
| 7,200 Union Pacific Corp. | | | 1,473,264 | | |
SECURITIES BROKERAGE: 3.7% | |
| 16,000 Morgan Stanley | | | 1,366,400 | | |
SEMICONDUCTOR: 8.1% | |
| 13,400 QUALCOMM, Inc. | | | 1,595,135 | | |
| 7,600 Texas Instruments, Inc. | | | 1,368,152 | | |
| | | | 2,963,287 | | |
TELECOMMUNICATIONS (EQUIPMENT): 4.4% | |
| 30,800 Cisco Systems, Inc. | | | 1,593,592 | | |
| TOTAL COMMON STOCKS (Cost $32,419,394) | | $ | 36,360,938 | | |
The accompanying notes are an integral part of these financial statements.
13
MATRIX ADVISORS
DIVIDEND FUND
Schedule of Investments
June 30, 2023 – Continued
SHARES | | VALUE | |
SHORT-TERM INVESTMENTS - 0.9% | |
| 336,417 First American Government Obligations Fund, Class X - 5.01%* | | $ | 336,417 | | |
| TOTAL SHORT-TERM INVESTMENTS (Cost $336,417) | | $ | 336,417 | | |
| TOTAL INVESTMENTS (Cost $32,755,811): 100.3% | | | 36,697,355 | | |
| LIABILITIES IN EXCESS OF OTHER ASSETS: (0.3)% | | | (95,465 | ) | |
| TOTAL NET ASSETS: 100.0% | | $ | 36,601,890 | | |
ADR American Depositary Receipt
* Rate quoted is seven-day yield at period end
The accompanying notes are an integral part of these financial statements.
14
MATRIX ADVISORS
DIVIDEND FUND
Statement of Assets and Liabilities
At June 30, 2023
ASSETS: | |
Investments in securities, at value (cost $32,755,811) | | $ | 36,697,355 | | |
Receivables: | |
Dividends and interest | | | 50,998 | | |
Fund shares sold | | | 5,703 | | |
Prepaid expenses | | | 12,143 | | |
Total assets | | | 36,766,199 | | |
LIABILITIES: | |
Payables: | |
Investments purchased | | | 108,707 | | |
Due to advisor | | | 12,515 | | |
Fund shares purchased | | | 2,344 | | |
Accrued expenses: | |
Audit fees | | | 14,000 | | |
Fund administration fees | | | 7,714 | | |
Accounting fees | | | 4,068 | | |
Reports to shareholders | | | 6,431 | | |
Transfer agent fees | | | 3,542 | | |
Custody fees | | | 1,755 | | |
Other expenses | | | 3,233 | | |
Total liabilities | | | 164,309 | | |
NET ASSETS | | $ | 36,601,890 | | |
Number of shares authorized | | | 30,000,000 | | |
Number of shares, $0.01 par value, issued and outstanding | | | 1,375,511 | | |
Net Asset Value, Offering Price and Redemption Price Per Share | | $ | 26.61 | | |
COMPONENTS OF NET ASSETS: | |
Paid in capital | | $ | 33,143,131 | | |
Total distributable earnings | | | 3,458,759 | | |
Net Assets | | $ | 36,601,890 | | |
The accompanying notes are an integral part of these financial statements.
15
MATRIX ADVISORS
DIVIDEND FUND
Statement of Operations
For the Year Ended June 30, 2023
INVESTMENT INCOME | |
INCOME | |
Dividends | | $ | 965,368 | | |
Interest | | | 7,253 | | |
Total income | | | 972,621 | | |
EXPENSES | |
Advisory fees | | | 182,835 | | |
Transfer agent and accounting fees | | | 48,262 | | |
Fund administration fees | | | 46,814 | | |
Federal and state registration fees | | | 30,794 | | |
Professional fees | | | 28,990 | | |
Reports to shareholders | | | 12,113 | | |
Custody fees | | | 10,907 | | |
Trustee fees | | | 4,529 | | |
Other expenses | | | 8,228 | | |
Total expenses | | | 373,472 | | |
Less: Expense reimbursement by advisor | | | (99,219 | ) | |
Net expenses | | | 274,253 | | |
Net investment income | | | 698,368 | | |
REALIZED AND UNREALIZED GAIN (LOSS) ON INVESTMENTS | |
Net realized loss on investments | | | (496,819 | ) | |
Net change in unrealized appreciation/depreciation on investments | | | 931,388 | | |
Net realized and unrealized gain on investments | | | 434,569 | | |
NET INCREASE IN NET ASSETS RESULTING FROM OPERATIONS | | $ | 1,132,937 | | |
The accompanying notes are an integral part of these financial statements.
16
MATRIX ADVISORS
DIVIDEND FUND
Statement of Changes in Net Assets | | YEAR ENDED
JUNE 30, 2023 | | YEAR ENDED
JUNE 30, 2022 | |
INCREASE (DECREASE) IN NET ASSETS | |
OPERATIONS: | |
Net investment income | | $ | 698,368 | | | $ | 579,349 | | |
Net realized gain (loss) on investments | | | (496,819 | ) | | | 1,736,919 | | |
Net change in net unrealized appreciation/depreciation
on investments | | | 931,388 | | | | (2,628,674 | ) | |
Net increase (decrease) in net assets resulting from operations | | | 1,132,937 | | | | (312,406 | ) | |
NET DISTRIBUTIONS TO SHAREHOLDERS | | | (2,390,634 | ) | | | (758,239 | ) | |
CAPITAL SHARE TRANSACTIONS: | |
Proceeds from shares sold | | | 8,056,662 | | | | 3,958,655 | | |
Proceeds from reinvestment of distributions | | | 2,293,050 | | | | 751,364 | | |
Cost of shares redeemed | | | (1,383,845 | ) | | | (590,313 | ) | |
Net increase from capital share transactions | | | 8,965,867 | | | | 4,119,706 | | |
Total increase in net assets | | | 7,708,170 | | | | 3,049,061 | | |
NET ASSETS | |
Beginning of year | | | 28,893,720 | | | | 25,844,659 | | |
End of year | | $ | 36,601,890 | | | $ | 28,893,720 | | |
CHANGE IN SHARES | |
Shares outstanding, beginning of year | | | 1,032,965 | | | | 897,246 | | |
Shares sold | | | 307,571 | | | | 130,210 | | |
Shares issued on reinvestment of distributions | | | 84,868 | | | | 25,212 | | |
Shares redeemed | | | (49,893 | ) | | | (19,703 | ) | |
Shares outstanding, end of year | | | 1,375,511 | | | | 1,032,965 | | |
The accompanying notes are an integral part of these financial statements.
17
MATRIX ADVISORS
DIVIDEND FUND
Financial Highlights
For a capital share outstanding throughout each year
| | | YEARS ENDED JUNE 30, | |
| | | 2023 | | 2022 | | 2021 | | 2020 | | 2019 | |
Net asset value, beginning of year | | $ | 27.97 | | | $ | 28.80 | | | $ | 22.97 | | | $ | 24.28 | | | $ | 22.62 | | |
Income (loss) from investment operations: | |
Net investment income(a) | | | 0.63 | | | | 0.60 | | | | 0.67 | | | | 0.70 | | | | 0.60 | | |
Net realized and unrealized gain (loss) on investments | | | 0.26 | | | | (0.64 | ) | | | 5.82 | | | | (1.22 | ) | | | 1.81 | | |
Total from investment operations | | | 0.89 | | | | (0.04 | ) | | | 6.49 | | | | (0.52 | ) | | | 2.41 | | |
Less distributions: | |
Dividends from net investment income | | | (0.61 | ) | | | (0.59 | ) | | | (0.66 | ) | | | (0.69 | ) | | | (0.57 | ) | |
Distributions from net realized gain | | | (1.64 | ) | | | (0.20 | ) | | | — | | | | (0.10 | ) | | | (0.18 | ) | |
Total distibutions | | | (2.25 | ) | | | (0.79 | ) | | | (0.66 | ) | | | (0.79 | ) | | | (0.75 | ) | |
Net asset value, end of year | | $ | 26.61 | | | $ | 27.97 | | | $ | 28.80 | | | $ | 22.97 | | | $ | 24.28 | | |
Total return | | | 3.17 | % | | | (0.28 | )% | | | 28.58 | % | | | (2.18 | )% | | | 10.86 | % | |
Ratios/supplemental data: | |
Net assets, end of year (millions) | | $ | 36.6 | | | $ | 28.9 | | | $ | 25.8 | | | $ | 17.8 | | | $ | 15.1 | | |
Ratio of operating expenses to average net assets: | |
Before expense reimbursement | | | 1.23 | % | | | 1.23 | % | | | 1.37 | % | | | 1.54 | % | | | 1.80 | % | |
After expense reimbursement | | | 0.90 | % | | | 0.90 | % | | | 0.90 | % | | | 0.90 | % | | | 0.90 | % | |
Ratio of net investment income
to average net assets: | |
Before expense reimbursement | | | 1.96 | % | | | 1.69 | % | | | 2.11 | % | | | 2.26 | % | | | 1.66 | % | |
After expense reimbursement | | | 2.29 | % | | | 2.02 | % | | | 2.58 | % | | | 2.90 | % | | | 2.56 | % | |
Portfolio turnover rate | | | 31 | % | | | 45 | % | | | 31 | % | | | 38 | % | | | 23 | % | |
(a) Calculated using the average shares method.
The accompanying notes are an integral part of these financial statements.
18
MATRIX ADVISORS
DIVIDEND FUND
Notes to Financial Statements
NOTE 1 – ORGANIZATION
The Matrix Advisors Dividend Fund (the "Fund") is a series of Matrix Advisors Funds Trust (the "Trust"), which was organized on July 20, 2016 as a Delaware statutory trust and is registered under the Investment Company Act of 1940 (the "1940 Act"). The Trust is a diversified, open-end management investment company and accordingly follows the investment company accounting and reporting guidance of the Financial Accounting Standards Board (the "FASB") Accounting Standard Codification Topic 946 "Financial Services – Investment Companies". The Fund commenced operations on October 13, 2016. The Fund's investment objective is to seek current income and capital appreciation.
NOTE 2 – SIGNIFICANT ACCOUNTING POLICIES
The Fund consistently follows the accounting policies set forth below which are in conformity with accounting principles generally accepted in the United States of America ("U.S. GAAP").
A. Security Valuation.
Securities traded on a national securities exchange, except those listed on the NASDAQ Stock Market, LLC ("NASDAQ") are valued at the last reported sales price at the close of regular trading on each day the exchanges are open for trading (generally 4:00 p.m, Eastern time). Securities traded on the NASDAQ are valued at the NASDAQ Official Closing Price, which may not necessarily represent the last sale price. Quotations of foreign securities currencies and other assets denominated in foreign currencies are translated into U.S. dollars at the exchange rate of such currencies against the U.S. dollar, as provided by an independent pricing service or reporting agency. Foreign currency exchange rates generally are valued at the last sale price at the close on an exchange on which the security is primarily traded. Securities traded on an exchange for which there have been no sales are valued at the mean between the the last reported bid and the asked quotes, or the last sale price when appropriate.
Securities for which quotations are not readily available are stated at their respective fair values as determined in good faith by Matrix Asset Advisors, Inc. (the "Advisor" or "Matrix"), the Fund's investment advisor and valuation designee, in accordance with procedures approved by the Board of Trustees (the "Board") of the Trust under Rule 2a-5 of the 1940 Act. In determining fair value, the Fund takes into account all relevant factors and available information. Consequently, the price of the security used by the Fund to calculate its net asset value ("NAV") per share may differ from quoted or published prices for the same security. Fair value pricing involves subjective judgments and there is no single standard for determining a security's fair value. As a result, different mutual funds could reasonably arrive at a different fair value for the same security. It is possible that the fair value determined for a security is materially different from the value that could be realized upon the sale of that security or from the values that other mutual funds may determine.
Investments in other funds are valued at their respective NAVs as determined by those funds for purchase and/or redemption orders placed on that day, in accordance with the 1940 Act.
Foreign securities are recorded in the financial statements after translation to U.S. dollars based on the applicable exchange rate at the end of the period. The Fund does not isolate that portion of the results of
19
MATRIX ADVISORS
DIVIDEND FUND
Notes to Financial Statements, Continued
operations arising as a result of changes in the currency exchange rate from the fluctuations arising as a result of changes in the market prices of investments during the period.
B. Share Valuation.
The NAV per share of the Fund is calculated by dividing the sum of the value of the securities held by the Fund, plus cash or other assets, minus all liabilities (including estimated accrued expenses), by the total number of shares outstanding of the Fund, rounded to the nearest cent. The Fund's shares will not be priced on the days on which the New York Stock Exchange ("NYSE") is closed for trading. The offering and redemption price per share of the Fund is equal to the Fund's NAV per share.
C. Federal Income Taxes.
The Fund has elected to be treated as a "regulated investment company" under Subchapter M of the Internal Revenue Code of 1986, as amended. The Fund intends to distribute substantially all of its taxable income and any capital gains less any applicable capital loss carryforwards.
The Fund recognizes the tax benefits of uncertain tax positions only where the position is "more likely than not" to be sustained assuming examination by tax authorities. Management has analyzed the Fund's tax positions, and has concluded that no liability for unrecognized tax benefits should be recorded related to uncertain tax positions taken on returns filed for open tax years (2020 – 2022) or expected to be taken in the Fund's 2023 tax returns. The Fund identifies its major tax jurisdictions as U. S. Federal, New York State and New York City. The Fund is not aware of any tax positions for which it is reasonably possible that the total amounts of unrecognized tax benefits will change materially in the next twelve months.
D. Use of Estimates.
The preparation of financial statements in conformity with U.S. GAAP requires management to make estimates and assumptions that affect the reported amounts of assets and liabilities and disclosure of contingent assets and liabilities at the date of the financial statements and the reported amounts of revenues and expenses during the reporting period. Actual results could differ from these estimates.
E. Security Transactions, Investment Income, and Distributions.
Security transactions are accounted for on the trade date. The Fund expects to make distributions of net investment income, if any, quarterly, and distributions of net capital gains, if any, at least annually. Dividend income and distributions to shareholders are recorded on the ex-dividend date, and interest income is recognized on the accrual basis. Realized gains and losses are evaluated on the basis of identified costs. Premiums and discounts on the purchase of securities are amortized/accreted using the effective interest method. U.S. GAAP requires that permanent financial reporting and tax differences be reclassified in the capital accounts.
F. Indemnification Obligations.
Under the Fund's organizational documents, its current and former Officers and Trustees are indemnified against certain liabilities arising out of the performance of their duties to the Fund. In addition, in the normal course of business, the Fund enters into contracts that contain a variety of representations and
20
MATRIX ADVISORS
DIVIDEND FUND
Notes to Financial Statements, Continued
warranties that provide general indemnifications. The Fund's maximum exposure under these arrangements is unknown as this would involve future claims that may be made against the Fund that have not yet occurred or that would be covered by other parties.
G. Recent Accounting Pronouncements.
Rule 18f-4
On October 28, 2020, the Securities and Exchange Commission (the "SEC") adopted new Rule 18f-4, which governs the use of derivatives by registered investment companies. The Fund was required to implement and comply with Rule 18f-4 by August 19, 2022 if the Fund invests in derivatives or engages in other transactions subject to Rule 18f-4. Rule 18f-4 imposes limits on the amount of derivatives a fund can enter into, eliminating the asset segregation framework previously used by funds to comply with Section 18 of the 1940 Act, treats derivatives as senior securities and requires funds whose use of derivatives is more than a limited specified exposure amount to establish and maintain a comprehensive derivatives risk management program and appoint a derivatives risk manager. The fund has adopted procedures in accordance with Rule 18f-4.
Rule 2a-5
In December 2020, the SEC adopted new Rule 2a-5 under the 1940 Act, which provides a framework for fund valuation practices. Rule 2a-5 establishes requirements for determining fair value in good faith for purposes of the 1940 Act. Rule 2a-5 permits fund boards to designate certain parties to perform fair value determinations, subject to board oversight and certain other conditions. Rule 2a-5 also defines when market quotations are "readily available" for purposes of the 1940 Act and the threshold for determining whether a fund must fair value a security. In connection with Rule 2a-5, the SEC also adopted related recordkeeping requirements and is rescinding previously issued guidance, including with respect to the role of a board in determining fair value and the accounting and auditing of fund investments. The fund has adopted procedures in accordance with Rule 2a-5.
H. Subsequent Events.
The Fund has evaluated subsequent events through the issuance of the Fund's financial statements and has determined that no events have occurred that require disclosure in these financial statements.
NOTE 3 – AGREEMENTS AND RELATED PARTY TRANSACTIONS
The Fund has entered into an investment advisory agreement ("Advisory Agreement") with the Advisor. Under the Advisory Agreement, the Advisor has overall responsibility for the general management and investment of the Fund's portfolio, subject to the supervision of the Board. The Fund compensates the Advisor for its services at the annual rate of 0.60% of its average daily net assets, payable on a monthly basis in arrears. For the year ended June 30, 2023, the Fund accrued $182,835 in advisory fees.
The Fund is responsible for its own operating expenses. Pursuant to an operating expenses limitation agreement between the Advisor and the Fund, the Advisor has contractually agreed to waive its fees or reimburse Fund
21
MATRIX ADVISORS
DIVIDEND FUND
Notes to Financial Statements, Continued
expenses until at least October 31, 2023, to ensure that Total Annual Fund Operating Expenses (exclusive of interest, acquired fund fees and expenses, distribution and/or service (12b-1) fees, leverage and tax expenses, dividend and interest expenses on short positions, brokerage commissions and extraordinary expenses) will not exceed 0.90% of the Fund's average daily net assets (the "Expense Limit"). The Advisor is entitled to recoup the fees waived and/or expenses reimbursed within a three-year period from the date of the waiver or expense payment if such reimbursement will not cause the Fund's expense ratio to exceed the lesser of (i) the Expense Limit in effect at the time of the waiver and/or expense payment or (ii) the Expense Limit in place at the time of recoupment. Any such reimbursement will be reviewed by the Board. The Fund must pay its current ordinary operating expenses before the Advisor is entitled to any recoupment of fees waived or expenses reimbursed. This arrangement can be terminated only by, or with the consent of, the Board upon 60 days' written notice to the Advisor.
For the year ended June 30, 2023, the Advisor waived advisory fees and reimbursed expenses totaling $99,219 in the aggregate. At June 30, 2023, the cumulative amount available for reimbursement that has been paid and/or waived is $297,463. Currently, the Advisor has agreed not to seek reimbursement of such fee reductions and/or expense payments. The Advisor may recapture a portion of this amount no later than the dates stated below:
| | | June 30 | |
| | 2024 | | 2025 | | 2026 | |
| | | | | $ | 105,028 | | | $ | 93,216 | | | $ | 99,219 | | |
The Fund's Chief Compliance Officer ("CCO") receives no compensation from the Fund; however, U.S. Bancorp Fund Services, LLC, d/b/a U.S. Bank Global Fund Services, the Fund's administrator (the "Administrator") was paid $4,000 during the year ended June 30, 2023 for CCO support services.
NOTE 4 – INVESTMENT TRANSACTIONS
The cost of purchases and the proceeds from sales of securities, other than short-term obligations and U.S. Government securities, for the year ended June 30, 2023, are as follows:
| | | Purchases | | Sales | |
Common Stock | | $ | 17,432,429 | | | $ | 9,555,700 | | |
22
MATRIX ADVISORS
DIVIDEND FUND
Notes to Financial Statements, Continued
NOTE 5 – DISTRIBUTIONS TO SHAREHOLDERS
As of June 30, 2023, the components of distributable earnings on a tax basis were as follows:
Cost of investments for tax purposes | | $ | 32,783,544 | | |
Gross tax unrealized appreciation | | | 5,151,724 | | |
Gross tax unrealized depreciation | | | (1,237,913 | ) | |
Net tax unrealized appreciation on investments | | | 3,913,811 | | |
Undistributed ordinary income | | | 15,102 | | |
Undistributed long-term capital gains | | | — | | |
Total Distributable Earnings | | | 15,102 | | |
Other accumulated gains (losses) | | | (470,154 | ) | |
Total Accumulated Earnings/Losses | | $ | 3,458,759 | | |
The difference between book and tax unrealized appreciation is attributable primarily to the tax deferral of losses on wash sale adjustments.
U.S. GAAP required that certain components of net assets relating to permanent differences be reclassified between financial and tax reporting. These reclassifications have no effect on net assets or NAV per share. For the year ended June 30, 2023, the Fund had no permanent differences that were reclassified between paid-in capital and distributable earnings.
As of June 30, 2023, the Fund had $80,980 of short term loss carryover and $389,174 of long term loss carryover, which do not expire. These losses may offset future capital gains for federal income tax purposes. The Fund had no post-October losses, which are deferred until fiscal year 2024 for tax purposes. Capital losses incurred after October 31 ("post-October losses") within that taxable year are deemed to arise on the first day of the Fund's next taxable year.
As of June 30, 2023, the Fund had no qualified late-year ordinary losses, which are deferred until fiscal year 2024 for tax purposes. Net late-year losses incurred after December 31 within the taxable year are deemed to arise on the first day of the Fund's next taxable year.
The tax character of distributions paid during the years ended June 30, 2023 and June 30, 2022 were as follow:
| | | June 30, 2023 | | June 30, 2022 | |
Distributions Paid From: | |
Ordinary Income* | | $ | 755,143 | | | $ | 580,011 | | |
Long-Term Capital Gain | | $ | 1,635,491 | | | $ | 178,228 | | |
| | | $ | 2,390,634 | | | $ | 758,239 | | |
* For tax purposes, short-term capital gains are considered ordinary income.
23
MATRIX ADVISORS
DIVIDEND FUND
Notes to Financial Statements, Continued
The Fund may use earnings and profits distributed to shareholders on redemption of shares as part of the dividends paid deduction.
NOTE 6 – FAIR VALUE
The Fund has adopted fair valuation accounting standards which establish an authoritative definition of fair value and set forth a hierarchy for measuring fair value. These standards require additional disclosure about the various inputs and valuation techniques used to develop the measurements of fair value and a discussion of changes in valuation techniques and related inputs during the period. These standards define fair value as the price that would be received in the sale of an asset or paid to transfer a liability in an orderly transaction between market participants on the measurement date. The fair value hierarchy is organized into three levels based upon the assumptions (referred to as "inputs") used to value the asset or liability. These standards state that "observable inputs" reflect the assumptions that market participants would use in valuing an asset or liability based on market data obtained from independent sources. "Unobservable inputs" reflect the Fund's own assumptions about the inputs market participants would use to value the asset or liability.
The Fund follows a fair value hierarchy that distinguishes between market data obtained from independent sources (observable inputs) and the Fund's own market assumptions (unobservable inputs). These inputs are used in determining the value of the Fund's investments and are summarized in the following fair value hierarchy:
Level 1 – Unadjusted quoted prices in active markets for identical assets or liabilities that the company has the ability to access.
Level 2 – Observable inputs other than quoted prices included in Level 1 that are observable for the asset or liability, either directly or indirectly. These inputs may include quoted prices for the identical instrument on an inactive market, prices for similar instruments, interest rates, prepayments speeds, credit risk, yield curves, default rates and similar data.
Level 3 – Unobservable inputs for the asset or liability, to the extent relevant observable inputs are not available, representing the company's own assumptions about the assumptions a market participant would use in valuing the asset or liability, and would be based on the best information available.
The inputs or methodology used for valuing securities are not an indication of the risk associated with investing in those securities.
The following is a summary of the inputs used to value the Fund's net assets as of June 30, 2023.
| | Level 1 | | Level 2 | | Level 3 | | Total | |
Equity | |
Common Stocks* | | $ | 36,360,938 | | | $ | — | | | $ | — | | | $ | 36,360,938 | | |
Total Equity | | $ | 36,360,938 | | | $ | — | | | $ | — | | | $ | 36,360,938 | | |
Short-Term Investments | | $ | 336,417 | | | $ | — | | | $ | — | | | $ | 336,417 | | |
Total Investments in Securities | | $ | 36,697,355 | | | $ | — | | | $ | — | | | $ | 36,697,355 | | |
* Please refer to the Schedule of Investments for a breakout of common stocks by industry classifications.
24
MATRIX ADVISORS
DIVIDEND FUND
Notes to Financial Statements, Continued
NOTE 7 – IMPACTS OF COVID-19
The global outbreak of COVID-19 has disrupted economic markets and the prolonged economic impact is uncertain. The operational and financial performance of the Fund's investments depends on future developments, including the duration and spread of the outbreak, and such uncertainty may in turn impact the value of the Fund's investments.
25
MATRIX ADVISORS
DIVIDEND FUND
REPORT OF INDEPENDENT REGISTERED PUBLIC ACCOUNTING FIRM
To the Board of Trustees and
Shareholders of Matrix Advisors Dividend Fund
Opinion on the Financial Statements
We have audited the accompanying statement of assets and liabilities of Matrix Advisors Dividend Fund (the "Fund"), a series of Matrix Advisors Funds Trust, including the schedule of investments, as of June 30, 2023, the related statement of operations for the year then ended, the statements of changes in net assets for each of the two years in the period then ended, and the financial highlights for each of the five years then ended, and the related notes (collectively referred to as the "financial statements"). In our opinion, the financial statements present fairly, in all material respects, the financial position of the Fund as of June 30, 2023, the results of its operations for the year then ended, the changes in its net assets for each of the two years in the period then ended, and the financial highlights for each of the five years in the period then ended, in conformity with accounting principles generally accepted in the United States of America.
Basis for Opinion
These financial statements are the responsibility of the Fund's management. Our responsibility is to express an opinion on the Fund's financial statements based on our audits. We are a public accounting firm registered with the Public Company Accounting Oversight Board (United States) ("PCAOB") and are required to be independent with respect to the Fund in accordance with the U.S. federal securities laws and the applicable rules and regulations of the Securities and Exchange Commission and the PCAOB. We have served as the Fund's auditor since 2016.
We conducted our audits in accordance with the standards of the PCAOB. Those standards require that we plan and perform the audit to obtain reasonable assurance about whether the financial statements are free of material misstatement, whether due to error or fraud. The Fund is not required to have, nor were we engaged to perform, an audit of its internal control over financial reporting. As part of our audits we are required to obtain an understanding of internal control over financial reporting, but not for the purpose of expressing an opinion on the effectiveness of the Fund's internal control over financial reporting. Accordingly, we express no such opinion.
Our audits included performing procedures to assess the risks of material misstatement of the financial statements, whether due to error or fraud, and performing procedures that respond to those risks. Such procedures included examining, on a test basis, evidence regarding the amounts and disclosures in the financial statements. Our audits also included evaluating the accounting principles used and significant estimates made by management, as well as evaluating the overall presentation of the financial statements. Our procedures included confirmation of securities owned as of June 30, 2023 by correspondence with the custodian and brokers. We believe that our audits provide a reasonable basis for our opinion.

TAIT, WELLER & BAKER LLP
Philadelphia, Pennsylvania
August 29, 2023
26
MATRIX ADVISORS
DIVIDEND FUND
Additional Information (Unaudited)
PROXY VOTING INFORMATION
The Advisor votes proxies relating to portfolio securities in accordance with procedures that have been approved by the Board of Trustees of the Fund. You may obtain a description of these procedures and how the Fund voted proxies relating to the portfolio securities during the most recent 12-month period ended June 30, free of charge, upon request, by calling toll-free 1-800-366-6223. This information is also available through the Securities and Exchange Commission's website at http://www.sec.gov.
PORTFOLIO HOLDINGS DISCLOSURE
The Fund files its complete schedule of portfolio holdings with the SEC as of the end of the first and third quarters of each fiscal year (quarters ended September 30 and March 31) as an exhibit to its reports on Form N-PORT. Portfolio holdings filed on Form N-PORT are publicly available 60 days after the end of the applicable quarter. The Fund's Form N-PORT filings are available on the Securities and Exchange Commission's website at www.sec.gov. This information is also available, without charge, upon request, by calling toll free, 1-800-366-6223.
TAX NOTICE
The percentage of dividend income distributed for the year ended June 30, 2023, which is designated as qualified dividend income under the Jobs and Growth Tax Relief Reconciliation Act of 2003, is 100.00%.
For the year ended June 30, 2023, the percentage of ordinary income distributions that qualify for the dividend received deduction available to corporate shareholders is 100.00%.
27
MATRIX ADVISORS
DIVIDEND FUND
Additional Information (Unaudited), Continued
TRUSTEES AND OFFICER INFORMATION
The Board of Trustees is responsible for the overall management of the Fund's business. The Board approves all significant agreements between the Fund and persons or companies furnishing services to it, including the agreements with the Advisor, Administrator, Custodian and Transfer Agent. The Board of Trustees delegates the day-to-day operations of the Fund to its Officers, subject to the Fund's investment objective and policies and to general supervision by the Board. The Statement of Additional Information includes additional information about the Fund's Trustees and is available, without charge, upon request, by calling 1-800-366-6223.
The Trustees and Officers of the Fund, their business addresses and principal occupations during the past five years are:
Interested Trustee | | | | | | | | | | | |
Name,
Address,
and Year of Birth | | Position(s)
Held with
the Fund | | Term of
Office and
Date
Elected | | Principal
Occupation(s)
During the
Past 5 Years | | Number
of Portfolios
In Fund
Complex**
Overseen by
Trustee | | Other
Directorships
Held by
Trustee | |
David A. Katz, CFA *
10 Bank Street,
Suite 590
White Plains, NY 10606
(Born 1962) | | Trustee, President and Treasurer | | Indefinite; Since 2016 | | Chief Investment Officer (1986 to present) and President (1990 to present) of the Advisor, and portfolio manager of the Fund (2016 to present). | | | 2 | | | Director, Matrix Advisors Value Fund, Inc. (mutual fund) (since 1997) | |
Independent Trustees | | | | | | | | | | | |
T. Michael Tucker
10 Bank Street,
Suite 590
White Plains, NY 10606
(Born 1942) | | Trustee | | Indefinite; Since 2016 | | Retired; formerly, Owner of T. Michael Tucker, a certified public accounting firm (1977 to 2005 and 2011 to 2019); formerly, Consultant, Carr Riggs & Ingram, LLP, a certified public accounting firm (2005 to 2011). | | | 2 | | | Director, Matrix Advisors Value Fund, Inc. (mutual fund) (since 1997) | |
28
MATRIX ADVISORS
DIVIDEND FUND
Additional Information (Unaudited), Continued
Independent Trustees, Continued | | | | | | | | | | | |
Name,
Address,
and Year of Birth | | Position(s)
Held with
the Fund | | Term of
Office and
Date
Elected | | Principal
Occupation(s)
During the
Past 5 Years | | Number
of Portfolios
In Fund
Complex**
Overseen by
Trustee | | Other
Directorships
Held by
Trustee | |
Larry D. Kieszek
10 Bank Street,
Suite 590
White Plains, NY 10606
(Born 1950) | | Trustee and Chairman | | Indefinite; Since 2016 | | Retired; formerly, Partner of Purvis, Gray & Company, a certified public accounting firm (1974 to 2015). | | | 2 | | | Director, Matrix Advisors Value Fund, Inc. (mutual fund) (since 1997) | |
David S. Wyler
10 Bank Street,
Suite 590
White Plains, NY 10606
(Born 1969) | | Trustee | | Indefinite; Since 2016 | | Vice President of Advanced TV & Digital Video at IRI Worldwide (market research company) (December 2017 to present); Vice President of Business Development, iQ Media (audience intelligence firm) (May to September 2017); Senior Director of Sales at Simulmedia (TV targeting company) (2016 – 2017); Vice President of Business Development at Resonate (marketing intelligence firm) (2014 – 2016); Vice President Business Development, Experian (2013 – 2014). | | | 2 | | | Director, Matrix Advisors Value Fund, Inc. (mutual fund) (since 2016) | |
Keith Shintani
10 Bank Street,
Suite 590
White Plains, NY 10606
(Born 1963) | | Trustee | | Indefinite; Since 2023 | | Retired; formerly Senior Vice President of Relationship Management at U.S. Bank Global Fund Services (January 1998 to June 2022). | | | 1 | | | None | |
29
MATRIX ADVISORS
DIVIDEND FUND
Additional Information (Unaudited), Continued
Officers of the Fund | | | | | | | | | | | |
Name,
Address,
and Year of Birth | | Position(s)
Held with
the Fund | | Term of
Office and
Date
Elected | | Principal
Occupation(s)
During the
Past 5 Years | | Number
of Portfolios
In Fund
Complex**
Overseen by
Trustee | | Other
Directorships
Held by
Trustee | |
Lon F. Birnholz
10 Bank Street,
Suite 590
White Plains, NY 10606
(Born 1960) | | Executive Vice President and Secretary | | Indefinite; Since 2016 | | Senior Managing Director of the Advisor (1999 to present). | | N/A | | N/A | |
Steven G. Roukis, CFA
10 Bank Street,
Suite 590
White Plains, NY 10606
(Born 1967) | | Senior Vice President | | Indefinite; Since 2016 | | Managing Director and Senior Portfolio Manager of the Advisor (2005 to present). | | N/A | | N/A | |
Jordan F. Posner
10 Bank Street,
Suite 590
White Plains, NY 10606
(Born 1957) | | Senior Vice President | | Indefinite; Since 2016 | | Managing Director and Senior Portfolio Manager of the Advisor (2005 to present). | | N/A | | N/A | |
Stephan J.
Weinberger, CFA
10 Bank Street,
Suite 590
White Plains, NY 10606
(Born 1955) | | Senior Vice President | | Indefinite; Since 2016 | | Managing Director and Senior Portfolio Manager of the Advisor (2010 to present). | | N/A | | N/A | |
30
MATRIX ADVISORS
DIVIDEND FUND
Additional Information (Unaudited), Continued
Officers of the Fund, Continued | | | | | | | | | | | |
Name,
Address,
and Year of Birth | | Position(s)
Held with
the Fund | | Term of
Office and
Date
Elected | | Principal
Occupation(s)
During the
Past 5 Years | | Number
of Portfolios
In Fund
Complex**
Overseen by
Trustee | | Other
Directorships
Held by
Trustee | |
Jonathan Tom
10 Bank Street,
Suite 590
White Plains, NY 10606
(Born 1983). | | Senior Vice President | | Indefinite; Since 2016 | | Chief Operating Officer of the Advisor (2015 to present); Head Fixed Income Trader of the Advisor (2011 to present); Equity Research Analyst the Advisor (2005 to present). | | N/A | | N/A | |
Jacqueline Mandel
10 Bank Street,
Suite 590
White Plains, NY
10606
(Born 1964) | | Vice President, Assistant Secretary, Chief Compliance Officer and AML Compliance Officer | | Since 2022 | | Chief Compliance Officer of the Advisor (February 2022 to present); Marketing Consultant of the Advisor (July 2021 to January 2022); Investment Management Sales Associate of Arrow Partners, Inc. (a third-party marketing firm) (January 2021 to January 2022); Analyst of Knightspoint Partners LLC (an investment firm) (2018 to 2020); Independent Consultant of Berens Capital Management, LLC (an investment firm) (November 2017 to January 2018); and Research Associate of Moisson Partners Inc. (a consulting firm) (2016 to February 2018). | | N/A | | N/A | |
* "Interested person" of the Trust as that term is defined under the 1940 Act. Mr. Katz is considered an "interested person" because of his affiliation with the Advisor.
** The "Fund Complex" includes the Fund and Matrix Advisors Value Fund, Inc.
31
MATRIX ADVISORS
DIVIDEND FUND
The Fund collects non-public information about you from the following sources:
• Information we receive about you on applications or other forms;
• Information you give us orally; and
• Information about your transactions with us or others.
We do not disclose any non-public personal information about our shareholders or former shareholders without the shareholder's authorization, except as required or permitted by law or in response to inquiries from governmental authorities. We restrict access to your personal and account information to those employees who need to know that information to provide products and services to you. We may disclose that information to unaffiliated third parties (such as to brokers or custodians) only as permitted by law and only as needed for us to provide agreed services to you. We maintain physical, electronic and procedural safeguards to guard your non-public personal information.
If you hold shares of the Fund through a financial intermediary, including, but not limited to, a broker-dealer, bank, or trust company, the privacy policy of your financial intermediary would govern how your nonpublic personal information would be shared by those entities with nonaffiliated third parties.
32
Board of Trustees
David A. Katz, CFA
Larry D. Kieszek
Keith Shintani
T. Michael Tucker
David S. Wyler
•
Investment Advisor
Matrix Asset Advisors, Inc.
10 Bank Street, Suite 590
White Plains, NY 10606
(800) 366-6223
•
Custodian
U.S. Bank, N.A.
1555 N. RiverCenter Drive, Suite 302
Milwaukee, WI 53212
•
Transfer Agent
U.S. Bancorp Fund Services, LLC
615 East Michigan Street
Milwaukee, WI 53202
•
Administrator
U.S. Bancorp Fund Services, LLC
777 E Wisconsin Ave
Milwaukee, WI 53202
•
Independent Registered Public
Accounting Firm
Tait, Weller & Baker LLP
50 South 16th Street, Suite 2900
Philadelphia, PA 19102
•
Distributor
Quasar Distributors, LLC
111 East Kilbourn Avenue, Suite 2200
Milwaukee, WI 53202
MATRIX ADVISORS
DIVIDEND FUND
This report is intended for shareholders of the Fund and may not be used as sales literature unless preceded or accompanied by a current prospectus.
Past performance results shown in this report should not be considered a representation of future performance. Share price and returns will fluctuate so that shares, when redeemed, may be worth more or less than their original cost. Statements and other information herein are dated and are subject to change.
10 Bank Street, Suite 590
White Plains, NY 10606
Ticker Symbol: MADFX
Cusip: 57681H108
Item 2. Code of Ethics.
The registrant has adopted a code of ethics that applies to the registrant’s principal executive officer and principal financial officer. The registrant has not made any amendments to its code of ethics during the period covered by this report. The registrant has not granted any waivers from any provisions of the code of ethics during the period covered by this report.
The registrant undertakes to provide to any person without charge, upon request, a copy of its code of ethics by mail when they call the registrant at 1-800-366-6223.
Item 3. Audit Committee Financial Expert.
The registrant’s board of directors has determined that there is at least one audit committee financial expert serving on its audit committee. Messrs. Kieszek and Tucker are “audit committee financial expert(s)” and are considered to be “independent” as each term is defined in Item 3 of Form N-CSR.
Item 4. Principal Accountant Fees and Services.
The registrant has engaged its principal accountant to perform audit services, audit-related services, tax services and other services during the past two fiscal years. “Audit services” refer to performing an audit of the registrant's annual financial statements or services that are normally provided by the accountant in connection with statutory and regulatory filings or engagements for those fiscal years. “Audit-related services” refer to the assurance and related services by the principal accountant that are reasonably related to the performance of the audit. “Tax services” refer to professional services rendered by the principal accountant for tax compliance, tax advice, and tax planning. There were no “Other services” provided by the principal accountant. The following table details the aggregate fees billed or expected to be billed for each of the last two fiscal years for audit fees, audit-related fees, tax fees and other fees by the principal accountant.
| | | FYE 6/30/2023 | | | FYE 6/30/2022 | |
| Audit Fees | | $ | 12,000 | | | $ | 12,000 | |
| Audit-Related Fees | | $ | 0 | | | $ | 0 | |
| Tax Fees | | $ | 2,000 | | | $ | 2,000 | |
| All Other Fees | | $ | 0 | | | $ | 0 | |
The audit committee has adopted pre-approval policies and procedures that require the audit committee to pre-approve all audit and non-audit services of the registrant, including services provided to any entity affiliated with the registrant.
The percentage of fees billed by Tait, Weller & Baker LLP applicable to non-audit services pursuant to waiver of pre-approval requirement were as follows:
| | | FYE 6/30/2023 | | | FYE 6/30/2022 | |
| Audit-Related Fees | | | 0 | % | | | 0 | % |
| Tax Fees | | | 0 | % | | | 0 | % |
| All Other Fees | | | 0 | % | | | 0 | % |
All of the principal accountant’s hours spent on auditing the registrant’s financial statements were attributed to work performed by full-time permanent employees of the principal accountant.
The following table indicates the non-audit fees billed or expected to be billed by the registrant’s accountant for services to the registrant and to the registrant’s investment adviser (and any other controlling entity, etc.—not sub-adviser) for the last two years.
| Non-Audit Related Fees | | FYE 6/30/2023 | | | FYE 6/30/2022 | |
| Registrant | | $ | 0 | | | $ | 0 | |
| Registrant’s Investment Adviser | | $ | 0 | | | $ | 0 | |
The audit committee of the board of trustees has considered whether the provision of non-audit services that were rendered to the registrant's investment adviser is compatible with maintaining the principal accountant's independence and has concluded that the provision of such non-audit services by the accountant has not compromised the accountant’s independence.
The registrant has not been identified by the U.S. Securities and Exchange Commission as having filed an annual report issued by a registered public accounting firm branch or office that is located in a foreign jurisdiction where the Public Company Accounting Oversight Board is unable to inspect or completely investigate because of a position taken by an authority in that jurisdiction.
The registrant is not a foreign issuer.
Item 5. Audit Committee of Listed Registrants.
Not applicable to registrants who are not listed issuers (as defined in Rule 10A-3 under the Securities Exchange Act of 1934).
Item 6. Investments.
| (a) | Schedule of Investments is included as part of the report to shareholders filed under Item 1 of this Form. |
Item 7. Disclosure of Proxy Voting Policies and Procedures for Closed-End Management Investment Companies.
Not applicable to open-end investment companies.
Item 8. Portfolio Managers of Closed-End Management Investment Companies.
Not applicable to open-end investment companies.
Item 9. Purchases of Equity Securities by Closed-End Management Investment Company and Affiliated Purchasers.
Not applicable to open-end investment companies.
Item 10. Submission of Matters to a Vote of Security Holders.
There have been no material changes to the procedures by which shareholders may recommend nominees to the registrant’s board of trustees.
Item 11. Controls and Procedures.
| (a) | The Registrant’s President and Treasurer have reviewed the Registrant's disclosure controls and procedures (as defined in Rule 30a-3(c) under the Investment Company Act of 1940 (the “Act”)) as of a date within 90 days of the filing of this report, as required by Rule 30a-3(b) under the Act and Rules 13a-15(b) or 15d-15(b) under the Securities Exchange Act of 1934. Based on their review, such officers have concluded that the disclosure controls and procedures are effective in ensuring that information required to be disclosed in this report is appropriately recorded, processed, summarized and reported and made known to them by others within the Registrant and by the Registrant’s service provider. |
| (b) | There were no changes in the Registrant's internal control over financial reporting (as defined in Rule 30a-3(d) under the Act) that occurred during the period covered by this report that has materially affected, or is reasonably likely to materially affect, the Registrant's internal control over financial reporting. |
Item 12. Disclosure of Securities Lending Activities for Closed-End Management Investment Companies.
Not applicable to open-end investment companies.
Item 13. Exhibits.
(2) A separate certification for each principal executive and principal financial officer pursuant to Rule 30a-2(a) under the Act (17 CFR 270.30a-2(a)). Filed herewith.
(3) Any written solicitation to purchase securities under Rule 23c-1 under the Act sent or given during the period covered by the report by or on behalf of the registrant to 10 or more persons. Not applicable to open-end investment companies.
(4) Change in the registrant’s independent public accountant. There was no change in the registrant’s independent public accountant for the period covered by this report.
SIGNATURES
Pursuant to the requirements of the Securities Exchange Act of 1934 and the Investment Company Act of 1940, the registrant has duly caused this report to be signed on its behalf by the undersigned, thereunto duly authorized.
| Matrix Advisors Funds Trust | |
| | |
| By | /s/ David A. Katz | |
| | David A. Katz, President | |
| | |
| Date | 9/7/2023 | |
Pursuant to the requirements of the Securities Exchange Act of 1934 and the Investment Company Act of 1940, this report has been signed below by the following persons on behalf of the registrant and in the capacities and on the dates indicated.
| By | /s/ David A. Katz | |
| | David A. Katz, President | |
| | | |
| Date | 9/7/2023 | |