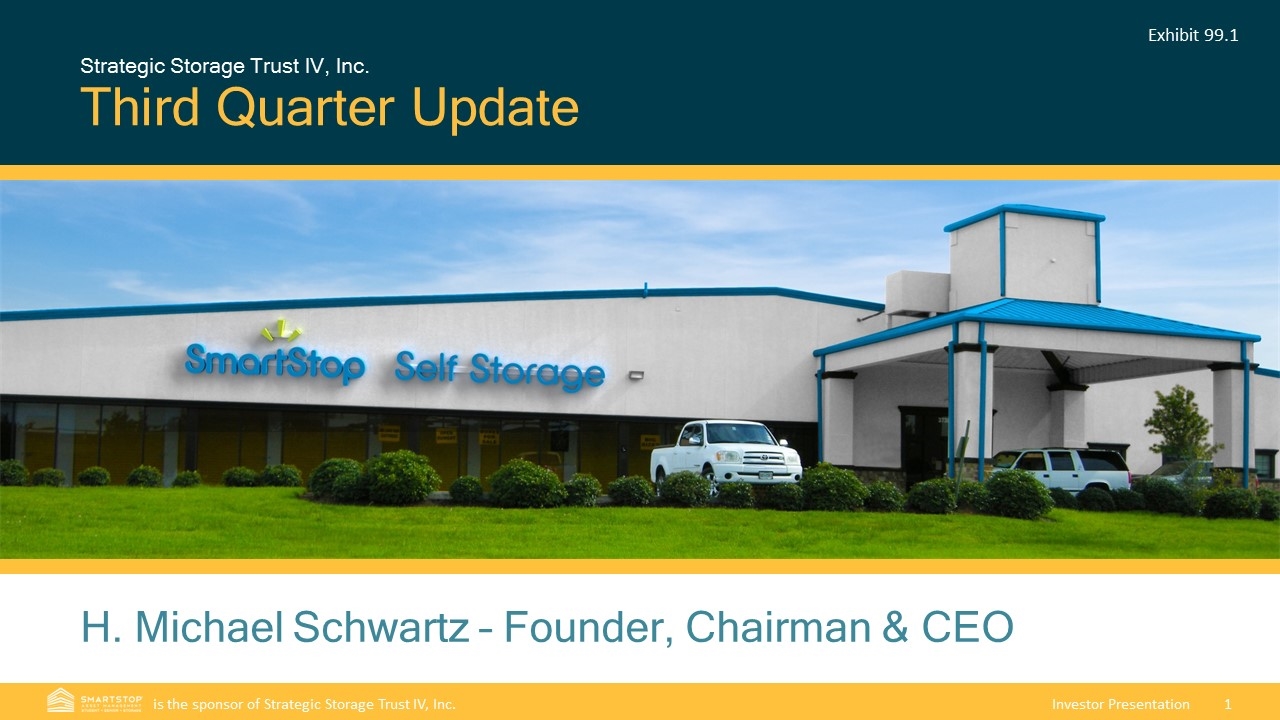
Third Quarter Update Strategic Storage Trust IV, Inc. This property is not owned by Strategic Storage Trust IV, Inc. This property is owned by our sponsor. H. Michael Schwartz – Founder, Chairman & CEO Exhibit 99.1
Disclaimer & Risk Factors This investor presentation may contain certain forward-looking statements within the meaning of Section 27A of the Securities Act of 1933, as amended, and Section 21E of the Securities Exchange Act of 1934, as amended. Such forward-looking statements can generally be identified by our use of forward-looking terminology such as “may,” “will,” “expect,” “intend,” “anticipate,” “estimate,” “believe,” “continue,” or other similar words. Because such statements include risks, uncertainties and contingencies, actual results may differ materially from the expectations, intentions, beliefs, plans or predictions of the future expressed or implied by such forward-looking statements. These risks, uncertainties and contingencies include, but are not limited to: uncertainties relating to changes in general economic and real estate conditions; uncertainties relating to the implementation of our real estate investment strategy; uncertainties relating to financing availability and capital proceeds; uncertainties relating to the closing of property acquisitions; uncertainties related to the timing and availability of distributions; and other risk factors as outlined in the Company’s public filings with the Securities and Exchange Commission. This is neither an offer nor a solicitation to purchase securities. See our Form 10-K and recent Form 10-Q for specific risks associated with an investment in Strategic Storage Trust IV, Inc. As of September 30, 2018, our accumulated deficit was approximately $3.9 million and we anticipate that our operations will not be profitable in 2018. We have paid distributions from sources other than our cash flows from operations, including from the net proceeds of our public offering, including our distribution reinvestment plan (DRP offering). We are not prohibited from undertaking such activities by our charter, bylaws or investment policies, and we may use an unlimited amount from any source to pay our distributions. For the year ended December 31, 2017, the payment of distributions was paid 79.1% from proceeds of our public and private offerings and 20.9% from our DRP offering. For the nine months ended September 30, 2018, the payment of distributions was paid 57.3% from proceeds of our public offering and 42.7% from our DRP offering. If we continue to pay distributions from sources other than cash flows from operations, we will have fewer funds available for acquiring properties, which may reduce our stockholders’ overall returns. Additionally, to the extent distributions exceed cash flows from operations, a stockholder’s basis in our stock may be reduced and, to the extent distributions exceed a stockholder’s basis, the stockholder may recognize a capital gain. No public market currently exists for shares of our common stock and we may not list our shares on a national securities exchange before three to five years after completion of our public offering, if at all; therefore, it may be difficult for our stockholders to sell their shares. If our stockholders sell their shares, it will likely be at a substantial discount. Our charter does not require us to pursue a liquidity transaction at any time. Until we generate operating cash flows sufficient to pay distributions to our stockholders, we may pay distributions from financing activities, which may include borrowings in anticipation of future cash flows or the net proceeds of our public offering (which may constitute a return of capital). It is likely that we will be required to use return of capital to fund distributions (if any) in at least the first few years of operation. We are not prohibited from undertaking such activities by our charter, bylaws or investment policies, and we may use an unlimited amount from any source to pay our distributions, and it is likely that we will use offering proceeds to fund a majority of our initial distributions. This is an initial public offering; we have no operating history, and the prior performance of real estate programs sponsored by affiliates of our sponsor may not be indicative of our future results. This is a "best efforts" offering. If we are unable to raise substantial funds in our public offering, we may not be able to invest in a diverse portfolio of real estate and real estate-related investments, and the value of our stockholders’ investment may fluctuate more widely with the performance of specific investments. We are a "blind pool" because we have not identified any properties to acquire with the net proceeds from our public offering. As a result, our stockholders will not be able to evaluate the economic merits of our future investments prior to their purchase. We may be unable to invest the net proceeds from our public offering on acceptable terms to investors, or at all. Investors in our public offering will experience immediate dilution in their investment primarily because (i) we pay upfront fees in connection with the sale of our shares that reduce the proceeds to us, (ii) on January 25, 2017 we sold approximately 360,577 shares of our Class A common stock at a purchase price of approximately $20.80 per share in a private offering transaction as described above, and (iii) we paid offering expenses in connection with our private offering transaction. There are substantial conflicts of interest among us and our sponsor, advisor, property manager, transfer agent and dealer manager. Our advisor will face conflicts of interest relating to the purchase of properties, including conflicts with Strategic Storage Trust II, Inc. and Strategic Storage Growth Trust, Inc., and such conflicts may not be resolved in our favor, which could adversely affect our investment opportunities. We have no employees and must depend on our advisor to select investments and conduct our operations, and there is no guarantee that our advisor will devote adequate time or resources to us. We will pay substantial fees and expenses to our advisor, its affiliates and participating broker-dealers, which will reduce cash available for investment and distribution. We may incur substantial debt, which could hinder our ability to pay distributions to our stockholders or could decrease the value of your investment. We may fail to qualify as a REIT, which could adversely affect our operations and our ability to make distributions. Our board of directors may change any of our investment objectives without stockholders consent.
SmartStop Asset Management, LLC
Why SmartStop Asset Management? SmartStop Asset Management, LLC is a diversified real estate company with a managed portfolio that currently includes approximately $1.7 billion of assets. Sponsor, Advisor, and Manager of three public, non-traded REITs focusing on self storage properties Sponsor of public, non-traded REIT investing in student & senior housing Sold first REIT, SmartStop Self Storage, to Extra Space (NYSE: EXR) for $1.4 billion in October 2015 Company and affiliates have acquired over $4 billion in real estate assets over the past 13 years National sponsor of 1031 DST programs Experienced developer of self storage and mixed-use properties in the U.S. and Toronto, including ground up & redevelopment projects Growing portfolio of properties in the greater Toronto area, comprising over 1 million net rentable square feet Over 325 employees, including 36 in Toronto, Canada Current portfolio comprises approximately 10.8 million rentable square feet across 20 states & Toronto, Canada
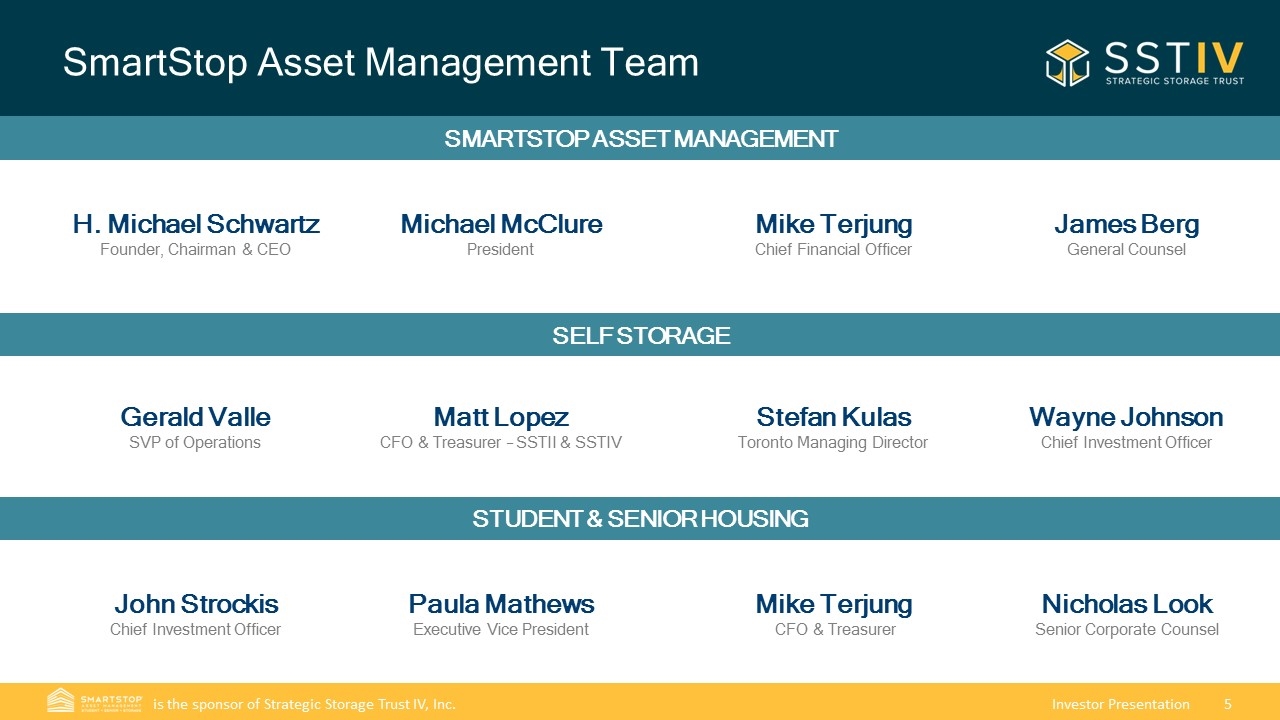
SmartStop Asset Management Team STUDENT & SENIOR HOUSING SELF STORAGE H. Michael Schwartz Founder, Chairman & CEO Wayne Johnson Chief Investment Officer Mike Terjung Chief Financial Officer Michael McClure President Paula Mathews Executive Vice President James Berg General Counsel Matt Lopez CFO & Treasurer – SSTII & SSTIV John Strockis Chief Investment Officer Stefan Kulas Toronto Managing Director Mike Terjung CFO & Treasurer Nicholas Look Senior Corporate Counsel SMARTSTOP ASSET MANAGEMENT Gerald Valle SVP of Operations
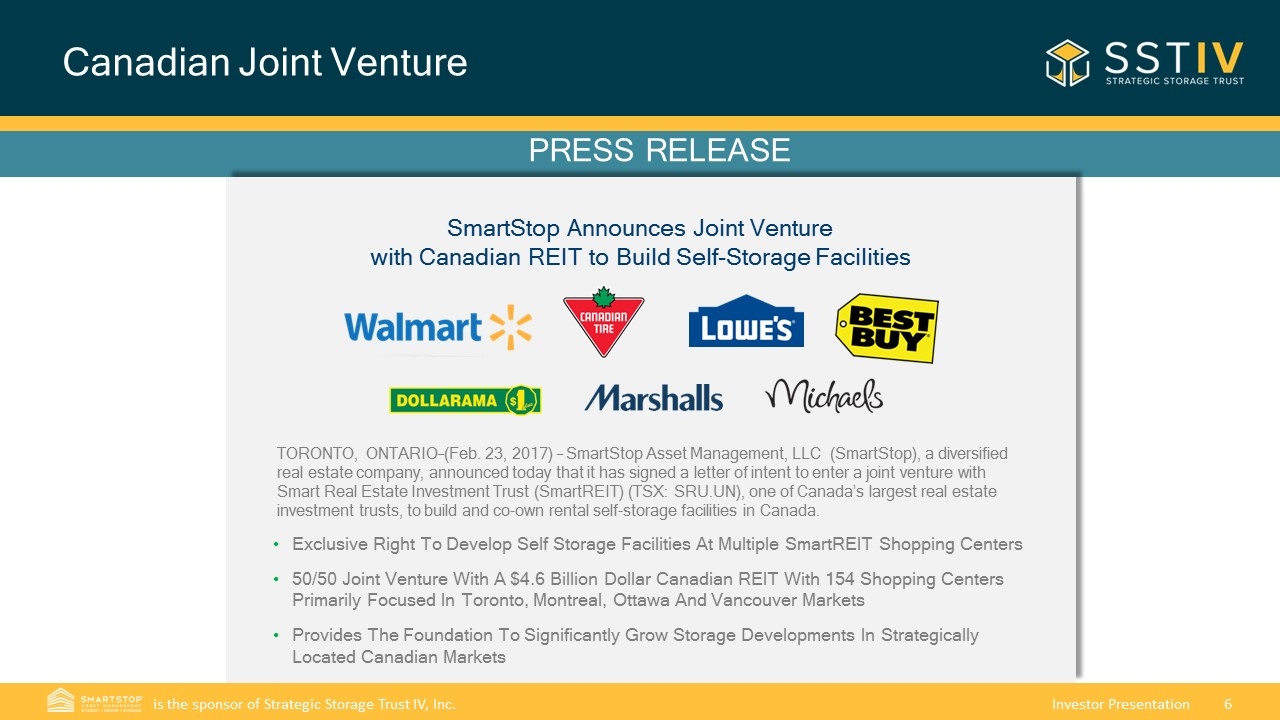
Canadian Joint Venture PRESS RELEASE TORONTO, ONTARIO–(Feb. 23, 2017) – SmartStop Asset Management, LLC (SmartStop), a diversified real estate company, announced today that it has signed a letter of intent to enter a joint venture with Smart Real Estate Investment Trust (SmartREIT) (TSX: SRU.UN), one of Canada’s largest real estate investment trusts, to build and co-own rental self-storage facilities in Canada. Exclusive Right To Develop Self Storage Facilities At Multiple SmartREIT Shopping Centers 50/50 Joint Venture With A $4.6 Billion Dollar Canadian REIT With 154 Shopping Centers Primarily Focused In Toronto, Montreal, Ottawa And Vancouver Markets Provides The Foundation To Significantly Grow Storage Developments In Strategically Located Canadian Markets SmartStop Announces Joint Venture with Canadian REIT to Build Self-Storage Facilities
Self Storage
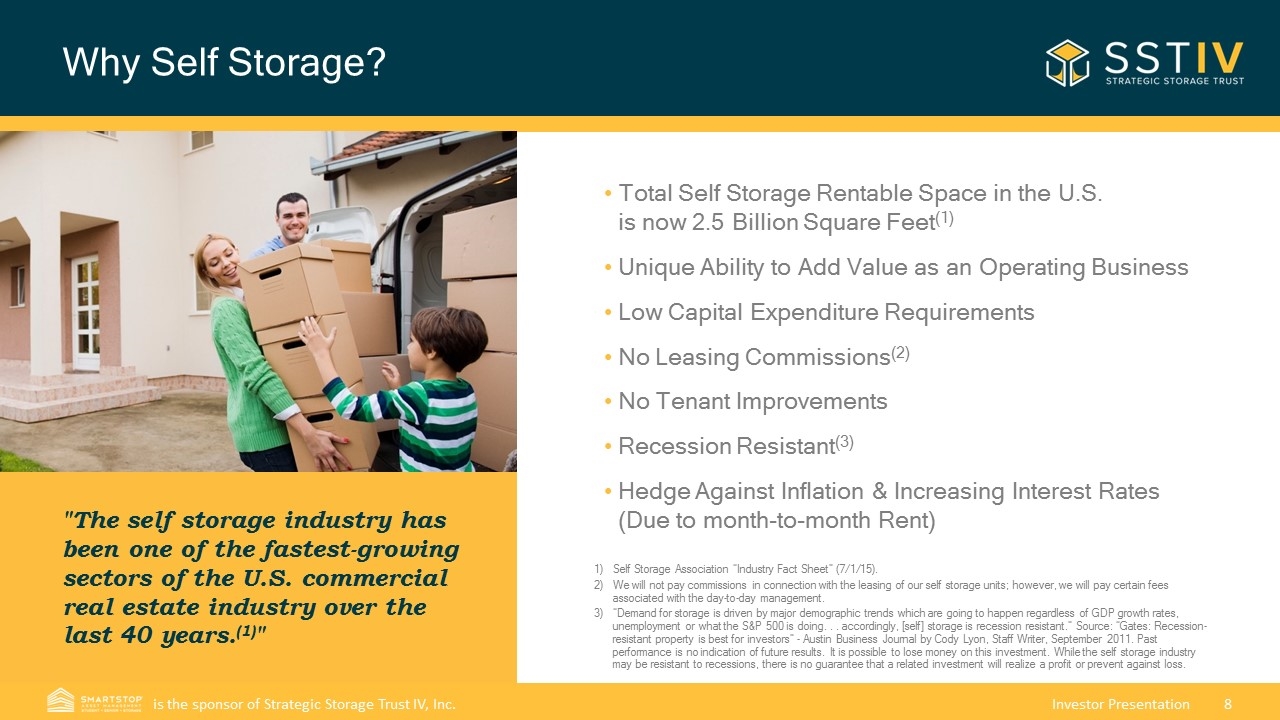
Why Self Storage? Total Self Storage Rentable Space in the U.S. is now 2.5 Billion Square Feet(1) Unique Ability to Add Value as an Operating Business Low Capital Expenditure Requirements No Leasing Commissions(2) No Tenant Improvements Recession Resistant(3) Hedge Against Inflation & Increasing Interest Rates (Due to month-to-month Rent) "The self storage industry has been one of the fastest-growing sectors of the U.S. commercial real estate industry over the last 40 years.(1)" Self Storage Association “Industry Fact Sheet” (7/1/15). We will not pay commissions in connection with the leasing of our self storage units; however, we will pay certain fees associated with the day-to-day management. “Demand for storage is driven by major demographic trends which are going to happen regardless of GDP growth rates, unemployment or what the S&P 500 is doing. . . accordingly, [self] storage is recession resistant.” Source: “Gates: Recession-resistant property is best for investors” - Austin Business Journal by Cody Lyon, Staff Writer, September 2011. Past performance is no indication of future results. It is possible to lose money on this investment. While the self storage industry may be resistant to recessions, there is no guarantee that a related investment will realize a profit or prevent against loss.
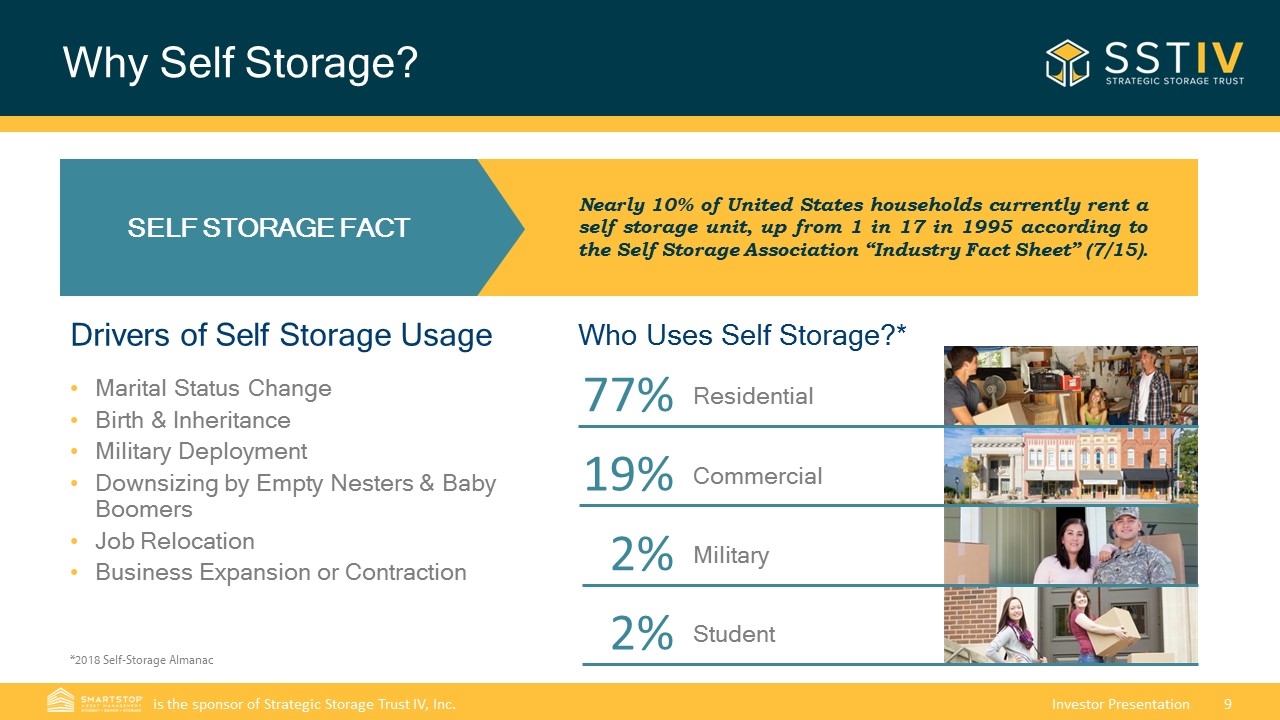
Why Self Storage? SELF STORAGE FACT Nearly 10% of United States households currently rent a self storage unit, up from 1 in 17 in 1995 according to the Self Storage Association “Industry Fact Sheet” (7/15). Drivers of Self Storage Usage Marital Status Change Birth & Inheritance Military Deployment Downsizing by Empty Nesters & Baby Boomers Job Relocation Business Expansion or Contraction Who Uses Self Storage?* 77% 19% 2% 2% Residential Commercial Military Student *2018 Self-Storage Almanac
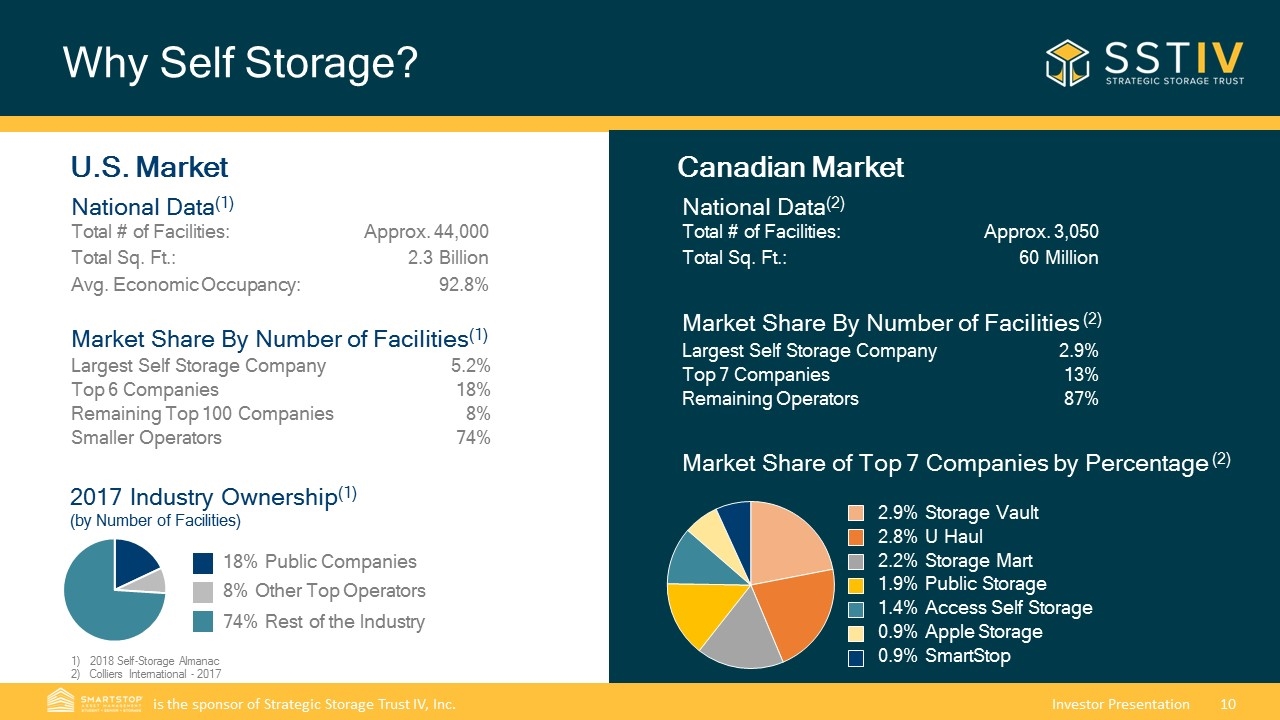
Why Self Storage? National Data(1) Total # of Facilities: Approx. 44,000 Total Sq. Ft.: 2.3 Billion Avg. Economic Occupancy: 92.8% Market Share By Number of Facilities(1) Largest Self Storage Company 5.2% Top 6 Companies 18% Remaining Top 100 Companies 8% Smaller Operators 74% 2018 Self-Storage Almanac Colliers International - 2017 2017 Industry Ownership(1) (by Number of Facilities) 8% Other Top Operators 18% Public Companies 74% Rest of the Industry U.S. Market Canadian Market National Data(2) Total # of Facilities: Approx. 3,050 Total Sq. Ft.: 60 Million Market Share By Number of Facilities (2) Largest Self Storage Company 2.9% Top 7 Companies 13% Remaining Operators 87% 2.9% Storage Vault 2.8% U Haul 2.2% Storage Mart 1.9% Public Storage 1.4% Access Self Storage 0.9% Apple Storage 0.9% SmartStop Market Share of Top 7 Companies by Percentage (2)
Strategic Storage Trust IV, Inc.
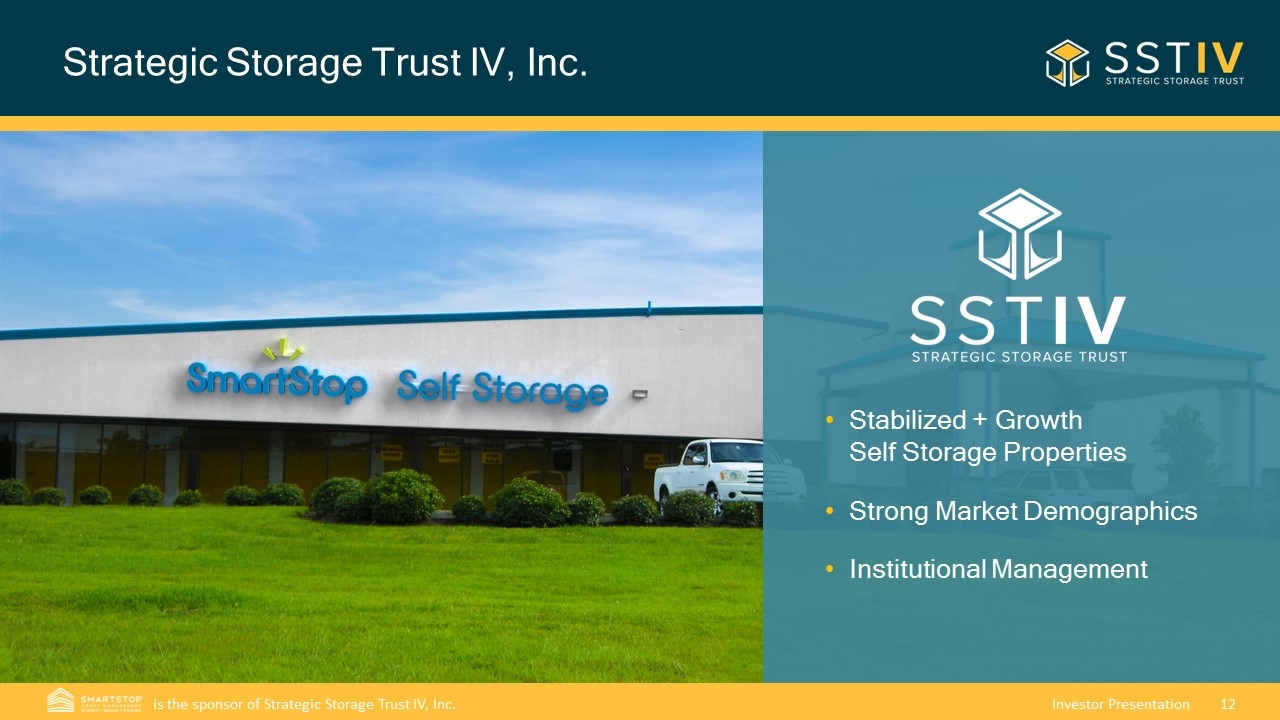
Strategic Storage Trust IV, Inc. Stabilized + Growth Self Storage Properties Strong Market Demographics Institutional Management
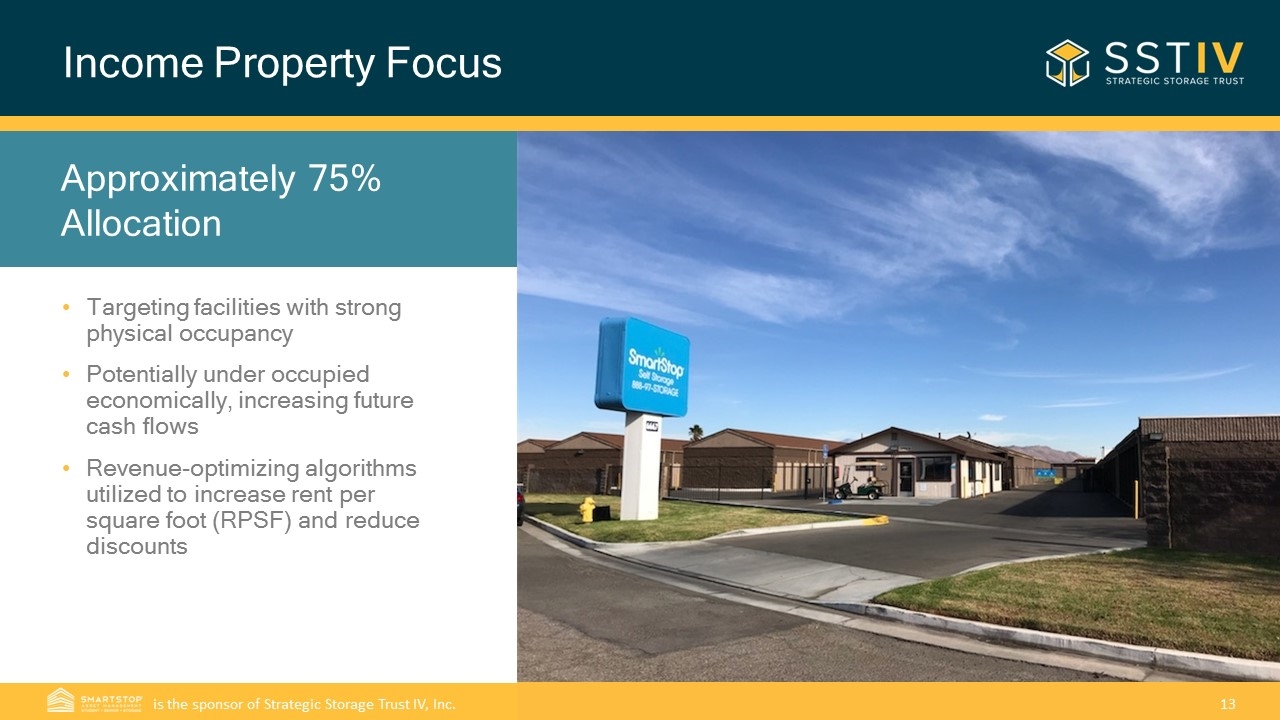
Income Property Focus Targeting facilities with strong physical occupancy Potentially under occupied economically, increasing future cash flows Revenue-optimizing algorithms utilized to increase rent per square foot (RPSF) and reduce discounts Approximately 75% Allocation
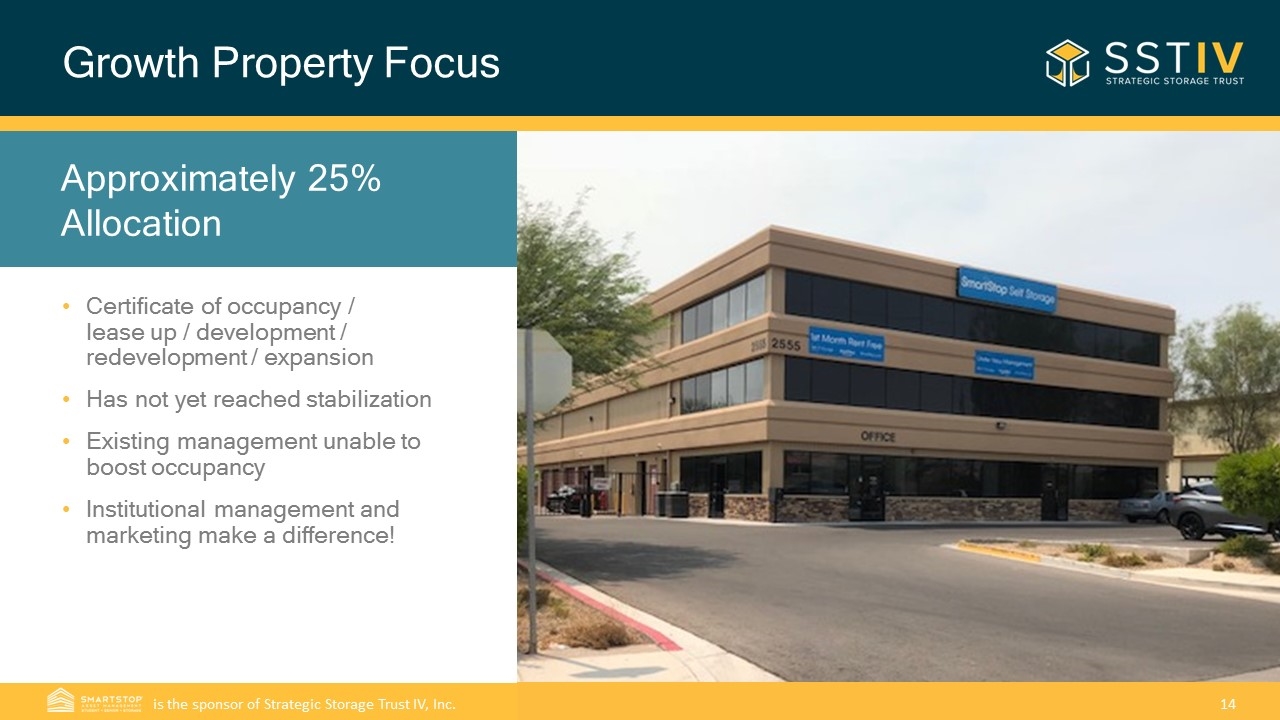
Growth Property Focus Certificate of occupancy / lease up / development / redevelopment / expansion Has not yet reached stabilization Existing management unable to boost occupancy Institutional management and marketing make a difference! Student & Senior Housing Approximately 25% Allocation
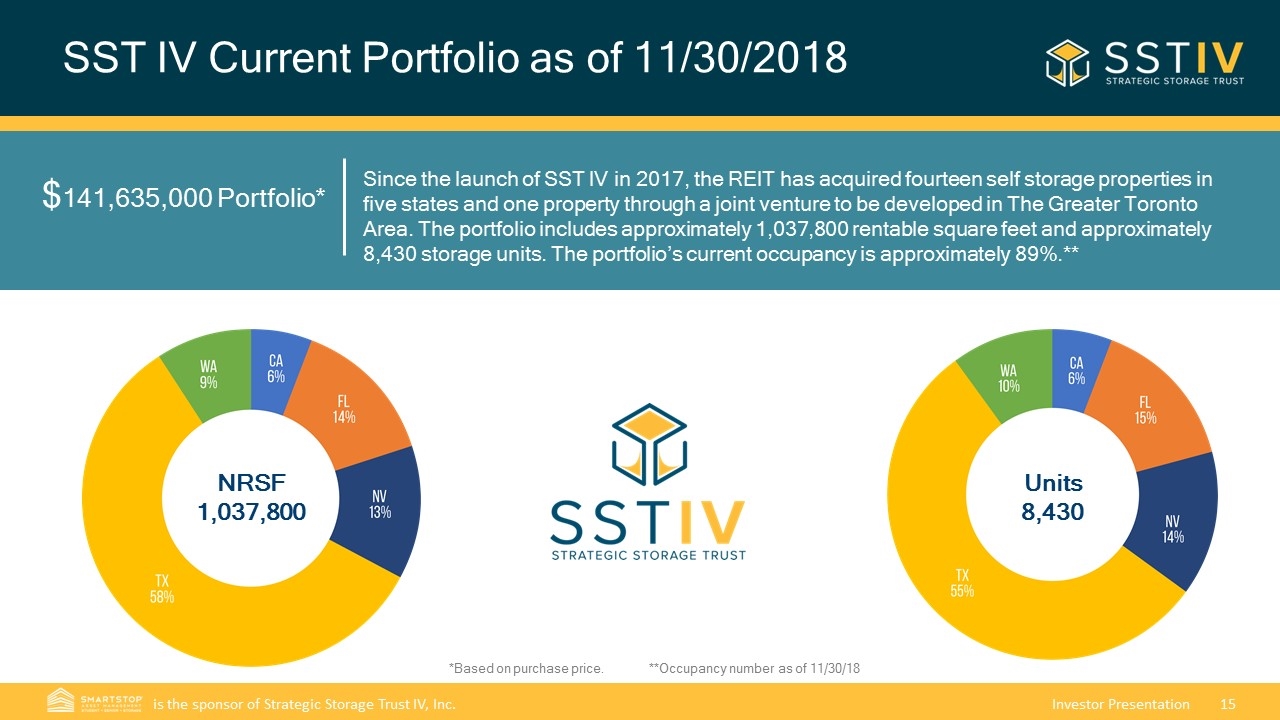
SST IV Current Portfolio as of 11/30/2018 $141,635,000 Portfolio* Since the launch of SST IV in 2017, the REIT has acquired fourteen self storage properties in five states and one property through a joint venture to be developed in The Greater Toronto Area. The portfolio includes approximately 1,037,800 rentable square feet and approximately 8,430 storage units. The portfolio’s current occupancy is approximately 89%.** NRSF 1,037,800 Units 8,430 **Occupancy number as of 11/30/18 *Based on purchase price.
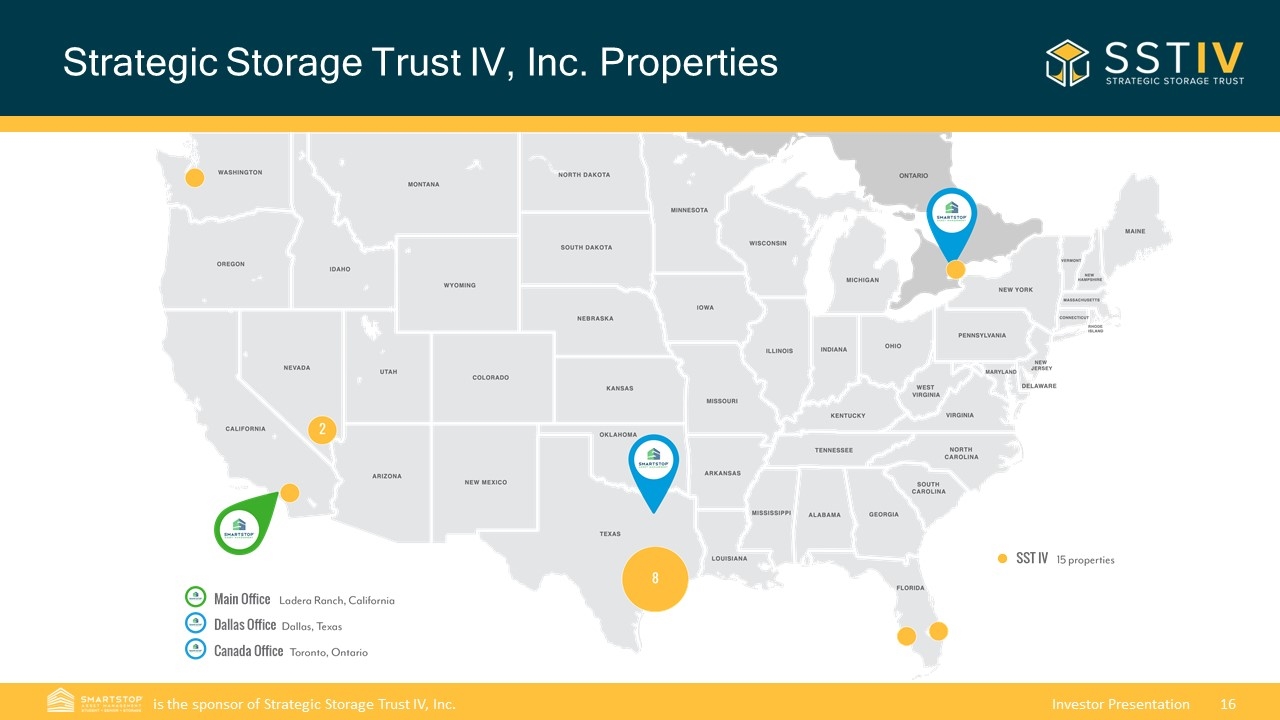
Strategic Storage Trust IV, Inc. Properties
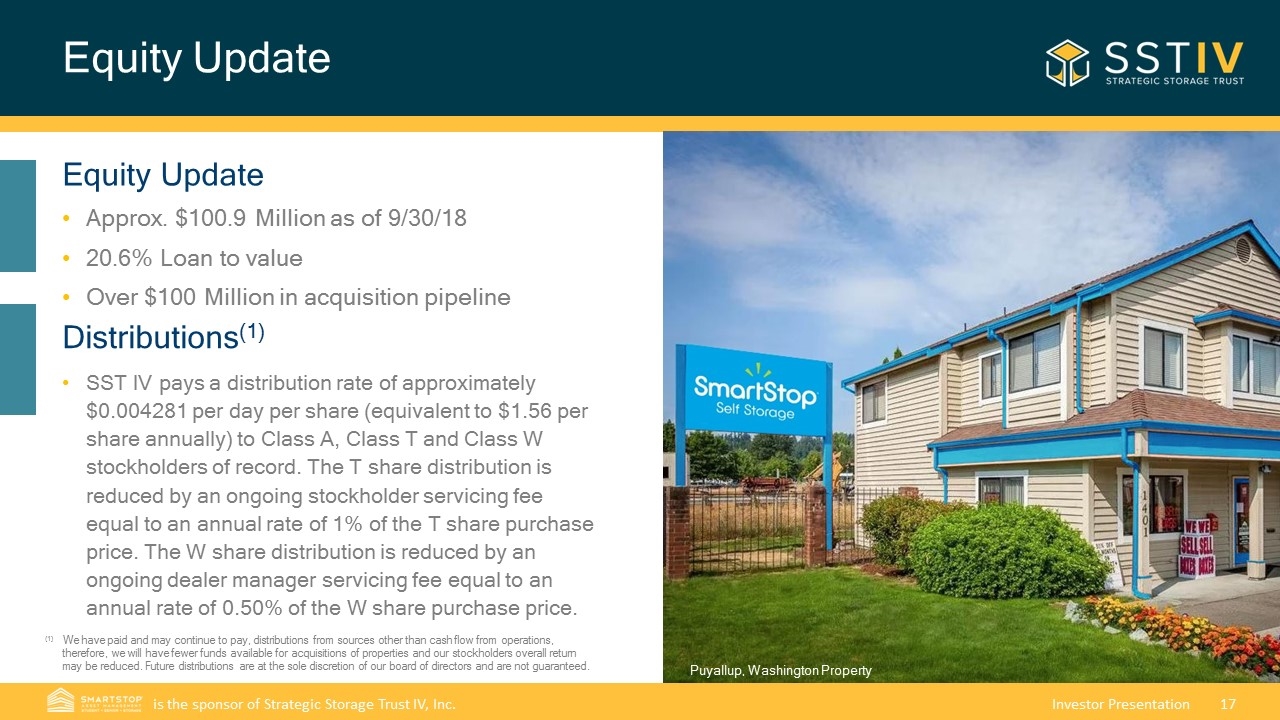
Equity Update Puyallup, Washington Property Equity Update Approx. $100.9 Million as of 9/30/18 20.6% Loan to value Over $100 Million in acquisition pipeline Distributions(1) SST IV pays a distribution rate of approximately $0.004281 per day per share (equivalent to $1.56 per share annually) to Class A, Class T and Class W stockholders of record. The T share distribution is reduced by an ongoing stockholder servicing fee equal to an annual rate of 1% of the T share purchase price. The W share distribution is reduced by an ongoing dealer manager servicing fee equal to an annual rate of 0.50% of the W share purchase price. (1) We have paid and may continue to pay, distributions from sources other than cash flow from operations, therefore, we will have fewer funds available for acquisitions of properties and our stockholders overall return may be reduced. Future distributions are at the sole discretion of our board of directors and are not guaranteed.
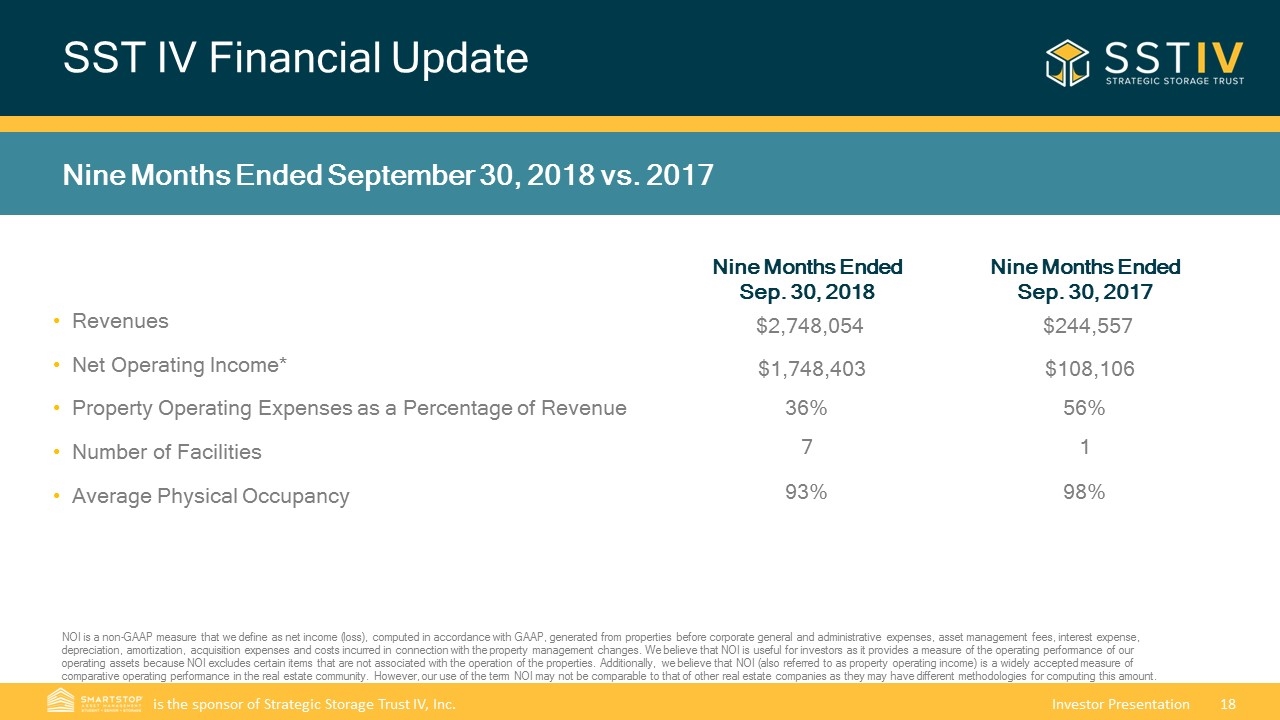
SST IV Financial Update Revenues Net Operating Income* Property Operating Expenses as a Percentage of Revenue Number of Facilities Average Physical Occupancy Nine Months Ended Sep. 30, 2018 $2,748,054 $1,748,403 36% 7 93% Nine Months Ended Sep. 30, 2017 $244,557 $108,106 56% 1 98% NOI is a non-GAAP measure that we define as net income (loss), computed in accordance with GAAP, generated from properties before corporate general and administrative expenses, asset management fees, interest expense, depreciation, amortization, acquisition expenses and costs incurred in connection with the property management changes. We believe that NOI is useful for investors as it provides a measure of the operating performance of our operating assets because NOI excludes certain items that are not associated with the operation of the properties. Additionally, we believe that NOI (also referred to as property operating income) is a widely accepted measure of comparative operating performance in the real estate community. However, our use of the term NOI may not be comparable to that of other real estate companies as they may have different methodologies for computing this amount. Nine Months Ended September 30, 2018 vs. 2017
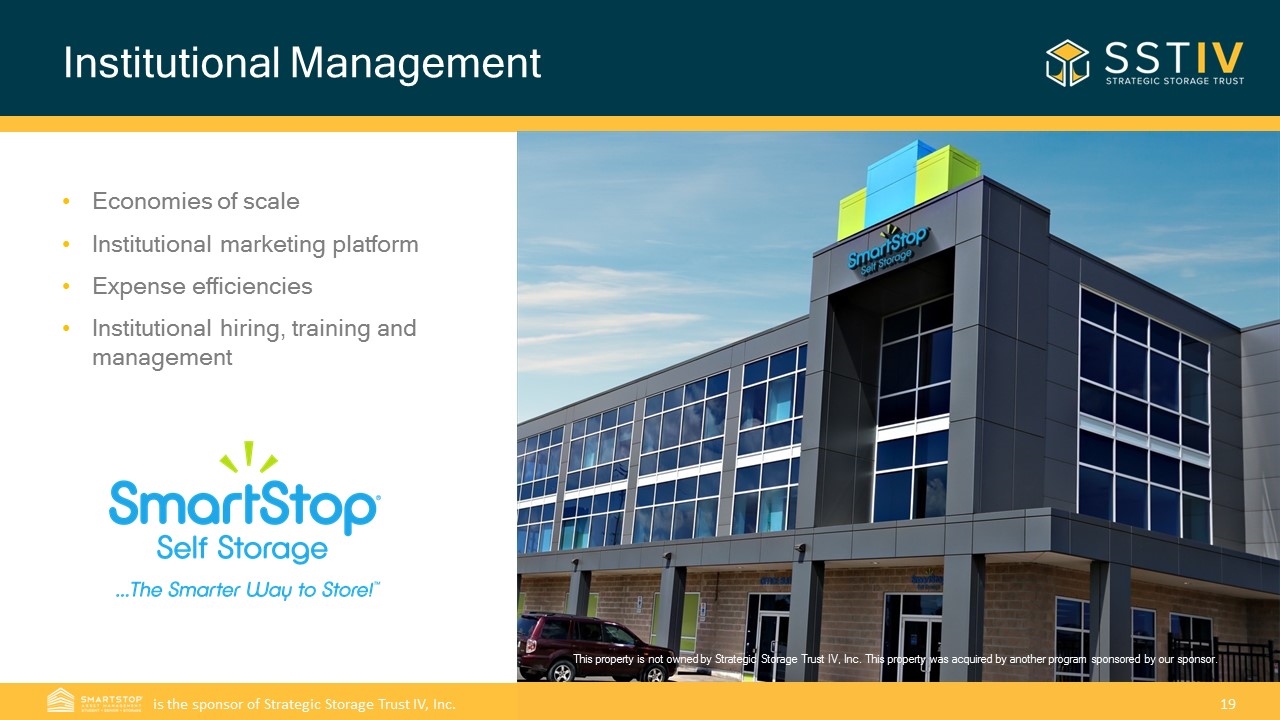
Institutional Management Economies of scale Institutional marketing platform Expense efficiencies Institutional hiring, training and management This property is not owned by Strategic Storage Trust IV, Inc. This property was acquired by another program sponsored by our sponsor.
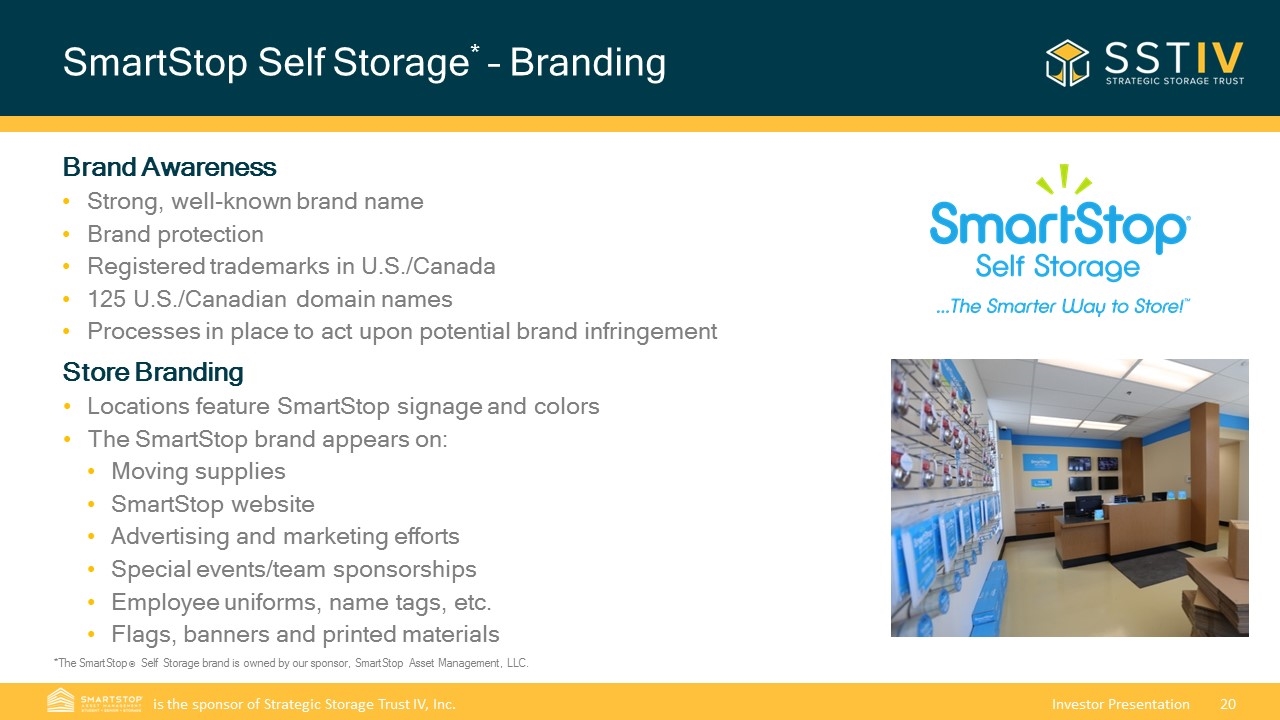
SmartStop Self Storage* – Branding Brand Awareness Strong, well-known brand name Brand protection Registered trademarks in U.S./Canada 125 U.S./Canadian domain names Processes in place to act upon potential brand infringement Store Branding Locations feature SmartStop signage and colors The SmartStop brand appears on: Moving supplies SmartStop website Advertising and marketing efforts Special events/team sponsorships Employee uniforms, name tags, etc. Flags, banners and printed materials *The SmartStop® Self Storage brand is owned by our sponsor, SmartStop Asset Management, LLC.
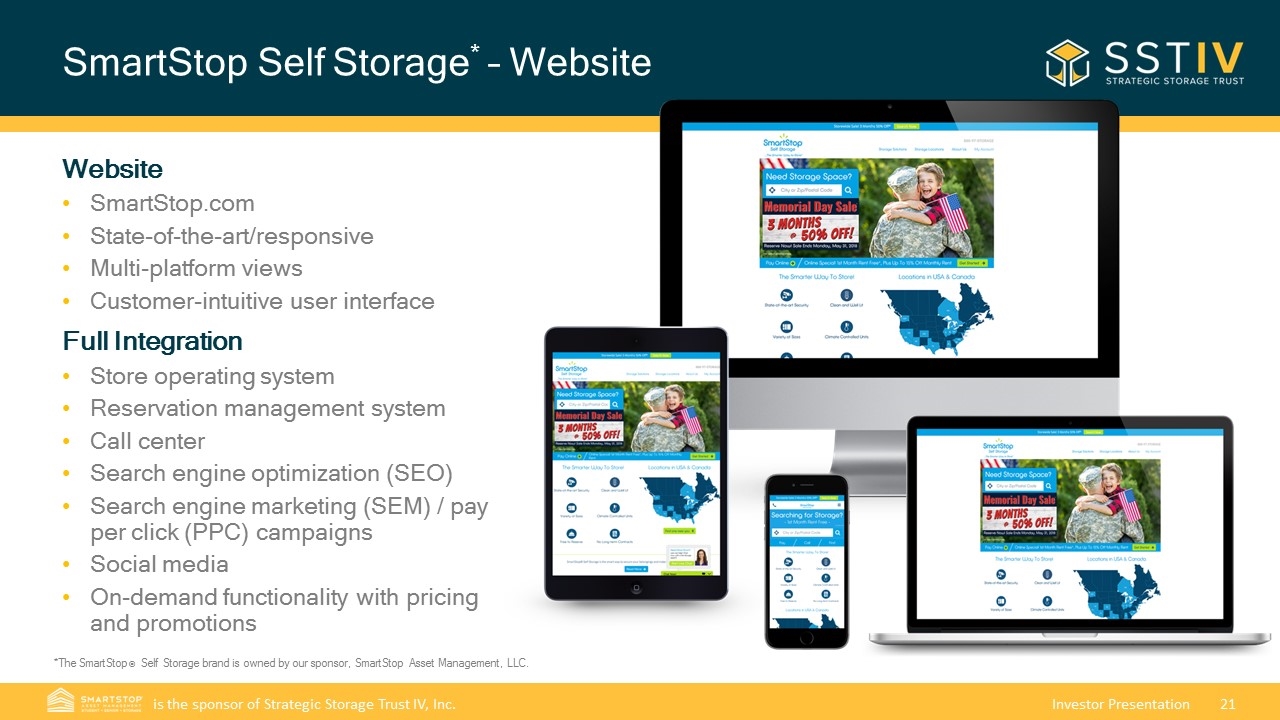
SmartStop Self Storage* – Website Website SmartStop.com State-of-the-art/responsive Multi-platform views Customer-intuitive user interface Full Integration Store operating system Reservation management system Call center Search engine optimization (SEO) Search engine marketing (SEM) / pay per click (PPC) campaigns Social media On-demand functionality with pricing and promotions *The SmartStop® Self Storage brand is owned by our sponsor, SmartStop Asset Management, LLC.
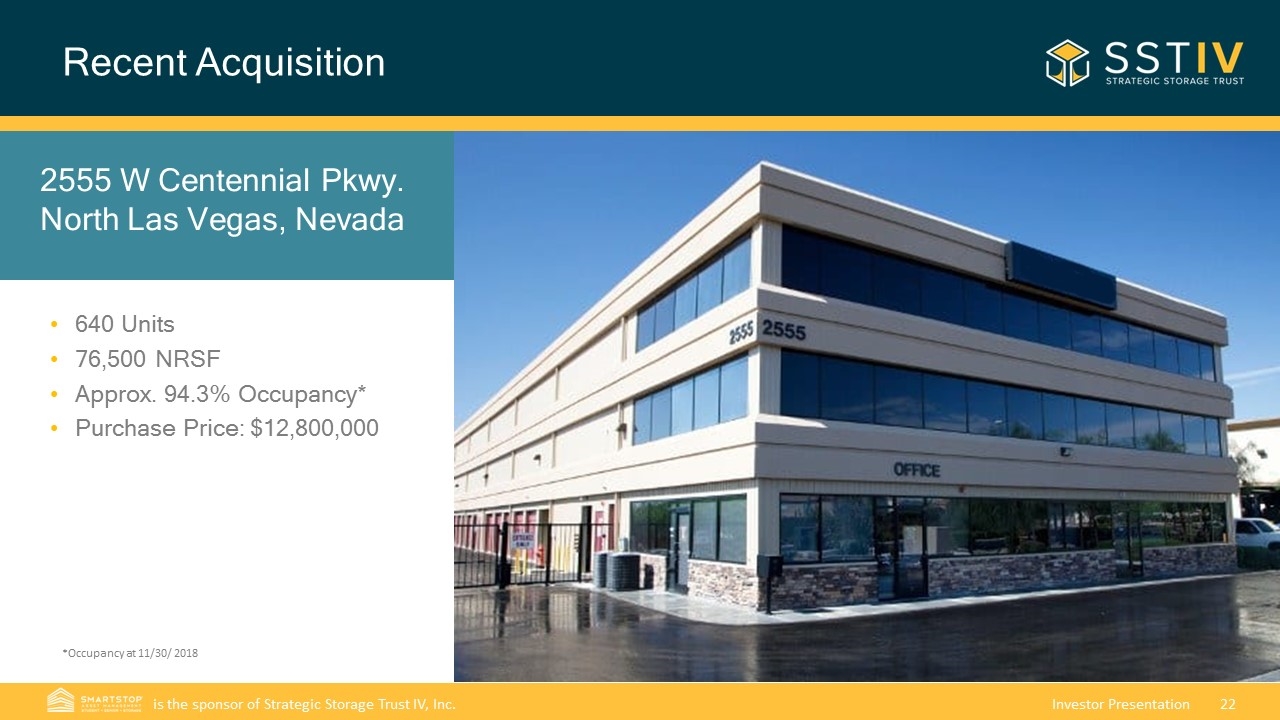
Recent Acquisition 2555 W Centennial Pkwy. North Las Vegas, Nevada 640 Units 76,500 NRSF Approx. 94.3% Occupancy* Purchase Price: $12,800,000 *Occupancy number as of 5/23/2018 *Occupancy at 11/30/ 2018
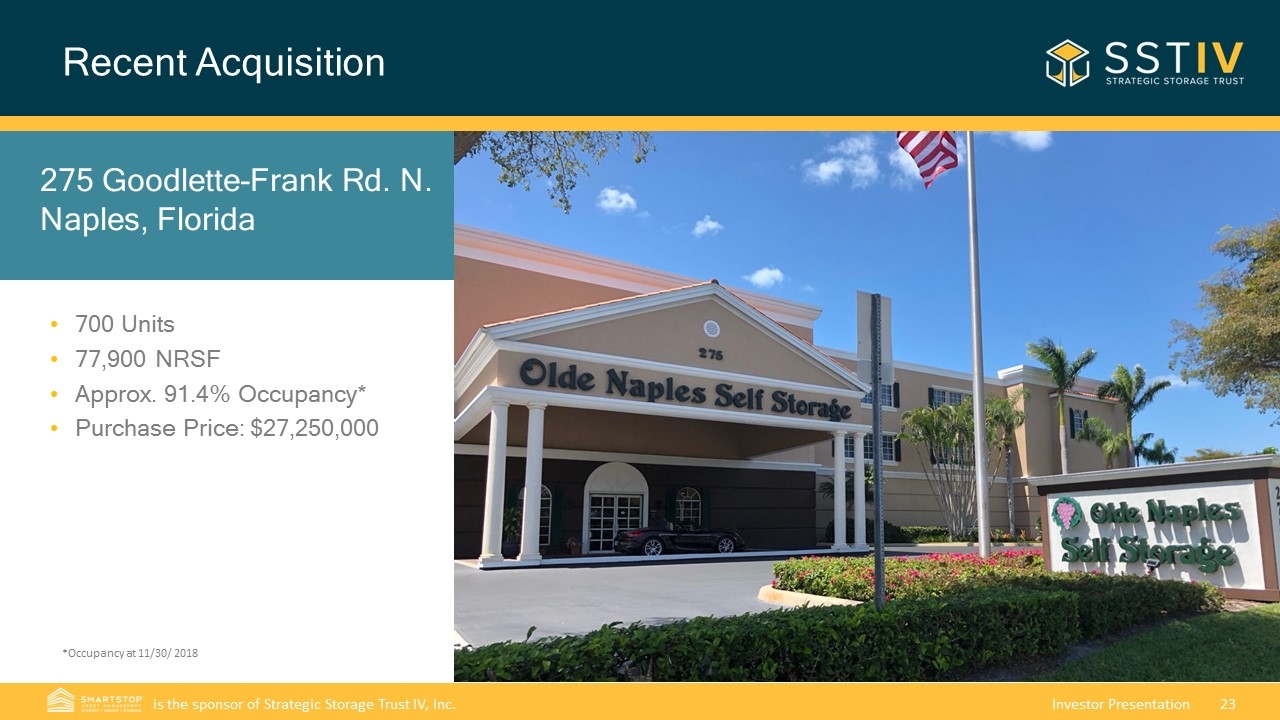
Recent Acquisition 275 Goodlette-Frank Rd. N. Naples, Florida 700 Units 77,900 NRSF Approx. 91.4% Occupancy* Purchase Price: $27,250,000 *Occupancy number as of 5/23/2018 *Occupancy at 11/30/ 2018
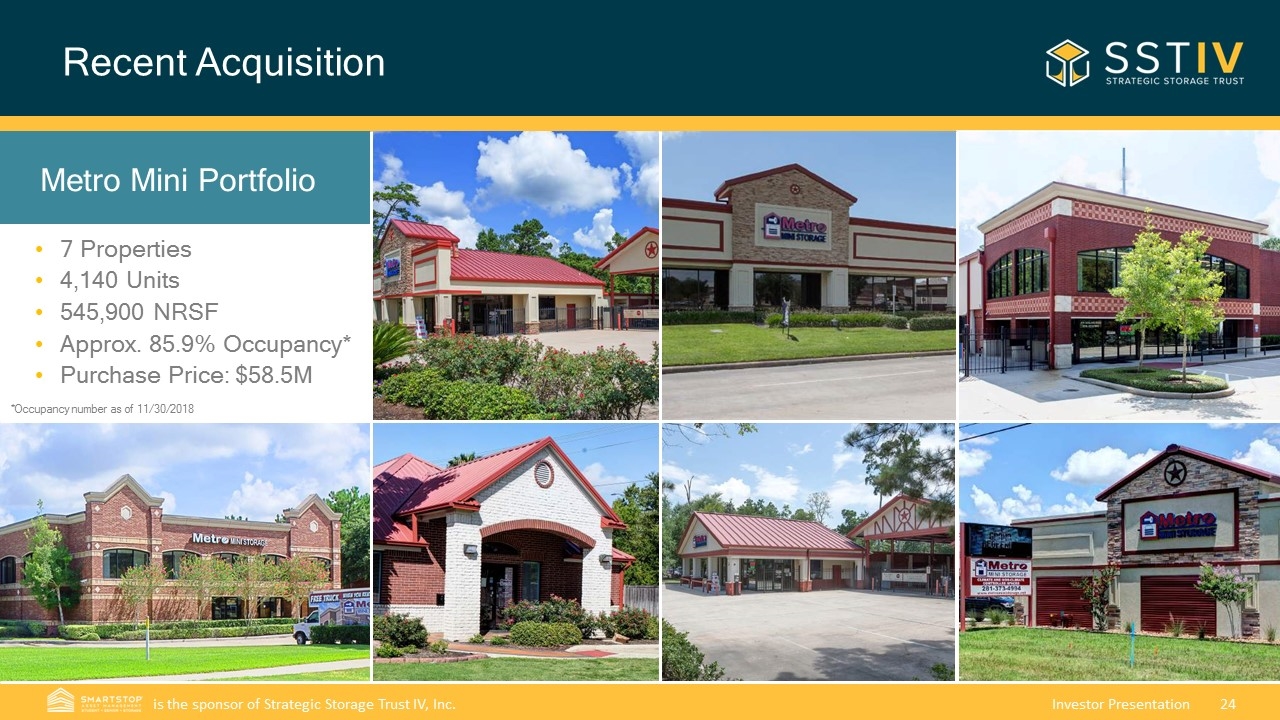
Recent Acquisition Metro Mini Portfolio 7 Properties 4,140 Units 545,900 NRSF Approx. 85.9% Occupancy* Purchase Price: $58.5M *Occupancy number as of 11/30/2018
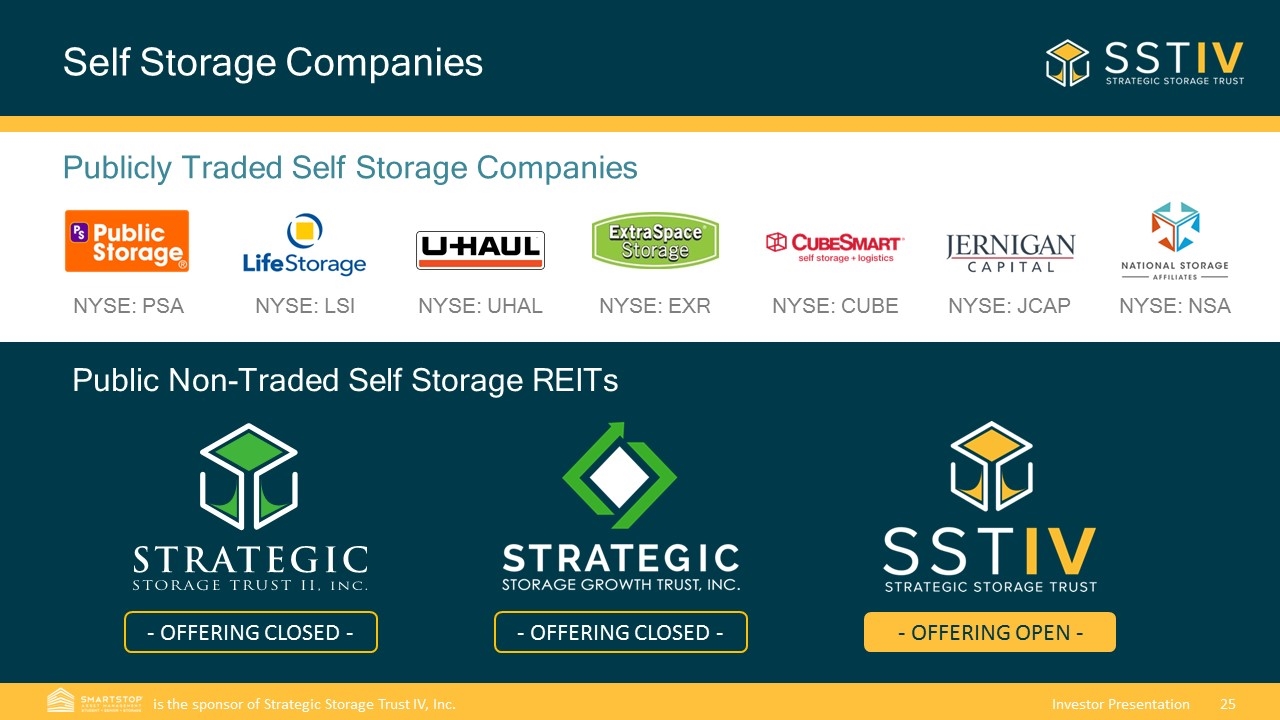
Self Storage Companies Publicly Traded Self Storage Companies NYSE: EXR NYSE: PSA NYSE: CUBE NYSE: LSI NYSE: UHAL NYSE: JCAP NYSE: NSA Public Non-Traded Self Storage REITs - OFFERING CLOSED - - OFFERING CLOSED - - OFFERING OPEN -

Questions?


