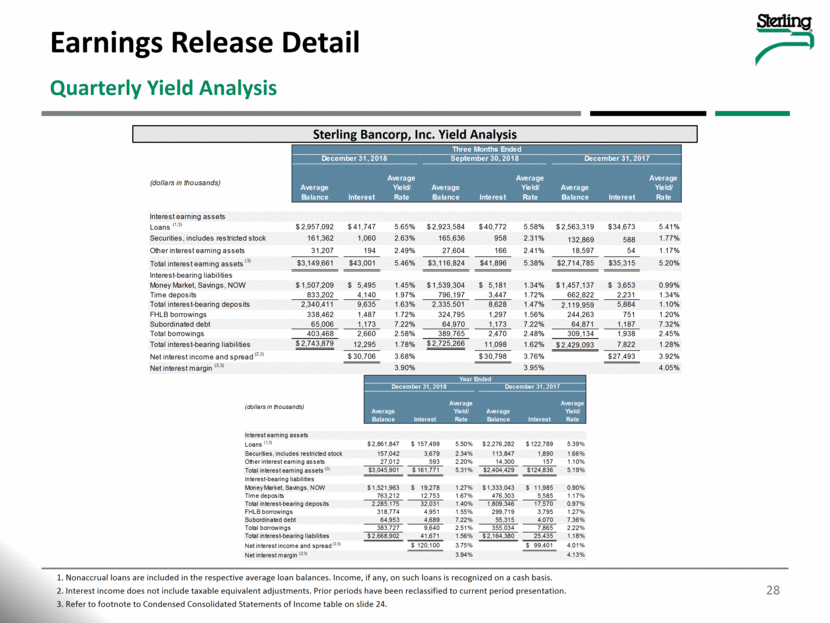
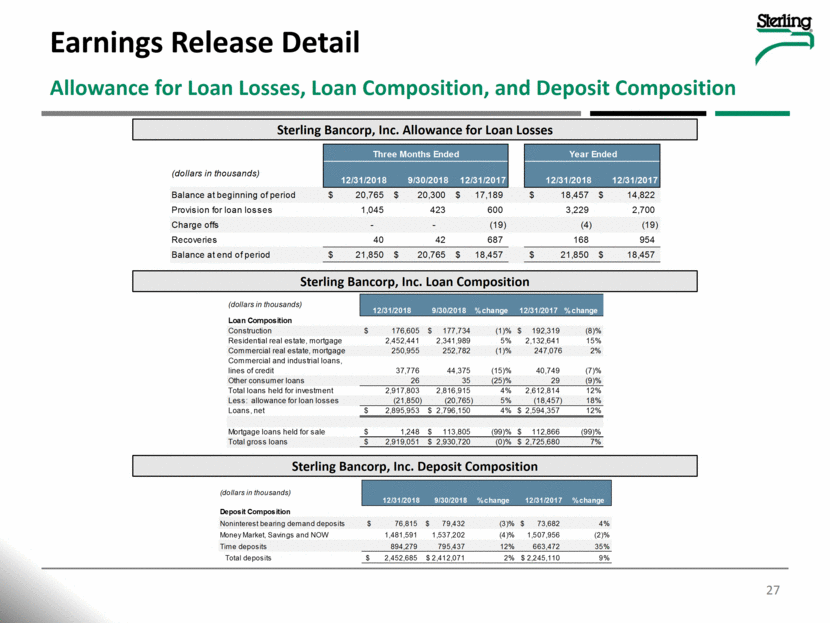
Earnings Release Detail 28 Quarterly Yield Analysis 1. Nonaccrual loans are included in the respective average loan balances. Income, if any, on such loans is recognized on a cash basis. 2. Interest income does not include taxable equivalent adjustments. Prior periods have been reclassified to current period presentation. 3. Refer to footnote to Condensed Consolidated Statements of Income table on slide 24. Sterling Bancorp, Inc. Yield Analysis (dollars in thousands) Average Balance Interest Average Yield/ Rate Average Balance Interest Average Yield/ Rate Average Balance Interest Average Yield/ Rate Interest earning assets Loans (1,3) 2,957,092 $ 41,747 $ 5.65% 2,923,584 $ 40,772 $ 5.58% 2,563,319 $ 34,673 $ 5.41% Securities, includes restricted stock 161,362 1,060 2.63% 165,636 958 2.31% 132,869 588 1.77% Other interest earning assets 31,207 194 2.49% 27,604 166 2.41% 18,597 54 1.17% Total interest earning assets (3) 3,149,661 $ 43,001 $ 5.46% 3,116,824 $ 41,896 $ 5.38% 2,714,785 $ 35,315 $ 5.20% Interest-bearing liabilities Money Market, Savings, NOW 1,507,209 $ 5,495 $ 1.45% 1,539,304 $ 5,181 $ 1.34% 1,457,137 $ 3,653 $ 0.99% Time deposits 833,202 4,140 1.97% 796,197 3,447 1.72% 662,822 2,231 1.34% Total interest-bearing deposits 2,340,411 9,635 1.63% 2,335,501 8,628 1.47% 2,119,959 5,884 1.10% FHLB borrowings 338,462 1,487 1.72% 324,795 1,297 1.56% 244,263 751 1.20% Subordinated debt 65,006 1,173 7.22% 64,970 1,173 7.22% 64,871 1,187 7.32% Total borrowings 403,468 2,660 2.58% 389,765 2,470 2.48% 309,134 1,938 2.45% Total interest-bearing liabilities 2,743,879 $ 12,295 1.78% 2,725,266 $ 11,098 1.62% 2,429,093 $ 7,822 1.28% Net interest income and spread (2,3) 30,706 $ 3.68% 30,798 $ 3.76% 27,493 $ 3.92% Net interest margin (2,3) 3.90% 3.95% 4.05% Three Months Ended December 31, 2018 September 30, 2018 December 31, 2017 (dollars in thousands) Average Balance Interest Average Yield/ Rate Average Balance Interest Average Yield/ Rate Interest earning assets Loans (1,3) 2,861,847 $ 157,499 $ 5.50% 2,276,282 $ 122,789 $ 5.39% Securities, includes restricted stock 157,042 3,679 2.34% 113,847 1,890 1.66% Other interest earning assets 27,012 593 2.20% 14,300 157 1.10% Total interest earning assets (3) 3,045,901 $ 161,771 $ 5.31% 2,404,429 $ 124,836 $ 5.19% Interest-bearing liabilities Money Market, Savings, NOW 1,521,963 $ 19,278 $ 1.27% 1,333,043 $ 11,985 $ 0.90% Time deposits 763,212 12,753 1.67% 476,303 5,585 1.17% Total interest-bearing deposits 2,285,175 32,031 1.40% 1,809,346 17,570 0.97% FHLB borrowings 318,774 4,951 1.55% 299,719 3,795 1.27% Subordinated debt 64,953 4,689 7.22% 55,315 4,070 7.36% Total borrowings 383,727 9,640 2.51% 355,034 7,865 2.22% Total interest-bearing liabilities 2,668,902 $ 41,671 1.56% 2,164,380 $ 25,435 1.18% Net interest income and spread (2,3) 120,100 $ 3.75% 99,401 $ 4.01% Net interest margin (2,3) 3.94% 4.13% December 31, 2018 December 31, 2017 Year Ended
