Partners Group Private Income Opportunities, LLC
(a Delaware Limited Liability Company)
Schedule of Investments —
December 31, 2019 (Unaudited)
The unaudited schedule of investments of Partners Group Private Income Opportunities, LLC (the “Fund”), a Delaware limited liability company that is registered under the Investment Company Act of 1940, as amended (the “Investment Company Act”), as a non-diversified, closed-end management investment company, as of December 31, 2019 is set forth below:
INVESTMENT PORTFOLIO AS A PERCENTAGE OF TOTAL NET ASSETS
Partners Group Private Income Opportunities, LLC
(a Delaware Limited Liability Company)
Schedule of Investments —
December 31, 2019 (Unaudited)
INVESTMENT PORTFOLIO AS A PERCENTAGE OF TOTAL NET ASSETS
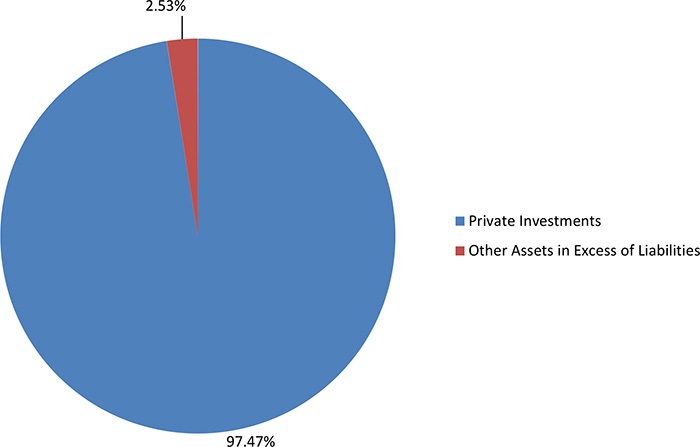
Private Investments (97.47%)
| Direct Equity (11.01%) | | Investment Type | | Acquisition Date | | Shares | | | Fair Value* | |
| North America (11.01%) | | | | | | | | | | |
| Acrisure Holdings, Inc.+, a | | Preferred equity | | 12/10/18 | | | 3,000,000 | | | $ | 3,464,422 | |
| Alliant Holdings, Inc.+, a | | Preferred equity | | 01/18/19 | | | 3,000 | | | | 3,000,000 | |
| BI Gen Holdings, Inc.+, a | | Common equity | | 09/05/18 | | | 14,561 | | | | 159,069 | |
| CB Titan MidCo Holdings, Inc.+, a | | Common equity | | 05/01/17 | | | 56,634 | | | | 89,261 | |
| Checkers Drive-in Restaurants, Inc. (US)+, a | | Common equity | | 08/21/19 | | | 108 | | | | 3 | |
| ConvergeOne Investment L.P.+, a | | Common equity | | 06/28/19 | | | 233 | | | | 232,500 | |
| KDOR Merger Sub Inc.+, a | | Common equity | | 05/11/18 | | | 250,000 | | | | 43,349 | |
| KENE Holdings, L.P.+, a, b | | Limited partnership interest | | 08/08/19 | | | — | | | | 219,375 | |
| KKR Enterprise Co-Invest L.P.+, a | | Common equity | | 10/11/18 | | | 548 | | | | 366,114 | |
| KSLB Holdings, LLC+, a | | Common equity | | 07/30/18 | | | 252,000 | | | | 292,581 | |
| Safari Co-Investment L.P.+, a, b | | Limited partnership interest | | 03/14/18 | | | — | | | | 323,398 | |
| Shermco Intermediate Holdings, Inc.+, a | | Common equity | | 06/05/18 | | | 2,500 | | | | 85,186 | |
| Total North America (11.01%) | | | | | | | | | | | 8,275,258 | |
| Total Equity (11.01%) | | | | | | | | | | $ | 8,275,258 | |
| Direct Debt (86.46%) | | Interest | | Acquisition Date | | Maturity Date | | Investment Type | | Principal | | | Fair Value* | |
| Asia - Pacific (4.55%) | | | | | | | | | | | | | | |
| Snacking Investments BidCo Pty Limited+, a | | Cash 8.50% + BBSY (1.00% Floor)† | | 12/23/19 | | 12/17/27 | | Second Lien | | $ | 3,542,156 | | | $ | 3,419,446 | |
| Total Asia - Pacific (4.55%) | | | | | | | | | | | | | 3,419,446 | |
| | | | | | | | | | | | | | | | | |
| North America (62.87%) | | | | | | | | | | | | | | | | |
| Bracket Intermediate Holding Corp.+, a | | Cash 8.13% + L (1.00% Floor)^^ | | 09/05/18 | | 08/31/26 | | Second Lien | | $ | 1,950,000 | | | $ | 1,928,355 | |
| Campaign Monitor (UK) Limited+, a | | Cash 8.50% + L (1.00% Floor)^^ | | 05/06/19 | | 11/06/25 | | Second Lien | | | 1,501,042 | | | | 1,440,250 | |
| Chase Industries, Inc.a, c | | Cash 7.25% + L (1.00% Floor)^^ | | 05/11/18 | | 05/11/26 | | Second Lien | | | 500,000 | | | | — | |
| Chase Industries, Inc.+, a | | Cash 8.00% + L (1.00% Floor)^^ | | 05/11/18 | | 05/11/26 | | Second Lien | | | 1,925,000 | | | | 1,927,400 | |
| Checkers Holdings, Inc.+, a | | Cash 4.25% + L (1.00% Floor)^ | | 05/09/17 | | 04/25/24 | | Senior | | | 154,400 | | | | 103,935 | |
| Checkers Holdings, Inc.+, a | | Cash 8.00% + L (1.00% Floor)^ | | 04/25/17 | | 04/25/25 | | Second Lien | | | 473,161 | | | | 291,829 | |
| CIBT Global, Inc.+, a | | Cash 4.00% + L (1.00% Floor)^^ | | 06/19/17 | | 06/01/24 | | Senior | | | 435,680 | | | | 418,236 | |
| Clarity Telecom, LLC+, a | | Cash 8.25% + L (1.00% Floor)^ | | 09/12/19 | | 08/30/27 | | Second Lien | | | 2,025,000 | | | | 2,002,725 | |
| ConvergeOne Holdings, Inc.+, a | | Cash 8.50% + L^ | | 04/15/19 | | 01/04/27 | | Second Lien | | | 2,325,000 | | | | 2,121,562 | |
| CSC Holdings, LLC+, a | | Cash 2.25% + L^ | | 07/31/19 | | 01/15/26 | | Senior | | | 994,987 | | | | 998,410 | |
| DG Investment Intermediate Holdings 2, Inc.+, a | | Cash 6.75% + L (0.75% Floor)^ | | 03/01/18 | | 02/02/26 | | Second Lien | | | 2,089,500 | | | | 2,093,490 | |
| Diligent Corporation+, a | | Cash 5.50% + L (1.00% Floor)^^ | | 05/12/17 | | 04/14/22 | | Senior | | | 1,359,880 | | | | 1,352,690 | |
| Edgewood Partners Holdings, LLC+, a | | Cash 4.25% + L (1.00% Floor)^ | | 09/29/17 | | 09/08/24 | | Senior | | | 915,273 | | | | 914,895 | |
| Envision Healthcare Corporation+, a | | Cash 7.75% + L^ | | 10/11/18 | | 10/11/26 | | Mezzanine | | | 3,765,450 | | | | 2,523,228 | |
| Envision Healthcare Corporation+, a | | Cash 3.75% + L^ | | 06/04/19 | | 10/10/25 | | Senior | | | 992,481 | | | | 851,465 | |
| Explorer Holdings, Inc.+, a | | Cash 8.25% + L (1.00% Floor)^^ | | 07/31/17 | | 05/02/24 | | Second Lien | | | 1,559,985 | | | | 1,616,185 | |
| Galls, LLC+, a | | Cash 6.25% + L (1.00% Floor)^ | | 02/07/18 | | 01/31/25 | | Senior | | | 459,276 | | | | 459,326 | |
| GHX Ultimate Parent Corporation+, a | | Cash 3.25% + L (1.00% Floor)^^ | | 07/25/17 | | 06/22/24 | | Senior | | | 982,125 | | | | 989,038 | |
| Idera, Inc.+, a | | Cash 4.50% + L (1.00% Floor)^ | | 08/03/17 | | 06/27/24 | | Senior | | | 652,692 | | | | 662,756 | |
| KENE Acquisition, Inc.+, a | | Cash 8.25% + L (1.00% Floor)^^ | | 08/08/19 | | 08/08/26 | | Second Lien | | | 1,462,500 | | | | 1,456,211 | |
The accompanying notes are an integral part of these Financial Statements.
Partners Group Private Income Opportunities, LLC
(a Delaware Limited Liability Company)
Schedule of Investments —
December 31, 2019 (Unaudited) (continued)
Private Investments (continued)
Direct Debt (continued) | | Interest | | Acquisition Date | | Maturity Date | | Investment Type | | Principal | | | Fair Value* | |
| KSLB Holdings, LLC+, a | | Cash 8.75% + L (1.00% Floor)^ | | 07/30/18 | | 07/30/26 | | Second Lien | | $ | 2,935,385 | | | $ | 2,849,965 | |
| Ministry Brands, LLC+, a | | Cash 4.00% + L (1.00% Floor)^ | | 04/11/17 | | 12/02/22 | | Senior | | | 1,265,102 | | | | 1,232,497 | |
| National Spine & Pain Centers, LLC+, a | | Cash 4.50% + L (1.00% Floor)^ | | 06/30/17 | | 06/02/24 | | Senior | | | 538,350 | | | | 541,125 | |
| Pearl Intermediate Parent, LLC+, a | | Cash 6.25% + L^ | | 03/21/18 | | 02/13/26 | | Second Lien | | | 2,397,000 | | | | 2,376,012 | |
| Peraton Corp.+, a | | Cash 5.25% + L (1.00% Floor)^ | | 06/09/17 | | 04/29/24 | | Senior | | | 582,000 | | | | 585,000 | |
| Perforce Software, Inc.+, a | | Cash 4.50% + L^^ | | 07/19/19 | | 07/01/26 | | Senior | | | 1,695,750 | | | | 1,698,938 | |
| Prometric Holdings, Inc.+, a | | Cash 7.50% + L (1.00% Floor)^ | | 01/29/18 | | 01/29/26 | | Second Lien | | | 519,250 | | | | 526,845 | |
| Radiology Partners, Inc.+, a | | Cash 4.75% + L^^ | | 07/23/19 | | 07/09/25 | | Senior | | | 1,984,925 | | | | 1,998,164 | |
| Radiology Partners, Inc.+, a | | Cash 8.25% + L^^ | | 08/10/18 | | 07/09/26 | | Second Lien | | | 4,032,399 | | | | 3,951,751 | |
| Shermco Intermediate Holdings, Inc.+, a | | Cash 4.50% + L (1.00% Floor)^ | | 06/05/18 | | 06/05/24 | | Senior | | | 1,300,469 | | | | 1,341,006 | |
| SSH Group Holdings, Inc.+, a | | Cash 8.25% + L^^ | | 08/21/18 | | 07/30/26 | | Second Lien | | | 2,120,000 | | | | 2,141,200 | |
| TecoStar Holdings, Inc.+, a | | Cash 8.50% + L (1.00% Floor)^ | | 05/01/17 | | 11/01/24 | | Second Lien | | | 511,875 | | | | 530,250 | |
| Vetcor Professional Practices LLC+, a | | Cash 6.50% + L^^ | | 07/02/18 | | 07/02/26 | | Second Lien | | | 3,312,000 | | | | 3,326,242 | |
| Total North America (62.87%) | | | | | | | | | | | | | 47,250,981 | |
| | | | | | | | | | | | | | | | | |
| Rest of World (3.60%) | | | | | | | | | | | | | | | | |
| AI Sirona (Luxembourg) Acquisition S.a.r.l.+, a | | Cash 4.75% + L^^^ | | 10/12/18 | | 07/10/26 | | Senior | | $ | 1,748,149 | | | $ | 1,719,741 | |
| AI Sirona (Luxembourg) Acquisition S.a.r.l.+, a | | Cash 7.25% + E### | | 10/05/18 | | 07/10/25 | | Second Lien | | | 1,032,900 | | | | 986,420 | |
| Total Rest of World (3.60%) | | | | | | | | | | | | | 2,706,161 | |
| | | | | | | | | | | | | | | | | |
| Western Europe (15.44%) | | | | | | | | | | | | | | | | |
| Altran Technologies S.A.+, a | | Cash 2.75% + E## | | 04/10/18 | | 03/20/25 | | Senior | | $ | 821,316 | | | $ | 829,274 | |
| Atlas Packaging GmbH+, a | | Cash 7.75% + E# | | 09/14/18 | | 07/31/26 | | Second Lien | | | 2,768,622 | | | | 2,732,353 | |
| CD&R Firefly Bidco Limited+, a | | Cash 7.75% + L^^ | | 06/21/18 | | 06/18/26 | | Second Lien | | | 2,180,749 | | | | 2,187,202 | |
| Cidron Atrium SE+, a | | Cash 7.00% + E (0.50% Floor)### | | 02/28/18 | | 02/28/26 | | Second Lien | | | 1,018,340 | | | | 1,059,600 | |
| EG Finco Limited+, a | | Cash 7.75% + E (1.00% Floor)### | | 06/21/18 | | 04/20/26 | | Second Lien | | | 1,426,400 | | | | 1,454,475 | |
| Everest Bidco SAS+, a | | Cash 7.50% + L (1.00% Floor)^^ | | 07/10/18 | | 07/04/26 | | Second Lien | | | 1,993,457 | | | | 1,929,268 | |
| RivieraTopco SARL+, a | | PIK 8.50%; E (1.00% Floor)### | | 12/08/17 | | 05/08/24 | | Mezzanine | | | 1,385,626 | | | | 1,408,332 | |
| Total Western Europe (15.44%) | | | | | | | | | | | | 11,600,504 | |
| Total Debt (86.46%) | | | | | | | | | | | | | | $ | 64,977,092 | |
| | | | | | | | | | | | | | | | | |
| Total Private Investments (Cost $74,657,172)(97.47%) | | | | | | | | | | | | $ | 73,252,350 | |
| | | | | | | | | | | | | | | | | |
| Total Investments (Cost $74,657,172)(97.47%) | | | | | | | | | | | | | 73,252,350 | |
| | | | | | | | | | | | | | | | | |
| Other Assets in Excess of Liabilities (2.53%) | | | | | | | | | | | | | 1,900,662 | |
| | | | | | | | | | | | | | | | | |
| Net Assets (100.00%) | | | | | | | | | | | | | | $ | 75,153,012 | |
| * | The Fair Value of any Investment may not necessarily reflect the current or expected future performance of such Investment or the Fair Value of the Fund's interest in such Investment. Furthermore, the Fair Value of any Investment has not been calculated, reviewed, verified or in any way approved by such Investment or its general partner, manager or sponsor (including any of its affiliates). Please see below for further detail regarding the valuation policy of the Fund. |
| + | The fair value of the investment was determined using significant unobservable inputs. |
| ^ | The interest rate on these loans is subject to the greater of a LIBOR floor or 1 month LIBOR plus a base rate. The 1 month LIBOR as of December 31, 2019 was 1.76%. |
The accompanying notes are an integral part of these Financial Statements.
Partners Group Private Income Opportunities, LLC
(a Delaware Limited Liability Company)
Schedule of Investments —
December 31, 2019 (Unaudited) (continued)
| ^^ | The interest rate on these loans is subject to the greater of a LIBOR floor or 3 month LIBOR plus a base rate. The 3 month LIBOR as of December 31, 2019 was 1.91%. |
| ^^^ | The interest rate on these loans is subject to the greater of a LIBOR floor or 6 month LIBOR plus a base rate. The 6 month LIBOR as of December 31, 2019 was 1.91%. |
| # | As of December 31, 2019, 1 month Euribor was -0.44%. |
| ## | As of December 31, 2019, 3 month Euribor was -0.38%. |
| ### | As of December 31, 2019, 6 month Euribor was -0.32%. |
| † | As of December 31, 2019, 1 month Bank Bill Swap Rate was 0.92%. |
| a | Private investments are generally issued in private placement transactions and as such are generally restricted as to resale. Each investment may have been purchased on various dates and for different amounts. The date of the first purchase is reflected under Acquisition Date as shown in the Schedule of Investments. Total fair value of restricted investments as of December 31, 2019 was $73,252,350, or 100.00% of net assets. As of December 31, 2019, the aggregate cost of each investment restricted to resale was $2,940,000, $2,940,000, $150,000, $56,635, $0, $232,500, $250,000, $219,375, $548,143, $252,000, $256,811, $57,500, $3,365,425, $1,912,138, $1,470,451, $0, $1,935,698, $154,958, $482,275, $436,288, $1,975,669, $2,194,263, $979,569, $2,091,349, $1,425,918, $916,511, $3,698,261, $948,894, $1,571,989, $460,736, $983,798, $654,844, $1,427,389, $2,853,376, $1,270,427, $539,350, $2,389,659, $583,049, $1,687,719, $536,488, $1,975,604, $4,002,880, $1,312,134, $2,101,413, $515,495, $3,250,453, $1,711,392, $1,054,746, $904,725, $2,788,692, $2,189,055, $1,114,003, $1,486,024, $1,944,836 and $1,456,265, respectively, totaling $74,657,172. |
| b | Investment does not issue shares. |
| c | Investment has been committed to but has not been funded by the Fund. |
Legend:
| BBSY | - Bank Bill Swap Rate |
A summary of outstanding financial instruments at December 31, 2019 is as follows:
Forward Foreign Currency Contracts
| Settlement Date | | Counterparty | | Currency Purchased | | | Currency Sold | | | Value | | | Unrealized
Appreciation
(Depreciation) | |
| March 18, 2020 | | Bank of America | | $ | 6,613,941 | | | € | 5,900,000 | | | $ | 6,656,007 | | | $ | (42,065 | ) |
| March 18, 2020 | | Bank of America | | $ | 1,643,170 | | | A$ | 2,400,000 | | | $ | 1,689,886 | | | $ | (46,717 | ) |
| January 15, 2020 | | Bank of America | | $ | 5,063,986 | | | £ | 3,900,000 | | | $ | 5,167,148 | | | $ | (103,162 | ) |
| | | | | | | | | | | | | | | | | $ | (191,944 | ) |
The accompanying notes are an integral part of these Financial Statements.
The information contained in this section should be read in conjunction with the Fund’s audited financial statements contained in its annual report for the year ended March 31, 2019.
Investments held by the Fund constitute a diversified portfolio of predominantly credit-related instruments, including but not limited to, first and second lien senior secured loans, secured unitranche debt, unsecured debt (e.g., mezzanine debt), structurally subordinated instruments, as well as public debt, corporate bonds, other debt securities and equity investments (“Private Investments”).
Partners Group (USA) Inc. (the "Adviser") estimates the fair value of the Fund's Private Investments in conformity with U.S. generally accepted accounting principles ("U.S. GAAP") and the Fund's valuation procedures (the "Valuation Procedures") that have been approved by the Board. As authorized by the Valuation Procedures, the Adviser values the Fund's Private Investments in consultation with its affiliates. The Valuation Procedures require evaluation of all relevant factors reasonably available to the Adviser and its affiliates at the time the Fund's Private Investments are valued.
The Valuation Procedures are implemented by the Adviser and State Street Bank and Trust Company, the Fund’s administrator (the “Administrator”). Both the Adviser and the Administrator are subject to the oversight of, and report to, the Board. The Adviser and the Administrator monitor and review the methodologies of the various third-party pricing services that are employed by the Fund. The Adviser employs valuation techniques for Private Investments held by the Fund, which include discounted cash flow methods and market comparables.
The Adviser and one or more of its affiliates act as investment advisers to clients other than the Fund. Accordingly, the valuation attributed to a Private Investment held by the Fund and the valuation attributed to the same Private Investment held by another client of the Adviser or of one of its affiliates might differ as a result of differences in accounting, regulatory and other factors applicable to the Fund versus to such other client.
In conformity with U.S. GAAP, investments are classified in their entirety based on the lowest level of input that is significant to the fair value measurement. Estimated values may differ from the values that would have been used if a ready market existed or if the investments were liquidated at the valuation date. A three-tier hierarchy is used to distinguish between (1) inputs that reflect the assumptions market participants would use in pricing an asset or liability developed based on market data obtained from sources independent of the reporting entity (observable inputs) and (2) inputs that reflect the reporting entity’s own assumptions about the assumptions market participants would use in pricing an asset or liability developed based on the best information available in the circumstances (unobservable inputs) and to establish classification of fair value measurements for disclosure purposes. Various inputs are used in determining the value of the Fund’s investments. The inputs are summarized in the three broad levels listed below:
| • | Level 1 – Pricing inputs are quoted prices available in active markets for identical investments as of the measurement date. The type of investments included in Level 1 include marketable securities that are primarily traded on a securities exchange or over-the-counter. The fair value is determined to be the last sale price on the determination date, or, if no sales occurred on any such date, the mean between the closing bid and ask prices on such date. The Fund does not apply a blockage discount to the quoted price for these investments, even in situations where the Fund holds a large position and a sale could reasonably impact the quoted price. |
| • | Level 2 – Pricing inputs are other than quoted prices in active markets (i.e., Level 1 pricing) and fair value is determined through the use of models or other valuation methodologies through direct or indirect corroboration with observable market data. Investments that are generally included in this category include corporate notes, convertible notes, warrants and restricted equity securities. The fair value of legally restricted equity securities may be discounted depending on the likely impact of the restrictions on liquidity and the Adviser’s estimates. |
| • | Level 3 – Pricing inputs are unobservable for the investment and include situations where there is little, if any, market activity for the investment. The inputs into the determination of fair value require significant management judgment and/or estimation. Investments that are included in this category are equity and debt investments that are privately owned, as well as convertible notes and warrants that are not actively traded. The fair value for investments using Level 3 pricing inputs are based on the Adviser’s estimates that consider a combination of various performance measurements including the timing of the transaction, the market in which the investment operates, comparable market transactions, performance and projections and various performance multiples as applied to earnings before interest, taxes, depreciation and amortization or a similar measure of earnings for the latest reporting period and forward earnings, brokers quotes as well as discounted cash flow analysis. |
The following table presents the Fund’s investments at December 31, 2019 measured at fair value. Due to the inherent uncertainty of estimates, fair value determinations based on estimates may materially differ from the values that would have been used had a ready market for the securities existed.
| Investments | | Level 1 | | | Level 2 | | | Level 3 | | | Total | |
| Private Investments: | | | | | | | | | | | | |
| Debt | | $ | — | | | $ | — | | | $ | 64,977,092 | | | $ | 64,977,092 | |
| Equity | | | — | | | | — | | | | 8,275,258 | | | | 8,275,258 | |
| Total Private Investments | | $ | — | | | $ | — | | | $ | 73,252,350 | | | $ | 73,252,350 | |
| Total Investments | | $ | — | | | $ | — | | | $ | 73,252,350 | | | $ | 73,252,350 | |
| Other Financial Instruments | | | | | | | | | | | | | | | | |
| Foreign Currency Exchange Contracts | | $ | (191,944 | ) | | $ | — | | | $ | — | | | $ | (191,944 | ) |
| Total Foreign Currency Exchange Contracts | | $ | (191,944 | ) | | $ | — | | | $ | — | | | $ | (191,944 | ) |
The following is a reconciliation of the amount of the account balances on April 1, 2019 and December 31, 2019 of those investments in which significant unobservable inputs (Level 3) were used in determining value:
| | | Balance as of
April 1,
2019 | | | Realized gain/(loss) | | | Net change in unrealized appreciation/ (depreciation) | | | Gross
purchases | | | Gross
sales | | | Net amortization of premium/
discount | | | Net
transfers
in or out
of Level 3 | | | Balance
as of
December 31, 2019 | |
| Private Investments: | | | | | | | | | | | | | | | | | | | | | | | | |
| Debt | | $ | 52,251,266 | | | $ | (180,159 | ) | | $ | (755,916 | ) | | $ | 17,587,258 | | | $ | (4,022,656 | ) | | $ | 97,299 | | | $ | - | | | $ | 64,977,092 | |
| Equity | | | 7,222,940 | | | | - | | | | 116,244 | | | | 939,264 | | | | (3,190 | ) | | | - | | | | - | | | | 8,275,258 | |
| Total Private Investments | | $ | 59,474,206 | | | $ | (180,159 | ) | | $ | (639,672 | ) | | $ | 18,526,522 | | | $ | (4,025,846 | ) | | $ | 97,299 | | | $ | - | | | $ | 73,252,350 | |
Transfers between levels of the fair value hierarchy are reported at the beginning of the reporting period in which they occur. For the period ended December 31, 2019, there were no transfers between levels.
The amount of the net change in unrealized depreciation for the period ended December 31, 2019 relating to investments in Level 3 assets still held at December 31, 2019 is $(792,662).
Changes in inputs or methodologies used for valuing investments may result in a transfer in or out of levels within the fair value hierarchy. The inputs or methodologies used for valuing investments may not necessarily be an indication of the risk associated with investing in those investments. Transfers between different levels of the fair value disclosure hierarchy are deemed to have occurred as of the beginning of the reporting period.
The following is a summary of quantitative information about significant unobservable valuation inputs approved by the Adviser for Level 3 Fair Value Measurements for investments held as of December 31, 2019.
| Type of Security | | Fair Value at
December 31, 2019 (000’s)* | | | Valuation
Technique(s) | | Unobservable Input | | Range
(weighted average) |
| Private Investments: | | | | | | | | | |
| Debt | | $ | 24,930 | | | Broker quotes | | Indicative quotes for an inactive market | | n/a – n/a (n/a) |
| | | $ | 36,972 | | | Discounted cash flow | | Discount factor | | 4.30% - 20.79% (8.53%) |
| | | $ | 3,427 | | | Recent financing | | Recent transaction price | | n/a – n/a (n/a) |
| Equity | | $ | 8,275 | | | Market comparable companies | | Enterprise value to EBITDA multiple | | 8.41x – 17.30x (12.80x) |
| * | Level 3 fair value includes accrued interest. |
Level 3 equity investments valued using an unobservable input factor are directly affected by a change in that factor. For Level 3 debt investments, the Fund arrives at a fair value through the use of an earnings and multiples analysis or a discounted cash flows analysis that consider the credit risk and interest rate risk of the particular investment. Significant increases or decreases in these inputs in isolation would result in a significantly lower or higher fair value measurement.
Forward Foreign Currency Exchange Contracts
The Fund may enter forward foreign currency exchange contracts as a way of managing foreign exchange rate risk. These contracts for the purchase or sale of a specific foreign currency at a fixed price on a future date may be entered into either as a hedge or as a cross hedge against either specific transactions or portfolio positions. The objective of the Fund’s foreign currency hedging transactions is to reduce the risk that the U.S. Dollar value of the Fund’s foreign currency denominated investments will decline in value due to changes in foreign currency exchange rates. All forward foreign currency exchange contracts are “marked-to-market” daily at the applicable translation rates resulting in unrealized gains or losses. Realized gains or losses are recorded at the time the forward foreign currency exchange contract is offset by entering into a closing transaction or by the delivery or receipt of the currency. Risk may arise upon entering into these contracts from the potential inability of counterparties to meet the terms of their contracts and from unanticipated movements in the value of a foreign currency relative to the U.S. Dollar.
During the period from April 1, 2019 to December 31, 2019, the Fund entered into 14 short forward foreign currency exchange contracts. The Fund had $442,509 in net realized gains and a $(260,658) change in net unrealized appreciation (depreciation) on forward foreign currency exchange contracts. The outstanding forward foreign currency exchange contract amounts at December 31, 2019 are representative of contract amounts during the period.