UNITED STATES
SECURITIES AND EXCHANGE COMMISSION
WASHINGTON, D.C. 20549
FORM 10-K
| |
☒ | ANNUAL REPORT PURSUANT TO SECTION 13 OR 15(d) OF THE SECURITIES EXCHANGE ACT OF 1934 |
For the fiscal year ended December 31, 2024
Or
| |
☐ | TRANSITION REPORT PURSUANT TO SECTION 13 OR 15(d) OF THE SECURITIES EXCHANGE ACT OF 1934 |
For the transition period from ___________ to ___________.
Commission File Number 001-37979
VERRA MOBILITY CORPORATION
(Exact name of registrant as specified in its charter)
| | |
Delaware | | 81-3563824 |
(State of Incorporation) | | (I.R.S. Employer Identification No.) |
| | |
| | |
1150 North Alma School Road Mesa, Arizona | | 85201 |
(Address of Principal Executive Offices) | | (Zip Code) |
(480) 443-7000
(Registrant’s Telephone Number, Including Area Code)
Securities registered pursuant to Section 12(b) of the Act:
| | | | |
(Title of Each Class) | | (Trading Symbol) | | (Name of Each Exchange on Which Registered) |
Class A Common Stock, par value $0.0001 per share | | VRRM | | Nasdaq Capital Market |
Securities registered pursuant to Section 12(g) of the Act: None
Indicate by check mark if the registrant is a well-known seasoned issuer, as defined in Rule 405 of the Securities Act. Yes ☒ No ☐
Indicate by check mark if the registrant is not required to file reports pursuant to Section 13 or Section 15(d) of the Act. Yes ☐ No ☒
Indicate by check mark whether the registrant (1) has filed all reports required to be filed by Section 13 or 15(d) of the Securities Exchange Act of 1934 during the preceding 12 months (or for such shorter period that the registrant was required to file such reports), and (2) has been subject to such filing requirements for the past 90 days. Yes ☒ No ☐
Indicate by check mark whether the registrant has submitted electronically every Interactive Data File required to be submitted pursuant to Rule 405 of Regulation S-T (§ 232.405 of this chapter) during the preceding 12 months (or for such shorter period that the registrant was required to submit such files). Yes ☒ No ☐
Indicate by check mark whether the registrant is a large accelerated filer, an accelerated filer, a non-accelerated filer, a smaller reporting company or an emerging growth company. See the definitions of “large accelerated filer,” “accelerated filer,” “smaller reporting company” and “emerging growth company” in Rule 12b-2 of the Exchange Act.
| | | |
Large accelerated filer | ☒ | Accelerated filer | ☐ |
Non-accelerated filer | ☐ | Smaller reporting company | ☐ |
| | Emerging growth company | ☐ |
If an emerging growth company, indicate by check mark if the registrant has elected not to use the extended transition period for complying with any new or revised financial accounting standards provided pursuant to Section 13(a) of the Exchange Act. ☐
Indicate by check mark whether the registrant has filed a report on attestation to its management’s assessment of the effectiveness of its internal control over financial reporting under Section 404(b) of the Sarbanes-Oxley Act (15 U.S.C. 7262(b)) by the registered public accounting firm that prepared or issued its audit report. ☒
If securities are registered pursuant to Section 12(b) of the Act, indicate by check mark whether the financial statements of the registrant included in the filing reflect the correction of an error to previously issued financial statements. ☐
Indicate by check mark whether any of those error corrections are restatements that required a recovery analysis of incentive-based compensation received by any of the registrant's executive officers during the relevant recovery period pursuant to §240.10D-1(b). ☐
Indicate by check mark whether the registrant is a shell company (as defined in Rule 12b-2 of the Act). Yes ☐ No ☒
The aggregate market value of the voting and non‑voting common equity held by non‑affiliates of the registrant on June 28, 2024, the last business day of the registrant’s most recently completed second fiscal quarter, computed by reference to the closing price reported on the Nasdaq Capital Market on such date was $4,445,976,517 (163,455,019 shares at a closing price per share of $27.20).
As of February 21, 2025, the registrant had 159,593,852 shares of Class A Common Stock, par value $0.0001 per share, issued and outstanding.
DOCUMENTS INCORPORATED BY REFERENCE
Portions of the registrant’s proxy statement to be filed in connection with its annual meeting of stockholders to be held May 20, 2025 are incorporated by reference into Part III of this Form 10-K.
VERRA MOBILITY CORPORATION
FORM 10-K
For the Fiscal Year Ended December 31, 2024
INDEX
As used in this Annual Report on Form 10-K (“Annual Report”), the terms “Verra Mobility,” the “Company,” “we,” “us,” or “our” refer to Verra Mobility Corporation and its consolidated subsidiaries.
PART I
Item 1. Business
Overview
We are a leading provider of smart mobility technology solutions, principally operating throughout the United States, Australia, Europe and Canada. Our goal is to make transportation safer, smarter and more connected through our integrated, data-driven solutions, including toll and violations management, title and registration services, automated safety and traffic enforcement and commercial parking management. We bring together vehicles, hardware, software, data and people to solve transportation challenges for customers around the world, including commercial fleet owners such as rental car companies (“RACs”), direct commercial fleet owner-operators (“Direct Fleets”) and fleet management companies (“FMCs”), as well as governments, universities, parking operators, healthcare facilities, transportation hubs and other violation-issuing authorities.
Segments
Our solutions are offered through three segments: (i) Commercial Services, (ii) Government Solutions and (iii) Parking Solutions.
Commercial Services
Our Commercial Services segment generated approximately $407.7 million in revenue for 2024, or approximately 46% of our total revenue. Commercial Services provides automated toll and violations management and title and registration solutions to RACs, Direct Fleets, FMCs and other large fleet owners primarily in North America. Our toll and violations management solutions are designed to facilitate the timely payment of tolls and violations incurred by our customers’ vehicles and perform timely transfers of liability on our customers’ behalf, and driver billing and collections, as applicable. We also manage regional toll transponder installation and vehicle association—a critical and highly complex process for RAC, Direct Fleet and FMC customers—to ensure that the transponders (and corresponding toll transactions) are associated with the correct vehicle.
We have long-standing relationships with, among others, the three largest RACs in the United States, Avis Budget Group, Enterprise Mobility and The Hertz Corporation. We also have relationships with key European RACs and leading FMCs in the United States. Through our established relationships with more than 50 individual tolling authorities throughout the United States, we provide an automated and outsourced administrative solution for our customers while also providing convenience for vehicle drivers and benefits to tolling and issuing authorities. Toll management solutions accounted for approximately 41% of our 2024 total revenues.
Our violations management solutions processes violations incurred by the drivers of RAC, Direct Fleet and FMC vehicles by working with more than 8,700 domestic violation-issuing authorities as of December 31, 2024, to either pay the fine on behalf of the vehicle owner (for which we are able to bill the driver) or to transfer liability directly to the vehicle driver. Vehicle-issued violations include parking and photo enforcement violations. In Europe, we specialize in the identification, notification and collection of unpaid traffic, parking and public transport related fees, charges and penalties issued to foreign registered vehicles or persons on behalf of issuing authorities in 20 European countries as of December 31, 2024. Violation management solutions accounted for approximately 4% of our 2024 total revenues.
Our title and registration solutions provide RAC, Direct Fleet and FMC customers with an integrated, end-to-end solution for managing vehicle titles and registrations and annual renewals. We provide automated title and registration solutions by working with individual departments of motor vehicles for title and registration processing in 18 states as of December 31, 2024. Title and registration solutions accounted for approximately 1% of our 2024 total revenues.
Government Solutions
Our Government Solutions segment generated approximately $390.9 million in revenue for 2024, or approximately 44% of our 2024 total revenue. Our Government Solutions segment is a provider of automated safety solutions primarily in the United States, Canada and Australia to state and local governments. In the United States, we provide government agencies with road safety cameras to detect and process traffic violations for red-light, speed, school bus, and city bus lanes. These programs are designed to reduce traffic violations and resulting collisions, injuries and fatalities. The Company implements and administers traffic safety programs for municipalities, counties, school districts and law enforcement agencies of all sizes. Our proprietary hardware and software technologies are designed to provide government agencies the information, data and automated end-to-end administrative capabilities to enforce traffic violations through photo enforcement. On behalf of our customers, we install, maintain and manage automated safety solution hardware and software that processes event data, apply customer specific rules and connect a traffic violation to the responsible driver or vehicle owner. For customers of our end-to-end solutions, we automatically send captured events to the designated enforcement agency of the customer, where an authorized individual determines if a violation occurred. Upon law enforcement’s determination that a violation occurred, we manage the citation mailing, billing and other administrative tasks on behalf of our customers. For many international customers, we design, engineer and maintain roadside photo enforcement technology, including both hardware and software, which is sold or licensed to government agencies and often maintained with maintenance contracts to support the technology. Service revenue from speed, red-light, school bus cameras and city bus lane cameras accounted for approximately 42% of our 2024 total revenues. Product sales to customers are not recurring and are dependent on our customers' needs, and account for approximately 2% of total revenue for 2024.
Parking Solutions
Our Parking Solutions segment generated approximately $80.6 million in revenue for 2024, or approximately 9% of our 2024 total revenue. Parking Solutions provides end-to-end commercial parking management solutions to approximately 2,000 customers in the university, municipal, healthcare and commercial operator markets, as of December 31, 2024. Our proprietary software, transaction processing and hardware technologies provide our customers with solutions to manage and monetize their parking and enforcement operations. In 2024, we processed over 190 million transactions using our various parking solutions systems, including parking access and revenue control (“PARC”), single- and multi-space pay stations, integrated physical and mobile payments, back-office parking rate management, permit issuance and management, online citation payment, event parking, and back-office management of violations.
Markets and Competition
The primary sectors in which we operate are automated safety, tolling, commercial fleet management and parking. We face competition in each of the sectors in which we operate, but there is no single company that provides a similarly broad suite of solutions and competes across all of our business segments. However, the markets for our solutions are increasingly competitive, rapidly evolving and fragmented, and are subject to changing technology, shifting customer needs, contract renewals and new laws and policies. A number of sector participants develop and market products and services that compete to varying extents with our offerings, and we expect this competition to intensify. The rapid rate of technological change in our industry could increase the likelihood that we will face competition from new products or services designed by companies with whom we do not currently compete. This includes advancements in the area of self-driving cars which may significantly reduce the frequency of vehicles illegally running red lights or exceeding posted speed limits. Moreover, we face competition from our own customers as they may choose to invest in developing their own internal solutions.
In our Commercial Services segment, we face competition from both our own customers, who may choose to invest in their own internal solutions, and vendors offering or seeking to offer new technologies or financial models. In our Government Solutions segment, we face competition with respect to certain automated safety solutions from other vendors in red-light, school bus, speed and bus lane photo enforcement. In Parking Solutions, we face competition from a variety of competitors in our markets in the United States and Canada.
Seasonality
Our Commercial Services business segment experiences seasonal fluctuations in usage and revenue. Historically, Commercial Services sees higher volumes in the second and third quarters of each fiscal year, driven by increases in travel demand during the summer driving season. Additionally, seasonal fluctuations can be influenced by weather conditions, economic conditions, and shifts in consumer preferences. Seasonality has not historically resulted in material fluctuations in our overall financial performance.
Technology
We utilize software and hardware to deliver our services. Our business unit teams have expertise in areas such as hardware, software and firmware development and testing, database design and data analytics, and both product and project management. In addition, we utilize external contractors to supplement our team in the areas of software and firmware development, digital design, test development and product-level testing. Generally, our research and development efforts are focused on expanding the capabilities of our products, differentiating our offerings, simplifying the implementation, support and utilization of our solutions, reducing the cost of our solutions, increasing the reliability of our solutions, expanding the functionality of our solutions to meet customer and market requirements, applying new advances in technology to enhance existing solutions, and building further competitive advantages through our intellectual property portfolio. We utilize artificial intelligence (“AI”) to enhance our business process functions and select aspects of our solutions. Given the evolving nature and complexity of AI technologies, there remains inherent operational and legal risks. For more details, refer to Item 1A, Risk Factors, “Our new products and services and changes to existing products and services may not succeed.”
Intellectual Property
We rely on a combination of patents, trademarks, trade secrets, copyrights and confidentiality agreements to protect our intellectual property. We take steps to protect new intellectual property to safeguard our ongoing technological innovations and strengthen our brand, and believe we take appropriate action against infringement or misappropriation of our intellectual property rights by others. We regularly review third-party intellectual property rights to help avoid infringement, and to identify strategic opportunities.
Our general policy is to seek patent protection for our inventions likely to be incorporated into our products and services or where obtaining such proprietary rights will improve our competitive position. As of December 31, 2024, we own approximately 87 U.S.- and foreign-issued patents and pending patent applications, including patents and rights to patent applications acquired through strategic transactions, which relate to various aspects of our products and technology. Our patent portfolio evolves as new patents are awarded to us and as older patents expire. Patents expire at various dates, generally 20 years from their original filing dates. While we believe that our portfolio of patents and applications has value, in general no single patent is essential to our business or any individual segment. In addition, any of our proprietary rights could be challenged, invalidated or circumvented, or may not provide significant competitive advantages.
Our business relies on both internally developed and externally licensed software, as well as internally, externally and co-developed hardware, to operate and provide our systems and deliver our services. We claim copyright on all internally developed software. We generally rely on common law protection for our copyrighted works. In addition, we rely on maintaining source code confidentiality to assure our market competitiveness. With respect to externally sourced software and hardware, we rely on contracts to retain our continued access for our business usage. From time to time, these agreements may expire or be subject to renegotiation.
We have approximately 220 registrations and pending applications in the United States and foreign jurisdictions for trademarks and service marks as of December 31, 2024, reflecting our many products and services. These registrations and applications include our historic and acquired brands, as well as “Verra Mobility.” These marks may have a perpetual life, subject to periodic renewal and may be subject to cancellation or invalidation based on certain use requirements and third-party challenges, or on other grounds. We vigorously enforce and protect our marks.
Government Regulation
We are subject to various local, state and national laws, regulations and administrative practices regulating matters such as data privacy, photo enforcement, consumer protection, procurement, licensing requirements, anti-corruption, equal employment, minimum wages, workplace health and safety, human rights and the environment, among others. Our operations are subject to regulation by various U.S. federal agencies, including but not limited to the U.S. Department of Transportation, (“USDOT”), the Federal Trade Commission, (“FTC”), the Federal Communications Commission, the Consumer Product Safety Commission, the Consumer Financial Protection Bureau and the Environmental Protection Agency. We are also subject to laws, regulations and administrative practices addressing many of these same matters in Europe, Australia, Canada and New Zealand, including those specifically relating to accessing and use of information obtained from vehicle licensing authorities, traffic enforcement and collections, and financial and banking regulations.
Privacy and Data Security
As part of our business, we collect, receive, process, use, transmit, disclose, and retain information relating to identifiable individuals (“personal information”) and, therefore, are subject to various laws protecting privacy and security of personal information, including but not limited to the U.S. Driver Privacy Protection Act, the General Data Protection Regulation (the “GDPR”) in the European Union (the “E.U.”), the Data Protection Act of 2018 and the GDPR in the United Kingdom, the Canadian Personal Information Protection and Electronic Documents Act, the Australia Privacy Act of 1988, New Zealand’s Privacy Act of 2020, the California Consumer Privacy Act (the “CCPA”), and other national and state privacy laws. We are also subject to similar restrictions and audit requirements pursuant to our contracts with the organizations from which we gain access to personal information, such as departments of motor vehicles and the National Law Enforcement Telecommunications System. Privacy and data security laws and regulations are constantly evolving and changing, are subject to differing interpretations and may be inconsistent among countries and state and local jurisdictions, or conflict with other rules.
As we expand our operations in foreign countries, or as U.S. federal or state law changes, our liability exposure and the complexity and cost of compliance with data and privacy requirements will increase. Laws and practices regarding handling and use of personal and other information by companies have also come under increased public scrutiny, and governmental authorities, consumer agencies and consumer advocacy groups have called for increased regulation, enforcement and changes in industry practices.
Photo Enforcement
Automated photo enforcement programs in the United States are typically regulated at the state and local level, under either state enabling legislation or under home rule authority established under the relevant state constitution. Where enabling legislation is not required, local ordinances impose further restrictions within a given jurisdiction.
In connection with the installation of photo enforcement systems, we or our customers routinely obtain permits from various permitting authorities. As a government contractor providing photo enforcement services directly or through subcontractors (including design, engineering, construction, installation, and maintenance) in various locations throughout the United States and internationally, we are at times required to obtain licenses regarding general contracting, performance of engineering services, performance of electrical work, performance of private investigative work and processing license plate and related personal information. We periodically receive notices from regulatory authorities regarding these matters and inquiring as to our compliance with the applicable state, local and foreign laws and regulations. In addition, our foreign photo enforcement programs are subject to regulation in the various countries in which we operate.
Tolling
We are also subject to state and local regulations with respect to tolling. Over the past few years, bills have been introduced in multiple states to limit whether and how much RACs can charge their customers for the use of a toll transponder, limit the administrative penalties and fees that can be assessed for processing tolls, and/or impose increased disclosure requirements on RACs with respect to tolling or violation processing fees. In addition, there has been an increase in interest and greater focus on RAC tolling programs from state Attorneys General related to tolling issues from a consumer protection perspective.
Government Contracting
Our Government Solutions customers are typically government agencies, and our operations within this segment are therefore subject to various laws pertaining to procurement, gifts and entertainment, payments of commissions and contingency fees, conflicts of interest, licensing and permitting requirements and other matters. These laws are overseen by different government agencies, depending on the jurisdiction, including departments of procurement services, contracting offices and offices of inspector general.
To successfully navigate this complex statutory and regulatory landscape, we have a dedicated government relations team that works with national, state and local policymakers, often with the help of lobbyists and consultants, to track and help support favorable photo-enforcement safety and toll-related legislative outcomes. Through this network, we have a presence in most states in which our Government Solutions and Commercial Services segments do business. These lobbying activities are subject to state and local regulations and registration requirements.
We believe we are in substantial compliance with the laws and regulations that regulate our business. There are, however, significant uncertainties involving the application of various legal requirements, the violation of which could result in, among other things, fines, penalties, revocation of permits or licenses, cessation of operations in a given jurisdiction and other adverse consequences. See “Risk Factors” for a discussion of our regulatory risks.
Human Capital Management
Our employees are critical to our success as a leading provider of smart mobility solutions. To continue delivering high-quality solutions to our customers and succeed in our highly competitive and rapidly evolving market, it is critical that we continue to attract, retain and develop diverse groups of talented individuals at all levels of our organization.
As of December 31, 2024, we had 1,879 employees, comprised of 1,754 full-time employees and 125 part-time employees. Of our full-time employees, 1,228 were located in the United States and 526 were located internationally. None of our employees are represented by a labor union or covered by a collective bargaining agreement, except for our 26 employees in Staten Island, New York. We believe our relations with our employees are good, and we have not experienced a strike or other significant work stoppage.
Talent Acquisition and Development
Our success depends upon attracting, retaining and developing a diverse group of talented individuals who possess the knowledge and skills necessary to support our business objectives, assist in the achievement of our strategic goals, contribute their own unique perspective and skill set and create long-term value for our stockholders. We have implemented purposeful hiring strategies that include opportunities for internal mobility and promotion and an employee referral program, both of which we believe will further strengthen our growing employee base and promote retention. We have a multifaceted talent development framework that includes functional training, management training and targeted development programs. We also develop our employees through an annual performance review and assessment process that incorporates a dual-performance rating system and provides each employee with concrete, actionable feedback that will enable them to succeed.
Compensation and Benefits
Our compensation programs are designed to align the compensation of our employees with the performance of the Company and the individual employee, and to provide a compensation package that will attract, retain, motivate and reward employees to achieve superior results. The structure of our compensation programs balances incentives for both short-term and long-term performance. In addition to cash compensation, we offer employees benefits such as health (medical, dental and vision) insurance, health savings accounts, flexible spending accounts, life insurance, accident insurance, paid time off, paid parental leave and a company-sponsored 401(k) plan, and related benefits for non-U.S. employees. For key leadership positions, we also provide compensation packages that include annual incentive bonuses and long-term equity awards.
Employee Engagement
We seek employees who collaborate and value differences, think and act globally, foster an engaging climate, and recognize and develop others. We engage and survey our employee population to gather insight, feedback, and data about employees’ engagement, workplace experiences, and manager effectiveness. Survey results inform and support corporate, business unit, department, and team action plans, with the goal of enhancing workplace satisfaction and overall employee well-being and effectiveness.
Corporate Information
Our principal executive office is located at 1150 North Alma School Road, Mesa, AZ 85201. Our telephone number is (480) 443-7000. Our website address is www.verramobility.com. The information on, or accessible through, our website does not constitute part of, and is not incorporated into, this Annual Report.
The trade names, trademarks, and service marks appearing in this Annual Report include registered marks and marks in which we claim common law rights, such as Verra Mobility and the Verra Mobility logo, all of which are our intellectual property. This Annual Report contains additional trade names, trademarks, and service marks of other companies that are the property of their respective owners. We do not intend our use or display of other companies’ trade names, trademarks, or service marks to imply a relationship with, or endorsement or sponsorship of us, by these companies. We have omitted the ® and ™ designations, as applicable, for the trademarks used in this Annual Report.
Our Annual Reports on Form 10-K, Quarterly Reports on Form 10-Q, Current Reports on Form 8-K, and amendments to reports filed pursuant to Sections 13(a) and 15(d) of the Securities Exchange Act of 1934, as amended (the “Exchange Act”), are filed with the SEC. We are subject to the informational requirements of the Exchange Act, and we file or furnish reports, proxy statements and other information with the SEC. Such reports and other information we file with the Securities and Exchange Commission (the “SEC”) are available free of charge at http://ir.verramobility.com/financial-information/sec-filings when such reports become available on the SEC’s website. The SEC maintains a website that contains reports, proxy and information statements, and other information regarding issuers that file electronically with the SEC at www.sec.gov. We periodically provide other information for investors on our corporate website, www.verramobility.com, and our investor relations website, ir.verramobility.com. This includes press releases and other information about financial performance, information on corporate governance and details related to our annual meeting of stockholders. The information contained on the websites referenced in this Annual Report is not incorporated by reference into this filing. Further, our references to website URLs are intended to be inactive textual references only.
Cautionary Note Regarding Forward-Looking Statements
The discussions in this Annual Report, as well as in our other filings with the SEC and other written and oral information we release, contains forward-looking statements within the meaning of Section 27A of the Securities Act of 1933, as amended (the "Securities Act"), and Section 21E of the Exchange Act. All statements contained in this Annual Report other than statements of historical fact, including statements regarding our future operating results and financial position, our business strategy and plans, products, services, technology offerings, market conditions, growth and trends, expansion plans and opportunities, and our objectives for future operations, are forward-looking statements. The words “believe,” “may,” “will,” “estimate,” “continue,” “anticipate,” “intend,” “expect,” “could,” “would,” “project,” “plan,” “preliminary,” “likely” and similar expressions, and the negative of these expressions, are intended to identify forward-looking statements.
We may not actually achieve the plans, intentions or expectations disclosed in our forward-looking statements and you should not place undue reliance on them. These forward-looking statements involve risks and uncertainties that could cause our actual results to differ materially from those in the forward-looking statements, including, without limitation, the risks set forth in Part I, Item 1A, “Risk Factors” in this Annual Report and in our other filings with the SEC, which highlight, among other risks:
•the impact of negative industry and macroeconomic conditions on our customers or us may materially and adversely impact our business, financial condition and results of operations;
•customer concentration in our Commercial Services and Government Solutions segments, including risks impacting these segments such as travel demand and legislation, and risks relating to our contract with NYCDOT (defined below), which comprises a material portion of our revenue. We extended our current contract with NYCDOT through December 31, 2025 to allow NYCDOT to continue to operate its automated enforcement program. We are presently participating in a competitive procurement for a new NYCDOT automated enforcement program contract. If we are not successful in winning the competitive procurement for a new contract with NYCDOT, or if we win the competitive procurement at materially different terms and pricing as our current contract, it would have a material adverse effect on our business, financial condition and results of operations;
•our reliance on specialized third-party providers;
•risks and uncertainties related to our government contracts, including legislative changes, termination rights, delays in payments, audits and investigations;
•decreases in the prevalence or political acceptance of, or an increase in governmental restrictions regarding, automated and other similar methods of photo enforcement, parking solutions or the use of tolling;
•our ability to successfully implement our acquisition strategy or integrate acquisitions;
•our ability to maintain effective internal controls over financial reporting;
•failure in or breaches of our networks or systems, including as a result of cyber-attacks or other incidents;
•risks and uncertainties related to our international operations;
•our failure to acquire necessary intellectual property or adequately protect our intellectual property;
•risks and uncertainties related to litigation and other disputes and regulatory investigations; and
•our ability to manage our substantial level of indebtedness.
You should not rely on forward-looking statements as predictions of future events. We operate in a very competitive and rapidly changing environment and new risks emerge from time to time. The forward-looking statements in this Annual Report represent our views as of the date hereof. Except as may be required by law, we undertake no obligation to update any of these forward-looking statements for any reason or to conform these statements to actual results or revised expectations.
Our Annual Reports on Form 10-K, Quarterly Reports on Form 10-Q, Current Reports on Form 8-K, and any amendments to those reports, are available free of charge on our website, verramobility.com, under the heading “Investors” immediately after they are filed with, or furnished to, the SEC. We use our investor relations website, ir.verramobility.com, as a means of disclosing information, which may be of interest or material to our investors and for complying with disclosure obligations under Regulation FD. Accordingly, investors should monitor our investor relations website, in addition to following our press releases, SEC filings, public conference calls, webcasts, and social media. Information contained on or accessible through, including any reports available on, our website is not a part of, and is not incorporated by reference into, this Annual Report or any other report or document we file with the SEC. Any reference to our website in this Annual Report is intended to be an inactive textual reference only.
Item 1A. Risk Factors
Risk Factor Summary
Investing in our common stock involves a high degree of risk. In addition to the other information set forth in this Annual Report, you should carefully consider the following factors, which could materially affect our business, financial condition and results of operations in future periods. The risks described below are not the only risks we face. Additional risks not currently known to us may adversely affect our business, financial condition or results of operations in future periods.
Risks Related to Our Customers, Industry, Competition and Vendors
•Negative industry and macroeconomic conditions impacting our customers or us may materially and adversely impact our business, financial condition and results of operations.
•Our Commercial Services and Government Solutions segments have customer concentration that could have a material adverse effect on our business.
•Our contract with NYCDOT, which comprises a material portion of our revenue, expired on December 31, 2024, and we are presently participating in a competitive procurement for a new NYCDOT automated enforcement program contract. We extended our current contract with NYCDOT through December 31, 2025 to allow NYCDOT to continue to operate its automated enforcement program until the competitive procurement process is completed. There can be no assurance that we will be successful in winning the competitive procurement. If we are not successful in winning the competitive procurement for a new contract with NYCDOT, or if we win the competitive procurement at materially different terms and pricing as our current contract, it would have a material adverse effect on our business, financial condition and results of operations.
•Our government contracts are subject to unique risks and uncertainties, including termination rights, delays in payment, audits and investigations, any of which could have a material adverse effect on our business.
•Any decreases in the prevalence or political acceptance of, or an increase in governmental restrictions regarding, automated and other similar methods of photo enforcement, the use of third-party tolling and violations processing service providers, the ability to charge service or other fees to customers for services provided, could have a material adverse effect on our business.
•Our reliance on specialized third-party providers could have a material adverse effect on our business.
Risks Related to Our Acquisitions
•Our inability to successfully implement our acquisition strategy could have a material adverse effect on our business.
Risks Related to Data Privacy and Cybersecurity
•A failure in or breach of our networks or systems, including as a result of cyber-attacks, could have a material adverse effect on our business.
Risks Related to our International Operations
•Our international operations expose us to additional risks, and failure to manage those risks could have a material adverse effect on our business.
Risks Related to Our Intellectual Property
•Failure to acquire necessary intellectual property or adequately protect our intellectual property could have a material adverse effect on our business.
Risks Related to Our Indebtedness
•Our substantial level of indebtedness could cause our business to suffer and incurring additional debt could intensify debt-related risks.
Due to the risk factors discussed below, as well as other factors affecting our business, operating results, financial condition, financial performance or prospects, our past financial performance should not be considered to be a reliable indicator of our future performance, and investors should not use historical trends to anticipate results or trends in future periods.
Risks Related to Our Customers, Industry, Competition and Vendors
Negative industry and macroeconomic conditions impacting our customers or us may materially and adversely impact our business, results of operations and financial condition.
We provide smart mobility technology solutions to customers in our Commercial Services, Government Solutions and Parking Solutions business segments. Accordingly, the demand for our products in the past has been, and in the future may be, impacted by industry and macroeconomic trends and conditions impacting our customers, including seasonality, demand for business and leisure travel, reductions in the level of air travel, higher airfare costs, energy shortages and cost increases, international, national and local economic conditions and cycles, as well as other factors affecting travel levels, such as military conflicts, terrorist incidents, natural disasters and epidemic diseases. For example, our Commercial Services segment may be impacted by travel demand and extreme weather events which may impact overall travel demand in the United States. Our Government Solutions segment may be impacted to the extent our customers experience a reduction in political acceptance of or additional government restrictions on automated safety programs. Our Parking Solutions segment may be impacted to the extent our customers see an increase in usage of public transportation or rideshare, either of which may cause a decrease in parking usage. Furthermore, uncertain economic conditions may make it more difficult for us to raise funds through borrowings or private or public sales of debt or equity securities. We cannot predict the timing, strength or duration of any economic slowdown, instability or recovery, generally or within any particular industry.
Government actions and regulations, such as tariffs and trade protection measures, may negatively impact our business. Political challenges between the United States and countries in which we operate, and changes to trade policies, including tariff rates and customs duties, trade relations between the United States and those countries and other macroeconomic issues could adversely impact our business. The United States administration has announced tariffs on certain products imported into the United States, and some countries have imposed tariffs in response to the actions of the United States. There is also a possibility of future tariffs, trade protection measures or other restrictions imposed by the United States or other countries.
In addition, consumer spending and activities may be materially adversely affected in response to financial market volatility, negative financial news, conditions in the real estate and mortgage markets, declines in income or asset values, energy prices, labor and healthcare costs and other economic factors, all of which may have a negative effect on our business and results of operations. Additionally, uncertainty about, or a decline in, global or regional economic conditions may have a significant impact on our suppliers, manufacturers, logistics providers, distributors and other partners. Potential effects on our suppliers and partners include financial instability, inability to obtain credit to finance operations, and insolvency.
Negative conditions in the general economy both in the United States and abroad, including conditions resulting from changes in gross domestic product growth, inflation, financial and credit market fluctuations, international trade relations, pandemics, political turmoil, natural catastrophes, warfare, and terrorist attacks on the United States or elsewhere, could negatively affect customer demand and the growth of our business.
Our Commercial Services and Government Solutions segments have several large customers, including the NYCDOT, that account for a significant portion of our revenue, and a reduction in demand or loss of one or more of such customers could have a material adverse effect on our business.
Our business experiences varying levels of customer concentration. For example, our Commercial Services segment is dependent on certain key customers, such as Avis Budget Group, Inc., Enterprise Mobility and The Hertz Corporation. These three customers accounted for 36.0% and 35.8% of our total revenue for the years ended December 31, 2024 and 2023, respectively. If any of these customers were to reduce their demand, the demand fluctuates, or one of more of these customers terminates their agreements with us, it would have a material adverse impact on our business and results of operations.
We also experience customer concentration in our Government Solutions segment. The New York City Department of Transportation (“NYCDOT”) represented approximately 15.8% and 16.9% of our total revenues during the years ended December 31, 2024 and 2023, respectively, and 17.2% and 18.3% of total accounts receivable, net as of December 31, 2024 and 2023, respectively. Our contract with NYCDOT expired on December 31, 2024, and we are presently participating in a competitive procurement for a new NYCDOT automated enforcement program contract. We extended our current contract with NYCDOT through December 31, 2025 to allow NYCDOT to continue to operate its automated enforcement program until the competitive procurement process is completed. However, there is no assurance that we will be successful in winning the competitive procurement for the new automated enforcement contract. If we are unable to win the competitive procurement for a new contract with NYCDOT, or if we win the competitive procurement at materially different terms and pricing as our current contract, it would have a material adverse effect on our business, financial condition and results of operations. We may continue to rely on a small number of customers in our Government Solutions segment to represent a significant portion of our total revenues in any given period. The loss of any of our top Government Solutions customers could have a material adverse effect on our business, financial condition and results of operations.
Our government contracts are subject to unique risks and uncertainties, including termination rights, delays in payment, audits and investigations, any of which could have a material adverse effect on our business.
We enter into government contracts from time to time with customers that are subject to various uncertainties, restrictions and regulations, which could result in withholding or delay of payments to us. For example, as of December 31, 2024, NYCDOT had an open receivable balance of $35.6 million, which represented 17.2% of our total accounts receivable, net.
Government entities typically finance projects through appropriated funds. While these projects are often planned and executed as multi-year projects, government entities usually reserve the right to change the scope of or terminate these projects for lack of approved funding or at their convenience. Furthermore, we may be required to perform work under expired or terminated government contracts and may be restricted from recognizing revenue from such contracts. Changes in government or political developments, including administrative hurdles, constitutional challenges, budget deficits, shortfalls or uncertainties, government spending reductions or other debt or funding constraints, could result in our government contracts being reduced in price or scope or terminated altogether, as well as limit our ability to win new government work in the future.
Moreover, if a government customer does not follow the requisite procurement or ordinance-specific administrative procedures, the contract may be subject to protest or voidable regardless of whether we bear any responsibility for the error. Our government contracts are subject to underlying laws and regulations related to government contractors, and often include other one-sided, customer-friendly provisions and certifications, including broad indemnification provisions and uncapped exposure or liquidated damages for certain liabilities, which can impose obligations, requirements and liabilities on us that are beyond those associated with a typical commercial arrangement. We may also be subject to differing or contrary policy preferences or requirements among our government customers which could result in a loss of government customers if we are unable to satisfy such potential differing requirements or preferences to the satisfaction of such customers.
In addition, government contracts are generally subject to audits and investigations by government agencies or higher-tier government contractors. If improper or illegal activities or contractual non-compliance are identified, including improper billing or vendor non-compliance, we may be subject to various civil and criminal penalties and administrative sanctions, which may include termination of contracts, forfeiture of profits, suspension of payments, the imposition of fines, penalties and sanctions, and suspensions or debarment from doing business for or on behalf of the government in the future. For example, in 2020, after we discovered issues in our system installation practices under our agreement with NYCDOT, NYCDOT investigated the matter and we undertook significant efforts to remediate past installations. If penalties or other restrictions are imposed in one jurisdiction, they could also implicate similar provisions of contracts with other government customers in other jurisdictions. Further, the negative publicity related to these penalties, sanctions or findings in government audits or investigations could harm our reputation and hinder our ability to compete for new contracts with government customers and in the private sector. Any of the foregoing or any other reduction in revenue from government customers could have a material adverse effect on our business, financial condition and results of operations.
Any decreases in the prevalence or political acceptance of, or an increase in governmental restrictions regarding, automated and other similar methods of photo enforcement, the use of third-party tolling service providers or the ability to charge service or other fees to customers for services provided, could have a material adverse effect on our business.
Our Government Solutions segment provides automated safety solutions to national, state and local government agencies, generating revenues through automated photo enforcement of red-light, school bus, speed limit and bus lane laws. We sometimes make significant capital and other investments to attract and retain these contracts, such as the cost of purchasing information technology equipment, constructing and installing photo enforcement systems and developing and implementing software and labor resources. In 2024, revenues from this segment represented approximately 44% of our total revenues. Therefore, we depend on national, state and local governments authorizing the use of automated photo enforcement and not otherwise materially restricting its use. In states that have enabling legislation, if that legislation is amended, not renewed or is otherwise repealed, use of automated enforcement technology can be suspended until new legislation is passed. In 2022, a North Carolina court of appeals issued a ruling limiting the ability of local authorities to make certain decisions with respect to funding automated enforcement programs, impacting the viability of automated enforcement in impacted jurisdictions.
Ballot initiatives, referendums, opinions of attorneys general and legal challenges can also be used to restrict the use of automated enforcement or to impose additional licensing requirements on its use. For example, the Attorneys General in the states of Arizona, Tennessee and Virginia have issued opinions that had the effect of limiting the use of these enforcement technologies or impacting the manner in which photo enforcement programs operate. Usage may also be affected if there is an unfavorable shift in political support for, or public sentiment towards, automated enforcement, or as a result of one or more scandals related to its use.
Similarly, our Commercial Services business may be materially impacted if there is an unfavorable shift in political support for or public sentiment towards tolling or its use is materially restricted or limited, including through the imposition of limits on the fees RAC companies can charge their customers for tolling or violation processing services. Any material restriction or limitation on the use of automated enforcement or material reduction in its use in the markets we serve, or any similar changes with respect to tolling, could have a material adverse effect on our ability to recoup our investments, and negatively impact our business, financial condition and results of operations. Further, our relationships and commercial account agreements with tolling authorities, issuing authorities, motor vehicle departments and other governmental agencies significantly enhances and enables our service offerings, and changes in those relationship or agreements could significantly adversely impact our business.
We face intense competition and any failure to keep up with technological developments, changing customer preferences and new laws and policies could have a material adverse effect on our business.
The markets for our solutions are increasingly competitive, rapidly evolving and fragmented, and are subject to changing technology, shifting customer needs, contract renewals and new laws and policies. A number of vendors develop and market products and services that compete to varying extents with our offerings, and we expect this competition to intensify. The rapid rate of technological change in our industry could increase the chances that we will face competition from new products or services designed by companies that we do not currently compete with. This includes advancements in the area of self-driving cars which may significantly reduce the frequency of vehicles illegally running red lights or exceeding posted speed limits. This also includes AI tools, which may allow for new or more efficient competing solutions. Moreover, we face competition from our own customers as they may choose to invest in developing their own internal solutions.
Some of our existing competitors and potential new competitors have longer operating histories, greater name recognition, less debt, more established customer bases or significantly greater financial, technical, research and development, marketing and other resources than we do. As a result, our competitors may be able to respond more quickly and effectively than we can to new or changing opportunities, technologies (including AI), standards or customer requirements. In some cases, our competitors may be better positioned to initiate or withstand substantial price competition, and we may have to reduce our pricing to retain existing business or obtain new business. If we are not able to maintain favorable pricing for our solutions, our profit margin and profitability could suffer. In addition, if a prospective customer is currently using a competing solution, the customer may be unwilling to switch to our solution without setup support services or other incentives. Certain existing and new competitors may be better positioned to acquire competitive solutions, develop new solutions, modify existing solutions, effectively negotiate third-party licenses and other strategic relationships, and take advantage of acquisition or other similar expansion opportunities. Any failure to achieve our target pricing levels, maintain existing customer relationships, generate additional customer wins or otherwise successfully compete would have a material adverse effect on our business, financial condition and results of operations.
Our new products and services and changes to existing products and services may not succeed.
Our ability to retain, increase and engage our customer base and to increase our revenue depends, in large part, on our ability to continue to evolve existing solutions and to create successful new solutions. We may introduce significant changes to our existing solutions or acquire or introduce new and unproven products and services, including using technologies (such as AI) or entering markets or industries in which we have little or no experience. For example, as Government Solutions customers increase their requirements related to data security, privacy and IT architecture, significant effort and expense may be required to develop new solutions to keep up with increasing requirements, and our efforts may not be entirely successful. Modifications or developments can be costly, may be restricted by regulatory requirements, involves significant research, development, time, expense and human capital and may not necessarily result in the successful commercialization or adoption by customers as expected. The failure of any new or enhanced solution to achieve customer adoption or our failure to otherwise successfully monetize our development efforts could have a material adverse effect on our business, financial condition and results of operations. Further, changes to the hardware solutions we offer to our government customers may require certification by a government agency, and failure to achieve such certification may result in an inability to sell or operate photo enforcement systems in a particular jurisdiction. Any failure to evolve existing solutions or create new successful solutions could have a material adverse effect on our business, financial condition and results of operations.
The use or integration of AI tools and technologies into existing and new solutions may present novel risks and challenges that could adversely affect our business. We are evaluating AI tools for, among other things, software development and back-end processing functions. In addition, our vendors may incorporate AI tools into their services and deliverables, at times without disclosing this to us, and the providers of such AI tools may not meet existing or rapidly evolving regulatory or industry standards with regard to privacy, security, IP, and data protection. Uncertainty in the regulatory environment related to AI may require significant resources to modify and maintain business practices to comply with applicable law, the nature of which continues to evolve and may prevent or limit our ability to use AI in our business, lead to regulatory fines or penalties, or require us to change our business practices. If we cannot use AI, or that use is restricted, our business may be less efficient, or we may be at a competitive disadvantage, which could adversely affect our business. Additionally, investments in AI may not realize the benefits that were anticipated.
We regularly pursue contracts and contract renewals that require competitive bidding, which can involve substantial costs and could have a material adverse effect on our business.
Many of the contracts and renewals for which we bid, particularly those for certain larger government customers, are extremely complex and require the investment for significant resources in order to prepare accurate bids and proposals. Further, a significant percentage of new customer growth opportunities and contract renewals or extensions in our business segments are only accessible through competitive bidding. Competitive bidding imposes substantial costs and presents several risks, including significant time and effort and the commitment of resources, regardless of whether the contract is ultimately won. For example, we invested significant time and resources to prepare our response for the competitive procurement for the new NYCDOT automated enforcement program contract. We may also be unable to meet the requirements of a solicitation or may have to incur substantial costs to be able to do so. These and other unanticipated costs related to the competitive bidding process, including advancing or defending bid protests, and any failure to win renewals or new customer accounts through the competitive bidding process, could have a material adverse effect on our business, financial condition and results of operations.
Our reliance on third-party providers could have a material adverse effect on our business.
We rely heavily on third-party providers, including subcontractors, manufacturers, software vendors, software application developers, and utility and network providers, to meet their obligations to us in a timely and high-quality manner. For example, we rely on third parties to provide data sourced from state departments of motor vehicles (and their European equivalents) and other governmental agencies with which we do not have direct relationships for the driver and other information we use in our business. Our ability to offer our solutions would be materially affected if this access was unavailable or materially restricted, or if the price we pay increased significantly. Our Government Solutions business also relies on a number of third-party manufacturers, including camera manufacturers and automated license plate recognition providers, and outsources some engineering, construction, maintenance, printing and mailing, call center, image review and event processing work. Further, if one or more tolling authorities cancels our accounts, or stops providing transponders and we are unable to obtain transponders through other sources, our Commercial Services business would be affected. Our Parking Solutions business also relies on a number of domestic and foreign third-party manufacturers in the production of our pay station, Parking Access and Revenue Control (PARCS) and parking enforcement hardware solutions, and our inability to access third-party providers could have a material adverse effect on our business.
We also outsource a meaningful percentage of our software development work to third parties. Some of our agreements with these third parties include termination rights, allowing the third party to terminate the arrangement in certain circumstances. For example, the agreements with our third-party payment processors give them the right to terminate the relationship if we fail to keep credit card chargeback and retrieval rates below certain thresholds. If any of our third-party providers are unable or unwilling to meet their obligations to us, fail to satisfy our expectations or those of our customers, including those imposed through flow-down provisions in prime contracts, or if they terminate or refuse to renew their relationships with us on substantially similar terms, we may be unable to find adequate replacements within a reasonable time frame, on favorable commercial terms or at all, and our business, financial condition and results of operations could be materially and adversely affected.
While we perform some due diligence on these third parties and take measures to ensure that they comply with applicable laws and regulations, we do not have an extensive screening or review process and ultimately cannot guarantee our third-party providers will comply with applicable laws, the terms of their agreements or flow-down requirements from our customers. Misconduct or performance deficiencies by any of our third-party providers may be perceived as misconduct or poor performance by us, cause us to fall short on our contractual obligations to our customers or harm our reputation, any of which could have a material adverse effect on our business, financial condition and results of operations.
We rely on communications networks and information systems and any interruption could have a material adverse effect on our business.
We rely heavily on the satisfactory performance and availability of our information technology infrastructure and systems, including our websites and network infrastructure, to conduct our business. We rely on third-party communications service and system providers to provide technology services and link our systems with our customers’ networks and systems, including a reliable network backbone with the necessary speed, data capacity and security. We also rely on third-party vendors, including data center, bandwidth and telecommunications equipment providers. A failure or interruption that results in the unavailability of any of our information systems or a major disruption of communications between a system and the customers we serve could disrupt the effective operation of our solutions and otherwise adversely impact our ability to manage our business effectively. We may experience system and service interruptions or disruptions for a variety of reasons, including as the result of network failures, power outages, cyber-attacks, employee errors, software errors, an unusually high volume of transactions, or localized conditions such as fire, explosions or power outages or broader geographic events such as earthquakes, storms, floods, epidemics, strikes, acts of war, civil unrest or terrorist acts. We have taken steps to mitigate our exposure to certain service disruptions by investing in redundant or blended circuits, although the redundant or blended circuits may also suffer disruption. Because we are dependent in part on independent third parties for the implementation and maintenance of certain aspects of our systems and because some of the causes of system interruptions may be outside of our control, we may not be able to remedy such interruptions in a timely manner, or at all. Any interruption or delay in or cessation of these services and systems could significantly disrupt operations, impact customers, damage our reputation, result in litigation, decrease the overall use and acceptance of our solutions, result in lost data and be costly, time consuming and difficult to remedy, any of which could have a material adverse effect on our business, financial condition and results of operations.
Our failure to properly perform under our contracts or otherwise satisfy our customers could have a material adverse effect on our business.
Our business model depends in large part on our ability to retain existing work and attract new work from existing customers. If a customer is not satisfied with our products, services or solutions or the timeliness or quality of our work, we may incur additional costs to address the problem, the profitability of that contract may be impaired, we may experience payment delays, it could do harm to our reputation and hinder our ability to win new work from prospective customers. Failure to properly transition new customers to our systems or existing customers to our different systems, properly budget transition costs or accurately estimate contract costs could also result in delays and general customer dissatisfaction. Many of our contracts may be terminated by the customer upon specified advance notice without cause. Any failure to properly perform under our contracts or meet our customers’ expectations could have a material adverse effect on our business, financial condition and results of operations.
Risks Related to Our Acquisitions
Our inability to successfully implement our acquisition strategy could have a material adverse effect on our business.
We have grown in large part as a result of our acquisitions, and we anticipate continuing to grow in this manner. Although we expect to regularly consider additional strategic transactions in the future, we may not identify suitable opportunities or, if we do identify prospects, it may not be possible to consummate a transaction on acceptable terms. Competition laws or foreign investment controls may also limit our ability to acquire or work collaboratively with certain businesses or to fully realize the benefits of a prospective or completed acquisition. Furthermore, a significant change in our business or the economy, an unexpected decrease in our cash flows or any restrictions imposed by our indebtedness may limit our ability to obtain the necessary capital or otherwise impede our ability to complete a transaction. Regularly considering strategic transactions can also divert management’s attention and lead to significant due diligence and other expenses regardless of whether we pursue or consummate any transaction. Failure to identify suitable transaction partners and to consummate transactions on acceptable terms, as well as the commitment of time and resources in connection with such transactions, could have a material adverse effect on our business, financial condition and results of operations.
The inability to successfully integrate our recent or future acquisitions could have a material adverse effect on our business.
We have integrated, and may in the future integrate, certain acquired businesses into our existing operations, which requires significant time and exposes us to significant risks and additional costs. Further, we may have difficulty integrating the operations, systems, controls, procedures or products of such acquired businesses and may not be able to do so in a timely, efficient and cost-effective manner. These difficulties could include but are not limited to:
•combining management teams, strategies and philosophies;
•merging or linking different accounting and financial reporting systems and systems of internal controls;
•assimilating personnel, human resources and other administrative departments and potentially contrasting corporate cultures;
•merging computer, technology and other information networks and systems;
•disrupting our relationship with or losing key customers, suppliers or personnel; and
•interference with, or loss of momentum in, our ongoing business or that of the acquired business.
Any integration-related issues could cause significant disruption to our business, divert the attention of management and lead to substantial additional costs and delays. For example, between February 2022 and April 2022, our Audit Committee devoted significant time and resources into an accounting investigation of Redflex Holdings Limited, an acquired subsidiary, and we were unable to timely file our Annual Report on Form 10-K for the fiscal year ended December 31, 2021. Our inability to successfully integrate acquired businesses could have a material adverse effect on our business, financial condition and results of operations.
Any failure to realize the anticipated benefits of an acquisition, including unanticipated expenses and liabilities related to acquisitions, could have a material adverse effect on our business.
We pursue each acquisition with the expectation that the transaction will result in various benefits, including growth opportunities and synergies from increased efficiencies. However, we may not realize some or all of the anticipated benefits of our acquisitions within our anticipated timeframes or at all. Furthermore, we may experience increased competition that limits our ability to expand our business, we may not be able to capitalize on expected business opportunities, and general industry and business conditions may deteriorate. Acquisitions also expose us to significant risks and costs, and business and operational overlaps may lead to hidden costs. These costs can include unforeseen pre-acquisition liabilities, the impairment of customer relationships, acquired assets, or goodwill, or exposure to oversight, operational and business control risks associated with a newly acquired business. We may also incur costs and inefficiencies to the extent an acquisition expands the industries, markets or geographies in which we operate due to our limited exposure to and experience in a given industry, market or region. Significant acquisitions may also require us to incur additional debt to finance the transactions, which could limit our flexibility in using our cash flow from operations for other purposes. Acquisitions often involve post-transaction disputes with the counterparty regarding a number of matters, including disagreements over the amount of a purchase price or other working capital adjustment or disputes regarding whether certain liabilities are covered by the indemnification provisions of the transaction agreement. We may underestimate the level of certain costs or the exposure we may face as a result of acquired liabilities. If any of these or other factors limit our ability to achieve the anticipated benefits of a transaction, or we encounter other unexpected transaction-related costs and liabilities, our business, financial condition and results of operations could be materially and adversely affected.
Our goodwill has been subject to impairment and may be subject to further impairment in the future, which could have a material adverse effect on our results of operations, financial condition, or future operating results.
We perform a goodwill impairment test for each reporting unit annually, or more frequently if indicators for potential impairment exist. Indicators that are considered include significant changes in performance relative to expected operating results, significant negative industry or economic trends, or a significant decline in our stock price and/or market capitalization for a sustained period of time. In addition, we assess the current and future economic outlook for our reporting units during the fiscal year. While we believe the assumptions used in determining whether there was impairment and the amount of any resulting impairment were reasonable and commensurate with the views of a market participant, changes in key assumptions in the future, including increasing the discount rate, lowering forecasts for revenue and operating margin, or lowering the long-term growth rate, could result in additional charges; similarly, one or more changes in these assumptions in future periods due to changes in circumstances could result in future impairments in one or more reporting units. We have incurred impairment charges in the current period, and we cannot predict if or when additional future goodwill impairments may occur. We recorded a $97.1 million impairment to goodwill in our Parking Solutions segment during fiscal year 2024, which is presented in a separate line item on the consolidated statements of operations. This was in connection with our 2024 assessment of goodwill impairment where the Parking Solutions reporting unit’s carrying value exceeded the estimated fair value. Any future goodwill impairments could have material adverse effects on our operating income, net assets, or our cost of, or access to, capital, which could harm our business. See Note 2, Significant Accounting Policies, in Item 8, Financial Statements and Supplementary Data, for additional information.
Risks Related to Data Privacy and Cybersecurity
A failure in or breach of our networks or systems, including as a result of cyber-attacks, could have a material adverse effect on our business.
We act as a trusted business partner in both front office and back office platforms, interacting with our customers and other third parties. Our customers include large, multinational corporations and government agencies who depend upon our operational efficiency, non-interruption of service, and accuracy and security of information. We receive, process, transmit and store substantial volumes of information relating to identifiable individuals, both in our role as a back-end or direct-to-consumer service provider and as an employer, and receive, process and implement financial transactions, and disburse funds, which requires us to receive debit and credit card information. We also use third-party providers such as subcontractors, software vendors, utility providers and network providers, upon whom we rely, to offer our products, services and solutions. As a result of these and other aspects of our business, the integrity, security and accuracy of our systems and information technology, and that of the third parties with which we interact, including our customers and other government agencies with which we work, are extremely important.
Our cybersecurity and processing systems, as well as those of the third parties with which we interact, may be damaged, disrupted or otherwise breached for a number of reasons, including power outages, computer and telecommunication failures, computer viruses, malware or other destructive software, internal design, manual or usage errors, cyber-attacks, terrorism, workplace violence or wrongdoing, catastrophic events, natural disasters and severe weather conditions. Our visibility and role as a processor of transactions containing personally identifiable information may also put us at a greater risk of being targeted by hackers. In the normal course of our business, we have been the target of malicious cyber-attack attempts. We have in place insurance designed to provide coverage in connection with cybersecurity breaches, provided, however, that such insurance coverage may be insufficient to cover all insured losses or all types of claims that may arise.
In addition, numerous and evolving cybersecurity threats, including advanced and persistent cyber-attacks, phishing and social engineering schemes could compromise our systems and the confidentiality, availability and integrity of data in our systems, as well as the systems and data of the third parties with which we interact. The security measures and procedures we and the third parties with which we interact have in place to protect sensitive consumer data and other information may not be successful or sufficient to counter all data breaches, cyber-attacks, or system failures. Further, employee error or malfeasance, faulty password management or other irregularities may result in a defeat of security measures or a system breach. Although we devote significant resources to our cybersecurity programs and have implemented security measures to protect our systems and data, and to prevent, detect and respond to data security incidents, in each case that we believe are reasonable and appropriate, these efforts, and the efforts of third parties with which we interact, may not prevent these or other threats.
Moreover, because the techniques used to obtain unauthorized access, or to disable or degrade systems change frequently, have become increasingly more complex and sophisticated, and may be difficult to detect for periods of time, we and the third parties with which we interact may not anticipate these acts or respond adequately or timely. As these threats continue to evolve and increase, we may be required to devote significant additional resources in order to modify and enhance our security controls and to identify and remediate any security vulnerabilities or conduct due diligence of those of third parties.
If we are sued in connection with any data security breach or system failure, we could be involved in protracted litigation. In addition, a breach could lead to unfavorable publicity and significant damage to our brand, the loss of existing and potential customers, allegations by customers that we have not performed or have breached our contractual obligations, or decreased use and acceptance of our solutions. A breach or failure may also subject us to additional regulations or governmental or regulatory scrutiny, which could result in significant compliance costs, fines or enforcement actions, or potential restrictions imposed by regulators on our ability to operate our business. A security breach would also likely require us to devote significant management and other resources to address the problems created by the security breach. Any of the foregoing could have a material adverse effect on our business, financial condition and results of operations.
We are subject to laws and regulations of the United States and foreign jurisdictions relating to personal information, privacy and data security, and failure to comply with these laws and regulations, whether or not inadvertent, could have a material adverse effect on our business.
Personal information is used both as part of our business and in our role as an employer. In addition, as part of our Government Solutions, Commercial Services and Parking Solutions businesses, we process other data which may be considered personal information or sensitive personal information in certain jurisdictions, such as photographs and video recordings. As a result, we are subject to various laws and regulations regarding personal information, privacy and data security, including those promulgated by the United States federal government and its agencies, and state, local and foreign governments, agencies, and public authorities. In addition, our handling of personal information is subject to our published privacy policies and notices, contractual obligations and industry standards.
Laws, regulations and industry standards relating to privacy are rapidly evolving, can be subject to significant change and may result in ever-increasing regulatory and public scrutiny and escalating levels of enforcement and sanctions. These laws and regulations may also be subject to new or different interpretations. For example, in June 2018, California enacted the CCPA, which took effect on January 1, 2020. The CCPA was amended and expanded (including to apply to employee and business-to-business data) by the California Privacy Rights Act, which took effect on January 1, 2023. The CCPA created several new obligations for companies which process personal information. It also gives California residents expanded rights to access, delete and obtain a copy of their personal information; opt out of certain personal information disclosures; and receive detailed information about how their personal data is processed. The law provides for civil penalties against companies that fail to comply.
Several other states have enacted privacy laws. These states include Virginia (effective January 1, 2023); Colorado and Connecticut (both effective July 1, 2023); Utah (effective December 31, 2023); Oregon, Texas, and Florida (all effective July 1, 2024); Montana (effective October 1, 2024); Delaware, Nebraska, New Hampshire, and Iowa (all effective January 1, 2025); New Jersey (effective January 16, 2025); Tennessee (effective July 1, 2025); Minnesota (effective July 31, 2025); Maryland (effective October 1, 2025); and Indiana, Kentucky, and Rhode Island (all effective January 1, 2026). Additional states have introduced privacy bills, and Congress has considered several privacy bills at the federal level. Regulations implementing the CCPA and Colorado have also been published, though many questions remain as to how all of the new statutes will be interpreted and enforced. In addition, the FTC uses its consumer protection authority to initiate enforcement actions against companies relating to their use and disclosure of personal information, particularly in response to actual or perceived unfair or deceptive acts or practices.
Various U.S. state laws and regulations may also require us to notify affected individuals and state agencies in the event of a data breach involving personal information. Penalties for failure to adequately protect personal information, notify as required, or provide timely notice vary by jurisdiction. In the United States, most state data breach notification laws consider violations to be unfair or deceptive trade practices and give the relevant state attorneys general the authority to levy fines or bring enforcement actions. Some laws, such as the CCPA, also grant affected individuals a private right of action for certain data breaches, with the CCPA also providing for statutory damages. Class action lawsuits against companies which experience a data breach involving personal information are also increasingly common and for larger awards. Foreign laws concerning personal information, privacy and data security may be more restrictive and burdensome than those of the United States. Given that data is highly mobile and transferable, many data protection and privacy laws of foreign nations seek to have wide extraterritorial jurisdiction over conduct occurring outside geographical boundaries of the relevant jurisdiction. For example, the GDPR extends the scope of E.U. data protection law to non-E.U. companies processing data of E.U. residents when certain conditions are satisfied. The GDPR contains numerous, more stringent requirements and changes from prior E.U. law, including more robust privacy and compliance obligations for both companies and their service providers, greater rights for individuals, heavier documentation requirements for data protection compliance programs, restrictions on transfers of personal data to non-E.U. countries, and prompt notice of data breaches to data subjects and supervisory authorities in certain circumstances. The GDPR fine framework can be up to €20 million, or up to 4% of the company’s total global turnover of the preceding fiscal year, whichever is higher. Further, our customers, through contractual requirements, could require us to comply with certain of these stringent requirements regardless of whether our business is actually subject to the GDPR.
The costs could be high and deadlines short for compliance with these privacy- and data security-related laws, regulations, contractual requirements and industry standards, each of which may limit our ability to compete for new business, do business with certain government agencies, including our existing customers, or continue to access certain data, and may limit the use or adoption of our smart mobility technology solutions and services, reduce overall demand for our solutions and services, slow the pace at which we generate revenue, subject us to fines or penalties, or cause us to breach contractual commitments to our customers. As these laws, regulations, and standards continue to develop in the United States and internationally, we may be required to expend significant time and resources in order to update existing processes or implement additional mechanisms as necessary to ensure compliance. Moreover, if our policies, procedures or measures relating to these issues fail to comply, or regulators assert we have failed to comply, with applicable laws, regulations or industry standards, we may be subject to governmental enforcement actions, litigation, regulatory investigations, fines, algorithmic disgorgement, the inability to use previously-collected personal information or the inability to collect new personal information, other penalties and negative publicity, and our application providers, customers and partners may lose trust in or stop doing business with us entirely. We expect that there will continue to be new proposed laws, regulations and industry standards concerning personal information, privacy and data retention in the United States, the E.U. and other jurisdictions, and we cannot yet determine the impact of such future laws, regulations and industry standards may have on our business. Any of the foregoing could have a material adverse effect on our business, financial condition and results of operations.
We are subject to domestic and foreign laws relating to processing certain financial transactions, including debit or credit card transactions, and failure to comply with those laws, even if inadvertent, could have a material adverse effect on our business.
We process, support and execute financial transactions as part of our business and disburse funds on behalf of certain of our customers. This activity includes receiving debit and credit card information, processing payments for and due to our customers and disbursing funds on payment or debit cards to payees of our customers. As a result, we may be subject to numerous U.S. federal and state and foreign jurisdiction laws and regulations, including the Electronic Fund Transfer Act, the Currency and Foreign Transactions Reporting Act of 1970 (commonly known as the Bank Secrecy Act) and the Uniting and Strengthening America by Providing Appropriate Tools Required to Intercept and Obstruct Terrorism Act of 2001 (the “Patriot Act”).
We have implemented policies and procedures to preserve and protect credit card and other payment data against loss, corruption, misappropriation caused by systems failures, unauthorized access or misuse. Notwithstanding these policies and procedures, we could be subject to liability claims by individuals and customers whose data resides in our databases for the misuse of that information. If we fail to meet appropriate compliance levels, this could negatively impact our ability to utilize credit cards as a method of payment, or collect and store credit card information, which could disrupt our business. Failure to comply with these laws may subject us to, among other things, additional costs or changes to our business practices, liability for monetary damages, fines or criminal prosecution, unfavorable publicity, restrictions on our ability to process and support financial transactions and allegations by customers that we have not performed our contractual obligations, any of which could have a material adverse effect on our business, financial condition and results of operations.
Risks Related to Human Capital Management
We depend on the services of key executives and any inability to attract and retain key management personnel could have a material adverse effect on our business.
Our future success depends upon the continued services of our executive officers, including our Chief Executive Officer and Chief Financial Officer, who have critical experience and relationships that we rely on to implement our business plan and growth strategy. Additionally, as our business grows, we may need to attract and hire additional management personnel. We have employment agreements with some members of senior management that include non-competition provisions; however, we cannot prevent our executives from terminating their employment and may not be able to fully enforce non-competition provisions limiting former executives or key personnel from competing with us following any departure. Moreover, we do not carry “key-man” life insurance on the lives of our executive officers, employees or advisors. Our ability to retain our key management personnel or to identify and attract additional management personnel or suitable replacements should any members of the management team leave or be terminated is dependent on a number of factors, including the competitive nature of the employment market and our industry. Any failure to retain key management personnel or to attract additional or suitable replacement personnel could cause uncertainty among investors, employees, customers and others concerning our future direction and performance and could have a material adverse effect on our business, financial condition and results of operations.
A failure to attract and retain necessary skilled personnel and qualified subcontractors could have a material adverse effect on our business.
Our business depends on highly skilled technical, managerial, engineering, sales, marketing and customer support personnel and qualified and competent subcontractors. Competition for these personnel is intense. Any failure to attract, hire, assimilate in a timely manner and retain and motivate key qualified personnel, particularly software development, product development, analytics and other technical personnel, or inability to contract with qualified, competent subcontractors, could impair our success. Additionally, certain portions of our Government Solutions operations are dependent on employees and subcontractors who are subject to a collective bargaining agreement. When the collective bargaining agreement becomes subject to renegotiation or if we face union organizing drives, a disagreement between us and the union on issues of importance to the union may lead to a strike, work slowdown or other job actions in one or more locations we serve. A strike, work slowdown or other job action could disrupt our services, resulting in reduced revenues or contract cancellations. State or local law in some jurisdictions requires that subcontractors for our Government Solutions segment are certified by the jurisdiction, and the failure on the part of our subcontractors to obtain and maintain such certification could impact their ability to perform services for us. Further, some jurisdictions require that we subcontract a certain percentage of our work to certified businesses and failure to do so may decrease our competitiveness in the marketplace, lead to breach of contract claims or result in having to refund fees paid for failing to achieve committed targets. Additionally, our acquisition activity could increase the challenge of retaining our key employees and subcontractors and those of the acquired businesses. The loss of any key technical employee or the termination of a key subcontractor relationship, and any inability to identify suitable replacements or offer reasonable terms to these candidates, could have a material adverse effect on our business, financial condition and results of operations.
Risks Related to our International Operations
Our operations in international markets expose us to additional risks, and failure to manage those risks could have a material adverse effect on our business.
We have subsidiaries in various international markets that include but are not limited to the United Kingdom, Netherlands, France, Ireland, Spain, Australia, Canada, Hungary and India. The success of our business depends, in part, on our ability to successfully manage these foreign operations. Our international operations subject us to risks that could increase expenses, restrict our ability to operate, result in lost revenues or otherwise materially and adversely affect our business, including:
•political, social, and economic instability, including European sovereign debt issues and tightening of government budgets;
•fluctuations in geopolitical relationships, which may impact our access to goods and services and our ability to contract with certain government entities;
•wars, civil unrest, acts of terrorism and other conflicts;
•increased complexity and costs of managing or overseeing foreign operations, including adapting and localizing our services to specific regions and countries and relying on different third-party service providers;
•complying with tariffs, trade restrictions, and trade agreements and any changes thereto;
•foreign exchange and other restrictions and limitations on the transfer or repatriation of funds;
•adverse tax consequences;
•fluctuations in currency exchange rates;
•complying with varying legal and regulatory environments, and managing public perception, in multiple foreign jurisdictions, including with respect to data and consumer privacy and payment processing, labor matters and VAT, and unexpected changes in these laws, regulatory requirements, and the enforcement thereof; and
•limited protection of our intellectual property and other assets as compared to the laws of the United States.
We have limited or no control over these and other factors related to international operations and our strategies to address these risks may not correctly anticipate any problems that arise or be successful in expanding our solutions from the United States into new markets. Any failure to successfully manage these and other similar risks could have a material adverse effect on our business, financial condition and results of operations.
Our growth strategy is, in part, dependent on successfully implementing our international expansion strategy.
Our growth strategy includes expanding our global footprint, which may involve moving into regions and countries beyond those in which we currently operate. In order to achieve widespread acceptance in new markets we may enter, we may need to develop new products and services or tailor our existing products and services to that market’s unique customs, cultures and standards. Management of these and any future international subsidiaries may divert our resources and require significant attention from management. In addition to the risks inherent in conducting international business, expanding internationally with new and existing customers poses additional risks, including:
•lack of acceptance of our products and services;
•tax issues, including administration of value-added tax, restrictions on repatriating earnings, and with respect to our corporate operating structure and intercompany arrangements;
•our ability to adapt our marketing and selling efforts to different cultures and customers;
•a different competitive environment, including a number of smaller competitors and a more fragmented business model, as well as competition from other market participants;
•our ability to obtain and protect intellectual property rights to operate successfully in each territory due to pre-existing third-party intellectual property rights; and
•an unfamiliar regulatory environment, including different local, provincial and national regulations.
If we are unable to effectively manage these risks, our relationships with our existing and prospective customers, strategic partners and employees and our operations outside the United States may be adversely affected.
In many cases, we will have limited or no experience in a particular region or country where we intend to launch operations. Moreover, learning the customs and cultures, particularly with respect to consumer preferences, differing technology standards and language barriers, is a difficult task. Our failure to do so effectively could slow our growth in those regions or countries. In many of these markets, long-standing relationships between potential customers and their local partners and protective regulations, including local content requirements and approvals, and disparate networks and systems used by each country, will create barriers to entry. Difficulties in foreign financial markets and economies and of foreign financial institutions, particularly in emerging markets, could also adversely affect demand in the affected areas. For this strategy to be successful, we must generate sufficient revenues and margins from the new markets to offset the expense of the expansion. Moreover, as the scale of our international operations increases, we will be more susceptible to the general risks related to our existing international operations discussed above. If we are unable to further expand internationally or if we are unable to effectively and efficiently manage the complexity of our expanded operations and compete in these new regions and countries, our business, financial condition and results of operations could be adversely affected.
Failure to comply with anticorruption and anti-money laundering laws, including the U.S. Foreign Corrupt Practices Act and similar laws associated with our activities outside of the United States, could have a material adverse effect on our business.
Our operations subject us to anticorruption and other similar laws and regulations of multiple jurisdictions, both within the United States and internationally, which are often evolving, including the Foreign Corrupt Practices Act (the “FCPA”), the U.S. domestic bribery statute contained in 18 U.S.C. § 201, the U.S. Travel Act, the Patriot Act, and comparable foreign anti-bribery and anti-money laundering laws and regulations, including the United Kingdom Bribery Act of 2010. Our businesses are subject to a number of international, federal, state and local laws and regulations regarding similar matters. These laws and regulations prohibit companies and their employees and third-party intermediaries from authorizing, offering or providing, directly or indirectly, improper payments or other benefits to government officials, political parties and private-sector recipients for the purpose of obtaining or retaining business, directing business to any person or securing any advantage.
We use various third parties to conduct our business, both domestically and abroad, and we can be held liable for the corrupt or illegal activities of our employees, representatives, contractors or subcontractors, partners, and agents, those of the third parties with which we do business or those of any businesses we acquire, even if we do not explicitly authorize such activities or if they occurred prior to our acquisition of the relevant business. Safeguards we implement to discourage these practices may prove to be ineffective and any internal investigations may not uncover any such practices that may exist. Violations of the FCPA or other applicable anti-bribery, anti-corruption, and anti-money laundering laws by us or any of these third parties can result in severe criminal or civil sanctions, or other liabilities or proceedings against us, including class action lawsuits, whistleblower complaints, enforcement actions by the SEC, Department of Justice, and U.S. state and local and foreign regulators, adverse media coverage, non-responsibility determinations by procuring agencies, and suspension or debarment from government contracts, any of which could have a material adverse effect on our business, financial condition and results of operations.
Numerous countries, including a number of those in which we do business, have agreed to a statement in support of Economic Co-operation and Development (“OECD”) model rules that propose a global minimum tax, which if adopted, and subject to any “protective measures” implemented by the United States and responses thereto, may increase and negatively impact our provision for income taxes.
Numerous countries, including a number of those in which we do business, have agreed to a statement in support of the OECD model rules that propose a global minimum tax rate of 15% that would apply to multinational companies with consolidated revenue above €750 million. Certain countries, including European Union member states, have enacted, or are expected to enact, legislation implementing a global minimum tax this year. In January 2025, the President of the United States issued an Executive Order declaring, in part, that the global minimum tax initiative has “no force or effect in the United States absent an act of the Congress.” This Executive Order further directed the U.S. Treasury Department to investigate whether any non-U.S. countries are not in compliance with any tax treaty or have tax rules in place, or that are likely to be put in place, that are extraterritorial or disproportionately affect U.S. corporations and, if so, to advise on options for “protective measures.” As a result of global minimum tax rules becoming effective in countries in which we do business, and subject to any “protective measures” that may be implemented by the United States and responses thereto by other countries, our taxes could increase and negatively impact our provision for income taxes. We will continue to monitor pending legislation and implementation by individual countries of a global minimum tax, as well as responses thereto by the United States, and evaluate the potential impact on our business in future periods.
Risks Related to Our Intellectual Property
Failure to acquire necessary intellectual property or adequately protect our intellectual property could have a material adverse effect on our business.
Our success depends, in part, on our ability to protect and defend our intellectual property against infringement, misappropriation and dilution. To protect our intellectual property rights, we rely on a combination of patent, trademark, copyright, trade secret and unfair competition laws of the United States and other countries, as well as contract provisions. We have registered certain patents and trademarks and have applications pending in the United States and foreign jurisdictions for some inventions and trademarks, including the Verra Mobility word mark and logo, for which some registrations have been granted and some applications are pending. However, not all of the trademarks and inventions we currently use have been registered in all of the countries in which we do business, and they may never be registered in all of those countries, and the applications we submit for these protections may not be granted. While we make efforts to acquire rights to intellectual property necessary for our operations, these measures may not adequately protect our rights in any given case, particularly in those countries where the laws do not protect proprietary rights as fully as in the United States.
If we fail to acquire necessary intellectual property rights or adequately protect or assert our intellectual property rights, competitors may manufacture and market similar products and services, or dilute our brands, which could adversely affect our market share. It may be possible for third parties to reverse engineer, otherwise obtain, copy, and use software or information that we regard as proprietary. In addition, our competitors may avoid application of our existing or future intellectual property rights. Further, patent rights, copyrights and contractual provisions may not prevent our competitors from developing, using or selling products or services that are similar to or address the same market as, our products and services. Failure to obtain registrations for the Verra Mobility word mark or logo may have a significant adverse impact on our brand. Moreover, some of our trademarks and services are descriptive or include descriptive elements, which may make it difficult to enforce our rights or prevent others from adopting and using similar marks. Competitive products and services could reduce the market value of our brands, products and services, inhibit attracting new customers or maintaining existing customers, lower our profits, and could have a material adverse effect on our business, financial condition and results of operations.
Our measures to monitor and protect our intellectual property may not be adequate to maintain or enforce our patents, trademarks or other intellectual property rights.
Despite our efforts to monitor and protect our intellectual property, we may not be able to maintain or enforce our patents, trademarks or other intellectual property rights. Unauthorized third parties may use our trademarks and service marks, or marks that are similar thereto, to impinge on our goodwill, cause consumer confusion or dilute our rights in the marks. We are aware of products, software and marks similar to our intellectual property being used by other persons. Although we believe that such uses will not adversely affect us, further or currently unknown unauthorized uses or other infringement of our trademarks or service marks could diminish the value of our intellectual property and may adversely affect our business. Even where we have effectively secured protection for our intellectual property, our competitors may challenge, infringe, misappropriate or dilute our intellectual property and our employees, consultants, contractors, customers and suppliers may breach their contractual obligations not to reveal or use our confidential information, including trade secrets. Additionally, defending or enforcing our intellectual property rights and agreements, and seeking an injunction or compensation for infringements or misappropriations, could result in expending significant resources and diverting management attention, which in turn may have a material adverse effect on our business, financial condition and results of operations.
We have been and may become subject to third-party infringement claims or challenges to the validity of our intellectual property that could have a material adverse effect on our business.
We have faced, and may in the future face, claims for infringement, misappropriation or other violations of intellectual property rights from intellectual property owners in areas where we operate or intend to operate, including in foreign jurisdictions. Such claims may or may not be unfounded. Regardless of whether such claims have merit, our image, brands, competitive position and ability to expand our operations into other jurisdictions may be harmed and we may incur significant costs related to defense or settlement. If such claims were decided against us or a third-party we indemnify pursuant to license terms, we could be required to pay damages, develop or adopt non-infringing products or services, or acquire a license to the intellectual property that is the subject of the asserted claim, which license may not be available on acceptable terms or at all.
Defending or settling claims would require the expenditure of additional capital, and negative publicity could arise, even if the matter was ultimately decided in our favor. Any of the foregoing could have a material adverse effect on our business, financial condition and results of operations.
Risks Related to Our Indebtedness
Our substantial level of indebtedness could cause our business to suffer and incurring additional debt could intensify debt-related risks.
We have a substantial amount of debt, including approximately $695.6 million outstanding under our first lien term loan facility as of December 31, 2024. Additionally, pursuant to an indenture, VM Consolidated, Inc. (“VM Consolidated”) issued an aggregate principal amount of $350 million in Senior Unsecured Notes (the “Senior Notes”) due 2029. We may also incur substantial additional debt in the future to, among other things, finance our acquisition strategy. We have the option to increase commitments under our revolving credit agreement by up to $50.0 million, all of which would be secured. We also have the ability to draw an unlimited amount from our first lien term loan facility, subject to the satisfaction of a maximum total net leverage ratio or minimum fixed charge coverage ratio, on a pro forma basis, all of which will be secured. Our substantial debt could have important consequences, any of which could be intensified if new debt is added to our current debt levels. For example, it could:
•increase our vulnerability to adverse economic and industry conditions;
•limit our ability to obtain additional financing for future working capital, capital expenditures, strategic acquisitions and other general corporate requirements;
•expose us to interest rate fluctuations because the interest rate on certain of our debt is variable;
•require us to dedicate a substantial portion of our cash flow from operations to payments on our debt, thereby reducing the availability of our cash flow for operations and other purposes;
•make it more difficult for us to satisfy our general business obligations, including our obligations to our lenders, resulting in possible defaults on and acceleration of such indebtedness;
•limit our ability to refinance indebtedness or increase the associated costs;
•require us to sell assets to reduce debt or influence our decision about whether to do so;
•limit our flexibility in planning for, or reacting to, changes in our business and the industry in which we operate or prevent us from carrying out capital spending that is necessary or important to our growth strategy and efforts to improve operating margins; and
•place us at a competitive disadvantage compared to any competitors that have less debt or comparable debt at more favorable interest rates and that, as a result, may be better positioned to withstand economic downturns.
Restrictive covenants in the agreements governing our indebtedness could restrict our operating flexibility.
The agreements governing our indebtedness limit our ability to take certain actions. These restrictions may limit our ability to operate our businesses, prohibit or limit our ability to enhance our operations or take advantage of potential business opportunities as they arise and cause us to take actions that are not favorable to stockholders.
The agreements governing our indebtedness restrict, among other things and subject to certain exceptions, our and our restricted subsidiaries’ ability to:
•incur additional indebtedness;
•pay dividends or other payments on capital stock;
•guarantee other obligations;
•make loans, acquisitions or other investments;
•transfer or dispose of assets;
•make optional payments or modify certain debt instruments;
•engage in transactions with affiliates;
•amend organizational documents;
•engage in mergers or consolidations;
•enter into arrangements that restrict the ability to pay dividends;
•engage in business activities that are materially different from existing business activities;
•change the nature of the business we conduct; and
•designate subsidiaries as unrestricted subsidiaries.
Under our first lien term loan facility, we could be required to make periodic prepayments based on excess cash flow (as defined by the first lien term loan agreement) thereby limiting the amount of cash flow that can be reinvested in our business. For example, under our revolving credit facility, if availability goes below a certain threshold, we will be required to comply with a minimum “consolidated fixed charge coverage ratio” financial covenant as calculated therein. Moreover, if availability falls below a certain threshold for a specified number of business days, we could be required to remit our cash funds to a dominion account maintained by the administrative agent to the revolving credit facility, which would require daily review and approval of operating disbursements by the administrative agent.
Our ability to comply with the covenants and restrictions contained in agreements governing our indebtedness may be affected by economic conditions and by financial, market and competitive factors, many of which are beyond our control. Our ability to comply with these covenants in future periods will also depend substantially on the pricing and sales volume of our products and our ability to successfully implement our overall business strategy. The breach of any of these covenants or restrictions could result in a default under one or more of the agreements governing our indebtedness that would permit the applicable lenders to declare all amounts outstanding thereunder to be due and payable, together with accrued and unpaid interest. In that case, we may be unable to borrow under our revolving credit agreement or otherwise, may not be able to repay the amounts due under the agreements governing our indebtedness, and may not be able to make cash available by dividend, debt repayment or otherwise. In addition, if we are unable to pay the amounts due under the term loan, our lenders could proceed against the collateral securing the indebtedness under the term loan, which consists of substantially all of our assets. Any of the foregoing could have material adverse effects to our financial position, results of operations or cash flows and could cause us to become bankrupt or insolvent.
The agreements governing our indebtedness contain cross default or cross acceleration provisions that may cause all of the debt issued under those instruments to become immediately due and payable because of a default under an unrelated debt instrument.
The agreements governing our indebtedness contain numerous covenants and require us, if availability goes below a certain threshold, to comply with a minimum “consolidated fixed charge coverage ratio” financial covenant as calculated in the revolving credit agreement. Our failure to comply with the obligations contained in these agreements or other instruments governing our indebtedness could result in an event of default under the applicable instrument, which could result in the related debt and the debt issued under other instruments (together with accrued and unpaid interest and other fees) becoming immediately due and payable. In such event, we would need to raise funds from alternative sources, which funds may not be available to us on favorable terms, on a timely basis or at all. Alternatively, such a default could require us to sell assets and otherwise curtail our operations in order to pay our creditors. These alternative measures could have a material adverse effect on our business, financial position, results of operations or cash flows.
If we do not generate sufficient cash flows, we may not be able to service all of our indebtedness.
To service our indebtedness, we will require a significant amount of cash. Our ability to generate cash, make scheduled payments or to refinance our debt obligations depends on our successful financial and operating performance, which will be affected by a range of economic, competitive and business factors, many of which are outside of our control.
If our cash flow and capital resources are insufficient to fund our debt service obligations or to repay indebtedness when it matures, we may have to undertake alternative financing plans, such as refinancing or restructuring our debt, selling assets or operations, reducing or delaying capital investments or seeking to raise additional capital. We may not be able to refinance our debt and any refinancing of our debt could be at higher interest rates and may require us to comply with more restrictive covenants that could further restrict our business operations and our ability to make cash available for dividends and distributions and payments on our other debt obligations (if any). Our ability to implement successfully any such alternative financing plans will be dependent on a range of factors, including general economic conditions, the level of activity in mergers and acquisitions and capital markets generally, and the terms of our various debt instruments then in effect. In addition, a significant portion of our outstanding indebtedness is secured by substantially all of our assets including our subsidiaries’ assets, and any successor credit facilities are likely to be secured on a similar basis. As such, our ability to seek additional financing or our ability to make cash available for dividends and distributions and payments on our other debt obligations (if any) could be impaired as a result of such security interests and the agreements governing such security interests. Moreover, as a result of these security interests, the underlying assets would only be available to satisfy claims of our general creditors or holders of our equity securities if we were to become insolvent to the extent the value of such assets exceeded the amount of our indebtedness and other obligations.
Our inability to generate sufficient cash flow to satisfy our debt obligations or to refinance our obligations on commercially reasonable terms could have a material adverse effect on our business, including our financial condition and results of operations.
We may be unable to obtain additional financing to fund operations and growth.
We may require additional financing to fund our operations or growth, whether organic or through acquisitions. Our failure to secure additional financing could have a material adverse effect on our continued development or growth.
Risks Related to Our Class A Common Stock, Related Party Transactions and Organizational Documents
We cannot guarantee that our stock repurchase programs will enhance long-term shareholder value. Stock repurchases could also increase the volatility of the trading price of our stock and could diminish our cash reserves. In addition, Congress enacted the Inflation Reduction Act in 2022, which (among other provisions) provided for a 1% excise tax on net stock repurchases. This provision applies to stock repurchases initiated after January 1, 2023.
In October 2023, our Board of Directors authorized a share repurchase program for up to an aggregate amount of $100.0 million of our outstanding shares of Class A Common Stock over an 18-month period in open market, accelerated share repurchase (“ASR”) or privately negotiated transactions.
In June 2024, we entered into a share repurchase agreement with a stockholder, pursuant to which we repurchased, directly from the stockholder, 2.0 million shares of our Class A Common Stock for an aggregate purchase price of $51.5 million. During the fourth quarter of 2024, we repurchased approximately 1.5 million shares through open market transactions and paid $35.8 million. On December 4, 2024, our Board of Directors authorized the repurchase of up to an additional $100 million of our outstanding shares of Class A Common Stock under the existing October 2023 program, providing the Company with approximately $112.7 million available for repurchases.
On December 11, 2024, we entered into an ASR agreement with a third-party financial institution to purchase $112.7 million of our Class A common stock. Pursuant to the terms of the ASR agreement, we received and retired 3,821,958 shares of our Class A Common Stock and paid $112.7 million. The delivery of any remaining shares will occur at the final settlement of the transactions under the ASR agreement, which is scheduled to occur in the first quarter of 2025. The final number of shares repurchased under the ASR agreement will be based on the daily volume-weighted average share prices over the term in the ASR agreement, less a discount and subject to adjustments.
We paid a total of $200.0 million for share repurchases during the year ended December 31, 2024. In addition, we recorded approximately $1.7 million within accrued liabilities related to the excise taxes payable on net share repurchases on the consolidated balance sheets as of December 31, 2024.
The timing, price, and quantity of purchases under the repurchase programs have been, and will continue to be, made at the discretion of our management based upon a variety of factors including share price, general and business market conditions, compliance with applicable laws and regulations, corporate and regulatory requirements, and alternative uses of capital. There is no guarantee as to the exact number of shares that we will repurchase and we cannot guarantee that share repurchase programs will enhance long-term stockholder value. Share repurchase programs could affect the trading price of our common stock and increase volatility. In addition, our repurchases under our share repurchase programs have diminished, and could continue to diminish, our cash reserves.
Anti-takeover provisions contained in our certificate of incorporation and bylaws, as well as provisions of Delaware law, could impair a takeover attempt.
Our certificate of incorporation contains provisions that may discourage unsolicited takeover proposals that stockholders may consider to be in their best interests. We are also subject to anti-takeover provisions under Delaware law, which could delay or prevent a change of control. Together, these provisions may make the removal of management more difficult and may discourage transactions that otherwise could involve payment of a premium over prevailing market prices for our securities. These provisions include:
•no cumulative voting in the election of directors, which limits the ability of minority stockholders to elect director candidates;
•a classified board of directors with three-year staggered terms, which could delay the ability of stockholders to change the membership of a majority of our Board;
•the requirement that directors may only be removed from the Board for cause;
•the right of our Board to elect a director to fill a vacancy created by the expansion of our Board or the resignation, death or removal of a director in certain circumstances, which prevents stockholders from being able to fill vacancies on our Board;
•a prohibition on stockholder action by written consent, which forces stockholder action to be taken at an annual or special meeting of our stockholders;
•a prohibition on stockholders calling a special meeting and the requirement that a meeting of stockholders may only be called by members of our Board or our Chief Executive Officer, which may delay the ability of our stockholders to force consideration of a proposal or to take action, including the removal of directors;
•the requirement that changes or amendments to certain provisions of our certificate of incorporation or bylaws must be approved by holders of at least two-thirds of our Common Stock; and
•advance notice procedures that stockholders must comply with in order to nominate candidates to our Board or to propose matters to be acted upon at a meeting of stockholders, which may discourage or deter a potential acquirer from conducting a solicitation of proxies to elect the acquirer’s own slate of directors or otherwise attempting to obtain control of us.
Our bylaws include a forum selection clause, which may impact the ability of our stockholders to bring actions against us.
Subject to certain limitations, our bylaws provide that, unless we consent in writing to the selection of an alternative forum, the Court of Chancery in the State of Delaware will be the sole and exclusive forum for any stockholder (including a beneficial owner) to bring: (a) any derivative action or proceeding brought on our behalf; (b) any action asserting a claim of breach of fiduciary duty owed by any of our directors, officers or other employees or our stockholders; (c) any action asserting a claim arising pursuant to any provision of the Delaware General Corporate Law or our certificate of incorporation or bylaws; or (d) any action asserting a claim governed by the internal affairs doctrine. In addition, our bylaws provide that unless we consent in writing to the selection of an alternative forum, the federal district courts of the United States will be the exclusive forum for resolving any complaint asserting a cause of action arising under the federal securities laws of the United States against us, our officers, directors, employees or underwriters. These limitations on the forum in which stockholders may initiate action against us could create costs or, inconvenience or otherwise adversely affect our stockholders’ ability to seek legal redress. If a court were to find the forum-selection provisions contained in our bylaws to be unenforceable, we may incur additional costs associated with resolving proceedings in forums other than the Court of Chancery in the State of Delaware and the federal district courts of the United States.
Our only significant asset is our ownership interest in our operating subsidiaries and such ownership may not be sufficient to pay dividends or make distributions or loans to enable us to pay any dividends on our Class A Common Stock or satisfy our other financial obligations.
We have no direct operations and no significant assets other than our ownership interest in our operating subsidiaries. We depend on our operating subsidiaries for distributions, loans and other payments to generate the funds necessary to meet our financial obligations, including our expenses as a publicly traded company. The financial condition and operating requirements of our operating subsidiaries may limit our ability to obtain cash from our operating subsidiaries. The earnings from, or other available assets of, our operating subsidiaries may not be sufficient to make distributions or loans to enable us to pay any dividends on our Common Stock or satisfy our other financial obligations.
The ability of our operating subsidiaries (other than subsidiaries which have been designated as unrestricted pursuant to our ability to do so in certain limited circumstances) to make distributions, loans and other payments to us for the purposes described above and for any other purpose is governed by the terms of the agreements governing our indebtedness and will be subject to the negative covenants set forth therein. Any loans or other extensions of credit would be subject to the restrictive covenants under such agreements.
If our Class A Common Stock is delisted from Nasdaq, a market for our securities may not continue, which would adversely affect the liquidity and price of our securities.
The price of our securities may vary due to general economic conditions and forecasts, our general business condition and the release of our financial reports. Additionally, if our securities are not listed on, or become delisted from, Nasdaq for any reason, including for failure to maintain compliance with rules for continued listing on Nasdaq, and are quoted on the OTC Bulletin Board or OTC Pink, an inter-dealer automated quotation system for equity securities that is not a national securities exchange, the liquidity and price of our securities may be more limited than if we were quoted or listed on Nasdaq or another national securities exchange.
Our business could be negatively affected as a result of actions of activist stockholders or others.
We may be subject to actions or proposals from stockholders or others that may not align with our business strategies or the interests of our other stockholders. Responding to such actions can be costly and time-consuming, disrupt our business and operations, and divert the attention of our Board, management, and employees from the pursuit of our business strategies. Such activities could interfere with our ability to execute our strategic plan. Activist stockholders or others may create perceived uncertainties as to the future direction of our business or strategy which may be exploited by our competitors and may make it more difficult to attract and retain qualified personnel and potential customers, and may affect our relationships with current customers, vendors, investors, and other third parties. In addition, a proxy contest for the election of directors at our annual meeting would require us to incur significant legal fees and proxy solicitation expenses and require significant time and attention by management and our Board. The perceived uncertainties as to our future direction also could affect the market price and volatility of our securities.
General Risk Factors
If we fail to maintain an effective system of internal controls or identify a material weakness or significant deficiency in our internal control over financial reporting, our ability to report our financial condition and results of operations in a timely and accurate manner could be adversely affected, investor confidence in our company could diminish, and the value of our securities may decline.
As a public company, we are required to comply with Section 404 of the Sarbanes Oxley Act of 2002 (“SOX”), which requires, among other things, that companies maintain disclosure controls and procedures to ensure timely disclosure of material information, and that management reviews the effectiveness of those controls on a quarterly basis.
A material weakness is a deficiency, or combination of deficiencies, in internal control over financial reporting, such that there is a reasonable possibility that a material misstatement of our annual or interim financial statements will not be prevented or detected on a timely basis. While we continually undertake steps to improve our internal control over financial reporting as our business changes, we may not be successful in making the improvements and changes necessary to be able to identify and remediate control deficiencies or material weaknesses on a timely basis.
During fiscal year 2023, we identified a material weakness in the design and operation of our internal controls over financial reporting in the Control Activities component of the COSO framework related to the lack of information technology general controls to prevent the risk of management override. Based on the implementation work and the results of testing performed, our management concluded that the previous identified material weakness has been remediated as of December 31, 2024, as further discussed in “Controls and Procedures” in Part II, Item 9A of this Annual Report.
We cannot be certain that we will be able to maintain adequate controls over our financial processes and reporting in the future or that we will be able to comply with our obligations under Section 404 of SOX. If we fail to maintain the adequacy of our internal controls, we cannot assure our stockholders that we will be able to conclude in the future that we have effective internal control over financial reporting, and/or we may encounter difficulties in implementing or improving our internal controls, which could harm our operating results or cause us to fail to meet our reporting obligations. If we fail to maintain effective internal controls, investors may lose confidence in the accuracy and completeness of our financial reports, the market price of our securities may be negatively affected, and we could be subject to sanctions or investigation by regulatory authorities, such as the SEC or Nasdaq.
Litigation and other disputes and regulatory investigations could have a material adverse effect on our business.
From time to time, and as more discussed in the section entitled “Legal Proceedings,” we may be involved in litigation and other disputes or regulatory investigations that arise in and outside the ordinary course of business. We expect that the number, frequency and significance of these matters may increase as our business expands and we grow as a company. Litigation, disputes, or regulatory investigations may relate to, among other things, intellectual property, antitrust claims, commercial arrangements, negligence and fiduciary duty claims, vicarious liability based upon conduct of individuals or entities outside of our control, including our third-party service providers, deceptive trade practices, claims related to invoicing, personal injury claims, claims related to licensing, general fraud claims and employment law claims, including compliance with wage and hour regulations and contractual requirements. An adverse determination may result in liability to us for the claim and may also result in the imposition of penalties and/or fines. Like other companies that handle sensitive personal and payment information, we also face the possibility of allegations regarding employee fraud or misconduct. In addition to more general litigation, at times we are also a named party in claims made against our customers, including putative class actions challenging the legality and constitutionality of automated photo enforcement and other similar programs of our Government Solutions customers and consumer fraud claims brought against our RAC customers alleging faulty disclosures regarding our services.
As a public company, we may also be subject to securities class action and stockholder derivative lawsuits. From time to time, we may also be reviewed or investigated by U.S. federal, state, or local regulators or regulators in the foreign jurisdictions in which we operate regarding similar and other matters, including tax assessments.
These investigations can be commenced at the initiative of the governmental authority or as a result of complaints by private citizens, regardless of whether the complaint has any merit. At times, we are also required to obtain licensing and permitting, including with respect to matters such as general contracting, performance of engineering services, performance of electrical work and performance of private investigative work. Although we carry general liability insurance coverage, our insurance may not cover all potential claims to which we are exposed, whether as a result of a dispute, litigation or governmental investigation, and it may not adequately indemnify us for all liability that may be imposed.
Any potential claims against us or investigation into our business and activities, whether meritorious or not, could be time consuming, result in significant legal and other expenses, require significant amounts of management time and result in the diversion of significant operational resources. Class action lawsuits can often be particularly burdensome given the breadth of claims, large potential damages and significant costs of defense. In the case of intellectual property litigation and proceedings, adverse outcomes could include the cancellation, invalidation or other loss of material intellectual property rights used in our business and injunctions prohibiting our use of business processes or technology that is subject to third-party patents or other third-party intellectual property rights. Legal or regulatory matters involving our directors, officers or employees in their individual capacities can also create exposure for us because we may be obligated or may choose to indemnify the affected individuals against liabilities and expenses they incur in connection with such matters. Regulatory investigations, including with respect to proper licensing, payment of wages, procurement practices or permitting, can also lead to enforcement actions, fines and penalties, the loss of a license or permit or the assertion of private litigation claims. Risks associated with these liabilities are often difficult to assess or quantify and their existence and magnitude can remain unknown for significant periods of time, making the amount of any legal reserves related to these legal liabilities difficult to determine and, if a reserve is established, subject to future revision. Future results of operations could be adversely affected if any reserve that we establish for a legal liability is increased or the underlying legal proceeding, investigation or other contingency is resolved for an amount in excess of established reserves. Because litigation and other disputes and regulatory investigations are inherently unpredictable, the results of any of these matters may have a material adverse effect on our business, financial condition and results of operations.
Risks related to laws and regulations and any changes in those laws could have a material adverse effect on our business.
We are subject to multiple, and sometimes conflicting, laws and regulations in the countries, states and localities in which we operate. We are required to comply with certain SEC, Nasdaq and other legal or regulatory requirements. Compliance with, and monitoring of, applicable laws, regulations and rules may be difficult, time consuming and costly. Increasing regulatory burdens and corporate governance requirements could increase our legal and financial compliance costs and the amount of time management must devote to governance and compliance activities.
In addition to the laws and regulations discussed elsewhere in these risk factors regarding data privacy, foreign operations and other matters, we are subject to laws regarding transportation safety, consumer protection, procurement, anti-kickback, labor and employment matters, competition and antitrust, payment processing, intellectual property, environmental matters, and other trade-related laws and regulations. Certain of our operations are also subject to oversight by the USDOT, the Federal Communications Commission, the U.S. Consumer Product Safety Commission, and the Environmental Protection Agency, as well as comparable state and local agencies, including departments of transportation, departments of motor vehicles, professional licensing authorities and offices of inspector general. Our Government Solutions segment is also subject to laws related to the use of automated traffic enforcement, the capture, access and retention of data and matters related to government contracting.
Recent years have seen a substantial increase in the number of new laws and regulations and the rate of change and enforcement of many of these types of laws and regulations. We cannot predict the nature, scope or impact of future laws, regulatory requirements or similar standards may have on our business, whether implemented through changes to existing laws or the way they are administered or interpreted, or through entirely new regulations. Future laws, regulations, and standards or any changed interpretation or administration of existing laws or regulations could limit the continued use or adoption of one or more of our solutions, require us to incur additional costs, impact our ability to develop and market new solutions or impact our ability to retain existing business and secure new business. We may not be able to respond in a reasonable or cost-effective manner, or at all. Even if we make what we believe are appropriate changes, there is no certainty those actions will comply.
Any alleged or actual violations of any law or regulation, change in law or regulation or changes in the interpretation of existing laws or regulations may subject us to government scrutiny, including government or regulatory investigations and enforcement actions, civil and criminal fines and penalties, and negative publicly, or otherwise have a material adverse effect on our business, financial condition and results of operations.
Unanticipated changes in effective tax rates or adverse outcomes resulting from examination of our income or other tax returns could adversely affect our financial condition and results of operations.
We are subject to income taxes in numerous countries, and our domestic tax liabilities are subject to the allocation of expenses in differing jurisdictions. Our future effective tax rates could be subject to volatility or adversely affected by a number of factors, including:
•changes in the valuation of our deferred tax assets and liabilities;
•expected timing and amount of the release of any tax valuation allowances;
•tax effects of stock-based compensation;
•costs related to intercompany restructurings;
•changes in tax laws, regulations or interpretations thereof; or
•lower than anticipated future earnings in jurisdictions where we have lower statutory tax rates and higher than anticipated future earnings in jurisdictions where we have higher statutory tax rates.
In addition, we are subject to audits of our income, sales and other transaction taxes by U.S. federal and state authorities, as well as foreign tax authorities. Outcomes from these audits could have an adverse effect on our financial condition and results of operations.
None.
Item 1C. Cybersecurity
Our Board recognizes the importance of maintaining the trust and confidence of our customers, clients, business partners and employees. Our Board, through the Audit Committee, oversees our cybersecurity program as part of our enterprise-wide approach to risk management. Our cybersecurity policies, standards, processes and practices are integrated into our risk management approach and take into account recognized frameworks such as those established by the National Institute of Standards and Technology, as well as the International Organization for Standardization (ISO) 27001. In general, we seek to address cybersecurity risks through a comprehensive, cross-functional approach that is focused on preserving the confidentiality, integrity and availability of the information that we collect and store by identifying, preventing and mitigating cybersecurity threats and effectively responding to cybersecurity incidents when they occur.
Risk Management and Strategy
As one of the critical elements of enterprise-wide approach to risk management, our cybersecurity program is focused on the following key areas:
Governance: As discussed in more detail under the heading “Governance” below, our cybersecurity program is led by our Vice President of Cybersecurity, who reports to our Chief Technology Officer, and is responsible for publishing cybersecurity policies and standards, conducting annual risk assessments and maintaining our compliance. Our Chief Technology Officer leads our cybersecurity team and regularly reports to our Audit Committee.
Collaboration: We have implemented a comprehensive, cross-functional approach to identifying, preventing and mitigating cybersecurity threats and incidents, while also implementing controls and procedures that provide for the prompt escalation of certain cybersecurity incidents so that decisions regarding the public disclosure and reporting of such incidents can be made by management in a timely manner. We work with third-party firms to monitor our cybersecurity environment and report findings to executive leadership, internal audit and the Audit Committee regularly.
Technical Safeguards: We deploy technical safeguards that are designed to protect our information systems from cybersecurity threats, including firewalls, intrusion prevention and detection systems, antimalware functionality and access controls, which are evaluated and improved through vulnerability assessments, certifications, audits and cybersecurity threat intelligence.
Incident Response and Recovery Planning: We have established and maintained comprehensive incident response and recovery plans that fully address our response to a cybersecurity incident, and such plans are tested and evaluated on a regular basis.
Third-Party Risk Management: We maintain a comprehensive, risk-based approach to identifying and overseeing cybersecurity risks presented by third parties, including vendors, service providers and other external users of our systems, as well as the systems of third parties that could adversely impact our business in the event of a cybersecurity incident affecting those third-party systems. The program is underpinned by our Supply Chain Risk Management Standard which outlines requirements for vendors handling confidential company data or personally identifiable information, and we conduct continuous monitoring through a third-party monitoring tool.
Education and Awareness: We provide regular, mandatory training for personnel regarding cybersecurity threats as a means to equip our personnel with effective tools to address cybersecurity threats, and to communicate our evolving information security policies, standards, processes and practices.
We engage in the periodic assessment and testing of our policies, standards, processes and practices that are designed to address cybersecurity threats and incidents. These efforts include a wide range of activities, including audits, assessments, tabletop exercises, threat modeling, vulnerability testing and other exercises focused on evaluating the effectiveness of our cybersecurity measures and planning. We regularly engage third parties to perform assessments on our cybersecurity measures, including information security maturity assessments, audits and independent reviews of our information security control environment and operating effectiveness. The results of such assessments, audits and reviews are reported to our Board and Audit Committee by our Chief Technology Officer based on materiality. We adjust our cybersecurity policies, standards, processes and practices as necessary based on the information provided by these assessments, audits and reviews.
Governance
Our Board, through the Audit Committee, oversees our enterprise-wide approach to risk management, including the risks arising from cybersecurity threats. Our Audit Committee regularly receives presentations and reports on cybersecurity risks, which address a wide range of topics, including recent developments, evolving standards, vulnerability assessments, third-party and independent reviews, the threat environment, technological trends and information security considerations arising with respect to our peers and third parties. Our Audit Committee also receives prompt and timely information regarding cybersecurity incidents that meet established reporting thresholds, as well as ongoing updates regarding any such incident until it has been addressed. On an annual basis, our Audit Committee discusses our Company’s approach to cybersecurity risk management with management.
Our Audit Committee, in connection with management led by our Chief Technology Officer and Vice President of Cybersecurity, works collaboratively across our Company to oversee and to implement a program designed to protect our information systems from cybersecurity threats and to promptly respond to any cybersecurity incidents in accordance with our incident response and recovery plans. To facilitate the success of our cybersecurity risk management program, multidisciplinary teams are deployed to address cybersecurity threats and respond to cybersecurity incidents. Through ongoing communications with these teams, our Audit Committee monitors the prevention, detection, mitigation, and remediation of cybersecurity threats and incidents.
Both our Chief Technology Officer and Vice President of Cybersecurity have extensive related experience and have served in various roles in technology leadership and cybersecurity for over 20 years. Our Chief Executive Officer, Chief Financial Officer and Chief Legal Officer each hold undergraduate and/or graduate degrees in their respective fields, and each has experience managing risks at our Company and at similar companies including risks arising from cybersecurity threats.
Cybersecurity Threats
As of December 31, 2024, we have not experienced any material risks from cybersecurity threats, including as a result of any previous cybersecurity incidents or threats, that have materially affected the business strategy, results of operations or financial condition of the Company or are reasonably likely to have such a material effect. However, evolving cybersecurity threats make it increasingly challenging to anticipate, detect, and defend against cybersecurity threats and incidents. We have in place insurance designed to provide coverage in connection with cybersecurity incidents, provided, however, that such insurance coverage may be insufficient to cover all insured losses or all types of claims that may arise. Additional information on cybersecurity risks is discussed in Part I, Item 1A, “Risk Factors.”
Item 2. Properties
We lease all of the properties used in our business, including 108,956 square feet of office space for our corporate headquarters in Mesa, Arizona. In addition to the corporate headquarters, we lease office space in various locations for corporate and administrative purposes and multiple small warehouse locations. We do not consider any of these properties to be material to our overall business.
Item 3. Legal Proceedings
We are subject to legal and regulatory actions that arise from time to time in the ordinary course of business, and may be subject to similar or other claims in the future. Legal disputes and other claims and proceedings may relate to, among other things, intellectual property, commercial arrangements, negligence and fiduciary duty claims, vicarious liability based on conduct of individuals or entities outside of our control, including our third-party service providers, antitrust claims, deceptive trade practices, general fraud claims and employment law claims, including compliance with wage and hour regulations. In addition to more general litigation, at times we have also been a named party in claims made against our customers, including putative class actions challenging the legality and constitutionality of automated photo enforcement and other similar programs of our Government Solutions customers, and consumer fraud claims brought against us and our Commercial Services customers alleging faulty disclosures regarding our services. From time to time, we may also be reviewed or investigated by U.S. federal, state or local regulators or regulators in the foreign jurisdictions in which we operate regarding these and other matters, including proper licensing and tax assessments. All litigation is inherently unpredictable and we could incur judgments or enter into settlements or claims in the future that could materially impact our results.
Brantley v. City of Gretna is a class action lawsuit filed in the 24th Judicial District Court of Jefferson Parish, Louisiana against the City of Gretna (the “City”) and its safety camera vendor, Redflex Traffic Systems, Inc. in April 2016. The Company acquired Redflex Traffic Systems, Inc. as part of its June 2021 purchase of Redflex Holdings Limited. The plaintiff class, which was certified on March 30, 2021, alleges that the City’s safety camera program was implemented and operated in violation of local ordinances and the state constitution, including that the City’s hearing process violated the plaintiffs’ due process rights for lack of a “neutral” arbiter of liability for traffic infractions. Plaintiffs seek recovery of traffic infraction fines paid. The City and Redflex Traffic Systems, Inc. appealed the trial court’s ruling granting class certification, which was denied and their petition for discretionary review of the certification ruling by the Louisiana Supreme Court was declined. Discovery has concluded and trial is scheduled for March 2025. Based on the information available to the Company at present, it has accrued an estimated amount within accrued liabilities on the consolidated balance sheet as of December 31, 2024. The information contained in Note 16, Commitments and Contingencies, included in Item 8 of this 10-K is incorporated herein by reference.
Item 4. Mine Safety Disclosures
Not applicable.
PART II
Item 5. Market for Registrant’s Common Equity, Related Stockholder Matters and Issuer Purchases of Equity Securities
Market Information
Our Class A Common Stock is currently quoted on Nasdaq under the symbol “VRRM”.
The following table sets forth the high and low sales prices per share of our Class A Common Stock as reported on Nasdaq for the two most recent fiscal years:
| | | | | | | | | | | | | | | |
| Fiscal Year 2024 | | | Fiscal Year 2023 | |
| High | | | Low | | | High | | | Low | |
First Quarter | $ | 25.57 | | | $ | 20.26 | | | $ | 17.87 | | | $ | 13.48 | |
Second Quarter | $ | 28.45 | | | $ | 23.30 | | | $ | 19.82 | | | $ | 16.22 | |
Third Quarter | $ | 31.03 | | | $ | 24.22 | | | $ | 21.54 | | | $ | 17.04 | |
Fourth Quarter | $ | 27.85 | | | $ | 22.20 | | | $ | 23.29 | | | $ | 18.62 | |
Holders of Record
As of February 21, 2025, we had 7 holders of record of our Class A Common Stock. Because many of our shares of Class A Common Stock are held by brokers and other institutions on behalf of stockholders, we are unable to estimate the total number of stockholders represented by these record holders.
Warrants
All warrants that were outstanding to acquire shares of the Company’s Class A Common Stock, including warrants originally issued to Gores Sponsor II, LLC in a private placement (the “Private Placement Warrants”) in connection with our initial public offering (the “IPO”) and the remaining warrants issued in connection with the IPO (the “Public Warrants” and, together with the Private Placement Warrants, the “Warrants”), were either exercised by the holder or redeemed by us as of December 31, 2023.
During the fiscal year ended December 31, 2023, we processed the exercise of 20.0 million Warrants in exchange for the issuance of 16,273,406 shares of Class A Common Stock. There were 14,035,449 shares issued in exchange for cash-basis warrant exercises resulting in the receipt of $161.4 million in cash proceeds for the year ended December 31, 2023. The remaining Warrant exercises were completed on a cashless basis. In addition, we redeemed 634 Public Warrants at a price of $0.01 per warrant pursuant to the terms of the warrant agreement governing the Public Warrants.
Dividends
We have not paid any cash dividends on our Class A Common Stock to date. The payment of cash dividends in the future will be dependent upon our revenues and earnings, if any, capital requirements and general financial condition. The payment of any cash dividends is within the discretion of our Board of Directors. In addition, our Board of Directors is not currently contemplating and does not anticipate declaring any stock dividends in the foreseeable future. Further, our ability to declare dividends is limited by restrictive covenants in the agreements governing our indebtedness.
Securities Authorized for Issuance Under Equity Compensation Plans
The information required by this item with respect to our equity compensation plans is incorporated by reference to our proxy statement for the 2025 annual meeting of stockholders.
Stock Performance Graph
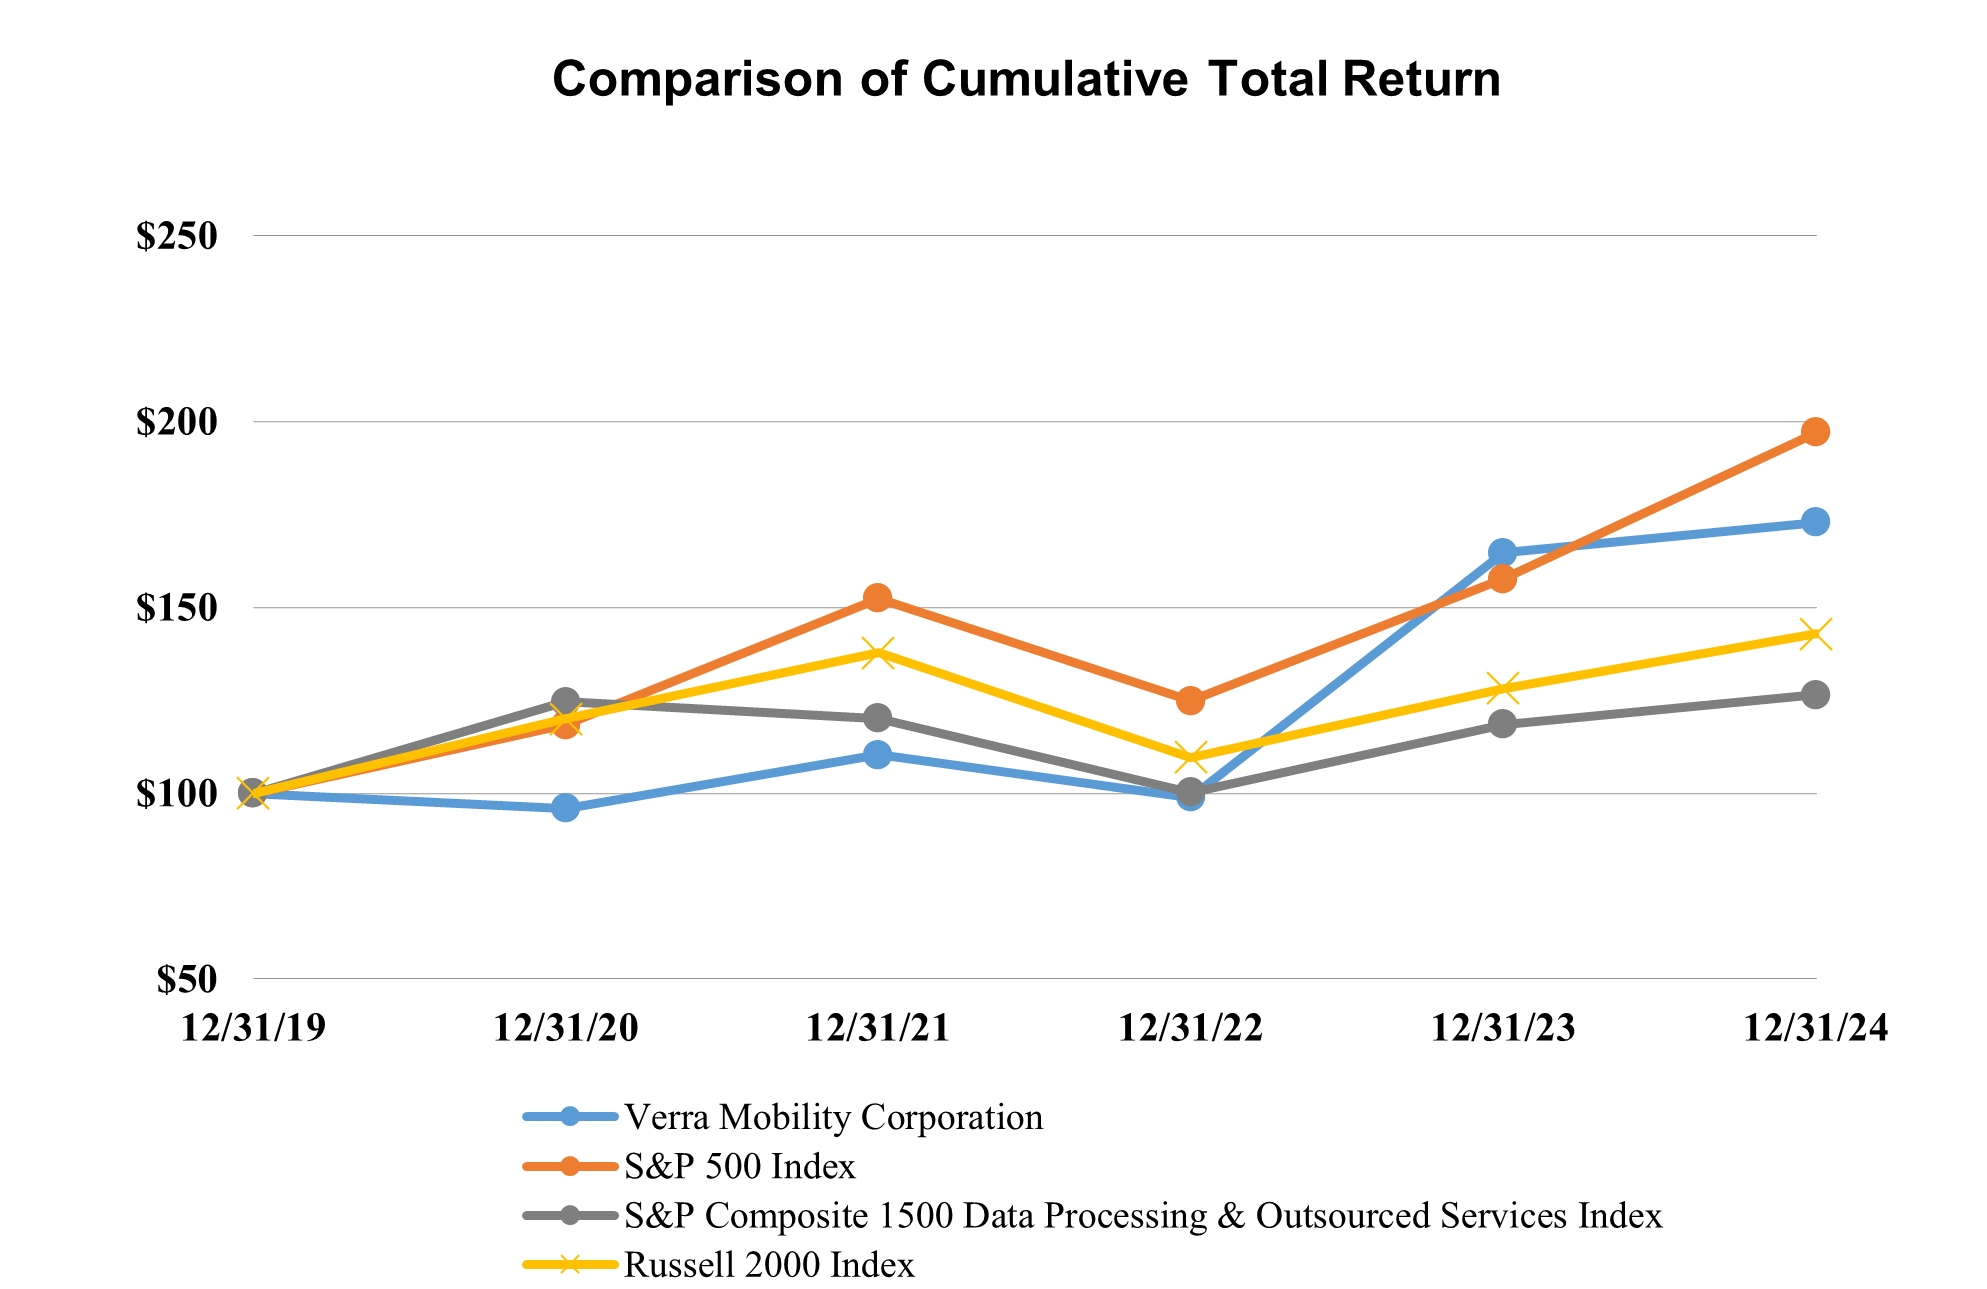
The graph above compares the cumulative total return on our Class A Common Stock with that of the S&P 500 Index, the S&P Composite 1500 Data Processing & Outsourced Services Index and the Russell 2000 Index. The period shown commences on December 31, 2019 and ends on December 31, 2024, the end of our last fiscal year. The graph assumes an investment of $100 in each of the above on the close of market on December 31, 2019. We did not declare or pay any dividends on our Class A Common Stock during the comparison period. The stock performance graph is not necessarily indicative of future stock price performance.
This performance graph is not deemed to be incorporated by reference into any of our other filings under the Exchange Act, or the Securities Act, except to the extent we specifically incorporate it by reference into such filings.
Recent Sales of Unregistered Securities and Use of Proceeds
None.
Purchases of Equity Securities by the Issuer and Affiliated Purchasers
The following details the purchases of our Class A Common Stock during the three months ended December 31, 2024:
| | | | | | | | | | | | | | | | |
Period | | Total Number of Shares Purchased (1) | | | Average Price Paid per Share (1) | | | Total Number of Shares Purchased as Part of Publicly Announced Plans or Programs (2) | | | Maximum Dollar Value of Shares that May Yet to be Purchased Under the Plans or Programs (2) | |
October 1, 2024 - October 31, 2024 | | | — | | | $ | — | | | | — | | | $ | 48,500,000 | |
November 1, 2024 - November 30, 2024 | | | 1,226,592 | | | $ | 23.38 | | | | 1,226,592 | | | $ | 19,850,784 | |
December 1, 2024 - December 31, 2024 | | | 4,121,958 | | | $ | 23.72 | | | | 4,121,958 | | | $ | 21,379 | |
Total | | | 5,348,550 | | | $ | 23.47 | | | | 5,348,550 | | | $ | 21,379 | |
(1) On December 11, 2024, we entered into an ASR agreement with a third-party financial institution and paid $112.7 million to receive an initial delivery of 3,821,958 shares of our Class A Common Stock. The final settlement is expected to occur in the first quarter of 2025, at which time, we expect to receive additional shares calculated using a volume-weighted average price over the term of the ASR agreement.
(2) In October 2023, our Board of Directors authorized a share repurchase program for up to an aggregate amount of $100.0 million of our outstanding shares of Class A Common Stock over an 18-month period in open market, ASR or privately negotiated transactions. On December 4, 2024, our Board of Directors authorized the repurchase of up to an additional $100 million of our outstanding shares of Class A Common Stock under the existing October 2023 program, providing us with approximately $112.7 million available for repurchases. As of December 31, 2024, less than $0.1 million remained available under the share repurchase authorization.
Earn-Out Agreement
Under the Agreement and Plan of Merger (as amended, the “Merger Agreement”), pursuant to which we became the owner, directly or indirectly, of all of the equity interests of Verra Mobility Holdings, LLC and its subsidiaries, PE Greenlight Holdings, LLC was entitled to receive additional shares of Class A Common Stock (the “Earn-Out Shares”) if the volume weighted average closing sale price of one share of Class A Common Stock on the Nasdaq exceeded certain defined thresholds for a period of at least 10 days out of 20 consecutive trading days at any time during a five-year period. There were four tranches of contingent shares under the agreement, with each tranche resulting in an issuance of 2,500,000 shares of Class A Common Stock (not to exceed a total of 10,000,000 shares). On April 26, 2019 and January 27, 2020, the criteria for the issuance of the first and second tranches was met and as a result, an aggregate 5,000,000 Earn-out Shares were issued. On June 14, 2023 and July 26, 2023, the criteria for the issuance of the remaining tranches of Earn-out Shares was met and we issued the remaining 5,000,000 shares. As of December 31, 2023, all contingent shares have been issued under the Merger Agreement.
Item 6. [Reserved]
Item 7. Management’s Discussion and Analysis of Financial Condition and Results of Operations
The following discussion and analysis of our financial condition and results of operations should be read together with the consolidated financial statements and the related notes that are included in Item 8 of Part II of this Annual Report. This Item generally discusses fiscal years 2024 and 2023 items and year-to-year comparisons between 2024 and 2023. Discussions of 2022 items and year-to-year comparisons between fiscal years 2023 and 2022 are not included, and can be found in “Management’s Discussion and Analysis of Financial Condition and Results of Operations” in Part II, Item 7 of the Company’s Annual Report on Form 10-K for the fiscal year ended December 31, 2023, which specific discussions and comparisons are incorporated herein by reference.
Overview
We are a leading provider of smart mobility technology solutions, principally operating throughout the United States, Australia, Europe and Canada. We make transportation safer, smarter and more connected through our integrated, data-driven solutions, including toll and violations management, title and registration services, automated safety and traffic enforcement and commercial parking management. We bring together vehicles, hardware, software, data and people to solve transportation challenges for customers around the world, including commercial fleet owners such as RACs, Direct Fleets and FMCs, as well as governments, universities, parking operators, healthcare facilities, transportation hubs and violation-issuing authorities. Our vision is to continue to develop and use technology and data intelligence to make transportation safer, smarter and more connected globally.
Our Segments
We have three operating and reportable segments, Commercial Services, Government Solutions and Parking Solutions:
•Our Commercial Services segment offers toll and violation management solutions and title and registration services for commercial fleet customers, including RACs and FMCs in North America. In Europe, we provide tolling and violations processing services.
•Our Government Solutions segment offers photo enforcement solutions and services to its customers. We provide complete, end-to-end speed, red-light, school bus stop arm and bus lane enforcement solutions. Our international operations primarily involve the sale of traffic enforcement products and recurring maintenance services related to the equipment and software.
•Our Parking Solutions segment provides an integrated suite of parking software, transaction processing and hardware solutions to universities, municipalities, commercial parking operators and health care facilities in the United States and Canada.
Segment performance is based on revenues and income from operations before depreciation, amortization and stock-based compensation. The measure also excludes interest expense, net, income taxes and certain other transactions and is inclusive of other income, net.
Executive Summary
We operate under long-term contracts and a highly reoccurring service revenue model. We continue to execute our strategy to grow revenue organically year over year and focus on initiatives that support our long-term strategy. During the periods presented, we:
•Increased total revenue by $61.9 million, or 7.6%, from $817.3 million in fiscal year 2023 to $879.2 million in fiscal year 2024. The increase was mainly due to service revenue resulting from increased travel volume and FMCs penetration in the Commercial Services segment and the growth from speed, maintenance and bus lane programs in the Government Solutions segment.
•Generated cash flows from operating activities of $223.6 million and $206.1 million for fiscal years 2024 and 2023, respectively. Our cash on hand was $77.6 million as of December 31, 2024.
•Used existing cash on hand of $200.0 million during fiscal year 2024 to repurchase approximately 7.9 million shares authorized under a 2023 share repurchase program.
•Continued to focus on debt management and lowering our exposure to higher interest rates, and as a result, we refinanced our debt during fiscal year 2024 which reduced our interest rate by an aggregate 111.4 basis points. In addition, we made early repayments of approximately $9.0 million and $172.5 million on our 2021 Term Loan (defined below) during fiscal year 2024 and 2023, respectively.
Recent Events
Share Repurchases and Retirement
In October 2023, our Board of Directors authorized a share repurchase program for up to an aggregate amount of $100.0 million of our outstanding shares of Class A Common Stock over an 18-month period in open market, ASR or privately negotiated transactions. In June 2024, we entered into a share repurchase agreement with a stockholder, pursuant to which we repurchased, directly from the stockholder, 2.0 million shares of our Class A Common Stock for an aggregate purchase price of $51.5 million. During the fourth quarter of 2024, we repurchased approximately 1.5 million shares through open market transactions and paid $35.8 million. In December 2024, our Board of Directors increased the authorization to repurchase up to an additional $100 million of our shares under the existing October 2023 program, providing us with approximately $112.7 million available for repurchases.
On December 11, 2024, we entered into an ASR agreement with a third-party financial institution and paid $112.7 million to receive an initial delivery of 3,821,958 shares of our Class A Common Stock. The final settlement is expected to occur in the first quarter of 2025, at which time, we expect to receive additional shares calculated using a volume-weighted average price over the term of the ASR agreement.
We paid a total of $200.0 million for share repurchases during the year ended December 31, 2024. All repurchased shares were subsequently retired. Refer to Note 12, Stockholders' Equity, in Item 8, Financial Statements and Supplementary Data, for additional information on our share repurchases.
Cancellation of the Interest Rate Swap
We exercised our option to cancel the interest rate swap agreement, effective the end of the third quarter of 2024, which was previously used to hedge our exposure to higher interest rates associated with the variable portion of the interest rate on our 2021 Term Loan. Refer to Note 2, Significant Accounting Policies, in Item 8, Financial Statements and Supplementary Data, for additional information.
NYCDOT Contract
NYCDOT represented approximately 15.8% and 16.9% of our total revenue for fiscal years 2024 and 2023, respectively, and 17.2% and 18.3% of total accounts receivable, net as of December 31, 2024 and 2023, respectively. Our contract with NYCDOT expired on December 31, 2024, and we are presently participating in a competitive procurement for a new NYCDOT automated enforcement program contract. We have executed a one-year contract extension with NYCDOT that expires December 31, 2025. The extension allows NYCDOT to continue to utilize our automated enforcement program under the same terms until the competitive procurement process is completed. However, there is no assurance that we will be successful in winning the competitive procurement for the new automated enforcement contract, or that if we are successful, the terms of the contract will be similar to our current contract. If we are unable to win the competitive procurement for a new contact with NYCDOT, it would have a material adverse effect on our business, financial condition and results of operations.
Goodwill Impairment
We recorded a $97.1 million impairment to goodwill in our Parking Solutions segment during fiscal year 2024, which is presented in a separate line item on the consolidated statements of operations. This was in connection with our 2024 assessment of goodwill impairment where the Parking Solutions reporting unit's carrying value exceeded the estimated fair value. Refer to Note 2, Significant Accounting Policies, in Item 8, Financial Statements and Supplementary Data, for additional information.
Key Factors Affecting Our Results of Operations
We believe that our performance and future success depend on a number of factors that present opportunities for us but also pose risks and challenges, including those discussed below and in the section of this Annual Report on Form 10-K titled “Risk Factors.”
Macroeconomic Conditions
Our business is susceptible to a number of industry-specific and global macroeconomic factors that may cause our actual results of operations to differ from our historical results of operations or current expectations. The factors and trends that we currently believe are or will be most impactful to our results of operations and financial condition include the following: the inflationary impact on items such as wages and travel-related costs, future travel demand, and legislation regarding the adoption, expansion or prohibition of automated enforcement and traffic safety technology by local or state governments. We continue to monitor the potential favorable or unfavorable impacts of these and other factors on our business, operations, financial condition, and future results of operations.
Travel Demand
Our Commercial Services segment is largely impacted by its customer demand which in turn is impacted by a variety of factors including seasonality, demand for business and leisure travel, reductions in the level of air travel, higher airfare costs, increases in energy prices, general international, national and local economic conditions and cycles, as well as other factors affecting travel levels, such as military conflicts, terrorist incidents, natural disasters and epidemic diseases.
We monitor the Transportation and Security Administration passenger volume (“TSA Passenger Volume”) as one of several measures for Commercial Services revenue growth. TSA Passenger Volume measures the number of passengers screened by the TSA at United States airports, which correlates to the number of vehicles rented by travelers and toll road usage. In fiscal year 2024, TSA Passenger Volume increased approximately five percent over fiscal year 2023, one of several factors contributing to Commercial Services revenue growth.
Electronic Tolling Penetration
Our Commercial Services segment is impacted by the number of toll roads in the United States and the geographic concentration of such roads.
We monitor the expansion and penetration of toll roadways across the United States and the percentage of toll roads that rely on cashless or all-electronic infrastructure. In fiscal year 2024, approximately 70% of all toll roadways in the United States relied on cashless or electronic payment methods.
Enabling Legislation
Our Government Solutions segment is impacted, in significant part, by enabling legislation that permits photo enforcement programs at the state and local level in the United States. Accordingly, we depend on national, state and local governments authorizing the use of automated photo enforcement and not otherwise materially restricting its use.
Primary Components of Our Operating Results
Revenues
Service Revenue. Our Commercial Services segment generates service revenue primarily through the operation and management of tolling programs and processing violations for RACs, FMCs and other large fleet customers. These solutions are full-service offerings by which we enroll the license plates of our customers’ vehicles and transponders with tolling authority accounts, pay tolls and violations on the customers’ behalf and, through proprietary technology, integrate with customer data to match the toll or violation to the driver and then bill the driver (or our customer, as applicable) for use of the service. The cost of certain tolls, violations and our customers’ share of administration fees are netted against revenue. We also generate service revenue in our Commercial Services segment through processing titles and registrations.
Our Government Solutions segment generates service revenue through the operation and maintenance of photo enforcement systems. Revenue drivers in this segment include the number of systems installed and the monthly revenue per system. Ancillary service revenue is generated in our Government Solutions segment from payment processing, pass-through fees for collection expense, and other fees.
Our Parking Solutions segment generates service revenue mainly from offering software as a service ("SaaS"), subscription fees, professional services and citation processing services related to parking management solutions to its customers.
Product Sales. Product sales are generated by the sale of photo enforcement equipment in the Government Solutions segment and specialized hardware in the Parking Solutions segment. Customer buying patterns vary greatly from period to period related to product sales.
Costs and Expenses
Cost of Service Revenue, Excluding Depreciation and Amortization. Cost of service revenue, excluding depreciation and amortization consists of recurring service costs, collection and other third-party costs in our segments.
Cost of Product Sales. Cost of product sales consists of the cost to acquire and install photo enforcement equipment purchased by Government Solutions customers and costs to develop hardware sold to Parking Solutions customers.
Operating Expenses. Operating expenses primarily include payroll and payroll-related costs (including stock-based compensation), subcontractor costs, payment processing and other operational costs, including print, postage and communication costs.
Selling, General and Administrative Expenses. Selling, general and administrative expenses include payroll and payroll-related costs (including stock-based compensation), real estate lease expense, insurance costs, professional services fees and general corporate expenses.
Depreciation, Amortization and (Gain) Loss on Disposal of Assets, Net. Depreciation, amortization and (gain) loss on disposal of assets, net includes depreciation on property, plant and equipment, and amortization of definite-lived intangible assets. This line item also includes any one-time gains or losses incurred in connection with the disposal of certain assets.
Goodwill Impairment. This relates to impairment loss recognized on goodwill from past acquisitions.
Interest Expense, Net. This includes interest expense and amortization of deferred financing costs and discounts and is net of interest income.
Change in Fair Value of Private Placement Warrants. Change in fair value of private placement warrants consisted of liability adjustments related to the Private Placement Warrants originally issued to Gores Sponsor II, LLC re-measured to fair value at the end of the reporting period, and the final re-measurement upon their exercise.
Tax Receivable Agreement Liability Adjustment. This consists of adjustments made to our tax receivable agreement liability due to changes in estimates.
Loss on Interest Rate Swap. Loss on interest rate swap related to the changes associated with the derivative instrument re-measured to fair value at the end of each reporting period and the related periodic cash receipts or payments.
Loss on Extinguishment of Debt. Loss on extinguishment of debt consisted of the write-off of pre-existing original issue discounts and deferred financing costs associated with debt extinguishment.
Other Income, Net. Other income, net primarily consists of volume rebates earned from total spend on credit card transactions, gains or losses on foreign currency transactions and other non-operating expenses.
Results of Operations
Fiscal Year 2024 Compared to Fiscal Year 2023
The following table sets forth our statements of operations data and expresses each item as a percentage of total revenue for the periods presented as well as the changes between periods. The tables and information provided in this section were derived from exact numbers and may have immaterial rounding differences.
| | | | | | | | | | | | | | | | | | | | | | | | |
| | Year Ended December 31, | |
| | | | | | | | Percentage of Revenue | | | Increase (Decrease)
2024 vs 2023 | |
($ in thousands) | | 2024 | | | 2023 | | | 2024 | | | 2023 | | | $ | | | % | |
Service revenue | | $ | 841,676 | | | $ | 783,595 | | | | 95.7 | % | | | 95.9 | % | | $ | 58,081 | | | | 7.4 | % |
Product sales | | | 37,531 | | | | 33,715 | | | | 4.3 | % | | | 4.1 | % | | | 3,816 | | | | 11.3 | % |
Total revenue | | | 879,207 | | | | 817,310 | | | | 100.0 | % | | | 100.0 | % | | | 61,897 | | | | 7.6 | % |
Cost of service revenue, excluding depreciation and amortization | | | 18,988 | | | | 18,232 | | | | 2.2 | % | | | 2.2 | % | | | 756 | | | | 4.1 | % |
Cost of product sales | | | 27,058 | | | | 25,231 | | | | 3.1 | % | | | 3.1 | % | | | 1,827 | | | | 7.2 | % |
Operating expenses | | | 295,937 | | | | 273,288 | | | | 33.7 | % | | | 33.4 | % | | | 22,649 | | | | 8.3 | % |
Selling, general and administrative expenses | | | 195,054 | | | | 198,550 | | | | 22.2 | % | | | 24.3 | % | | | (3,496 | ) | | | (1.8 | )% |
Depreciation, amortization and (gain) loss on disposal of assets, net | | | 109,072 | | | | 113,195 | | | | 12.3 | % | | | 13.9 | % | | | (4,123 | ) | | | (3.6 | )% |
Goodwill impairment | | | 97,076 | | | | — | | | | 11.0 | % | | | — | | | | 97,076 | | | n/a | |
Total costs and expenses | | | 743,185 | | | | 628,496 | | | | 84.5 | % | | | 76.9 | % | | | 114,689 | | | | 18.2 | % |
Income from operations | | | 136,022 | | | | 188,814 | | | | 15.5 | % | | | 23.1 | % | | | (52,792 | ) | | | (28.0 | )% |
Interest expense, net | | | 73,902 | | | | 86,701 | | | | 8.4 | % | | | 10.6 | % | | | (12,799 | ) | | | (14.8 | )% |
Change in fair value of private placement warrants | | | — | | | | 24,966 | | | | 0.0 | % | | | 3.1 | % | | | (24,966 | ) | | | (100.0 | )% |
Tax receivable agreement liability adjustment | | | (257 | ) | | | (3,077 | ) | | | (0.0 | )% | | | (0.4 | )% | | | 2,820 | | | | (91.6 | )% |
Loss on interest rate swap | | | 494 | | | | 817 | | | | 0.1 | % | | | 0.1 | % | | | (323 | ) | | | (39.5 | )% |
Loss on extinguishment of debt | | | 1,745 | | | | 3,533 | | | | 0.2 | % | | | 0.4 | % | | | (1,788 | ) | | | (50.6 | )% |
Other income, net | | | (18,970 | ) | | | (11,123 | ) | | | (2.2 | )% | | | (1.3 | )% | | | (7,847 | ) | | | 70.5 | % |
Total other expenses | | | 56,914 | | | | 101,817 | | | | 6.5 | % | | | 12.5 | % | | | (44,903 | ) | | | (44.1 | )% |
Income before income taxes | | | 79,108 | | | | 86,997 | | | | 9.0 | % | | | 10.6 | % | | | (7,889 | ) | | | (9.1 | )% |
Income tax provision | | | 47,660 | | | | 29,982 | | | | 5.4 | % | | | 3.6 | % | | | 17,678 | | | | 59.0 | % |
Net income | | $ | 31,448 | | | $ | 57,015 | | | | 3.6 | % | | | 7.0 | % | | $ | (25,567 | ) | | | (44.8 | )% |
Service Revenue. Service revenue increased by $58.1 million, or 7.4%, to $841.7 million for fiscal year 2024 from $783.6 million in fiscal year 2023, representing 95.7% and 95.9% of total revenue, respectively. The following table depicts service revenue by segment:
| | | | | | | | | | | | | | | | | | | | | | | | |
| | Year Ended December 31, | |
| | | | | | | | Percentage of Revenue | | | Increase (Decrease)
2024 vs 2023 | |
($ in thousands) | | 2024 | | | 2023 | | | 2024 | | | 2023 | | | $ | | | % | |
Service revenue | | | | | | | | | | | | | | | | | | |
Commercial Services | | $ | 407,680 | | | $ | 372,786 | | | | 46.4 | % | | | 45.6 | % | | $ | 34,894 | | | | 9.4 | % |
Government Solutions | | | 367,914 | | | | 344,034 | | | | 41.8 | % | | | 42.1 | % | | | 23,880 | | | | 6.9 | % |
Parking Solutions | | | 66,082 | | | | 66,775 | | | | 7.5 | % | | | 8.2 | % | | | (693 | ) | | | (1.0 | )% |
Total service revenue | | $ | 841,676 | | | $ | 783,595 | | | | 95.7 | % | | | 95.9 | % | | $ | 58,081 | | | | 7.4 | % |
Commercial Services service revenue includes mainly toll and violation management revenues from RACs and FMCs. Commercial Services service revenue increased by $34.9 million, or 9.4%, from $372.8 million in fiscal year 2023 to $407.7 million in fiscal year 2024. This increase was primarily due to increased travel volume, product adoption and increased tolling activity compared to the prior year. These factors contributed to a $18.1 million growth in RAC tolling revenue. An increase in enrolled vehicles as well as higher tolling activity from our FMC customers contributed to a $8.4 million growth in revenue during the year ended December 31, 2024, compared to the same period in 2023. The remaining revenue growth was mainly generated from processing titles and registrations as well as processing violations compared to the prior year.
Government Solutions service revenue includes revenue from speed, red-light, school bus stop arm and bus lane photo enforcement systems. Service revenue increased by $23.9 million to $367.9 million in fiscal year 2024 compared to $344.0 million in fiscal year 2023. The increase was primarily driven by the expansion of speed, maintenance and bus lane programs contributing approximately $17.1 million to the increase in service revenue this year. The remaining increase was mainly attributable to expansions across school bus stop arm programs.
Parking Solutions service revenue decreased by $0.7 million to $66.1 million in fiscal year 2024 compared to $66.8 million in fiscal year 2023. The increased revenue from SaaS product offerings was offset by a decrease in professional services related to parking management solutions.
Product Sales. Product sales increased $3.8 million year-over-year and were $37.5 million and $33.7 million for fiscal years 2024 and 2023, respectively. The increase was primarily due to a $8.6 million increase in product sales to Government Solutions customers, offset by a $4.8 million decrease in the Parking Solutions segment driven by a structural transition from hardware to software and mobile payment solutions. Customer buying patterns vary greatly from period to period related to product sales.
Cost of Service Revenue, Excluding Depreciation and Amortization. Cost of service revenue, excluding depreciation and amortization increased from $18.2 million for fiscal year 2023 to $19.0 million for fiscal year 2024, mainly due to increased recurring service costs for the Parking Solutions segment.
Cost of Product Sales. Cost of product sales increased by approximately $1.8 million from $25.2 million in fiscal year 2023 to $27.1 million in fiscal year 2024, which was in line with the increase in product sales discussed above.
Operating Expenses. Operating expenses increased by $22.6 million, or 8.3%, from $273.3 million for fiscal year 2023 to $295.9 million in fiscal year 2024. The increase in 2024 was primarily attributable to an increase of $19.7 million in wages expense, of which, $15.7 million was in the Government Solutions segment and $3.7 million in the Commercial Services segment. Operating expenses as a percentage of total revenue increased from 33.4% to 33.7% in fiscal years 2023 and 2024, respectively. The following table presents operating expenses by segment:
| | | | | | | | | | | | | | | | | | | | | | | | |
| | Year Ended December 31, | |
| | | | | | | | Percentage of Revenue | | | Increase (Decrease)
2024 vs 2023 | |
($ in thousands) | | 2024 | | | 2023 | | | 2024 | | | 2023 | | | $ | | | % | |
Operating expenses | | | | | | | | | | | | | | | | | | |
Commercial Services | | $ | 92,038 | | | $ | 83,828 | | | | 10.5 | % | | | 10.3 | % | | $ | 8,210 | | | | 9.8 | % |
Government Solutions | | | 182,493 | | | | 168,736 | | | | 20.8 | % | | | 20.6 | % | | | 13,757 | | | | 8.2 | % |
Parking Solutions | | | 17,353 | | | | 18,236 | | | | 1.9 | % | | | 2.2 | % | | | (883 | ) | | | (4.8 | )% |
Operating expenses by segment | | | 291,884 | | | | 270,800 | | | | 33.2 | % | | | 33.1 | % | | | 21,084 | | | | 7.8 | % |
Other expenses | | | 4,053 | | | | 2,488 | | | | 0.5 | % | | | 0.3 | % | | | 1,565 | | | | 62.9 | % |
Total operating expenses | | $ | 295,937 | | | $ | 273,288 | | | | 33.7 | % | | | 33.4 | % | | $ | 22,649 | | | | 8.3 | % |
Selling, General and Administrative Expenses. Selling, general and administrative expenses decreased by $3.5 million to approximately $195.1 million for fiscal year 2024 compared to $198.6 million for fiscal year 2023. The decrease is primarily due to a $23.3 million decrease in legal expenses compared to the prior year, partially offset by $9.0 million in higher wages and benefits expense, of which, $3.2 million was in the Government Solutions segment and $2.7 million is the Commercial Services segment. In addition, there was a $3.9 million increase in stock-based compensation expense, $3.9 million increase in bad debt expense (mainly in the Commercial Services segment) and increases in other general expenses compared to prior year. Selling, general and administrative expenses as a percentage of total revenue decreased from 24.3% to 22.2% in fiscal years 2023 and 2024, respectively. The following table presents selling, general and administrative expenses by segment:
| | | | | | | | | | | | | | | | | | | | | | | | |
| | Year Ended December 31, | |
| | | | | | | | Percentage of Revenue | | | Increase (Decrease)
2024 vs 2023 | |
($ in thousands) | | 2024 | | | 2023 | | | 2024 | | | 2023 | | | $ | | | % | |
Selling, general and administrative expenses | | | | | | | | | | | | | | | | | | |
Commercial Services | | $ | 62,942 | | | $ | 61,607 | | | | 7.2 | % | | | 7.5 | % | | $ | 1,335 | | | | 2.2 | % |
Government Solutions | | | 69,972 | | | | 62,597 | | | | 8.0 | % | | | 7.7 | % | | | 7,375 | | | | 11.8 | % |
Parking Solutions | | | 25,173 | | | | 23,988 | | | | 2.8 | % | | | 2.9 | % | | | 1,185 | | | | 4.9 | % |
Selling, general and administrative expenses by segment | | | 158,087 | | | | 148,192 | | | | 18.0 | % | | | 18.1 | % | | | 9,895 | | | | 6.7 | % |
Other expenses | | | 36,967 | | | | 50,358 | | | | 4.2 | % | | | 6.2 | % | | | (13,391 | ) | | | (26.6 | )% |
Total selling, general and administrative expenses | | $ | 195,054 | | | $ | 198,550 | | | | 22.2 | % | | | 24.3 | % | | $ | (3,496 | ) | | | (1.8 | )% |
Depreciation, Amortization and (Gain) Loss on Disposal of Assets, Net. Depreciation, amortization and (gain) loss on disposal of assets, net, decreased by $4.1 million to $109.1 million for 2024 from $113.2 million for 2023. This was mainly due certain non-compete, trademark and developed technology intangible assets being fully amortized in fiscal year 2024 as compared to the prior year. This decrease was partially offset by an increase in depreciation expense in fiscal year 2024.
Goodwill Impairment. We recorded an impairment loss of $97.1 million in fiscal year 2024 as a result of our 2024 assessment of goodwill impairment in our Parking Solutions segment. See Note 2, Significant Accounting Policies, for additional information.
Interest Expense, Net. Interest expense, net decreased by $12.8 million from $86.7 million in fiscal year 2023 to $73.9 million in fiscal year 2024. This decrease is primarily attributable to voluntary principal prepayments made during 2023 and 2024 which lowered the outstanding debt balance in 2024 coupled with a 100 basis-point reduction in the interest rate from refinancing our debt in February and in October of fiscal year 2024. The average variable interest rate on the 2021 Term Loan was 44 basis points lower for the twelve months ended December 31, 2024 compared to the prior period. See “Liquidity and Capital Resources” below.
Change in Fair Value of Private Placement Warrants. We recorded a loss of $25.0 million for the fiscal year 2023 related to the changes in fair value of our Private Placement Warrants which were accounted for as liabilities on our consolidated balance sheets. The change in fair value was the result of re-measurement of the liability at the end of the reporting period, and the final re-measurement upon their exercise.
Tax Receivable Agreement Liability Adjustment. We recorded a gain of approximately $0.3 million in fiscal year 2024 as a result of lower estimated state tax rates due to changes in apportionment. We recorded a gain of approximately $3.1 million in fiscal year 2023 as a result of tax settlement adjustments related to a previous acquisition.
Loss on Interest Rate Swap. We recorded a $0.5 million loss in fiscal year 2024 of which $1.3 million is associated with the derivative instrument re-measured to fair value at the end of the reporting period offset by $(0.8) million related to the monthly cash proceeds. We recorded a $0.8 million loss in fiscal year 2023 of which approximately $1.1 million related to the monthly cash payments on the interest rate swap net of $(0.3) million associated with the derivative instrument re-measured to fair value at the end of the reporting period. We exercised our option to cancel the interest rate swap agreement effective the end of the third quarter of 2024.
Loss on Extinguishment of Debt. We recorded a $1.7 million loss on extinguishment of debt for fiscal year 2024 related to the write-off of pre-existing deferred financing costs and discounts in connection with the February and October 2024 refinancing of the 2021 Term Loan. Loss on extinguishment of debt was $3.5 million for fiscal year 2023 related to the write-off of pre-existing deferred financing costs and discounts in connection with the early repayment of $172.5 million on the 2021 Term Loan.
Other Income, Net. Other income, net was $19.0 million in fiscal year 2024 compared to $11.1 million in fiscal year 2023. The increase of approximately $7.9 million is primarily attributable to a $5.6 million tax settlement payment recorded in 2023 related to a prior year acquisition without a comparable amount in 2024, as well as increase in volume rebates earned from total spend on credit card transactions due to increased tolling and travel activity.
Income Tax Provision. Income tax provision was $47.7 million representing an effective tax rate of 60.2% for fiscal year 2024 compared to $30.0 million, representing an effective tax rate of 34.5% for fiscal year 2023. Our effective tax rate for 2024 was higher compared to 2023 primarily due to the impact of permanent differences related to the mark-to-market adjustment on the Private Placement Warrants and the impairment adjustments in the Parking Solutions segment.
Net Income. We had net income of $31.4 million for fiscal year 2024 compared to a net income of $57.0 million for 2023. The $25.6 million decrease in net income was primarily due to the goodwill impairment recorded in fiscal year 2024, partially offset by the change in fair value of the Private Placement Warrants liability in the prior fiscal year without a comparable amount in the current year, and the other statement of operations activity discussed above.
Liquidity and Capital Resources
Our principal sources of liquidity are cash flows from operations and the available borrowing under our Revolver (defined below).
We believe that our existing cash and cash equivalents, cash flows provided by operating activities and our ability to borrow under our Revolver will be sufficient to meet operating cash requirements, service debt obligations and fund potential share repurchases for at least the next 12 months and thereafter for the foreseeable future. Our ability to generate sufficient cash from our operating activities depends on our future performance, which is subject to general economic, political, financial, competitive and other factors beyond our control. In addition, our future capital expenditures and other cash requirements could be higher than currently expected due to various factors, including any expansion of our business or strategic acquisitions.
We have incurred significant long-term debt as a result of acquisitions completed in prior years. Should we pursue strategic acquisitions, we may need to raise additional capital, which may be in the form of additional long-term debt, borrowings on our Revolver, or equity financings, all of which may not be available to us on favorable terms or at all.
We have the ability to borrow under our Revolver to meet obligations as they come due. As of December 31, 2024, we had $74.4 million available for borrowing, net of letters of credit, under our Revolver. Our cash on hand was $77.6 million as of December 31, 2024.
In February 2024 and in October 2024, we refinanced the 2021 Term Loan (as discussed below) which reduced the interest rate by an aggregate 1.00% and eliminated the applicable credit spread adjustment. During fiscal years 2024 and 2023, we made early repayments of $9.0 million and $172.5 million, respectively, on the 2021 Term Loan and as a result, the total principal outstanding was $695.6 million as of December 31, 2024.
At December 31, 2024, the tax receivable agreement liability was approximately $48.1 million. We expect to make payments of approximately $5.2 million per year for the next 10 years.
Share Repurchases
In October 2023, our Board of Directors authorized a share repurchase program for up to an aggregate amount of $100.0 million of our outstanding shares of Class A Common Stock over an 18-month period in open market, ASR or privately negotiated transactions.
In June 2024, we entered into a share repurchase agreement with a stockholder, pursuant to which we repurchased, directly from the stockholder, 2.0 million shares of our Class A Common Stock for an aggregate purchase price of $51.5 million. During the fourth quarter of 2024, we repurchased approximately 1.5 million shares through open market transactions and paid $35.8 million. On December 4, 2024, our Board of Directors authorized the repurchase of up to an additional $100 million of our outstanding shares of Class A Common Stock under the existing October 2023 program, providing us with approximately $112.7 million available for repurchases.
On December 11, 2024, we entered into an ASR agreement with a third-party financial institution and paid $112.7 million to receive an initial delivery of 3,821,958 shares of our Class A Common Stock. The final settlement is expected to occur in the first quarter of 2025, at which time, we may receive additional shares calculated using a volume-weighted average price over the term of the ASR agreement.
We paid a total of $200.0 million for share repurchases during the year ended December 31, 2024. All repurchased shares were subsequently retired. In addition, we recorded approximately $1.7 million within accrued liabilities related to the excise taxes payable on net share repurchases on the consolidated balance sheets as of December 31, 2024.
The following table sets forth certain captions on our statements of cash flows for the respective periods:
| | | | | | | | |
| | For the Year Ended December 31, | |
($ in thousands) | | 2024 | | | 2023 | |
Net cash provided by operating activities | | $ | 223,642 | | | $ | 206,101 | |
Net cash used in investing activities | | | (69,720 | ) | | | (58,290 | ) |
Net cash used in financing activities | | | (211,427 | ) | | | (117,793 | ) |
Cash Flows from Operating Activities
Cash provided by operating activities increased by $17.5 million, from $206.1 million in fiscal year 2023 to $223.6 million in fiscal year 2024. Net income decreased $25.6 million from $57.0 million in fiscal year 2023 compared to $31.4 million in fiscal year 2024. The aggregate adjustments to reconcile net income to net cash provided by operating activities increased by $93.0 million mainly due to the goodwill impairment recorded in the current year and change in deferred income taxes, partially offset by a decrease in the change in the fair value of private placement warrants. The aggregate changes in operating assets and liabilities decreased by $49.9 million in 2024 primarily due to a legal settlement accrued in the prior year that was paid in 2024, partially offset by a lower increase in accounts receivable balances year over year as compared to prior year, mainly in our Commercial Services business.
Cash Flows from Investing Activities
Cash used in investing activities in fiscal years 2024 and 2023 was primarily related to purchases of installation and service parts and property and equipment mainly in our Government Solutions business of $70.9 million and $57.0 million, respectively.
Cash Flows from Financing Activities
Cash used in financing activities was $211.4 million in fiscal year 2024 mainly due to $200 million of share repurchases using existing cash on hand, as well as early repayments on the 2021 Term Loan of a net $9.0 million.
Cash used in financing activities was $117.8 million in fiscal year 2023 mainly due to early repayments totaling $172.5 million on our 2021 Term Loan and $100.0 million of share repurchases, which were partially offset by $161.4 million of proceeds from the exercise of warrants.
Long-term Debt
2021 Term Loan
In March 2021, VM Consolidated, our wholly owned subsidiary, entered into an Amendment and Restatement Agreement No.1 to the First Lien Term Loan Credit Agreement (the “2021 Term Loan”) with a syndicate of lenders. The 2021 Term Loan has an aggregate borrowing of $900.0 million, maturing on March 24, 2028. In connection with the 2021 Term Loan borrowings, we had $4.6 million of offering discount costs and $4.5 million in deferred financing costs, both of which were capitalized and are being amortized over the remaining life of the 2021 Term Loan.
In February 2024, VM Consolidated entered into a third amendment (the “Third Amendment”) and in October 2024, a fourth amendment (the "Fourth Amendment") to refinance the 2021 Term Loan (the “Refinancing Transactions”). Pursuant to the Third and Fourth Amendments, the interest rate was reduced by an aggregate 1.00% to SOFR plus 2.25% from SOFR plus 3.25% with the SOFR floor unchanged at 0.00%. The credit spread adjustment, ranging from 0.11448% to 0.71513%, was eliminated. In addition, the 2021 Term Loan no longer contains a provision for principal repayments which were previously required to be paid in quarterly installments.
We evaluated the Refinancing Transactions on a lender-by-lender basis and accounted accordingly for debt extinguishment and debt modification costs (for the portion of the transactions that did not meet the accounting criteria for debt extinguishment).
During fiscal years 2024 and 2023, we made early repayments of $9.0 million and $172.5 million, respectively, on the 2021 Term Loan and as a result, the total principal outstanding was $695.6 million as of December 31, 2024.
We recorded $1.7 million of loss on extinguishment of debt during the fiscal year ended December 31, 2024, primarily related to the write-off of pre-existing deferred financing costs and discounts in connection with the Refinancing Transactions. We recognized a loss on extinguishment of debt of $3.5 million for the fiscal year ended December 31, 2023, related to the write-off of pre-existing deferred financing costs and discounts in connection with the early repayments.
The 2021 Term Loan bears interest based, at our option, on either (i) Term SOFR plus an applicable margin of 2.25% per annum, or (ii) an alternate base rate plus an applicable margin of 1.25% per annum. As of December 31, 2024, the interest rate on the 2021 Term Loan was 6.6%.
In addition, the 2021 Term Loan requires mandatory prepayments equal to the product of the excess cash flows of the Company (as defined in the 2021 Term Loan agreement) and the applicable prepayment percentages (calculated as of the last day of the fiscal year), as set forth in the following table:
| | |
Consolidated First Lien Net Leverage Ratio (As Defined by the 2021 Term Loan Agreement) | | Applicable
Prepayment
Percentage |
> 3.70:1.00 | | 50% |
< 3.70:1.00 and > 3.20:1.00 | | 25% |
< 3.20:1.00 | | 0% |
We did not have mandatory prepayments of excess cash flows for the fiscal years ended December 31, 2024 or 2023.
Senior Notes
In March 2021, VM Consolidated issued an aggregate principal amount of $350.0 million in Senior Notes, due on April 15, 2029. In connection with the issuance of the Senior Notes, we incurred $5.7 million in lender and third-party costs, which were capitalized as deferred financing costs and are being amortized over the remaining life of the Senior Notes.
Interest on the Senior Notes is fixed at 5.50% per annum and is payable on April 15 and October 15 of each year. We may redeem all or a portion of the Senior Notes at the redemption prices set forth below in percentages by year, plus accrued and unpaid interest:
| | |
Year |
| Percentage |
2025 |
| 101.375% |
2026 and thereafter |
| 100.000% |
PPP Loan
During fiscal year 2020, one of our wholly owned subsidiaries received a $2.9 million loan from the U.S. Small Business Administration (“SBA”) as part of the Paycheck Protection Program (“PPP Loan”) to offset certain employment and other allowable costs incurred as a result of the COVID-19 pandemic. In 2022, we were notified by the SBA that the loan, together with accrued interest, had been fully forgiven under the provisions of the PPP Loan program. Accordingly, we recognized a $3.0 million gain on extinguishment of debt in the consolidated statements of operations for the year ended December 31, 2022.
The Revolver
We have a Revolving Credit Agreement (the “Revolver”) with a commitment of up to $75.0 million available for loans and letters of credit. The Revolver matures on December 18, 2026. Borrowing eligibility under the Revolver is subject to a monthly borrowing base calculation based on (i) certain percentages of eligible accounts receivable and inventory, less (ii) certain reserve items, including outstanding letters of credit and other reserves. The Revolver bears interest on either (1) Term SOFR plus an applicable margin, or (2) an alternate base rate, plus an applicable margin. The margin percentage applied to (1) Term SOFR is either 1.25%, 1.50%, or 1.75%, or (2) the base rate is either 0.25%, 0.50%, or 0.75%, depending on our average availability to borrow under the commitment. There is a credit spread adjustment of 0.10% for a one-month duration, 0.15% for a three-month duration, and 0.25% for a six-month duration, in addition to Term SOFR and the applicable margin percentages. There were no outstanding borrowings on the Revolver as of December 31, 2024 or 2023. The availability to borrow was $74.4 million, net of $0.6 million of outstanding letters of credit at December 31, 2024.
Interest on the unused portion of the Revolver is payable quarterly at 0.375% and we are also required to pay participation and fronting fees at 1.38% on $0.6 million of outstanding letters of credit as of December 31, 2024.
All borrowings and other extensions of credits under the 2021 Term Loan, Senior Notes and the Revolver are subject to the satisfaction of customary conditions and restrictive covenants including absence of defaults and accuracy in material respects of representations and warranties. Substantially all of our assets are pledged as collateral to secure our indebtedness under the 2021 Term Loan. At December 31, 2024, we were compliant with all debt covenants in our debt agreements.
Interest Expense, Net
We recorded interest expense, including amortization of deferred financing costs and discounts, of $73.9 million, $86.7 million and $69.4 million for the fiscal years ended December 31, 2024, 2023 and 2022 respectively.
Critical Accounting Estimates
The preparation of consolidated financial statements in conformity with generally accepted accounting principles in the United States of America (“GAAP”) requires management to make estimates and assumptions that affect the amounts reported in the consolidated financial statements and accompanying notes. Management believes that its estimates and assumptions are reasonable in the circumstances; however, actual results could differ materially from those estimates.
Our significant accounting policies are described in Note 2, Significant Accounting Policies, in Item 8, Financial Statements and Supplementary Data, of this Annual Report. We believe that the critical accounting estimates listed below involve our more significant judgments, assumptions, and estimates and, therefore, could have the greatest potential impact on the financial statements.
Revenue Recognition
Judgment is required for the estimation of the standalone selling price (“SSP”) and the allocation of the transaction price by relative SSPs. Within our Government Solutions and Parking Solutions operating segments, some customer arrangements include multiple performance obligations. Government Solutions’ customer arrangements containing multiple performance obligations typically include the sale and installation of photo-enforcement cameras, license of back-office software, processing payments on behalf of the customer and the performance of maintenance services on such cameras over a contractual term. Parking Solutions’ customer arrangements containing multiple performance obligations typically include the sale of parking access hardware systems, the licensing of SaaS products, installation and/or the performance of maintenance services over a contractual term. In most instances, we have determined these performance obligations qualify as distinct performance obligations, as the customer can benefit from the service on its own or together with other resources that are readily available to the customer, and our promise to transfer the service is separately identifiable from other promises in the contract. For arrangements that contain multiple performance obligations, we exercise judgment in allocating the transaction price based on the relative SSP method by comparing the SSP of each distinct performance obligation to the total value of the contract. We apply judgment in determining the SSP for each distinct performance obligation.
See Note 2, Significant Accounting Policies, in Item 8, Financial Statements and Supplementary Data for additional information on the Company’s policy for recognition of revenue.
Allowance for Credit Losses
We review historical credit losses and customer payment trends on receivables and develop loss rate estimates as of the balance sheet date, which includes adjustments for current and future expectations. We identify pools of receivables based on the type of business, industry in which the customer operates and historical credit loss patterns (for example, receivables from drivers of rental cars). We evaluate the changes in expectations based on the newest information available on customer payment trends, travel forecasts and other risk characteristics and adjusting either upward or downward that is most representative of the expected credit losses. Administration fees charged to drivers of rented vehicles that we cannot recover from our customers represent higher risk of credit loss compared to our other pools of receivables. We periodically evaluate the adequacy of our allowance for expected credit losses and adjust appropriately.
Impairment of Goodwill and Long-Lived Assets
We assess goodwill for impairment annually on October 1, or more frequently if events or circumstances indicate that the carrying amounts may not be fully recoverable. We have four reporting units for the purposes of assessing potential impairment of goodwill which include Commercial Services, Government Solutions North America, Government Solutions International and Parking Solutions. We first consider the option to assess qualitative factors to determine whether it is more likely than not that the fair value of the reporting unit is less than its carrying amount. If we conclude that it is more likely than not that the fair value is less than the carrying amount, we then perform a quantitative impairment test by comparing the reporting unit’s fair value with its carrying value. An impairment loss is recognized for the amount by which the reporting units’ carrying value exceeds its fair value, up to the total amount of goodwill allocated to the reporting unit. No impairment is recognized if the fair value of the reporting unit exceeds its carrying value.
The process of evaluating goodwill requires significant judgment including the identification of reporting units and the determination of the fair value of each reporting unit. We estimate the fair value of our reporting units based on a combination of an income approach or more specifically, a discounted cash flow method (“DCF Method”) and a market approach employing the public company market multiple method. The DCF Method is based on projected future cash flows and terminal value estimates discounted to their present values using a market-participant weighted average cost of capital. Significant estimates and assumptions used in the DCF Method include forecasts of future revenue growth rates, EBITDA margin percentages, terminal growth rates and discount rates. We apply discount rates that are commensurate with the risks and uncertainties inherent in the respective reporting units and our internally developed projections of future cash flows. The market approach utilizes a blend of revenue and EBITDA multiples from guideline public companies which are comparable to us in size, profitability and other factors to estimate the fair value of the reporting units. Significant estimates and assumptions used in the market approach include the selection of guideline public companies, revenue and EBITDA projections, the selection of revenue and EBITDA multiples and the application of a control premium. Our estimates are based upon assumptions believed to be reasonable, but which are inherently uncertain, and actual results may differ from those assumed in our analysis. The determination of whether goodwill is impaired involves a significant level of judgment in these assumptions, and changes in our forecasts, business strategy, government regulations, or economic or market conditions could significantly impact these judgments, potentially decreasing the fair value of one or more reporting units. Any resulting impairment charges could have a material impact on our results of operations.
In connection with our annual impairment assessment, we determined it was more likely than not that the fair values of our reporting units were in excess of their carrying value for our Commercial Services, Government Solutions North America and Government Solutions International reporting units based on qualitative factors. We performed a quantitative impairment test for our Parking Solutions reporting unit as of October 1, 2024. This was due to recent performance that unfavorably impacted the Parking Solutions business, including lower revenue growth, higher customer churn and lower profitability margins than previously estimated. The fair value of this reporting unit was determined by equally weighting the results of the DCF and market approach methods described above. Based on the results of its quantitative review, we concluded an impairment to goodwill was necessary because the reporting unit's carrying value exceeded the estimated fair value. We recorded a $97.1 million impairment of goodwill in our Parking Solutions segment during fiscal year 2024, which is presented in the goodwill impairment line item on the consolidated statements of operations.
We review our long-lived assets other than goodwill for impairment whenever events or circumstances indicate that the carrying amount of an asset or asset group may not be fully recoverable. We assess recoverability by comparing the estimated undiscounted future cash flows expected to be generated by the asset or asset group with its carrying value. If the carrying value of the asset or asset group exceeds the estimated undiscounted future cash flows, an impairment loss is recognized for the difference between the estimated fair value and the carrying value. Our estimates of cash flows are subjective judgments based on past experiences adjusted for trends and future expectations, and can be significantly impacted by changes in our business or economic conditions. The determination of a asset group's fair value is also subject to significant judgment and utilizes valuation techniques including discounting estimated future cash flows and market-based analyses. If our estimates or underlying assumptions change in the future, our operating results may be materially impacted. During the year ended December 31, 2024, we recorded a $0.2 million impairment related to the write-down of installation and service parts that no longer had future use within the operating expenses line item in our Government Solutions segment. During the year ended December 31, 2023, we recorded a $4.3 million impairment which included a $3.9 million write-down of installation and service parts that no longer had future use within the operating expenses line item in our Government Solutions segment, and $0.4 million impairment of an ROU asset within the selling, general and administrative expenses line item in our Parking Solutions segment. We recorded a $0.7 million of impairment related to certain photo enforcement programs that ended during the year ended December 31, 2022 within the depreciation, amortization and (gain) loss on disposal of assets, net line item on the consolidated statements of operations.
Income Taxes
The objectives of accounting for income taxes are to recognize the amount of taxes payable or refundable for the current year, and to recognize deferred tax assets and liabilities for the expected future consequences of differences between the tax basis of assets or liabilities and their carrying amounts in the financial statements. Deferred tax assets generally represent items that can be used as a tax deduction or credit in our tax return in future years, while deferred tax liabilities generally represent items that generate a future tax liability for items where deductions have been accelerated for tax purposes. We provide a valuation allowance against deferred tax assets when it is more likely than not that some portion or all of the deferred tax asset will not be realized. We calculate the valuation allowance in accordance with the authoritative guidance relating to income taxes, which requires an assessment of both positive and negative evidence regarding the realizability of these deferred tax assets when measuring the need for a valuation allowance. Significant judgment is required in determining any valuation allowance against deferred tax assets. The realization of deferred tax assets can be affected by, among other things, the nature, frequency and severity of current and cumulative losses, forecasts of future profitability, the length of statutory carryforward periods, our experience with utilizing operating loss and other tax carryforwards by jurisdiction, the reversal of existing taxable temporary differences and tax planning alternatives and strategies that may be available. We recognize the tax benefit from an uncertain tax position only if it is more likely than not that the tax position will be sustained on examination by the taxing authorities, based on the technical merits of the position. The tax benefits recognized in the financial statements from such a position are measured based on the largest benefit that has a greater than 50% likelihood of being realized upon ultimate settlement. Judgment is required in assessing the future tax consequences of events that have been recognized in our financial statements or tax returns. Variation in the actual outcome of these future tax consequences could materially impact our financial statements.
Private Placement Warrant Liabilities
We accounted for warrants as either equity-classified or liability-classified instruments based on an assessment of the warrant’s specific terms and applicable authoritative guidance. For warrants that met all of the criteria for equity classification, the warrants were required to be recorded as a component of additional paid-in capital at the time of issuance. For warrants that did not meet all the criteria for equity classification, the warrants were required to be recorded at their fair value on the date of issuance, and each balance sheet date thereafter. Changes in the estimated fair value of the warrants were recognized as a non-cash gain or loss on the statements of operations. Our Public Warrants met the criteria for equity classification and accordingly, were reported as a component of shareholders’ equity while our Private Placement Warrants did not meet the criteria for equity classification and were instead classified as a liability. The fair value of the Private Placement Warrants was estimated at period-end using a Black-Scholes option pricing model, which was a Level 3 fair value measurement exposed to valuation risk. As of December 31, 2023, all Warrants were either exercised by the holder or redeemed by the Company.
Recent Accounting Pronouncements
For a discussion of recent accounting pronouncements, refer to Note 2, Significant Accounting Policies, in Item 8, Financial Statements and Supplementary Data.
Item 7A. Quantitative and Qualitative Disclosures About Market Risk
We are exposed to interest rate risk due to the variable interest rate on the 2021 Term Loan described in “Item 7. Management’s Discussion and Analysis of Financial Condition and Results of Operations—Liquidity and Capital Resources.”
Interest rate risk represents our exposure to fluctuations in interest rates associated with the variable rate debt represented by the 2021 Term Loan, which has an outstanding balance of $695.6 million at December 31, 2024. The 2021 Term Loan bears interest based, at our option, on either (i) Term SOFR plus an applicable margin of 2.25% per annum, or (ii) an alternate base rate plus an applicable margin of 1.25% per annum. As of December 31, 2024, the interest rate on the 2021 Term Loan was 6.6%.
Based on the December 31, 2024 balance outstanding, each 1% movement in interest rates will result in an approximately $7.0 million change in annual interest expense.
In December 2022, we entered into a cancellable interest rate swap agreement to hedge our exposure to interest rate fluctuations associated with the LIBOR (now transitioned to Term SOFR) portion of the variable interest rate on our 2021 Term Loan. We exercised our option to cancel the interest rate swap effective the end of the third quarter of 2024.
VERRA MOBILITY CORPORATION
INDEX TO CONSOLIDATED FINANCIAL STATEMENTS
Item 8. Financial Statements and Supplementary Data
Report of Independent Registered Public Accounting Firm
To the Stockholders and the Board of Directors of Verra Mobility Corporation
Opinion on the Financial Statements
We have audited the accompanying consolidated balance sheets of Verra Mobility Corporation (the “Company”) as of December 31, 2024 and 2023, the related consolidated statements of operations and comprehensive income, stockholders’ equity, and cash flows for each of the two years in the period ended December 31, 2024, and the related notes and the financial statement schedule listed in the Index at Item 15(a) (collectively referred to as the “financial statements”). In our opinion, the financial statements present fairly, in all material respects, the financial position of the Company as of December 31, 2024 and 2023, and the results of its operations and its cash flows for each of the two years in the period ended December 31, 2024 in conformity with accounting principles generally accepted in the United States of America.
We have also audited, in accordance with the standards of the Public Company Accounting Oversight Board (United States) (PCAOB), the Company’s internal control over financial reporting as of December 31, 2024, based on criteria established in Internal Control — Integrated Framework (2013) issued by the Committee of Sponsoring Organizations of the Treadway Commission and our report dated February 27, 2025, expressed an unqualified opinion on the Company’s internal control over financial reporting.
Basis for Opinion
These financial statements are the responsibility of the Company’s management. Our responsibility is to express an opinion on the Company's financial statements based on our audits. We are a public accounting firm registered with the PCAOB and are required to be independent with respect to the Company in accordance with the U.S. federal securities laws and the applicable rules and regulations of the Securities and Exchange Commission and the PCAOB.
We conducted our audits in accordance with the standards of the PCAOB. Those standards require that we plan and perform the audit to obtain reasonable assurance about whether the financial statements are free of material misstatement, whether due to error or fraud. Our audits included performing procedures to assess the risks of material misstatement of the financial statements, whether due to error or fraud, and performing procedures that respond to those risks. Such procedures included examining, on a test basis, evidence regarding the amounts and disclosures in the financial statements. Our audits also included evaluating the accounting principles used and significant estimates made by management, as well as evaluating the overall presentation of the financial statements. We believe that our audits provide a reasonable basis for our opinion.
Critical Audit Matters
The critical audit matter communicated below is a matter arising from the current-period audit of the financial statements that was communicated or required to be communicated to the audit committee and that (1) relates to accounts or disclosures that are material to the financial statements and (2) involved our especially challenging, subjective, or complex judgments. The communication of critical audit matters does not alter in any way our opinion on the financial statements, taken as a whole, and we are not, by communicating the critical audit matter below, providing a separate opinion on the critical audit matter or on the accounts or disclosures to which it relates.
Goodwill — Parking Solutions Reporting Unit – Refer to Notes 2 and 5 to the financial statements
Critical Audit Matter Description
The Company’s goodwill for its Parking Solutions reporting unit is tested annually for impairment on October 1 of each year, or more frequently if events and circumstances indicate that the carrying value may not be recoverable. The Company’s evaluation of goodwill for impairment involves the comparison of the fair value of each reporting unit to its carrying value. The estimated fair value of a reporting unit is determined using both market and income approaches, combined with an equal weighting.
The market approach is based on comparable company multiples (revenue and “EBITDA,” which stands for earnings before interest, income taxes, depreciation, and amortization) and requires an estimate of multiples derived from comparable publicly traded companies to the reporting unit. The income approach is based on a discounted cash flow method and requires significant estimates and assumptions, including estimates regarding future revenue growth rates, EBITDA margin percentages and the selection of discount rates. Changes in these estimates and assumptions could have a material impact on either the fair value, the amount of any goodwill impairment charge, if any, or both.
During 2024, the Company recognized an impairment loss of $97.1 million for the Parking Solutions reporting unit’s goodwill. After considering the impact of the impairment charges, the carrying amount of the Parking Solutions reporting unit’s goodwill as of December 31, 2024, was $102.1 million.
We identified impairment of the Parking Solutions reporting unit as a critical audit matter because of the significant judgments made by management to estimate the fair value. The audit of these estimates and assumptions required a high degree of auditor judgment when performing audit procedures to evaluate the reasonableness of management's estimates and assumptions related to future revenue growth rates and EBITDA margin percentages, and the selection of significant valuation assumptions such as comparable company revenue and EBITDA multiples and discount rates. The audit also required an increased extent of effort, including the need to involve our fair value specialists.
How the Critical Audit Matter Was Addressed in the Audit
Our audit procedures related to revenue growth rates and EBITDA margin percentages and the selection of significant valuation assumptions, such as comparable company revenue and EBITDA multiples and discount rates used by management to estimate the fair value of the Parking Solutions reporting unit included the following procedures:
•We tested the effectiveness of controls over management’s goodwill impairment evaluation, including those over the determination of the fair value of the Parking Solutions reporting unit, such as controls related to management's review of forecasts of future revenue growth rates and EBITDA margin percentages, selection of comparable company revenue and EBITDA multiples and discount rates.
•We evaluated management’s ability to accurately forecast by comparing actual results to management’s historical forecasts.
•We performed a sensitivity analysis of the future revenue growth rates, EBITDA margin percentages, and discount rates, which included their impact on cash flows.
•We evaluated the reasonableness of management’s forecasted revenue growth rates and EBITDA margin percentages by comparing the forecasts to (1) historical results of the Company, (2) internal communications to management and the board of directors, and (3) forecasted information included in industry reports of the Company and companies in its peer groups.
•With the assistance of our fair value specialists, we evaluated (1) the valuation methodologies used, (2) the comparable company multiples selected by management, and (3) the discount rates used in determining the present value of the expected cash flows.
/S/ Deloitte & Touche LLP
Tempe, Arizona
February 27, 2025
We have served as the Company’s auditor since 2023.
Report of Independent Registered Public Accounting Firm
To the Stockholders and the Board of Directors of Verra Mobility Corporation
Opinion on Internal Control over Financial Reporting
We have audited the internal control over financial reporting of Verra Mobility Corporation (the “Company”) as of December 31, 2024, based on criteria established in Internal Control — Integrated Framework (2013) issued by the Committee of Sponsoring Organizations of the Treadway Commission (COSO). In our opinion, the Company maintained, in all material respects, effective internal control over financial reporting as of December 31, 2024, based on criteria established in Internal Control — Integrated Framework (2013) issued by COSO.
We have also audited, in accordance with the standards of the Public Company Accounting Oversight Board (United States) (PCAOB), the consolidated financial statements and schedule as of and for the year ended December 31, 2024, of the Company and our report dated February 27, 2025, expressed an unqualified opinion on those financial statements.
Basis for Opinion
The Company’s management is responsible for maintaining effective internal control over financial reporting and for its assessment of the effectiveness of internal control over financial reporting, included in the accompanying Managements Report on Internal Control Over Financial Reporting. Our responsibility is to express an opinion on the Company’s internal control over financial reporting based on our audit. We are a public accounting firm registered with the PCAOB and are required to be independent with respect to the Company in accordance with the U.S. federal securities laws and the applicable rules and regulations of the Securities and Exchange Commission and the PCAOB.
We conducted our audit in accordance with the standards of the PCAOB. Those standards require that we plan and perform the audit to obtain reasonable assurance about whether effective internal control over financial reporting was maintained in all material respects. Our audit included obtaining an understanding of internal control over financial reporting, assessing the risk that a material weakness exists, testing and evaluating the design and operating effectiveness of internal control based on the assessed risk, and performing such other procedures as we considered necessary in the circumstances. We believe that our audit provides a reasonable basis for our opinion.
Definition and Limitations of Internal Control over Financial Reporting
A company’s internal control over financial reporting is a process designed to provide reasonable assurance regarding the reliability of financial reporting and the preparation of financial statements for external purposes in accordance with generally accepted accounting principles. A company’s internal control over financial reporting includes those policies and procedures that (1) pertain to the maintenance of records that, in reasonable detail, accurately and fairly reflect the transactions and dispositions of the assets of the company; (2) provide reasonable assurance that transactions are recorded as necessary to permit preparation of financial statements in accordance with generally accepted accounting principles, and that receipts and expenditures of the company are being made only in accordance with authorizations of management and directors of the company; and (3) provide reasonable assurance regarding prevention or timely detection of unauthorized acquisition, use, or disposition of the company’s assets that could have a material effect on the financial statements.
Because of its inherent limitations, internal control over financial reporting may not prevent or detect misstatements. Also, projections of any evaluation of effectiveness to future periods are subject to the risk that controls may become inadequate because of changes in conditions, or that the degree of compliance with the policies or procedures may deteriorate.
/S/ Deloitte & Touche LLP
Tempe, Arizona
February 27, 2025
Report of Independent Registered Public Accounting Firm
To the Stockholders and the Board of Directors of Verra Mobility Corporation
Opinion on the Financial Statements
We have audited the accompanying consolidated statements of operations and comprehensive income, stockholders’ equity, and cash flows of Verra Mobility Corporation (the Company) for the year ended December 31, 2022, and the related notes and the financial statement schedule listed in the Index at Item 15(a) (collectively referred to as the “consolidated financial statements”). In our opinion, the consolidated financial statements present fairly, in all material respects, the results of the Company’s operations and its cash flows for the year ended December 31, 2022, in conformity with U.S. generally accepted accounting principles.
Basis for Opinion
These financial statements are the responsibility of the Company's management. Our responsibility is to express an opinion on the Company’s financial statements based on our audit. We are a public accounting firm registered with the PCAOB and are required to be independent with respect to the Company in accordance with the U.S. federal securities laws and the applicable rules and regulations of the Securities and Exchange Commission and the PCAOB.
We conducted our audit in accordance with the standards of the PCAOB. Those standards require that we plan and perform the audit to obtain reasonable assurance about whether the financial statements are free of material misstatement, whether due to error or fraud. Our audit included performing procedures to assess the risks of material misstatement of the financial statements, whether due to error or fraud, and performing procedures that respond to those risks. Such procedures included examining, on a test basis, evidence regarding the amounts and disclosures in the financial statements. Our audit also included evaluating the accounting principles used and significant estimates made by management, as well as evaluating the overall presentation of the financial statements. We believe that our audit provides a reasonable basis for our opinion.
/s/ Ernst & Young LLP
We served as the Company’s auditor from 2013 to 2023.
Phoenix, Arizona
March 1, 2023
VERRA MOBILITY CORPORATION
CONSOLIDATED BALANCE SHEETS
| | | | | | | | |
| | December 31, | |
(In thousands, except per share data) | | 2024 | | | 2023 | |
Assets | | | | | | |
Current assets: | | | | | | |
Cash and cash equivalents | | $ | 77,560 | | | $ | 136,309 | |
Restricted cash | | | 3,594 | | | | 3,413 | |
Accounts receivable (net of allowance for credit losses of $17.0 million and $18.5 million at December 31, 2024 and 2023, respectively) | | | 206,503 | | | | 197,824 | |
Unbilled receivables | | | 48,193 | | | | 37,065 | |
Inventory | | | 15,502 | | | | 17,966 | |
Prepaid expenses and other current assets | | | 42,647 | | | | 46,961 | |
Total current assets | | | 393,999 | | | | 439,538 | |
Installation and service parts, net | | | 36,631 | | | | 22,895 | |
Property and equipment, net | | | 141,601 | | | | 123,248 | |
Operating lease assets | | | 29,895 | | | | 33,523 | |
Intangible assets, net | | | 232,297 | | | | 301,025 | |
Goodwill | | | 735,615 | | | | 835,835 | |
Other non-current assets | | | 44,451 | | | | 33,919 | |
Total assets | | $ | 1,614,489 | | | $ | 1,789,983 | |
Liabilities and Stockholders' Equity | | | | | | |
Current liabilities: | | | | | | |
Accounts payable | | $ | 91,224 | | | $ | 78,749 | |
Deferred revenue | | | 29,374 | | | | 28,788 | |
Accrued liabilities | | | 73,980 | | | | 93,119 | |
Tax receivable agreement liability, current portion | | | 5,163 | | | | 5,098 | |
Current portion of long-term debt | | | — | | | | 9,019 | |
Total current liabilities | | | 199,741 | | | | 214,773 | |
Long-term debt, net of current portion | | | 1,034,211 | | | | 1,029,113 | |
Operating lease liabilities, net of current portion | | | 25,757 | | | | 29,124 | |
Tax receivable agreement liability, net of current portion | | | 42,977 | | | | 48,369 | |
Asset retirement obligations | | | 15,493 | | | | 14,580 | |
Deferred tax liabilities, net | | | 14,699 | | | | 18,360 | |
Other long-term liabilities | | | 16,486 | | | | 14,197 | |
Total liabilities | | | 1,349,364 | | | | 1,368,516 | |
Commitments and contingencies (Note 16) | | | | | | |
Stockholders' equity | | | | | | |
Preferred stock, $0.0001 par value, 1,000 shares authorized with no shares issued and outstanding at December 31, 2024 and 2023 | | | — | | | | — | |
Common stock, $0.0001 par value, 260,000 shares authorized with 159,594 and 166,555 shares issued and outstanding at December 31, 2024 and 2023, respectively | | | 16 | | | | 17 | |
Additional paid-in capital | | | 551,955 | | | | 557,513 | |
Accumulated deficit | | | (269,287 | ) | | | (125,887 | ) |
Accumulated other comprehensive loss | | | (17,559 | ) | | | (10,176 | ) |
Total stockholders' equity | | | 265,125 | | | | 421,467 | |
Total liabilities and stockholders' equity | | $ | 1,614,489 | | | $ | 1,789,983 | |
See accompanying Notes to Consolidated Financial Statements.
VERRA MOBILITY CORPORATION
CONSOLIDATED STATEMENTS OF OPERATIONS
AND COMPREHENSIVE INCOME
| | | | | | | | | | | | |
| | For the Year Ended December 31, | |
(In thousands, except per share data) | | 2024 | | | 2023 | | | 2022 | |
Service revenue | | $ | 841,676 | | | $ | 783,595 | | | $ | 695,218 | |
Product sales | | | 37,531 | | | | 33,715 | | | | 46,380 | |
Total revenue | | | 879,207 | | | | 817,310 | | | | 741,598 | |
Cost of service revenue, excluding depreciation and amortization | | | 18,988 | | | | 18,232 | | | | 16,330 | |
Cost of product sales | | | 27,058 | | | | 25,231 | | | | 30,932 | |
Operating expenses | | | 295,937 | | | | 273,288 | | | | 226,324 | |
Selling, general and administrative expenses | | | 195,054 | | | | 198,550 | | | | 163,133 | |
Depreciation, amortization and (gain) loss on disposal of assets, net | | | 109,072 | | | | 113,195 | | | | 140,174 | |
Goodwill impairment | | | 97,076 | | | | — | | | | — | |
Total costs and expenses | | | 743,185 | | | | 628,496 | | | | 576,893 | |
Income from operations | | | 136,022 | | | | 188,814 | | | | 164,705 | |
Interest expense, net | | | 73,902 | | | | 86,701 | | | | 69,372 | |
Change in fair value of private placement warrants | | | — | | | | 24,966 | | | | (14,400 | ) |
Tax receivable agreement liability adjustment | | | (257 | ) | | | (3,077 | ) | | | (720 | ) |
Loss (gain) on interest rate swap | | | 494 | | | | 817 | | | | (996 | ) |
Loss (gain) on extinguishment of debt | | | 1,745 | | | | 3,533 | | | | (3,005 | ) |
Other income, net | | | (18,970 | ) | | | (11,123 | ) | | | (12,654 | ) |
Total other expenses | | | 56,914 | | | | 101,817 | | | | 37,597 | |
Income before income taxes | | | 79,108 | | | | 86,997 | | | | 127,108 | |
Income tax provision | | | 47,660 | | | | 29,982 | | | | 34,633 | |
Net income | | $ | 31,448 | | | $ | 57,015 | | | $ | 92,475 | |
Other comprehensive (loss) income: | | | | | | | | | |
Change in foreign currency translation adjustment | | | (7,383 | ) | | | 2,689 | | | | (7,771 | ) |
Total comprehensive income | | $ | 24,065 | | | $ | 59,704 | | | $ | 84,704 | |
Net income per share: | | | | | | | | | |
Basic | | $ | 0.19 | | | $ | 0.36 | | | $ | 0.61 | |
Diluted | | $ | 0.19 | | | $ | 0.36 | | | $ | 0.50 | |
Weighted average shares outstanding: | | | | | | | | | |
Basic | | | 165,090 | | | | 158,777 | | | | 152,848 | |
Diluted | | | 167,717 | | | | 160,017 | | | | 159,026 | |
See accompanying Notes to Consolidated Financial Statements.
VERRA MOBILITY CORPORATION
CONSOLIDATED STATEMENTS OF STOCKHOLDERS’ EQUITY
| | | | | | | | | | | | | | | | | | | | | | | | | | | | |
| | Common
Stock | | | Common
Stock
Contingent | | | Additional
Paid-in | | | Accumulated | | | Accumulated
Other
Comprehensive | | | Total
Stockholders' | |
(In thousands) | | Shares | | | Amount | | | Consideration | | | Capital | | | Deficit | | | Loss | | | Equity | |
Balance as of December 31, 2021 | | | 156,079 | | | $ | 16 | | | $ | 36,575 | | | $ | 309,883 | | | $ | (81,416 | ) | | $ | (5,094 | ) | | $ | 259,964 | |
Net income | | | — | | | | — | | | | — | | | | — | | | | 92,475 | | | | — | | | | 92,475 | |
Share repurchases and retirement | | | (7,874 | ) | | | (1 | ) | | | — | | | | (15,933 | ) | | | (109,137 | ) | | | — | | | | (125,071 | ) |
Vesting of restricted stock units ("RSUs") | | | 654 | | | | — | | | | — | | | | — | | | | — | | | | — | | | | — | |
Exercise of stock options | | | 103 | | | | — | | | | — | | | | 1,334 | | | | — | | | | — | | | | 1,334 | |
Payment of employee tax withholding related to RSUs vesting | | | — | | | | — | | | | — | | | | (6,524 | ) | | | — | | | | — | | | | (6,524 | ) |
Stock-based compensation | | | — | | | | — | | | | — | | | | 16,663 | | | | — | | | | — | | | | 16,663 | |
Other comprehensive loss, net of tax | | | — | | | | — | | | | — | | | | — | | | | — | | | | (7,771 | ) | | | (7,771 | ) |
Balance as of December 31, 2022 | | | 148,962 | | | $ | 15 | | | $ | 36,575 | | | $ | 305,423 | | | $ | (98,078 | ) | | $ | (12,865 | ) | | $ | 231,070 | |
Net income | | | — | | | | — | | | | — | | | | — | | | | 57,015 | | | | — | | | | 57,015 | |
Earn-out shares issued to PE Greenlight Holdings, LLC | | | 5,000 | | | | — | | | | (36,575 | ) | | | 36,575 | | | | — | | | | — | | | | — | |
Share repurchases and retirement | | | (4,581 | ) | | | — | | | | — | | | | (15,176 | ) | | | (84,824 | ) | | | — | | | | (100,000 | ) |
Vesting of RSUs and performance share units ("PSUs") | | | 449 | | | | — | | | | — | | | | — | | | | — | | | | — | | | | — | |
Exercise of stock options | | | 451 | | | | — | | | | — | | | | 5,919 | | | | — | | | | — | | | | 5,919 | |
Payment of employee tax withholding related to RSUs and PSUs vesting | | | — | | | | — | | | | — | | | | (3,142 | ) | | | — | | | | — | | | | (3,142 | ) |
Exercise of warrants | | | 16,274 | | | | 2 | | | | — | | | | 210,438 | | | | — | | | | — | | | | 210,440 | |
Stock-based compensation | | | — | | | | — | | | | — | | | | 17,476 | | | | — | | | | — | | | | 17,476 | |
Other comprehensive income, net of tax | | | — | | | | — | | | | — | | | | — | | | | — | | | | 2,689 | | | | 2,689 | |
Balance as of December 31, 2023 | | | 166,555 | | | $ | 17 | | | $ | — | | | $ | 557,513 | | | $ | (125,887 | ) | | $ | (10,176 | ) | | $ | 421,467 | |
Net income | | | — | | | | — | | | | — | | | | — | | | | 31,448 | | | | — | | | | 31,448 | |
Share repurchases and retirement | | | (7,883 | ) | | | (1 | ) | | | — | | | | (26,803 | ) | | | (174,848 | ) | | | — | | | | (201,652 | ) |
Vesting of RSUs and PSUs | | | 600 | | | | — | | | | — | | | | — | | | | — | | | | — | | | | — | |
Exercise of stock options | | | 322 | | | | — | | | | — | | | | 4,288 | | | | — | | | | — | | | | 4,288 | |
Payment of employee tax withholding related to RSUs and PSUs vesting | | | — | | | | — | | | | — | | | | (6,001 | ) | | | — | | | | — | | | | (6,001 | ) |
Stock-based compensation | | | — | | | | — | | | | — | | | | 22,958 | | | | — | | | | — | | | | 22,958 | |
Other comprehensive loss, net of tax | | | — | | | | — | | | | — | | | | — | | | | — | | | | (7,383 | ) | | | (7,383 | ) |
Balance as of December 31, 2024 | | | 159,594 | | | $ | 16 | | | $ | — | | | $ | 551,955 | | | $ | (269,287 | ) | | $ | (17,559 | ) | | $ | 265,125 | |
See accompanying Notes to Consolidated Financial Statements.
VERRA MOBILITY CORPORATION
CONSOLIDATED STATEMENTS OF CASH FLOWS
| | | | | | | | | | | | |
| | For the Year Ended December 31, | |
($ in thousands) | | 2024 | | | 2023 | | | 2022 | |
Cash Flows from Operating Activities: | | | | | | | | | |
Net income | | $ | 31,448 | | | $ | 57,015 | | | $ | 92,475 | |
Adjustments to reconcile net income to net cash provided by operating activities: | | | | | | | | | |
Depreciation and amortization | | | 108,525 | | | | 113,067 | | | | 138,684 | |
Amortization of deferred financing costs and discounts | | | 4,106 | | | | 4,679 | | | | 5,472 | |
Change in fair value of private placement warrants | | | — | | | | 24,966 | | | | (14,400 | ) |
Tax receivable agreement liability adjustment | | | (257 | ) | | | (3,077 | ) | | | (720 | ) |
Change in fair value of interest rate swap | | | 1,316 | | | | (320 | ) | | | (996 | ) |
Loss (gain) on extinguishment of debt | | | 1,745 | | | | 3,533 | | | | (3,005 | ) |
Credit loss expense | | | 13,002 | | | | 9,054 | | | | 14,481 | |
Deferred income taxes | | | (10,012 | ) | | | (27,037 | ) | | | (17,355 | ) |
Stock-based compensation | | | 22,958 | | | | 17,476 | | | | 16,663 | |
Goodwill impairment | | | 97,076 | | | | — | | | | — | |
Impairment of long-lived assets and ROU assets | | | 170 | | | | 4,280 | | | | — | |
Other | | | 1,403 | | | | 359 | | | | 2,994 | |
Changes in operating assets and liabilities: | | | | | | | | | |
Accounts receivable | | | (22,664 | ) | | | (42,459 | ) | | | (17,685 | ) |
Unbilled receivables | | | (11,987 | ) | | | (6,252 | ) | | | (1,936 | ) |
Inventory | | | 1,917 | | | | 1,148 | | | | (10,310 | ) |
Prepaid expenses and other assets | | | 5,926 | | | | (2,161 | ) | | | 4,306 | |
Deferred revenue | | | 1,231 | | | | (2,400 | ) | | | 4,591 | |
Accounts payable and other current liabilities | | | (16,425 | ) | | | 50,512 | | | | 6,513 | |
Other liabilities | | | (5,836 | ) | | | 3,718 | | | | (1,435 | ) |
Net cash provided by operating activities | | | 223,642 | | | | 206,101 | | | | 218,337 | |
Cash Flows from Investing Activities: | | | | | | | | | |
Cash receipts (payments) for interest rate swap | | | 822 | | | | (1,137 | ) | | | — | |
Purchase of intellectual property | | | — | | | | (500 | ) | | | — | |
Purchases of installation and service parts and property and equipment | | | (70,856 | ) | | | (56,985 | ) | | | (48,186 | ) |
Cash proceeds from the sale of assets | | | 314 | | | | 332 | | | | 241 | |
Payment of contingent consideration | | | — | | | | — | | | | (647 | ) |
Net cash used in investing activities | | | (69,720 | ) | | | (58,290 | ) | | | (48,592 | ) |
Cash Flows from Financing Activities: | | | | | | | | | |
Borrowings on long-term debt | | | 36,591 | | | | — | | | | — | |
Repayment of long-term debt | | | (45,610 | ) | | | (181,519 | ) | | | (9,019 | ) |
Repayment on revolver | | | — | | | | — | | | | (25,000 | ) |
Payment of debt issuance costs | | | (716 | ) | | | (459 | ) | | | (447 | ) |
Proceeds from the exercise of warrants | | | — | | | | 161,408 | | | | — | |
Share repurchases and retirement | | | (199,979 | ) | | | (100,000 | ) | | | (125,071 | ) |
Proceeds from exercise of stock options | | | 4,288 | | | | 5,919 | | | | 1,334 | |
Payment of employee tax withholding related to RSUs and PSUs vesting | | | (6,001 | ) | | | (3,142 | ) | | | (6,524 | ) |
Payment of contingent consideration | | | — | | | | — | | | | (205 | ) |
Net cash used in financing activities | | | (211,427 | ) | | | (117,793 | ) | | | (164,932 | ) |
Effect of exchange rate changes on cash and cash equivalents | | | (1,063 | ) | | | 589 | | | | (130 | ) |
Net (decrease) increase in cash, cash equivalents and restricted cash | | | (58,568 | ) | | | 30,607 | | | | 4,683 | |
Cash, cash equivalents and restricted cash - beginning of period | | | 139,722 | | | | 109,115 | | | | 104,432 | |
Cash, cash equivalents and restricted cash - end of period | | $ | 81,154 | | | $ | 139,722 | | | $ | 109,115 | |
See accompanying Notes to Consolidated Financial Statements.
VERRA MOBILITY CORPORATION
CONSOLIDATED STATEMENTS OF CASH FLOWS (Continued)
| | | | | | | | | | | | |
| | For the Year Ended December 31, | |
Reconciliation of cash, cash equivalents, and restricted cash to the consolidated balance sheets | | 2024 | | | 2023 | | | 2022 | |
Cash and cash equivalents | | $ | 77,560 | | | $ | 136,309 | | | $ | 105,204 | |
Restricted cash | | | 3,594 | | | | 3,413 | | | | 3,911 | |
Total cash, cash equivalents, and restricted cash | | $ | 81,154 | | | $ | 139,722 | | | $ | 109,115 | |
| | | | | | | | | | | |
Supplemental cash flow information: | | | | | | | | |
Interest paid | $ | 76,203 | | | $ | 86,113 | | | $ | 63,663 | |
Income taxes paid, net of refunds | | 50,199 | | | | 54,002 | | | | 47,623 | |
Supplemental non-cash information: | | | | | | | | |
Purchases of installation and service parts and property and equipment in accounts payable and accrued liabilities at year-end | | 8,911 | | | | 5,120 | | | | 10,421 | |
Accrued excise tax payable on net share repurchases | | 1,673 | | | | — | | | | — | |
Leased assets obtained in exchange for new operating lease liabilities | | 3,994 | | | | — | | | | — | |
Earn-out shares issued to PE Greenlight Holdings, LLC | | — | | | | 36,575 | | | | — | |
Increase in additional paid-in capital due to exercise of private placement warrants | | — | | | | 49,032 | | | | — | |
See accompanying Notes to Consolidated Financial Statements.
VERRA MOBILITY CORPORATION
NOTES TO CONSOLIDATED FINANCIAL STATEMENTS
1.Description of Business
Verra Mobility Corporation (collectively with its subsidiaries, the “Company” or “Verra Mobility”) offers integrated technology solutions and services to its customers who are located throughout the world, primarily within the United States, Australia, Canada and Europe. The Company is organized into three operating segments: Commercial Services, Government Solutions and Parking Solutions (see Note 17, Segment Reporting).
The Commercial Services segment offers automated toll and violations management and title and registration solutions to rental car companies (“RACs”), direct commercial fleet owner-operators (“Direct Fleets”) and fleet management companies (“FMCs”) and other large fleet owners in North America. Through its established relationships with individual tolling authorities throughout the United States, the segment provides an automated and outsourced administrative solution for its customers while also providing a value-added convenience for vehicle drivers and benefits to tolling and issuing authorities. The toll and violations management solutions help ensure timely payment of tolls and violations incurred by the customers’ vehicles and perform timely transfers of liability on the customers’ behalf, and driver billing and collections, as applicable. It also manages regional toll transponder installation and vehicle association—a critical and highly complex process for RAC, Direct Fleet and FMC customers—to ensure that the transponders (and corresponding toll transactions) are associated with the correct vehicle. In Europe, the Commercial Services segment provides violations processing through Euro Parking Collection plc and consumer tolling services through Pagatelia S.L.U.
The Government Solutions segment offers photo enforcement solutions and services to its customers which include complete, end-to-end speed, red-light, school bus stop arm and bus lane enforcement solutions. These programs are designed to reduce traffic violations and resulting collisions, injuries and fatalities. The Company implements and administers traffic safety programs for municipalities, counties, school districts and law enforcement agencies of all sizes. The international operations for this segment primarily involve the sale of traffic enforcement products and recurring maintenance services related to the equipment and software.
The Parking Solutions segment offers an integrated suite of parking software, transaction processing and hardware solutions to its customers, which include universities, municipalities, healthcare facilities and commercial parking operators. This segment develops specialized hardware and parking management software that provides a platform for the issuance of parking permits, enforcement, gateless vehicle counting, event parking and citation services. It also produces and markets its proprietary software as a service to its customers throughout the United States and Canada.
2.Significant Accounting Policies
Principles of Consolidation
The accompanying consolidated financial statements include the accounts of the Company prepared in accordance with generally accepted accounting principles in the United States of America (“GAAP”). All intercompany balances and transactions have been eliminated in consolidation. In the opinion of the Company’s management, the consolidated financial statements reflect all adjustments, which are normal and recurring in nature, necessary for fair financial statement presentation.
Use of Estimates
The preparation of consolidated financial statements in conformity with GAAP requires management to make estimates and assumptions that affect the amounts reported in the consolidated financial statements and accompanying notes. Significant estimates and assumptions include those related to allocating the transaction price for revenue recognition, inventory valuation, allowance for credit losses, fair value of the private placement warrant liabilities, fair value of the interest rate swap, self-insurance liability, valuation allowance on deferred tax assets, uncertain tax positions, apportionment for state income taxes, the tax receivable agreement liability, fair value of privately-held securities, impairment assessments of goodwill, intangible assets and other long-lived assets, asset retirement obligations, contingent consideration and the recognition and measurement of loss contingencies.
Management believes that its estimates and assumptions are reasonable in the circumstances; however, actual results could differ materially from those estimates.
Cash and Cash Equivalents
The Company considers all highly liquid investments purchased with a remaining maturity of three months or less when acquired to be cash equivalents.
Restricted Cash
The Company collects cash on behalf of customers under certain contracts which it deposits daily into Company bank accounts and transfers regularly to customer bank accounts. Restricted cash primarily represents customer cash collected but not yet remitted to the customer. Restricted cash is classified as a current asset and the corresponding liability for amounts due to customers is within current liabilities.
Concentration of Credit Risk
Financial instruments that potentially subject the Company to concentrations of credit risk are primarily cash and cash equivalents, accounts receivable and unbilled receivables. The Company limits cash and cash equivalents to highly rated financial institutions.
Significant customers are those which represent more than 10% of the Company’s total revenue or accounts receivable, net. Revenue from the single Government Solutions customer exceeding 10% of total revenue is presented below:
| | | | | | | | | | | | |
| | For the Year Ended December 31, | |
| | 2024 | | | 2023 | | | 2022 | |
City of New York Department of Transportation | | | 15.8 | % | | | 16.9 | % | | | 19.5 | % |
The City of New York Department of Transportation (“NYCDOT”) represented 17.2% and 18.3% of total accounts receivable, net as of December 31, 2024 and 2023, respectively. There is no material reserve related to NYCDOT open receivables as amounts are deemed collectible based on current conditions and expectations. No other Government Solutions customer exceeded 10% of total accounts receivable, net as of any period presented.
Significant customer revenue concentrations generated through the Company’s Commercial Services partners as a percent of total revenue are presented below:
| | | | | | | | | | | | |
| | For the Year Ended December 31, | |
| | 2024 | | | 2023 | | | 2022 | |
Hertz Corporation | | | 10.8 | % | | | 11.8 | % | | | 11.1 | % |
Avis Budget Group, Inc. | | | 13.5 | % | | | 13.6 | % | | | 13.0 | % |
Enterprise Mobility | | | 11.7 | % | | | 10.4 | % | | | 9.3 | % |
No Commercial Services customer exceeded 10% of total accounts receivable, net as of December 31, 2024 or 2023.
There were no significant customer concentrations that exceeded 10% of total revenue or accounts receivables, net for the Parking Solutions segment as of or for any period presented.
Allowance for Credit Losses
Accounts receivable and unbilled receivables are uncollateralized customer obligations arising from the sale of products or services. Accounts receivable and unbilled receivables have normal trade terms of less than one year and are initially stated at the amounts billed to the customers and subsequently measured at amortized cost net of allowance for credit losses. Unbilled receivables are recorded when revenues have been earned but have not been included on a customer invoice through the end of the current period. Unbilled receivables were $48.2 million and $37.1 million as of December 31, 2024 and 2023, respectively.
The Company reviews historical credit losses and customer payment trends on receivables and develops loss estimates as of the balance sheet date, which includes adjustments for current and future expectations. It identifies pools of receivables based on the type of business, industry in which the customer operates and historical credit loss patterns. The Company uses collection assumptions (typically at the customer level) to estimate expected credit losses. Receivables are written off against the allowance for credit losses when it is probable that amounts will not be collected based on the terms of the customer contracts, and subsequent recoveries reverse the previous write-off and apply to the receivable in the period recovered. No interest or late fees are charged on delinquent accounts. The Company periodically evaluates the adequacy of its allowance for expected credit losses and adjusts appropriately.
The following presents the activity in the allowance for credit losses by reportable segment for the years ended December 31, 2023 and 2024, respectively:
| | | | | | | | | | | | |
($ in thousands) | Commercial
Services (1) | | Government
Solutions | | Parking
Solutions | | Total | |
Balance at January 1, 2023 | $ | 11,177 | | $ | 4,573 | | $ | 157 | | $ | 15,907 | |
Credit loss expense (income) | | 11,153 | | | (1,953 | ) | | (146 | ) | | 9,054 | |
Write-offs, net of recoveries | | (6,669 | ) | | (194 | ) | | 415 | | | (6,448 | ) |
Balance at December 31, 2023 | $ | 15,661 | | $ | 2,426 | | $ | 426 | | $ | 18,513 | |
Credit loss expense (income) | | 14,670 | | | (1,979 | ) | | 311 | | | 13,002 | |
Write-offs, net of recoveries | | (14,293 | ) | | (115 | ) | | (89 | ) | | (14,497 | ) |
Balance at December 31, 2024 | $ | 16,038 | | $ | 332 | | $ | 648 | | $ | 17,018 | |
(1)This primarily consists of receivables from drivers of rental cars for which the Company bills on behalf of its customers. Receivables not collected from drivers within a defined number of days are transferred to customers subject to applicable bad debt sharing agreements. The allowance for credit losses for driver-billed receivables was 85% and 88% of the total Commercial Services allowance for credit losses as of December 31, 2024 and 2023, respectively.
Inventory
Inventories consist of parts and electronic components used in the production of parking management related hardware sold to certain Parking Solutions customers and photo enforcement systems sold to certain Government Solutions customers. Inventories for the Parking Solutions business were stated at cost on a first-in, first-out basis and the total carrying value was approximately $8.4 million and $10.0 million as of December 31, 2024 and 2023, respectively. Inventories for the Government Solutions international business were stated at a weighted average cost and the total carrying value was $7.1 million and $8.0 million as of December 31, 2024 and 2023, respectively. The Company assesses the value of its inventory and writes down the cost to net realizable value upon evaluation of historical experience and assumptions regarding future usage, and any such write down establishes a new cost basis for the items. Total finished goods were approximately $3.1 million and $3.4 million as of December 31, 2024 and 2023, respectively.
Installation and Service Parts
Installation and service parts consist of components used in the construction and maintenance of the Company's photo enforcement systems. Installation and service parts are stated at cost and are reclassified to property and equipment upon initiation of construction and subsequently placed in service. Installation and service parts used in repairs and maintenance are recorded as operating expenses. See Impairment of Long-lived Assets section below for a discussion of the write-down of installation and service parts that no longer had future use.
Property and Equipment
Property and equipment is stated at cost less accumulated depreciation. All repairs and maintenance costs are expensed as incurred. Depreciation is recorded on a straight-line basis over the estimated useful lives of the related assets as follows:
| | |
Equipment | | 3-7 years |
Computer equipment | | 3-5 years |
Furniture | | 3-10 years |
Automobiles | | 3-7 years |
Software | | 3-7 years |
Leasehold improvements | | Shorter of lease term or estimated useful life |
Equipment relates to equipment installed at customer sites and certain installation costs that qualify for capitalization. Software costs include certain internal and external costs associated with the development of software that are incurred during the application development stage. In addition, a modification or upgrade to existing software is capitalized only to the extent it results in additional functionality to existing software. Software maintenance and training costs are expensed as incurred.
Investment in Privately-held Securities
The Company holds an investment in privately-held equity securities which is recorded at cost and adjusted based on observable transactions for same or similar investments or for impairment. Investment gains and losses are recorded in other income, net.
Valuation of privately-held securities requires judgment due to the lack of readily available observable market data. The carrying value is not adjusted if there are no identified events that would indicate a need for upward or downward adjustments or changes in circumstances that may indicate impairment. In determining the estimated fair value of its investment, the Company utilizes the most recent data available. The Company assesses its investment for impairment quarterly using both qualitative and quantitative factors. If an investment is considered impaired, an impairment loss is recognized and a new carrying value is established for the investment.
There were no indicators of impairment during the years ended December 31, 2024 or December 31, 2023. The Company recorded a $1.3 million impairment during the year ended December 31, 2022 within other income, net on the consolidated statements of operations.
Goodwill
Goodwill represents the excess of the purchase price over the estimated fair value of net tangible and identifiable intangible assets acquired in business combinations. Goodwill is assessed for impairment at least annually at the reporting unit level or more frequently if events or changes in circumstances indicate the carrying value may not be recoverable. If, based on a qualitative analysis, it is determined more-likely-than-not that the fair value of the reporting unit is less than its carrying amount, a quantitative impairment test is performed. Reporting units are identified by assessing whether the components of the Company’s operating segments constitute businesses for which discrete financial information is available, if segment management regularly reviews the operating results of those components and if any of the components can be aggregated based on economic similarities and other factors. Application of the goodwill impairment test requires judgment, including the identification of reporting units, the assignment of assets (including goodwill) to those reporting units and the determination of the fair value of each reporting unit. The date of the Company’s annual impairment analysis is October 1. The Company has four reporting units for the purposes of assessing potential impairment of goodwill which include Commercial Services, Government Solutions North America, Government Solutions International and Parking Solutions.
The Company estimates the fair value of its reporting units based on a combination of an income approach or more specifically, a discounted cash flow method (“DCF Method”) and a market approach employing the public company market multiple method. The DCF Method is based on projected future cash flows and terminal value estimates discounted to their present values using a market-participant weighted average cost of capital. Significant estimates and assumptions used in the DCF Method include forecasts of future revenue growth rates, EBITDA margin percentages, terminal growth rates and discount rates. The Company applies discount rates that are commensurate with the risks and uncertainties inherent in the respective reporting units and its internally developed projections of future cash flows. The market approach utilizes a blend of revenue and EBITDA multiples from guideline public companies which are comparable to it in size, profitability and other factors to estimate the fair value of the reporting units. Significant estimates and assumptions used in the market approach include the selection of guideline public companies, revenue and EBITDA projections, the selection of revenue and EBITDA multiples and the application of a control premium.
In connection with its annual impairment assessment, the Company determined it was more likely than not that the fair values of its reporting units were in excess of their carrying values for the Commercial Services, Government Solutions North America and Government Solutions International reporting units based on qualitative factors. The Company performed a quantitative impairment test for its Parking Solutions reporting unit as of October 1, 2024. This was due to recent performance that unfavorably impacted the Parking Solutions business, including lower revenue growth, higher customer churn and lower profitability margins than previously estimated. The fair value of this reporting unit was determined by equally weighting the results of the DCF and market approach methods described above. Based on the results of its quantitative review, the Company concluded an impairment to goodwill was necessary because the reporting unit's carrying value exceeded the estimated fair value. The Company recorded a $97.1 million impairment of goodwill in the Parking Solutions segment during fiscal year 2024, which is presented in the goodwill impairment line item on the consolidated statements of operations.
Intangible Assets
Intangible assets represent existing customer relationships, trademarks, patents, developed technology (hardware and software) and non-compete agreements. Intangible assets are amortized over their respective estimated useful lives on a straight-line basis, which approximates the utilization of their expected future benefits. Amortization of intangible assets is included in depreciation, amortization and (gain) loss on disposal of assets, net in the consolidated statements of operations.
The Company annually evaluates the estimated remaining useful lives of its intangible assets to determine whether events or changes in circumstances warrant a revision to the remaining period of amortization.
Impairment of Long-Lived Assets
The Company reviews its long-lived assets (including intangible assets with finite useful lives and installation and service parts) for impairment whenever events or circumstances indicate that the carrying amount of an asset or an asset group may not be fully recoverable. The Company assesses recoverability by comparing the estimated undiscounted future cash flows expected to be generated by the asset or asset group with its carrying value. If the carrying value of the asset or asset group exceeds the estimated undiscounted future cash flows, an impairment loss is recognized for the difference between the estimated fair value and the carrying value.
During the year ended December 31, 2024, the Company recorded a $0.2 million impairment related to the write-down of installation and service parts that no longer had future use within the operating expenses line item in the Government Solutions segment. During the year ended December 31, 2023, the Company recorded a $4.3 million impairment which included a $3.9 million write-down of installation and service parts that no longer had future use within the operating expenses line item in the Government Solutions segment, and $0.4 million impairment of an ROU asset within the selling, general and administrative expenses line item in the Parking Solutions segment. The Company had $0.7 million of impairment related to certain photo enforcement programs that ended during the year ended December 31, 2022 within the depreciation, amortization and (gain) loss on disposal of assets, net line item on the consolidated statements of operations.
Self-Insurance
The Company is self-insured for medical costs and has stop-loss insurance policies to limit its exposure to individual and aggregate claims made. Liabilities for these programs are estimated based on outstanding claims and claims estimated to be incurred but not yet reported using historical loss experience. These estimates are subject to variability due to changes in trends of losses for outstanding claims and incurred but not reported claims, including external factors such as the number, and cost of claims, benefit level changes and claim settlement patterns.
Warrants
As of December 31, 2022, there were warrants outstanding to acquire 19,999,967 shares of the Company’s Class A Common Stock including: (i) 6,666,666 Private Placement Warrants and (ii) 13,333,301 warrants issued in connection with the initial public offering (the “Public Warrants” and, together with the Private Placement Warrants, the “Warrants”). The Warrants had a five-year term and expired in October 2023, unless they were redeemed or exercised prior to expiration. As of December 31, 2023, all Warrants were either exercised by the holder or redeemed by the Company. See Note 12, Shareholders' Equity, for additional details on warrant exercises.
The Company accounted for warrants as either equity-classified or liability-classified instruments based on an assessment of the warrant’s specific terms and applicable authoritative guidance under Financial Accounting Standards Board (“FASB”) ASC 480, Distinguishing Liabilities from Equity (“ASC 480”) and ASC 815, Derivatives and Hedging (“ASC 815”). The assessment considered whether the warrants were freestanding financial instruments pursuant to ASC 480, met the definition of a liability pursuant to ASC 480, and whether the warrants met all of the requirements for equity classification under ASC 815, including whether the warrants were indexed to the Company’s own common shares, among other conditions for equity classification.
For warrants that met all of the criteria for equity classification, the warrants were required to be recorded as a component of additional paid-in capital at the time of issuance. Warrants that did not meet all the criteria for equity classification were recorded at their initial fair value on the date of issuance, and each balance sheet date thereafter. Changes in the estimated fair value of the warrants were recognized as a non-cash gain or loss on the consolidated statements of operations. The Company’s Public Warrants met the criteria for equity classification and accordingly, were reported as a component of stockholders’ equity while the Company’s Private Placement Warrants were classified as a liability. The fair value of the Private Placement Warrants was estimated at period-end using a Black-Scholes option pricing model. Shares issuable under the Warrants were considered for inclusion in the diluted share count in accordance with GAAP.
Interest Rate Swap
In December 2022, the Company entered into a cancellable interest rate swap agreement to hedge its exposure to interest rate fluctuations associated with the LIBOR (now transitioned to Term Secured Overnight Financing Rate, “SOFR”) portion of the variable interest rate on its 2021 Term Loan. Under the interest rate swap agreement, the Company paid a fixed rate of 5.17% and the counterparty paid a variable interest rate. The Company entered into an International Swaps and Derivatives Association, Inc. Master Agreement with the counterparty which provided for the net settlement of all, or a specified group, of derivative transactions through a single payment. The notional amount on the interest rate swap was $675.0 million. The Company had the option to effectively terminate the interest rate swap agreement starting in December 2023, and monthly thereafter until December 2025. The Company treated the interest rate swap as an economic hedge for accounting purposes and any changes in the fair value of the derivative instrument (including accrued interest) and related cash receipts or payments were recorded in the consolidated statements of operations within the loss (gain) on interest rate swap line item. The Company exercised its option to cancel the interest rate swap agreement during the third quarter of fiscal year 2024.
The following details the components of the loss (gain) on interest rate swap for the respective periods:
| | | | | | | | | | | | |
| | For the Year Ended December 31, | |
($ in thousands) | | 2024 | | | 2023 | | | 2022 | |
Change in fair value | | $ | 1,316 | | | $ | (320 | ) | | $ | (996 | ) |
Cash (receipts) payments | | | (822 | ) | | | 1,137 | | | | — | |
Total loss (gain) on interest rate swap | | $ | 494 | | | $ | 817 | | | $ | (996 | ) |
The effect of remeasurement to fair value was recorded within the operating activities section and the monthly cash proceeds received or payments made were recorded within the investing activities section in the consolidated statements of cash flows. See below for further discussion on the fair value measurement of the interest rate swap.
Fair Value of Financial Instruments
ASC Topic 820, Fair Value Measurement, includes a single definition of fair value to be used for financial reporting purposes, provides a framework for applying this definition and for measuring fair value under GAAP, and establishes a fair value hierarchy that categorizes into three levels the inputs to valuation techniques used to measure fair value. The three levels of the fair value hierarchy are summarized as follows:
Level 1 – Fair value is based on observable inputs such as quoted prices for identical assets or liabilities in active markets.
Level 2 – Fair value is determined using quoted prices for similar assets or liabilities in active markets, quoted prices for identical or similar assets or liabilities in markets that are not active or inputs other than quoted prices that are directly or indirectly observable.
Level 3 – Fair value is determined using one or more significant inputs that are unobservable in active markets at the measurement date, such as a pricing model, discounted cash flow, or similar technique.
The carrying amounts reported in the Company’s consolidated balance sheets for cash, accounts receivable, accounts payable and accrued liabilities approximate fair value due to the immediate to short-term maturity of these financial instruments. The estimated fair value of the Company’s long-term debt was calculated based upon available market information. The carrying value and the estimated fair value of long-term debt are as follows:
| | | | | | | | | | | | | | | | | | |
| | Level in | | December 31, 2024 | | | December 31, 2023 | |
| | Fair Value | | Carrying | | | Estimated | | | Carrying | | | Estimated | |
($ in thousands) | | Hierarchy | | Amount | | | Fair Value | | | Amount | | | Fair Value | |
2021 Term Loan | | 2 | | $ | 687,203 | | | $ | 699,916 | | | $ | 691,821 | | | $ | 709,872 | |
Senior Notes | | 2 | | | 347,008 | | | | 341,250 | | | | 346,311 | | | | 335,125 | |
The Company had issued Private Placement Warrants (as discussed above) to acquire shares of its Class A Common Stock in connection with its initial public offering which had a five-year term and expired in October 2023. During fiscal year 2023, all Private Placement Warrants were exercised by the warrant holders.
The following summarizes the changes in fair value of Private Placement Warrant liabilities included in net income and the impact of exercises for the year ended December 31, 2023:
| | | | |
($ in thousands) | | December 31, 2023 | |
Beginning balance | | $ | 24,066 | |
Change in fair value of private placement warrants | | | 24,966 | |
Exercise of warrants | | | (49,032 | ) |
Ending balance | | $ | — | |
The change in fair value of private placement warrants consisted of adjustments related to the unexercised Private Placement Warrants re-measured to fair value at the end of the reporting period and the final mark-to-market adjustments for the exercised warrants. During the year ended December 31, 2023, 6.7 million Private Placement Warrants were exercised, which reduced our Private Placement Warrants liabilities by $49.0 million with an offset to common stock at par value and the remaining to additional paid in capital.
The Company has an equity investment measured at cost with a carrying value of $1.9 million and $2.1 million as December 31, 2024 and 2023 respectively, and is only adjusted to fair value if there are identified events that would indicate a need for an upward or downward adjustment or changes in circumstances that may indicate impairment. The estimation of fair value requires the use of significant unobservable inputs, such as voting rights and obligations in the securities held, and is therefore classified within level 3 of the fair value hierarchy. There were no identified events that required a fair value adjustment during the years ended December 31, 2024 and 2023.
The recurring fair value measurement of the interest rate swap was valued based on observable inputs for similar assets and liabilities including swaption values and other observable inputs for interest rates and yield curves and was classified within level 2 of the fair value hierarchy. The following presents the changes in the fair value of the interest rate swap in the gross balances within the below line items for the respective periods:
| | | | | | | |
($ in thousands) | | December 31, 2024 | | December 31, 2023 | |
Prepaid expenses and other current assets | | | | | |
Beginning balance | | $ | 689 | | $ | — | |
Change in fair value of interest rate swap | | | (689 | ) | | 689 | |
Ending balance | | $ | — | | $ | 689 | |
| | | | | |
Other non-current assets | | | | | |
Beginning balance | | $ | 627 | | $ | 1,973 | |
Change in fair value of interest rate swap | | | (627 | ) | | (1,346 | ) |
Ending balance | | $ | — | | $ | 627 | |
| | | | | |
Accrued liabilities | | | | | |
Beginning balance | | $ | — | | $ | 977 | |
Change in fair value of interest rate swap | | | — | | | (977 | ) |
Ending balance | | $ | — | | $ | — | |
The Company separately classified the current and non-current components based on the value of settlements due within 12 months (current) and greater than 12 months (non-current). The Company exercised its option to cancel the interest rate swap during the third quarter of fiscal year 2024.
Asset Retirement Obligations
The Company records obligations to perform certain retirement activities on camera and speed enforcement systems in the period that the related assets are placed in service. Asset retirement obligations are contractual obligations to restore property to its initial state. These obligations, which are initially estimated based on discounted cash flow estimates, are accreted to full value over time through charges to operating expenses in the consolidated statements of operations. The offsetting asset is capitalized as part of the related asset’s carrying value and is depreciated over the asset’s estimated remaining useful life. When events and circumstances indicate that the original estimates used for asset retirement obligations may need revision, the Company reassesses the assumptions used and adjusts the liability appropriately.
Deferred Financing Costs
Deferred financing costs consist of the costs incurred to obtain long-term financing, including the Company’s credit facilities (see Note 8, Long-Term Debt). These costs, which are a reduction to long-term debt on the consolidated balance sheets, are amortized over the term of the related debt, using the effective interest method for term debt and the straight-line method for revolving credit facilities. Amortization of deferred financing costs for fiscal years 2024, 2023 and 2022 was $4.1 million, $4.7 million and $5.5 million respectively.
Income Taxes
Income tax expense includes U.S and international current and deferred income taxes and interest and penalties on uncertain tax positions. Certain income and expenses are not reported in tax returns and financial statements in the same year. The tax effect of these temporary differences is reported as deferred income taxes. Deferred tax assets are reported net of a valuation allowance when it is more likely than not that a tax benefit will not be realized. All deferred income taxes are classified as long-term on our consolidated balance sheets. See Note 11, Income Taxes, for more information.
Stock-based Compensation
In October 2018, the Company established the Verra Mobility 2018 Equity Incentive Plan which provides for a variety of stock-based awards for issuance to employees and directors. In May 2023, the Company's stockholders approved the Verra Mobility Corporation Amended and Restated 2018 Equity Incentive Plan (the “2018 Plan”), which, among other things, increased the maximum number of shares available for awards by 5,000,000 shares. The Company grants RSUs, stock options and PSUs.
The Company recognizes the fair value of RSUs based on the Company’s common stock price at market close on the date of the grant. The Company uses the Black-Scholes option pricing model to determine the fair value of stock options, and uses the Monte Carlo simulation model to determine the fair value of PSUs containing market conditions. The Black-Scholes model requires an assumption regarding the expected life of the stock option, which the Company estimated to be 6.25 years by applying the short-cut method permitted under SEC Staff Accounting Bulletin No. 110. PSUs granted vest at the end of a three-year period (or ratably over three years for certain grants), which matches the awards’ performance period. RSUs and stock options vest based on the continued service of the recipient. PSUs are issued upon continued service along with the relative satisfaction of a market condition that measures the Company’s total stockholder return relative to a comparably calculated return for a peer group during the performance period or to the Company's absolute total stockholder return. In addition, the Black-Scholes and the Monte Carlo models require assumptions to be made regarding the expected volatility of the Company’s stock price. Stock price volatility is determined by averaging an implied volatility with the measure of historical volatility for stock options and using the historical volatility for PSUs.
The following represents our weighted average assumptions for stock options and PSUs granted for the respective periods:
| | | | | | | | | | | | |
| | For the Year Ended December 31, | |
| | 2024 | | | 2023 | | | 2022 | |
Stock options (1) | | | | | | | | | |
Weighted average expected volatility | | n/a | | | | 38.5 | % | | | 45.1 | % |
Weighted average risk-free interest rate | | n/a | | | | 4.28 | % | | | 2.94 | % |
PSUs | | | | | | | | | |
Weighted average expected volatility | | | 35.2 | % | | | 43.8 | % | | | 48.0 | % |
Weighted average risk-free interest rate | | | 4.26 | % | | | 4.29 | % | | | 2.78 | % |
(1) There were no stock options granted during fiscal year 2024.
Compensation expense for share-based awards is determined based on the grant date fair value. The Company recognizes these compensation costs on a straight-line basis over the requisite service period of the award, which is generally the vesting term of the share-based award. The compensation expense for the PSUs is recognized over the requisite service period regardless of whether the market condition is satisfied. Forfeitures are accounted for as they occur. See Note 13, Equity Incentive Plan, for more information on the Company’s share-based awards.
Revenue Recognition
Nature of Goods and Services
The following is a description of principal activities, separated by reportable segments, from which the Company generates revenue:
Commercial Services. The Commercial Services segment offers toll and violation management solutions for commercial fleet operators, including RACs, Direct Fleets and FMCs. The Company determined its performance obligation is a distinct stand-ready obligation, as there is an unspecified quantity of services provided that does not diminish, and the customer is being charged only when it uses the Company’s services, such as toll payment, title and registration, etc. Payment terms for contracts with commercial fleet and rental car companies vary, but are usually billed as services are performed. The Company recognizes revenue over time based on the number of transactions processed on behalf of customers during the period. It recognizes revenue on a net basis when it acts as an agent in the transaction.
Government Solutions. The Government Solutions segment principally generates revenue by providing complete, end-to-end speed, red-light, school bus stop arm, and bus lane enforcement solutions. Products, when sold, are typically sold together with the services in a bundle for a majority of customers. The average initial term of a contract is three to five years. Payment terms for contracts with government agencies vary depending on whether the consideration is fixed or variable. Payment terms for contracts with fixed consideration are usually based on equal installments over the duration of the contract. Payment terms for contracts with variable consideration are usually billed and collected as citations are issued or paid. Certain mobile speed programs are billed per camera system deployed. In instances when the consideration expected from the customer is subject to variation, any variable consideration affecting revenue recognition is allocated to the distinct period (the monthly period) that it relates to.
•Product sales (sale of camera systems and installation) – the camera systems and related installation services are an integrated solution and are accounted for as a single performance obligation. The revenues for this performance obligation are recognized when control of the product is transferred to the customer.
•Service revenue – the Company provides a suite of services which may include camera maintenance, processing images taken by the camera, forwarding eligible images to the police department and processing payments on behalf of the municipality. The Company concluded that the suite of services as a whole represents one service offering and is a single performance obligation. The service offering is accounted for as a single continuous service. The Company applies the series guidance for those services as it stands ready to deliver those services over the contract period. The Company recognizes revenue from services over time, as they are performed.
Many of the Company’s customer contracts include both product sales and service revenue. The Company applies judgment when determining whether the product sales and service offering are accounted for as combined performance obligation or distinct performance obligations. In contracts where title to the camera system does not transfer to the customer, the Company accounts for the contract as a single, combined performance obligation. This is because the customer receives the right to use the photo enforcement system and the service offering concurrently. For other contracts, the Company accounts for the products and services as distinct performance obligations because the camera systems and the related service solution are both capable of being distinct and are not highly interdependent and interrelated.
In contracts with multiple performance obligations, consideration is allocated between separate products and services in a bundle based on their stand-alone selling prices (“SSP”). The Company estimates the SSP for its product sales using expected cost plus margin. The Company is unable to establish the SSP for its service offering based on observable prices as the services are sold for a wide range of amounts (the selling price is highly variable). As such, the SSP for service offerings included in these contracts is generally determined by applying a residual approach.
Parking Solutions. The T2 Systems business offers an integrated suite of parking software, transaction processing and hardware solutions to its customers. Revenue is derived primarily from the sale of software as a service (“SaaS”) and specialized hardware. For bundled offerings, the Company accounts for individual products and services separately if they are distinct and allocates the transaction price based on the relative SSP. The Company is able to establish the SSP for its product sales based on the observable prices of products sold separately in comparable transactions. For professional services, the Company’s estimate of the standalone selling price is comprised of multiple factors which include a cost plus margin approach and the historical sales price of similar services. The Company is unable to establish the SSP for its software licenses based on observable prices given the same products are sold at a broad range of prices and a representative SSP is not discernible from past transactions or other observable evidence, as such, the SSP for software licenses included in a contract with multiple performance obligations is generally determined by applying a residual approach. The Company’s estimates of SSP are reassessed on a periodic basis or when facts and circumstances change.
•The Company’s hosted parking management software products provide customers the ability to manage access to their parking lots and garages, issue physical or virtual parking permits and manage citations issued through enforcement devices. Revenue derived from these SaaS products is recognized ratably over the contractual service period beginning on the date the service is made available to the customer.
•Service revenue derived from the Company’s professional services is recognized over time as the services are performed. Revenues for fixed-price service projects are generally recognized over time applying input methods to estimate progress to completion.
•Revenue from product sales is recognized at a point in time when a customer takes control of the hardware, which typically occurs when the product is delivered and ownership is transferred to the customer.
Remaining Performance Obligations
Deferred revenue represents amounts that have been invoiced in advance which are expected to be recognized as revenue in future periods, and it primarily relates to the Government Solutions and Parking Solutions customers. As of December 31, 2024 and 2023, the Company had approximately $11.8 million and $13.1 million of deferred revenue in the Government Solutions segment, respectively. During the twelve months ended December 31, 2024 and 2023, the Company recognized $6.7 million and $5.2 million, respectively, of revenue, excluding exchange rate impact, related to amounts that were included in deferred revenue as of December 31, 2023 and 2022. As of December 31, 2024 and 2023, the Company had approximately $21.7 million and $19.7 million of deferred revenue in the Parking Solutions segment, respectively. During the twelve months ended December 31, 2024 and 2023, the Company recognized $18.7 million and $20.7 million, respectively, of revenue related to amounts that were included in deferred revenue as of December 31, 2023 and 2022.
Remaining performance obligations represent the amount of contracted future revenue not yet recognized as the amounts relate to undelivered performance obligations, including both deferred revenue and non-cancelable contracted amounts that will be invoiced and recognized as revenue in future periods. The Company elected the practical expedients to omit disclosure for the amount of the transaction price allocated to remaining performance obligations with original expected contract length of one year or less and the amount that relates to variable consideration allocated to a wholly unsatisfied performance obligation to transfer a distinct good or service within a series of distinct goods or services that form a single performance obligation. As of December 31, 2024, total transaction price allocated to performance obligations in the Government Solutions segment that were unsatisfied or partially unsatisfied was $203.0 million, of which $88.0 million is expected to be recognized as revenue in the next twelve months and the rest over the remaining performance obligation period.
Credit Card Rebates
The Company earns volume rebates from total spend on purchasing cards and recognizes the income in other income, net in the consolidated statements of operations. For the fiscal years ended December 31, 2024, 2023 and 2022, the Company recorded $18.9 million, $17.8 million, and $14.5 million respectively, related to rebates.
Advertising Costs
The Company expenses advertising costs as incurred. Advertising costs for the fiscal years ended December 31, 2024, 2023 and 2022, were $1.6 million, $1.1 million and $1.0 million, respectively, and were included in selling, general, and administrative expenses in the consolidated statements of operations.
Foreign Currency
Assets and liabilities denominated in foreign currencies that differ from their functional currencies are re-measured at the exchange rate on the balance sheet date. The foreign currency effect of the re-measurement is included in other income, net in the consolidated statements of operations. The impact of foreign currency re-measurement was losses of $0.4 million, $1.7 million and $0.7 million for the fiscal years ended December 31, 2024, 2023 and 2022, respectively.
The assets and liabilities of our foreign subsidiaries whose functional currency is not the U.S. dollar are translated into U.S. dollars at current exchange rates while revenue and expenses are translated from functional currencies at average monthly exchange rates. The resulting translation adjustments are recorded in accumulated other comprehensive loss in stockholders’ equity.
Recent Accounting Pronouncements
Accounting Standards Adopted
In November 2023, the Financial Accounting Standards Board (the “FASB”) issued Accounting Standards Update (“ASU”) 2023-07, Segment Reporting (Topic 280): Improvements to Reportable Segment Disclosures. The ASU was intended to enhance disclosure related to significant segment expenses regularly provided to the Chief Operating Decision Maker (“CODM”), amounts presented as “other” within segment profit (loss), require that all annual disclosures are also reported for interim periods, further define the CODM and how they use segment profit (loss) to allocate resources, and require that entities with only a single reportable segment provide all required segment disclosures. The Company adopted this standard as of December 31, 2024 which included providing relevant disclosures within Note 17, Segment Reporting; however, there were no other impacts from the adoption of this standard.
In June 2022, the FASB issued ASU 2022-03, Fair Value Measurement (Topic 820): Fair Value Measurement of Equity Securities Subject to Contractual Sale Restrictions. The ASU clarified that a contractual restriction on the sale of an equity security is not considered part of the unit of account of the equity security and, therefore, is not considered in measuring fair value. It also required entities with investments in equity securities subject to contractual sale restrictions to disclose certain qualitative and quantitative information about such securities. The Company adopted this standard as of January 1, 2024. The adoption of this standard did not have an impact on the Company's financial statements or disclosures.
Accounting Standards Not Yet Adopted
In December 2023, the FASB issued ASU 2023-09, Income Taxes (Topic 740): Improvements to Income Tax Disclosures. The ASU requires companies to disclose specific categories in the rate reconciliation, provide additional disclosure for reconciling items that exceed proscribed thresholds, and enhance disclosure regarding income taxes paid and sources of income (loss) from continuing operations including the tax expense (or benefit) disaggregated by federal, state and foreign taxes. The guidance is effective for fiscal years beginning after December 15, 2024. The Company is currently evaluating the impact of this standard on its financial statements and disclosures.
In November 2024, the FASB issued ASU 2024-03, Income Statement- Reporting Comprehensive Income- Expense Disaggregation Disclosures (Subtopic 220-40): Disaggregation of Income Statement Expenses. The ASU requires public companies to disclose, in the notes to financial statements, specified information about certain costs and expenses at each interim and annual reporting period at a disaggregated level. The guidance is effective for fiscal years beginning after December 15, 2026 and interim periods within fiscal years beginning after December 15, 2027. Early adoption is permitted. The Company is currently evaluating the impact of this standard on its financial statements and disclosures.
3.Prepaid Expenses and Other Current Assets
Prepaid expenses and other current assets consist of the following at December 31:
| | | | | | | | |
($ in thousands) | | 2024 | | | 2023 | |
Prepaid services | | $ | 17,359 | | | $ | 17,271 | |
Prepaid tolls | | | 8,751 | | | | 9,174 | |
Costs to fulfill a customer contract | | | 3,710 | | | | 5,852 | |
Income taxes receivable | | | 3,063 | | | | 9,830 | |
Deposits | | | 3,057 | | | | 2,322 | |
Prepaid insurance | | | 2,304 | | | | 1,755 | |
Other | | | 4,403 | | | | 757 | |
Total prepaid expenses and other current assets | | $ | 42,647 | | | $ | 46,961 | |
4.Property and Equipment, Net
Property and equipment, net, consists of the following at December 31:
| | | | | | | | |
($ in thousands) | | 2024 | | | 2023 | |
Equipment | | $ | 211,213 | | | $ | 159,151 | |
Software | | | 61,183 | | | | 37,415 | |
Leasehold improvements | | | 12,287 | | | | 10,031 | |
Computer equipment | | | 22,411 | | | | 21,415 | |
Furniture | | | 2,464 | | | | 2,651 | |
Automobiles | | | 15,248 | | | | 14,422 | |
Construction in progress | | | 15,053 | | | | 17,781 | |
Property and equipment | | | 339,859 | | | | 262,866 | |
Less: accumulated depreciation | | | (198,258 | ) | | | (139,618 | ) |
Property and equipment, net | | $ | 141,601 | | | $ | 123,248 | |
Depreciation expense was $41.4 million, $35.2 million and $32.2 million for the fiscal years ended December 31, 2024, 2023 and 2022, respectively.
5.Goodwill and Intangible Assets
The following table presents the changes in the carrying amount of goodwill by reportable segment:
| | | | | | | | | | | | | | | | |
| | Commercial | | | Government | | | Parking | | | | |
($ in thousands) | | Services | | | Solutions | | | Solutions | | | Total | |
Balance at December 31, 2022 | | $ | 419,720 | | | $ | 214,618 | | | $ | 199,142 | | | $ | 833,480 | |
Foreign currency translation adjustment | | | 2,371 | | | | (16 | ) | | | — | | | | 2,355 | |
Balance at December 31, 2023 | | | 422,091 | | | | 214,602 | | | | 199,142 | | | | 835,835 | |
Goodwill impairment (1) | | | — | | | | — | | | | (97,076 | ) | | | (97,076 | ) |
Foreign currency translation adjustment | | | (1,924 | ) | | | (1,220 | ) | | | — | | | | (3,144 | ) |
Balance at December 31, 2024 | | $ | 420,167 | | | $ | 213,382 | | | $ | 102,066 | | | $ | 735,615 | |
(1) The Company recorded an impairment to goodwill in its Parking Solutions segment during fiscal year 2024, refer to Note 2, Significant Accounting Policies, for additional information.
Intangible assets consist of the following as of the respective period-ends:
| | | | | | | | | | | | |
| | Weighted | | Weighted | | At December 31, 2024 | |
| | Average | | Average | | Gross | | | | |
| | Remaining | | Amortization | | Carrying | | | Accumulated | |
($ in thousands) | | Useful Life | | Period | | Amount | | | Amortization | |
Trademarks | | 5.2 years | | 8.8 years | | $ | 4,667 | | | $ | 1,972 | |
Patent | | 3.8 years | | 5.0 years | | | 500 | | | | 117 | |
Customer relationships | | 3.5 years | | 9.3 years | | | 557,958 | | | | 348,138 | |
Developed technology | | 3.9 years | | 7.2 years | | | 38,659 | | | | 19,260 | |
Gross carrying value of intangible assets | | | | | | | 601,784 | | | $ | 369,487 | |
Less: accumulated amortization | | | | | | | (369,487 | ) | | | |
Intangible assets, net | | | | | | $ | 232,297 | | | | |
| | | | | | | | | | | | |
| | Weighted | | Weighted | | At December 31, 2023 | |
| | Average | | Average | | Gross | | | | |
| | Remaining | | Amortization | | Carrying | | | Accumulated | |
($ in thousands) | | Useful Life | | Period | | Amount | | | Amortization | |
Trademarks | | 0.3 years | | 3.7 years | | $ | 36,190 | | | $ | 32,882 | |
Patent | | 4.8 years | | 5.0 years | | | 500 | | | | 17 | |
Non-compete agreements | | 0.0 years | | 5.0 years | | | 62,540 | | | | 62,540 | |
Customer relationships | | 4.5 years | | 9.3 years | | | 558,801 | | | | 288,065 | |
Developed technology | | 0.8 years | | 5.8 years | | | 201,657 | | | | 175,159 | |
Gross carrying value of intangible assets | | | | | | | 859,688 | | | $ | 558,663 | |
Less: accumulated amortization | | | | | | | (558,663 | ) | | | |
Intangible assets, net | | | | | | $ | 301,025 | | | | |
Amortization expense was $67.0 million, $77.6 million and $106.2 million for fiscal years ended December 31, 2024, 2023 and 2022, respectively.
Estimated amortization expense in future years is expected to be:
| | | | |
($ in thousands) | | | |
2025 | | $ | 64,164 | |
2026 | | | 57,244 | |
2027 | | | 28,229 | |
2028 | | | 22,316 | |
2029 | | | 21,419 | |
Thereafter | | | 38,925 | |
Total | | $ | 232,297 | |
Accrued liabilities consist of the following at December 31:
| | | | | | | | |
($ in thousands) | | 2024 | | | 2023 | |
Accrued salaries and wages | | $ | 34,310 | | | $ | 27,905 | |
Current deferred tax liabilities | | | 7,650 | | | | 7,574 | |
Current portion of operating lease liabilities | | | 6,925 | | | | 7,133 | |
Accrued interest payable | | | 4,211 | | | | 4,594 | |
Advanced deposits | | | 2,993 | | | | 2,308 | |
Restricted cash due to customers | | | 2,858 | | | | 2,835 | |
Self-insurance liability | | | 1,271 | | | | 1,802 | |
Accrued legal settlement | | | — | | | | 31,500 | |
Other | | | 13,762 | | | | 7,468 | |
Total accrued liabilities | | $ | 73,980 | | | $ | 93,119 | |
7.Asset Retirement Obligations
The following summarizes the changes in the Company’s asset retirement obligations for the years ended December 31:
| | | | | | | | |
| | | | | | |
($ in thousands) | | 2024 | | | 2023 | |
Asset retirement obligations, beginning balance | | $ | 14,580 | | | $ | 12,993 | |
Liabilities incurred | | | 1,419 | | | | 1,176 | |
Accretion expense | | | 678 | | | | 760 | |
Liabilities settled | | | (1,184 | ) | | | (349 | ) |
Asset retirement obligations, ending balance | | $ | 15,493 | | | $ | 14,580 | |
The following table provides a summary of the Company’s long-term debt at December 31:
| | | | | | | | |
($ in thousands) | | 2024 | | | 2023 | |
2021 Term Loan, due 2028 | | $ | 695,568 | | | $ | 704,587 | |
Senior Notes, due 2029 | | | 350,000 | | | | 350,000 | |
Less: original issue discounts | | | (2,322 | ) | | | (3,646 | ) |
Less: unamortized deferred financing costs | | | (9,035 | ) | | | (12,809 | ) |
Total long-term debt | | | 1,034,211 | | | | 1,038,132 | |
Less: current portion of long-term debt | | | — | | | | (9,019 | ) |
Total long-term debt, net of current portion | | $ | 1,034,211 | | | $ | 1,029,113 | |
The following table presents the aggregate principal and interest payments in future years on long-term debt as of December 31, 2024:
| | | | | | | | |
($ in thousands) | | Principal | | | Interest (1) | |
2025 | | $ | — | | | $ | 65,845 | |
2026 | | | — | | | | 65,845 | |
2027 | | | — | | | | 65,844 | |
2028 | | | 695,568 | | | | 29,973 | |
2029 | | | 350,000 | | | | 5,561 | |
Total | | $ | 1,045,568 | | | $ | 233,068 | |
(1) The variable interest rate in effect as of December 31, 2024 was used to calculate interest payments for the 2021 Term Loan.
2021 Term Loan
In March 2021, VM Consolidated, Inc. (“VM Consolidated”), the Company’s wholly owned subsidiary, entered into an Amendment and Restatement Agreement No.1 to the First Lien Term Loan Credit Agreement (the “2021 Term Loan”) with a syndicate of lenders. The 2021 Term Loan has an aggregate borrowing of $900.0 million, maturing on March 24, 2028. In connection with the 2021 Term Loan borrowings, the Company had $4.6 million of offering discount costs and $4.5 million in deferred financing costs, both of which were capitalized and are being amortized over the remaining life of the 2021 Term Loan.
In February 2024, VM Consolidated entered into a third amendment (the “Third Amendment”) and in October 2024, a fourth amendment (the “Fourth Amendment”) to refinance the 2021 Term Loan (the “Refinancing Transactions”). Pursuant to the Third and Fourth Amendments, the interest rate was reduced by an aggregate 1.00% to SOFR plus 2.25% from SOFR plus 3.25%, with the SOFR floor unchanged at 0.00%. The credit spread adjustment, ranging from 0.11448% to 0.71513%, was eliminated. In addition, the 2021 Term Loan no longer contains a provision for principal repayments which were previously required to be paid in quarterly installments. The Company evaluated the Refinancing Transactions on a lender-by-lender basis and accounted accordingly for debt extinguishment and debt modification costs (for the portion of the transactions that did not meet the accounting criteria for debt extinguishment).
During fiscal years 2024 and 2023, the Company made early repayments of $9.0 million and $172.5 million, respectively, on the 2021 Term Loan and as a result, the total principal outstanding was $695.6 million as of December 31, 2024.
The Company recorded $1.7 million of loss on extinguishment of debt during the fiscal year ended December 31, 2024 primarily related to the write-off of pre-existing deferred financing costs and discounts in connection with the Refinancing Transactions. It recognized a loss on extinguishment of debt of $3.5 million for the fiscal year ended December 31, 2023, related to the write-off of pre-existing deferred financing costs and discounts in connection with the early repayments.
The 2021 Term Loan bears interest based at the Company’s option, on either (i) Term SOFR plus an applicable margin of 2.25% per annum, or (ii) an alternate base rate plus an applicable margin of 1.25% per annum. As of December 31, 2024, the interest rate on the 2021 Term Loan was 6.6%.
In addition, the 2021 Term Loan requires mandatory prepayments equal to the product of the excess cash flows of the Company (as defined in the 2021 Term Loan agreement) and the applicable prepayment percentages (calculated as of the last day of the fiscal year), as set forth in the following table:
| | |
Consolidated First Lien Net Leverage Ratio (As Defined by the 2021 Term Loan Agreement) | | Applicable
Prepayment
Percentage |
> 3.70:1.00 | | 50% |
< 3.70:1.00 and > 3.20:1.00 | | 25% |
< 3.20:1.00 | | 0% |
The Company did not have mandatory prepayments of excess cash flows for the fiscal years ended December 31, 2024 or 2023.
Senior Notes
In March 2021, VM Consolidated issued an aggregate principal amount of $350.0 million in Senior Unsecured Notes (the “Senior Notes”), due on April 15, 2029. In connection with the issuance of the Senior Notes, the Company incurred $5.7 million in lender and third-party costs, which were capitalized as deferred financing costs and are being amortized over the remaining life of the Senior Notes.
Interest on the Senior Notes is fixed at 5.50% per annum and is payable on April 15 and October 15 of each year. The Company may redeem all or a portion of the Senior Notes at the redemption prices set forth below in percentages by year, plus accrued and unpaid interest:
| | |
Year |
| Percentage |
2025 |
| 101.375% |
2026 and thereafter |
| 100.000% |
PPP Loan
During fiscal year 2020, one of the Company's wholly owned subsidiaries received a $2.9 million loan from the U.S. Small Business Administration (“SBA”) as part of the Paycheck Protection Program (“PPP Loan”) to offset certain employment and other allowable costs incurred as a result of the COVID-19 pandemic. In 2022, the Company was notified by the SBA that the loan, together with accrued interest, had been fully forgiven under the provisions of the PPP Loan program. Accordingly, the Company recognized a $3.0 million gain on extinguishment of debt in the consolidated statements of operations for the year ended December 31, 2022.
The Revolver
The Company has a Revolving Credit Agreement (the “Revolver”) with a commitment of up to $75.0 million available for loans and letters of credit. The Revolver matures on December 18, 2026. Borrowing eligibility under the Revolver is subject to a monthly borrowing base calculation based on (i) certain percentages of eligible accounts receivable and inventory, less (ii) certain reserve items, including outstanding letters of credit and other reserves. The Revolver bears interest on either (1) Term SOFR plus an applicable margin, or (2) an alternate base rate, plus an applicable margin. The margin percentage applied to (1) Term SOFR is either 1.25%, 1.50%, or 1.75%, or (2) the base rate is either 0.25%, 0.50%, or 0.75%, depending on the Company’s average availability to borrow under the commitment. There is a credit spread adjustment of 0.10% for a one-month duration, 0.15% for a three-month duration, and 0.25% for a six-month duration, in addition to Term SOFR and the applicable margin percentages. There were no outstanding borrowings on the Revolver as of December 31, 2024 or 2023. The availability to borrow was $74.4 million, net of $0.6 million of outstanding letters of credit at December 31, 2024.
Interest on the unused portion of the Revolver is payable quarterly at 0.375% and the Company is also required to pay participation and fronting fees at 1.38% on $0.6 million of outstanding letters of credit as of December 31, 2024.
All borrowings and other extensions of credits under the 2021 Term Loan, Senior Notes and the Revolver are subject to the satisfaction of customary conditions and restrictive covenants including absence of defaults and accuracy in material respects of representations and warranties. Substantially all of the Company’s assets are pledged as collateral to secure the Company’s indebtedness under the 2021 Term Loan. At December 31, 2024, the Company was compliant with all debt covenants in its debt agreements.
Interest Expense, Net
The Company recorded interest expense, including amortization of deferred financing costs and discounts, of $73.9 million, $86.7 million and $69.4 million for the fiscal years ended December 31, 2024, 2023 and 2022 respectively.
The weighted average effective interest rates on the Company’s outstanding borrowings were 6.2% and 7.7% at December 31, 2024 and 2023, respectively.
The Company’s operating leases primarily consist of office, equipment and vehicle leases expiring at various dates through April 2035. The Company has lease agreements with lease and non-lease components and has elected to account for such components as a single lease component. The Company measures and recognizes contracts containing a lease and determines lease classification at commencement. Right of use operating assets and lease liabilities are measured based on the estimated present value of lease payments over the lease term. In determining the present value of lease payments, the Company uses its estimated incremental borrowing rate when the rate implicit in the lease cannot be readily determined. The estimated incremental borrowing rate is based upon information available at lease commencement including publicly available data for debt instruments. The lease term includes periods covered by options to extend when it is reasonably certain the Company will exercise such options as well as periods subsequent to an option to terminate the lease if it is reasonably certain the Company will not exercise the termination option. Certain of the lease agreements have rent abatement and escalating rental payment provisions. Operating lease costs are recognized on a straight-line basis over the lease term. Variable lease costs are recognized as incurred. The Company’s lease agreements do not contain any material residual value guarantees or restrictive covenants. The Company does not have material short-term leases and does not engage in material subleasing activities.
As of December 31, 2024 and 2023, operating leases had a remaining weighted average lease term of 7.5 years and 8.0 years, respectively, and operating lease liabilities were measured using a weighted average discount rate of 5.8% and 5.4%, respectively. The total operating lease costs for the fiscal years ended December 31, 2024, 2023 and 2022 were $9.3 million, $9.5 million and $8.8 million, respectively. Variable lease costs for fiscal years ended December 31, 2024, 2023 and 2022 were approximately $3.8 million, $2.7 million and $1.5 million, respectively. Finance leases for the Company were not material.
The following is a summary of the operating lease liabilities as of December 31:
| | | | | | | | |
($ in thousands) | | 2024 | | | 2023 | |
Operating lease liabilities, net of current portion | | $ | 25,757 | | | $ | 29,124 | |
Current portion | | | 6,925 | | | | 7,133 | |
Total operating lease liabilities | | $ | 32,682 | | | $ | 36,257 | |
The following provides future maturities of operating lease liabilities as of December 31, 2024:
| | | | |
($ in thousands) | | | |
2025 | | $ | 8,551 | |
2026 | | | 5,962 | |
2027 | | | 4,486 | |
2028 | | | 3,145 | |
2029 | | | 3,049 | |
Thereafter | | | 15,174 | |
Total minimum payments | | | 40,367 | |
Less: amount representing interest | | | (7,685 | ) |
Total | | $ | 32,682 | |
Basic net income per share is calculated by dividing net income by the weighted average shares outstanding during the period, without consideration of common stock equivalents. Diluted net income per share is calculated by adjusting the weighted average shares outstanding for the dilutive effect of common stock equivalents outstanding for the period, determined using the treasury-stock method.
The components of basic and diluted net income per share are as follows:
| | | | | | | | | | | | |
| | For the Year Ended December 31, | |
(In thousands, except per share data) | | 2024 | | | 2023 | | | 2022 | |
Numerator: | | | | | | | | | |
Net income | | $ | 31,448 | | | $ | 57,015 | | | $ | 92,475 | |
Denominator: | | | | | | | | | |
Weighted average shares - basic | | | 165,090 | | | | 158,777 | | | | 152,848 | |
Common stock equivalents | | | 2,627 | | | | 1,240 | | | | 6,178 | |
Weighted average shares - diluted | | | 167,717 | | | | 160,017 | | | | 159,026 | |
Net income per share - basic | | $ | 0.19 | | | $ | 0.36 | | | $ | 0.61 | |
Net income per share - diluted | | $ | 0.19 | | | $ | 0.36 | | | $ | 0.50 | |
Antidilutive shares excluded from diluted net income per share: | | | | | | | | | |
Contingently issuable shares (1) | | | — | | | | — | | | | 5,000 | |
ASR shares (2) | | | 952 | | | | 566 | | | | — | |
Non-qualified stock options | | | — | | | | 222 | | | | 1,149 | |
Performance share units | | | 12 | | | | 22 | | | | 157 | |
Restricted stock units | | | 23 | | | | 219 | | | | 742 | |
Total antidilutive shares excluded | | | 987 | | | | 1,029 | | | | 7,048 | |
(1) Contingently issuable shares related to the earn-out agreement as discussed in Note 15, Other Transactions.
(2) This represents the number of additional estimated shares the counterparties to the Company’s accelerated share repurchase (“ASR”) agreements initiated in 2024 and 2023, respectively, would have been required to deliver had the ASRs been settled as of December 31, 2024 and 2023, respectively. The final settlement for the 2024 ASR is expected to occur in the first quarter of 2025. The final settlement of the 2023 ASR occurred in the first quarter of 2024, at which time, the Company received 534,499 additional shares.
Income before income taxes consisted of the following:
| | | | | | | | | | | | | |
| | For the Year Ended December 31, | | |
($ in thousands) | | 2024 | | | 2023 | | | 2022 | | |
U.S. | | $ | 114,296 | | | $ | 92,425 | | | $ | 140,858 | | |
Foreign | | | (35,188 | ) | | | (5,428 | ) | | | (13,750 | ) | |
Total income before incomes taxes | | $ | 79,108 | | | $ | 86,997 | | | $ | 127,108 | | |
The income tax provision consisted of the following:
| | | | | | | | | | | | |
| | For the Year Ended December 31, | |
($ in thousands) | | 2024 | | | 2023 | | | 2022 | |
Current | | | | | | | | | |
Federal | | $ | 40,381 | | | $ | 38,109 | | | $ | 34,071 | |
State | | | 16,964 | | | | 15,794 | | | | 14,779 | |
Foreign | | | 329 | | | | 3,113 | | | | 1,777 | |
Total current | | | 57,674 | | | | 57,016 | | | | 50,627 | |
Deferred | | | | | | | | | |
Federal | | | (5,696 | ) | | | (16,522 | ) | | | (8,069 | ) |
State | | | (1,697 | ) | | | (6,335 | ) | | | (4,863 | ) |
Foreign | | | (2,621 | ) | | | (4,177 | ) | | | (3,062 | ) |
Total deferred | | | (10,014 | ) | | | (27,034 | ) | | | (15,994 | ) |
Income tax provision | | $ | 47,660 | | | $ | 29,982 | | | $ | 34,633 | |
A reconciliation to the income tax provision from the amounts computed by applying the statutory U.S. federal income tax rate is as follows:
| | | | | | | | | | | | |
| | For the Year Ended December 31, | |
($ in thousands) | | 2024 | | | 2023 | | | 2022 | |
Income tax provision at statutory rate | | $ | 16,612 | | | $ | 18,270 | | | $ | 26,693 | |
State income taxes, net of federal income tax effect | | | 11,032 | | | | 7,762 | | | | 8,588 | |
162(m) limitation | | | 1,790 | | | | 1,000 | | | | 1,766 | |
Non-deductible expenses | | | 1,365 | | | | 49 | | | | 30 | |
Stock-based compensation | | | (102 | ) | | | 796 | | | | (545 | ) |
Unrecognized tax benefits | | | 2,593 | | | | 1,831 | | | | 1,215 | |
Goodwill impairment | | | 18,091 | | | | — | | | | — | |
Tax impact for change in fair value of warrants | | | — | | | | 5,243 | | | | (3,024 | ) |
Change in valuation allowance | | | (1,466 | ) | | | 297 | | | | 1,429 | |
Research and development credits | | | (2,713 | ) | | | (1,032 | ) | | | (517 | ) |
Tax receivable agreement imputed interest | | | — | | | | (3,641 | ) | | | — | |
Other | | | 458 | | | | (593 | ) | | | (1,002 | ) |
Total income tax provision | | $ | 47,660 | | | $ | 29,982 | | | $ | 34,633 | |
Significant components of the Company’s deferred income tax assets and liabilities consist of the following at December 31:
| | | | | | | | |
($ in thousands) | | 2024 | | | 2023 | |
Deferred tax assets: | | | | | | |
Accrued expenses and other | | $ | 6,279 | | | $ | 12,649 | |
Allowance for credit losses | | | 14,237 | | | | 7,894 | |
Net operating loss carryforward | | | 12,238 | | | | 16,489 | |
Interest expense limitation carryforward | | | 3,566 | | | | 5,656 | |
Federal and state income tax credits | | | 3,808 | | | | 4,446 | |
ASC 842 operating lease liabilities | | | 8,428 | | | | 10,005 | |
R&D Section 174 capitalization | | | 16,178 | | | | 9,235 | |
Stock compensation | | | 3,410 | | | | 2,655 | |
Tax receivable agreement imputed interest | | | 3,479 | | | | 3,641 | |
Transaction costs | | | 228 | | | | 305 | |
Other | | | 2,352 | | | | 1,252 | |
Gross deferred tax assets | | | 74,203 | | | | 74,227 | |
Valuation allowance | | | (5,542 | ) | | | (7,011 | ) |
Deferred tax assets, net of valuation allowance | | | 68,661 | | | | 67,216 | |
Deferred tax liabilities: | | | | | | |
Intangible assets and transaction costs | | | (23,030 | ) | | | (31,663 | ) |
Property and equipment | | | (12,975 | ) | | | (13,719 | ) |
Financing costs | | | (1,975 | ) | | | (1,206 | ) |
Prepaid assets | | | (3,023 | ) | | | (2,255 | ) |
ASC 842 operating lease assets | | | (7,687 | ) | | | (9,255 | ) |
Gross deferred tax liabilities | | | (48,690 | ) | | | (58,098 | ) |
Total deferred tax assets, net | | $ | 19,971 | | | $ | 9,118 | |
As of December 31, 2024 and 2023, the Company presented $34.7 million and $27.5 million, respectively, of deferred tax assets, net, to reflect U.S. entity deferred taxes within other non-current assets in the Company's consolidated balance sheets.
As of December 31, 2024, the Company has provided income taxes on the earnings of foreign subsidiaries, except to the extent such earnings are considered indefinitely reinvested. The amount of the unrecognized deferred tax liability related to these temporary differences is approximately $0.8 million.
In accordance with ASC 740, Income Taxes, deferred tax assets are reduced by a valuation allowance if it is more likely than not that some portion or all of the deferred tax assets will not be realized. The realization of deferred tax assets can be affected by, among other things, the nature, frequency and severity of current and cumulative losses, forecasts of future profitability, limitations on the use of acquired tax attributes due to an ownership change under IRC section 382, the length of statutory carryforward periods, the Company’s experience with utilizing operating losses and tax credit carryforwards by jurisdiction, and tax planning alternatives and strategies that may be available.
The Company performed an analysis of the reversal of the deferred tax assets and considered the overall business environment, historical earnings, the outlook for future years and the impact of limitations on the use of acquired tax attributes due to an ownership change under IRC section 382. The Company determined that it is more likely than not that the benefit from certain foreign net operating loss carryforwards will not be realized as of the years ended December 31, 2024 and 2023, and as such provided a valuation allowance of $5.5 million and $7.0 million, respectively. The valuation allowance could be adjusted in future periods if estimates of future taxable income during the carryforward period are increased or if objective negative evidence in the form of cumulative losses is no longer present.
The net operating loss carryforwards represent $103.0 million and $118.0 million of federal, state and foreign net operating losses at December 31, 2024 and 2023, respectively. The federal net operating loss carryforward at December 31, 2024 consists of $13.0 million of losses that were generated after 2017 with no expiration date. The Company also has certain tax credits of $3.8 million and $4.2 million at December 31, 2024 and 2023, respectively, which if unused will begin to expire in 2025.
The following table summarizes the activity related to the Company’s unrecognized tax benefits as of December 31:
| | | | | | | | |
($ in thousands) | | 2024 | | | 2023 | |
Balance at the beginning of the year | | $ | 16,157 | | | $ | 10,675 | |
Increases/(decreases) related to current year tax positions | | | 867 | | | | 5,401 | |
Increases/(decreases) related to prior year tax positions | | | 491 | | | | 592 | |
Expiration due to statute of limitations | | | (230 | ) | | | (511 | ) |
Balance at the end of the year | | $ | 17,285 | | | $ | 16,157 | |
Included in the balance of unrecognized tax benefits as of December 31, 2024 were $9.3 million of tax benefits that, if recognized, would impact the effective tax rate. The Company believes it is reasonably possible that unrecognized tax benefits will decrease by up to $6.1 million within the coming year due to prior year tax positions related to tax elections for certain U.S. legal entities.
The Company recognizes interest and penalties related to unrecognized tax benefits as income tax expense. The Company recognized $1.0 million for fiscal year 2024 and $0.7 million for fiscal year 2023 in interest and penalties. The Company had accrued interest and penalties of $2.2 million and $1.2 million at December 31, 2024 and 2023, respectively. The Company accounts for uncertain tax positions by recognizing the financial statement effects of a tax position only when, based on technical merits, it is more likely than not that the tax position will be sustained under examination.
The Company is subject to examination by the Internal Revenue Service and taxing authorities in various jurisdictions. The Company files U.S. federal and various foreign income tax returns which are subject to examination by the taxing authorities in the respective jurisdictions, generally for three or four years after they are filed. The Company’s state income tax returns are generally no longer subject to income tax examination by tax authorities prior to 2020; however, the Company’s net operating loss carryforwards and research credit carryforwards arising prior to that year are subject to adjustment. The Company is currently under audit by various state tax jurisdictions for the years 2018 through 2020; however, no material adjustments are anticipated. The Company regularly assesses the likelihood of tax deficiencies in each of the tax jurisdictions and, accordingly, makes appropriate adjustments to the tax provision as deemed necessary.
The Company’s Amended and Restated Certificate of Incorporation authorizes the issuance of 261,000,000 shares of capital stock, consisting of (i) 260,000,000 shares of Class A Common Stock, and (ii) 1,000,000 shares of preferred stock, each at par value of $0.0001 per share. The outstanding shares of the Company’s common stock are duly authorized, validly issued, fully paid and non-assessable.
Warrants
All warrants that were outstanding to acquire shares of the Company’s Class A Common Stock, including Public and Private Placement Warrants, were either exercised by the holder or redeemed by the Company as of December 31, 2023.
During the fiscal year ended December 31, 2023, the Company processed the exercise of 20.0 million Warrants in exchange for the issuance of 16,273,406 shares of Class A Common Stock. There were 14,035,449 shares issued in exchange for cash-basis warrant exercises resulting in the receipt of $161.4 million in cash proceeds as of December 31, 2023. The remaining Warrant exercises were completed on a cashless basis. In addition, the Company redeemed 634 Public Warrants at a price of $0.01 per warrant pursuant to the terms of the warrant agreement governing the Public Warrants.
Share Repurchases and Retirement - 2022
In May 2022, the Company’s Board of Directors authorized a share repurchase program for up to an aggregate amount of $125.0 million of its outstanding shares of Class A Common Stock over a twelve-month period. The Company repurchased a total of 7.9 million shares through ASRs and open market transactions during fiscal year 2022. The Company accounted for each ASR transaction as a common stock repurchase and a forward contract indexed to its own common stock. The Company determined that the equity classification criteria was met for the forward contracts, therefore, it did not account for them as derivative instruments.
The Company paid a total of $125.0 million for shares repurchases and $0.1 million for direct costs during the year ended December 31, 2022 and accounted for the transactions by deducting the par value from the common stock, reducing $15.9 million from additional paid-in capital calculated using an average share price, and by increasing accumulated deficit for the remaining cost of $109.1 million.
Share Repurchases and Retirement - 2023
In November 2022, the Company’s Board of Directors authorized a share repurchase program for up to an aggregate amount of $100.0 million of the Company's outstanding shares of Class A Common Stock over an 18-month period.
The Company paid $8.1 million to repurchase 449,432 shares of its Class A Common Stock through open market transactions during the third quarter of fiscal year 2023, which it subsequently retired. On September 5, 2023, the Company used the remaining availability under the share repurchase program for an ASR and paid approximately $91.9 million to receive an initial delivery of 4,131,551 shares of its Class A Common Stock in accordance with an ASR agreement with a third-party financial institution. The final settlement occurred on January 12, 2024, at which time, the Company received 534,499 additional shares calculated using a volume-weighted average price over the term of the ASR agreement. The Company accounted for the ASR as a common stock repurchase and a forward contract indexed to its own common stock. The Company determined that the equity classification criteria was met for the forward contract, therefore, it did not account for it as a derivative instrument.
The Company paid a total of $100.0 million for share repurchases during the year ended December 31, 2023, and accounted for the transactions by deducting the par value from common stock, reducing $15.2 million from additional paid-in capital calculated using an average share price, and by increasing accumulated deficit for the remaining cost of $84.8 million.
Share Repurchases and Retirement - 2024
In October 2023, the Company’s Board of Directors authorized a new share repurchase program for up to an aggregate amount of $100.0 million of its outstanding shares of Class A Common Stock over an 18-month period in open market, ASR or privately negotiated transactions.
In June 2024, the Company entered into a share repurchase agreement with a stockholder, pursuant to which the Company repurchased, directly from the stockholder, 2.0 million shares of the Company’s Class A Common Stock for an aggregate purchase price of $51.5 million. During the fourth quarter of 2024, the Company repurchased approximately 1.5 million shares through open market transactions and paid $35.8 million. On December 4, 2024, the Company’s Board of Directors authorized the repurchase of up to an additional $100 million of its outstanding shares of Class A Common Stock under the existing October 2023 program, providing the Company with approximately $112.7 million available for repurchases.
On December 11, 2024, the Company entered into an ASR agreement with a third-party financial institution and paid $112.7 million to receive an initial delivery of 3,821,958 shares of its Class A Common Stock. The final settlement is expected to occur in the first quarter of 2025, at which time, the Company expects to receive additional shares calculated using a volume-weighted average price over the term of the ASR agreement. The Company accounted for the ASR as a common stock repurchase and a forward contract indexed to its own common stock. The Company determined that the equity classification criteria was met for the forward contract, therefore, it did not account for it as a derivative instrument. All repurchased shares were subsequently retired.
The 2023 ASR's final settlement on January 12, 2024 (discussed above) was recorded during the year ended December 31, 2024. The Company paid a total of $200.0 million for share repurchases during the year ended December 31, 2024, and accounted for all share repurchase transactions by deducting the par value from common stock, reducing $26.8 million from additional paid-in capital calculated using an average share price, and by increasing accumulated deficit for the remaining cost of $173.2 million. In addition, the Company recorded approximately $1.7 million within accrued liabilities related to the excise taxes payable on net share repurchases on the consolidated balance sheets as of December 31, 2024.
In October 2018, the Company established the Verra Mobility 2018 Equity Incentive Plan which provides for a variety of stock-based awards including restricted stock units (“RSUs”), performance share units (“PSUs”) and non-qualified stock options to employees and non-employee directors. In May 2023, the stockholders approved the Verra Mobility Corporation Amended and Restated 2018 Equity Incentive Plan (the “2018 Plan”), which, among other things, increased the maximum number of shares available for awards by 5,000,000 shares. The maximum number of shares of the Company’s common stock that may be subject to awards under the 2018 Plan was 15,864,000 as of December 31, 2024, subject to adjustment in accordance with the terms of the 2018 Plan. At December 31, 2024, the Company had an aggregate of 6,500,840 shares of common stock available for future grants under the 2018 Plan.
RSUs and PSUs
The Company’s RSUs consist of a right to receive shares on one or more vesting dates in the future. RSUs granted to employees vest ratably over four years (or over two years for certain grants) from their individual award dates, subject to continued employment on the applicable vesting dates. RSUs granted to non-employee directors vest on the earlier of (a) the first anniversary of the vesting start date, or (b) the date immediately prior to the next annual stockholders meeting held by the Company occurring after the date of grant.
The Company grants PSUs to senior executives which consist of a right to receive shares generally at the end of a three-year period (or ratably over three years for certain grants). PSUs are issued upon continued service along with the relative satisfaction of a market condition that generally measures either the Company’s total stockholder return relative to a comparably calculated return for a peer group during the performance period or to the Company's absolute total stockholder return. The level at which the performance condition is attained upon the completion of the performance period determines the actual number of shares of the Class A Common Stock into which the PSUs will be converted. The conversion percentage ranges from 0% up to 150% of the target level.
The following table summarizes the activity of the Company’s RSUs and PSUs:
| | | | | | | | | | | | | | | | |
| | RSUs | | | PSUs | |
| | Shares
(in thousands) | | | Weighted Average
Grant Date
Fair Value | | | Shares
(in thousands) | | | Weighted Average
Grant Date
Fair Value | |
Balance at December 31, 2021 | | | 1,692 | | | $ | 11.92 | | | | 229 | | | $ | 15.07 | |
Granted | | | 1,093 | | | $ | 14.09 | | | | 179 | | | $ | 15.58 | |
Vested | | | (1,030 | ) | | $ | 11.10 | | | | — | | | $ | — | |
Forfeited | | | (260 | ) | | $ | 13.39 | | | | (94 | ) | | $ | 15.17 | |
Balance at December 31, 2022 | | | 1,495 | | | $ | 13.82 | | | | 314 | | | $ | 15.33 | |
Granted | | | 1,452 | | | $ | 18.16 | | | | 1,970 | | | $ | 11.42 | |
Vested | | | (523 | ) | | $ | 13.77 | | | | (101 | ) | | $ | 13.88 | |
Forfeited | | | (358 | ) | | $ | 16.18 | | | | (85 | ) | | $ | 11.64 | |
Balance at December 31, 2023 | | | 2,066 | | | $ | 16.49 | | | | 2,098 | | | $ | 11.88 | |
Granted | | | 1,170 | | | $ | 23.27 | | | | 437 | | | $ | 22.49 | |
Vested | | | (721 | ) | | $ | 15.80 | | | | (135 | ) | | $ | 15.98 | |
Forfeited | | | (440 | ) | | $ | 19.42 | | | | (226 | ) | | $ | 14.30 | |
Balance at December 31, 2024 | | | 2,075 | | | $ | 19.92 | | | | 2,174 | | | $ | 13.51 | |
The fair value of RSUs vested during fiscal years 2024, 2023 and 2022 was $11.4 million, $7.2 million and $11.4 million, respectively. The fair value of PSUs vested during fiscal years 2024 and 2023 was $2.2 million and $1.4 million, respectively. There were no PSU awards that vested during fiscal year 2022. As of December 31, 2024, the Company had $30.7 million and $16.9 million of unrecognized stock-based compensation expense related to unvested RSUs and PSUs, respectively, which is expected to be recognized over a weighted average period of 2.4 years and 2.2 years, respectively.
Stock Options
Stock options granted vest ratably over four years from their individual award dates, subject to continued employment on the applicable vesting dates, with a contractual term of ten years. The following table summarizes the activity of the Company’s stock options:
| | | | | | | | | | | | | | |
| | Stock Options Outstanding | |
| | Shares
(in thousands) | | | Weighted Average
Exercise Price
Per Share | | | Weighted Average Remaining Contractual Term | | Aggregate
Intrinsic Value
($ in thousands) | |
Balance at December 31, 2021 | | | 1,163 | | | $ | 13.18 | | | 8.7 years | | $ | 2,636 | |
Granted | | | 846 | | | $ | 13.97 | | | | | | |
Exercised | | | (103 | ) | | $ | 12.98 | | | | | $ | 348 | |
Forfeited | | | (329 | ) | | $ | 13.59 | | | | | | |
Balance at December 31, 2022 | | | 1,577 | | | $ | 13.53 | | | 8.5 years | | $ | 619 | |
Granted | | | 25 | | | $ | 17.75 | | | | | | |
Exercised | | | (451 | ) | | $ | 13.08 | | | | | $ | 2,671 | |
Forfeited | | | (91 | ) | | $ | 13.89 | | | | | | |
Balance at December 31, 2023 | | | 1,060 | | | $ | 13.78 | | | 7.7 years | | $ | 9,798 | |
Granted | | | — | | | $ | — | | | | | | |
Exercised | | | (322 | ) | | $ | 13.33 | | | | | $ | 3,756 | |
Forfeited | | | (75 | ) | | $ | 13.89 | | | | | | |
Balance at December 31, 2024 | | | 663 | | | $ | 13.99 | | | 7.0 years | | $ | 6,755 | |
| | | | | | | | | | | |
Exercisable at December 31, 2024 | | | 291 | | | $ | 13.84 | | | 6.8 years | | $ | 3,014 | |
The weighted average fair value of options granted in fiscal years 2022 and 2023 was $6.66 and $8.08 per share, respectively. There were no stock options granted during fiscal year 2024. The Company received approximately $1.3 million, $5.9 million and $4.3 million related to stock options exercised during fiscal years 2022, 2023 and 2024, respectively. As of December 31, 2024, the Company had $1.3 million of unrecognized stock-based compensation expense related to unvested stock options which is expected to be recognized over a weighted average period of 1.0 year.
The following details the components of stock-based compensation for the respective periods:
| | | | | | | | | | | | |
| | For the Year Ended December 31, | |
($ in thousands) | | 2024 | | | 2023 | | | 2022 | |
Operating expenses | | $ | 4,053 | | | $ | 2,488 | | | $ | 1,130 | |
Selling, general and administrative expenses | | | 18,905 | | | | 14,988 | | | | 15,533 | |
Total stock-based compensation expense | | $ | 22,958 | | | $ | 17,476 | | | $ | 16,663 | |
Tax benefits attributable to stock-based compensation represented approximately $6.4 million, $3.3 million and $4.6 million, before limitations under section 162(m) of the Internal Revenue Code, during the years ended December 31, 2024, 2023 and 2022, respectively.
The Company has a 401(k) plan that covers U.S. employees who meet certain eligibility requirements. Covered employees may elect to have a portion of their compensation withheld up to the statutory limit. The 401(k) plan includes a company match that vests immediately. The Company made employer contributions of $5.2 million, $3.9 million and $2.5 million during the fiscal years ended December 31, 2024, 2023 and 2022, respectively.
The Company also makes superannuation contributions for eligible non-U.S. based employees in accordance with the employer contribution rate set by the applicable country. The expense related to these contributions was $2.2 million, $1.9 million and $1.7 million during the fiscal years ended December 31, 2024, 2023 and 2022, respectively.
Tax Receivable Agreement
In October 2018, the Company entered into a Tax Receivable Agreement (“Tax Receivable Agreement”) with PE Greenlight Holdings, LLC. On August 3, 2022, PE Greenlight Holdings, LLC sold and transferred to Lakeside Smart Holdco L.P (“Lakeside”), all of its rights, remaining interests and obligations as of that date under the agreement. The Tax Receivable Agreement provides for the payment to Lakeside of 50.0% of the net cash savings, if any, in U.S. federal, state and local income tax that the Company actually realizes (or is deemed to realize in certain circumstances) under the agreement. The Company generally retains the benefit of the remaining 50.0% of these cash savings. The Company estimated the potential maximum benefit to be paid will be approximately $70.0 million, and recorded an initial liability and corresponding charge to equity at the inception of the Tax Receivable Agreement.
At December 31, 2024, the Tax Receivable Agreement liability was $48.1 million of which approximately $5.1 million was the current portion and $43.0 million was the non-current portion, both of which are included in the respective tax receivable agreement liability line items on the consolidated balance sheets. During the fourth quarter of 2024, the Company made a payment for $5.2 million related to the 2023 tax year.
The Company recorded a gain of $0.3 million in fiscal year 2024 as a result of lower estimated state tax rates due to changes in apportionment. The Company recorded a gain of approximately $3.1 million in fiscal year 2023 as a result of tax settlement adjustments related to a previous acquisition. It recorded a gain of $0.7 million in fiscal year 2022 as a result of lower estimated state tax rates due to changes in apportionment.
Earn-Out Agreement
Under the Agreement and Plan of Merger (as amended, the “Merger Agreement”), pursuant to which the Company became the owner, directly or indirectly, of all of the equity interests of Verra Mobility Holdings, LLC and its subsidiaries, PE Greenlight Holdings, LLC was entitled to receive additional shares of Class A Common Stock (the “Earn-Out Shares”) if the volume weighted average closing sale price of one share of Class A Common Stock on the Nasdaq exceeded certain defined thresholds for a period of at least 10 days out of 20 consecutive trading days at any time during a five-year period. There were four tranches of contingent shares under the agreement, with each tranche resulting in an issuance of 2,500,000 shares of Class A Common Stock (not to exceed a total of 10,000,000 shares). On April 26, 2019 and January 27, 2020, the criteria for the issuance of the first and second tranches was met and as a result, an aggregate 5,000,000 Earn-out Shares were issued. On June 14, 2023 and July 26, 2023, the criteria for the issuance of the remaining tranches of Earn-out Shares was met and the Company issued an aggregate 5,000,000 shares, which resulted in an increase in the Company's common stock and additional paid-in capital accounts of approximately $36.6 million with a corresponding decrease to the common stock contingent consideration account. As of December 31, 2023, all contingent shares have been issued under the Merger Agreement.
16.Commitments and Contingencies
The Company had $2.3 million of bank guarantees at December 31, 2024 required to support bids and contracts with certain international customers.
The Company has non-cancelable purchase commitments to certain vendors. The aggregate non-cancelable purchase commitments outstanding at December 31, 2024 were $43.4 million. The majority of these outstanding commitments are expected to be incurred in the next twelve months and approximately $8.6 million is expected to be incurred subsequent to December 31, 2025.
The Company is subject to tax audits in the normal course of business and does not have material contingencies recorded related to such audits.
The Company accrues for claims and contingencies when losses become probable and reasonably estimable. As of the end of each applicable reporting period, the Company reviews each of its matters and, where it is probable that a liability has been or will be incurred, the Company accrues for all probable and reasonably estimable losses. Where the Company can reasonably estimate a range of loss it may incur regarding such a matter, the Company records an accrual for the amount within the range that constitutes its best estimate. If the Company can reasonably estimate a range but no amount within the range appears to be a better estimate than any other, the Company uses the amount that is the low end of such range.
Legal Proceedings
The Company is subject to legal and regulatory actions that arise from time to time in the ordinary course of business. The Company records a liability when it believes it is probable a loss will be incurred, and the amount of loss or range of loss can be reasonably estimated. The assessment as to whether a loss is probable, reasonably possible or remote, and as to whether a loss or a range of such loss is estimable, often involves significant judgment about future events. The Company has accrued estimated amounts related to legal proceedings as of December 31, 2024 and 2023 within accrued liabilities on the consolidated balance sheets. The ultimate cost of litigation or settlement of one or more of the following cases could be materially different than the amount of the current estimates and accruals and could have a material adverse impact on the Company's consolidated financial position, results of operations, or cash flows.
Brantley v. City of Gretna is a class action lawsuit filed in the 24th Judicial District Court of Jefferson Parish, Louisiana against the City of Gretna (the “City”) and its safety camera vendor, Redflex Traffic Systems, Inc. in April 2016. The Company acquired Redflex Traffic Systems, Inc. as part of its June 2021 purchase of Redflex Holdings Limited. The plaintiff class, which was certified on March 30, 2021, alleges that the City’s safety camera program was implemented and operated in violation of local ordinances and the state constitution, including that the City’s hearing process violated the plaintiffs’ due process rights for lack of a “neutral” arbiter of liability for traffic infractions. Plaintiffs seek recovery of traffic infraction fines paid. The City and Redflex Traffic Systems, Inc. appealed the trial court’s ruling granting class certification, which was denied and their petition for discretionary review of the certification ruling by the Louisiana Supreme Court was declined. Discovery has concluded and trial is scheduled for March 2025.
PlusPass Inc. (“PlusPass”) v. Verra Mobility Corporation, et al. is a lawsuit filed in the United States District Court, Central District of California, against Verra Mobility, The Gores Group LLC, Platinum Equity LLC and ATS Processing Services, Inc., in November 2020. In February 2024, Verra Mobility and PlusPass entered into a confidential business arrangement pursuant to which Verra Mobility (i) acquired certain assets from PlusPass and (ii) fully and finally resolved all litigation and disputes between the parties, including the payment of the settlement amount during the first quarter of 2024.
The Company has three operating and reportable segments, Commercial Services, Government Solutions and Parking Solutions. Commercial Services offers toll and violation management solutions and title and registration services to RACs, Direct Fleets, FMCs and violation-issuing authorities. Government Solutions implements and administers traffic safety programs and products for municipalities and government agencies of all sizes. Parking Solutions provides an integrated suite of parking software and hardware solutions to its customers.
The operating and reportable segments were determined based on how the Company's Chief Operating Decision Maker (“CODM”) regularly reviews the operating results of the various components of the Company for which discrete financial information is available, including based on the nature of the products and services and the type of customer. The Company defines the CODM as its Chief Executive Officer. The Company's CODM primarily uses actual revenues and segment profit (defined below) as compared to previously budgeted amounts to evaluate the operating performance, allocate resources and deploy capital to the segments.
Segment performance is based on revenues and income from operations before depreciation, amortization, and stock-based compensation. The measure also excludes interest expense, net, income taxes and certain other transactions and is inclusive of other income, net. The tables below refer to this measure as segment profit. The aforementioned items are not indicative of operating performance, and, as a result are not included in the measures that are reviewed by the CODM for the segments. Other income, net included in segment profit below consists primarily of credit card rebates earned on the prepayment of tolling transactions and gains or losses on foreign currency transactions, and excludes certain non-operating expenses inapplicable to segments.
The Company adopted ASU 2023-07, Segment Reporting (Topic 280): Improvements to Reportable Segment Disclosures in fiscal year 2024, and as a result, updated the presentation of financial information by reportable segment. The measure of segment profit for the year ended December 31, 2024 excludes certain costs within operating expenses and selling, general and administrative expenses that were previously allocated to the segments, in order to align with how the CODM reviews the information regularly. In addition, the CODM does not use discrete asset information to evaluate operating performance at the segment level, as such, the Company has not reported assets disaggregated by reportable segment.
The following tables set forth financial information by segment for the fiscal years ended December 31, 2024, 2023 and 2022:
| | | | | | | | | | | | | | | | |
| | For the Year Ended December 31, 2024 | |
| | Commercial | | | Government | | | Parking | | | | |
($ in thousands) | | Services | | | Solutions | | | Solutions | | | Total | |
Service revenue | | $ | 407,680 | | | $ | 367,914 | | | $ | 66,082 | | | $ | 841,676 | |
Product sales | | | — | | | | 22,989 | | | | 14,542 | | | | 37,531 | |
Total revenue | | | 407,680 | | | | 390,903 | | | | 80,624 | | | | 879,207 | |
Cost of service revenue, excluding depreciation and amortization | | | 2,682 | | | | 2,066 | | | | 14,240 | | | | 18,988 | |
Cost of product sales | | | — | | | | 15,433 | | | | 11,625 | | | | 27,058 | |
Operating expenses | | | 92,038 | | | | 182,493 | | | | 17,353 | | | | 291,884 | |
Selling, general and administrative expenses | | | 62,942 | | | | 69,972 | | | | 25,173 | | | | 158,087 | |
Loss on disposal of assets, net | | | 222 | | | | 315 | | | | 9 | | | | 546 | |
Other (income) expense, net | | | (17,958 | ) | | | (1,061 | ) | | | 49 | | | | (18,970 | ) |
Segment profit | | $ | 267,754 | | | $ | 121,685 | | | $ | 12,175 | | | $ | 401,614 | |
Interest expense, net | | | | | | | | | | | | 73,902 | |
Goodwill impairment | | | | | | | | | | | | 97,076 | |
Tax receivable agreement liability adjustment | | | | | | | | | | | | (257 | ) |
Loss on interest rate swap | | | | | | | | | | | | 494 | |
Loss on extinguishment of debt | | | | | | | | | | | | 1,745 | |
Other reconciling items (1) | | | | | | | | | | | | 149,546 | |
Income before income taxes | | | | | | | | | | | $ | 79,108 | |
(1) This primarily consists of depreciation and amortization expense, stock-based compensation and other costs to reconcile to total income before income taxes.
| | | | | | | | | | | | | | | | |
| | For the Year Ended December 31, 2023 | |
| | Commercial | | | Government | | | Parking | | | | |
($ in thousands) | | Services | | | Solutions | | | Solutions | | | Total | |
Service revenue | | $ | 372,786 | | | $ | 344,034 | | | $ | 66,775 | | | $ | 783,595 | |
Product sales | | | — | | | | 14,385 | | | | 19,330 | | | | 33,715 | |
Total revenue | | | 372,786 | | | | 358,419 | | | | 86,105 | | | | 817,310 | |
Cost of service revenue, excluding depreciation and amortization | | | 2,362 | | | | 2,252 | | | | 13,618 | | | | 18,232 | |
Cost of product sales | | | — | | | | 9,751 | | | | 15,480 | | | | 25,231 | |
Operating expenses | | | 83,828 | | | | 168,736 | | | | 18,236 | | | | 270,800 | |
Selling, general and administrative expenses | | | 61,607 | | | | 62,597 | | | | 23,988 | | | | 148,192 | |
Loss on disposal of assets, net | | | — | | | | 128 | | | | — | | | | 128 | |
Other (income) expense, net | | | (17,176 | ) | | | 488 | | | | (87 | ) | | | (16,775 | ) |
Segment profit | | $ | 242,165 | | | $ | 114,467 | | | $ | 14,870 | | | $ | 371,502 | |
Interest expense, net | | | | | | | | | | | | 86,701 | |
Change in fair value of private placement warrants | | | | | | | | | | | | 24,966 | |
Tax receivable agreement liability adjustment | | | | | | | | | | | | (3,077 | ) |
Loss on interest rate swap | | | | | | | | | | | | 817 | |
Loss on extinguishment of debt | | | | | | | | | | | | 3,533 | |
Other reconciling items (1) | | | | | | | | | | | | 171,565 | |
Income before income taxes | | | | | | | | | | | $ | 86,997 | |
(1) This primarily consists of depreciation and amortization expense, stock-based compensation and other costs to reconcile to total income before income taxes.
| | | | | | | | | | | | | | | | |
| | For the Year Ended December 31, 2022 | |
| | Commercial | | | Government | | | Parking | | | | |
($ in thousands) | | Services | | | Solutions | | | Solutions | | | Total | |
Service revenue | | $ | 325,971 | | | $ | 307,639 | | | $ | 61,608 | | | $ | 695,218 | |
Product sales | | | — | | | | 29,028 | | | | 17,352 | | | | 46,380 | |
Total revenue | | | 325,971 | | | | 336,667 | | | | 78,960 | | | | 741,598 | |
Cost of service revenue, excluding depreciation and amortization | | | 2,869 | | | | 2,016 | | | | 11,445 | | | | 16,330 | |
Cost of product sales | | | — | | | | 17,436 | | | | 13,496 | | | | 30,932 | |
Operating expenses | | | 72,328 | | | | 139,961 | | | | 12,905 | | | | 225,194 | |
Selling, general and administrative expenses | | | 56,105 | | | | 61,235 | | | | 27,104 | | | | 144,444 | |
Loss on disposal of assets, net | | | 522 | | | | 931 | | | | 37 | | | | 1,490 | |
Other income, net | | | (14,387 | ) | | | (679 | ) | | | (266 | ) | | | (15,332 | ) |
Segment profit | | $ | 208,534 | | | $ | 115,767 | | | $ | 14,239 | | | $ | 338,540 | |
Interest expense, net | | | | | | | | | | | | 69,372 | |
Change in fair value of private placement warrants | | | | | | | | | | | | (14,400 | ) |
Tax receivable agreement liability adjustment | | | | | | | | | | | | (720 | ) |
Gain on interest rate swap | | | | | | | | | | | | (996 | ) |
Gain on extinguishment of debt | | | | | | | | | | | | (3,005 | ) |
Other reconciling items (1) | | | | | | | | | | | | 161,181 | |
Income before income taxes | | | | | | | | | | | $ | 127,108 | |
(1) This primarily consists of depreciation and amortization expense, stock-based compensation and other costs to reconcile to total income before income taxes.
The Company provides information on credit loss expense (income) by reportable segment, refer to Note 2, Significant Accounting Policies, for additional details.
The Company primarily operates within the United States, Australia, Canada, United Kingdom and in various other countries in Europe and Asia. Property and equipment, net located in foreign countries was $20.3 million as of December 31, 2024, of which Canada represented $10.6 million and Australia represented $5.8 million. Property and equipment, net located in foreign countries was $19.3 million as of December 31, 2023, of which Canada represented $11.7 million and Australia represented $4.2 million.
The following table details the revenues from international operations for the respective periods:
| | | | | | | | | | | | |
| | For the Year Ended December 31, | |
($ in thousands) | | 2024 | | | 2023 | | | 2022 | |
Australia | | $ | 58,029 | | | $ | 45,879 | | | $ | 34,356 | |
Canada | | | 33,192 | | | | 30,826 | | | | 32,413 | |
United Kingdom | | | 20,484 | | | | 23,794 | | | | 24,017 | |
All other | | | 4,318 | | | | 3,071 | | | | 3,532 | |
Total international revenues | | $ | 116,023 | | | $ | 103,570 | | | $ | 94,318 | |
Item 9. Changes in and Disagreements with Accountants on Accounting and Financial Disclosure
None.
Item 9A. Controls and Procedures
Evaluation of Disclosure Controls and Procedures
Our disclosure controls and procedures, as defined in Rules 13a-15(e) or 15d-15(e) under the Exchange Act, are designed to ensure that information required to be disclosed in the reports that we file or submit under the Exchange Act is recorded, processed, summarized, and reported within the time periods specified in the SEC’s rules and forms and to ensure that information required to be disclosed is accumulated and communicated to management, including our Chief Executive Officer and Chief Financial Officer, to allow timely decisions regarding disclosure.
Based on this evaluation, our Chief Executive Officer and our Chief Financial Officer concluded that, as of December 31, 2024, our disclosure controls and procedures were designed and operated effectively to provide reasonable assurance that the information we are required to disclose in reports that we file or submit under the Exchange Act is recorded, processed, summarized and reported within the time periods specified in the Securities and Exchange Commission rules and forms, and that such information is accumulated and communicated to our management, including our Chief Executive Officer and our Chief Financial Officer, as appropriate, to allow timely decisions regarding required disclosures.
Management’s Report on Internal Control over Financial Reporting
Our management is responsible for establishing and maintaining adequate internal control over financial reporting as defined in Rules 13a-15(f) and 15d-15(f) under the Exchange Act. Internal control over financial reporting is a process designed by, or under the supervision of, our Chief Executive Officer and Chief Financial Officer to provide reasonable assurance regarding the reliability of financial reporting and the preparation of financial statements for external purposes in accordance with GAAP and includes those policies and procedures that (1) pertain to the maintenance of records that in reasonable detail accurately and fairly reflect the transactions and dispositions of our assets; (2) provide reasonable assurance that transactions are recorded as necessary to permit preparation of financial statements in accordance with GAAP, and that our receipts and expenditures are being made only in accordance with authorizations of our management and directors; and (3) provide reasonable assurance regarding prevention or timely detection of unauthorized acquisition, use or disposition of our assets that could have a material effect on our financial statements.
Under the supervision and with the participation of our management, including our Chief Executive Officer and Chief Financial Officer, we conducted an evaluation of the effectiveness of our internal control over financial reporting based on criteria established in Internal Control – Integrated Framework (2013) issued by the Committee of Sponsoring Organizations (“COSO”) of the Treadway Commission. Based on this evaluation, our management concluded that our internal control over financial reporting was effective as of December 31, 2024.
Deloitte & Touche LLP, an independent registered public accounting firm, has issued an attestation report on our internal control over financial reporting as of December 31, 2024, which report appears herein.
Remediation of Material Weakness
We are committed to maintaining a strong internal control environment. In connection with our annual report on Form 10-K for the year ended December 31, 2023, we identified a material weakness in the design and operation of our internal controls over financial reporting in the Control Activities component of the COSO framework related to a lack of information technology general controls to prevent the risk of management override. Specifically, we identified system limitations that do not facilitate proper segregation of duties within multiple systems and a lack of mitigating business process level controls to address the risk of management override over the preparation and review of manual journal entries and certain manual revenue invoices. While this deficiency did not result in any material misstatements of our consolidated interim or annual financial statements, it did represent a material weakness in our internal control over financial reporting.
Since the fourth quarter of 2023, management executed plans to remediate the above material weakness which included:
•Hiring experienced personnel in the Government Solutions segment with prior public accounting and public company experience, technical accounting experience, and financial reporting experience.
•Implementing system enforced segregation of duties within our accounting and close process.
•Implementing information technology general controls reducing the risk of management override.
Based on the implementation work and the results of testing performed, our management concluded that the previously identified material weakness has been remediated as of December 31, 2024.
Limitations on the Effectiveness of Controls
Because of inherent limitations, internal control over financial reporting may not prevent or detect misstatements and projections of any evaluation of effectiveness to future periods are subject to the risk that controls may become inadequate because of changes in conditions, or that the degree of compliance with the policies or procedures may deteriorate.
Changes in Internal Control over Financing Reporting
For the quarter ended December 31, 2024, except for the remediation efforts noted above, there were no changes in our internal control over financial reporting identified in connection with the evaluation required by paragraph (d) of Rule 13a-15 or Rule 15d-15 that have materially affected, or are reasonably likely to materially affect, our internal control over financial reporting.
Item 9B. Other Information
During the three months ended December 31, 2024, none of our directors or executive officers adopted or terminated a Rule 10b5-1 trading arrangement or a non-Rule 10b5-1 trading arrangement. (as each term is defined in Item 408 of Regulation S-K).
Item 9C. Disclosure Regarding Foreign Jurisdictions that Prevent Inspections.
Not applicable.
PART III
Item 10. Directors, Executive Officers and Corporate Governance
The information required by this Item is incorporated by reference from our proxy statement to be filed in connection with our 2025 annual meeting of stockholders within 120 days after the end of the fiscal year ended December 31, 2024.
We have adopted an Insider Trading Policy governing the purchase, sale and/or other dispositions of our securities by our directors, officers and employees that we believe is reasonably designed to promote compliance with insider trading laws, rules and regulations, and any applicable listing standards. A copy of our Insider Trading Policy is filed as Exhibit 19.1 to this Annual Report on Form 10-K.
Item 11. Executive Compensation
The information required by this Item is incorporated by reference from our proxy statement to be filed in connection with our 2025 annual meeting of stockholders within 120 days after the end of the fiscal year ended December 31, 2024.
Item 12. Security Ownership of Certain Beneficial Owners and Management and Related Stockholder Matters
The information required by this Item is incorporated by reference from our proxy statement to be filed in connection with our 2025 annual meeting of stockholders within 120 days after the end of the fiscal year ended December 31, 2024.
Item 13. Certain Relationships and Related Transactions, and Director Independence
The information required by this Item is incorporated by reference from our proxy statement to be filed in connection with our 2025 annual meeting of stockholders within 120 days after the end of the fiscal year ended December 31, 2024.
Item 14. Principal Accountant Fees and Services
The information required by this Item is incorporated by reference from our proxy statement to be filed in connection with our 2025 annual meeting of stockholders within 120 days after the end of the fiscal year ended December 31, 2024.
PART IV
Item 15. Exhibits, Financial Statement Schedules
(a)The following documents are filed as part of this Annual Report:
1.Consolidated Financial Statements
The financial statements filed as part of this Annual Report are listed in the “Index to Consolidated Financial Statements” under Part II, Item 8 of this Annual Report.
2.Financial Statement Schedules
•Appendix A, Schedule II – Consolidated Valuation and Qualifying Accounts
Schedules not listed above are omitted as the required information is inapplicable or the information is presented in the consolidated financial statements or notes to the consolidated financial statements under Part II, Item 8 of this Annual Report.
The exhibits listed below are filed as part of this Annual Report. References under the caption “Incorporated by Reference” to exhibits or other filings indicate that the exhibit or other filing has been filed, that the indexed exhibit and the exhibit referred to are the same and that the exhibit referred to is incorporated by reference.
EXHIBIT INDEX
| | | | | | | | | | | | |
| | | | Incorporated by Reference | | |
Exhibit Number | | Description | | Form | | File No. | | Exhibit | | Filing Date | | Filed Herewith |
| | | | | | | | | | | | |
2.1 | | Merger Agreement, dated as of June 21, 2018, by and among Gores Holdings II, Inc., AM Merger Sub I, Inc., AM Merger Sub II, LLC, Greenlight Holding II Corporation and PE Greenlight Holdings, LLC, in its capacity as the Stockholder Representative. | | 8-K | | 001-37979 | | 2.1 | | June 21, 2018 | | |
| | | | | | | | | | | | |
2.2 | | Amendment No. 1 to Agreement and Plan of Merger, dated as of August 23, 2018, by and among Gores Holdings II, Inc., AM Merger Sub I, Inc., AM Merger Sub II, LLC, Greenlight Holding II Corporation and PE Greenlight Holdings, LLC, in its capacity as the Stockholder Representative. | | 8-K | | 001-37979 | | 2.2 | | Aug. 24, 2018 | | |
| | | | | | | | | | | | |
3.1 | | Second Amended and Restated Certificate of Incorporation of Verra Mobility Corporation. | | 8-K | | 001-37979 | | 3.1 | | Oct. 22, 2018 | | |
| | | | | | | | | | | | |
3.2 | | Amended and Restated Bylaws of Verra Mobility Corporation. | | 8-K | | 001-37979 | | 3.1 | | Nov. 9, 2023 | | |
| | | | | | | | | | | | |
4.1 | | Description of Verra Mobility Corporation’s Securities Registered Pursuant to Section 12 of the Exchange Act. | | | | | | | | | | X |
| | | | | | | | | | | | |
4.2 | | Indenture, dated as of March 26, 2021, by and among VM Consolidated, Inc., the Guarantors party thereto and Wilmington Trust, National Association as Trustee. | | 8-K | | 001-37979 | | 4.1 | | Mar. 29, 2021 | | |
| | | | | | | | | | | | |
4.3 | | Form of 5.5% Senior Note Due 2029. | | 8-K | | 001-37979 | | 4.1 | | Mar. 29, 2021 | | |
| | | | | | | | | | | | |
10.1 | | Form of Indemnity Agreement. | | S-1 | | 333-21503 | | 10.7 | | Dec. 9, 2016 | | |
| | | | | | | | | | | | |
10.2 | | Revolving Credit Agreement dated as of March 1, 2018, among Greenlight Acquisition Corporation, ATS Consolidated Inc., each of the other borrowers party thereto, the lenders party thereto and Bank of America, N.A. as Administrative Agent and Collateral Agent. | | 8-K | | 001-37979 | | 10.5 | | Oct. 22, 2018 | | |
| | | | | | | | | | | | |
10.3 | | Amendment No. 1 to Revolving Credit Agreement, dated as of July 24, 2018, among Greenlight Acquisition Corporation, VM Consolidated, Inc. (formerly known as ATS Consolidated Inc.), each of the other borrowers party thereto, the lenders party thereto and | | 8-K | | 001-37979 | | 10.7 | | Oct. 22, 2018 | | |
| | | | | | | | | | | | |
| | Bank of America, N.A. as Administrative Agent and Collateral Agent. | | | | | | | | | | |
| | | | | | | | | | | | |
10.4 | | Amendment No. 2 to Revolving Credit Agreement, dated as of October 29, 2021, by and among Greenlight Acquisition Corporation, VM Consolidated, Inc., each of the other borrowers party thereto, the lenders party thereto and Bank of America, N.A. as Administrative Agent and Collateral Agent. | | 10-K | | 001-37979 | | 10.7 | | April 22, 2022 | | |
| | | | | | | | | | | | |
10.5 | | Amendment No. 3 to Revolving Credit Agreement, dated as of December 20, 2021, by and among Greenlight Acquisition Corporation, VM Consolidated, Inc., each of the other borrowers party thereto, the lenders party thereto and Bank of America, N.A. as Administrative Agent and Collateral Agent. | | 8-K | | 001-37979 | | 10.1 | | Dec. 20, 2021 | | |
| | | | | | | | | | | | |
10.6 | | Amendment and Restatement Agreement No. 1 to First Lien Term Loan Credit Agreement, dated as of March 26, 2021, by and among Greenlight Acquisition Corporation, VM Consolidated, Inc., American Traffic Solutions, Inc., Lasercraft, Inc. the subsidiary guarantors party thereto, the lenders party thereto and Bank of America, N.A., as Administrative Agent and Collateral Agent. | | 8-K | | 001-37979 | | 10.1 | | Mar. 29, 2021 | | |
| | | | | | | | | | | | |
10.7 | | Amendment No. 1 to Amendment and Restatement Agreement No. 1 to First Lien Term Loan Credit Agreement, dated as of December 7, 2021, by and among Greenlight Acquisition Corporation, VM Consolidated, Inc., American Traffic Solutions, Inc., Lasercraft, Inc. the subsidiary guarantors party thereto, the lenders party thereto and Bank of America, N.A., as Administrative Agent and Collateral Agent. | | 8-K | | 001-37979 | | 10.1 | | Dec. 7, 2021 | | |
| | | | | | | | | | | | |
10.8 | | Amendment No. 2 to Amendment and Restatement Agreement No. 1 to First Lien Term Loan Credit Agreement, dated as of March 29, 2023, by and among Greenlight Acquisition Corporation, VM Consolidated, Inc., American Traffic Solutions, Inc., Lasercraft, Inc. the subsidiary guarantors party thereto, the lenders party thereto and Bank of America, N.A., as Administrative Agent and Collateral Agent. | | | | | | | | | | X |
| | | | | | | | | | | | |
| | | | | | | | | | | | |
10.9 | | Amendment No. 3 to Amendment and Restatement Agreement No. 1 to First Lien Term Loan Credit Agreement, dated as of February 8, 2024, by and among Greenlight Acquisition Corporation, VM Consolidated, Inc., American Traffic Solutions, Inc., Lasercraft, Inc. the subsidiary guarantors party thereto, the lenders party thereto and Bank of America, N.A., as Administrative Agent and Collateral Agent. | | 8-K | | 001-37979 | | 10.1 | | Feb. 8, 2024 | | |
| | | | | | | | | | | | |
10.10 | | Amendment No. 4 to Amendment and Restatement Agreement No. 1 to First Lien Term Loan Credit Agreement, dated as of October 3, 2024, by and among Greenlight Acquisition Corporation, VM Consolidated, Inc., American Traffic Solutions, Inc., Lasercraft, Inc. the subsidiary guarantors party thereto, the lenders party thereto and Bank of America, N.A., as Administrative Agent and Collateral Agent. | | 8-K | | 001-37979 | | 10.1 | | Oct. 7, 2024 | | |
| | | | | | | | | | | | |
10.11# | | Amended and Restated Executive Employment Agreement, dated as of March 25, 2021, by and between VM Consolidated, Inc. and David Roberts. | | 10-Q | | 001-37979 | | 10.3 | | May 17, 2021 | | |
| | | | | | | | | | | | |
10.12# | | Executive Employment Agreement by and between VM Consolidated, Inc. and Steven Lalla, dated as of January 31, 2021. | | 10-K | | 001-37979 | | 10.15 | | Mar. 1, 2021 | | |
| | | | | | | | | | | | |
10.13# | | Executive Employment Agreement by and between VM Consolidated, Inc. and Craig Conti, dated as of January 29, 2022. | | 10-K | | 001-37979 | | 10.15 | | April 22, 2022 | | |
| | | | | | | | | | | | |
10.14# | | Verra Mobility Corporation Amended and Restated 2018 Equity Incentive Plan. | | 8-K | | 001-37979 | | 10.1 | | May 24, 2023 | | |
| | | | | | | | | | | | |
10.15# | | Amendment No. 1 to Verra Mobility Corporation Amended and Restated 2018 Equity Incentive Plan. | | | | | | | | | | X |
| | | | | | | | | | | | |
10.16# | | Amendment No. 2 to Verra Mobility Corporation Amended and Restated 2018 Equity Incentive Plan. | | | | | | | | | | X |
| | | | | | | | | | | | |
10.17# | | Form of Notice of Grant of Restricted Stock Unit and Agreement under the Verra Mobility Corporation 2018 Equity Incentive Plan. | | 8-K | | 001-37979 | | 10.18 | | Oct. 22, 2018 | | |
| | | | | | | | | | | | |
10.18# | | Form of Notice of Grant of Restricted Stock Unit and Agreement for Non-U.S. Participants under the Verra Mobility Corporation 2018 Equity Incentive Plan. | | 8-K | | 001-37979 | | 10.19 | | Oct. 22, 2018 | | |
| | | | | | | | | | | | |
| | | | | | | | | | | | |
10.19# | | Form of Notice of Grant of Restricted Stock Unit for Non-Employee Directors under the Verra Mobility Corporation 2018 Equity Incentive Plan. | | 10-K | | 001-37979 | | 10.30 | | Mar. 18, 2019 | | |
| | | | | | | | | | | | |
10.20# | | Form of Notice of Grant of Stock Option and Agreement under the Verra Mobility Corporation 2018 Equity Incentive Plan. | | 10-K | | 001-37979 | | 10.24 | | Mar. 2, 2020 | | |
| | | | | | | | | | | | |
10.21# | | Form of Notice of Grant of Performance Share Unit and Agreement under the Verra Mobility Corporation 2018 Equity Incentive Plan. | | 10-K | | 001-37979 | | 10.26 | | Mar. 2, 2020 | | |
| | | | | | | | | | | | |
10.22# | | 2020 Form of Notice of Grant of Restricted Stock Unit and Agreement for Non-U.S. Participants under the Verra Mobility Corporation 2018 Equity Incentive Plan. | | 10-Q | | 001-37979 | | 10.1 | | Nov. 5, 2020 | | |
| | | | | | | | | | | | |
10.23# | | Form of Notice of Grant of Stock Option and Agreement for Non-U.S. Participants under the Verra Mobility Corporation 2018 Equity Incentive Plan. | | 10-Q | | 001-37979 | | 10.2 | | Nov. 5, 2020 | | |
| | | | | | | | | | | | |
10.24# | | Verra Mobility Corporation Non-Employee Director Compensation Policy. | | | | | | | | | | X |
| | | | | | | | | | | | |
10.25# | | Form of Notice of Grant of Performance Share Units and Award Agreement under the Verra mobility Corporation 2018 Equity Incentive Plan. | | 8-K | | 001-37979 | | 10.1 | | June 1, 2022 | | |
| | | | | | | | | | | | |
10.26# | | Executive Employment Agreement by and between VM Consolidated, Inc. and Jonathan Baldwin, dated as of January 16, 2022. | | 10-K | | 001-37979 | | 10.30 | | March 1, 2023 | | |
| | | | | | | | | | | | |
10.27# | | Executive Employment Agreement by and between VM Consolidated, Inc. and Jonathan Keyser, dated as of November 8, 2022. | | 10-K | | 001-37979 | | 10.32 | | March 1, 2023 | | |
| | | | | | | | | | | | |
10.28# | | Form of Notice of Grant of Restricted Stock Units (U.S. Participants) under the Verra Mobility Corporation 2018 Equity Incentive Plan. | | 8-K | | 001-37979 | | 10.1 | | Feb. 17, 2023 | | |
| | | | | | | | | | | | |
10.29# | | Form of Notice of Grant of Restricted Stock Units (Non-U.S. Participants) under the Verra Mobility Corporation 2018 Equity Incentive Plan. | | 8-K | | 001-37979 | | 10.2 | | Feb. 17, 2023 | | |
| | | | | | | | | | | | |
10.30# | | Form of Notice of Grant of Stock Option (U.S. Participants) under the Verra Mobility Corporation 2018 Equity Incentive Plan. | | 8-K | | 001-37979 | | 10.3 | | Feb. 17, 2023 | | |
| | | | | | | | | | | | |
10.31# | | Form of Notice of Grant of Stock Option (Non-U.S. Participants) under the Verra | | 8-K | | 001-37979 | | 10.4 | | Feb. 17, 2023 | | |
# Management contract or compensatory plan or arrangement.
* This certification is deemed not filed for purposes of Section 18 of the Exchange Act or otherwise subject to the liability of that section, nor shall it be deemed incorporated by reference into any filing under the Securities Act or the Exchange Act.
Item 16. Form 10-K Summary
None.
SIGNATURES
Pursuant to the requirements of Section 13 or 15(d) of the Securities Exchange Act of 1934, the registrant has duly caused this report to be signed on its behalf by the undersigned, thereunto duly authorized.
| | |
| VERRA MOBILITY CORPORATION |
|
|
Date: February 27, 2025 | By: | /s/ David Roberts |
|
| David Roberts |
|
| President and Chief Executive Officer |
|
| (Principal Executive Officer) |
POWER OF ATTORNEY
KNOW ALL PERSONS BY THESE PRESENTS, that each individual whose signature appears below constitutes and appoints David Roberts and Craig Conti, and each of them, his or her true and lawful attorney-in-fact and agent, with full power of substitution and resubstitution, for him or her and in his or her name, place and stead, in any and all capacities, to sign any and all amendments to this Annual Report, and to file the same, with all exhibits thereto and other documents in connection therewith, with the SEC, granting unto said attorneys-in-fact and agents, and each of them, full power and authority to do and perform each and every act and thing requisite and necessary to be done in and about the premises, as fully to all intents and purposes as he or she might or could do in person, hereby ratifying and confirming all that said attorneys-in-fact and agents or any of them, or his or her or their substitute or substitutes, may lawfully do or cause to be done or by virtue hereof.
Pursuant to the requirements of the Securities Exchange Act of 1934, this report has been signed below by the following persons on behalf of the Registrant and in the capacities and on the date indicated:
| | | | | |
| Signature |
| Capacity in Which Signed |
| Date |
| | | | | |
| /s/ David Roberts | | President, Chief Executive Officer and Director | | February 27, 2025 |
| David Roberts | (Principal Executive Officer) | |
| | | |
| /s/ Craig Conti | | Chief Financial Officer | | February 27, 2025 |
| Craig Conti | (Principal Financial Officer) | |
|
|
| |
|
|
| /s/ Hiten Patel | | Chief Accounting Officer | | February 27, 2025 |
| Hiten Patel | | (Principal Accounting Officer) | | |
| | | | | |
| /s/ Patrick Byrne |
| Director |
| February 27, 2025 |
| Patrick Byrne |
| | | |
|
|
| |
|
|
| /s/ Douglas Davis |
| Director |
| February 27, 2025 |
| Douglas Davis | |
|
|
|
| |
|
|
| /s/ Michael Huerta |
| Director |
| February 27, 2025 |
| Michael Huerta | |
|
| | | | | |
| /s/ Raj Ratnakar | | Director | | February 27, 2025 |
| Raj Ratnakar | | | | |
|
|
| |
|
|
| /s/ John Rexford |
| Director |
| February 27, 2025 |
| John Rexford | |
|
|
|
| |
|
|
| /s/ Cynthia Russo |
| Director |
| February 27, 2025 |
| Cynthia Russo |
|
|
|
|
Appendix A
Verra Mobility Corporation
Schedule II
Consolidated Valuation and Qualifying Accounts for the Years Ended December 31, 2024, 2023 and 2022
| | | | | | | | | | | | | | | | | | | | |
| | Beginning | | | Charged/Credited to | | | Charged to Other | | | Charges Utilized/ | | | Ending | |
($ in thousands) | | Balance | | | Net Income | | | Account | | | Write-offs | | | Balance | |
Allowance for Credit Losses | | | | |
| | |
| | |
| | |
| |
Year Ended December 31, 2024 | | $ | 18,513 | | | $ | 13,002 | | | $ | — | | | $ | (14,497 | ) | | $ | 17,018 | |
Year Ended December 31, 2023 | | | 15,907 | | | | 9,054 | | | | — | | | | (6,448 | ) | | | 18,513 | |
Year Ended December 31, 2022 | | | 12,138 | | | | 14,481 | | | | — | | | | (10,712 | ) | | | 15,907 | |
| | | | | | | | | | | | | | | |
Tax Valuation Allowance | |
| | |
| | |
| | |
| | |
| |
Year Ended December 31, 2024 | | $ | 7,011 | | | $ | (1,466 | ) | | $ | (3 | ) | | $ | — | | | $ | 5,542 | |
Year Ended December 31, 2023 | | | 5,263 | | | | 297 | | | | 1,451 | | | | — | | | | 7,011 | |
Year Ended December 31, 2022 | | | 3,785 | | | | 2,438 | | | | 63 | | | | (1,023 | ) | | | 5,263 | |