LISTED FUNDS TRUST
c/o U.S. Bancorp Fund Services, LLC
615 East Michigan Street | Milwaukee, Wisconsin 53202
May 27, 2020
VIA EDGAR TRANSMISSION
Ryan Sutcliffe
U.S. Securities and Exchange Commission
Division of Investment Management
100 F Street NE
Washington, DC 20549
RE: Listed Funds Trust (the “Trust”)
File Nos. 333-215588 and 811-23226
Post- Effective Amendment No. 33 to the Trust’s Registration Statement on Form N-1A
AAF First Priority CLO Bond ETF (the “Fund”)
Dear Mr. Sutcliffe:
This correspondence responds to your comments received from the staff (the “Staff”) of the U.S. Securities and Exchange Commission on April 29, 2020 regarding the Trust’s Post-Effective Amendment No. 33 (the “Amendment”) to its registration statement on Form N‑1A, which was filed via EDGAR on December 23, 2019. The Trust notes that it previously submitted responses to your oral comments received on February 6, 2020, March 4, 2020, and April 29, 2020 regarding the Amendment under separate cover filed on February 21, 2020, April 2, 2020, and May 13, 2020, respectively. For your convenience, your comments have been reproduced with responses following each comment. Capitalized terms not otherwise defined have the same meaning as in the Amendment.
Comment. Please provide additional information specifically regarding hedging and arbitrage to supplement previous responses.
Response:
Market and Fund Size:
We once again want to highlight the size of the CLO market and how that compares to potential fund size. As of the writing of this response, the CLO market has approximately $700 billion in assets under management. The first priority bond portion of those assets are approximately $400 billion. We believe that there exists ample supply of bonds to meet ETF creation requests for the foreseeable future.
We use other fixed income ETFs as a barometer for anticipated fund size. Specifically, in the floating rate portion of the ETF universe we think the tickers JPST, FLOT, CMBS, BKLN and SRLN, all provide us with good guidance as to what size a successful ETF could become. The average AUM of the tickers above is approximately $4.6 billion. We would anticipate that any fund that is $10 billion or less, representing 2.5% or less of the entire first priority CLO bond ecosystem could easily find appropriate investments to purchase and manage. Should the fund grow larger than 2.5% of the aggregate first priority CLO bonds outstanding, we believe that management could become more difficult as the fund would start to find difficulty in sourcing enough a diversity of product to satisfy its portfolio constraints, namely its manager and deal level concentration limits, and its WARF requirements.
Hedging and Arbitrage:
To augment the hedging-related commentary we previously provided, we have included below a discussion of two examples of hedges that could be utilized by authorized participants (“APs”) or market makers to ensure proper functioning of the arbitrage mechanism.
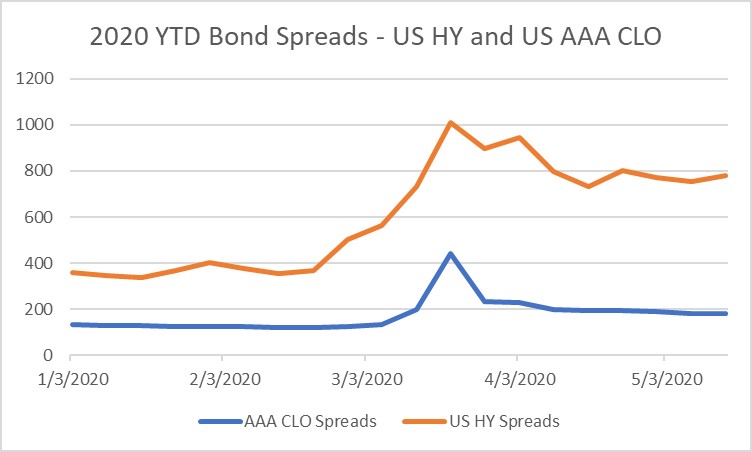
APs seeking to hedge positions in an AAA-rated CLO ETF, such as the Fund, have a variety of liquid financial instruments at their disposal to enact that hedge. First, APs may use a High Yield (“HY”) Bond ETF as an effective investment hedge. Given that high yield bonds and leveraged loans (the assets that CLOs own) have similar [investment risk profiles], including with respect to underlying credit risk, the use of a HY Bond ETF provides a means to hedge oneself. The chart below demonstrates the correlative relationship between US High Yield bond spreads and US AAA-rated CLO bond spreads from the beginning of 2020.
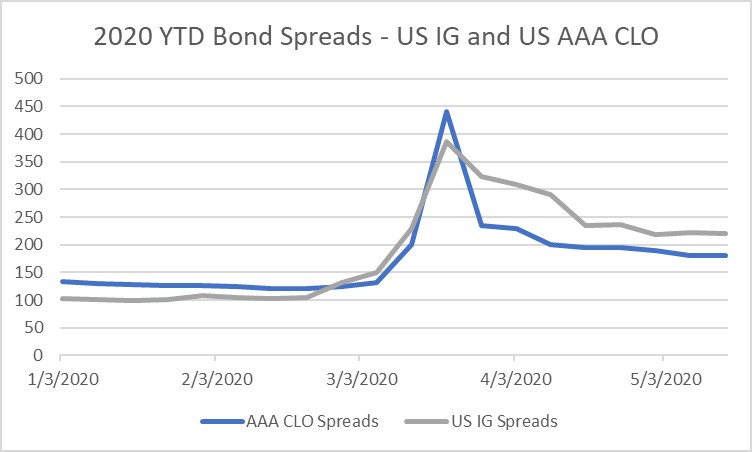
Another useful hedge an AP or market maker could utilize is in the Investment Grade (IG) Corporate space. Given the IG rating of the first priority CLO bond tranche, there exists a great deal of correlation between the spread movements in AAA-rated CLOs and IG Bond Indices. The graph below reflects the correlative relationship between US IG bond spreads and US AAA-rated CLO bond spreads since the beginning of 2020. It should be noted that the correlation (R-squared) value between these two asset classes is .78 and with p-values below that of .00001, making the relationship statistically significant.
Also, as mentioned, we have engaged in discussions with a number APs and market makers in preparation for the launch of the Fund and none expressed a concern regarding their ability to hedge a future investment in the Fund.
Secondary Market Trading update for the latest data from since our correspondence on May 13:
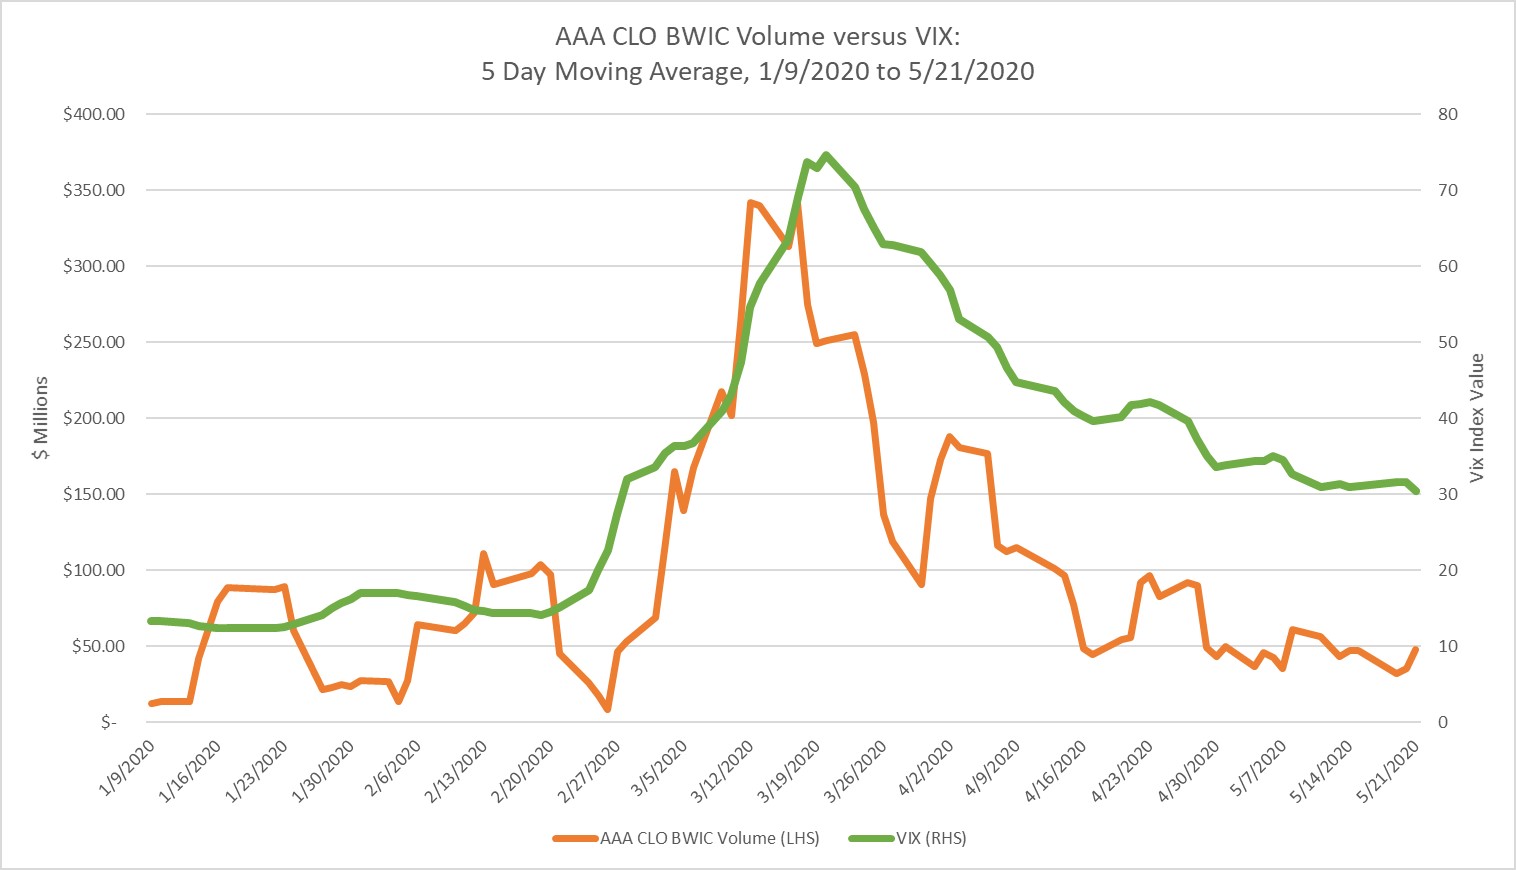
Subsequent to March’s highly elevated trade volumes, global markets have calmed meaningfully as liquidity-driven selling has abated. Similarly, Bid Wanted in Competition (“BWIC”) volumes of AAA-rated CLOs have also subsided to levels that, while still elevated, are more in line with their historical daily averages. Throughout the past couple of months of elevated global market volatility, AAA-rated CLO trade volumes have been directly correlated with market measures of volatility, meaning that AAA-rated CLOs remained liquid even as markets endured varied levels of stress.
We have updated the chart below, which was initially included in the Fund’s May 13th correspondence with Staff to reflect the most recently available data. The chart shows the trailing five-day average of AAA-rated CLO BWIC volumes over the last four
months on the left-hand axis. Additionally, the chart shows the trailing five-day average of the closing value of the CBOE Volatility Index (VIX) on the right-hand axis. The VIX Index is a calculation designed to produce a measure of constant, 30-day expected volatility of the U.S. stock market, derived from real-time, mid-quote prices of S&P 500® Index (SPXSM) call and put options. On a global basis, it is one of the most recognized measures of volatility -- widely reported by financial media and closely followed by a variety of market participants as a daily market indicator. The chart shows a significant increase in AAA-rated CLO BWIC volumes over late February and throughout March, coinciding with the dramatic spike in market volatility (as measured by VIX) over this same time period - as markets became increasingly stressed, trade volumes and liquidity in AAA-rated CLOs increased dramatically. As markets calmed over the month of April, the VIX and AAA-rated CLO trade volumes also decreased. The decrease in AAA-rated CLO trade volumes was not a function of any particular catalyst and, in fact, the baseline level of volume and liquidity remained slightly elevated relative to recent history before the COVID-19-instigated volatility of March 2020. For these reasons and those previously discussed in prior correspondence, we believe that AAA-rated CLOs remain highly liquid and appropriate for an ETF structure during times of both moderate and extreme market stress.
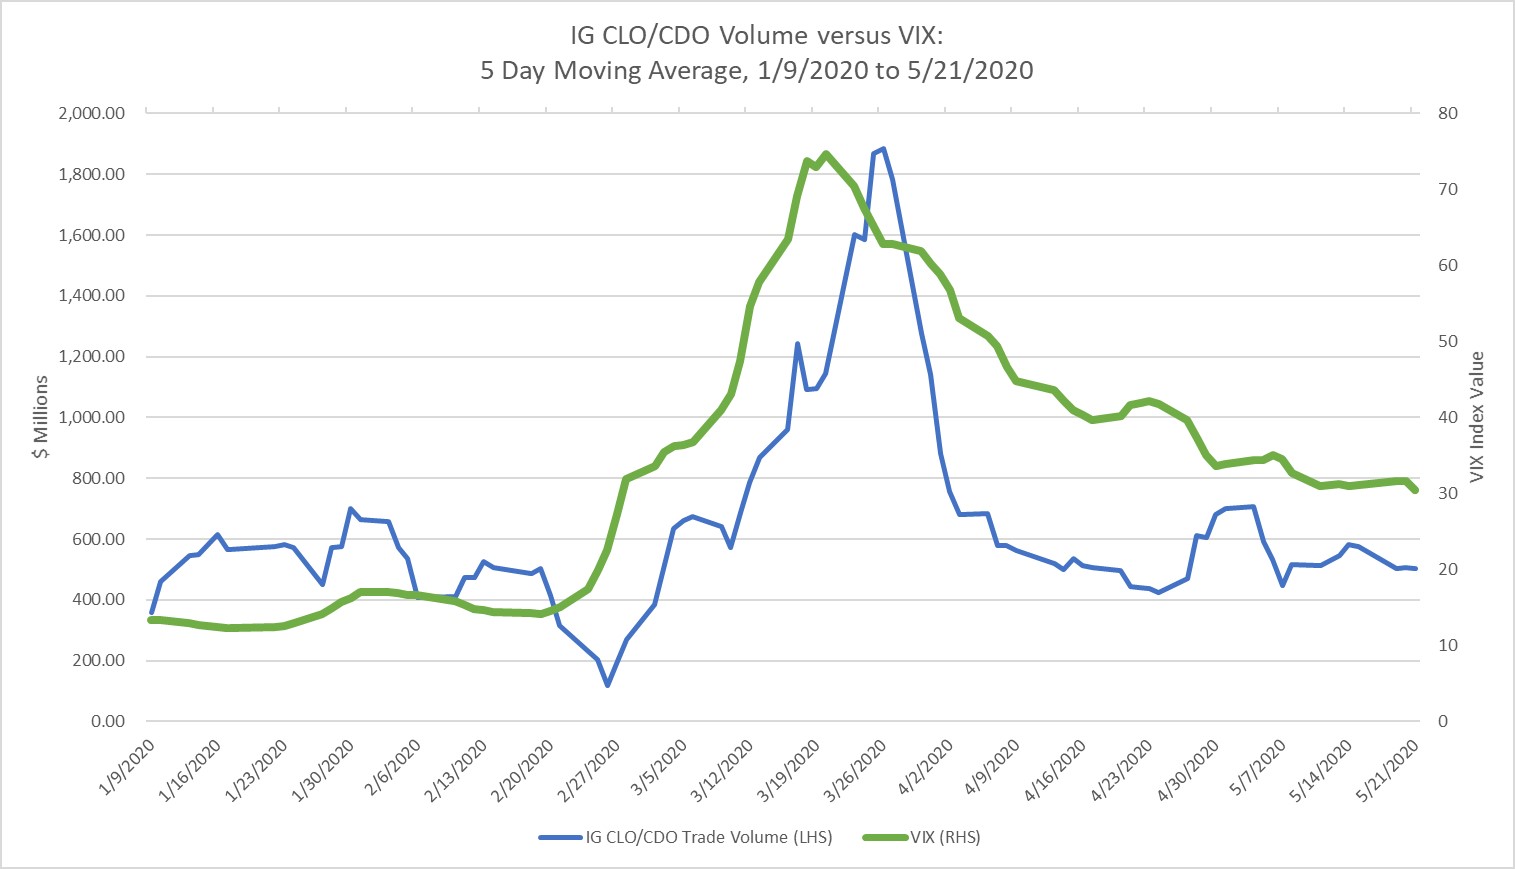
Similar to the decline in global volatility and the all-time high levels of BWIC volumes, FINRA’s TRACE reported volumes for the “Investment Grade CLO/CBO/CDO” bucket have also declined from all-time highs. While these numbers have receded somewhat, they remain elevated versus volumes witnessed prior to March 2020. The chart below provides us a parallel chart to the BWIC data presented above. As we have noted previously, not all volume is represented by BWIC volumes and a significant amount of trading occurs on a bilateral basis.
Liquidity and Fund Appropriateness:
In our assessment of liquidity and fund appropriateness, we continue to be mindful of what the capacity of the market is in its ability to absorb a large redemption from an ETF such as ours. We utilize our analysis of potential fund size from above, along with observations from the recently experienced volatility and trading volume to come to conclusions about the ability of the ETF to operate during periods of stress.
In our analysis we assume that the fund had grown to ~$4 billion similar to that of the average of the other successful floating rate ETFs. We then employ a “reasonably anticipated trade size (RATS)” analysis, to determine if the volume required to meet a reasonably sized redemption would fall within the bounds of the trading volumes experienced during the recent period of stress. Here we assume that a one-day reasonable redemption request is for 10% of the outstanding shares of the fund, or in our hypothetical $400 million. Further we note that daily IG CLO/CD volumes spiked to above $1.8 billion during the most extreme periods of the recent market sell off. We conclude that there is more than reasonable market volume during periods of stress to fully cover a reasonably anticipated trade size and would not impact the Fund's liquidity classifications.
* * *
If you have any questions or require further information, please contact Kent Barnes at (414) 765-6511 or kent.barnes@usbank.com.
Sincerely,
/s/ Kent P. Barnes
Kent P. Barnes
Secretary