UNITED STATES
SECURITIES AND EXCHANGE COMMISSION
Washington, D.C. 20549
FORM N-CSR
CERTIFIED SHAREHOLDER REPORT OF REGISTERED
MANAGEMENT INVESTMENT COMPANIES
Investment Company Act file number (811-23226)
Listed Funds Trust
(Exact name of registrant as specified in charter)
615 East Michigan Street
Milwaukee, WI 53202
(Address of principal executive offices) (Zip code)
Kent P. Barnes, Secretary
Listed Funds Trust
c/o U.S. Bancorp Fund Services, LLC
777 East Wisconsin Avenue, 10th Floor
Milwaukee, WI 53202
(Name and address of agent for service)
(414) 516-1681
Registrant's telephone number, including area code
Date of fiscal year end: September 30
Date of reporting period: September 30, 2022
Item 1. Reports to Stockholders.

Innovative ETFs
Dividend Performers ETF (IPDP)
Preferred-Plus ETF (IPPP)
ANNUAL REPORT
September 30, 2022
Innovative ETFs
Table of Contents
| | |
Management Discussion of Fund Performance (Unaudited) | 2 |
Dividend Performers ETF | 2 |
Preferred-Plus ETF | 3 |
Shareholder Expense Example (Unaudited) | 5 |
Performance Overview (Unaudited) | 6 |
Dividend Performers ETF | 6 |
Preferred-Plus ETF | 7 |
Schedules of Investments and Written Options | 8 |
Dividend Performers ETF | 8 |
Preferred-Plus ETF | 11 |
Statements of Assets and Liabilities | 15 |
Statements of Operations | 16 |
Statements of Changes in Net Assets | 17 |
Financial Highlights | 19 |
Notes to Financial Statements | 21 |
Report of Independent Registered Public Accounting Firm | 32 |
Trustees and Officers of the Trust (Unaudited) | 33 |
Supplemental Information (Unaudited) | 35 |
Review of Liquidity Risk Management Program (Unaudited) | 37 |
Privacy Policy (Unaudited) | 38 |
1
Dividend Performers ETF
Management Discussion of Fund Performance
September 30, 2022 (Unaudited)
Market Review
On March 7, 2022, Innovative Portfolios’ Dividend Performers Mutual Fund (IPDPX) converted to the Dividend Performers ETF (IPDP). The ETF is currently listed with the CBOE (formerly Chicago Board of Options Exchange). Over the last twelve months, the capital markets have lost trillions of dollars as both equities and fixed income have sold-off due to a wide range of macroeconomic factors. Inflation has reached a 40-year high, and the Federal Reserve has been aggressively increasing interest rate to combat it. These conditions have caused investors to recalibrate financial models and lower multiples. Additionally, growth has been slowing around the world. As such, recession risk has risen substantially throughout the year.
Performance Discussion
Performance ending September 30, 2022 | 1-Year
Annualized | 3-Year
Annualized | Since Inception
Annualized
(12/24/18) |
Dividend Performers ETF - Market Price | -23.31% | 5.72% | 10.44% |
Dividend Performers ETF - NAV | -22.92% | 5.86% | 10.56% |
NASDAQ U.S. Broad Dividend Achievers™ Index | -7.85% | 5.67% | 11.80% |
S&P 500 Index | -15.47% | 8.16% | 13.80% |
After strong performance in years 2019-2021, 2022 has been a tough year. While Q1 of fiscal 2022 continued being strong, the market peaked at the beginning of January 2022. Over the next three quarters, inflation, increasing interest rates, and slowing growth have hurt performance materially. Dividend Performers is comprised of 50 common equities with an option overlay. The stocks are selected for their history of raising dividends and quality downside risk quantitative scores from Revelation Investment Research. The current market environment plays into the strength of this selection method which favors value which outperformed growth and the broad market over the last 12 months. From a sector allocation perspective, underweight energy and consumer staples detracted from performance while being underweight communication and materials contributed to performance relative to the benchmark.
While the underlying stock portfolio contributed toward performance, the option overlay strategy resulted in underperformance of the fund. The put-credit spread on the S&P 500 Index or similar ETF has shown effectiveness in bull markets as seen in 2019-2021; however, the bear market of 2022 has shown the potential negative impact.
Portfolio Activity
Over the last year, the fund sold 16 out of the 50 positions. Stocks fell out of the portfolio either for failing to raise dividends or weakening quantitative downside risk scores. They were replaced by the top ranked stocks of the Dividend Achievers Index based on our screening. As of September 30, 2022, the largest overweight sectors compared to the Dividend Achievers Index was Industrials and Information Technology, while the largest underweight were Consumer Staples and Discretionary. Over the year, the option positions changed numerous times with new positions or rolling into the future.
Investing Outlook
Current market conditions look difficult in the immediate term with inflation at high levels, growth slowing, and the Fed raising interest rates. Given the conflux of factors, economists have been increasing the odds of a recession (if not in one already). Signs of strength include high employment, modestly healthy consumer financial conditions, and relatively strong corporate balance sheets. As rates continue increasing, valuation models will put greater influence on the near term rather than potential future earnings, often referred to as short duration equities. We believe these changes will likely continue favoring value stocks, especially dividend paying ones. Additionally, dividends generated are likely to be a much larger contributor to total return in the coming quarters than in recent history.
2
Preferred-Plus ETF
Management Discussion of Fund Performance
September 30, 2022 (Unaudited)
Performance of the Fund
The total return for the Preferred-Plus (the “Fund”) and its comparative benchmarks for the year ending September 30, 2022 were:
Performance ending September 30, 2022 | 1-Year
Annualized | 3-Year
Annualized | Since
Inception1 |
Preferred-Plus ETF – Market Price | -18.88% | -0.99% | 3.19% |
Preferred-Plus ETF – NAV | -18.64% | -0.59% | 3.53% |
S&P U.S. Preferred Stock Index | -16.25% | -0.85% | 3.75% |
ICE BofA Core Plus Fixed Rate Preferred Securities Index | -16.35% | -2.22% | 2.69% |
1 | The Fund’s inception date is December 24, 2018. |
Market Review
Preferred securities, as measured by the S&P U.S. Preferred Stock Index, had a loss for the 12-month period ending September 30, 2022. The U.S. Federal Reserve (the “Fed”) abandoned their “transitory” inflation outlook after headline inflation rose at the fasted rate in 40 years. To combat inflation, the Fed (starting in mid-March) increased the Federal Funds target rate from 0.25% to 3.25%. This action has had a dramatic effect on capital markets. Year-to-date, as of September 30, equities lost approximately 24% as measured by the S&P 500 Index, while bonds are down approximately 15% as measured by the Bloomberg U.S. Aggregate Index Bond.
Portfolio Activity
The preferred security market is inefficient due to its small market capitalization, complexity, and variety of security structures available. We believe that a comprehensive analysis of the different structures, credit quality, economic and interest rate outlook can result in outperformance.
For the period ending September 30, 2022, the main contributor to the Fund’s performance was the fund’s lower duration versus the benchmark. Based on an increasing interest rate outlook, the Fund maintained a lower duration versus the benchmark, by maintaining higher than average cash levels along with a strong allocation to fixed-to-float coupon structures. Security selection in the banking sector also contributed to the Fund’s performance.
The main detractor to the Fund’s performance was the option overlay. The Fund’s options overlay seeks additional returns by selling or “writing” credit spreads on the S&P 500. The significant decline in the S&P 500 resulted in negative performance for the Fund’s option overlay.
Investment Outlook
The recent sell-off in preferred equity has resulted in attractive yields for preferred investors. New issue preferred securities are coming to market with coupons in the 6-7% range, well above recent averages. Credit quality among banks, who are the largest issuers of preferred securities, remains sound. Banks are reporting better than expected loan growth and an increase in net interest margins.
In addition to the strong fundamentals of preferred issuers, the technicals look favorable. Supply is expected to shrink going forward as most preferred issuers took advantage of the recent low rates to issue needed preferred capital, while demand should remain strong given investors’ continuing search for yield.
3
Preferred-Plus ETF
Management Discussion of Fund Performance
September 30, 2022 (Unaudited) (Continued)
The average credit rating of issuers in the fund is BBB+. Credit spreads widened during the third quarter and could widen further as the prospect of a recession grows. We prefer structures with higher resets and have started to lean towards higher-quality issuers.
The Federal Reserve is in a difficult situation as they need to combat inflation in the face of an economic slowdown. We feel that they lost some creditability by labeling inflation as “transitory” too long and now are taking aggressive steps to break inflation even if that results in a recession.
The continuing fight against inflation, economic slowing, and geopolitical issues adds up to a volatile market. However, this uncertainty is providing opportunities for investors looking for income. Preferred yields are the highest they have been since a brief spike in yields during the Covid pandemic and are well placed versus other fixed income investment with comparable credit quality. In addition to higher yields, most preferred securities pay qualified dividend income meaning the income in taxed at the lower capital gains rate than ordinary income rates.
4
Innovative ETFs
Shareholder Expense Example
(Unaudited)
As a shareholder of a fund you incur two types of costs: (1) transaction costs, including brokerage commissions on purchases and sales of fund shares; and (2) ongoing costs, including management fees and other fund expenses. The following example is intended to help you understand your ongoing costs (in dollars and cents) of investing in the Funds and to compare these costs with the ongoing costs of investing in other funds. The examples are based on an investment of $1,000 invested at the beginning of the period and held throughout the entire period (April 1, 2022 to September 30, 2022).
ACTUAL EXPENSES
The first line under the Funds in the table below provides information about actual account values and actual expenses. You may use the information in this line, together with the amount you invested, to estimate the expenses that you paid over the period. Simply divide your account value by $1,000 (for example, an $8,600 account value divided by $1,000 = 8.6), then multiply the result by the number in the first line for your Fund under the heading entitled “Expenses Paid During Period” to estimate the expenses you paid on your account during this period.
HYPOTHETICAL EXAMPLE FOR COMPARISON PURPOSES
The second line in the table provides information about hypothetical account values and hypothetical expenses based on each Fund’s actual expense ratio and an assumed rate of return of 5% per year before expenses, which is not the Fund’s actual return. The hypothetical account values and expenses may not be used to estimate the actual ending account balance or expenses you paid for the period. You may use this information to compare the ongoing costs of investing in the Funds and other funds. To do so, compare this 5% hypothetical example with the 5% hypothetical examples that appear in the shareholder reports of the other funds. Please note that the expenses shown in the table are meant to highlight your ongoing costs only and do not reflect any transactional costs, such as brokerage commissions paid on purchases and sales of Fund shares. Therefore, the second line in the table is useful in comparing ongoing Fund costs only and will not help you determine the relative total costs of owning different funds. In addition, if these transactional costs were included, your costs would have been higher.
| | Beginning
Account Value
4/1/22 | Ending
Account Value
9/30/22 | Annualized
Expense
Ratios | Expenses
Paid During
the Period(1) |
Dividend Performers ETF | | | | |
Actual | $ 1,000.00 | $ 704.80 | 1.25% | $5.34 |
Hypothetical (5% return before expenses) | $ 1,000.00 | $ 1,018.80 | 1.25% | $6.33 |
Preferred-Plus ETF | | | | |
Actual | $ 1,000.00 | $ 840.40 | 1.06% | $4.89 |
Hypothetical (5% return before expenses) | $ 1,000.00 | $ 1,019.75 | 1.06% | $5.37 |
(1) | Expenses are calculated using the Fund’s annualized expense ratio, multiplied by the average account value for the period, multiplied by 183/365 (to reflect the six-month period). |
5
Dividend Performers ETF
Performance Overview
September 30, 2022 (Unaudited)
Hypothetical Growth of $10,000 Investment
(Since Commencement through 09/30/2022)
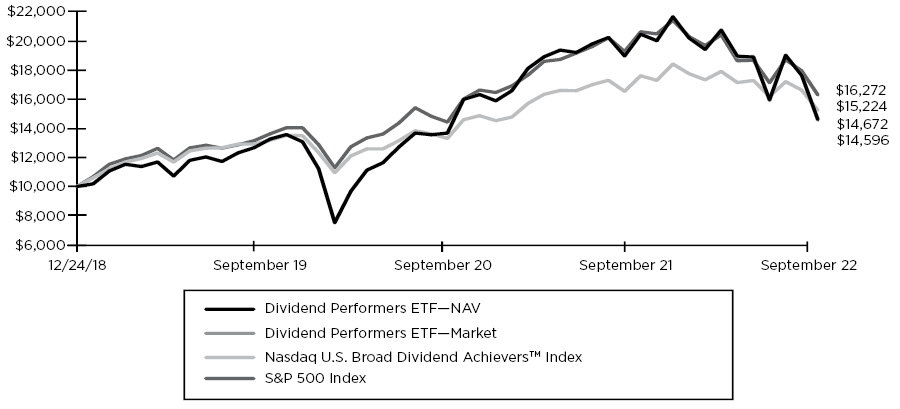
ANNUALIZED TOTAL RETURN FOR THE PERIODS ENDED SEPTEMBER 30, 2022 |
Total Returns | One
Year | Three
Year | Since
Commencement1 |
Dividend Performers ETF—NAV | -22.92% | 5.86% | 10.56% |
Dividend Performers ETF—Market | -23.31% | 5.72% | 10.44% |
Nasdaq U.S. Broad Dividend AchieversTM Index | -7.85% | 5.67% | 11.80% |
S&P 500 Index | -15.47% | 8.16% | 13.80% |
1 | The Fund commenced operations on December 24, 2018. |
The Fund is the successor to the investment performance of Dividend Performers (the “Predecessor Fund”) as a result of the reorganization of the Predecessor Fund into the Fund before the start of business on March 7, 2022. Accordingly, the performance information shown in the chart and table above for the periods prior to before the start of business on March 7, 2022, is that of the Predecessor Fund’s shares for the Fund. The Predecessor Fund was managed by the same portfolio managers as the Fund and had substantially the same investment objectives, policies, and strategies as the Fund.
The performance data quoted represents past performance. Past performance does not guarantee future results. Current performance may be lower or higher than the performance data quoted. The investment return and principal value of an investment will fluctuate so that an investor’s shares, when sold or redeemed, may be worth more or less than their original cost. For the most recent month-end performance, please call 1-866-704-6857. You cannot invest directly in an index. Shares are bought and sold at market price (closing price), not net asset value (NAV), and are individually redeemed from the Fund. Market performance is determined using the bid/ask midpoint at 4:00pm Eastern time when the NAV is typically calculated. Brokerage commissions will reduce returns. Returns shown include the reinvestment of all dividends and distribution. Returns shown do not reflect the deduction of taxes that a shareholder would pay on fund distributions or the redemption of fund shares.
The NASDAQ U.S. Broad Dividend AchieversTM Index is comprised of U.S. accepted securities with at least ten consecutive years of increasing annual regular dividend payments.
The S&P 500 Index is a market-value weighted index consisting of 500 stocks chosen for market size, liquidity, and industry group representation, with each stock’s weight in the Index proportionate to its market value.
6
Preferred-Plus ETF
Performance Overview
September 30, 2022 (Unaudited)
Hypothetical Growth of $10,000 Investment
(Since Commencement through 09/30/2022)
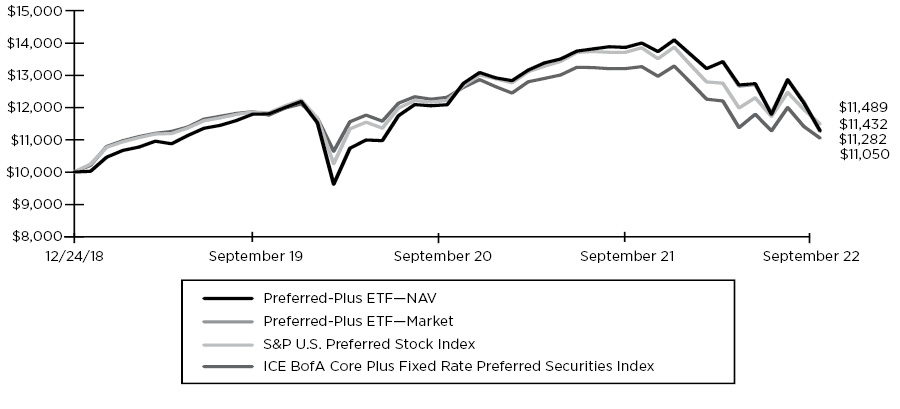
ANNUALIZED TOTAL RETURN FOR THE PERIODS ENDED SEPTEMBER 30, 2022 |
Total Returns | One
Year | Three
Year | Since
Commencement1 |
Preferred-Plus ETF—NAV | -18.64% | -0.59% | 3.53% |
Preferred-Plus ETF—Market | -18.88% | -0.99% | 3.19% |
ICE BofA Core Plus Fixed Rate Preferred Securities Index | -16.35% | -2.22% | 2.69% |
S&P U.S. Preferred Stock Index | -16.25% | -0.85% | 3.75% |
1 | The Fund commenced operations on December 24, 2018. |
The Fund is the successor to the investment performance of Preferred-Plus (the “Predecessor Fund”) as a result of the reorganization of the Predecessor Fund into the Fund before the start of business on March 7, 2022. Accordingly, the performance information shown in the chart and table above for the periods prior to before the start of business on March 7, 2022, is that of the Predecessor Fund’s shares for the Fund. The Predecessor Fund was managed by the same portfolio managers as the Fund and had substantially the same investment objectives, policies, and strategies as the Fund.
The performance data quoted represents past performance. Past performance does not guarantee future results. Current performance may be lower or higher than the performance data quoted. The investment return and principal value of an investment will fluctuate so that an investor’s shares, when sold or redeemed, may be worth more or less than their original cost. For the most recent month-end performance, please call 1-866-704-6857. You cannot invest directly in an index. Shares are bought and sold at market price (closing price), not net asset value (NAV), and are individually redeemed from the Fund. Market performance is determined using the bid/ask midpoint at 4:00pm Eastern time when the NAV is typically calculated. Brokerage commissions will reduce returns. Returns shown include the reinvestment of all dividends and distribution. Returns shown do not reflect the deduction of taxes that a shareholder would pay on fund distributions or the redemption of fund shares.
The ICE BofA Core Plus Fixed Rate Preferred Securities Index is an index designed to measure the performance of fixed rate U.S. dollar denominated preferred securities issued in the U.S domestic market with a rating of at least B3 (based on an average of Moody’s, S&P and Fitch) and an investment-grade country risk profile.
The S&P U.S. Preferred Securities Index is an index designed to measure the performance of the U.S. preferred stock market and consists of U.S. preferred stocks with a market cap greater than $100 million and a maturity of at least one year or longer.
7
Dividend Performers ETF
Schedule of Investments
September 30, 2022
Description | | Shares | | | Value | |
COMMON STOCKS — 124.3% | | | | | | | | |
Auto Manufacturers — 2.7% | | | | | | | | |
Cummins, Inc. (a) | | | 1,684 | | | $ | 342,711 | |
| | | | | | | | | |
Banks — 2.8% | | | | | | | | |
1st Source Corp. (a) | | | 7,581 | | | | 351,000 | |
| | | | | | | | | |
Chemicals — 2.1% | | | | | | | | |
The Sherwin-Williams Co. (a) | | | 1,289 | | | | 263,923 | |
| | | | | | | | | |
Commercial Services — 10.1% | | | | | | | | |
ABM Industries, Inc. (a) | | | 7,310 | | | | 279,461 | |
Automatic Data Processing, Inc. | | | 1,578 | | | | 356,928 | |
Cintas Corp. (a) | | | 914 | | | | 354,806 | |
Robert Half International, Inc. | | | 3,749 | | | | 286,798 | |
| | | | | | | | 1,277,993 | |
Computers — 2.4% | | | | | | | | |
Accenture PLC - Class A (a)(b) | | | 1,202 | | | | 309,274 | |
| | | | | | | | | |
Cosmetics & Personal Care — 2.5% | | | | | | | | |
Colgate-Palmolive Co. (a) | | | 4,422 | | | | 310,645 | |
| | | | | | | | | |
Distribution & Wholesale — 5.1% | | | | | | | | |
Fastenal Co. (a) | | | 6,457 | | | | 297,280 | |
WW Grainger, Inc. (a) | | | 716 | | | | 350,260 | |
| | | | | | | | 647,540 | |
Diversified Financial Services — 4.6% | | | | | | | | |
Cohen & Steers, Inc. (a) | | | 4,584 | | | | 287,096 | |
SEI Investments Co. | | | 5,957 | | | | 292,191 | |
| | | | | | | | 579,287 | |
Electrial Components & Equipment — 2.3% | | | | | | | | |
Emerson Electric Co. (a) | | | 3,972 | | | | 290,830 | |
| | | | | | | | | |
Electronics — 5.4% | | | | | | | | |
Amphenol Corp. - Class A | | | 4,843 | | | | 324,287 | |
Hubbell, Inc. (a) | | | 1,624 | | | | 362,152 | |
| | | | | | | | 686,439 | |
Food — 2.3% | | | | | | | | |
The Kroger Co. | | | 6,737 | | | | 294,744 | |
| | | | | | | | | |
Hand & Machine Tools — 7.8% | | | | | | | | |
Franklin Electric Co., Inc. (a) | | | 4,274 | | | | 349,229 | |
Lincoln Electric Holdings, Inc. (a) | | | 2,541 | | | | 319,454 | |
Snap-on, Inc. (a) | | | 1,583 | | | | 318,737 | |
| | | | | | | | 987,420 | |
Healthcare - Products — 4.5% | | | | | | | | |
Abbott Laboratories (a) | | | 2,934 | | | | 283,894 | |
Stryker Corp. (a) | | | 1,431 | | | | 289,835 | |
| | | | | | | | 573,729 | |
Healthcare - Services — 10.4% | | | | | | | | |
Chemed Corp. | | | 684 | | | | 298,607 | |
Elevance Health, Inc. | | | 673 | | | | 305,703 | |
Humana, Inc. | | | 751 | | | | 364,378 | |
UnitedHealth Group, Inc. (a) | | | 685 | | | | 345,952 | |
| | | | | | | | 1,314,640 | |
Household Products & Wares — 2.6% | | | | | | | | |
Avery Dennison Corp. (a) | | | 2,020 | | | | 328,654 | |
| | | | | | | | | |
Insurance — 7.8% | | | | | | | | |
Globe Life, Inc. | | | 3,551 | | | | 354,035 | |
The Allstate Corp. (a) | | | 2,701 | | | | 336,356 | |
The Hanover Insurance Group, Inc. (a) | | | 2,348 | | | | 300,873 | |
| | | | | | | | 991,264 | |
Machinery - Diversified — 7.5% | | | | | | | | |
Applied Industrial Technologies, Inc. (a) | | | 3,304 | | | | 339,585 | |
Dover Corp. (a) | | | 2,540 | | | | 296,113 | |
Tennant Co. (a) | | | 5,547 | | | | 313,738 | |
| | | | | | | | 949,436 | |
| | | | | | | | | |
Miscellaneous Manufacturing — 9.7% | | | | | | | | |
3M Co. (a) | | | 2,310 | | | | 255,255 | |
Carlisle Cos., Inc. (a) | | | 1,148 | | | | 321,911 | |
Donaldson Co., Inc. (a) | | | 6,671 | | | | 326,946 | |
Eaton Corp PLC (a)(b) | | | 2,477 | | | | 330,333 | |
| | | | | | | | 1,234,445 | |
| | | | | | | | | |
The accompanying notes are an integral part of the financial statements.
8
Dividend Performers ETF
Schedule of Investments
September 30, 2022 (Continued)
Description | | Shares | | | Value | |
Pharmaceuticals — 7.6% | | | | | | | | |
AmerisourceBergen Corp. (a) | | | 2,212 | | | $ | 299,350 | |
Johnson & Johnson (a) | | | 1,878 | | | | 306,790 | |
McKesson Corp. (a) | | | 1,030 | | | | 350,066 | |
| | | | | | | | 956,206 | |
Retail — 5.3% | | | | | | | | |
Genuine Parts Co. (a) | | | 2,343 | | | | 349,857 | |
Target Corp. (a) | | | 2,139 | | | | 317,406 | |
| | | | | | | | 667,263 | |
Semiconductors — 9.2% | | | | | | | | |
Analog Devices, Inc. (a) | | | 2,046 | | | | 285,090 | |
Broadcom, Inc. (a) | | | 612 | | | | 271,734 | |
KLA Corp. (a) | | | 990 | | | | 299,604 | |
Microchip Technology, Inc. (a) | | | 4,983 | | | | 304,112 | |
| | | | | | | | 1,160,540 | |
Software — 7.2% | | | | | | | | |
Microsoft Corp. | | | 1,292 | | | | 300,907 | |
Oracle Corp. (a) | | | 4,841 | | | | 295,640 | |
Paychex, Inc. (a) | | | 2,832 | | | | 317,779 | |
| | | | | | | | 914,326 | |
Telecommunications — 2.4% | | | | | | | | |
Cisco Systems, Inc. | | | 7,687 | | | | 307,480 | |
| | | | | | | | | |
TOTAL COMMON STOCKS (Cost $15,840,191) | | | | | | | 15,739,789 | |
| | | | | | | | | |
MONEY MARKET FUNDS — 1.6% | | | | | | | | |
First American Government Obligations Fund - Class X, 2.77% (d) | | | 207,872 | | | | 207,872 | |
TOTAL MONEY MARKET FUNDS (Cost $207,872) | | | | | | | 207,872 | |
| | Number of
Contracts (c) | | | Value | | | Notional
Value | |
PURCHASED OPTIONS — 5.9% | | | | | | | | |
PURCHASED PUT OPTIONS — 5.9% | | | | | | | | |
CBOE Mini S&P 500 Index | | | | | | | | | | | | |
Expiration: October 2022, Exercise Price: $369 (e) | | | 193 | | | $ | 279,561 | | | $ | 7,121,700 | |
Expiration: October 2022, Exercise Price: $370 (e) | | | 184 | | | | 296,148 | | | | 6,808,000 | |
Expiration: November 2022, Exercise Price: $355 (e) | | | 143 | | | | 174,746 | | | | 5,076,500 | |
TOTAL PURCHASED OPTIONS (Cost $375,369) | | | | | | | 750,455 | | | | | |
| | | | | | | | | | | | | |
TOTAL INVESTMENTS (Cost $16,423,432) — 131.8% | | | | | | | 16,698,116 | | | | | |
Other Assets and Liabilities, net — (31.8)% | | | | | | | (4,031,357 | ) | | | | |
NET ASSETS — 100.0% | | | | | | $ | 12,666,759 | | | | | |
Percentages are stated as a percent of net assets.
CBOE Chicago Board Options Exchange
PLC Public Limited Company
(a) | A portion or all of the security has been segregated or earmarked as collateral for written options. As of September 30, 2022, the value of these securities amounts to $10,596,105 or 83.7% of net assets. |
(b) | Foreign issued security. |
(c) | Each contract has a multiplier of 100. |
(d) | The rate shown is the seven-day yield at period end. |
(e) | Held in connection with a written option, see Schedule of Written Options for more detail. |
The accompanying notes are an integral part of the financial statements.
9
Dividend Performers ETF
Schedule of Written Options
September 30, 2022
| | Number of
Contracts (a) | | | Value | | | Notional
Value | |
WRITTEN OPTIONS — (31.8)% | | | | | | | | |
WRITTEN PUT OPTIONS — (31.8)% | | | | | | | | |
CBOE Mini S&P 500 Index | | | | | | | | | | | | |
Expiration: October 2022, Exercise Price: $439 | | | 193 | | | $ | 1,515,050 | | | $ | 8,472,700 | |
Expiration: October 2022, Exercise Price: $440 | | | 184 | | | | 1,459,672 | | | | 8,096,000 | |
Expiration: November 2022, Exercise Price: $435 | | | 143 | | | | 1,059,487 | | | | 6,220,500 | |
TOTAL WRITTEN OPTIONS (Premiums Received $2,538,267) | | | | | | $ | 4,034,209 | | | | | |
Percentages are stated as a percent of net assets.
CBOE Chicago Board Options Exchange
(a) Each contract has a multiplier of 100.
The accompanying notes are an integral part of the financial statements.
10
Preferred-Plus ETF
Schedule of Investments
September 30, 2022
Description | | Shares | | | Value | |
CLOSED-END FUNDS — 0.2% | | | | | | | | |
Cohen & Steers Limited Duration Preferred and Income Fund, Inc. (a) | | | 1,343 | | | $ | 24,309 | |
TOTAL CLOSED-END FUNDS (Cost $31,138) | | | | | | | 24,309 | |
| | | | | | | | | |
PREFERRED STOCKS — 108.5% | | | | | | | | |
Agriculture — 2.0% | | | | | | | | |
CHS, Inc. | | | | | | | | |
Series 2, 7.100% (3 Month LIBOR USD + 4.298%), 03/31/2024 (a)(f)(g) | | | 4,528 | | | | 112,566 | |
Series 4, 7.500%, 01/21/2025 (a)(g) | | | 5,255 | | | | 139,993 | |
| | | | | | | | 252,559 | |
Auto Manufacturers — 2.8% | | | | | | | | |
Ford Motor Co. | | | | | | | | |
6.000%, 12/01/2059 (a)(h) | | | 8,060 | | | | 187,556 | |
6.200%, 06/01/2059 (a)(h) | | | 6,769 | | | | 165,028 | |
| | | | | | | | 352,584 | |
Banks — 47.5% (e) | | | | | | | | |
Bank of America Corp. | | | | | | | | |
Series HH, 5.875%, 07/24/2023 (g) | | | 6,769 | | | | 158,192 | |
Series LL, 5.000%, 09/17/2024 (g) | | | 6,900 | | | | 141,243 | |
Citigroup Capital XIII | | | | | | | | |
9.176% (3 Month LIBOR USD + 6.370%), 10/30/2040 (a)(f)(h) | | | 4,720 | | | | 131,688 | |
Citigroup, Inc. | | | | | | | | |
Series J, 7.125% (3 Month LIBOR USD + 4.040%), 09/30/2023 (f)(g) | | | 6,900 | | | | 176,847 | |
Series K, 6.875% (3 Month LIBOR USD + 4.130%), 11/15/2023 (a)(f)(g) | | | 11,475 | | | | 294,104 | |
Citizens Financial Group, Inc. | | | | | | | | |
Series D, 6.350% (3 Month LIBOR USD + 3.642%), 04/06/2024 (f)(g) | | | 6,900 | | | | 172,155 | |
ConnectOne Bancorp, Inc. | | | | | | | | |
Series A, 5.250% (5 Year CMT Rate + 4.420%), 09/01/2026 (a)(f)(g) | | | 5,740 | | | | 113,939 | |
Dime Community Bancshares, Inc. | | | | | | | | |
5.500%, 02/15/2025 (a)(g) | | | 6,900 | | | | 135,723 | |
Fifth Third Bancorp | | | | | | | | |
Series I, 6.625% (3 Month LIBOR USD + 3.710%), 12/31/2023 (f)(g) | | | 7,165 | | | | 182,492 | |
Series K, 4.950%, 09/30/2024 (a)(g) | | | 4,590 | | | | 96,941 | |
First Citizens BancShares, Inc. | | | | | | | | |
Series A, 5.375% 03/15/2025 (a)(g) | | | 5,165 | | | | 110,531 | |
First Republic Bank | | | | | | | | |
Series I, 5.500%, 06/30/2023 (g) | | | 3,450 | | | | 79,419 | |
JPMorgan Chase & Co. | | | | | | | | |
Series DD, 5.750%, 12/01/2023 (g) | | | 10,375 | | | | 256,366 | |
Series EE, 6.000%, 03/01/2024 (g) | | | 5,185 | | | | 129,522 | |
Series LL, 4.625%, 06/01/2026 (g) | | | 5,165 | | | | 100,614 | |
KeyCorp | | | | | | | | |
Series E, 6.125% (3 Month LIBOR USD + 3.892%), 12/15/2026 (a)(f)(g) | | | 5,750 | | | | 144,095 | |
6.200% (5 Year CMT Rate + 3.132%), 12/15/2027 (f)(g) | | | 6,234 | | | | 151,175 | |
Midland States Bancorp, Inc. | | | | | | | | |
7.750% (5 Year CMT Rate + 4.713%), 09/30/2027 (f)(g) | | | 2,078 | | | | 53,093 | |
Morgan Stanley | | | | | | | | |
Series E, 7.125% (3 Month LIBOR USD + 4.320%), 10/15/2023 (f)(g) | | | 6,274 | | | | 160,238 | |
Series F, 6.875% (3 Month LIBOR USD + 3.940%), 01/15/2024 (a)(f)(g) | | | 7,097 | | | | 177,993 | |
Series K, 5.850% (3 Month LIBOR USD + 3.491%), 04/15/2027 (a)(f)(g) | | | 8,013 | | | | 194,155 | |
Series P, 6.500%, 10/15/2027 (g) | | | 5,402 | | | | 135,806 | |
Old National Bancorp | | | | | | | | |
Series C, 7.000%, 08/20/2025 (a)(g) | | | 6,900 | | | | 175,122 | |
PacWest Bancorp | | | | | | | | |
Series A, 7.750% (5 Year CMT Rate + 4.820%), 09/01/2027 (f)(g) | | | 6,494 | | | | 163,064 | |
The accompanying notes are an integral part of the financial statements.
11
Preferred-Plus ETF
Schedule of Investments
September 30, 2022 (Continued)
Description | | Shares | | | Value | |
Banks (Continued) | | | | | | | | |
Regions Financial Corp. | | | | | | | | |
Series B, 6.375% (3 Month LIBOR USD + 3.536%), 09/15/2024 (a)(f)(g) | | | 6,829 | | | $ | 174,822 | |
Series C, 5.700% (3 Month LIBOR USD + 3.148%), 05/15/2029 (a)(f)(g) | | | 6,900 | | | | 154,836 | |
State Street Corp. | | | | | | | | |
Series D, 5.900% (3 Month LIBOR USD + 3.108%), 03/15/2024 (f)(g) | | | 5,750 | | | | 143,577 | |
Series G, 5.350% (3 Month LIBOR USD + 3.709%), 03/15/2026 (f)(g) | | | 4,528 | | | | 110,710 | |
Synovus Financial Corp. | | | | | | | | |
Series D, 6.300% (3 Month LIBOR USD + 3.352%), 06/21/2023 (a)(f)(g) | | | 8,034 | | | | 186,549 | |
Series E, 5.875% (5 Year CMT Rate + 4.127%), 07/01/2024 (f)(g) | | | 11,321 | | | | 277,478 | |
The Goldman Sachs Group, Inc. | | | | | | | | |
Series J, 5.500% (3 Month LIBOR USD + 3.640%), 05/10/2023 (f)(g) | | | 6,900 | | | | 170,637 | |
Series K, 6.375% (3 Month LIBOR USD + 3.550%), 05/10/2024 (f)(g) | | | 1,375 | | | | 34,554 | |
Truist Financial Corp. | | | | | | | | |
Series R, 4.750%, 09/01/2025 (a)(g) | | | 7,346 | | | | 145,745 | |
US Bancorp | | | | | | | | |
Series K, 5.500%, 10/15/2023 (g) | | | 6,900 | | | | 163,392 | |
Wells Fargo & Co. | | | | | | | | |
Series L, 7.500%, 12/15/2022 (a) | | | 72 | | | | 86,688 | |
Series Q, 5.850% (3 Month LIBOR USD + 3.090%), 09/15/2023 (a)(f)(g) | | | 6,925 | | | | 155,466 | |
Series R, 6.625% (3 Month LIBOR USD + 3.690%), 03/15/2024 (f)(g) | | | 5,185 | | | | 131,440 | |
WesBanco, Inc. | | | | | | | | |
Series A, 6.750% (5 Year CMT Rate + 6.557%), 11/15/2025 (f)(g) | | | 5,750 | | | | 144,785 | |
Wintrust Financial Corp. | | | | | | | | |
Series E, 6.875% (5 Year CMT Rate + 6.507%), 07/15/2025 (f)(g) | | | 6,900 | | | | 168,636 | |
| | | | | | | | 5,883,832 | |
Distribution & Wholesale — 1.7% | | | | | | | | |
WESCO International, Inc. | | | | | | | | |
Series A, 10.625% (5 Year CMT Rate + 10.325%), 06/22/2025 (f)(g) | | | 7,998 | | | | 215,546 | |
| | | | | | | | | |
Diversified Financial Services — 5.2% | | | | | | | | |
Air Lease Corp. | | | | | | | | |
Series A, 6.150% (3 Month LIBOR USD + 3.650%), 03/15/2024 (a)(f)(g) | | | 6,900 | | | | 154,353 | |
B. Riley Financial, Inc. | | | | | | | | |
5.000%, 12/31/2026 (h) | | | 2,875 | | | | 64,572 | |
Capital One Financial Corp. | | | | | | | | |
Series I, 5.000%, 12/01/2024 (a)(g) | | | 5,821 | | | | 114,266 | |
Series J, 4.800%, 06/01/2025 (a)(g) | | | 3,495 | | | | 64,273 | |
Stifel Financial Corp. | | | | | | | | |
Series D, 4.500%, 08/15/2026 (g) | | | 3,450 | | | | 59,133 | |
Synchrony Financial | | | | | | | | |
Series A, 5.625%, 11/15/2024 (a)(g) | | | 10,172 | | | | 186,148 | |
| | | | | | | | 642,745 | |
Electric — 10.6% | | | | | | | | |
Algonquin Power & Utilities Corp. (b) | | | | | | | | |
Series 19-A, 6.200% (3 Month LIBOR USD + 4.010%), 07/01/2079 (f)(h) | | | 6,900 | | | | 167,049 | |
6.875% (3 Month LIBOR USD + 3.677%), 10/17/2078 (f)(h) | | | 3,450 | | | | 83,800 | |
CMS Energy Corp. | | | | | | | | |
5.875%, 03/01/2079 (h) | | | 3,450 | | | | 80,005 | |
DTE Energy Co. | | | | | | | | |
6.250%, 11/01/2022 (a) | | | 2,211 | | | | 110,860 | |
Duke Energy Corp. | | | | | | | | |
5.625%, 09/15/2078 (a)(h) | | | 6,758 | | | | 165,639 | |
National Rural Utilities Cooperative Finance Corp. | | | | | | | | |
Series US, 5.500%, 05/15/2064 (a)(h) | | | 5,750 | | | | 127,362 | |
SCE Trust III | | | | | | | | |
Series H, 5.750% (3 Month LIBOR USD + 2.990%), 03/15/2024 (f)(g) | | | 5,750 | | | | 118,508 | |
SCE Trust IV | | | | | | | | |
Series J, 5.375% (3 Month LIBOR USD + 3.132%), 09/15/2025 (a)(f)(g) | | | 5,750 | | | | 113,160 | |
SCE Trust V | | | | | | | | |
Series K, 5.450% (3 Month LIBOR USD + 3.790%), 03/15/2026 (a)(f)(g) | | | 5,750 | | | | 117,760 | |
Sempra Energy | | | | | | | | |
5.750%, 07/01/2079 (h) | | | 6,900 | | | | 163,116 | |
The Southern Co. | | | | | | | | |
Series 2020, 4.950%, 01/30/2080 (h) | | | 3,450 | | | | 71,208 | |
| | | | | | | | 1,318,467 | |
Gas — 1.3% | | | | | | | | |
NiSource, Inc. | | | | | | | | |
Series B, 6.500% (5 Year CMT Rate + 3.632%), 03/15/2024 (a)(f)(g) | | | 6,401 | | | | 157,977 | |
| | | | | | | | | |
Insurance — 17.7% | | | | | | | | |
American Equity Investment Life Holding Co. | | | | | | | | |
Series A, 5.950% (5 Year CMT Rate + 4.322%), 12/01/2024 (a)(f)(g) | | | 8,557 | | | | 192,105 | |
Series B, 6.625% (5 Year CMT Rate + 6.297%), 09/01/2025 (a)(f)(g) | | | 8,060 | | | | 191,344 | |
Aspen Insurance Holdings Ltd. (b) | | | | | | | | |
5.625%, 10/01/2024 (g) | | | 3,450 | | | | 69,207 | |
The accompanying notes are an integral part of the financial statements.
12
Preferred-Plus ETF
Schedule of Investments
September 30, 2022 (Continued)
Description | | Shares | | | Value | |
Insurance (Continued) | | | | | | | | |
Athene Holding Ltd. (b) | | | | | | | | |
Series A, 6.350% (3 Month LIBOR USD + 4.253%), 06/30/2029 (a)(f)(g) | | | 11,483 | | | $ | 279,956 | |
Series C, 6.375% (5 Year CMT Rate + 5.970%), 06/30/2025 (f)(g) | | | 4,569 | | | | 115,230 | |
Brighthouse Financial, Inc. | | | | | | | | |
Series B, 6.750%, 06/25/2025 (a)(g) | | | 8,060 | | | | 197,792 | |
6.250%, 09/15/2058 (a)(g)(h) | | | 3,905 | | | | 85,442 | |
Enstar Group Ltd. (b) | | | | | | | | |
Series D, 7.000% (3 Month LIBOR USD + 4.015%), 09/01/2028 (a)(f)(g) | | | 6,900 | | | | 161,805 | |
Equitable Holdings, Inc. | | | | | | | | |
Series A, 5.250%, 12/15/2024 (a)(g) | | | 5,847 | | | | 121,793 | |
Kemper Corp. | | | | | | | | |
5.875% (5 Year CMT Rate + 4.140%), 03/15/2062 (f)(h) | | | 5,165 | | | | 111,771 | |
MetLife, Inc. | | | | | | | | |
Series E, 5.625%, 06/15/2023 (g) | | | 6,390 | | | | 154,638 | |
Prudential Financial, Inc. | | | | | | | | |
5.625%, 08/15/2058 (h) | | | 3,319 | | | | 81,282 | |
The Allstate Corp. | | | | | | | | |
5.100% (3 Month LIBOR USD + 3.165%), 01/15/2053 (f)(h) | | | 6,900 | | | | 166,290 | |
Unum Group | | | | | | | | |
6.250%, 06/15/2058 (h) | | | 3,450 | | | | 86,353 | |
Voya Financial, Inc. | | | | | | | | |
Series B, 5.350% (5 Year CMT Rate + 3.210%), 09/15/2029 (f)(g) | | | 7,401 | | | | 177,328 | |
| | | | | | | | 2,192,336 | |
Investment Companies — 0.7% | | | | | | | | |
Oaktree Capital Group, LLC | | | | | | | | |
Series B, 6.550%, 09/15/2023 (g) | | | 3,450 | | | | 82,765 | |
| | | | | | | | | |
Pipelines — 3.7% | | | | | | | | |
Enbridge, Inc. (b) | | | | | | | | |
Series B, 6.375% (3 Month LIBOR USD + 3.593%), 04/15/2078 (a)(f)(h) | | | 6,829 | | | | 161,643 | |
Energy Transfer LP | | | | | | | | |
Series E, 7.600% (3 Month LIBOR USD + 5.161%), 05/15/2024 (a)(f)(g) | | | 8,060 | | | | 194,971 | |
NuStar Logistics LP | | | | | | | | |
9.246% (3 Month LIBOR USD + 6.734%), 01/15/2043 (f)(h) | | | 4,409 | | | | 107,624 | |
| | | | | | | | 464,238 | |
Real Estate Investment Trusts — 11.2% | | | | | | | | |
AGNC Investment Corp. | | | | | | | | |
Series F, 6.125% (3 Month LIBOR USD + 4.697%), 04/15/2025 (f)(g) | | | 8,053 | | | | 155,101 | |
Annaly Capital Management, Inc. | | | | | | | | |
Series F, 6.950% (3 Month LIBOR USD + 4.993%), 11/01/2022 (f)(g) | | | 3,286 | | | | 78,305 | |
Series I, 6.750% (3 Month LIBOR USD + 4.989%), 06/30/2024 (f)(g) | | | 3,413 | | | | 74,233 | |
Arbor Realty Trust, Inc. | | | | | | | | |
Series F, 6.250% (SOFR + 5.440%), 10/12/2026 (f)(g) | | | 8,000 | | | | 167,280 | |
Chimera Investment Corp. | | | | | | | | |
Series B, 8.000% (3 Month LIBOR USD + 5.791%), 03/30/2024 (f)(g) | | | 4,034 | | | | 70,998 | |
Hudson Pacific Properties, Inc. | | | | | | | | |
Series C, 4.750%, 11/16/2026 (g) | | | 3,319 | | | | 55,394 | |
KKR Real Estate Finance Trust, Inc. | | | | | | | | |
Series A, 6.500%, 04/16/2026 (a)(g) | | | 5,862 | | | | 116,537 | |
MFA Financial, Inc. | | | | | | | | |
Series C, 6.500%, (3 Month LIBOR USD + 5.345%), 03/31/2025 (f)(g) | | | 2,828 | | | | 49,999 | |
Pebblebrook Hotel Trust | | | | | | | | |
Series G, 6.375%, 05/13/2026 (a)(g) | | | 6,900 | | | | 129,030 | |
Public Storage | | | | | | | | |
Series M, 4.125%, 08/14/2025 (a)(g) | | | 1,207 | | | | 22,028 | |
Sachem Capital Corp. | | | | | | | | |
Series A, 7.750%, 06/29/2026 (a)(g) | | | 6,900 | | | | 148,419 | |
6.000%, 12/30/2026 (h) | | | 3,319 | | | | 73,908 | |
6.875%, 12/30/2024 (a)(h) | | | 3,319 | | | | 79,855 | |
Vornado Realty Trust | | | | | | | | |
Series N, 5.250%, 11/24/2025 (a)(g) | | | 9,205 | | | | 162,284 | |
| | | | | | | | 1,383,371 | |
Retail — 0.3% | | | | | | | | |
Qurate Retail, Inc. | | | | | | | | |
8.000%, 03/15/2031 (h) | | | 683 | | | | 31,104 | |
| | | | | | | | | |
Savings & Loans — 1.6% | | | | | | | | |
New York Community Bancorp, Inc. | | | | | | | | |
Series A, 6.375% (3 Month LIBOR USD + 3.821%), 03/17/2027 (f)(g) | | | 8,012 | | | | 197,656 | |
| | | | | | | | | |
Telecommunications — 2.2% | | | | | | | | |
AT&T, Inc. | | | | | | | | |
Series A, 5.000%, 12/12/2024 (a)(g) | | | 1,346 | | | | 27,633 | |
Series C, 4.750%, 02/18/2025 (a)(g) | | | 1,440 | | | | 27,043 | |
5.625%, 08/01/2067 (h) | | | 3,319 | | | | 81,515 | |
Telephone and Data Systems, Inc. | | | | | | | | |
Series UU, 6.625%, 03/31/2026 (a)(g) | | | 6,900 | | | | 137,655 | |
| | | | | | | | 273,846 | |
TOTAL PREFERRED STOCKS (Cost $15,122,845) | | | | | | | 13,449,026 | |
| | | | | | | | | |
The accompanying notes are an integral part of the financial statements.
13
Preferred-Plus ETF
Schedule of Investments
September 30, 2022 (Continued)
Description | | Shares | | | Value | |
MONEY MARKET FUNDS — 0.9% | | | | | | | | |
First American Government Obligations Fund - Class X, 2.77% (d) | | | 105,551 | | | $ | 105,551 | |
TOTAL MONEY MARKET FUNDS (Cost $105,551) | | | | | | | 105,551 | |
| | Number of
Contracts (c) | | | Value | | | Notional
Value | |
PURCHASED OPTIONS — 2.4% | | | | | | | | |
PURCHASED PUT OPTIONS — 2.4% | | | | | | | | |
CBOE Mini S&P 500 Index | | | | | | | | | | | | |
Expiration: October 2022, Exercise Price: $369 (i) | | | 73 | | | $ | 105,740 | | | $ | 2,693,700 | |
Expiration: October 2022, Exercise Price: $370 (i) | | | 69 | | | | 111,056 | | | | 2,553,000 | |
Expiration: November 2022, Exercise Price: $355 (i) | | | 63 | | | | 76,986 | | | | 2,236,500 | |
TOTAL PURCHASED OPTIONS (Cost $150,725) | | | | | | | 293,782 | | | | | |
| | | | | | | | | | | | | |
TOTAL INVESTMENTS (Cost $15,410,259) — 112.0% | | | | | | | 13,872,668 | | | | | |
Other Assets and Liabilities, Net - (12.0)% | | | | | | | (1,489,631 | ) | | | | |
NET ASSETS — 100.0% | | | | | | $ | 12,383,037 | | | | | |
Percentages are stated as a percent of net assets.
CBOE Chicago Board Options Exchange
CMT Constant Maturity Treasury Rate
LIBOR London Interbank Offered Rate
SOFR Secured Overnight Financing Rate
(a) | A portion or all of the security has been segregated or earmarked as collateral for written options. As of September 30, 2022, the value of these securities amounts to $5.028.723 or 40.6% of net assets. |
(b) | Foreign issued security. |
(c) | Each contract has a multiplier of 100. |
(d) | The rate shown is the seven-day yield at period end. |
(e) | To the extent the Fund invests more heavily in particular sectors or asset classes, its performance will be especially sensitive to developments that significantly affect those sectors or asset classes. |
(f) | Variable rate securities. The coupon is based on a reference index and spread. The rate reported is the rate in effect as of September 30, 2022. |
(g) | Perpetual security. Perpetual securities have no stated maturity date, but they may be called/redeemed by the issuer as of the date indicated. |
(h) | Security may be called/redeemed by the issuer as of an earlier date. |
(i) | Held in connection with a written option, see Schedule of Written Options for more detail. |
Preferred-Plus ETF
Schedule of Written Options
September 30, 2022
| | Number of
Contracts (a) | | | Value | | | Notional
Value | |
WRITTEN OPTIONS — (12.8)% | | | | | | | | |
WRITTEN PUT OPTIONS — (12.8)% | | | | | | | | |
CBOE Mini S&P 500 Index | | | | | | | | | | | | |
Expiration: October 2022, Exercise Price: $439 | | | 73 | | | $ | 573,050 | | | $ | 3,204,700 | |
Expiration: October 2022, Exercise Price: $440 | | | 69 | | | | 547,377 | | | | 3,036,000 | |
Expiration: November 2022, Exercise Price: $435 | | | 63 | | | | 466,767 | | | | 2,740,500 | |
TOTAL WRITTEN OPTIONS (Premiums Received $1,018,239) | | | | | | $ | 1,587,194 | | | | | |
Percentages are stated as a percent of net assets.
CBOE Chicago Board Options Exchange
(a) | Each contract has a multiplier of 100. |
The accompanying notes are an integral part of the financial statements.
14
Innovative ETFs
Statements of Assets and Liabilities
September 30, 2022
| | | Dividend
Performers ETF | | | Preferred-Plus
ETF | |
Assets | | | | | | | | |
Investments, at value (cost $16,423,432, and $15,410,259, respectively) | | $ | 16,698,116 | | | $ | 13,872,668 | |
Cash | | | 4,253 | | | | 17,816 | |
Receivable for investment securities sold | | | 986,653 | | | | 434,679 | |
Deposit with broker for options | | | 164,741 | | | | 111,823 | |
Dividend and interest receivable | | | 11,866 | | | | 50,291 | |
Total assets | | | 17,865,629 | | | | 14,487,277 | |
| | | | | | | | | |
Liabilities | | | | | | | | |
Payable to Adviser | | | 10,858 | | | | 9,169 | |
Written options, at value (premums received $2,538,267 and $1,018,239, respectively) | | | 4,034,209 | | | | 1,587,194 | |
Payable for investment securities purchased | | | 1,144,926 | | | | 504,408 | |
Interest payable | | | 8,877 | | | | 3,469 | |
Total liabilities | | | 5,198,870 | | | | 2,104,240 | |
Net Assets | | $ | 12,666,759 | | | $ | 12,383,037 | |
| | | | | | | | | |
Net Assets Consists of: | | | | | | | | |
Paid-in capital | | $ | 15,429,402 | | | $ | 15,207,391 | |
Total distributable earnings (losses) | | | (2,762,643 | ) | | | (2,824,354 | ) |
Net Assets | | $ | 12,666,759 | | | $ | 12,383,037 | |
| | | | | | | | | |
Shares of beneficial interest outstanding (unlimited number of shares authorized, no par value) | | | 1,098,877 | | | | 1,347,107 | |
Net Asset Value, redemption price and offering price per share | | $ | 11.53 | | | $ | 9.19 | |
The accompanying notes are an integral part of the financial statements.
15
Innovative ETFs
Statements of Operations
For the Year Ended September 30, 2022
| | | Dividend
Performers ETF | | | Preferred-Plus
ETF | |
Investment Income | | | | | | | | |
Dividend income | | $ | 365,500 | | | $ | 672,223 | |
Interest Income | | | — | | | | 88,542 | |
Total investment income | | | 365,500 | | | | 760,765 | |
| | | | | | | | | |
Expenses | | | | | | | | |
Investment advisory fees | | | 151,272 | | | | 122,450 | |
Interest expense | | | 36,987 | | | | 14,479 | |
Administrative fees* | | | 17,745 | | | | 14,751 | |
Fund Accounting and Transfer Agent fees* | | | 15,931 | | | | 16,450 | |
Registration fees* | | | 12,138 | | | | 8,552 | |
Other expenses* | | | 18,489 | | | | 21,250 | |
Total expenses | | | 252,562 | | | | 197,932 | |
Less fees waived by the Adviser | | | (28,928 | ) | | | (31,501 | ) |
Net Expenses | | | 223,634 | | | | 166,431 | |
Net investment income | | | 141,866 | | | | 594,334 | |
| | | | | | | | | |
Realized and Unrealized Gain (Loss) on Investments | | | | | | | | |
Net realized gain (loss) on: | | | | | | | | |
Investments | | | 469,327 | | | | (305,397 | ) |
Purchased options | | | (1,068,711 | ) | | | (434,897 | ) |
Written options | | | (329,208 | ) | | | 84,748 | |
Net realized loss | | | (928,592 | ) | | | (655,546 | ) |
Net change in unrealized appreciation/depreciation on: | | | | | | | | |
Investments | | | (2,166,590 | ) | | | (2,288,018 | ) |
Purchased options | | | 385,424 | | | | 148,092 | |
Written options | | | (1,432,994 | ) | | | (541,772 | ) |
Net change in unrealized appreciation/depreciation | | | (3,214,160 | ) | | | (2,681,698 | ) |
Net realized and unrealized loss on investments | | | (4,142,752 | ) | | | (3,337,244 | ) |
Net decrease in net assets from operations | | $ | (4,000,886 | ) | | $ | (2,742,910 | ) |
* | Expenses are that of the Predecessor Funds (See Note 1 in the accompanying notes to these financial statements). |
The accompanying notes are an integral part of the financial statements.
16
Dividend Performers ETF
Statements of Changes in Net Assets
| | | Year Ended
September 30,
2022 | | | Year Ended
September 30,
2021 | |
From Operations | | | | | | | | |
Net investment income | | $ | 141,866 | | | $ | 54,631 | |
Net realized gain (loss) on investments, purchased options and written options | | | (928,592 | ) | | | 2,673,090 | |
Net change in unrealized appreciation/depreciation on investments, purchased options and written options | | | (3,214,160 | ) | | | 1,094,626 | |
Net increase (decrease) in net assets resulting from operations | | | (4,000,886 | ) | | | 3,822,347 | |
| | | | | | | | | |
From Distributions | | | | | | | | |
Distributable earnings | | | (1,263,814 | ) | | | (926,588 | ) |
Return of capital | | | (767,321 | ) | | | — | |
Total distributions | | | (2,031,135 | ) | | | (926,588 | ) |
| | | | | | | | | |
From Capital Share Transactions | | | | | | | | |
Proceeds from shares sold | | | 5,572,101 | | | | 2,573,505 | |
Reinvestment of dividends | | | 1,671,990 | | | | 926,588 | |
Cost of shares redeemed | | | (3,719,629 | ) | | | (802,943 | ) |
Net increase in net assets resulting from capital share transactions | | | 3,524,462 | | | | 2,697,150 | |
| | | | | | | | | |
Total Increase (Decrease) in Net Assets | | | (2,507,559 | ) | | | 5,592,909 | |
| | | | | | | | | |
Net Assets | | | | | | | | |
Beginning of year | | | 15,174,318 | | | | 9,581,409 | |
End of year | | $ | 12,666,759 | | | $ | 15,174,318 | |
| | | | | | | | | |
Changes in Shares Outstanding | | | | | | | | |
Shares outstanding, beginning of year | | | 896,257 | | | | 742,019 | |
Shares sold | | | 371,329 | | | | 147,828 | |
Shares reinvested | | | 96,382 | | | | 54,038 | |
Shares redeemed | | | (265,091 | ) | | | (47,628 | ) |
Shares outstanding, end of year | | | 1,098,877 | | | | 896,257 | |
The accompanying notes are an integral part of the financial statements.
17
Preferred-Plus ETF
Statements of Changes in Net Assets
| | | Year Ended
September 30,
2022 | | | Year Ended
September 30,
2021 | |
From Operations | | | | | | | | |
Net investment income | | $ | 594,334 | | | $ | 410,951 | |
Net realized gain (loss) on investments, purchased options and written options | | | (655,546 | ) | | | 656,939 | |
Net change in unrealized appreciation/depreciation on investments, purchased options and written options | | | (2,681,698 | ) | | | 584,978 | |
Net increase (decrease) in net assets resulting from operations | | | (2,742,910 | ) | | | 1,652,868 | |
| | | | | | | | | |
From Distributions | | | | | | | | |
Distributable earnings | | | (739,387 | ) | | | (749,249 | ) |
Return of capital | | | (93,765 | ) | | | — | |
Total distributions | | | (833,152 | ) | | | (749,249 | ) |
| | | | | | | | | |
From Capital Share Transactions | | | | | | | | |
Proceeds from shares sold | | | 2,065,498 | | | | 2,645,885 | |
Reinvestment of dividends | | | 459,283 | | | | 749,249 | |
Cost of shares redeemed | | | (558,243 | ) | | | (901,411 | ) |
Net increase in net assets resulting from capital share transactions | | | 1,966,538 | | | | 2,493,723 | |
| | | | | | | | | |
Total Increase (Decrease) in Net Assets | | | (1,609,524 | ) | | | 3,397,342 | |
| | | | | | | | | |
Net Assets | | | | | | | | |
Beginning of year | | | 13,992,561 | | | | 10,595,219 | |
End of year | | $ | 12,383,037 | | | $ | 13,992,561 | |
| | | | | | | | | |
Changes in Shares Outstanding | | | | | | | | |
Shares outstanding, beginning of year | | | 1,162,051 | | | | 955,453 | |
Shares sold | | | 193,443 | | | | 219,452 | |
Shares reinvested | | | 39,814 | | | | 62,532 | |
Shares redeemed | | | (48,201 | ) | | | (75,386 | ) |
Shares outstanding, end of year | | | 1,347,107 | | | | 1,162,051 | |
The accompanying notes are an integral part of the financial statements.
18
Dividend Performers ETF
Financial Highlights
For a Share Outstanding Throughout Each Period
| | | Year Ended
September 30,
2022 | | | Year Ended
September 30,
2021 | | | Year Ended
September 30,
2020 | | | Period Ended
September 30,
2019(1) | |
Net Asset Value, Beginning of Period | | $ | 16.93 | | | $ | 12.91 | | | $ | 12.16 | | | $ | 10.00 | |
| | | | | | | | | | | | | | | | | |
Income (Loss) from investment operations: | | | | | | | | | | | | | | | | |
Net investment income (loss)(2) | | | 0.14 | | | | 0.07 | | | | 0.12 | | | | 0.07 | |
Net realized and unrealized gain (loss) | | | (3.45 | ) | | | 5.06 | | | | 1.06 | (7) | | | 2.23 | |
Total from investment operations | | | (3.31 | ) | | | 5.13 | | | | 1.18 | | | | 2.30 | |
| | | | | | | | | | | | | | | | | |
Less distributions paid: | | | | | | | | | | | | | | | | |
From net investment income | | | (0.24 | ) | | | (0.07 | ) | | | (0.13 | ) | | | (0.06 | ) |
From net realized and unrealized gain (loss) | | | (1.08 | ) | | | (1.04 | ) | | | (0.23 | ) | | | (0.08 | ) |
From return of capital | | | (0.77 | ) | | | — | | | | (0.07 | ) | | | — | |
Total distributions paid | | | (2.09 | ) | | | (1.11 | ) | | | (0.43 | ) | | | (0.14 | ) |
| | | | | | | | | | | | | | | | | |
Net Asset Value, End of Period | | $ | 11.53 | | | $ | 16.93 | | | $ | 12.91 | | | $ | 12.16 | |
| | | | | | | | | | | | | | | | | |
Total return, at NAV(3) | | | -22.92 | % | | | 39.80 | % | | | 10.08 | % | | | 23.04 | %(4) |
Total return, at Market(3) | | | -23.31 | % | | | N/A | | | | N/A | | | | N/A | |
| | | | | | | | | | | | | | | | | |
Supplemental Data and Ratios: | | | | | | | | | | | | | | | | |
Net assets, end of period (000’s) | | $ | 12,667 | | | $ | 15,174 | | | $ | 9,581 | | | $ | 11,749 | |
| | | | | | | | | | | | | | | | | |
Ratio of expenses to average net assets before reimbursements (excluding interest expense)(8) | | | 1.30 | % | | | 2.08 | % | | | 2.50 | % | | | 2.48 | % |
Ratio of expenses to average net assets before reimbursements (including interest expense)(8) | | | 1.52 | % | | | 2.12 | % | | | 2.66 | % | | | 2.56 | % |
Ratio of expenses to average net assets after reimbursements (excluding interest expense)(8) | | | 1.13 | % | | | 1.50 | % | | | 1.50 | % | | | 1.50 | % |
Ratio of expenses to average net assets after reimbursements (including interest expense)(8) | | | 1.35 | % | | | 1.54 | % | | | 1.66 | % | | | 1.56 | % |
Ratio of net investment income (loss) to average net assets after reimbursement(8)(9) | | | 0.86 | % | | | 0.41 | % | | | 1.04 | % | | | 0.80 | %(5) |
Portfolio Turnover rate(6) | | | 74 | % | | | 58 | % | | | 129 | % | | | 15 | %(4) |
(1) | The Fund commenced operations on December 24, 2018. |
(2) | Per share net investment income (loss) was calculated using average shares outstanding. |
(3) | Total return in the table represents the rate that the investor would have earned or lost on an investment in the Fund, assuming reinvestment of dividends. |
(4) | Not annualized for periods less than one year. |
(5) | Annualized for periods less than one year. |
(6) | Excludes in-kind transactions associated with creations and redemptions of the Fund. |
(7) | The amount of net realized and unrealized gain on investment per share for the period does not accord with the amounts in the Statement of Operations due to share transactions for the period. |
(8) | Expense waived or reimbursed reflect reductions to total expenses, as discussed in the notes to the financial statements. These amounts would increase the net investment loss ratio or decrease the net investment income ratio, as applicable, had such reductions not occurred. |
(9) | Does not include income and expenses of investment companies in which the Fund invests. |
The accompanying notes are an integral part of the financial statements.
19
Preferred-Plus ETF
Financial Highlights
For a Share Outstanding Throughout Each Period
| | | Year Ended
September 30,
2022 | | | Year Ended
September 30,
2021 | | | Year Ended
September 30,
2020 | | | Period Ended
September 30,
2019(1) | |
Net Asset Value, Beginning of Period | | $ | 12.04 | | | $ | 11.09 | | | $ | 11.21 | | | $ | 10.00 | |
| | | | | | | | | | | | | | | | | |
Income (Loss) from investment operations: | | | | | | | | | | | | | | | | |
Net investment income(2) | | | 0.49 | | | | 0.40 | | | | 0.41 | | | | 0.34 | |
Net realized and unrealized gain (loss) | | | (2.66 | ) | | | 1.25 | | | | — | (7) | | | 1.24 | |
Total from investment operations | | | (2.17 | ) | | | 1.65 | | | | 0.41 | | | | 1.58 | |
| | | | | | | | | | | | | | | | | |
Less distributions paid: | | | | | | | | | | | | | | | | |
From net investment income | | | (0.38 | ) | | | (0.38 | ) | | | (0.41 | ) | | | (0.29 | ) |
From net realized and unrealized gain (loss) | | | (0.23 | ) | | | (0.32 | ) | | | (0.05 | ) | | | (0.08 | ) |
From return of capital | | | (0.07 | ) | | | — | | | | (0.07 | ) | | | — | |
Total distributions paid | | | (0.68 | ) | | | (0.70 | ) | | | (0.53 | ) | | | (0.37 | ) |
| | | | | | | | | | | | | | | | | |
Net Asset Value, End of Period | | $ | 9.19 | | | $ | 12.04 | | | $ | 11.09 | | | $ | 11.21 | |
| | | | | | | | | | | | | | | | | |
Total return, at NAV(3) | | | -18.64 | % | | | 15.01 | % | | | 3.95 | % | | | 15.97 | %(4) |
Total return, at Market(3) | | | -18.88 | % | | | N/A | | | | N/A | | | | N/A | |
| | | | | | | | | | | | | | | | | |
Supplemental Data and Ratios: | | | | | | | | | | | | | | | | |
Net assets, end of period (000’s) | | $ | 12,383 | | | $ | 13,993 | | | $ | 10,595 | | | $ | 7,270 | |
| | | | | | | | | | | | | | | | | |
Ratio of expenses to average net assets before reimbursements (excluding interest expense)(8) | | | 1.37 | % | | | 2.13 | % | | | 2.43 | % | | | 2.70 | % |
Ratio of expenses to average net assets before reimbursements (including interest expense)(8) | | | 1.48 | % | | | 2.15 | % | | | 2.48 | % | | | 2.76 | % |
Ratio of expenses to average net assets after reimbursements (excluding interest expense)(8) | | | 1.14 | % | | | 1.50 | % | | | 1.50 | % | | | 1.50 | % |
Ratio of expenses to average net assets after reimbursements (including interest expense)(8) | | | 1.25 | % | | | 1.52 | % | | | 1.55 | % | | | 1.56 | % |
Ratio of net investment income to average net assets after reimbursement(8)(9) | | | 4.45 | % | | | 3.31 | % | | | 3.90 | % | | | 3.96 | %(5) |
Portfolio turnover rate(6) | | | 65 | %(10) | | | 27 | % | | | 70 | % | | | 6 | %(4) |
(1) | The Fund commenced operations on December 14, 2018. |
(2) | Per share net investment income (loss) was calculated using average shares outstanding. |
(3) | Total return in the table represents the rate that the investor would have earned or lost on an investment in the Fund, assuming reinvestment of dividends. |
(4) | Not annualized for periods less than one year. |
(5) | Annualized for periods less than one year. |
(6) | Excludes in-kind transactions associated with creations and redemptions of the Fund. |
(7) | The amount of net realized and unrealized gain on investment per share for the period does not accord with the amounts in the Statement of Operations due to share transactions for the period. |
(8) | Expense waived or reimbursed reflect reductions to total expenses, as discussed in the notes to the financial statements. These amounts would increase the net investment loss ratio or decrease the net investment income ratio, as applicable, had such reductions not occurred. |
(9) | Does not include income and expenses of investment companies in which the Fund invests. |
(10) | The proceeds from sales of securities incurred by the Fund related to the alignment of the Predecessor Fund’s portfolio with the Fund’s investment style are excluded from the portfolio turnover rate calculation. See Notes 6 and 8 of the Notes to Financial Statements for further information. If such amounts had not been excluded, the portfolio turnover rate would have been 114% for the year ended September 30, 2022. |
The accompanying notes are an integral part of the financial statements.
20
Innovative ETFs
Notes to Financial Statements
September 30, 2022
Dividend Performers ETF (“Dividend Performers” or “IPDP”) and Preferred-Plus ETF (“Preferred-Plus” or “IPPP”) (each a “Fund” and collectively, the “Funds”) are each a diversified series of Listed Funds Trust (the “Trust”), formerly Active Weighting Funds ETF Trust. The Trust was organized as a Delaware statutory trust on August 26, 2016, under a Declaration of Trust amended on December 21, 2018, and is registered with the U.S. Securities and Exchange Commission (the “SEC”) as an open-end management investment company under the Investment Company Act of 1940, as amended (the “1940 Act”).
IPDP is an actively-managed exchange-traded fund (“ETF”) that seeks to achieve its primary investment objective to provide income and secondary objective of capital appreciation by investing in dividend paying U.S. equity securities, and credit spread options on an S&P 500 ETF or Index.
IPPP is an actively-managed ETF that seeks to achieve its investment objective to provide income by investing in issues of preferred securities and debt securities that Innovative Portfolios, LLC (“Innovative” or the “Adviser”), the Fund’s investment adviser, believes to be undervalued and credit spread options on an S&P 500 ETF or Index.
IPDP and IPPP are the successors in interest to the Dividend Performers and Preferred-Plus mutual funds, respectively, each a series of Collaborative Investment Series Trust, (the “Predecessor Funds”) pursuant to a tax-free reorganization that took place before the start of business on March 7, 2022. The Funds are the accounting and performance information successors of the Predecessor Funds. Costs incurred by the Funds in connection with the reorganization were paid by the Adviser.
2. | SIGNIFICANT ACCOUNTING POLICIES |
Each Fund is an investment company and accordingly follows the investment company accounting and reporting guidance of the Financial Accounting Standards Board (“FASB”) Accounting Standards Codification (“ASC”) Topic 946, Financial Services — Investment Companies. Each Fund prepares its financial statements in accordance with accounting principles generally accepted in the United States of America (“U.S. GAAP”) and follows the significant accounting policies described below.
New Accounting Pronouncements
In March 2020, FASB issued Accounting Standards Update (ASU) 2020-04, Reference Rate Reform (Topic 848) - Facilitation of the Effects of Reference Rate Reform on Financial Reporting. The amendments in ASU 2020-04 provides optional temporary financial reporting relief from the effect of certain types of contract modifications due to the planned discontinuation of LIBOR and other interbank-offered based reference rates as of the end of 2021. ASU 2020-04 is effective for certain reference rate related contract modifications that occur during the period March 12, 2020 through December 31, 2022. Management is currently evaluating the impact, if any, of applying this ASU.
Use of Estimates
The preparation of the financial statements in conformity with U.S. GAAP requires management to make estimates and assumptions that affect the reported amounts of assets and liabilities and disclosures of contingent assets and liabilities at the date of the financial statements and the reported amounts of increases and decreases in net assets from operations during the reporting period. Actual results could differ from these estimates.
Share Transactions
The net asset value (“NAV”) per share of each Fund will be equal to a Fund’s total assets minus a Fund’s total liabilities divided by the total number of shares outstanding. The NAV that is published will be rounded to the nearest cent. The NAV is determined as of the close of trading (generally, 4:00 p.m. Eastern Time) on each day the New York Stock Exchange (“NYSE”) is open for trading.
21
Innovative ETFs
Notes to Financial Statements
September 30, 2022 (Continued)
Fair Value Measurement
In calculating the NAV, each Fund’s exchange-traded equity securities will be valued at fair value, which will generally be determined using the last reported official closing or last trading price on the exchange or market on which the security is primarily traded at the time of valuation. Such valuations are typically categorized as Level 1 in the fair value hierarchy described below.
Securities listed on the NASDAQ Stock Market, Inc. are generally valued at the NASDAQ official closing price.
If market quotations are not readily available, or if it is determined that a quotation of a security does not represent fair value, then the security is valued at fair value as determined in good faith by the Adviser using procedures adopted by the Board of Trustees of the Trust (the “Board”). The circumstances in which a security may be fair valued include, among others: the occurrence of events that are significant to a particular issuer, such as mergers, restructurings, or defaults; the occurrence of events that are significant to an entire market, such as natural disasters in a particular region or government actions; trading restrictions on securities; thinly traded securities; and market events such as trading halts and early market closings. Due to the inherent uncertainty of valuations, fair values may differ significantly from the values that would have been used had an active market existed. Fair valuation could result in a different NAV than a NAV determined by using market quotations. Such valuations are typically categorized as Level 2 or Level 3 in the fair value hierarchy described below.
Money market funds are valued at NAV. If NAV is not readily available, the securities will be valued at fair value.
Exchange-traded options are valued at the composite mean price, which calculates the mean of the highest bid price and lowest asked price across the exchange. On the last trading day prior to expiration, expiring options may be priced at intrinsic value. The premium a fund pays when purchasing a put option or receives when writing a put option will reflect, among other things, the market price of the security, the relationship of the exercise price to the market price of the security, the relationship of the exercise price to the volatility of the security, the length of the option period and supply and demand factors. The premium is the value of an option at the date of purchase.
All other securities and investments for which market values are not readily available, including restricted securities, and those securities for which it is inappropriate to determine prices in accordance with the aforementioned procedures, are valued at fair value as determined in good faith under procedures adopted by the Board, although the actual calculations may be done by others. Factors considered in making this determination may include, but are not limited to, information obtained by contacting the issuer, analysts, or the appropriate stock exchange (for exchange-traded securities), analysis of the issuer’s financial statements or other available documents and, if necessary, available information concerning other securities in similar circumstances.
FASB ASC Topic 820, Fair Value Measurements and Disclosures (“ASC 820”) defines fair value, establishes a framework for measuring fair value in accordance with U.S. GAAP, and requires disclosure about fair value measurements. It also provides guidance on determining when there has been a significant decrease in the volume and level of activity for an asset or liability, when a transaction is not orderly, and how that information must be incorporated into fair value measurements. Under ASC 820, various inputs are used in determining the value of the Funds’ investments. These inputs are summarized in the following hierarchy:
| | ● | Level 1 — Unadjusted quoted prices in active markets for identical assets or liabilities that the Funds have the ability to access. |
| | ● | Level 2 — Observable inputs other than quoted prices included in Level 1 that are observable for the asset or liability, either directly or indirectly. These inputs may include quoted prices for the identical instrument on an inactive market, prices for similar securities, interest rates, prepayment speeds, credit risk, yield curves, default rates and similar data. |
| | ● | Level 3 — Unobservable inputs for the asset or liability, to the extent relevant observable inputs are not available; representing the Funds’ own assumptions about the assumptions a market participant would use in valuing the asset or liability and would be based on the best information available. |
22
Innovative ETFs
Notes to Financial Statements
September 30, 2022 (Continued)
The fair value hierarchy gives the highest priority to quoted prices (unadjusted) in active markets for identical assets or liabilities (Level 1) and the lowest priority to unobservable inputs (Level 3).
The availability of observable inputs can vary from security to security and is affected by a wide variety of factors, including, for example, the type of security, whether the security is new and not yet established in the marketplace, the liquidity of markets, and other characteristics particular to the security. To the extent that valuation is based on models or inputs that are less observable or unobservable in the market, the determination of fair value requires more judgment. Accordingly, the degree of judgment exercised in determining fair value is greatest for instruments categorized in Level 3.
The inputs or methodology used for valuing securities are not necessarily an indication of the risk associated with investing in those securities. The hierarchy classification of inputs used to value the Funds’ investments at September 30, 2022, are as follows:
Dividend Performers ETF
| | | Level 1 | | | Level 2 | | | Level 3 | | | Total | |
Investments - Assets: | | | | | | | | | | | | | | | | |
Common Stocks* | | $ | 15,739,789 | | | $ | — | | | $ | — | | | $ | 15,739,789 | |
Money Market Funds | | | 207,872 | | | | — | | | | — | | | | 207,872 | |
Purchased Put Options | | | — | | | | 750,455 | | | | — | | | | 750,455 | |
Total Investments - Assets | | $ | 15,947,661 | | | $ | 750,455 | | | $ | — | | | $ | 16,698,116 | |
Other Financial Instruments - Liabilities: | | | | | | | | | | | | | | | | |
Written Put Options | | $ | — | | | $ | 4,034,209 | | | $ | — | | | $ | 4,034,209 | |
Preferred-Plus ETF
| | | Level 1 | | | Level 2 | | | Level 3 | | | Total | |
Investments - Assets: | | | | | | | | | | | | | | | | |
Closed-End Funds | | $ | 24,309 | | | $ | — | | | $ | — | | | $ | 24,309 | |
Preferred Stocks* | | | 13,449,026 | | | | — | | | | — | | | | 13,449,026 | |
Money Market Funds | | | 105,551 | | | | — | | | | — | | | | 105,551 | |
Purchased Put Options | | | — | | | | 293,782 | | | | — | | | | 293,782 | |
Total Investments - Assets | | $ | 13,578,886 | | | $ | 293,782 | | | $ | — | | | $ | 13,872,668 | |
Other Financial Instruments - Liabilities: | | | | | | | | | | | | | | | | |
Written Put Options | | $ | — | | | $ | 1,587,194 | | | $ | — | | | $ | 1,587,194 | |
* | See the Schedule of Investments for industry classifications. |
Security Transactions
Investment transactions are recorded as of the date that the securities are purchased or sold (trade date). Realized gains and losses from the sale or disposition of securities are calculated based on the specific identification basis.
Investment Income
Dividend income is recognized on the ex-dividend date. Withholding taxes on foreign dividends, a portion of which may be reclaimable, has been provided for in accordance with the Funds’ understanding of the applicable tax rules and regulations. Interest income is accrued daily. An amortized cost method of valuation may be used with respect to debt obligations with sixty days or less remaining to maturity, unless the Adviser determines in good faith that such method does not represent fair value. Discounts and premiums on fixed income securities purchased are accreted or amortized using the effective interest method.
23
Innovative ETFs
Notes to Financial Statements
September 30, 2022 (Continued)
Tax Information, Dividends and Distributions to Shareholders and Uncertain Tax Positions
The Funds are treated as separate entities for Federal income tax purposes. Each Fund intends to qualify as a regulated investment company (“RIC”) under Subchapter M of the Internal Revenue Code of 1986, as amended (the “Internal Revenue Code”). To qualify and remain eligible for the special tax treatment accorded to RICs, each Fund must meet certain annual income and quarterly asset diversification requirements and must distribute annually at least 90% of the sum of (i) its investment company taxable income (which includes dividends, interest, and net short-term capital gains) and (ii) certain net tax-exempt income, if any. If so qualified, each Fund will not be subject to Federal income tax.
Distributions to shareholders are recorded on the ex-dividend date. The Funds generally pay out dividends from net investment income, if any, quarterly. Each Fund will distribute their net capital gains, if any, to shareholders at least annually. The Funds may also pay a special distribution at the end of the calendar year to comply with Federal tax requirements. The amount of dividends and distributions from net investment income and net realized capital gains are determined in accordance with Federal income tax regulations, which may differ from U.S. GAAP. These “book/tax” differences are either considered temporary or permanent in nature. To the extent these differences are permanent in nature, such amounts are reclassified within the components of net assets based on their Federal tax basis treatment; temporary differences do not require reclassification. Dividends and distributions which exceed earnings and profit for tax purposes are reported as a tax return of capital.
Management evaluates the Funds’ tax positions to determine if the tax positions taken meet the minimum recognition threshold in connection with accounting for uncertainties in income tax positions taken or expected to be taken for the purposes of measuring and recognizing tax liabilities in the financial statements. Recognition of tax benefits of an uncertain tax position is required only when the position is “more likely than not” to be sustained assuming examination by taxing authorities. Interest and penalties related to income taxes would be recorded as income tax expense. The Funds’ Federal income tax returns are subject to examination by the Internal Revenue Service (the “IRS”) for a period of three fiscal years after they are filed. State and local tax returns may be subject to examination for an additional fiscal year depending on the jurisdiction. As of September 30, 2022, the Funds’ fiscal year end, the Funds had no material uncertain tax positions and did not have a liability for any unrecognized tax benefits. As of September 30, 2022, the Funds’ fiscal year end, the Funds had no examination in progress and management is not aware of any tax positions for which it is reasonably possible that the amounts of unrecognized tax benefits will significantly change in the next twelve months.
The Funds recognized no interest or penalties related to uncertain tax benefits in the fiscal year 2022. At September 30, 2022, the Funds’ fiscal year end, the tax periods for the prior three years are open to examination in the Funds’ major tax jurisdictions.
Indemnification
In the normal course of business, the Funds expect to enter into contracts that contain a variety of representations and warranties, and which provide general indemnifications. The Funds’ maximum exposure under these anticipated arrangements is unknown, as this would involve future claims that may be made against the Funds that have not yet occurred. However, based on experience, the Funds expect the risk of loss to be remote.
Derivatives
The Funds may purchase and write put options on indices or securities and enter into related closing transactions. Put options on indices give the holder the right to receive, upon exercise of the option, an amount of cash if the closing level of the underlying index is less than the exercise price of the option. This amount of cash is equal to the difference between the closing price of the index and the exercise price of the option, expressed in dollars multiplied by a specified number. The premium paid to the writer is the consideration for undertaking the obligations under the option contract.
The Funds seek to achieve credit spread on an S&P 500 ETF or Index by selling/writing an out-of-the-money (an out-of-the-money put option is one whose strike price is lower than the market price of the underlying reference asset of the option) short put option each month while simultaneously purchasing an out-of-the-money long put option below the short option position. A credit spread is an options strategy that involves the purchase of one option and a sale of another option in the same class
24
Innovative ETFs
Notes to Financial Statements
September 30, 2022 (Continued)
and with the same expiration but different strike prices. The strategy objective is a net credit for entering the option position and is profitable when the spreads narrow or expire. By buying a protective long put option, the Funds seek to hedge any significant downside risk posed by the short put option.
Selling (writing) and buying options are speculative activities and entail greater than ordinary investment risks. Each Fund’s use of put options can lead to losses because of adverse movements in the price or value of the underlying asset, which may be magnified by certain features of the options. When selling a put option, the Funds will receive a premium; however, this premium may not be enough to offset a loss incurred by the Funds if the price of the underlying asset is below the strike price by an amount equal to or greater than the premium. Purchasing of put options involves the payment of premiums, which may adversely affect the Funds’ performance. Purchasing a put option gives the purchaser of the option the right to sell a specified quantity of an underlying asset at a fixed exercise price over a defined period. Purchased put options may expire worthless resulting in the Funds’ loss of the premium it paid for the option.
The value of an option may be adversely affected if the market for the option becomes less liquid or smaller and will be affected by changes in the value or yield of the option’s underlying asset, an increase in interest rates, a change in the actual or perceived volatility of the stock market or the underlying asset and the remaining time to expiration. Additionally, the value of an option does not increase or decrease at the same rate as the underlying asset. The Funds’ use of options may reduce the Funds’ ability to profit from increases in the value of the underlying asset. If the price of the underlying asset of an option is above the strike price of a written put option, the value of the option, and consequently of the Funds, may decline significantly more than if the Funds invested directly in the underlying asset instead of using options. While the Funds will segregate liquid assets at least equal in value to the maximum potential loss for the Funds, the Funds could still lose a significant amount or nearly all of its value if the price of an underlying asset changes significantly enough.
As of September 30, 2022, the Funds’ derivative instruments are not subject to a master netting arrangement.
The average monthly value outstanding of purchased and written options during the year ended September 30, 2022, were as follows:
| | | Dividend
Performers ETF | | | Preferred-Plus
ETF | |
Purchased Options | | $ | 169,518 | | | $ | 66,708 | |
Written Options | | | (1,242,808 | ) | | | (490,268 | ) |
The following is a summary of the effect of derivative instruments on the Funds’ Statements of Assets and Liabilities as of September 30, 2022:
| | Equity Risk Contracts | | Asset Derivatives,
Investments,
at value | | | Liability
Derivatives,
Written options,
at value | |
Dividend Performers ETF | Purchased Options | | $ | 750,445 | | | $ | — | |
| | Written Options | | | — | | | | 4,034,209 | |
Preferred-Plus ETF | Purchased Options | | | 293,782 | | | | — | |
| | Written Options | | | — | | | | 1,587,194 | |
25
Innovative ETFs
Notes to Financial Statements
September 30, 2022 (Continued)
The following is a summary of the effect of derivative instruments on the Funds’ Statements of Operations for the year ended September 30, 2022:
| | | | Realized Gain (Loss) | | | Change in Unrealized
Appreciation/Depreciation | |
| | | | Purchased
Options | | | Written Options | | | Purchased
Options | | | Written Options | |
Dividend Performers ETF | Equity Risk Contracts | | $ | (1,068,711 | ) | | $ | (329,208 | ) | | $ | 385,424 | | | $ | (1,432,994 | ) |
Preferred-Plus ETF | Equity Risk Contracts | | | (434,897 | ) | | | 84,748 | | | | 148,092 | | | | (541,772 | ) |
3. | INVESTMENT ADVISORY AND OTHER AGREEMENTS |
Investment Advisory Agreement
The Trust has entered into an Investment Advisory Agreement (the “Advisory Agreement”) with the Adviser, effective at the start of business on March 7, 2022. Under the Advisory Agreement, the Adviser provides a continuous investment program for the Funds’ assets in accordance with their investment objectives, policies and limitations, and oversees the day-to-day operations of the Funds subject to the supervision of the Board, including the Trustees who are not “interested persons” of the Trust as defined in the 1940 Act.
Pursuant to the Advisory Agreement between the Trust, on behalf of the Funds, and Innovative, each Fund pays a unified management fee to the Adviser, which is calculated daily and paid monthly, at an annual rate of 0.85% of each Fund’s average daily net assets. Innovative has agreed to pay all expenses of the Funds except the fee paid to Innovative under the Advisory Agreement, interest charges on any borrowings, dividends and other expenses on securities sold short, taxes, brokerage commissions and other expenses incurred in placing orders for the purchase and sale of securities and other investment instruments, acquired fund fees and expenses, accrued deferred tax liability, extraordinary expenses, and distribution (12b-1) fees and expenses (if any).
For the period October 1, 2021 to March 6, 2022, the Predecessor Funds were obligated to pay the Adviser a fee computed and accrued daily and paid monthly at an annual rate of 1.00% of the average daily net assets of each Fund. The Predecessor Funds’ Advisory Agreement was terminated as of the tax-free reorganization that took place before the start of business on March 7, 2022.
For the period October 1, 2021 to March 6, 2022, the Adviser received the following fee from each Fund, included in the Advisory Fee expense on the Statements of Operations:
Dividend
Performers ETF | Preferred-Plus
ETF |
$ 70,978 | $ 59,004 |
Fee Waiver Agreement
For the period October 1, 2021 to March 6, 2022, the Adviser contractually agreed to reduce fees and to reimburse expenses of the Predecessor Funds to ensure that total annual Fund operating expenses after fee waiver and reimbursement (exclusive of any acquired fund fees and expenses, interest expenses, dividend expenses on short sales, taxes, brokerage commissions, expenses incurred in connection with any merger or reorganization, or extraordinary expenses such as litigation) of the Predecessor Funds did not exceed 1.50% of the average daily net assets of the Funds. The Fee Waiver Agreement was terminated as of the tax-free reorganization that took place before the start of business on March 7, 2022. As part of the Reorganization, the Adviser did not retain any right to recoup any fees waived or expenses reimbursed pursuant to the Predecessor Funds’ expense limitation agreement.
26
Innovative ETFs
Notes to Financial Statements
September 30, 2022 (Continued)
For the period October 1, 2021 to March 6, 2022, the Adviser waived:
Dividend
Performers ETF | Preferred-Plus
ETF |
$ 28,928 | $ 31,501 |
Distribution Agreement and 12b-1 Plan
Foreside Fund Services, LLC (the “Distributor”) serves as each Fund’s distributor pursuant to a Distribution Services Agreement. The Distributor receives compensation for the statutory underwriting services it provides to the Funds. The Distributor enters into agreements with certain broker-dealers and others that will allow those parties to be “Authorized Participants” and to subscribe for and redeem shares of the Funds. The Distributor will not distribute shares in less than whole Creation Units and does not maintain a secondary market in shares.
The Board has adopted a Distribution and Service Plan pursuant to Rule 12b-1 under the 1940 Act (“Rule 12b-1 Plan”). In accordance with the Rule 12b-1 Plan, each Fund is authorized to pay an amount up to 0.25% of the Fund’s average daily net assets each year for certain distribution-related activities. As authorized by the Board, no Rule 12b-1 fees are currently paid by the Funds and there are no plans to impose these fees. However, in the event Rule 12b-1 fees are charged in the future, they will be paid out of each Fund’s assets. The Adviser and its affiliates may, out of their own resources, pay amounts to third parties for distribution or marketing services on behalf of the Funds.
For the period October 1, 2021 to March 6, 2022, the distributor of the Predecessor Funds was Arbor Court Capital, LLC, an affiliate of Mutual Shareholder Services, LLC, the Predecessor Fund’s Transfer Agent.
Administrator, Custodian and Transfer Agent
U.S. Bancorp Fund Services LLC, doing business as U.S. Bank Global Fund Services (“Fund Services” or “Administrator”) serves as administrator, transfer agent and fund accounting agent of the Funds pursuant to a Fund Servicing Agreement. U.S. Bank N.A. (the “Custodian”), an affiliate of Fund Services, serves as the Funds’ custodian pursuant to a Custody Agreement. Under the terms of these agreements, the Adviser pays each Fund’s administrative, custody and transfer agency fees. A Trustee and all officers of the Trust are affiliated with the Administrator and Custodian. The Administrative fees and Transfer Agent fees as presented on the Statements of Operations are all pursuant to prior agreements of the Predecessor Funds, as detailed below.
For the period October 1, 2021 to March 6, 2022, Collaborative Fund Services, LLC (“CFS”) served as the Funds’ Administrator pursuant to an Administration Agreement. For the services CFS provided under the Administration Agreement, CFS received an annual fee of 0.25% of each Fund’s average daily net assets, subject to a minimum monthly fee of $1,000 per Fund. For the period October 1, 2021 to March 6, 2022, CFS received the following fee from each Fund as presented on the Statements of Operations:
| | | Dividend
Performers ETF | | | Preferred-Plus
ETF | |
Administrative Fees | | $ | 17,745 | | | $ | 14,751 | |
Through March 6, 2022, certain trustees of the Predecessor Funds were officers/employees of CFS.
For the period October 1, 2021 to March 6, 2022, Mutual Shareholder Services, LLC (“MSS”) served as the Funds’ Transfer Agent pursuant to a Transfer Agency Services Agreement. MSS received an annual fee from each Fund of $11.50 per shareholder for transfer agency services. For its services as fund accountant, MSS received an annual fee from each Fund based on the average net assets of each Fund. For the period October 1, 2021 to March 6, 2022, MSS received the following fee from each Fund as presented on the Statements of Operations:
| | | Dividend
Performers ETF | | | Preferred-Plus
ETF | |
Fund Accounting and Transfer Agent Fees | | $ | 15,931 | | | $ | 16,450 | |
27
Innovative ETFs
Notes to Financial Statements
September 30, 2022 (Continued)
4. | CREATION AND REDEMPTION TRANSACTIONS |
Shares of the Funds are listed and traded on the Cboe BZX Exchange, Inc. (the “Exchange”). Each Fund issues and redeems shares on a continuous basis at NAV only in large blocks of shares called “Creation Units.” Creation Units are to be issued and redeemed principally in kind for a basket of securities and a balancing cash amount. Shares generally will trade in the secondary market in amounts less than a Creation Unit at market prices that change throughout the day. Market prices for the shares may be different from their NAV. The NAV is determined as of the close of trading (generally, 4:00 p.m. Eastern Time) on each day the NYSE is open for trading. The NAV of the shares of each Fund will be equal to a Fund’s total assets minus a Fund’s total liabilities divided by the total number of shares outstanding. The NAV that is published will be rounded to the nearest cent; however, for purposes of determining the price of Creation Units, the NAV will be calculated to four decimal places.
Creation Unit Transaction Fee
Authorized Participants will be required to pay to the Custodian a fixed transaction fee (the “Creation Unit Transaction Fee”) in connection with the issuance or redemption of Creation Units. The standard Creation Unit Transaction Fee will be the same regardless of the number of Creation Units purchased or redeemed by an investor on the applicable business day. The Creation Unit Transaction Fee charged for each creation order is $300 for Dividend Performers and $500 for Preferred-Plus.
An additional variable fee of up to a maximum of 2% of the value of the Creation Units subject to the transaction may be imposed for (1) creations effected outside the Clearing Process and (2) creations made in an all cash amount (to offset the Trust’s brokerage and other transaction costs associated with using cash to purchase or redeem the requisite Deposit Securities). Investors are responsible for the costs of transferring the securities constituting the Deposit Securities to the account of the Trust. Each Fund may determine to not charge a variable fee on certain orders when the Adviser has determined that doing so is in the best interests of Fund shareholders. Variable fees, if any, received by the Funds are displayed in the Capital Share Transactions section on the Statements of Changes in Net Assets.
Only “Authorized Participants” may purchase or redeem shares directly from the Funds. An Authorized Participant is either (1) a broker-dealer or other participant in the clearing process through the Continuous Net Settlement System of National Securities Clearing Corporation or (2) a DTC participant and, in each case, must have executed a Participant Agreement with the Distributor. Most retail investors will not qualify as Authorized Participants or have the resources to buy and sell whole Creation Units. Therefore, they will be unable to purchase or redeem the shares directly from the Funds. Rather, most retail investors will purchase shares in the secondary market with the assistance of a broker and will be subject to customary brokerage commissions or fees. Securities received or delivered in connection with in-kind creates and redeems are valued as of the close of business on the effective date of the creation or redemption.
A Creation Unit will generally not be issued until the transfer of good title of the deposit securities to the Funds and the payment of any cash amounts have been completed. To the extent contemplated by the applicable participant agreement, Creation Units of the Funds will be issued to such authorized participant notwithstanding the fact that the Funds’ deposits have not been received in part or in whole, in reliance on the undertaking of the authorized participant to deliver the missing deposit securities as soon as possible. If the Funds or their agents do not receive all of the deposit securities, or the required cash amounts, by such time, then the order may be deemed rejected and the authorized participant shall be liable to the Fund for losses, if any.
The tax character of distributions paid was as follows:
| | | Year Ended September 30, 2022 | |
| | | Ordinary
Income(1) | | | Long-Term
Capital Gain | | | Return of Capital | |
Dividend Performers ETF | | $ | 270,727 | | | $ | 993,087 | | | $ | 767,321 | |
Preferred-Plus ETF | | | 681,747 | | | | 57,640 | | | | 93,765 | |
28
Innovative ETFs
Notes to Financial Statements
September 30, 2022 (Continued)
| | | Year Ended September 30, 2021 | |
| | | Ordinary
Income(1) | | | Long-Term
Capital Gain | |
Dividend Performers ETF | | $ | 926,588 | | | $ | — | |
Preferred-Plus ETF | | | 749,249 | | | | — | |
(1) | Ordinary income includes short-term capital gains. |
At September 30, 2022, the Funds’ fiscal year end, the components of distributable earnings (accumulated losses) and the cost of investments on a tax basis, including the adjustments for financial reporting purposes as of the most recently completed Federal income tax reporting year for the Funds were as follows:
| | | Dividend
Performers ETF | | | Preferred-Plus
ETF | |
Federal Tax Cost of Investments(1) | | $ | 12,898,262 | | | $ | 13,980,079 | |
Gross Tax Unrealized Appreciation | | $ | 1,518,963 | | | $ | 25,576 | |
Gross Tax Unrealized Depreciation | | | (1,753,318 | ) | | | (1,720,181 | ) |
Net Tax Unrealized Appreciation (Depreciation) | | | (234,355 | ) | | | (1,694,605 | ) |
Other Accumulated Gain (Loss) | | | (2,528,288 | ) | | | (1,129,749 | ) |
Total Distributable Earnings / (Accumulated Losses) | | $ | (2,762,643 | ) | | $ | (2,824,354 | ) |
(1) | Federal Tax Cost of Investments includes written option premiums. |
The primary reason for the difference between the book and tax cost of investments and premiums from written options is the tax deferral of losses on wash sales and mark-to-market treatment of index options.
Under current tax law, net capital losses realized after October 31 and net ordinary losses incurred after December 31 may be deferred and treated as occurring on the first day of the following fiscal year. The Funds’ carryforward losses and post-October losses are determined only at the end of each fiscal year. At September 30, 2022, the Funds had short and long-term post October losses as follows:
| | | Long-Term
Post October
Capital Loss | | | Short-Term
Post October
Capital Loss | |
Dividend Performers ETF | | $ | 184,510 | | | $ | 2,343,079 | |
Preferred-Plus ETF | | | 166,117 | | | | 963,632 | |
U.S. GAAP requires that certain components of net assets relating to permanent differences be reclassified between financial and tax reporting. These reclassifications have no effect on net assets or NAV per share. The permanent differences primarily relate to redemptions in-kind. For the year ended September 30, 2022, the following reclassifications were made for permanent tax differences on the Statements of Assets and Liabilities.
| | | Total
Distributable
Earnings (Losses) | | | Paid-In Capital | |
Dividend Performers ETF | | $ | (504,565 | ) | | $ | 504,565 | |
Preferred-Plus ETF | | | — | | | | — | |
29
Innovative ETFs
Notes to Financial Statements
September 30, 2022 (Continued)
6. | INVESTMENT TRANSACTIONS |
During the year ended September 30, 2022, the Funds realized net capital gains and losses resulting from in-kind redemptions, in which shareholders exchanged Fund shares for securities held by the Funds rather than for cash. Because such gains are not taxable to the Funds, and are not distributed to shareholders, they have been reclassified from distributable earnings (accumulated losses) to paid in-capital. The amount of realized gains and losses from in-kind redemptions included in realized gain/(loss) on investments in the Statements of Operations is as follows:
| | | Realized Gains | | | Realized Losses | |
Dividend Performers ETF | | $ | 583,423 | | | $ | 51,528 | |
Preferred-Plus ETF | | | — | | | | — | |
Purchases and sales of investments (excluding short-term investments), creations in-kind and redemptions in-kind for the year ended September 30, 2022, were as follows:
| | | Purchases | | | Sales | | | Creations
In-Kind | | | Redemptions
In-Kind | |
Dividend Performers ETF | | $ | 14,146,161 | | | $ | 12,492,392 | | | $ | 4,716,557 | | | $ | 3,158,842 | |
Preferred-Plus ETF | | | 16,621,548 | | | | 14,815,156 | * | | | 1,283,745 | | | | — | |
* | Includes sales of $6,437,894 to realign the Predecessor Fund’s portfolio due to the Reorganization. See Note 8 for additional information. |
As with all ETFs, shareholders of the Funds are subject to the risk that their investment could lose money. Each Fund is subject to the principal risks, any of which may adversely affect a Fund’s NAV, trading price, yield, total return, and ability to meet its investment objective.
LIBOR is used extensively in the U.S. and globally as a “benchmark” or “reference rate” for various commercial and financial contracts, including CLOs. Instruments in which the Fund invests may pay interest at floating rates based on LIBOR or may be subject to interest caps or floors based on LIBOR. The industry currently anticipates the conversion of all LIBOR based instruments to SOFR based instruments in June 2023 or sooner.
Since 2017, the United Kingdom’s Financial Conduct Authority has been working towards the cessation of LIBOR at the end of December 2021. In November 2020, though, the administrator of the U.S. Dollar LIBOR benchmarks, the ICE Benchmark Administration, extended the retirement date for most U.S. Dollar LIBOR rates until June 2023. Regulators and industry working groups have suggested numerous alternative reference rates to LIBOR. Leading alternatives include Sonia in the United Kingdom, €STR in the European Union, Tonar in Japan, and in the U.S., the New York Fed has been working to develop the Secured Overnight Financing Rate (SOFR). Global consensus is still coalescing around the transition to a new reference rate and the process for amending existing contracts. Abandonment of or modifications to LIBOR could have adverse impacts on newly issued financial instruments and existing financial instruments which reference LIBOR. There also remains uncertainty and risk regarding the willingness and ability of issuers to include enhanced provisions in new and existing contracts or instruments. The transition away from LIBOR may lead to increased volatility and illiquidity in markets that are tied to LIBOR, reduced values of LIBOR-related investments, and reduced effectiveness of hedging strategies, adversely affecting the Fund’s performance or NAV. In addition, the alternative reference rate may be an ineffective substitute resulting in prolonged adverse market conditions for the Funds.
The global outbreak of COVID-19 (commonly referred to as “coronavirus”) has disrupted economic markets and the prolonged economic impact is uncertain. The ultimate economic fallout from the pandemic, and the long-term impact on economies, markets, industries and individual issuers, are not known. The operational and financial performance of the issuers of securities in which the Funds invest depends on future developments, including the duration and spread of the outbreak, and such uncertainty may in turn adversely affect the value and liquidity of the Funds’ investments, impair the Funds’ ability to satisfy redemption requests, and negatively impact the Funds’ performance.
30
Innovative ETFs
Notes to Financial Statements
September 30, 2022 (Continued)
On February 24, 2022, Russia commenced a military attack on Ukraine. The outbreak of hostilities between the two countries could result in more widespread conflict and could have a severe adverse effect on the region and the markets. In addition, sanctions imposed on Russia by the United States and other countries, and any sanctions imposed in the future could have a significant adverse impact on the Russian economy and related markets. The price and liquidity of investments may fluctuate widely as a result of the conflict and related events. How long such conflict and related events will last and whether it will escalate further cannot be predicted, nor its effect on the Funds.
A complete description of principal risks is included in the Funds’ prospectuses under the heading ‘’Principal Investment Risks’’.
8. | AGREEMENT AND PLAN OF REORGANIZATION |
On March 4, 2022, shareholders of the Predecessor Funds approved an Agreement and Plan of Reorganization between the Trust, on behalf of the Funds, and Collaborative Investment Series Trust, a Delaware statutory trust, on behalf of the Predecessor Funds. The Agreement and Plan of Reorganization provided for the transfer of all of the assets of the Predecessor Funds to the Funds and the assumption of the liabilities (other than any excluded liabilities) of the Predecessor Funds by the Funds. For financial reporting purposes, assets received, and shares issued by the Funds were recorded at fair value; however, the cost basis of the investments received from the Predecessor Funds were carried forward to align ongoing reporting of the Funds’ realized and unrealized gains and losses with amounts distributable to shareholders for tax purposes. The Funds were created to carry out the reorganization and has substantially similar investment objectives and substantially similar principal investment strategies as the Predecessor Funds. The reorganization was effective before the start of business on March 7, 2022. The following table illustrates the specifics of the reorganization of the Predecessor Funds into the Funds:
Dividend Performers ETF
Predecessor Fund
Net Assets | Shares Issued to
Shareholders of
Predecessor Fund | Fund Net Assets | Combined Net Assets | Tax Status of Transfer |
$16,060,087(1) | 1,023,877 | $— | $16,060,087 | Non-taxable |
(1) | Includes accumulated net investment income, accumulated realized losses and unrealized appreciation in the amounts of $15,288, $(32,515) and $1,663,269, respectively. |
Preferred-Plus ETF
Predecessor Fund
Net Assets | Shares Issued to
Shareholders of
Predecessor Fund | Fund Net Assets | Combined Net Assets | Tax Status of Transfer |
$12,960,532(1) | 1,172,107 | $— | $12,960,532 | Non-taxable |
(1) | Includes accumulated net investment income, accumulated realized losses and unrealized depreciation in the amounts of $2,815, $(16,235) and $(485,294), respectively. |
Management has evaluated the Funds’ related events and transactions that occurred subsequent to September 30, 2022, through the date of issuance of the Funds’ financial statements. Management has determined that there were no subsequent events requiring recognition or disclosure in the financial statements.
31
Innovative ETFs
Report of Independent Registered Public Accounting Firm
To the Shareholders of Dividend Performers ETF and Preferred-Plus ETF and
Board of Trustees of Listed Funds Trust
Opinion on the Financial Statements
We have audited the accompanying statements of assets and liabilities, including the schedules of investments and written options, of Dividend Performers ETF and Preferred-Plus ETF (the “Funds”), each a series of Listed Funds Trust, as of September 30, 2022, the related statements of operations for the year then ended, the statements of changes in net assets for each of the two years in the period then ended, the related notes, and the financial highlights for each of the three years in the period then ended (collectively referred to as the “financial statements”). In our opinion, the financial statements present fairly, in all material respects, the financial position of each of the Funds as of September 30, 2022, the results of their operations for the year then ended, the changes in net assets for each of the two years in the period then ended, and the financial highlights for each of the three years in the period then ended, in conformity with accounting principles generally accepted in the United States of America.
The Funds’ financial highlights for the period ended September 30, 2019, were audited by other auditors whose report dated November 25, 2019, expressed an unqualified opinion on those financial highlights.
Basis for Opinion
These financial statements are the responsibility of the Funds’ management. Our responsibility is to express an opinion on the Funds’ financial statements based on our audits. We are a public accounting firm registered with the Public Company Accounting Oversight Board (United States) (“PCAOB”) and are required to be independent with respect to the Funds in accordance with the U.S. federal securities laws and the applicable rules and regulations of the Securities and Exchange Commission and the PCAOB.
We conducted our audits in accordance with the standards of the PCAOB. Those standards require that we plan and perform the audit to obtain reasonable assurance about whether the financial statements are free of material misstatement whether due to error or fraud.
Our audits included performing procedures to assess the risks of material misstatement of the financial statements, whether due to error or fraud, and performing procedures that respond to those risks. Such procedures included examining, on a test basis, evidence regarding the amounts and disclosures in the financial statements. Our procedures included confirmation of securities owned as of September 30, 2022, by correspondence with the custodian and broker. Our audits also included evaluating the accounting principles used and significant estimates made by management, as well as evaluating the overall presentation of the financial statements. We believe that our audits provide a reasonable basis for our opinion.
We have served as the Funds’ auditor since 2019.

COHEN & COMPANY, LTD.
Cleveland, Ohio
November 29, 2022
32
Innovative ETFs
Trustees and Officers of the Trust
September, 2022 (Unaudited)
The Funds’ Statement of Additional Information includes additional information about the Funds’ Trustees and Officers, and is available, without charge upon request by calling 1-866-704-6857, or by visiting the Funds’ website at www.innovativeportfolios.com.
Name and Year of Birth | Position Held
with the Trust | Term of Office
and Length of
Time Served | Principal Occupation(s)
During Past 5 Years | Number of
Portfolios in
Fund Complex
Overseen
by Trustee | Other
Directorships Held
by Trustee During
Past 5 Years |
Independent Trustees | | | | | |
John L. Jacobs
Year of birth: 1959 | Trustee and Audit Committee Chair | Indefinite term; since 2017 | Chairman of Alerian, Inc. (since June 2018); Founder and CEO of Q3 Advisors, LLC (financial consulting firm) (since 2015); Executive Director of Center for Financial Markets and Policy (2016–2022); Distinguished Policy Fellow and Executive Director, Center for Financial Markets and Policy, Georgetown University (2015–2022); Senior Advisor, Nasdaq OMX Group (2015–2016); Executive Vice President, Nasdaq OMX Group (2013–2015) | 52 | Independent Trustee, SHP ETF Trust (since 2021) (2 portfolios); Director, tZERO Group, Inc. (since 2020); Independent Trustee, Procure ETF Trust II (since 2018) (1 portfolio); Independent Trustee, Horizons ETF Trust I (2015-2019) |
Koji Felton
Year of birth: 1961 | Trustee | Indefinite term; since 2019 | Retired; formerly Counsel, Kohlberg Kravis Roberts & Co. L.P. (investment firm) (2013–2015); Counsel, Dechert LLP (law firm) (2011–2013) | 52 | Independent Trustee, Series Portfolios Trust (since 2015) (10 portfolios) |
Pamela H. Conroy
Year of birth: 1961 | Trustee and Nominating and Governance Committee Chair | Indefinite term; since 2019 | Retired; formerly Executive Vice President, Chief Operating Officer & Chief Compliance Officer, Institutional Capital Corporation (investment firm) (1994–2008) | 52 | Independent Trustee, Frontier Funds, Inc. (since 2020) (6 portfolios) |
Interested Trustee | | | | | |
Paul R. Fearday, CPA*
Year of birth: 1979 | Trustee and Chairman | Indefinite term; since 2019 | Senior Vice President, U.S. Bancorp Fund Services, LLC (since 2008) | 52 | None |
* | This Trustee is considered an “Interested Trustee” as defined in the 1940 Act because of his affiliation with U.S. Bancorp Fund Services, d/b/a U.S. Bank Global Fund Services and U.S. Bank N.A., which provide fund accounting, administration, transfer agency and custodian services to the Funds. |
33
Innovative ETFs
Trustees and Officers of the Trust
September 30, 2022 (Unaudited) (Continued)
Name and Year of Birth | Position(s) Held
with the Trust | Term of Office
and Length of
Time Served | Principal Occupation(s) During Past 5 Years |
Officers | | | |
Gregory Bakken
Year of birth: 1983 | President and Principal Executive Officer | Indefinite term, February 2019 | Vice President, U.S. Bancorp Fund Services, LLC (since 2006) |
Travis G. Babich
Year of birth: 1980 | Treasurer and Principal Financial Officer | Indefinite term, September 2019 | Vice President, U.S. Bancorp Fund Services, LLC (since 2005) |
Kacie G. Briody
Year of birth: 1992 | Assistant Treasurer | Indefinite term,
March 2019 | Assistant Vice President, U.S. Bancorp Fund Services, LLC (since 2021); Officer, U.S. Bancorp Fund Services, LLC (2014 to 2021) |
Kent Barnes
Year of birth: 1968 | Secretary | Indefinite term, February 2019 | Vice President, U.S. Bancorp Fund Services, LLC (since 2018); Chief Compliance Officer, Rafferty Asset Management, LLC (2016 to 2018); Vice President, U.S. Bancorp Fund Services, LLC (2007 to 2016) |
Christi C. James
Year of birth: 1974 | Chief Compliance Officer and
Anti-Money Laundering Officer | Indefinite term, July 2022 | Senior Vice President, U.S. Bancorp Fund Services, LLC (since 2022); Principal Consultant, ACA Group (2021 to 2022); Lead Manager, Communications Compliance, T. Rowe Price Investment Services, Inc. (2018 to 2021); Compliance & Legal Manager, CR Group LP (2017 to 2018) |
Joshua J. Hinderliter
Year of birth: 1983 | Assistant Secretary | Indefinite term, May 2022 | Assistant Vice President, U.S. Bancorp Fund Services, LLC (since 2022); Managing Associate, Thompson Hine LLP (2016 to 2022) |
34
Innovative ETFs
Supplemental Information
(Unaudited)
Investors should consider the investment objective and policies, risk considerations, charges and ongoing expenses of an investment carefully before investing. The prospectus contains this and other information relevant to an investment in the Funds. Please read the prospectus carefully before investing. A copy of the prospectus for the Funds may be obtained without charge by writing to the Funds, c/o U.S. Bank Global Fund Services, P.O. Box 701, Milwaukee, Wisconsin 53201-0701, by calling 1-866-704-6857, or by visiting the Funds’ website at www.innovativeportfolios.com.
QUARTERLY PORTFOLIO HOLDING INFORMATION
Each Fund files its complete schedule of portfolio holdings for its first and third fiscal quarters with the Securities and Exchange Commission (“SEC”) on Part F of Form N-PORT. The Funds’ Part F of Form N-PORT is available without charge, upon request, by calling toll-free at 1-866-704-6857. Furthermore, you may obtain the Part F of Form N-PORT on the SEC’s website at www.sec.gov.
PROXY VOTING INFORMATION
Each Fund is required to file a Form N-PX, with the Fund’s complete proxy voting record for the 12 months ended June 30, no later than August 31 of each year. The Fund’s proxy voting record will be available without charge, upon request, by calling toll-free 1-866-704-6857 and on the SEC’s website at www.sec.gov.
FREQUENCY DISTRIBUTION OF PREMIUMS AND DISCOUNTS
Information regarding how often shares of the Funds trade on an exchange at a price above (i.e., at a premium) or below (i.e., at a discount) the NAV of the Funds is available without charge, on the Funds’ website at www.innovativeportfolios.com.
MATTERS SUBMITTED TO A SHAREHOLDER VOTE
A special meeting of shareholders of the Predecessor Fund was held on March 4, 2022, and the following matters were approved:
Proposal to approve an Agreement and Plan of Reorganization pursuant to which all of the assets of the Predecessor Funds will be transferred to the Funds, newly formed series of Listed Funds Trust, in exchange for shares of the Funds, distributed pro rata by the Predecessor Funds to its shareholders, and the Funds’ assumption of the Predecessor Funds’ stated liabilities.
Dividend Performers ETF
For: | | | 646,849 | |
Against: | | | 0 | |
Abstain: | | | 0 | |
Total: | | | 646,849 | |
Preferred-Plus ETF
For: | | | 799,419 | |
Against: | | | 0 | |
Abstain: | | | 2,615 | |
Total: | | | 802,034 | |
35
Innovative ETFs
Supplemental Information
September 30, 2022 (Unaudited) (Continued)
TAX INFORMATION
For the fiscal year ended September 30, 2022, certain dividends paid by the Funds may be subject to a maximum tax rate of 20%, as provided for by the Jobs and Growth Tax Relief Reconciliation Act of 2003. The percentage of dividends declared from ordinary income designated as qualified dividend income was as follows:
Dividend Performers ETF | | | 100 | % |
Preferred-Plus ETF | | | 100 | % |
For corporate shareholders, the percent of ordinary income distributions qualifying for the corporate dividends received deduction for the fiscal year ended September 30, 2022, was as follows:
Dividend Performers ETF | | | 100 | % |
Preferred-Plus ETF | | | 100 | % |
For the fiscal year ended September 30, 2022, the Percentage of taxable ordinary income distributions that are designated as short-term capital gain distributions under Internal Revenue Code Section 871(k)(2)(C) for the Funds was as follows:
Dividend Performers ETF | | | 48 | % |
Preferred-Plus ETF | | | 7 | % |
36
Innovative ETFs
Review of Liquidity Risk Management Program
(Unaudited)
Pursuant to Rule 22e-4 under the Investment Company Act of 1940, the Trust, on behalf of the series of the Trust covered by this shareholder report (the “Series”), has adopted a liquidity risk management program to govern the Trust’s approach to managing liquidity risk. Rule 22e-4 seeks to promote effective liquidity risk management, thereby reducing the risk that a fund will be unable to meet its redemption obligations and mitigating dilution of the interests of fund shareholders. The Trust’s liquidity risk management program is tailored to reflect the Series’ particular risks, but not to eliminate all adverse impacts of liquidity risk, which would be incompatible with the nature of such Series.
The investment adviser to the Series has adopted and implemented its own written liquidity risk management program (the “Program”) tailored specifically to assess and manage the liquidity risk of the Series. At a meeting of the Board of Trustees of the Trust on December 9, 2021, the Trustees received a report pertaining to the key elements of the Program in connection with the approval of establishment the Series as a new series of the Trust. The report concluded that the Program is reasonably designed to assess and manage the Series’ liquidity risk and to meet the requirements of the Trust’s liquidity risk management program and Rule 22e-4. Because the Series has not completed a full year of operation as a series of the Trust, there has not been an annual review of the Program yet as of the date of this report.
There can be no assurance that the Program will achieve its objectives in the future. Please refer to the prospectus for more information regarding the Series’ exposure to liquidity risk and other principal risks to which an investment in the Series may be subject.
37
Innovative ETFs
Privacy Policy
September 30, 2022 (Unaudited)
We are committed to respecting the privacy of personal information you entrust to us in the course of doing business with us.
The Fund collects non-public information about you from the following sources:
| | ● | Information we receive about you on applications or other forms; |
| | ● | Information you give us orally; and/or |
| | ● | Information about your transactions with us or others. |
We do not disclose any non-public personal information about our customers or former customers without the customer’s authorization, except as permitted by law or in response to inquiries from governmental authorities. We may share information with affiliated and unaffiliated third parties with whom we have contracts for servicing the Fund. We will provide unaffiliated third parties with only the information necessary to carry out their assigned responsibilities. We maintain physical, electronic and procedural safeguards to guard your non-public personal information and require third parties to treat your personal information with the same high degree of confidentiality.
In the event that you hold shares of the Fund through a financial intermediary, including, but not limited to, a broker-dealer, bank, or trust company, the privacy policy of your financial intermediary would govern how your non-public personal information would be shared by those entities with unaffiliated third parties.
38
THIS PAGE INTENTIONALLY LEFT BLANK
THIS PAGE INTENTIONALLY LEFT BLANK
THIS PAGE INTENTIONALLY LEFT BLANK
Investment Adviser:
Innovative Portfolios, LLC
8801 River Crossing Boulevard, Suite 100
Indianapolis, Indiana 46240
Legal Counsel:
Morgan, Lewis & Bockius LLP
1111 Pennsylvania Avenue, N.W.
Washington, D.C. 20004
Independent Registered Public Accounting Firm:
Cohen & Company, Ltd.
1350 Euclid Avenue, Suite 800
Cleveland, OH 44115
Distributor:
Foreside Distributors, LLC
Three Canal Plaza, Suite 100
Portland, ME 04101
Administrator, Fund Accountant & Transfer Agent:
U.S. Bancorp Fund Services, LLC
d/b/a U.S. Bank Global Fund Services
615 E. Michigan St.
Milwaukee, WI 53202
Custodian:
U.S. Bank N.A.
1555 North RiverCenter Drive, Suite 302
Milwaukee, WI 53212
This information must be preceded or accompanied by a current prospectus for the Funds.
Item 2. Code of Ethics.
The registrant has adopted a code of ethics that applies to the registrant’s principal executive officer and principal financial officer. The Registrant has not made any substantive amendments to its code of ethics during the period covered by this report. The registrant has not granted any waivers from any provisions of the code of ethics during the period covered by this report.
A copy of the registrant’s Code of Ethics is filed herewith.
Item 3. Audit Committee Financial Expert.
The registrant’s Board of Trustees has determined that there is at least one audit committee financial expert serving on its audit committee. Mr. John Jacobs is the “audit committee financial expert” and is considered to be “independent” as each term is defined in Item 3 of Form N-CSR.
Item 4. Principal Accountant Fees and Services.
The registrant has engaged its principal accountant to perform audit services, audit-related services, tax services and other services during the past fiscal year. “Audit services” refer to performing an audit of the registrant's annual financial statements or services that are normally provided by the accountant in connection with statutory and regulatory filings or engagements for the fiscal year. “Audit-related services” refer to the assurance and related services by the principal accountant that are reasonably related to the performance of the audit. “Tax services” refer to professional services rendered by the principal accountant for tax compliance, tax advice, and tax planning. There were no “Other services” provided by the principal accountant. The following table details the aggregate fees billed or expected to be billed for the last two fiscal years for audit fees, audit-related fees, tax fees and other fees by the principal accountant.
| | FYE 09/30/2022 | FYE 09/30/2021 |
| Audit Fees | $28,000 | $24,000 |
| Audit-Related Fees | $0 | $0 |
| Tax Fees | $6,000 | $6,000 |
| All Other Fees | $0 | $0 |
(e)(1) The audit committee has adopted pre-approval policies and procedures that require the audit committee to pre-approve all audit and non-audit services of the registrant, including services provided to any entity affiliated with the registrant.
(e)(2) The percentage of fees billed by Cohen & Company, Ltd. applicable to non-audit services pursuant to waiver of pre-approval requirement were as follows:
| | FYE 09/30/2022 | FYE 09/30/2021 |
| Audit-Related Fees | 0% | 0% |
| Tax Fees | 0% | 0% |
| All Other Fees | 0% | 0% |
(f) All of the principal accountant’s hours spent on auditing the registrant’s financial statements were attributed to work performed by full-time permanent employees of the principal accountant.
(g) The following table indicates the non-audit fees billed or expected to be billed by the registrant’s accountant for services to the registrant and to the registrant’s investment adviser (and any other controlling entity, etc.—not sub-adviser) for the last two years.
| Non-Audit Related Fees | FYE 09/30/2022 | FYE 09/30/2021 |
| Registrant | N/A | N/A |
| Registrant’s Investment Adviser | N/A | N/A |
(h) The audit committee of the board of trustees/directors has considered whether the provision of non-audit services that were rendered to the registrant's investment adviser is compatible with maintaining the principal accountant's independence and has concluded that the provision of such non-audit services by the accountant has not compromised the accountant’s independence.
The registrant has not been identified by the U.S. Securities and Exchange Commission as having filed an annual report issued by a registered public accounting firm branch or office that is located in a foreign jurisdiction where the Public Company Accounting Oversight Board is unable to inspect or completely investigate because of a position taken by an authority in that jurisdiction.
The registrant is not a foreign issuer.
Item 5. Audit Committee of Listed Registrants.
| (a) | The registrant is an issuer as defined in Rule 10A-3 under the Securities Exchange Act of 1934, (the “Act”) and has a separately-designated standing audit committee established in accordance with Section 3(a)(58)(A) of the Act. The entire Board of Trustees is acting as the registrant’s audit committee. |
Item 6. Investments.
| (a) | Schedule of Investments is included as part of the report to shareholders filed under Item 1 of this Form. |
Item 7. Disclosure of Proxy Voting Policies and Procedures for Closed-End Management Investment Companies.
Not applicable to open-end investment companies.
Item 8. Portfolio Managers of Closed-End Management Investment Companies.
Not applicable to open-end investment companies.
Item 9. Purchases of Equity Securities by Closed-End Management Investment Company and Affiliated Purchasers.
Not applicable to open-end investment companies.
Item 10. Submission of Matters to a Vote of Security Holders.
There have been no material changes to the procedures by which shareholders may recommend nominees to the registrant’s Board of Trustees.
Item 11. Controls and Procedures.
| (a) | The Registrant’s President and Treasurer have reviewed the Registrant's disclosure controls and procedures (as defined in Rule 30a-3(c) under the Investment Company Act of 1940 (the “Act”)) as of a date within 90 days of the filing of this report, as required by Rule 30a-3(b) under the Act and Rules 13a-15(b) or 15d-15(b) under the Securities Exchange Act of 1934. Based on their review, such officers have concluded that the disclosure controls and procedures are effective in ensuring that information required to be disclosed in this report is appropriately recorded, processed, summarized and reported and made known to them by others within the Registrant and by the Registrant’s service provider. |
| (b) | There were no changes in the Registrant's internal control over financial reporting (as defined in Rule 30a-3(d) under the Act) that occurred during the period covered by this report that have materially affected, or are reasonably likely to materially affect, the Registrant's internal control over financial reporting. |
Item 12. Disclosure of Securities Lending Activities for Closed-End Management Investment Companies
Not applicable to open-end investment companies.
Item 13. Exhibits.
(2) A separate certification for each principal executive officer and principal financial officer pursuant to Section 302 of the Sarbanes-Oxley Act of 2002. Filed herewith.
(3) Any written solicitation to purchase securities under Rule 23c-1 under the Act sent or given during the period covered by the report by or on behalf of the registrant to 10 or more persons. Not applicable to open-end investment companies.
(4) Change in the registrant’s independent public accountant. There was no change in the registrant’s independent public accountant for the period covered by this report.
SIGNATURES
Pursuant to the requirements of the Securities Exchange Act of 1934 and the Investment Company Act of 1940, the registrant has duly caused this report to be signed on its behalf by the undersigned, thereunto duly authorized.
| (Registrant) | Listed Funds Trust | |
| | | |
| By (Signature and Title)* | /s/ Gregory C. Bakken | |
| | Gregory C. Bakken, President/Principal Executive Officer | |
| | | |
| Date | 12/7/2022 | |
Pursuant to the requirements of the Securities Exchange Act of 1934 and the Investment Company Act of 1940, this report has been signed below by the following persons on behalf of the registrant and in the capacities and on the dates indicated.
| By (Signature and Title)* | /s/ Gregory C. Bakken | |
| | Gregory C. Bakken, President/Principal Executive Officer | |
| | | |
| Date | 12/7/2022 | |
| | | |
| By (Signature and Title)* | /s/ Travis G. Babich | |
| | Travis G. Babich, Treasurer/Principal Financial Officer | |
| | | |
| Date | 12/7/2022 | |
| * | Print the name and title of each signing officer under his or her signature. |