UNITED STATES
SECURITIES AND EXCHANGE COMMISSION
Washington, D.C. 20549
FORM N-CSR
CERTIFIED SHAREHOLDER REPORT OF REGISTERED
MANAGEMENT INVESTMENT COMPANIES
Investment Company Act file number (811-23226)
Listed Funds Trust
(Exact name of registrant as specified in charter)
615 East Michigan Street
Milwaukee, WI 53202
(Address of principal executive offices) (Zip code)
Kent P. Barnes, Secretary
Listed Funds Trust
c/o U.S. Bancorp Fund Services, LLC
777 East Wisconsin Avenue, 10th Floor
Milwaukee, WI 53202
(Name and address of agent for service)
(414) 516-1681
Registrant's telephone number, including area code
Date of fiscal year end: May 31
Date of reporting period: May 31, 2023
Item 1. Reports to Stockholders.
(a)

Wahed FTSE USA Shariah ETF
(HLAL)
Wahed Dow Jones Islamic World ETF
(UMMA)
ANNUAL REPORT
May 31, 2023
Wahed ETFs
Table of Contents
| | |
Shareholder Letter (Unaudited) | 2 |
Shareholder Expense Example (Unaudited) | 6 |
Performance Overview (Unaudited) | 7 |
Schedules of Investments | 9 |
Statements of Assets and Liabilities | 17 |
Statements of Operations | 18 |
Statements of Changes in Net Assets | 19 |
Financial Highlights | 21 |
Notes to Financial Statements | 23 |
Report of Independent Registered Public Accounting Firm | 31 |
Board Consideration and Approval of Continuation of Advisory Agreement (Unaudited) | 32 |
Review of Liquidity Risk Management Program (Unaudited) | 34 |
Trustees and Officers of the Trust (Unaudited) | 35 |
Supplemental Information (Unaudited) | 37 |
Privacy Policy (Unaudited) | 38 |
1
Wahed ETFs
Shareholder Letter
May 31, 2023 (Unaudited)
To Our Shareholders,
We greet you again for with the hope that this letter finds you and your loved ones safe, secure and healthy. The annual period has once again proven volatile and unpredictable, not only for the Wahed FTSE Shariah ETF and Wahed Dow Jones Islamic World ETF (tickers: HLAL and UMMA, respectively, and also each referred to herein individually as a “Fund” and collectively as the “Funds”), but in broader financial markets as well. Though through the last two quarters of 2022, HLAL and UMMA experienced declines followed by a rebound in line with broader interest rate sensitive patterns, the advent of 2023 saw significant fluctuations in market sentiments across time and regions, regarding the path of monetary policy, the potential for a recession and the anticipated trajectory of markets in response, all the while markets steadily moved upward from 2022 lows.
HLAL
It will not be news to most shareholders that inflation and concerns of a recession have continued to be front and center for U.S. and international equities markets and therefore, the Funds as well. With the effects of inflation on the broader U.S. and global economy becoming ever more apparent in the third quarter of 2022, Federal Reserve (“Fed”) Chairman Jerome Powell indicated that interest rates would continue to be raised as needed to restore inflation back to target levels, even if doing so would likely slow GDP growth. The Chairman’s messaging resonated with markets, with equities pricing in slower growth and increasingly higher discount rates as the central banks of the United States, the United Kingdom, Europe, and other developed countries all proceeded to continue their aggressive monetary tightening cycle, as they had previously forewarned. As 2022 wound down, there were signs that inflation was coming under control across the developed world, and as a result all the key central banks began to slow down the pace of the hikes. The market’s hyperfocus on Fed action meant that indicators of economic weakness in the U.S. and abroad such as slowing economic growth and corporate earnings were often viewed positively as propelling the end of the interest rate hiking cycle, while indicators of economic strength such as low unemployment were often viewed negatively as prolonging the hiking cycle. After a relief rally brought on by the U.S. midterm elections and Powell’s suggestions that the Fed may slow the pace of interest rate hikes, market sentiment turned negative again in December despite signs that inflation was coming under control, as the Fed vowed to continue fighting inflation by raising interest rates and keeping rates higher for longer, which dampened the markets’ hopes of an economic recovery.
The arrival of 2023 saw signs that inflation was continuing to subside across the developed world while labor conditions remained stubbornly tight. As a result, the Fed was thought to be nearing the end of its historically aggressive hiking cycle. There was some confusion about how the tight labor market data was reconcilable with Big Tech and other public company layoffs that were dominating the headlines, suggesting that the economic impact of high interest rates may not yet have been fully reflected in the official data, and the Fed’s contractionary policy responses might be divergent from the conditions on the ground. By March, it became clear that the hiking cycle was having a significant impact on the regional banking sector in the U.S., where mark-to-market losses led to bank runs that resulted in the failure of Silicon Valley Bank and other institutions. The focus shifted in April to earnings so that market participants could assess the impact of recent macro events and policies on businesses in the first quarter and what that might suggest about the direction of the economy. Several big tech companies showed considerable resilience, which was attributable to the increasing role of artificial intelligence solutions in their business models. By May, the share prices of many of the tech companies had started to skyrocket. As the month of May wound to a close, market participants wavered back and forth on how much growth from AI should be priced in. As there was already debate on whether the markets were adequately pricing recession risk, now with the AI hype market participants began making direct comparisons to the tech bubble in the early 2000s. This fueled both the pessimism about the tech bubble eventually bursting and the optimism about how much runway still lies ahead before there are any real concerns about being in a bubble.
Of course, HLAL, faced with the difficulties of calendar 2022 and the wide variety of different if not opposing narratives in the first half of 2023, experienced significant volatility. However, being historically more resilient and better performing than broader U.S. equities markets, the Fund continued to do exactly that, providing well-performing Shariah-compliant equity exposure in a passive, buy-and-hold investment style. The higher exposure to the technology sector was a tailwind for HLAL throughout the 12-month period ending May 31, 2023, and we expect it may continue to benefit the Fund as the potential for artificial intelligence continues to be harnessed. Furthermore, the exclusion of financials and highly leveraged companies has resulted in better historical performance for all Islamic funds and indices through the 2008-2009 global financial crisis,
2
Wahed ETFs
Shareholder Letter
May 31, 2023 (Unaudited) (Continued)
and 2023 year to date performance of HLAL also benefited as the market worried about contagion from the regional bank weakness. As we view speculative activities by banks to be cyclically recurring events, we believe the exclusion of financials and highly leveraged companies will also be a long-term driver of outperformance through future cycles.
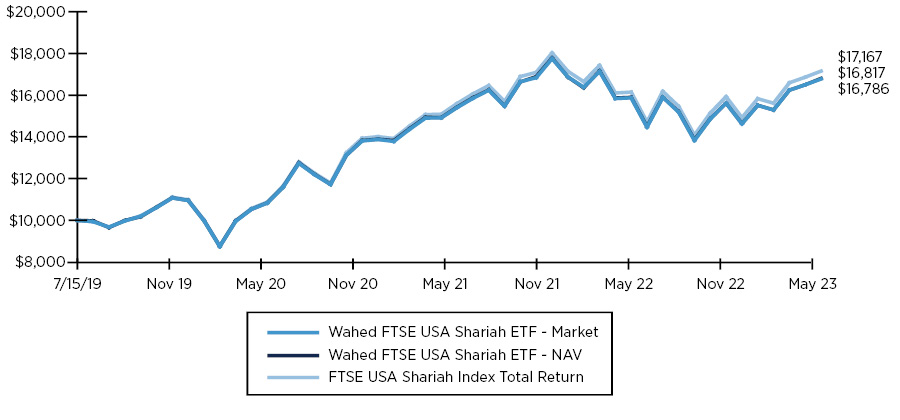
Per the chart below, as of May 31, 2023, HLAL displayed minimal tracking error to the underlying index (FTSE USA Shariah Index), well within the expected variance which is largely due to required fees and dividend distribution associated with the fund. Additionally, relative to conventional indices, HLAL outperformed broader indices.
| | | 1 Month
Total
Return | 3 Month
Total
Return | 6 Month
Total
Return | 9 Month
Total
Return | 1 Year
Total
Return | Cumulative
Total Return
Since Inception
(7/15/2019) |
Wahed FTSE USA Shariah ETF (Ticker: HLAL) | Market | 1.84% | 9.89% | 7.60% | 10.51% | 5.70% | 68.17% |
| | NAV | 1.67% | 9.69% | 7.39% | 10.46% | 5.70% | 67.86% |
FTSE USA Shariah Index Total Return | | 1.72% | 9.86% | 7.69% | 10.96% | 6.23% | 71.67% |
S&P 500 Index | | 0.43% | 5.75% | 3.31% | 7.05% | 2.89% | 48.40% |
MSCI World Islamic | | -1.78% | 4.14% | 2.53% | 10.35% | -0.09% | 24.78% |
Source: Bloomberg, US Bank as of 5/31/2023. Please note that returns over 1 year are not annualized.
Performance data quoted represents past performance; past performance does not guarantee future results. Investment return and principal value of an investment will fluctuate so that shares, when sold or redeemed, may be worth more or less than the original cost. Current performance may be lower or higher than the performance quoted. Performance data current to the most recent month end may be obtained by calling 1-855-976-4747 for fund performance.
Market returns are based upon the midpoint of the bid/ask spread at 4:00 p.m. eastern time (when NAV is normally determined for most ETFs), and do not represent the returns you would receive if you traded shares at other times.
As the Fund continues to grow in size, we do not expect any changes to the Fund’s stated strategy, both in passively tracking its underlying index (FTSE USA Shariah Index Total Return), as well as continuing to validate the underlying shariah methodology with Yasaar / FTSE Russell. Furthermore, the Fund is expected to continue to hold at least 80% of its assets in the index securities and minimize its cash holdings.
UMMA
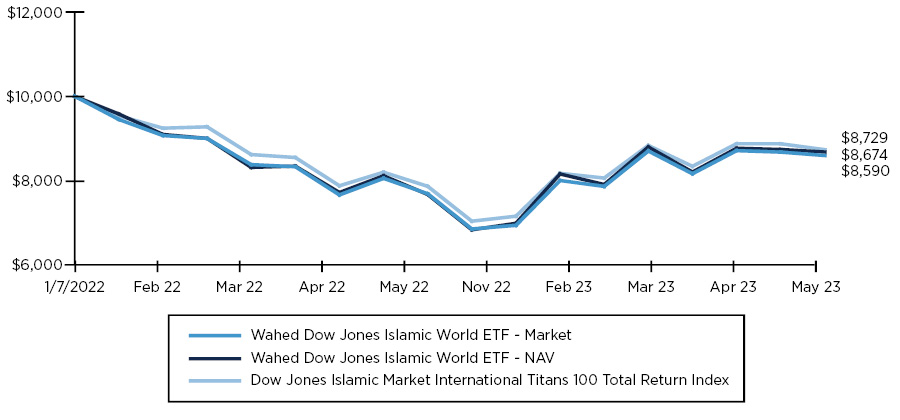
2023 also saw rapid movement in international equity markets and related volatility. This weighed on the performance of UMMA during the fiscal year ended May 31, 2023, as the Fund gained 4.0% at market.
In many ways, the economic factors contributing to the decline and recovery in U.S. markets were even more pronounced internationally, with market participants finding additional positive signs that global economic conditions may turn out better than expected. On the decline side, these economic factors in the third calendar quarter of 2022 included the strength of the U.S. dollar as a safe haven asset combined with the continuation of weakness in the UK and European political climate which led to foreign currency devaluation. Furthermore, China’s post-lockdown economy was sluggish as the country’s zero-COVID policy continued to impose constraints, which had an impact on other emerging equity markets as well. Interest rate hikes in developed countries and concerns about weakening can weigh even more heavily on emerging economies in the subsequent years. All these factors exacerbated the significant challenges for UMMA in Q3 2022 due to its international focus, and resulted in a quarterly return of -11.5% at market compared with a -4.4% return at market for HLAL over the same period. However on the recovery side, global economic factors elevated UMMA’s performance to a Q4 2022 return of 15.8% at market as compared with 5.6% at market for HLAL over the same period. These factors included China easing pandemic restrictions and reopening its economy and renewed optimism for the semiconductor sector, along with economic indicators showing Euro-area inflation beginning to slow down. The Japanese economy, facing an aging population, experienced less inflation than in other parts of the developed world which was supportive of asset prices in Japan, with the Asia Pacific region appearing closer to the growth phase of the economic cycle than the U.S. and Europe.
3
Wahed ETFs
Shareholder Letter
May 31, 2023 (Unaudited) (Continued)
With the arrival of 2023, and different countries being at different stages of their economic cycles, differences in market performance internationally arose. As January progressed, other developed and emerging markets rallied even further than the U.S., retracing some of the excess losses they faced in 2022 compared to the U.S. The momentum in emerging markets was strong to start the quarter as China came out of its zero-Covid strategy. Meanwhile, in Europe, economists no longer predicted a recession in 2023. The main contributor to these revisions was the surprisingly warm winter, which reduced the need for scarce energy reserves and lowered gas prices. Geopolitical tensions, on the other hand, dampened market sentiment in the quarter, as China and the U.S. struggled to see eye to eye on many issues. The U.S. dollar also weakened during the first quarter of 2023, as it tends to do after rising during selloffs on the equity market. As the second quarter commenced, inflation concerns started to resurface in Europe while in China, where market participants had expected that the end of China’s zero Covid policy would result in an economic boom, the economic and earnings data were somewhat disappointing in May. As a result of these factors, UMMA’s performance, which at 10.9% at market was at par with HLAL in the first quarter of 2023, then lagged HLAL in April and May. With UMMA’s maturation during the most recent fiscal year, we expect that it will continue to provide diversification benefits alongside HLAL, as U.S. and international (ex-U.S.) equities tend to outperform one another at different times.
Per the chart below, during the fiscal year ended May 31, 2023, the Fund outperformed its underlying benchmark index (Dow Jones Islamic Market International Titans 100 Total Return Index), and since inception has performed well within the expected variance which were largely due to required fees and dividend distribution associated with the fund. Additionally, relative to conventional indices, UMMA outperformed broader indices during the year.
| | | 1 Month
Total
Return | 3 Month
Total
Return | 6 Month
Total
Return | 9 Month
Total
Return | 1 Year
Total
Return | Cumulative
Total Return
Since Inception
(1/6/2022) |
Wahed Dow Jones Islamic World ETF (Ticker: UMMA) | Market | -0.70% | 5.80% | 6.41% | 13.20% | 4.02% | -13.26% |
| | NAV | -0.93% | 5.33% | 7.43% | 11.85% | 3.20% | -14.10% |
Dow Jones Islamic Market International Titans 100 TR Index | | -1.39% | 4.75% | 6.88% | 11.09% | 2.18% | -12.71% |
ACWI ex-US | | -3.57% | 1.06% | 2.66% | 8.90% | -1.19% | -11.36% |
MSCI World ex-US | | -4.08% | 0.90% | 6.19% | 12.66% | 2.22% | -7.39% |
Source: Bloomberg, US Bank as of 5/31/2023. DJI100XT Index, ACWX US Equity, MXWOU Index. Please note that returns over 1 year are not annualized.
Performance data quoted represents past performance; past performance does not guarantee future results. Investment return and principal value of an investment will fluctuate so that shares, when sold or redeemed, may be worth more or less than the original cost. Current performance may be lower or higher than the performance quoted. Performance data current to the most recent month end may be obtained by calling 1-855-976-4747 for fund performance.
Market returns are based upon the midpoint of the bid/ask spread at 4:00 p.m. eastern time (when NAV is normally determined for most ETFs), and do not represent the returns you would receive if you traded shares at other times.
4
Wahed ETFs
Shareholder Letter
May 31, 2023 (Unaudited) (Continued)
As we have said in the past, Wahed believes that investors should not be disadvantaged for wanting to invest in line with their faith. With HLAL, UMMA, and the continued expansion of our ETF products, we are excited to continue serving our shareholders through adversity and prosperity for years to come.
Sincerely,

Ahmar Shaikh
Head of North America
Wahed Invest LLC
DISCLAIMER
Must be preceded or accompanied by a prospectus.
One cannot invest in an index.
An investment in the Funds is subject to investment risk, including the possible loss of principal. The Funds may trade at a premium or discount to NAV. The Funds have the same risk as the underlying securities traded on the exchange throughout the day. Redemptions are limited and often commission are charged on every trade. The Funds’ shares may be bought and sold on an exchange through a brokerage account. Brokerage commissions and ETF expenses will reduce investment returns. There can be no assurance that an active trading market for ETF shares will be developed or maintained. The risks associated with the Funds are detailed in the “Principal Investment Risk” section of the prospectus and could include factors such as equity market risk, ETF risk, Market Capitalization risk, Market risk, new fund risk, non-diversification risk, passive investment risk, sector risk, tracking risk, ESG risk (as applicable), Shariah-Compliant Investment risk, tracking error risk, and/or underlying index risk.
For Wahed Dow Jones Islamic World ETF, applying ESG criteria to the investment process may exclude securities of certain issuers for non-investment reasons and therefore the Fund may forgo some market opportunities available to funds that do not use ESG or sustainability criteria. Emerging and Frontier markets are subject to greater market volatility, less liquidity, lower trading volume, political and economic instability, uncertainty regarding the existence of trading markets and more governmental limitations on foreign investment than more developed markets. Shariah-Compliant Investing and Islamic principles restrict the Fund’s ability to invest in certain market sectors, such as financial companies and conventional fixed-income securities, and reduce the size of the overall universe in which the Fund can invest. The strategy to reduce the investable universe may limit investment opportunities and adversely affect the Fund’s performance. Because Islamic principles preclude the use of interest-paying instruments, the Fund’s cash reserves do not earn income.
Please refer to the Schedules of Investments in this report for a complete list of Fund holdings.
The Wahed FTSE USA Shariah ETF (HLAL) and Wahed Dow Jones Islamic World ETF are distributed by Quasar Distributors, LLC.
5
Wahed ETFs
Shareholder Expense Example
May 31, 2023 (Unaudited)
As a shareholder of the Funds you incur two types of costs: (1) transaction costs, including brokerage commissions on purchases and sales of fund shares; and (2) ongoing costs, including management fees and other fund expenses. The following example is intended to help you understand your ongoing costs (in dollars and cents) of investing in the Funds and to compare these costs with the ongoing costs of investing in other funds. The examples are based on an investment of $1,000 invested at the beginning of the period and held throughout the entire period (December 1, 2022 to May 31, 2023).
ACTUAL EXPENSES
The first line under each Fund in the table below provides information about actual account values and actual expenses. You may use the information in this line, together with the amount you invested, to estimate the expenses that you paid over the period. Simply divide your account value by $1,000 (for example, an $8,600 account value divided by $1,000 = 8.6), then multiply the result by the number in the first line for your Fund under the heading entitled “Expenses Paid During Period” to estimate the expenses you paid on your account during this period.
HYPOTHETICAL EXAMPLE FOR COMPARISON PURPOSES
The second line in the table provides information about hypothetical account values and hypothetical expenses based on each Fund’s actual expense ratio and an assumed rate of return of 5% per year before expenses, which is not the Fund’s actual return. The hypothetical account values and expenses may not be used to estimate the actual ending account balance or expenses you paid for the period. You may use this information to compare the ongoing costs of investing in the Funds and other funds. To do so, compare this 5% hypothetical example with the 5% hypothetical examples that appear in the shareholder reports of the other funds. Please note that the expenses shown in the table are meant to highlight your ongoing costs only and do not reflect any transactional costs, such as brokerage commissions paid on purchases and sales of Fund shares. Therefore, the second line in the table is useful in comparing ongoing Fund costs only and will not help you determine the relative total costs of owning different funds. In addition, if these transactional costs were included, your costs would have been higher.
| | Beginning
Account
Value
12/01/22 | Ending
Account
Value
05/31/23 | Annualized
Expense
Ratios | Expenses
Paid
During the
Period(1) |
Wahed FTSE USA Shariah ETF | | | | |
Actual | $1,000.00 | $ 1,073.90 | 0.50% | $2.59 |
Hypothetical (5% return before expenses) | $1,000.00 | $ 1,022.44 | 0.50% | $2.52 |
Wahed Dow Jones Islamic World ETF | | | | |
Actual | $1,000.00 | $ 1,074.30 | 0.65% | $3.36 |
Hypothetical (5% return before expenses) | $1,000.00 | $ 1,021.69 | 0.65% | $3.28 |
(1) | Expenses are calculated using the Fund’s annualized expense ratio, multiplied by the average account value for the period, multiplied by 182/365 (to reflect the six-month period). |
6
Wahed ETFs
Performance Overview
May 31, 2023 (Unaudited)
Hypothetical Growth of $10,000 Investment
(Since Commencement through 5/31/2023)
ANNUALIZED TOTAL RETURN FOR THE PERIODS ENDED MAY 31, 2023 |
Total Returns | 1 Year | 3 Year | Since
Commencement1 |
Wahed FTSE USA Shariah ETF—NAV | 5.70% | 16.82% | 14.28% |
Wahed FTSE USA Shariah ETF—Market | 5.70% | 16.87% | 14.34% |
FTSE USA Shariah Index Total Return | 6.23% | 17.54% | 14.95% |
1 | The Fund commenced operations on July 15, 2019. |
7
Wahed ETFs
Performance Overview
May 31, 2023 (Unaudited) (Continued)
Hypothetical Growth of $10,000 Investment
(Since Commencement through 5/31/2023)
ANNUALIZED TOTAL RETURN FOR THE PERIODS ENDED MAY 31, 2023 |
Total Returns | 1 Year | Since
Commencement1 |
Wahed Dow Jones Islamic World ETF—NAV | 3.20% | -10.30% |
Wahed Dow Jones Islamic World ETF—Market | 4.02% | -9.68% |
Dow Jones Islamic Market International Titans 100 Total Return Index | 2.18% | -9.27% |
1 | The Fund commenced operations on January 7, 2022. |
The performance data quoted represents past performance. Past performance does not guarantee future results. Current performance may be lower or higher than the performance data quoted. The investment return and principal value of an investment will fluctuate so that an investor’s shares, when sold or redeemed, may be worth more or less than their original cost. For the most recent month-end performance, please call (855) 976-4747. You cannot invest directly in an index. Shares are bought and sold at market price (closing price), not net asset value (“NAV”), and are not individually redeemed from the Fund. Market performance is determined using the bid/ask midpoint at 4:00 p.m. Eastern time when the NAV is typically calculated. Brokerage commissions will reduce returns. Returns shown include the reinvestment of all dividends and distribution. Returns shown do not reflect the deduction of taxes that a shareholder would pay on fund distributions or the redemption of fund shares.
The FTSE Global Equity Shariah Index Series has been designed to be used as the basis for Shariah compliant investment products that meet the requirements of investors globally. Using large and mid-cap stocks from the FTSE Global Equity Index Series as a base universe, constituents are then screened against Shariah principles and standards by subject-matter experts at Yasaar Limited, to create a more discrete, certified Shariah compliant index series.
The FTSE USA Shariah Index contains U.S. stocks that meet the aforementioned criteria and is a sub-index of the FTSE Global Equity Shariah Index Series. The FTSE USA Shariah Index has been fully certified as Shariah compliant through a fatwa (Islamic legal opinion) issued by Yasaar Limited.
The Dow Jones Islamic Market International Titans 100 Total Return Index is designed to measure the performance of the largest 100 stocks traded globally that pass rules-based screens for adherence to Shariah investment guidelines.
8
Wahed FTSE USA Shariah ETF
Schedule of Investments
May 31, 2023
| | Shares | | | Value | |
COMMON STOCKS — 98.8% | | | | | | | | |
Administrative and Support Services — 0.2% | | | | | | | | |
Baker Hughes Co. | | | 12,311 | | | $ | 335,475 | |
Robert Half International, Inc. | | | 1,429 | | | | 92,914 | |
Rollins, Inc. | | | 3,145 | | | | 123,661 | |
RXO, Inc. (a) | | | 1,545 | | | | 32,244 | |
| | | | | | | | 584,294 | |
Air Transportation — 0.1% | | | | | | | | |
Delta Air Lines, Inc. (a) | | | 2,210 | | | | 80,289 | |
United Airlines Holdings, Inc. (a) | | | 1,111 | | | | 52,734 | |
| | | | | | | | 133,023 | |
Ambulatory Health Care Services — 0.2% | | | | | | | | |
Laboratory Corp. of America Holdings | | | 1,140 | | | | 242,284 | |
Quest Diagnostics, Inc. | | | 1,515 | | | | 200,965 | |
| | | | | | | | 443,249 | |
Apparel Manufacturing — 0.2% | | | | | | | | |
Lululemon Athletica, Inc. (a) | | | 1,519 | | | | 504,202 | |
| | | | | | | | | |
Beverage and Tobacco Product Manufacturing — 1.7% | | | | | | | | |
Keurig Dr. Pepper, Inc. | | | 11,540 | | | | 359,125 | |
Monster Beverage Corp. (a) | | | 9,826 | | | | 576,000 | |
The Coca-Cola Co. | | | 52,658 | | | | 3,141,576 | |
| | | | | | | | 4,076,701 | |
Broadcasting (except Internet) — 0.1% | | | | | | | | |
Liberty Broadband Corp. - Class A (a) | | | 220 | | | | 16,251 | |
Liberty Broadband Corp. - Class C (a) | | | 1,590 | | | | 117,819 | |
| | | | | | | | 134,070 | |
| | Shares | | | Value | |
Building Material and Garden Equipment and Supplies Dealers — 0.1% | | | | | | | | |
Masterbrand, Inc. (a) | | | 1,764 | | | $ | 18,310 | |
Snap-on, Inc. | | | 653 | | | | 162,506 | |
| | | | | | | | 180,816 | |
Chemical Manufacturing — 12.2% | | | | | | | | |
Abbott Laboratories | | | 23,119 | | | | 2,358,138 | |
Air Products & Chemicals, Inc. | | | 3,018 | | | | 812,265 | |
Albemarle Corp. | | | 1,533 | | | | 296,681 | |
Biogen, Inc. (a) | | | 1,945 | | | | 576,517 | |
BioMarin Pharmaceutical, Inc. (a) | | | 2,535 | | | | 220,393 | |
Bio-Techne Corp. | | | 2,099 | | | | 171,677 | |
Bristol-Myers Squibb Co. | | | 28,640 | | | | 1,845,562 | |
CF Industries Holdings, Inc. | | | 2,674 | | | | 164,478 | |
Church & Dwight Co., Inc. | | | 3,244 | | | | 299,908 | |
Dow, Inc. | | | 9,568 | | | | 466,727 | |
DuPont de Nemours, Inc. | | | 6,250 | | | | 419,938 | |
Eli Lilly & Co. | | | 11,298 | | | | 4,852,039 | |
FMC Corp. | | | 1,690 | | | | 175,895 | |
International Flavors & Fragrances, Inc. | | | 3,473 | | | | 268,428 | |
Linde PLC (b) | | | 6,684 | | | | 2,363,863 | |
Merck & Co., Inc. | | | 34,131 | | | | 3,768,404 | |
Moderna, Inc. (a) | | | 4,482 | | | | 572,396 | |
Pfizer, Inc. | | | 76,226 | | | | 2,898,113 | |
PPG Industries, Inc. | | | 3,138 | | | | 411,988 | |
Regeneron Pharmaceuticals, Inc. (a) | | | 1,391 | | | | 1,023,164 | |
The Estee Lauder Cos., Inc. | | | 3,060 | | | | 563,132 | |
The Mosaic Co. | | | 4,678 | | | | 149,509 | |
The Procter & Gamble Co. | | | 31,727 | | | | 4,521,097 | |
West Pharmaceutical Services, Inc. | | | 992 | | | | 331,953 | |
Westlake Chemical Corp. | | | 438 | | | | 45,530 | |
| | | | | | | | 29,577,795 | |
Clothing and Clothing Accessories Stores — 0.7% | | | | | | | | |
Ross Stores, Inc. | | | 4,502 | | | | 466,497 | |
The TJX Cos., Inc. | | | 15,709 | | | | 1,206,294 | |
| | | | | | | | 1,672,791 | |
Computer and Electronic Product Manufacturing — 32.8% (c) | | | | | | | | |
Advanced Micro Devices, Inc. (a) | | | 21,554 | | | | 2,547,898 | |
Agilent Technologies, Inc. | | | 3,951 | | | | 457,012 | |
Alphabet, Inc. - Class A (a) | | | 80,848 | | | | 9,933,794 | |
Alphabet, Inc. - Class C (a) | | | 70,384 | | | | 8,683,274 | |
Analog Devices, Inc. | | | 6,818 | | | | 1,211,490 | |
Apple, Inc. | | | 202,282 | | | | 35,854,485 | |
Bio-Rad Laboratories, Inc. - Class A (a) | | | 289 | | | | 107,898 | |
Cisco Systems, Inc. | | | 55,231 | | | | 2,743,324 | |
The accompanying notes are an integral part of the financial statements.
9
Wahed FTSE USA Shariah ETF
Schedule of Investments
May 31, 2023 (Continued)
| | Shares | | | Value | |
Computer and Electronic Product Manufacturing — 32.8% (c) (continued) | | | | | | | | |
Danaher Corp. | | | 8,724 | | | $ | 2,003,205 | |
Dell Technologies, Inc. | | | 3,207 | | | | 143,706 | |
Fortinet, Inc. (a) | | | 8,568 | | | | 585,451 | |
Fortive Corp. | | | 4,883 | | | | 317,932 | |
GE Healthcare Technologies, Inc. | | | 4,764 | | | | 378,786 | |
GlobalFoundries, Inc. (a)(b) | | | 689 | | | | 40,189 | |
Hologic, Inc. (a) | | | 3,174 | | | | 250,397 | |
HP, Inc. | | | 13,323 | | | | 387,166 | |
Illumina, Inc. (a) | | | 2,109 | | | | 414,735 | |
Intel Corp. | | | 56,129 | | | | 1,764,696 | |
Juniper Networks, Inc. | | | 4,300 | | | | 130,591 | |
Lam Research Corp. | | | 1,796 | | | | 1,107,593 | |
Marvell Technology, Inc. | | | 11,439 | | | | 669,067 | |
Masimo Corp. (a) | | | 635 | | | | 102,768 | |
Medtronic PLC (b) | | | 17,929 | | | | 1,483,804 | |
Micron Technology, Inc. | | | 14,471 | | | | 986,922 | |
NetApp, Inc. | | | 2,922 | | | | 193,875 | |
ON Semiconductor Corp. (a) | | | 5,825 | | | | 486,970 | |
QUALCOMM, Inc. | | | 15,043 | | | | 1,706,027 | |
Revvity, Inc. | | | 1,725 | | | | 198,927 | |
Roper Technologies, Inc. | | | 1,410 | | | | 640,450 | |
Teradyne, Inc. | | | 2,101 | | | | 210,499 | |
Thermo Fisher Scientific, Inc. | | | 5,268 | | | | 2,678,567 | |
Trane Technologies PLC (b) | | | 3,160 | | | | 515,807 | |
Trimble, Inc. (a) | | | 3,355 | | | | 156,578 | |
Western Digital Corp. (a) | | | 4,260 | | | | 164,990 | |
Zebra Technologies Corp. - Class A (a) | | | 693 | | | | 181,961 | |
| | | | | | | | 79,440,834 | |
Construction of Buildings — 0.5% | | | | | | | | |
DR Horton, Inc. | | | 4,149 | | | | 443,279 | |
Lennar Corp. - Class A | | | 3,375 | | | | 361,530 | |
Lennar Corp. - Class B | | | 189 | | | | 17,870 | |
NVR, Inc. (a) | | | 37 | | | | 205,506 | |
PulteGroup, Inc. | | | 2,901 | | | | 191,698 | |
| | | | | | | | 1,219,883 | |
Couriers and Messengers — 0.9% | | | | | | | | |
FedEx Corp. | | | 2,867 | | | | 624,949 | |
United Parcel Service, Inc. - Class B | | | 9,970 | | | | 1,664,990 | |
| | | | | | | | 2,289,939 | |
Data Processing, Hosting and Related Services — 0.4% | | | | | | | | |
Fiserv, Inc. (a) | | | 7,936 | | | | 890,340 | |
| | | | | | | | | |
| | Shares | | | Value | |
Electrical Equipment, Appliance and Component Manufacturing — 0.2% | | | | | | | | |
Generac Holdings, Inc. (a) | | | 853 | | | $ | 92,909 | |
Rockwell Automation, Inc. | | | 1,507 | | | | 419,850 | |
Whirlpool Corp. | | | 708 | | | | 91,537 | |
| | | | | | | | 604,296 | |
Fabricated Metal Product Manufacturing — 0.5% | | | | | | | | |
Emerson Electric Co. | | | 7,735 | | | | 600,855 | |
Nucor Corp. | | | 3,442 | | | | 454,551 | |
Stanley Black & Decker, Inc. | | | 2,029 | | | | 152,114 | |
| | | | | | | | 1,207,520 | |
Food Manufacturing — 0.9% | | | | | | | | |
Archer-Daniels-Midland Co. | | | 7,393 | | | | 522,315 | |
Bunge Ltd. (b) | | | 1,906 | | | | 176,572 | |
Mondelez International, Inc. - Class A | | | 18,490 | | | | 1,357,351 | |
The JM Smucker Co. | | | 1,384 | | | | 202,881 | |
| | | | | | | | 2,259,119 | |
Funds, Trusts and Other Financial Vehicles — 0.1% | | | | | | | | |
Garmin Ltd. (b) | | | 2,083 | | | | 214,861 | |
| | | | | | | | | |
Gasoline Stations — 1.6% | | | | | | | | |
Chevron Corp. | | | 26,108 | | | | 3,932,387 | |
| | | | | | | | | |
General Merchandise Stores — 0.2% | | | | | | | | |
Burlington Stores, Inc. (a) | | | 880 | | | | 132,405 | |
Dollar Tree, Inc. (a) | | | 2,735 | | | | 368,897 | |
| | | | | | | | 501,302 | |
Health and Personal Care Stores — 0.2% | | | | | | | | |
Ulta Beauty, Inc. (a) | | | 654 | | | | 268,029 | |
Walgreens Boots Alliance, Inc. | | | 9,827 | | | | 298,446 | |
| | | | | | | | 566,475 | |
Leather and Allied Product Manufacturing — 0.7% | | | | | | | | |
NIKE, Inc. - Class B | | | 16,185 | | | | 1,703,633 | |
| | | | | | | | | |
Machinery Manufacturing — 1.4% | | | | | | | | |
Applied Materials, Inc. | | | 11,283 | | | | 1,504,024 | |
Carrier Global Corp. | | | 11,470 | | | | 469,123 | |
Cummins, Inc. | | | 1,854 | | | | 378,976 | |
Dover Corp. | | | 1,855 | | | | 247,327 | |
IDEX Corp. | | | 1,036 | | | | 206,330 | |
Ingersoll Rand, Inc. | | | 5,348 | | | | 303,018 | |
Xylem, Inc. | | | 2,470 | | | | 247,494 | |
| | | | | | | | 3,356,292 | |
The accompanying notes are an integral part of the financial statements.
10
Wahed FTSE USA Shariah ETF
Schedule of Investments
May 31, 2023 (Continued)
| | Shares | | | Value | |
Management of Companies and Enterprises — 0.1% | | | | | | | | |
LyondellBasell Industries NV - Class A (b) | | | 3,456 | | | $ | 295,626 | |
| | | | | | | | | |
Merchant Wholesalers Durable Goods — 1.3% | | | | | | | | |
Copart, Inc. (a) | | | 5,747 | | | | 503,380 | |
Fastenal Co. | | | 7,776 | | | | 418,738 | |
Flex Ltd. (a)(b) | | | 6,124 | | | | 155,488 | |
Genuine Parts Co. | | | 1,828 | | | | 272,244 | |
Henry Schein, Inc. (a) | | | 1,820 | | | | 134,498 | |
Johnson Controls International PLC (b) | | | 9,133 | | | | 545,240 | |
LKQ Corp. | | | 3,402 | | | | 179,456 | |
TE Connectivity Ltd. (b) | | | 4,311 | | | | 528,011 | |
WW Grainger, Inc. | | | 611 | | | | 396,551 | |
| | | | | | | | 3,133,606 | |
Merchant Wholesalers Nondurable Goods — 0.6% | | | | | | | | |
AmerisourceBergen Corp. | | | 2,195 | | | | 373,479 | |
Cardinal Health, Inc. | | | 3,514 | | | | 289,202 | |
McKesson Corp. | | | 1,840 | | | | 719,146 | |
| | | | | | | | 1,381,827 | |
Mining (except Oil and Gas) — 0.7% | | | | | | | | |
Freeport-McMoRan, Inc. | | | 19,177 | | | | 658,538 | |
Martin Marietta Materials, Inc. | | | 817 | | | | 325,199 | |
Newmont Goldcorp Corp. | | | 10,150 | | | | 411,582 | |
Southern Copper Corp. | | | 996 | | | | 66,503 | |
Vulcan Materials Co. | | | 1,814 | | | | 354,637 | |
| | | | | | | | 1,816,459 | |
Miscellaneous Manufacturing — 4.8% | | | | | | | | |
3M Co. | | | 7,356 | | | | 686,388 | |
Align Technology, Inc. (a) | | | 1,067 | | | | 301,598 | |
Becton Dickinson and Co. | | | 3,790 | | | | 916,270 | |
Boston Scientific Corp. (a) | | | 19,286 | | | | 992,843 | |
DENTSPLY SIRONA, Inc. | | | 2,898 | | | | 104,676 | |
Edwards Lifesciences Corp. (a) | | | 8,385 | | | | 706,269 | |
Johnson & Johnson | | | 35,504 | | | | 5,505,250 | |
STERIS PLC (b) | | | 1,344 | | | | 268,760 | |
Stryker Corp. | | | 4,693 | | | | 1,293,297 | |
Teleflex, Inc. | | | 616 | | | | 144,606 | |
The Cooper Cos., Inc. | | | 649 | | | | 241,123 | |
Zimmer Biomet Holdings, Inc. | | | 2,826 | | | | 359,863 | |
| | | | | | | | 11,520,943 | |
Miscellaneous Store Retailers — 0.1% | | | | | | | | |
Tractor Supply Co. | | | 1,453 | | | | 304,534 | |
| | | | | | | | | |
| | Shares | | | Value | |
Motion Picture and Sound Recording Industries — 0.1% | | | | | | | | |
Take-Two Interactive Software, Inc. (a) | | | 2,137 | | | $ | 294,329 | |
| | | | | | | | | |
Motor Vehicle and Parts Dealers — 0.0% (d) | | | | | | | | |
Advance Auto Parts, Inc. | | | 812 | | | | 59,187 | |
| | | | | | | | | |
Nonmetallic Mineral Product Manufacturing — 0.2% | | | | | | | | |
Corning, Inc. | | | 9,697 | | | | 298,765 | |
Mohawk Industries, Inc. (a) | | | 708 | | | | 65,164 | |
| | | | | | | | 363,929 | |
Nonstore Retailers — 0.1% | | | | | | | | |
eBay, Inc. | | | 7,178 | | | | 305,352 | |
| | | | | | | | | |
Oil and Gas Extraction — 1.5% | | | | | | | | |
Coterra Energy, Inc. | | | 10,688 | | | | 248,496 | |
Devon Energy Corp. | | | 8,876 | | | | 409,184 | |
EOG Resources, Inc. | | | 7,810 | | | | 837,935 | |
Marathon Oil Corp. | | | 8,799 | | | | 194,986 | |
Occidental Petroleum Corp. | | | 10,744 | | | | 619,499 | |
Phillips 66 | | | 6,295 | | | | 576,685 | |
Pioneer Natural Resources Co. | | | 3,185 | | | | 635,216 | |
| | | | | | | | 3,522,001 | |
Other Information Services — 3.3% | | | | | | | | |
Meta Platforms, Inc. - Class A (a) | | | 29,908 | | | | 7,917,246 | |
| | | | | | | | | |
Paper Manufacturing — 0.2% | | | | | | | | |
International Paper Co. | | | 4,902 | | | | 144,315 | |
Packaging Corp. of America | | | 1,246 | | | | 154,541 | |
Westrock Co. | | | 3,503 | | | | 98,119 | |
| | | | | | | | 396,975 | |
Petroleum and Coal Products Manufacturing — 2.8% | | | | | | | | |
Exxon Mobil Corp. | | | 55,641 | | | | 5,685,397 | |
Marathon Petroleum Corp. | | | 6,095 | | | | 639,427 | |
Valero Energy Corp. | | | 5,198 | | | | 556,394 | |
| | | | | | | | 6,881,218 | |
Primary Metal Manufacturing — 0.1% | | | | | | | | |
Steel Dynamics, Inc. | | | 2,146 | | | | 197,217 | |
| | | | | | | | | |
The accompanying notes are an integral part of the financial statements.
11
Wahed FTSE USA Shariah ETF
Schedule of Investments
May 31, 2023 (Continued)
| | Shares | | | Value | |
Professional, Scientific and Technical Services — 2.0% | | | | | | | | |
Amdocs Ltd. (b) | | | 1,486 | | | $ | 139,937 | |
Eaton Corp. PLC (b) | | | 5,347 | | | | 940,537 | |
Exact Sciences Corp. (a) | | | 2,444 | | | | 199,381 | |
F5, Inc. (a) | | | 796 | | | | 117,474 | |
Gartner, Inc. (a) | | | 1,039 | | | | 356,231 | |
Global Payments, Inc. | | | 3,459 | | | | 337,910 | |
Horizon Therapeutics PLC (a)(b) | | | 2,898 | | | | 289,887 | |
ICON PLC (a)(b) | | | 1,094 | | | | 233,055 | |
Omnicom Group, Inc. | | | 2,710 | | | | 238,995 | |
Palo Alto Networks, Inc. (a) | | | 4,013 | | | | 856,334 | |
Paychex, Inc. | | | 4,313 | | | | 452,563 | |
Paycom Software, Inc. | | | 646 | | | | 180,964 | |
The Interpublic Group of Cos., Inc. | | | 5,247 | | | | 195,136 | |
VMware, Inc. - Class A (a) | | | 2,847 | | | | 388,018 | |
| | | | | | | | 4,926,422 | |
Publishing Industries (except Internet) — 17.7% | | | | | | | | |
Adobe, Inc. (a) | | | 6,059 | | | | 2,531,390 | |
Akamai Technologies, Inc. (a) | | | 2,042 | | | | 188,109 | |
ANSYS, Inc. (a) | | | 1,157 | | | | 374,394 | |
Autodesk, Inc. (a) | | | 2,941 | | | | 586,406 | |
Cadence Design Systems, Inc. (a) | | | 3,671 | | | | 847,670 | |
Ceridian HCM Holding, Inc. (a) | | | 1,841 | | | | 113,866 | |
Electronic Arts, Inc. | | | 3,668 | | | | 469,504 | |
Microsoft Corp. | | | 100,787 | | | | 33,097,443 | |
News Corp. - Class A | | | 5,155 | | | | 94,388 | |
News Corp. - Class B | | | 1,601 | | | | 29,586 | |
Okta, Inc. (a) | | | 2,031 | | | | 184,618 | |
PTC, Inc. (a) | | | 1,427 | | | | 191,789 | |
salesforce.com, Inc. (a) | | | 12,974 | | | | 2,898,132 | |
Synopsys, Inc. (a) | | | 2,038 | | | | 927,208 | |
Tyler Technologies, Inc. (a) | | | 550 | | | | 218,328 | |
Yandex NV - Class A (a)(b)(e)(f) | | | 3,809 | | | | — | |
ZoomInfo Technologies, Inc. (a) | | | 3,568 | | | | 88,237 | |
| | | | | | | | 42,841,068 | |
Specialty Trade Contractors — 0.1% | | | | | | | | |
Quanta Services, Inc. | | | 1,940 | | | | 344,505 | |
| | | | | | | | | |
Support Activities for Agriculture and Forestry — 0.2% | | | | | | | | |
Corteva, Inc. | | | 9,622 | | | | 514,681 | |
| | | | | | | | | |
| | Shares | | | Value | |
Support Activities for Mining — 1.5% | | | | | | | | |
ConocoPhillips | | | 16,543 | | | $ | 1,642,720 | |
Diamondback Energy, Inc. | | | 2,319 | | | | 294,861 | |
Halliburton Co. | | | 11,856 | | | | 339,674 | |
Hess Corp. | | | 3,818 | | | | 483,626 | |
Schlumberger Ltd. (b) | | | 19,156 | | | | 820,452 | |
| | | | | | | | 3,581,333 | |
Support Activities for Transportation — 0.2% | | | | | | | | |
Expeditors International of Washington, Inc. | | | 2,132 | | | | 235,181 | |
JB Hunt Transport Services, Inc. | | | 1,119 | | | | 186,839 | |
| | | | | | | | 422,020 | |
Telecommunications — 0.6% | | | | | | | | |
ResMed, Inc. | | | 1,911 | | | | 402,820 | |
T-Mobile U.S., Inc. (a) | | | 7,817 | | | | 1,072,883 | |
| | | | | | | | 1,475,703 | |
Transit and Ground Passenger Transportation — 0.4% | | | | | | | | |
Uber Technologies, Inc. (a) | | | 25,680 | | | | 974,042 | |
| | | | | | | | | |
Transportation Equipment Manufacturing — 3.5% | | | | | | | | |
Aptiv PLC (a)(b) | | | 3,560 | | | | 313,565 | |
Autoliv, Inc. | | | 1,079 | | | | 87,938 | |
BorgWarner, Inc. | | | 2,961 | | | | 131,261 | |
Gentex Corp. | | | 3,189 | | | | 83,743 | |
Lear Corp. | | | 812 | | | | 99,600 | |
PACCAR, Inc. | | | 6,861 | | | | 471,900 | |
Tesla, Inc. (a) | | | 34,865 | | | | 7,110,019 | |
Westinghouse Air Brake Technologies Corp. | | | 2,352 | | | | 217,866 | |
| | | | | | | | 8,515,892 | |
Truck Transportation — 0.2% | | | | | | | | |
Old Dominion Freight Line, Inc. | | | 1,344 | | | | 417,231 | |
| | | | | | | | | |
Utilities — 0.6% | | | | | | | | |
Avangrid, Inc. | | | 945 | | | | 35,466 | |
Constellation Energy Corp. | | | 4,484 | | | | 376,746 | |
First Solar, Inc. (a) | | | 1,385 | | | | 281,100 | |
NRG Energy, Inc. | | | 2,861 | | | | 96,673 | |
Sempra Energy | | | 4,224 | | | | 606,271 | |
Vistra Corp. | | | 4,889 | | | | 117,189 | |
| | | | | | | | 1,513,445 | |
TOTAL COMMON STOCKS (Cost $201,184,262) | | | | | | | 239,410,613 | |
| | | | | | | | | |
The accompanying notes are an integral part of the financial statements.
12
Wahed FTSE USA Shariah ETF
Schedule of Investments
May 31, 2023 (Continued)
| | Shares | | | Value | |
Real Estate Investment Trusts (REITs) — 0.9% | | | | | | | | |
Real Estate — 0.8% | | | | | | | | |
Alexandria Real Estate Equities, Inc. | | | 2,306 | | | $ | 261,639 | |
Prologis, Inc. | | | 12,378 | | | | 1,541,680 | |
Regency Centers Corp. | | | 2,353 | | | | 132,403 | |
| | | | | | | | 1,935,722 | |
Wood Product Manufacturing — 0.1% | | | | | | | | |
Weyerhaeuser Co. | | | 9,979 | | | | 285,998 | |
TOTAL REITS (Cost $2,225,425) | | | | | | | 2,221,720 | |
| | | | | | | | | |
TOTAL INVESTMENTS (Cost $203,409,687) — 99.7% | | | | | | | 241,632,333 | |
Other assets and liabilities, net — 0.3% | | | | | | | 820,293 | |
NET ASSETS — 100.0% | | | | | | $ | 242,452,626 | |
Percentages are stated as a percent of net assets.
PLC - Public Limited Company
(a) | Non-income producing security. |
(b) | Foreign issued security. |
(c) | To the extent the Fund invests more heavily in particular sectors of the economy, its performance will be especially sensitive to developments that significantly affect those sectors. |
(d) | Amount is less than 0.05%. |
(e) | Value determined based on estimated fair value. The value of this security totals $0, which represents 0.00% of total net assets. Classified as Level 3 in the fair value hierarchy. Please refer to Note 2 of the Notes to Financial Statements. |
(f) | Security has been deemed illiquid according to the Fund’s liquidity guidelines. The value of these securities total $0, which represents 0.00% of total net assets. |
The accompanying notes are an integral part of the financial statements.
13
Wahed Dow Jones Islamic World ETF
Schedule of Investments
May 31, 2023
| | Shares | | | Value | |
COMMON STOCKS — 99.1% (b) | | | | | | | | |
Aerospace and Defense — 0.7% | | | | | | | | |
Safran SA | | | 2,082 | | | $ | 300,625 | |
| | | | | | | | | |
Apparel and Textile Products — 3.1% | | | | | | | | |
adidas AG | | | 1,059 | | | | 171,043 | |
Compagnie Financière Richemont SA | | | 3,182 | | | | 503,154 | |
Hermès International | | | 205 | | | | 415,639 | |
Kering SA | | | 422 | | | | 224,204 | |
| | | | | | | | 1,314,040 | |
Automotive — 1.5% | | | | | | | | |
BYD Co. Ltd. - Class H | | | 5,179 | | | | 156,397 | |
Denso Corp. | | | 3,064 | | | | 188,842 | |
Ferrari NV | | | 786 | | | | 223,398 | |
NIO, Inc. - ADR (a) | | | 8,703 | | | | 65,534 | |
| | | | | | | | 634,171 | |
Biotechnology and Pharmaceuticals — 18.1% | | | | | | | | |
Astellas Pharma, Inc. | | | 11,259 | | | | 177,892 | |
AstraZeneca PLC | | | 6,356 | | | | 918,534 | |
CSL Ltd. | | | 2,972 | | | | 589,288 | |
Daiichi Sankyo Co. Ltd. | | | 12,006 | | | | 390,132 | |
Genmab A/S (a) | | | 388 | | | | 151,363 | |
GSK PLC | | | 24,182 | | | | 403,533 | |
Novartis AG | | | 14,808 | | | | 1,411,875 | |
Novo Nordisk A/S - Class B | | | 10,056 | | | | 1,606,898 | |
Roche Holding AG - Non-Voting Share | | | 4,429 | | | | 1,396,311 | |
Roche Holding AG - Voting Share | | | 149 | | | | 50,039 | |
Sanofi | | | 6,932 | | | | 701,181 | |
| | | | | | | | 7,797,046 | |
| | Shares | | | Value | |
Chemicals — 3.1% | | | | | | | | |
Air Liquide SA | | | 3,136 | | | $ | 523,692 | |
Givaudan SA | | | 41 | | | | 134,372 | |
Koninklijke DSM NV (e) | | | 1,017 | | | | 123,547 | |
LG Chem Ltd. | | | 263 | | | | 137,321 | |
Shin-Etsu Chemical Co. Ltd. | | | 12,940 | | | | 397,976 | |
| | | | | | | | 1,316,908 | |
Commercial Support Services — 2.9% | | | | | | | | |
Compass Group PLC | | | 26,045 | | | | 710,811 | |
Recruit Holdings Co. Ltd. | | | 10,478 | | | | 321,731 | |
Waste Connections, Inc. | | | 1,570 | | | | 214,277 | |
| | | | | | | | 1,246,819 | |
Construction Materials — 0.5% | | | | | | | | |
Sika AG | | | 880 | | | | 239,120 | |
| | | | | | | | | |
E-Commerce Discretionary — 2.6% | | | | | | | | |
JD.com, Inc. - ADR | | | 28,131 | | | | 917,071 | |
PDD Holdings, Inc. - ADR (a) | | | 3,140 | | | | 205,105 | |
| | | | | | | | 1,122,176 | |
Electrical Equipment — 3.3% | | | | | | | | |
ABB, Ltd. | | | 10,353 | | | | 376,679 | |
Assa Abloy AB - Class B | | | 5,937 | | | | 131,356 | |
Daikin Industries Ltd. | | | 1,769 | | | | 336,289 | |
Schneider Electric SE | | | 3,428 | | | | 589,631 | |
| | | | | | | | 1,433,955 | |
Food — 2.7% | | | | | | | | |
DSM-Firmenich AG (a) | | | 25 | | | | 2,773 | |
Nestle SA | | | 9,979 | | | | 1,177,853 | |
| | | | | | | | 1,180,626 | |
Health Care Facilities and Services — 0.9% | | | | | | | | |
Lonza Group AG | | | 424 | | | | 264,098 | |
Wuxi Biologics Cayman, Inc. (a)(c) | | | 20,127 | | | | 102,971 | |
| | | | | | | | 367,069 | |
Household Products — 5.9% | | | | | | | | |
Kao Corp. | | | 20,491 | | | | 715,275 | |
L’Oréal SA | | | 1,538 | | | | 654,224 | |
Reckitt Benckiser Group PLC | | | 4,484 | | | | 347,120 | |
Unilever PLC | | | 16,138 | | | | 805,860 | |
| | | | | | | | 2,522,479 | |
Industrial Support Services — 0.4% | | | | | | | | |
Ashtead Group PLC | | | 2,790 | | | | 169,439 | |
| | | | | | | | | |
Internet, Media and Services — 5.4% | | | | | | | | |
Meituan - Class B (a)(c) | | | 26,503 | | | | 373,089 | |
NAVER Corp. | | | 1,910 | | | | 287,094 | |
Prosus NV | | | 7,102 | | | | 466,173 | |
The accompanying notes are an integral part of the financial statements.
14
Wahed Dow Jones Islamic World ETF
Schedule of Investments
May 31, 2023 (Continued)
| | Shares | | | Value | |
Internet, Media and Services — 5.4% (continued) | | | | | | | | |
Tencent Holdings Ltd. | | | 30,406 | | | $ | 1,206,413 | |
| | | | | | | | 2,332,769 | |
Machinery — 3.3% | | | | | | | | |
Atlas Copco AB - Class A | | | 15,437 | | | | 224,174 | |
Atlas Copco AB - Class B | | | 9,493 | | | | 119,147 | |
FANUC Corp. | | | 5,663 | | | | 194,475 | |
Keyence Corp. | | | 1,233 | | | | 598,342 | |
SMC Corp. | | | 345 | | | | 185,396 | |
Techtronic Industries Co. Ltd. | | | 10,579 | | | | 98,178 | |
| | | | | | | | 1,419,712 | |
Medical Equipment and Devices — 2.6% | | | | | | | | |
Alcon, Inc. | | | 3,084 | | | | 238,380 | |
EssilorLuxottica SA | | | 1,826 | | | | 327,901 | |
Hoya Corp. | | | 2,164 | | | | 272,059 | |
Olympus Corp. | | | 7,894 | | | | 119,640 | |
Terumo Corp. | | | 4,685 | | | | 142,379 | |
| | | | | | | | 1,100,359 | |
Metals and Mining — 5.7% | | | | | | | | |
Anglo American PLC | | | 7,922 | | | | 218,315 | |
Barrick Gold Corp. | | | 10,299 | | | | 173,809 | |
BHP Group Ltd. | | | 30,842 | | | | 838,692 | |
Franco-Nevada Corp. | | | 1,189 | | | | 172,564 | |
Rio Tinto Ltd. | | | 3,179 | | | | 220,130 | |
Rio Tinto PLC | | | 8,898 | | | | 527,369 | |
Vale SA - ADR | | | 22,188 | | | | 281,344 | |
| | | | | | | | 2,432,223 | |
Oil and Gas Producers — 0.8% | | | | | | | | |
Canadian Natural Resources Ltd. | | | 6,644 | | | | 357,446 | |
Lukoil PJSC - ADR (a)(d)(e) | | | 3,928 | | | | — | |
Lukoil PJSC - GDR (a)(d)(e) | | | 224 | | | | — | |
| | | | | | | | 357,446 | |
Renewable Energy — 0.4% | | | | | | | | |
Vestas Wind Systems A/S (a) | | | 6,244 | | | | 177,294 | |
| | | | | | | | | |
Retail - Discretionary — 1.6% | | | | | | | | |
Fast Retailing Co. Ltd. | | | 1,119 | | | | 261,739 | |
Industria de Diseño Textil SA | | | 6,487 | | | | 216,395 | |
Wesfarmers Ltd. | | | 7,060 | | | | 217,798 | |
| | | | | | | | 695,932 | |
| | Shares | | | Value | |
Semiconductors — 15.4% | | | | | | | | |
ASML Holding NV | | | 2,478 | | | $ | 1,773,963 | |
Infineon Technologies AG | | | 52,565 | | | | 1,946,250 | |
SK Hynix, Inc. | | | 3,343 | | | | 273,535 | |
Taiwan Semiconductor Manufacturing Co. Ltd. - ADR | | | 22,757 | | | | 2,243,613 | |
Tokyo Electron Ltd. | | | 2,915 | | | | 402,986 | |
| | | | | | | | 6,640,347 | |
Software — 6.6% | | | | | | | | |
Constellation Software, Inc. | | | 110 | | | | 223,998 | |
Dassault Systemes SE | | | 4,198 | | | | 183,987 | |
SAP SE | | | 6,572 | | | | 856,042 | |
Shopify, Inc. - Class A (a) | | | 27,830 | | | | 1,590,198 | |
| | | | | | | | 2,854,225 | |
Technology Hardware — 5.8% | | | | | | | | |
Murata Manufacturing Co. Ltd. | | | 3,912 | | | | 229,571 | |
Nidec Corp. | | | 3,290 | | | | 163,423 | |
Samsung Electronics Co. Ltd. | | | 31,744 | | | | 1,707,683 | |
Samsung SDI Co. Ltd. | | | 335 | | | | 181,224 | |
Telefonaktiebolaget LM Ericsson - Class B | | | 18,865 | | | | 97,275 | |
Xiaomi Corp. - Class B (a)(c) | | | 83,642 | | | | 110,479 | |
| | | | | | | | 2,489,655 | |
Technology Services — 3.3% | | | | | | | | |
Adyen NV (a)(c) | | | 184 | | | | 299,500 | |
Amadeus IT Group SA | | | 2,473 | | | | 176,379 | |
Capgemini SE | | | 919 | | | | 159,502 | |
Experian PLC | | | 5,920 | | | | 207,791 | |
RELX PLC | | | 12,195 | | | | 379,374 | |
Wolters Kluwer NV | | | 1,578 | | | | 179,670 | |
| | | | | | | | 1,402,216 | |
Transportation and Logistics — 2.5% | | | | | | | | |
Canadian National Railway Co. | | | 3,652 | | | | 411,223 | |
Canadian Pacific Railway Ltd. (a) | | | 5,678 | | | | 432,084 | |
DSV A/S | | | 1,159 | | | | 222,751 | |
| | | | | | | | 1,066,058 | |
TOTAL COMMON STOCKS (Cost $44,794,440) | | | | | | | 42,612,709 | |
| | | | | | | | | |
TOTAL INVESTMENTS (Cost $44,794,440) — 99.1% | | | | | | | 42,612,709 | |
Other assets and liabilities, net — 0.9% | | | | | | | 368,094 | |
NET ASSETS — 100.0% | | | | | | $ | 42,980,803 | |
Percentages are stated as a percent of net assets.
ADR - American Depositary Receipt
GDR - Global Depositary Receipt
The accompanying notes are an integral part of the financial statements.
15
Wahed Dow Jones Islamic World ETF
Schedule of Investments
May 31, 2023 (Continued)
PLC - Public Limited Company
(a) | Non-income producing security. |
(b) | Foreign issued security. |
(c) | Security exempt from registration pursuant to Rule 144a under the Securities Act of 1933, as amended. These securities may be resold in transactions exempt from registration to qualified institutional investors. |
(d) | Value determined based on estimated fair value. The value of these securities total $0, which represents 0.00% of total net assets. Classified as Level 3 in the fair value hierarchy. Please refer to Note 2 of the Notes to Financial Statements. |
(e) | Security has been deemed illiquid according to the Fund’s liquidity guidelines. The value of these securities total $123,547 which represents 0.29% of total net assets. |
COUNTRY | Percentage of
Net Assets |
Switzerland | 13.5% |
Japan | 11.9% |
United Kingdom | 10.9% |
France | 9.5% |
Canada | 8.3% |
Netherlands | 7.1% |
Cayman Islands | 6.9% |
Germany | 6.9% |
Republic of Korea | 6.0% |
Taiwan | 5.2% |
Denmark | 5.0% |
Australia | 4.4% |
Sweden | 1.3% |
Spain | 0.9% |
Brazil | 0.7% |
China | 0.4% |
Hong Kong | 0.2% |
Russian Federation | 0.0% |
Total Country | 99.1% |
TOTAL INVESTMENTS | 99.1% |
Other assets and liabilities, net | 0.9% |
NET ASSETS | 100.0% |
The accompanying notes are an integral part of the financial statements.
16
Wahed ETFs
Statements of Assets and Liabilities
May 31, 2023
| | | Wahed FTSE USA
Shariah ETF | | | Wahed Dow Jones
Islamic World ETF | |
Assets | | | | | | | | |
Investments, at value (cost $203,409,687 and $44,794,440, respectively) | | $ | 241,632,333 | | | $ | 42,612,709 | |
Cash | | | 488,073 | | | | 220,413 | |
Dividends receivable | | | 412,816 | | | | 100,250 | |
Dividend withholding tax reclaims receivable | | | — | | | | 71,492 | |
Receivable for fund shares sold | | | 1,011,035 | | | | — | |
Total assets | | | 243,544,257 | | | | 43,004,864 | |
| | | | | | | | | |
Liabilities | | | | | | | | |
Payable to Adviser | | | 100,347 | | | | 24,061 | |
Payable for investment securities purchased | | | 991,284 | | | | — | |
Total liabilities | | | 1,091,631 | | | | 24,061 | |
Net Assets | | $ | 242,452,626 | | | $ | 42,980,803 | |
| | | | | | | | | |
Net Assets Consists of: | | | | | | | | |
Paid-in capital | | $ | 219,051,068 | | | $ | 46,578,304 | |
Total distributable earnings (accumulated losses) | | | 23,401,558 | | | | (3,597,501 | ) |
Net Assets | | $ | 242,452,626 | | | $ | 42,980,803 | |
| | | | | | | | | |
Shares of beneficial interest outstanding (unlimited number of shares authorized, no par value) | | | 6,025,000 | | | | 2,050,000 | |
Net Asset Value, redemption price and offering price per share | | $ | 40.24 | | | $ | 20.97 | |
The accompanying notes are an integral part of the financial statements.
17
Wahed ETFs
Statements of Operations
For the Year Ended May 31, 2023
| | | Wahed FTSE USA
Shariah ETF | | | Wahed Dow Jones
Islamic World ETF | |
Investment Income | | | | | | | | |
Dividend income (net of withholding tax and issuance fees of $- and $134,768, respectively) | | $ | 3,018,447 | | | $ | 708,903 | |
Dividend withholding tax reclaims | | | — | | | | 51,535 | |
Total investment income | | | 3,018,447 | | | | 760,438 | |
| | | | | | | | | |
Expenses | | | | | | | | |
Investment advisory fees | | | 951,849 | | | | 223,330 | |
Total expenses | | | 951,849 | | | | 223,330 | |
Net Investment Income | | | 2,066,598 | | | | 537,108 | |
| | | | | | | | | |
Realized and Unrealized Gain (Loss) on Investments and Foreign Currency | | | | | | | | |
Net realized gain (loss) on: | | | | | | | | |
Investments | | | (8,444,153 | ) | | | (1,597,518 | ) |
Foreign currency transactions | | | — | | | | (2,296 | ) |
Net realized loss on investments and foreign currency transactions | | | (8,444,153 | ) | | | (1,599,814 | ) |
Net change in unrealized appreciation/depreciation on: | | | | | | | | |
Investments | | | 21,521,909 | | | | 2,961,613 | |
Foreign currency translation | | | — | | | | (778 | ) |
Net change in unrealized appreciation/depreciation on investments and foreign currency translation | | | 21,521,909 | | | | 2,960,835 | |
Net realized and unrealized gain on investments | | | 13,077,756 | | | | 1,361,021 | |
Net increase in net assets from operations | | $ | 15,144,354 | | | $ | 1,898,129 | |
The accompanying notes are an integral part of the financial statements.
18
Wahed FTSE USA Shariah ETF
Statements of Changes in Net Assets
| | | Year Ended
May 31, 2023 | | | Year Ended
May 31, 2022 | |
From Operations | | | | | | | | |
Net investment income | | $ | 2,066,598 | | | $ | 1,539,832 | |
Net realized gain (loss) on investments | | | (8,444,153 | ) | | | 8,424,889 | |
Net change in unrealized appreciation/depreciation on investments | | | 21,521,909 | | | | (3,373,278 | ) |
Net increase in net assets resulting from operations | | | 15,144,354 | | | | 6,591,443 | |
| | | | | | | | | |
From Distributions | | | | | | | | |
Distributable earnings | | | (2,037,392 | ) | | | (1,384,308 | ) |
Total distributions | | | (2,037,392 | ) | | | (1,384,308 | ) |
| | | | | | | | | |
From Capital Share Transactions | | | | | | | | |
Proceeds from shares sold | | | 78,185,113 | | | | 79,475,180 | |
Cost of shares redeemed | | | (16,325,058 | ) | | | (26,702,197 | ) |
Net increase in net assets resulting from capital share transactions | | | 61,860,055 | | | | 52,772,983 | |
| | | | | | | | | |
Total Increase in Net Assets | | | 74,967,017 | | | | 57,980,118 | |
| | | | | | | | | |
Net Assets | | | | | | | | |
Beginning of year | | | 167,485,609 | | | | 109,505,491 | |
End of year | | $ | 242,452,626 | | | $ | 167,485,609 | |
| | | | | | | | | |
Changes in Shares Outstanding | | | | | | | | |
Shares outstanding, beginning of year | | | 4,350,000 | | | | 3,000,000 | |
Shares sold | | | 2,125,000 | | | | 2,000,000 | |
Shares redeemed | | | (450,000 | ) | | | (650,000 | ) |
Shares outstanding, end of year | | | 6,025,000 | | | | 4,350,000 | |
The accompanying notes are an integral part of the financial statements.
19
Wahed Dow Jones Islamic World ETF
Statements of Changes in Net Assets
| | | Year Ended
May 31, 2023 | | | Period Ended
May 31, 2022(1) | |
From Operations | | | | | | | | |
Net investment income | | $ | 537,108 | | | $ | 317,520 | |
Net realized gain (loss) on investments and foreign currency transactions | | | (1,599,814 | ) | | | 70,376 | |
Net change in unrealized appreciation/depreciation on investments and foreign currency translation | | | 2,960,835 | | | | (5,144,423 | ) |
Net increase (decrease) in net assets resulting from operations | | | 1,898,129 | | | | (4,756,527 | ) |
| | | | | | | | | |
From Distributions | | | | | | | | |
Distributable earnings | | | (576,603 | ) | | | (162,500 | ) |
Total distributions | | | (576,603 | ) | | | (162,500 | ) |
| | | | | | | | | |
From Capital Share Transactions | | | | | | | | |
Proceeds from shares sold | | | 9,578,095 | | | | 36,975,825 | |
Transaction fees (Note 4) | | | 3,719 | | | | 20,665 | |
Net increase in net assets resulting from capital share transactions | | | 9,581,814 | | | | 36,996,490 | |
| | | | | | | | | |
Total Increase in Net Assets | | | 10,903,340 | | | | 32,077,463 | |
| | | | | | | | | |
Net Assets | | | | | | | | |
Beginning of period | | | 32,077,463 | | | | — | |
End of period | | $ | 42,980,803 | | | $ | 32,077,463 | |
| | | | | | | | | |
Changes in Shares Outstanding | | | | | | | | |
Shares outstanding, beginning of period | | | 1,550,000 | | | | — | |
Shares sold | | | 500,000 | | | | 1,550,000 | |
Shares redeemed | | | — | | | | — | |
Shares outstanding, end of period | | | 2,050,000 | | | | 1,550,000 | |
(1) | The Fund commenced operations on January 7, 2022. |
The accompanying notes are an integral part of the financial statements.
20
Wahed FTSE USA Shariah ETF
Financial Highlights
For a Share Outstanding Throughout Each Period
| | | Year Ended
May 31, 2023 | | | Year Ended
May 31, 2022 | | | Year Ended
May 31, 2021 | | | Period Ended
May 31, 2020(1) | |
Net Asset Value, Beginning of Period | | $ | 38.50 | | | $ | 36.50 | | | $ | 26.00 | | | $ | 25.00 | |
| | | | | | | | | | | | | | | | | |
Income (Loss) from investment operations: | | | | | | | | | | | | | | | | |
Net investment income(2) | | | 0.40 | | | | 0.40 | | | | 0.36 | | | | 0.40 | |
Net realized and unrealized gain on investments | | | 1.74 | | | | 1.96 | | | | 10.44 | | | | 0.90 | |
Total from investment operations | | | 2.14 | | | | 2.36 | | | | 10.80 | | | | 1.30 | |
| | | | | | | | | | | | | | | | | |
Less distributions paid: | | | | | | | | | | | | | | | | |
From net investment income | | | (0.40 | ) | | | (0.36 | ) | | | (0.30 | ) | | | (0.28 | ) |
From net realized gains | | | — | | | | — | | | | — | | | | (0.02 | ) |
Total distributions paid | | | (0.40 | ) | | | (0.36 | ) | | | (0.30 | ) | | | (0.30 | ) |
| | | | | | | | | | | | | | | | | |
Net Asset Value, End of Period | | $ | 40.24 | | | $ | 38.50 | | | $ | 36.50 | | | $ | 26.00 | |
| | | | | | | | | | | | | | | | | |
Total return, at NAV(3)(5) | | | 5.70 | % | | | 6.43 | % | | | 41.70 | % | | | 5.30 | % |
Total return, at Market(4)(5) | | | 5.70 | % | | | 6.50 | % | | | 41.81 | % | | | 5.39 | % |
| | | | | | | | | | | | | | | | | |
Supplemental Data and Ratios: | | | | | | | | | | | | | | | | |
Net assets, end of period (000’s) | | $ | 242,453 | | | $ | 167,486 | | | $ | 109,505 | | | $ | 32,506 | |
| | | | | | | | | | | | | | | | | |
Ratio of expenses to average net assets(6) | | | 0.50 | % | | | 0.50 | % | | | 0.50 | % | | | 0.50 | % |
| | | | | | | | | | | | | | | | | |
Ratio of net investment income to average net assets(6) | | | 1.10 | % | | | 1.01 | % | | | 1.08 | % | | | 1.81 | % |
| | | | | | | | | | | | | | | | | |
Portfolio turnover rate (5)(7) | | | 29 | % | | | 16 | % | | | 19 | % | | | 15 | % |
(1) | The Fund commenced operations on July 15, 2019. |
(2) | Per share net investment income was calculated using average shares outstanding. |
(3) | Net asset value total return is calculated assuming an initial investment made at the net asset value at the beginning of the period, reinvestment of all dividends and distributions at net asset value during the period, if any, and redemption on the last day of the period at net asset value. This percentage is not an indication of the performance of a shareholder’s investment in the Fund based on market value due to the differences between the market price of the shares and the net asset value per share of the Fund. |
(4) | Market value total return is calculated assuming an initial investment made at market value at the beginning of the period, reinvestment of all dividends and distributions at market value during the period, if any, and redemption on the last day of the period at market value. Market value is determined by the composite closing price. Composite closing security price is defined as the last reported sale price on the Nasdaq Stock Market. The composite closing price is the last reported sale, regardless of volume, and not an average price, and may have occurred on a date prior to the close of the reporting period. Market value may be greater or less than net asset value, depending on the Fund’s closing price on the Nasdaq Stock Market. |
(5) | Not annualized for periods less than one year. |
(6) | Annualized for periods less than one year. |
(7) | Excludes in-kind transactions associated with creations and redemptions of the Fund. |
The accompanying notes are an integral part of the financial statements.
21
Wahed Dow Jones Islamic World ETF
Financial Highlights
For a Share Outstanding Throughout Each Period
| | | Year Ended
May 31, 2023 | | | Period Ended
May 31, 2022(1) | |
Net Asset Value, Beginning of Period | | $ | 20.70 | | | $ | 25.00 | |
| | | | | | | | | |
Income (Loss) from investment operations: | | | | | | | | |
Net investment income(2) | | | 0.31 | | | | 0.25 | |
Net realized and unrealized gain (loss) on investments and foreign currency | | | 0.30 | | | | (4.44 | ) |
Total from investment operations | | | 0.61 | | | | (4.19 | ) |
| | | | | | | | | |
Less distributions paid: | | | | | | | | |
From net investment income | | | (0.34 | ) | | | (0.13 | ) |
Total distributions paid | | | (0.34 | ) | | | (0.13 | ) |
| | | | | | | | | |
Capital Share Transactions: | | | | | | | | |
Transaction fees (See Note 4) | | | 0.00 | (8) | | | 0.02 | |
| | | | | | | | | |
Net Asset Value, End of Period | | $ | 20.97 | | | $ | 20.70 | |
| | | | | | | | | |
Total return, at NAV(3)(5) | | | 3.20 | % | | | -16.76 | % |
Total return, at Market(4)(5) | | | 4.02 | % | | | -16.62 | % |
| | | | | | | | | |
Supplemental Data and Ratios: | | | | | | | | |
Net assets, end of period (000’s) | | $ | 42,981 | | | $ | 32,077 | |
| | | | | | | | | |
Ratio of expenses to average net assets(6) | | | 0.65 | % | | | 0.65 | % |
| | | | | | | | | |
Ratio of net investment income to average net assets(6) | | | 1.56 | % | | | 2.91 | % |
| | | | | | | | | |
Portfolio turnover rate (5)(7) | | | 11 | % | | | 8 | % |
(1) | The Fund commenced operations on January 7, 2022. |
(2) | Per share net investment income was calculated using average shares outstanding. |
(3) | Net asset value total return is calculated assuming an initial investment made at the net asset value at the beginning of the period, reinvestment of all dividends and distributions at net asset value during the period, if any, and redemption on the last day of the period at net asset value. This percentage is not an indication of the performance of a shareholder’s investment in the Fund based on market value due to the differences between the market price of the shares and the net asset value per share of the Fund. |
(4) | Market value total return is calculated assuming an initial investment made at market value at the beginning of the period, reinvestment of all dividends and distributions at market value during the period, if any, and redemption on the last day of the period at market value. Market value is determined by the composite closing price. Composite closing security price is defined as the last reported sale price on the Nasdaq Stock Market. The composite closing price is the last reported sale, regardless of volume, and not an average price, and may have occurred on a date prior to the close of the reporting period. Market value may be greater or less than net asset value, depending on the Fund’s closing price on the Nasdaq Stock Market. |
(5) | Not annualized for periods less than one year. |
(6) | Annualized for periods less than one year. |
(7) | Excludes in-kind transactions associated with creations of the Fund. |
The accompanying notes are an integral part of the financial statements.
22
Wahed ETFs
Notes to Financial Statements
May 31, 2023
1. ORGANIZATION
The Wahed FTSE USA Shariah ETF (“HLAL”) and Wahed Dow Jones Islamic World ETF (“UMMA”) (each a “Fund” and collectively, the “Funds”) are non-diversified series of Listed Funds Trust (the “Trust”), formerly Active Weighting Funds ETF Trust. The Trust was organized as a Delaware statutory trust on August 26, 2016, under a Declaration of Trust amended on December 21, 2018, and is registered with the U.S. Securities and Exchange Commission (the “SEC”) as an open-end management investment company under the Investment Company Act of 1940, as amended (the “1940 Act”).
HLAL is a passively-managed exchange-traded fund (“ETF”). The Fund’s objective is to track the total return performance, before fees and expenses, of the FTSE USA Shariah Index (the “Index”). The Index is composed of common stocks of large and mid-capitalization U.S. companies the characteristics of which meet the requirements of the Shariah and are consistent with Islamic principles as interpreted by subject-matter experts.
UMMA is an actively-managed ETF. The Fund’s objective is to seek long-term capital appreciation. UMMA seeks to achieve its objective by investing in a portfolio of global companies (excluding U.S. domiciled companies) the characteristics of which meet the requirements of Shariah and are consistent with Islamic principles as interpreted by subject-matter experts. Wahed Invest LLC (“Wahed” or the “Adviser”), the Fund’s investment adviser, seeks to invest the Fund’s assets in securities similar to the components of, and to achieve returns similar to those of, the Dow Jones Islamic International Titans 100 Index (the “Index”). The Index is a data-driven index owned and maintained by S&P Dow Jones Indices, is designed to measure the stock performance of the largest ex-U.S. companies that have passed rules-based screens for adherence to Shariah investment guidelines.
2. SIGNIFICANT ACCOUNTING POLICIES
Each Fund is an investment company and accordingly follows the investment company accounting and reporting guidance of the Financial Accounting Standards Board (“FASB”) Accounting Standards Codification (“ASC”) Topic 946, Financial Services — Investment Companies. Each Fund prepares its financial statements in accordance with accounting principles generally accepted in the United States of America (“U.S. GAAP”) and follows the significant accounting policies described below.
Use of Estimates
The preparation of the financial statements in conformity with U.S. GAAP requires management to make estimates and assumptions that affect the reported amounts of assets and liabilities and disclosures of contingent assets and liabilities at the date of the financial statements and the reported amounts of increases and decreases in net assets from operations during the reporting period. Actual results could differ from these estimates.
Share Transactions
The net asset value (“NAV”) per share of each Fund will be equal to each Fund’s total assets minus each Fund’s total liabilities divided by the total number of shares outstanding. The NAV that is published will be rounded to the nearest cent. The NAV is determined as of the close of trading (generally, 4:00 p.m. Eastern Time) on each day the New York Stock Exchange (“NYSE”) is open for trading.
Fair Value Measurement
In calculating the NAV, each Fund’s exchange-traded equity securities will be valued at fair value, which will generally be determined using the last reported official closing or last trading price on the exchange or market on which the security is primarily traded at the time of valuation. Such valuations are typically categorized as Level 1 in the fair value hierarchy described below.
Securities listed on the NASDAQ Stock Market, Inc. are generally valued at the NASDAQ official closing price.
If market quotations are not readily available, or if it is determined that a quotation of a security does not represent fair value, then the security is valued at fair value as determined in good faith by the Adviser using procedures adopted by the Board of Trustees of the Trust (the “Board”). The circumstances in which a security may be fair valued include, among others: the occurrence of events that are significant to a particular issuer, such as mergers, restructurings or defaults; the occurrence of
23
Wahed ETFs
Notes to Financial Statements
May 31, 2023 (Continued)
events that are significant to an entire market, such as natural disasters in a particular region or government actions; trading restrictions on securities; thinly traded securities; and market events such as trading halts and early market closings. Due to the inherent uncertainty of valuations, fair values may differ significantly from the values that would have been used had an active market existed. Fair valuation could result in a different NAV than a NAV determined by using market quotations. Such valuations are typically categorized as Level 2 or Level 3 in the fair value hierarchy described below.
FASB ASC Topic 820, Fair Value Measurements and Disclosures (“ASC 820”) defines fair value, establishes a framework for measuring fair value in accordance with U.S. GAAP, and requires disclosure about fair value measurements. It also provides guidance on determining when there has been a significant decrease in the volume and level of activity for an asset or liability, when a transaction is not orderly, and how that information must be incorporated into fair value measurements. Under ASC 820, various inputs are used in determining the value of the Funds’ investments. These inputs are summarized in the following hierarchy:
| | ● | Level 1 — Unadjusted quoted prices in active markets for identical assets or liabilities that the Funds have the ability to access. |
| | ● | Level 2 — Observable inputs other than quoted prices included in Level 1 that are observable for the asset or liability, either directly or indirectly. These inputs may include quoted prices for the identical instrument on an inactive market, prices for similar securities, interest rates, prepayment speeds, credit risk, yield curves, default rates and similar data. |
| | ● | Level 3 — Unobservable inputs for the asset or liability, to the extent relevant observable inputs are not available; representing the Funds’ own assumptions about the assumptions a market participant would use in valuing the asset or liability, and would be based on the best information available. |
The fair value hierarchy gives the highest priority to quoted prices (unadjusted) in active markets for identical assets or liabilities (Level 1) and the lowest priority to unobservable inputs (Level 3).
The availability of observable inputs can vary from security to security and is affected by a wide variety of factors, including, for example, the type of security, whether the security is new and not yet established in the marketplace, the liquidity of markets, and other characteristics particular to the security. To the extent that valuation is based on models or inputs that are less observable or unobservable in the market, the determination of fair value requires more judgment. Accordingly, the degree of judgment exercised in determining fair value is greatest for instruments categorized in Level 3.
Foreign securities, currencies and other assets denominated in foreign currencies are translated into U.S. dollars at the exchange rate of such currencies against the U.S. dollar using the applicable currency exchange rates as of the close of the NYSE, generally 4:00 p.m. Eastern Time.
All other securities and investments for which market values are not readily available, including restricted securities, and those securities for which it is inappropriate to determine prices in accordance with the aforementioned procedures, are valued at fair value as determined in good faith under procedures adopted by the Board, although the actual calculations may be done by others. Factors considered in making this determination may include, but are not limited to, information obtained by contacting the issuer, analysts, or the appropriate stock exchange (for exchange-traded securities), analysis of the issuer’s financial statements or other available documents and, if necessary, available information concerning other securities in similar circumstances.
24
Wahed ETFs
Notes to Financial Statements
May 31, 2023 (Continued)
The inputs or methodology used for valuing securities are not necessarily an indication of the risk associated with investing in those securities. The hierarchy classification of inputs used to value each Fund’s investments at May 31, 2023, are as follows:
Wahed FTSE USA Shariah ETF
| | | Level 1 | | | Level 2 | | | Level 3 | | | Total | |
Investments - Assets: | | | | | | | | | | | | | | | | |
Common Stocks* | | $ | 239,410,613 | | | $ | — | | | $ | — | ^ | | $ | 239,410,613 | |
REITs* | | | 2,221,720 | | | | — | | | | — | | | | 2,221,720 | |
Total Investments - Assets | | $ | 241,632,333 | | | $ | — | | | $ | — | | | $ | 241,632,333 | |
* | See the Schedule of Investments for industry classifications. |
^ | The Wahed FTSE USA Shariah ETF held a Level 3 security at the end of the period valued at $-. The security classified as Level 3 is deemed immaterial. |
Wahed Dow Jones Islamic World ETF
| | | Level 1 | | | Level 2 | | | Level 3 | | | Total | |
Investments - Assets: | | | | | | | | | | | | | | | | |
Common Stocks* | | $ | 42,489,162 | | | $ | 123,547 | | | $ | — | ^ | | $ | 42,612,709 | |
Total Investments - Assets | | $ | 42,489,162 | | | $ | 123,547 | | | $ | — | | | $ | 42,612,709 | |
* | See the Schedule of Investments for industry classifications. |
^ | The Wahed Dow Jones Islamic World ETF held Level 3 securities at the end of the period valued at $-. The securities classified as Level 3 are deemed immaterial. |
Level 3 Reconciliation Disclosure
Wahed FTSE USA Shariah ETF
The Level 3 investment as of May 31, 2023 represented 0.00% of net assets and did not warrant a disclosure of significant unobservable valuation inputs. Certain Russian-issued securities continue to be untradeable due to the ongoing conflict in Russia and Ukraine, which has caused significant disruption and volatility in the global stock market.
Wahed Dow Jones Islamic World ETF
The Level 3 investments as of May 31, 2023 represented 0.00% of net assets and did not warrant a disclosure of significant unobservable valuation inputs. Certain Russian-issued securities continue to be untradeable due to the ongoing conflict in Russia and Ukraine, which has caused significant disruption and volatility in the global stock market.
Security Transactions
Investment transactions are recorded as of the date that the securities are purchased or sold (trade date). Realized gains and losses from the sale or disposition of securities are calculated based on the specific identification basis.
The Funds do not isolate that portion of the results of operations resulting from changes in foreign exchange rates on investments and currency gains or losses realized between the trade and settlement dates on securities transactions from the fluctuations arising from changes in market prices of securities held. Such fluctuations are included with the net realized and unrealized gain or loss from investments.
25
Wahed ETFs
Notes to Financial Statements
May 31, 2023 (Continued)
The Funds report net realized foreign exchange gains or losses that arise from sales of foreign currencies, currency gains or losses realized between the trade and settlement dates on foreign currency transactions, and the difference between the amounts of dividends, interest, and foreign withholding taxes recorded on each Fund’s books and the U.S. dollar equivalent of the amounts actually received or paid. Net unrealized foreign exchange gains or losses arise from changes in the values of assets and liabilities, other than investments in securities at period end, resulting from changes in exchange rates.
Investment Income
Dividend income is recognized on the ex-dividend date. Withholding taxes on foreign dividends, a portion of which may be reclaimable, has been provided for in accordance with the Funds’ understanding of the applicable tax rules and regulations. Dividend withholding tax reclaims are filed in certain countries to recover a portion of the amounts previously withheld. Dividends received on investments that represent a return of capital are classified as a reduction of cost of investments.
Distributions received from each Fund’s investments in real estate investment trusts (“REITs”) may be characterized as ordinary income, net capital gain, or a return of capital. The proper characterization of REIT distributions is generally not known until after the end of each calendar year. As such, the Funds must use estimates in reporting the character of its income and distributions received during the current calendar year for financial statement purposes. The actual character of distributions to each Fund’s shareholders will be reflected on the Form 1099 received by shareholders after the end of the calendar year. Due to the nature of REIT investments, a portion of the distributions received by each Fund’s shareholders may represent a return of capital.
Tax Information, Dividends and Distributions to Shareholders and Uncertain Tax Positions
The Funds are treated as separate entities for Federal income tax purposes. Each Fund intends to qualify as a regulated investment company (“RIC”) under Subchapter M of the Internal Revenue Code of 1986, as amended (the “Internal Revenue Code”). To qualify and remain eligible for the special tax treatment accorded to RICs, each Fund must meet certain annual income and quarterly asset diversification requirements and must distribute annually at least 90% of the sum of (i) its investment company taxable income (which includes dividends, interest and net short-term capital gains) and (ii) certain net tax-exempt income, if any. If so qualified, each Fund will not be subject to Federal income tax.
Distributions to shareholders are recorded on the ex-dividend date. The Funds generally pay out dividends from net investment income, if any, quarterly, and distribute their net capital gains, if any, to shareholders at least annually. The Funds may also pay a special distribution at the end of the calendar year to comply with Federal tax requirements. The amount of dividends and distributions from net investment income and net realized capital gains are determined in accordance with Federal income tax regulations, which may differ from U.S. GAAP. These “book/tax” differences are either considered temporary or permanent in nature. To the extent these differences are permanent in nature, such amounts are reclassified within the components of net assets based on their Federal tax basis treatment; temporary differences do not require reclassification. Dividends and distributions which exceed earnings and profit for tax purposes are reported as a tax return of capital.
Management evaluates each Fund’s tax positions to determine if the tax positions taken meet the minimum recognition threshold in connection with accounting for uncertainties in income tax positions taken or expected to be taken for the purposes of measuring and recognizing tax liabilities in the financial statements. Recognition of tax benefits of an uncertain tax position is required only when the position is “more likely than not” to be sustained assuming examination by taxing authorities. Interest and penalties related to income taxes would be recorded as income tax expense. The Funds’ Federal income tax returns are subject to examination by the Internal Revenue Service (the “IRS”) for a period of three fiscal years after they are filed. State and local tax returns may be subject to examination for an additional fiscal year depending on the jurisdiction. As of May 31, 2023, the Funds’ fiscal year end, the Funds had no material uncertain tax positions and did not have a liability for any unrecognized tax benefits. As of May 31, 2023, the Funds’ fiscal year end, the Funds had no examination in progress and management is not aware of any tax positions for which it is reasonably possible that the amounts of unrecognized tax benefits will significantly change in the next twelve months.
The Funds recognized no interest or penalties related to uncertain tax benefits in the 2023 fiscal year. At May 31, 2023, the Funds’ fiscal year end, the tax periods for the prior three years are open to examination in the Funds’ major tax jurisdiction.
26
Wahed ETFs
Notes to Financial Statements
May 31, 2023 (Continued)
Indemnification
In the normal course of business, the Funds expect to enter into contracts that contain a variety of representations and warranties and which provide general indemnifications. The Funds’ maximum exposure under these anticipated arrangements is unknown, as this would involve future claims that may be made against a Fund that have not yet occurred. However, based on experience, the Funds expect the risk of loss to be remote.
3. INVESTMENT ADVISORY AND OTHER AGREEMENTS
Investment Advisory Agreement
The Trust has entered into an Investment Advisory Agreement (the “Advisory Agreement”) with the Adviser. Under the Advisory Agreement, the Adviser provides a continuous investment program for the Funds’ assets in accordance with their investment objectives, policies and limitations, and oversees the day-to-day operations of the Funds subject to the supervision of the Board, including the Trustees who are not “interested persons” of the Trust as defined in the 1940 Act.
Pursuant to the Advisory Agreement between the Trust, on behalf of the Funds, and Wahed, each Fund pays a unified management fee to the Adviser, which is calculated daily and paid monthly, at an annual rate of 0.50% of HLAL’s average daily net assets and at an annual rate of 0.65% of UMMA’s average daily net assets. Wahed has agreed to pay all expenses of the Funds except the fee paid to Wahed under the Advisory Agreement, interest charges on any borrowings, dividends and other expenses on securities sold short, taxes, brokerage commissions and other expenses incurred in placing orders for the purchase and sale of securities and other investment instruments, acquired fund fees and expenses, accrued deferred tax liability, extraordinary expenses, and distribution (12b-1) fees and expenses (if any).
At May 31, 2023, a majority of the outstanding shares of UMMA were held in separately managed accounts of the Adviser.
Distribution Agreement and 12b-1 Plan
Quasar Distributors, LLC (“Quasar” or, the “Distributor”), a wholly owned subsidiary of Foreside Financial Group, serves as each Fund’s distributor pursuant to a Distribution Services Agreement. The Distributor receives compensation for the statutory underwriting services it provides to the Funds. The Distributor enters into agreements with certain broker-dealers and others that will allow those parties to be “Authorized Participants” and to subscribe for and redeem shares of the Funds. The Distributor will not distribute shares in less than whole Creation Units and does not maintain a secondary market in shares.
The Board has adopted a Distribution and Service Plan pursuant to Rule 12b-1 under the 1940 Act (“Rule 12b-1 Plan”). In accordance with the Rule 12b-1 Plan, each Fund is authorized to pay an amount up to 0.25% of the Fund’s average daily net assets each year for certain distribution-related activities. As authorized by the Board, no Rule 12b-1 fees are currently paid by the Funds and there are no plans to impose these fees. However, in the event Rule 12b-1 fees are charged in the future, they will be paid out of each Fund’s assets. The Adviser and its affiliates may, out of their own resources, pay amounts to third parties for distribution or marketing services on behalf of the Funds.
Administrator, Custodian and Transfer Agent
U.S. Bancorp Fund Services LLC, doing business as U.S. Bank Global Fund Services (“Fund Services” or “Administrator”) serves as administrator, transfer agent and fund accounting agent of the Funds pursuant to a Fund Servicing Agreement. U.S. Bank N.A., an affiliate of Fund Services, serves as the Funds’ custodian pursuant to a Custody Agreement. Under the terms of these agreements, the Adviser pays each Fund’s administrative, custody and transfer agency fees.
A Trustee and all officers of the Trust are affiliated with the Administrator and the Custodian.
4. CREATION AND REDEMPTION TRANSACTIONS
Shares of the Funds are listed and traded on the NASDAQ Stock Market LLC, (the “Exchange”). Each Fund issues and redeems shares on a continuous basis at NAV only in large blocks of shares called “Creation Units.” Creation Units are to be issued and redeemed principally in kind for a basket of securities and a balancing cash amount. Shares generally will trade in the secondary
27
Wahed ETFs
Notes to Financial Statements
May 31, 2023 (Continued)
market in amounts less than a Creation Unit at market prices that change throughout the day. Market prices for the shares may be different from their NAV. The NAV is determined as of the close of trading (generally, 4:00 p.m. Eastern Time) on each day the NYSE is open for trading. The NAV of the shares of each Fund will be equal to the Fund’s total assets minus the Fund’s total liabilities divided by the total number of shares outstanding. The NAV that is published will be rounded to the nearest cent; however, for purposes of determining the price of Creation Units, the NAV will be calculated to four decimal places.
Creation Unit Transaction Fee
Authorized Participants may be required to pay to the Custodian a fixed transaction fee (the “Creation Unit Transaction Fee”) in connection with the issuance of Creation Units. The standard Creation Unit Transaction Fee will be the same regardless of the number of Creation Units purchased by an investor on the applicable Business Day. The Creation Unit Transaction Fee charged by the Funds for each creation order is $500.
An additional variable fee of up to a maximum of 2% of the value of the Creation Units subject to the transaction imposed by cash purchases, non-standard orders, or partial cash purchases of Creation Units. The variable charge is primarily designed to cover additional costs (e.g., brokerage taxes) involved with buying the securities with cash. Each Fund may determine to not charge a variable fee on certain orders when the Adviser has determined that doing so is in the best interests of Fund shareholders. Variable fees, if any, received by the Funds are displayed in the Capital Share Transactions section on the Statements of Changes in Net Assets.
Only “Authorized Participants” may purchase or redeem shares directly from the Funds. An Authorized Participant is either (i) a broker-dealer or other participant in the clearing process through the Continuous Net Settlement System of National Securities Clearing Corporation or (ii) a DTC participant and, in each case, must have executed a Participant Agreement with the Distributor. Most retail investors will not qualify as Authorized Participants or have the resources to buy and sell whole Creation Units. Therefore, they will be unable to purchase or redeem the shares directly from the Funds. Rather, most retail investors will purchase shares in the secondary market with the assistance of a broker and will be subject to customary brokerage commissions or fees. Securities received or delivered in connection with in-kind creates and redeems are valued as of the close of business on the effective date of the creation or redemption.
A Creation Unit will generally not be issued until the transfer of good title of the deposit securities to the Funds and the payment of any cash amounts have been completed. To the extent contemplated by the applicable participant agreement, Creation Units of the Funds will be issued to such authorized participant notwithstanding the fact that the Funds’ deposits have not been received in part or in whole, in reliance on the undertaking of the authorized participant to deliver the missing deposit securities as soon as possible. If the Funds or its agents do not receive all of the deposit securities, or the required cash amounts, by such time, then the order may be deemed rejected and the authorized participant shall be liable to the Funds for losses, if any.
5. FEDERAL INCOME TAX
The tax character of distributions paid was as follows:
| | | Fiscal Year Ended May 31, 2023 | |
| | | Ordinary
Income(1) | | | Long-Term
Capital Gain | |
Wahed FTSE USA Shariah ETF | | $ | 2,037,392 | | | $ | — | |
Wahed Dow Jones Islamic World ETF | | | 576,603 | | | | — | |
| | | Fiscal Year/Period Ended May 31, 2022 | |
| | | Ordinary
Income(1) | | | Long-Term
Capital Gain | |
Wahed FTSE USA Shariah ETF | | $ | 1,384,308 | | | $ | — | |
Wahed Dow Jones Islamic World ETF | | | 162,500 | | | | — | |
(1) | Ordinary income includes short-term capital gains. |
28
Wahed ETFs
Notes to Financial Statements
May 31, 2023 (Continued)
At May 31, 2023, the Funds’ fiscal year end, the components of distributable earnings (accumulated losses) and cost of investments on a tax basis, including the adjustments for financial reporting purposes as of the most recently completed Federal income tax reporting year, were as follows:
| | | Wahed FTSE USA
Shariah ETF | | | Wahed Dow
Jones Islamic
World ETF | |
Federal Tax Cost of Investments | | $ | 209,455,879 | | | $ | 45,244,792 | |
Gross Tax Unrealized Appreciation | | $ | 45,933,547 | | | $ | 3,379,331 | |
Gross Tax Unrealized Depreciation | | | (13,757,093 | ) | | | (6,013,271 | ) |
Net Tax Unrealized Appreciation (Depreciation) | | | 32,176,454 | | | | (2,633,940 | ) |
Undistributed Ordinary Income | | | 390,629 | | | | 176,726 | |
Other Accumulated Gain (Loss) | | | (9,165,525 | ) | | | (1,140,287 | ) |
Total Distributable Earnings / (Accumulated Losses) | | $ | 23,401,558 | | | $ | (3,597,501 | ) |
The difference between book-basis and tax-basis unrealized appreciation is attributable primarily to the tax deferral of losses on wash sales.
At May 31, 2023, the Funds’ fiscal year end, Wahed FTSE USA Shariah ETF and Wahed Dow Jones Islamic World ETF had short-term capital losses of $7,269,929 and $658,006, respectively, and long-term capital losses of $1,895,596 and $482,281, respectively, which will be carried forward indefinitely to offset future realized capital gains.
U.S. GAAP requires that certain components of net assets relating to permanent differences be reclassified between financial and tax reporting. These reclassifications have no effect on net assets or NAV per share. The permanent differences primarily relate to redemptions in-kind. For the fiscal year ended May 31, 2023, the following reclassifications were made for permanent tax differences on the Statements of Assets and Liabilities:
| | | Total
Distributable
Earnings
(Accumulated
Losses) | | | Paid-In Capital | |
Wahed FTSE USA Shariah ETF | | $ | (4,107,346 | ) | | $ | 4,107,346 | |
Wahed Dow Jones Islamic World ETF | | | — | | | | — | |
6. INVESTMENT TRANSACTIONS
During the fiscal year ended May 31, 2023, the Funds realized net capital gains resulting from in-kind redemptions, in which shareholders exchanged Fund shares for securities held by the Funds rather than for cash. Because such gains are not taxable to the Funds, and are not distributed to shareholders, they have been reclassified from total distributable earnings (accumulated losses) to paid in-capital. The amount of realized gains and losses from in-kind redemptions included in realized gain/(loss) on investments in the Statements of Operations is as follows:
| | | Realized Gains | | | Realized Losses | |
Wahed FTSE USA Shariah ETF | | $ | 4,518,335 | | | $ | (180,381 | ) |
Wahed Dow Jones Islamic World ETF | | | — | | | | — | |
29
Wahed ETFs
Notes to Financial Statements
May 31, 2023 (Continued)
Purchases and sales of investments (excluding short-term investments), creations in-kind and redemptions in-kind for the fiscal year ended May 31, 2023, were as follows:
| | | Purchases | | | Sales | | | Creations In-Kind | | | Redemptions
In-Kind | |
Wahed FTSE USA Shariah ETF | | $ | 57,020,131 | | | $ | 56,144,737 | | | $ | 76,656,274 | | | $ | 15,879,961 | |
Wahed Dow Jones Islamic World ETF | | | 4,521,617 | | | | 3,665,854 | | | | 8,695,825 | | | | — | |
7. PRINCIPAL RISKS
As with all ETFs, shareholders of the Funds are subject to the risk that their investment could lose money. Each Fund is subject to the principal risks, any of which may adversely affect the Fund’s NAV, trading price, yield, total return and ability to meet its investment objective.
A complete description of the principal risks is included in the prospectus under the heading “Principal Investment Risks.”
8. SUBSEQUENT EVENTS
On June 30, 2023, the Funds paid a distribution to shareholders of record on June 29, 2023, as follows:
| | | Ordinary
Income Rate | | | Ordinary Income
Distribution Paid | |
Wahed FTSE USA Shariah ETF | | $ | 0.07 | | | $ | 448,000 | |
Wahed Dow Jones Islamic World ETF | | | 0.08 | | | | 168,000 | |
Other than as disclosed, there were no other subsequent events requiring recognition or disclosure through the date the financial statements were issued.
30
Wahed ETFs
Report of Independent Registered Public Accounting Firm
To the Shareholders of Wahed ETFs and
Board of Trustees of Listed Funds Trust
Opinion on the Financial Statements
We have audited the accompanying statements of assets and liabilities, including the schedules of investments, of Wahed FTSE USA Shariah ETF and Wahed Dow Jones Islamic World ETF (the “Funds”), each a series of Listed Funds Trust, as of May 31, 2023, the related statements of operations, the statements of changes in net assets, the related notes, and the financial highlights for each of the periods indicated below (collectively referred to as the “financial statements”). In our opinion, the financial statements present fairly, in all material respects, the financial position of each of the Funds as of May 31, 2023, the results of their operations, the changes in net assets, and the financial highlights for each of the periods indicated below in conformity with accounting principles generally accepted in the United States of America.
Fund Name | Statements of Operations | Statements of
Changes in Net Assets | Financial Highlights |
Wahed FTSE USA Shariah ETF | For the year ended May 31, 2023 | For the years ended May 31, 2023 and 2022 | For the years ended May 31, 2023, 2022, and 2021, and for the period from the July 15, 2019 (commencement of operations) through May 31, 2020 |
Wahed Dow Jones Islamic World ETF | For the year ended May 31, 2023 | For the year ended May 31, 2023 and for the period from January 7, 2022 (commencement of operations) through May 31, 2022 |
Basis for Opinion
These financial statements are the responsibility of the Funds’ management. Our responsibility is to express an opinion on the Funds’ financial statements based on our audits. We are a public accounting firm registered with the Public Company Accounting Oversight Board (United States) (“PCAOB”) and are required to be independent with respect to the Funds in accordance with the U.S. federal securities laws and the applicable rules and regulations of the Securities and Exchange Commission and the PCAOB.
We conducted our audits in accordance with the standards of the PCAOB. Those standards require that we plan and perform the audit to obtain reasonable assurance about whether the financial statements are free of material misstatement whether due to error or fraud.
Our audits included performing procedures to assess the risks of material misstatement of the financial statements, whether due to error or fraud, and performing procedures that respond to those risks. Such procedures included examining, on a test basis, evidence regarding the amounts and disclosures in the financial statements. Our procedures included confirmation of securities owned as of May 31, 2023, by correspondence with the custodian and brokers; when replies were not received from brokers, we performed other auditing procedures. Our audits also included evaluating the accounting principles used and significant estimates made by management, as well as evaluating the overall presentation of the financial statements. We believe that our audits provide a reasonable basis for our opinion.
We have served as the Funds’ auditor since 2019.

COHEN & COMPANY, LTD.
Cleveland, Ohio
July 28, 2023
31
Wahed FTSE USA Shariah ETF
Board Consideration and Approval of Continuation of Advisory Agreement
(Unaudited)
At a meeting held on December 6 and 8, 2022 (the “Meeting”), the Board of Trustees (the “Board”) of Listed Funds Trust (the “Trust”), including those trustees who are not “interested persons” of the Trust, as defined in the Investment Company Act of 1940 (the “1940 Act”) (the “Independent Trustees”), considered the approval of the continuation of the advisory agreement (the “Agreement”) between Wahed Invest LLC (the “Adviser”) and the Trust, on behalf of Wahed FTSE USA Shariah ETF (the “Fund”).
Pursuant to Section 15 of the 1940 Act, the continuation of the Agreement after its initial two-year term must be approved annually by: (i) the vote of the Board or shareholders of the Fund and (ii) the vote of a majority of the Independent Trustees cast at a meeting called for the purpose of voting on such approval. As discussed in greater detail below, in preparation for the Meeting, the Board requested from and reviewed a wide variety of information provided by the Adviser.
In addition to the written materials provided to the Board in advance of the Meeting, during the Meeting representatives from the Adviser provided the Board with an overview of the Fund’s strategy, the services provided to the Fund by the Adviser, and additional information about the Adviser’s personnel, financial resources, experience, investment processes, and compliance program. The Board considered the Adviser’s presentation and the materials it received in advance of the meeting, including a memorandum from legal counsel to the Trust regarding the responsibilities of the Board in considering the approval of the Agreement. The Board deliberated on the approval of the Agreement for an additional one-year period in light of this information. Throughout the process, the Board was afforded the opportunity to ask questions of, and request additional materials from, the Adviser. The Independent Trustees also met in executive session with counsel to the Trust to further discuss the Agreement and the Independent Trustees’ responsibilities relating thereto.
At the Meeting, the Board, including a majority of the Independent Trustees, evaluated a number of factors, including, among other things: (i) the nature, extent, and quality of the services provided by the Adviser to the Fund; (ii) the Fund’s expenses and performance; (iii) the cost of the services provided and profits to be realized by the Adviser from the relationship with the Fund; (iv) comparative fee and expense data for the Fund and other investment companies with similar investment objectives; (v) the extent to which the advisory fee for the Fund reflects economies of scale shared with its shareholders; (vi) any benefits derived by the Adviser from the relationship with the Fund, including any fall-out benefits enjoyed by the Adviser; and (vii) other factors the Board deemed relevant. In its deliberations, the Board considered the factors and reached the conclusions described below relating to the advisory arrangement and the renewal of the Agreement. In its deliberations, the Board did not identify any single piece of information that was paramount or controlling and the individual Trustees may have attributed different weights to various factors.
Nature, Extent, and Quality of Services Provided. The Board considered the scope of services provided under the Agreement, noting that the Adviser expected to continue to provide substantially similar investment management services to the Fund. In considering the nature, extent, and quality of the services provided by the Adviser, the Board considered the quality of the Adviser’s compliance infrastructure and past reports from the Trust’s Chief Compliance Officer. The Board also considered its previous experience with the Adviser and the investment management services it has provided to the Fund, as well as other series of the Trust. The Board noted that it had received a copy of the Adviser’s registration form on Form ADV, as well as the response of the Adviser to a detailed series of questions which included, among other things, information about the background and experience of the firm’s key personnel, the firm’s cybersecurity policy, and the services provided by the Adviser.
In addition to the Adviser’s responsibilities with respect to implementing the Fund’s investment program, the Board also considered other services currently provided by the Adviser to the Fund, such as monitoring adherence to the Fund’s investment restrictions, compliance with various policies and procedures and with applicable securities regulations, and the extent to which the Fund achieved its investment objective. The Board further considered the information provided by the Adviser with respect to the ongoing impact of the COVID-19 pandemic on the Adviser’s operations.
Historical Performance. The Board noted that it had received information regarding the Fund’s performance for various time periods in the materials provided in advance of the Meeting and considered the Fund’s performance for the period ended September 30, 2022. The Board noted that, for the one-year period, the Fund outperformed the FTSE Shariah USA Index TR (the “Benchmark”), before Fund fees and expenses, and slightly underperformed the Benchmark for the three-year and
32
Wahed FTSE USA Shariah ETF
Board Consideration and Approval of Continuation of Advisory Agreement
(Unaudited) (Continued)
since inception periods, before fees and expenses. The Board also noted that, for the one-year, three-year, and since inception periods as of October 31, 2022, the Fund outperformed the median for funds in the universe of Large Blend ETFs as reported by Morningstar (the “Category Peer Group”).
The Board also considered the Fund’s performance relative to the sole direct competitor as identified by the Adviser which is the only other Shariah compliant ETF with a domestic equity strategy (the “Selected Peer Group”). The Board noted that, for the one-year period, the Fund outperformed the Selected Peer Group.
Cost of Services Provided and Profitability. The Board reviewed the expense ratio for the Fund and compared the expense ratio to those of its Category Peer Group and Selected Peer Group. The Board took into consideration that the Adviser charges a “unitary fee,” meaning the Fund pays no expenses except for the fee paid to the Adviser pursuant to the Agreement, interest charges on any borrowings, dividends and other expenses on securities sold short, taxes, brokerage commissions and other expenses incurred in placing orders for the purchase and sale of securities and other investment instruments, acquired fund fees and expenses, accrued deferred tax liability, extraordinary expenses, and distribution fees and expenses paid by the Trust under any distribution plan adopted pursuant to Rule 12b-1 under the 1940 Act. The Board noted that the Adviser continued to be responsible for compensating the Fund’s other service providers and paying the Fund’s other expenses out of its own revenue and resources. The Board also evaluated the compensation and benefits received by the Adviser from its relationship with the Fund, taking into account the Adviser’s profitability analysis with respect to the Fund.
The Board noted that the expense ratio for the Fund was equivalent to its unitary fee. The Board further noted that the expense ratio for the Fund was significantly higher than the median of its Category Peer Group. The Board also noted that the Fund’s expense ratio was in-line with the expense ratio for the Selected Peer Group. The Board further noted that because the Category Peer Group included funds that were not Shariah compliant and funds of large fund complexes where economies of scale are more easily attainable, the Category Peer Group may not allow for an apt comparison by which to judge the Fund’s expense ratio.
Economies of Scale. The Board noted that it is not yet evident that the Fund has reached the size at which it have begun to realize economies of scale, but acknowledged that breakpoints might be warranted if the Fund’s assets continue to grow. However, the Board further determined that, based on the amount and structure of the Fund’s unitary fee, any such economies of scale would be shared with the Fund’s shareholders. The Board stated that it would monitor fees as the Fund grows and consider whether fee breakpoints may be warranted in the future.
Conclusion. No single factor was determinative of the Board’s decision to approve the continuation of the Agreement; rather, the Board based its determination on the total mix of information available to it. Based on a consideration of all the factors in their totality, the Board, including a majority of the Independent Trustees, determined that the terms of the Agreement, including the compensation payable thereunder, were fair and reasonable to the Fund. The Board, including a majority of the Independent Trustees, therefore determined that the approval of the continuation of the Agreement was in the best interests of the Fund and its shareholders.
33
Wahed ETFs
Review of Liquidity Risk Management Program
(Unaudited)
Pursuant to Rule 22e-4 under the Investment Company Act of 1940, the Trust, on behalf of the series of the Trust covered by this shareholder report (the “Series”), has adopted a liquidity risk management program to govern the Trust’s approach to managing liquidity risk. Rule 22e-4 seeks to promote effective liquidity risk management, thereby reducing the risk that a fund will be unable to meet its redemption obligations and mitigating dilution of the interests of fund shareholders. The Trust’s liquidity risk management program is tailored to reflect the Series’ particular risks, but not to eliminate all adverse impacts of liquidity risk, which would be incompatible with the nature of such Series.
The investment adviser to the Series has adopted and implemented its own written liquidity risk management program (the “Program”) tailored specifically to assess and manage the liquidity risk of the Series. At a recent meeting of the Board of Trustees of the Trust, the Trustees received a report pertaining to the operation, adequacy, and effectiveness of implementation of the Program for the period ended December 31, 2022. The report concluded that the Program is reasonably designed to assess and manage the Series’ liquidity risk and has operated adequately and effectively to manage such risk. The report reflected that there were no liquidity events that impacted the Series’ ability to timely meet redemptions without dilution to existing shareholders. The report further noted that no material changes have been made to the Program since its implementation.
There can be no assurance that the Program will achieve its objectives in the future. Please refer to the prospectus for more information regarding the Series’ exposure to liquidity risk and other principal risks to which an investment in the Series may be subject.
34
Wahed ETFs
Trustees and Officers of the Trust
May 31, 2023 (Unaudited)
The Funds’ Statement of Additional Information includes additional information about the Funds’ Trustees and Officers, and is available, without charge upon request by calling 1-855-976-4747, or by visiting the Funds’ website at www.funds.wahedinvest.com.
Name and Year of Birth | Position Held
with the Trust | Term of Office
and Length of
Time Served | Principal Occupation(s)
During Past 5 Years | Number of
Portfolios in
Fund Complex
Overseen by
Trustee | Other
Directorships Held
by Trustee During
Past 5 Years |
Independent Trustees | | | | | |
John L. Jacobs
Year of birth: 1959 | Trustee and Audit Committee Chair | Indefinite term; since 2017 | Chairman of Alerian, Inc. (since June 2018); Founder and CEO of Q3 Advisors, LLC (financial consulting firm) (since 2015); Executive Director of Center for Financial Markets and Policy (2016–2022); Distinguished Policy Fellow and Executive Director, Center for Financial Markets and Policy, Georgetown University (2015–2022); Senior Advisor, Nasdaq OMX Group (2015–2016); Executive Vice President, Nasdaq OMX Group (2013–2015) | 56 | Independent Trustee, SHP ETF Trust (since 2021) (2 portfolios); Director, tZERO Group, Inc. (since 2020); Independent Trustee, Procure ETF Trust II (since 2018) (1 portfolio); Independent Trustee, Horizons ETF Trust I (2015-2019) |
Koji Felton
Year of birth: 1961 | Trustee | Indefinite term; since 2019 | Retired; formerly Counsel, Kohlberg Kravis Roberts & Co. L.P. (investment firm) (2013–2015); Counsel, Dechert LLP (law firm) (2011–2013) | 56 | Independent Trustee, Series Portfolios Trust (since 2015) (10 portfolios) |
Pamela H. Conroy Year of birth: 1961 | Trustee and Nominating and Governance Committee Chair | Indefinite term; since 2019 | Retired; formerly Executive Vice President, Chief Operating Officer & Chief Compliance Officer, Institutional Capital Corporation (investment firm) (1994–2008) | 56 | Independent Trustee, Frontier Funds, Inc. (since 2020) (6 portfolios) |
Interested Trustee | | | | | |
Paul R. Fearday, CPA* Year of birth: 1979 | Trustee and Chairman | Indefinite term; since 2019 | Senior Vice President, U.S. Bancorp Fund Services, LLC (since 2008). | 56 | None. |
* | This Trustee is considered an “Interested Trustee” as defined in the 1940 Act because of his affiliation with U.S. Bancorp Fund Services, d/b/a U.S. Bank Global Fund Services and U.S. Bank N.A., which provide fund accounting, administration, transfer agency and custodian services to the Funds. |
35
Wahed ETFs
Trustees and Officers of the Trust
May 31, 2023 (Unaudited) (Continued)
Name and Year of Birth | Position(s)
Held with
the Trust | Term of Office
and Length of
Time Served | Principal Occupation(s) During Past 5 Years |
Officers | | | |
Gregory Bakken
Year of birth: 1983 | President and Principal Executive Officer | Indefinite term, February 2019 | Vice President, U.S. Bancorp Fund Services, LLC (since 2006) |
Travis G. Babich
Year of birth: 1980 | Treasurer and Principal Financial Officer | Indefinite term, September 2019 | Vice President, U.S. Bancorp Fund Services, LLC (since 2005) |
Kacie G. Briody
Year of birth: 1992 | Assistant Treasurer | Indefinite term, March 2019 | Assistant Vice President, U.S. Bancorp Fund Services, LLC (since 2021); Officer, U.S. Bancorp Fund Services, LLC (2014 to 2021) |
Kent Barnes
Year of birth: 1968 | Secretary | Indefinite term, February 2019 | Vice President, U.S. Bancorp Fund Services, LLC (since 2018); Chief Compliance Officer, Rafferty Asset Management, LLC (2016 to 2018); Vice President, U.S. Bancorp Fund Services, LLC (2007 to 2016) |
Christi C. James
Year of birth: 1974 | Chief Compliance Officer and Anti-Money Laundering Officer | Indefinite term, July 2022 | Senior Vice President, U.S. Bancorp Fund Services, LLC (since 2022); Principal Consultant, ACA Group (2021 to 2022); Lead Manager, Communications Compliance, T. Rowe Price Investment Services, Inc. (2018 to 2021); Compliance & Legal Manager, CR Group LP (2017 to 2018). |
Jay S. Fitton
Year of birth: 1970 | Assistant Secretary | Indefinite term, May 2023 | Vice President, U.S. Bancorp Fund Services, LLC (since 2022); Assistant Vice President, U.S. Bancorp Fund Services, LLC (2019 to 2022); Partner, Practus (2018 to 2019); Counsel, Drinker Biddle & Rather LLP (2016-2018). |
36
Wahed ETFs
Supplemental Information
(Unaudited)
Investors should consider the investment objective and policies, risk considerations, charges and ongoing expenses of an investment carefully before investing. The prospectus contains this and other information relevant to an investment in the Funds. Please read the prospectus carefully before investing. A copy of the prospectus for the Funds may be obtained without charge by writing to the Funds, c/o U.S. Bank Global Fund Services, P.O. Box 701, Milwaukee, Wisconsin 53201-0701, by calling 1-855-976-4747, or by visiting the Funds’ website at www.funds.wahedinvest.com.
QUARTERLY PORTFOLIO HOLDING INFORMATION
Each Fund files its complete schedule of portfolio holdings for its first and third fiscal quarters with the Securities and Exchange Commission (“SEC”) on Part F of Form N-PORT. The Funds’ Part F of Form N-PORT is available without charge, upon request, by calling toll-free at 1-855-976-4747. Furthermore, you may obtain the Part F of Form N-PORT on the SEC’s website at www.sec.gov.
PROXY VOTING INFORMATION
The Funds are required to file a Form N-PX, with each Fund’s complete proxy voting record for the 12 months ended June 30, no later than August 31 of each year. The Funds’ proxy voting record will be available without charge, upon request, by calling toll-free 1-855-976-4747 and on the SEC’s website at www.sec.gov.
FREQUENCY DISTRIBUTION OF PREMIUMS AND DISCOUNTS
Information regarding how often shares of each Fund trade on an exchange at a price above (i.e., at a premium) or below (i.e., at a discount) the NAV of the Funds are available without charge, on the Funds’ website at www.funds.wahedinvest.com.
TAX INFORMATION
Each Fund designated 100.00% of its ordinary income distribution for the fiscal year ended May 31, 2023 as qualified dividend income under the Jobs and Growth Tax Relief Reconciliation Act of 2003.
For the fiscal year ended May 31, 2023, 100.00% and 0.00% of dividends paid from net ordinary income qualified for the dividends received deduction available to corporate shareholders of the Wahed FTSE USA Shariah ETF and Wahed Dow Jones Islamic World ETF, respectively.
For the fiscal year ended May 31, 2023, Wahed FTSE USA Shariah ETF earned foreign source income and paid foreign taxes, which the Fund intends to pass through to its shareholders pursuant to Section 853 of the Internal Revenue Code:
| | | Foreign Source
Income Earned | | | Foreign
Taxes Paid | |
Wahed FTSE USA Shariah ETF | | $ | 843,825 | | | $ | 81,585 | |
37
Wahed ETFs
Privacy Policy
(Unaudited)
We are committed to respecting the privacy of personal information you entrust to us in the course of doing business with us.
The Funds collect non-public information about you from the following sources:
| | ● | Information we receive about you on applications or other forms; |
| | ● | Information you give us orally; and/or |
| | ● | Information about your transactions with us or others. |
We do not disclose any non-public personal information about our customers or former customers without the customer’s authorization, except as permitted by law or in response to inquiries from governmental authorities. We may share information with affiliated and unaffiliated third parties with whom we have contracts for servicing the Funds. We will provide unaffiliated third parties with only the information necessary to carry out their assigned responsibilities. We maintain physical, electronic and procedural safeguards to guard your non-public personal information and require third parties to treat your personal information with the same high degree of confidentiality.
In the event that you hold shares of the Funds through a financial intermediary, including, but not limited to, a broker-dealer, bank, or trust company, the privacy policy of your financial intermediary would govern how your non-public personal information would be shared by those entities with unaffiliated third parties.
38
THIS PAGE INTENTIONALLY LEFT BLANK
THIS PAGE INTENTIONALLY LEFT BLANK
THIS PAGE INTENTIONALLY LEFT BLANK
Investment Adviser:
Wahed Invest LLC
12 East 49th Street, 11th Floor
New York, NY 10017
Legal Counsel:
Morgan, Lewis & Bockius LLP
1111 Pennsylvania Avenue, N.W.
Washington, D.C. 20004
Independent Registered Public Accounting Firm:
Cohen & Company, Ltd.
1350 Euclid Avenue, Suite 800
Cleveland, OH 44115
Distributor:
Quasar Distributors, LLC
111 East Kilbourn Avenue, Suite 2200
Milwaukee, WI 53202
Administrator, Fund Accountant & Transfer Agent:
U.S. Bancorp Fund Services, LLC
d/b/a U.S. Bank Global Fund Services
615 East Michigan Street
Milwaukee, WI 53202
Custodian:
U.S. Bank N.A.
1555 North RiverCenter Drive, Suite 302
Milwaukee, WI 53212
This information must be preceded or accompanied by a current prospectus for the Funds.
Item 2. Code of Ethics.
The registrant has adopted a code of ethics that applies to the registrant’s principal executive officer and principal financial officer. The Registrant has not made any substantive amendments to its code of ethics during the period covered by this report. The registrant has not granted any waivers from any provisions of the code of ethics during the period covered by this report.
A copy of the registrant’s Code of Ethics is filed herewith.
Item 3. Audit Committee Financial Expert.
The registrant’s Board of Trustees has determined that there is at least one audit committee financial expert serving on its audit committee. Mr. John Jacobs is the “audit committee financial expert” and is considered to be “independent” as each term is defined in Item 3 of Form N-CSR.
Item 4. Principal Accountant Fees and Services.
The registrant has engaged its principal accountant to perform audit services, audit-related services, tax services and other services during the past two fiscal years. “Audit services” refer to performing an audit of the registrant's annual financial statements or services that are normally provided by the accountant in connection with statutory and regulatory filings or engagements for those fiscal years. “Audit-related services” refer to the assurance and related services by the principal accountant that are reasonably related to the performance of the audit. “Tax services” refer to professional services rendered by the principal accountant for tax compliance, tax advice, and tax planning. There were no “Other services” provided by the principal accountant. The following table details the aggregate fees billed or expected to be billed for the last two fiscal years for audit fees, audit-related fees, tax fees and other fees by the principal accountant.
| | FYE 05/31/2023 | FYE 05/31/2022 |
| Audit Fees | $30,000 | $30,000 |
| Audit-Related Fees | $0 | $0 |
| Tax Fees | $6,000 | $6,000 |
| All Other Fees | $0 | $0 |
(e)(1) The audit committee has adopted pre-approval policies and procedures that require the audit committee to pre-approve all audit and non-audit services of the registrant, including services provided to any entity affiliated with the registrant.
(e)(2) The percentage of fees billed by Cohen & Company, Ltd. applicable to non-audit services pursuant to waiver of pre-approval requirement were as follows:
| | FYE 05/31/2023 | FYE 05/31/2022 |
| Audit-Related Fees | 0% | 0% |
| Tax Fees | 0% | 0% |
| All Other Fees | 0% | 0% |
(f) All of the principal accountant’s hours spent on auditing the registrant’s financial statements were attributed to work performed by full-time permanent employees of the principal accountant.
(g) The following table indicates the non-audit fees billed or expected to be billed by the registrant’s accountant for services to the registrant and to the registrant’s investment adviser (and any other controlling entity, etc.—not sub-adviser) for the last two years.
| Non-Audit Related Fees | FYE 05/31/2023 | FYE 05/31/2022 |
| Registrant | N/A | N/A |
| Registrant’s Investment Adviser | N/A | N/A |
(h) The audit committee of the board of trustees/directors has considered whether the provision of non-audit services that were rendered to the registrant's investment adviser is compatible with maintaining the principal accountant's independence and has concluded that the provision of such non-audit services by the accountant has not compromised the accountant’s independence.
The registrant has not been identified by the U.S. Securities and Exchange Commission as having filed an annual report issued by a registered public accounting firm branch or office that is located in a foreign jurisdiction where the Public Company Accounting Oversight Board is unable to inspect or completely investigate because of a position taken by an authority in that jurisdiction.
The registrant is not a foreign issuer.
Item 5. Audit Committee of Listed Registrants.
| (a) | The registrant is an issuer as defined in Rule 10A-3 under the Securities Exchange Act of 1934, (the “Act”) and has a separately-designated standing audit committee established in accordance with Section 3(a)(58)(A) of the Act. The entire Board of Trustees is acting as the registrant’s audit committee. |
Item 6. Investments.
| (a) | Schedule of Investments is included as part of the report to shareholders filed under Item 1 of this Form. |
Item 7. Disclosure of Proxy Voting Policies and Procedures for Closed-End Management Investment Companies.
Not applicable to open-end investment companies.
Item 8. Portfolio Managers of Closed-End Management Investment Companies.
Not applicable to open-end investment companies.
Item 9. Purchases of Equity Securities by Closed-End Management Investment Company and Affiliated Purchasers.
Not applicable to open-end investment companies.
Item 10. Submission of Matters to a Vote of Security Holders.
There have been no material changes to the procedures by which shareholders may recommend nominees to the registrant’s Board of Trustees.
Item 11. Controls and Procedures.
| (a) | The Registrant’s President and Treasurer have reviewed the Registrant's disclosure controls and procedures (as defined in Rule 30a-3(c) under the Investment Company Act of 1940 (the “Act”)) as of a date within 90 days of the filing of this report, as required by Rule 30a-3(b) under the Act and Rules 13a-15(b) or 15d-15(b) under the Securities Exchange Act of 1934. Based on their review, such officers have concluded that the disclosure controls and procedures are effective in ensuring that information required to be disclosed in this report is appropriately recorded, processed, summarized and reported and made known to them by others within the Registrant and by the Registrant’s service provider. |
| (b) | There were no changes in the Registrant's internal control over financial reporting (as defined in Rule 30a-3(d) under the Act) that occurred during the period covered by this report that have materially affected, or are reasonably likely to materially affect, the Registrant's internal control over financial reporting. |
Item 12. Disclosure of Securities Lending Activities for Closed-End Management Investment Companies
Not applicable to open-end investment companies.
Item 13. Exhibits.
| (a) | (1) Any code of ethics or amendment thereto, that is the subject of the disclosure required by Item 2, to the extent that the registrant intends to satisfy Item 2 requirements through filing an exhibit. Filed herewith. |
(2) A separate certification for each principal executive officer and principal financial officer pursuant to Section 302 of the Sarbanes-Oxley Act of 2002. Filed herewith.
(3) Any written solicitation to purchase securities under Rule 23c-1 under the Act sent or given during the period covered by the report by or on behalf of the registrant to 10 or more persons. Not applicable to open-end investment companies.
| (4)Change | in the registrant’s independent public accountant. There was no change in the registrant’s independent public accountant for the period covered by this report. |
| (b) | Certifications pursuant to Section 906 of the Sarbanes-Oxley Act of 2002. Furnished herewith. |
SIGNATURES
Pursuant to the requirements of the Securities Exchange Act of 1934 and the Investment Company Act of 1940, the registrant has duly caused this report to be signed on its behalf by the undersigned, thereunto duly authorized.
| | (Registrant) | Listed Funds Trust | |
| | | | |
| | By (Signature and Title)* | /s/ Gregory C. Bakken | |
| | | Gregory C. Bakken, President/Principal Executive Officer | |
| | | | |
| | Date | 8/3/2023 | |
Pursuant to the requirements of the Securities Exchange Act of 1934 and the Investment Company Act of 1940, this report has been signed below by the following persons on behalf of the registrant and in the capacities and on the dates indicated.
| | By (Signature and Title)* | /s/ Gregory C. Bakken | |
| | | Gregory C. Bakken, President/Principal Executive Officer | |
| | | | |
| | Date | 8/3/2023 | |
| | | | |
| | By (Signature and Title)* | /s/ Travis G. Babich | |
| | | Travis G. Babich, Treasurer/Principal Financial Officer | |
| | | | |
| | Date | 8/3/2023 | |
| * | Print the name and title of each signing officer under his or her signature. |