UNITED STATES
SECURITIES AND EXCHANGE COMMISSION
Washington, D.C. 20549
FORM N-CSR
CERTIFIED SHAREHOLDER REPORT OF REGISTERED
MANAGEMENT INVESTMENT COMPANIES
Investment Company Act file number (811-23226)
Listed Funds Trust
(Exact name of registrant as specified in charter)
615 East Michigan Street
Milwaukee, WI 53202
(Address of principal executive offices) (Zip code)
Gregory C. Bakken, President
Listed Funds Trust
c/o U.S. Bancorp Fund Services, LLC
777 East Wisconsin Avenue, 6th Floor
Milwaukee, WI 53202
(Name and address of agent for service)
(414) 516-3097
Registrant’s telephone number, including area code
Date of fiscal year end: April 30
Date of reporting period: October 31, 2023
Item 1. Reports to Stockholders.

Teucrium ETFs
Teucrium Agricultural Strategy No K-1 ETF (TILL)
Teucrium AiLA Long-Short Agriculture Strategy ETF (OAIA)
Teucrium AiLA Long-Short Base Metals Strategy ETF (OAIB)
SEMI-ANNUAL REPORT
October 31, 2023
(Unaudited)
Teucrium ETFs
Table of Contents
(Unaudited)
| | |
Shareholder Expense Example | 2 |
Teucrium Agricultural Strategy No K-1 ETF | |
Consolidated Schedule of Investments | 3 |
Consolidated Schedule of Open Futures Contracts | 4 |
Teucrium AiLA Long-Short Agriculture Strategy ETF | |
Consolidated Schedule of Investments | 5 |
Consolidated Schedule of Open Futures Contracts | 6 |
Teucrium AiLA Long-Short Base Metals Strategy ETF | |
Consolidated Schedule of Investments | 7 |
Consolidated Schedule of Open Futures Contracts | 8 |
Consolidated Statements of Assets and Liabilities | 9 |
Consolidated Statements of Operations | 10 |
Consolidated Statements of Changes in Net Assets | 11 |
Consolidated Financial Highlights | 14 |
Notes to Consolidated Financial Statements | 17 |
Supplemental Information | 30 |
1
Teucrium ETFs
Shareholder Expense Example
(Unaudited)
As a shareholder of a fund you incur two types of costs: (1) transaction costs, including brokerage commissions on purchases and sales of fund shares; and (2) ongoing costs, including management fees and other fund expenses. The following example is intended to help you understand your ongoing costs (in dollars and cents) of investing in the Funds and to compare these costs with the ongoing costs of investing in other funds. The examples are based on an investment of $1,000 invested at the beginning of the period and held throughout the entire period (May 1, 2023 to October 31, 2023).
ACTUAL EXPENSES
The first line under the Funds in the table below provides information about actual account values and actual expenses. You may use the information in this line, together with the amount you invested, to estimate the expenses that you paid over the period. Simply divide your account value by $1,000 (for example, an $8,600 account value divided by $1,000 = 8.6), then multiply the result by the number in the first line for your Fund under the heading entitled “Expenses Paid During Period” to estimate the expenses you paid on your account during this period.
HYPOTHETICAL EXAMPLE FOR COMPARISON PURPOSES
The second line in the table provides information about hypothetical account values and hypothetical expenses based on each Fund’s actual expense ratio and an assumed rate of return of 5% per year before expenses, which is not the Funds’ actual return. The hypothetical account values and expenses may not be used to estimate the actual ending account balance or expenses you paid for the period. You may use this information to compare the ongoing costs of investing in the Funds and other funds. To do so, compare this 5% hypothetical example with the 5% hypothetical examples that appear in the shareholder reports of the other funds. Please note that the expenses shown in the table are meant to highlight your ongoing costs only and do not reflect any transactional costs, such as brokerage commissions paid on purchases and sales of Fund shares. Therefore, the second line in the table is useful in comparing ongoing Fund costs only and will not help you determine the relative total costs of owning different funds. In addition, if these transactional costs were included, your costs would have been higher.
| | Beginning
Account Value
5/1/23 | Ending
Account Value
10/31/23 | Annualized
Expense
Ratios | Expenses
Paid During
the Period(1) |
Teucrium Agricultural Strategy No K-1 ETF | | | | |
Actual | $ 1,000.00 | $ 1,003.00 | 0.89% | $ 4.48 |
Hypothetical (5% return before expenses) | $ 1,000.00 | $ 1,020.66 | 0.89% | $ 4.52 |
Teucrium AiLA Long-Short Agriculture Strategy ETF | | | | |
Actual | $ 1,000.00 | $ 1,044.80 | 1.49% | $ 7.66 |
Hypothetical (5% return before expenses) | $ 1,000.00 | $ 1,017.65 | 1.49% | $ 7.56 |
Teucrium AiLA Long-Short Base Metals Stategy ETF | | | | |
Actual | $ 1,000.00 | $ 989.50 | 1.49% | $ 7.45 |
Hypothetical (5% return before expenses) | $ 1,000.00 | $ 1,017.65 | 1.49% | $ 7.56 |
(1) | Expenses are calculated using the Funds’ annualized expense ratio, multiplied by the average account value during the period, multiplied by 184/366 days (to reflect the six-month period). |
2
Teucrium Agricultural Strategy No K-1 ETF
Consolidated Schedule of Investments
October 31, 2023 (Unaudited)
| | Shares | | | Value | |
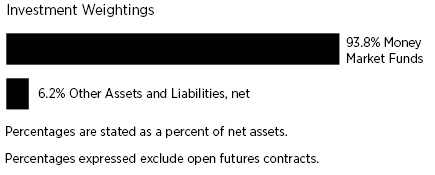
SHORT-TERM INVESTMENTS — 93.8% |
Deposit Accounts — 93.8% |
U.S. Bank Money Market Deposit Account, 5.27% (a) | | | 6,136,414 | | | $ | 6,136,414 | |
TOTAL SHORT-TERM INVESTMENTS (Cost $6,136,414) | | | | | | | 6,136,414 | |
| | | | | | | | | |
Total Investments (Cost $6,136,414) — 93.8% | | | | | | | 6,136,414 | |
Other assets and liabilities, net — 6.2% | | | | | | | 407,700 | |
TOTAL NET ASSETS — 100.0% | | | | | | $ | 6,544,114 | |
Percentages are stated as a percent of net assets.
(a) | The rate shown is the seven day yield as of October 31, 2023. |
The accompanying notes are an integral part of the consolidated financial statements.
3
Teucrium Agricultural Strategy No K-1 ETF
Consolidated Schedule of Open Futures Contracts
October 31, 2023 (Unaudited)
Description | | Number of
Contracts
Purchased | | | Settlement
Month | | | Notional
Value | | | Value and
Unrealized
Appreciation
(Depreciation) | |
Long Contracts | | | | | | | | | | | | | | | | |
Corn Futures (a) | 63 | December 2024 | | $ | 1,615,950 | | | $ | 4,263 | |
Soybean Futures (a) | 26 | November 2024 | | | 1,646,775 | | | | (25,162 | ) |
Sugar No. 11 Futures (a) | 60 | July 2024 | | | 1,654,464 | | | | 152,319 | |
Wheat Futures (a) | 52 | July 2024 | | | 1,610,050 | | | | (99,738 | ) |
| | | | | | | | | | | | | | | $ | 31,682 | |
(a) | All or a portion of this security is held by TILL Cayman. |
The accompanying notes are an integral part of the consolidated financial statements.
4
Teucrium AiLA Long-Short Agriculture Strategy ETF
Consolidated Schedule of Investments
October 31, 2023 (Unaudited)
| | Shares | | | Value | |
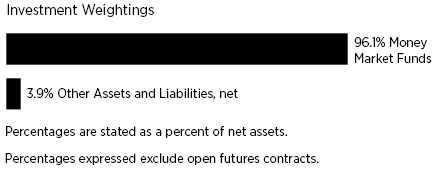
SHORT-TERM INVESTMENTS — 96.1% |
Deposit Accounts — 96.1% |
U.S. Bank Money Market Deposit Account — 5.27% (a) | | | 7,739,473 | | | $ | 7,739,473 | |
TOTAL SHORT-TERM INVESTMENTS (Cost $7,739,473) | | | | | | | 7,739,473 | |
| | | | | | | | | |
Total Investments (Cost $7,739,473) — 96.1% | | | | | | | 7,739,473 | |
Other assets and liabilities, net — 3.9% | | | | | | | 316,650 | |
TOTAL NET ASSETS — 100.0% | | | | | | $ | 8,056,123 | |
Percentages are stated as a percent of net assets.
(a) | The rate shown is the seven day yield as of October 31, 2023. |
The accompanying notes are an integral part of the consolidated financial statements.
5
Teucrium AiLA Long-Short Agriculture Strategy ETF
Consolidated Schedule of Open Futures Contracts
October 31, 2023 (Unaudited)
Description | | Number of
Contracts
Purchased | | | Settlement
Month | | | Notional
Value | | | Value and
Unrealized
Appreciation
(Depreciation) | |
Long Contracts | | | | | | | | | | | | | | | | |
Coffee Futures (a) | 3 | July 2024 | | $ | 186,693 | | | $ | 2,914 | |
Corn Futures (a) | 12 | December 2023 | | | 287,250 | | | | (5,340 | ) |
Corn Futures (a) | 12 | March 2024 | | | 295,800 | | | | (4,353 | ) |
Corn Futures (a) | 12 | May 2024 | | | 301,050 | | | | (3,990 | ) |
Corn Futures (a) | 12 | July 2024 | | | 305,100 | | | | (2,353 | ) |
Corn Futures (a) | 11 | September 2024 | | | 279,813 | | | | (1,625 | ) |
Cotton No. 2 Futures (a) | 8 | December 2023 | | | 324,880 | | | | (11,067 | ) |
Cotton No. 2 Futures (a) | 3 | July 2024 | | | 127,470 | | | | (5,455 | ) |
Soybean Oil Futures (a) | 4 | December 2023 | | | 123,408 | | | | (4,706 | ) |
Soybean Oil Futures (a) | 4 | January 2024 | | | 121,992 | | | | (6,019 | ) |
Soybean Oil Futures (a) | 4 | March 2024 | | | 121,104 | | | | (3,968 | ) |
Soybean Oil Futures (a) | 5 | May 2024 | | | 150,840 | | | | (2,651 | ) |
Soybean Oil Futures (a) | 5 | July 2024 | | | 150,510 | | | | (3,965 | ) |
Soybean Oil Futures (a) | 5 | August 2024 | | | 149,430 | | | | (3,383 | ) |
Soybean Oil Futures (a) | 5 | September 2024 | | | 148,350 | | | | (3,257 | ) |
Soybean Oil Futures (a) | 4 | October 2024 | | | 117,600 | | | | (2,077 | ) |
Wheat Futures (a) | 8 | December 2023 | | | 222,500 | | | | (8,214 | ) |
Wheat Futures (a) | 8 | March 2024 | | | 234,100 | | | | (9,614 | ) |
Wheat Futures (a) | 8 | May 2024 | | | 241,200 | | | | (8,352 | ) |
Wheat Futures (a) | 6 | July 2024 | | | 185,775 | | | | (6,045 | ) |
Wheat Futures (a) | 5 | September 2024 | | | 158,563 | | | | (4,792 | ) |
| | | | | | | | | | | | | | | | (98,312 | ) |
(a) | All or a portion of this security is held by OAIA Cayman. |
The accompanying notes are an integral part of the consolidated financial statements.
6
Teucrium AiLA Long-Short Base Metals Strategy ETF
Consolidated Schedule of Investments
October 31, 2023 (Unaudited)

| | Shares | | | Value | |
SHORT-TERM INVESTMENTS — 92.7% |
Depoist Accounts — 92.7% |
U.S. Bank Money Market Deposit Account — 5.27% (a) | | | 5,235,404 | | | $ | 5,235,404 | |
TOTAL SHORT-TERM INVESTMENTS (Cost $5,235,404) | | | | | | | 5,235,404 | |
| | | | | | | | | |
Total Investments (Cost $5,235,404) — 92.7% | | | | | | | 5,235,404 | |
Other assets and liabilities, net — 7.3% | | | | | | | 410,515 | |
TOTAL NET ASSETS — 100.0% | | | | | | $ | 5,645,919 | |
Percentages are stated as a percent of net assets.
(a) | The rate shown is the seven day yield as of October 31, 2023. |
The accompanying notes are an integral part of the consolidated financial statements.
7
Teucrium AiLA Long-Short Base Metals Strategy ETF
Consolidated Schedule of Open Futures Contracts
October 31, 2023 (Unaudited)
Description | | Number of
Contracts
Purchased (Sold) | | | Settlement
Month | | | Notional
Value | | | Value and
Unrealized
Appreciation
(Depreciation) | |
Long Contracts | | | | | | | | | | | | | | | | |
Copper Futures (a) | 28 | December 2023 | | $ | 2,554,300 | | | $ | 8,504 | |
Copper Futures (a) | 5 | July 2024 | | | 466,188 | | | | 4,111 | |
Copper Futures (a) | 3 | September 2024 | | | 280,800 | | | | 4,166 | |
LME Copper Futures (a)(b) | 123 | December 2023 | | | 24,856,763 | | | | (1,255,020 | ) |
LME Copper Futures (a)(b) | 101 | June 2024 | | | 20,708,156 | | | | (496,140 | ) |
LME Lead Futures (a)(b) | 166 | December 2023 | | | 8,657,938 | | | | (192,952 | ) |
LME Lead Futures (a)(b) | 81 | June 2024 | | | 4,249,969 | | | | (51,694 | ) |
LME Nickel Futures (a)(b) | 10 | November 2023 | | | 1,075,560 | | | | (43,166 | ) |
LME Nickel Futures (a)(b) | 23 | December 2023 | | | 2,486,070 | | | | (22,990 | ) |
LME Primary Aluminum Futures (a)(b) | 160 | December 2023 | | | 8,988,600 | | | | (86,561 | ) |
LME Primary Aluminum Futures (a)(b) | 87 | June 2024 | | | 5,011,744 | | | | 15,432 | |
LME Zinc Futures (a)(b) | 110 | December 2023 | | | 6,681,813 | | | | (242,679 | ) |
LME Zinc Futures (a)(b) | 89 | June 2024 | | | 5,447,913 | | | | (144,287 | ) |
| | | | | | | | | | | | | | | | (2,503,276 | ) |
Short Contracts | | | | | | | | | | | | | | | | |
LME Copper Futures (a)(b) | (123) | December 2023 | | | (24,856,763 | ) | | | 929,577 | |
LME Copper Futures (a)(b) | (101) | June 2024 | | | (20,708,156 | ) | | | 394,974 | |
LME Lead Futures (a)(b) | (166) | December 2023 | | | (8,657,938 | ) | | | 217,529 | |
LME Lead Futures (a)(b) | (76) | June 2024 | | | (3,987,625 | ) | | | 68,528 | |
LME Nickel Futures (a)(b) | (10) | November 2023 | | | (1,075,560 | ) | | | 31,891 | |
LME Nickel Futures (a)(b) | (6) | December 2023 | | | (648,540 | ) | | | 5,309 | |
LME Primary Aluminum Futures (a)(b) | (160) | December 2023 | | | (8,988,600 | ) | | | 89,116 | |
LME Primary Aluminum Futures (a)(b) | (87) | June 2024 | | | (5,011,744 | ) | | | (15,718 | ) |
LME Zinc Futures (a)(b) | (110) | December 2023 | | | (6,681,813 | ) | | | 205,180 | |
LME Zinc Futures (a)(b) | (89) | June 2024 | | | (5,447,913 | ) | | | 127,713 | |
| | | | | | | | | | | | | | | | 2,054,099 | |
| | | | | | | | | | | | | | | $ | (449,177 | ) |
LME - London Metal Exchange
(a) | All or a portion of this security is held by OAIB Cayman. |
(b) | LME futures contracts settle on their respective maturity date. The unrealized appreciation on these contracts is a receivable for unsettled open futures contracts and the unrealized depreciation is a payable for unsettled open futures contracts on the Fund’s consolidated statement of assets and liabilities. |
The accompanying notes are an integral part of the consolidated financial statements.
8
Teucrium ETFs
Consolidated Statements of Assets and Liabilities
October 31, 2023 (Unaudited)
| | | Teucrium
Agricultural
Strategy No
K-1 ETF | | | Teucrium
AiLA Long-
Short
Agriculture
Strategy ETF | | | Teucrium
AiLA Long-
Short Base
Metals
Strategy ETF | |
Assets | | | | | | | | | | | | |
Investments, at value (cost $6,136,414, $7,739,473, and $5,235,404, respectively) | | $ | 6,136,414 | | | $ | 7,739,473 | | | $ | 5,235,404 | |
Deposits at Broker for futures contracts | | | 387,492 | | | | 319,112 | | | | 1,121,200 | |
Interest receivable | | | 28,745 | | | | 37,758 | | | | 24,590 | |
Receivable for unsettled open futures contracts | | | — | | | | — | | | | 2,085,249 | |
Total assets | | | 6,552,651 | | | | 8,096,343 | | | | 8,466,443 | |
| | | | | | | | | | | | | |
Liabilities | | | | | | | | | | | | |
Payable to Adviser, net | | | 4,955 | | | | 10,815 | | | | 7,213 | |
Payable to Broker for futures contracts | | | — | | | | 1,733 | | | | 252,695 | |
Variation margin on futures contracts, net | | | 3,582 | | | | 27,672 | | | | 9,409 | |
Payable for unsettled open futures contracts | | | — | | | | — | | | | 2,551,207 | |
Total liabilities | | | 8,537 | | | | 40,220 | | | | 2,820,524 | |
Net Assets | | $ | 6,544,114 | | | $ | 8,056,123 | | | $ | 5,645,919 | |
| | | | | | | | | | | | | |
Net Assets Consists of: | | | | | | | | | | | | |
Paid-in capital | | $ | 6,385,975 | | | $ | 7,786,724 | | | $ | 5,688,530 | |
Total distributable earnings (accumulated losses) | | | 158,139 | | | | 269,399 | | | | (42,611 | ) |
Net Assets | | $ | 6,544,114 | | | $ | 8,056,123 | | | $ | 5,645,919 | |
| | | | | | | | | | | | | |
Shares of beneficial interest outstanding (unlimited number of shares authorized, no par value) | | | 187,500 | | | | 350,000 | | | | 225,000 | |
Net Asset Value, redemption price and offering price per share | | $ | 34.90 | | | $ | 23.02 | | | $ | 25.09 | |
The accompanying notes are an integral part of the consolidated financial statements.
9
Teucrium ETFs
Consolidated Statements of Operations
For the Six Months Ended October 31, 2023 (Unaudited)
| | | Teucrium
Agricultural
Strategy No
K-1 ETF | | | Teucrium
AiLA Long-
Short
Agriculture
Strategy ETF | | | Teucrium
AiLA Long-
Short Base
Metals
Strategy ETF | |
Investment Income | | | | | | | | | | | | |
Interest income | | $ | 454,915 | | | $ | 199,211 | | | $ | 148,696 | |
Total investment income | | | 454,915 | | | | 199,211 | | | | 148,696 | |
| | | | | | | | | | | | | |
Expenses | | | | | | | | | | | | |
Investment advisory fees | | | 148,639 | | | | 60,240 | | | | 47,058 | |
Less reimbursement by Adviser | | | (64,883 | ) | | | (2,033 | ) | | | (2,981 | ) |
Net expenses | | | 83,756 | | | | 58,207 | | | | 44,077 | |
Net investment income | | | 371,159 | | | | 141,004 | | | | 104,619 | |
| | | | | | | | | | | | | |
Realized and Unrealized Gain (Loss) on Open Futures Contracts | | | | | | | | | | | | |
Net realized gain (loss) on open futures contracts | | | (3,861,618 | ) | | | 11,724 | | | | 255,308 | |
Net change in unrealized appreciation (depreciation) on open futures contracts | | | 2,624,732 | | | | 66,591 | | | | (459,344 | ) |
Net realized and unrealized gain (loss) | | | (1,236,886 | ) | | | 78,315 | | | | (204,036 | ) |
Net increase (decrease) in net assets from operations | | $ | (865,727 | ) | | $ | 219,319 | | | $ | (99,417 | ) |
The accompanying notes are an integral part of the consolidated financial statements.
10
Teucrium Agricultural Strategy No K-1 ETF
Consolidated Statements of Changes in Net Assets
| | | Six Months
Ended
October 31,
2023
(Unaudited) | | | Period Ended
April 30,
2023(1) | |
From Operations | | | | | | | | |
Net investment income | | $ | 371,159 | | | $ | 1,589,004 | |
Net realized gain (loss) on open futures contracts | | | (3,861,618 | ) | | | 2,648,379 | |
Net change in unrealized appreciation/depreciation on open futures contracts | | | 2,624,732 | | | | (2,593,050 | ) |
Net increase (decrease) in net assets resulting from operations | | | (865,727 | ) | | | 1,644,333 | |
| | | | | | | | | |
From Distributions | | | | | | | | |
Distributable earnings | | | — | | | | (620,467 | ) |
Total distributions | | | — | | | | (620,467 | ) |
| | | | | | | | | |
From Capital Share Transactions | | | | | | | | |
Proceeds from shares sold | | | — | | | | 87,710,569 | |
Cost of shares redeemed | | | (78,707,976 | ) | | | (2,616,618 | ) |
Net increase (decrease) in net assets resulting from capital share transactions | | | (78,707,976 | ) | | | 85,093,951 | |
| | | | | | | | | |
Total Increase (Decrease) in Net Assets | | | (79,573,703 | ) | | | 86,117,817 | |
| | | | | | | | | |
Net Assets | | | | | | | | |
Beginning of period | | | 86,117,817 | | | | — | |
End of period | | $ | 6,544,114 | | | $ | 86,117,817 | |
| | | | | | | | | |
Changes in Shares Outstanding | | | | | | | | |
Shares outstanding, beginning of period | | | 2,475,000 | | | | — | |
Shares sold | | | — | | | | 2,550,000 | |
Shares redeemed | | | (2,287,500 | ) | | | (75,000 | ) |
Shares outstanding, end of period | | | 187,500 | | | | 2,475,000 | |
(1) | The Fund commenced operations on May 16, 2022. |
The accompanying notes are an integral part of the consolidated financial statements.
11
Teucrium AiLA Long-Short Agriculture Strategy ETF
Consolidated Statements of Changes in Net Assets
| | | Six Months
Ended
October 31,
2023
(Unaudited) | | | Period Ended
April 30,
2023(1) | |
From Operations | | | | | | | | |
Net investment income | | $ | 141,004 | | | $ | 50,615 | |
Net realized gain (loss) on open futures contracts | | | 11,724 | | | | (553,571 | ) |
Net change in unrealized appreciation/depreciation on open futures contracts | | | 66,591 | | | | (164,903 | ) |
Net increase (decrease) in net assets resulting from operations | | | 219,319 | | | | (667,859 | ) |
| | | | | | | | | |
From Capital Share Transactions | | | | | | | | |
Proceeds from shares sold | | | 1,805,378 | | | | 8,516,625 | |
Cost of shares redeemed | | | (577,825 | ) | | | (1,239,515 | ) |
Net increase in net assets resulting from capital share transactions | | | 1,227,553 | | | | 7,277,110 | |
| | | | | | | | | |
Total Increase in Net Assets | | | 1,446,872 | | | | 6,609,251 | |
| | | | | | | | | |
Net Assets | | | | | | | | |
Beginning of period | | | 6,609,251 | | | | — | |
End of period | | $ | 8,056,123 | | | $ | 6,609,251 | |
| | | | | | | | | |
Changes in Shares Outstanding | | | | | | | | |
Shares outstanding, beginning of period | | | 300,000 | | | | — | |
Shares sold | | | 75,000 | | | | 350,000 | |
Shares redeemed | | | (25,000 | ) | | | (50,000 | ) |
Shares outstanding, end of period | | | 350,000 | | | | 300,000 | |
(1) | The Fund commenced operations on December 19, 2022. |
The accompanying notes are an integral part of the consolidated financial statements.
12
Teucrium AiLA Long-Short Base Metals Strategy ETF
Consolidated Statements of Changes in Net Assets
| | | Six Months
Ended
October 31,
2023
(Unaudited) | | | Period Ended
April 30,
2023(1) | |
From Operations | | | | | | | | |
Net investment income | | $ | 104,619 | | | $ | 9,618 | |
Net realized gain on open futures contracts | | | 255,308 | | | | 37,021 | |
Net change in unrealized appreciation/depreciation on open futures contracts | | | (459,344 | ) | | | 10,167 | |
Net increase (decrease) in net assets resulting from operations | | | (99,417 | ) | | | 56,806 | |
| | | | | | | | | |
From Capital Share Transactions | | | | | | | | |
Proceeds from shares sold | | | 1,915,950 | | | | 5,015,860 | |
Cost of shares redeemed | | | (1,243,280 | ) | | | — | |
Net increase in net assets resulting from capital share transactions | | | 672,670 | | | | 5,015,860 | |
| | | | | | | | | |
Total Increase in Net Assets | | | 573,253 | | | | 5,072,666 | |
| | | | | | | | | |
Net Assets | | | | | | | | |
Beginning of period | | | 5,072,666 | | | | — | |
End of period | | $ | 5,645,919 | | | $ | 5,072,666 | |
| | | | | | | | | |
Changes in Shares Outstanding | | | | | | | | |
Shares outstanding, beginning of period | | | 200,000 | | | | — | |
Shares sold | | | 75,000 | | | | 200,000 | |
Shares redeemed | | | (50,000 | ) | | | — | |
Shares outstanding, end of period | | | 225,000 | | | | 200,000 | |
(1) | The Fund commenced operations on April 4, 2023. |
The accompanying notes are an integral part of the consolidated financial statements.
13
Teucrium Agricultural Strategy No K-1 ETF
Consolidated Financial Highlights
For a Share Outstanding Throughout Each Period
| | | Six Months
Ended
October 31,
2023
(Unaudited) | | | Period Ended
April 30,
2023(1) | |
Net Asset Value, Beginning of Period | | $ | 34.80 | | | $ | 40.00 | |
| | | | | | | | | |
Income (Loss) from investment operations: | | | | | | | | |
Net investment income(2) | | | 0.68 | | | | 0.85 | |
Net realized and unrealized loss | | | (0.58 | ) | | | (5.79 | )(7) |
Total from investment operations | | | 0.10 | | | | (4.94 | ) |
| | | | | | | | | |
Less distributions paid: | | | | | | | | |
From net investment income | | | — | | | | (0.26 | ) |
Total distributions paid | | | — | | | | (0.26 | ) |
| | | | | | | | | |
Net Asset Value, End of Period | | $ | 34.90 | | | $ | 34.80 | |
| | | | | | | | | |
Total return, at NAV(3)(5) | | | 0.30 | % | | | -12.37 | % |
Total return, at Market(4)(5) | | | 0.33 | % | | | -12.40 | % |
| | | | | | | | | |
Supplemental Data and Ratios: | | | | | | | | |
Net assets, end of period (000’s) | | $ | 6,544 | | | $ | 86,118 | |
| | | | | | | | | |
Ratio of expenses to average net assets before waivers(6)(8) | | | 1.58 | % | | | 1.58 | % |
Ratio of expenses to average net assets after waivers(6)(8) | | | 0.89 | % | | | 0.94 | % |
Ratio of net investment income to average net assets after waivers(6)(8) | | | 3.94 | % | | | 2.56 | % |
Portfolio turnover rate (5) | | | 0 | % | | | 0 | % |
(1) | The Fund commenced operations on May 16, 2022. |
(2) | Per share net investment income was calculated using average shares outstanding. |
(3) | Net asset value total return is calculated assuming an initial investment made at the net asset value at the beginning of the period, reinvestment of all dividends and distributions at net asset value on ex-date during the period, if any, and redemption on the last day of the period at net asset value. This percentage is not an indication of the performance of a shareholder’s investment in the Fund based on market value due to the differences between the market price of the shares and the net asset value per share of the Fund. |
(4) | Market value total return is calculated assuming an initial investment made at market value at the beginning of the period, reinvestment of all dividends and distributions at market value on pay date during the period, if any, and redemption on the last day of the period at market value. Market value is determined by the composite closing price. Composite closing security price is defined as the last reported sale price on the NYSE Arca. The composite closing price is the last reported sale, regardless of volume, and not an average price, and may have occurred on a date prior to the close of the reporting period. Market value may be greater or less than net asset value, depending on the Fund’s closing price on the NYSE Arca. |
(5) | Not annualized for periods less than one year. |
(6) | Annualized for periods less than one year. |
(7) | Realized and unrealized gains and losses per share in this caption are balancing amounts necessary to reconcile the change in net asset value per share for the period, and may not reconcile with the aggregate gains and losses in the Consolidated Statements of Operations due to share transactions for the period. |
(8) | Expense waived or reimbursed reflect reductions to total expenses, as discussed in the notes to the financial statements. These amounts would increase the net investment loss ratio or decrease the net investment income ratio, as applicable, had such reductions not occurred. |
The accompanying notes are an integral part of the consolidated financial statements.
14
Teucrium AiLA Long-Short Agriculture Strategy ETF
Consolidated Financial Highlights
For a Share Outstanding Throughout Each Period
| | | Six Months
Ended
October 31,
2023
(Unaudited) | | | Period Ended
April 30,
2023(1) | |
Net Asset Value, Beginning of Period | | $ | 22.03 | | | $ | 25.00 | |
| | | | | | | | | |
Income (Loss) from investment operations: | | | | | | | | |
Net investment income(2) | | | 0.42 | | | | 0.25 | |
Net realized and unrealized gain (loss) | | | 0.57 | | | | (3.22 | ) |
Total from investment operations | | | 0.99 | | | | (2.97 | ) |
| | | | | | | | | |
Net Asset Value, End of Period | | $ | 23.02 | | | $ | 22.03 | |
| | | | | | | | | |
Total return, at NAV(3)(5) | | | 4.48 | % | | | -11.88 | % |
Total return, at Market(4)(5) | | | 4.64 | % | | | -11.98 | % |
| | | | | | | | | |
Supplemental Data and Ratios: | | | | | | | | |
Net assets, end of period (000’s) | | $ | 8,056 | | | $ | 6,609 | |
| | | | | | | | | |
Ratio of expenses to average net assets before waivers(6)(7) | | | 1.54 | % | | | 1.55 | % |
Ratio of expenses to average net assets after waivers(6)(7) | | | 1.49 | % | | | 1.49 | % |
Ratio of net investment income (loss) to average net assets after waivers(6)(7) | | | 3.61 | % | | | 2.83 | % |
Portfolio turnover rate (5) | | | 0 | % | | | 0 | % |
(1) | The Fund commenced operations on December 19, 2022. |
(2) | Per share net investment income was calculated using average shares outstanding. |
(3) | Net asset value total return is calculated assuming an initial investment made at the net asset value at the beginning of the period, reinvestment of all dividends and distributions at net asset value on ex-date during the period, if any, and redemption on the last day of the period at net asset value. This percentage is not an indication of the performance of a shareholder’s investment in the Fund based on market value due to the differences between the market price of the shares and the net asset value per share of the Fund. |
(4) | Market value total return is calculated assuming an initial investment made at market value at the beginning of the period, reinvestment of all dividends and distributions at market value on pay date during the period, if any, and redemption on the last day of the period at market value. Market value is determined by the composite closing price. Composite closing security price is defined as the last reported sale price on the NYSE Arca. The composite closing price is the last reported sale, regardless of volume, and not an average price, and may have occurred on a date prior to the close of the reporting period. Market value may be greater or less than net asset value, depending on the Fund’s closing price on the NYSE Arca. |
(5) | Not annualized for periods less than one year. |
(6) | Annualized for periods less than one year. |
(7) | Expense waived or reimbursed reflect reductions to total expenses, as discussed in the notes to the financial statements. These amounts would increase the net investment loss ratio or decrease the net investment income ratio, as applicable, had such reductions not occurred. |
The accompanying notes are an integral part of the consolidated financial statements.
15
Teucrium AiLA Long-Short Base Metals Strategy ETF
Consolidated Financial Highlights
For a Share Outstanding Throughout Each Period
| | | Six Months
Ended
October 31,
2023
(Unaudited) | | | Period Ended
April 30,
2023(1) | |
Net Asset Value, Beginning of Period | | $ | 25.36 | | | $ | 25.00 | |
| | | | | | | | | |
Income (Loss) from investment operations: | | | | | | | | |
Net investment income(2) | | | 0.45 | | | | 0.06 | |
Net realized and unrealized gain (loss) | | | (0.72 | ) | | | 0.30 | |
Total from investment operations | | | (0.27 | ) | | | 0.36 | |
| | | | | | | | | |
Net Asset Value, End of Period | | $ | 25.09 | | | $ | 25.36 | |
| | | | | | | | | |
Total return, at NAV(3)(5) | | | -1.05 | % | | | 1.45 | % |
Total return, at Market(4)(5) | | | -1.09 | % | | | 1.50 | % |
| | | | | | | | | |
Supplemental Data and Ratios: | | | | | | | | |
Net assets, end of period (000’s) | | $ | 5,646 | | | $ | 5,073 | |
| | | | | | | | | |
Ratio of expenses to average net assets before waivers(6)(7) | | | 1.59 | % | | | 1.55 | % |
Ratio of expenses to average net assets after waivers(6)(7) | | | 1.49 | % | | | 1.49 | % |
Ratio of net investment income (loss) to average net assets after waivers(6)(7) | | | 3.54 | % | | | 3.31 | % |
Portfolio turnover rate (5) | | | 0 | % | | | 0 | % |
(1) | The Fund commenced operations on April 4, 2023. |
(2) | Per share net investment income was calculated using average shares outstanding. |
(3) | Net asset value total return is calculated assuming an initial investment made at the net asset value at the beginning of the period, reinvestment of all dividends and distributions at net asset value on ex-date during the period, if any, and redemption on the last day of the period at net asset value. This percentage is not an indication of the performance of a shareholder’s investment in the Fund based on market value due to the differences between the market price of the shares and the net asset value per share of the Fund. |
(4) | Market value total return is calculated assuming an initial investment made at market value at the beginning of the period, reinvestment of all dividends and distributions at market value on pay date during the period, if any, and redemption on the last day of the period at market value. Market value is determined by the composite closing price. Composite closing security price is defined as the last reported sale price on the NYSE Arca. The composite closing price is the last reported sale, regardless of volume, and not an average price, and may have occurred on a date prior to the close of the reporting period. Market value may be greater or less than net asset value, depending on the Fund’s closing price on the NYSE Arca. |
(5) | Not annualized for periods less than one year. |
(6) | Annualized for periods less than one year. |
(7) | Expense waived or reimbursed reflect reductions to total expenses, as discussed in the notes to the financial statements. These amounts would increase the net investment loss ratio or decrease the net investment income ratio, as applicable, had such reductions not occurred. |
The accompanying notes are an integral part of the consolidated financial statements.
16
Teucrium ETFs
Notes to Consolidated Financial Statements
October 31, 2023 (Unaudited)
��
The Teucrium ETFs are a non-diversified series of Listed Funds Trust (the “Trust”), formerly Active Weighting Funds ETF Trust. The Trust was organized as a Delaware statutory trust on August 26, 2016, under a Declaration of Trust amended on December 21, 2018 and is registered with the U.S. Securities and Exchange Commission (the “SEC”) as an open-end management investment company under the Investment Company Act of 1940, as amended (the “1940 Act”).
Fund Name | Ticker | Commencement of Operations |
Teucrium Agricultural Strategy No K-1 ETF (“TILL ETF”) | TILL | May 16, 2022 |
Teucrium AiLA Long-Short Agriculture Strategy ETF (“OAIA ETF”) | OAIA | December 19, 2022 |
Teucrium AiLA Long-Short Base Metals Strategy ETF (“OAIB ETF”) | OAIB | April 4, 2023 |
TILL ETF is an actively-managed exchange-traded fund (“ETF”) that seeks to achieve capital appreciation by investing primarily in agricultural commodities futures contracts traded on the Chicago Board of Trade (“CBOT”) or Intercontinental Exchange Inc. (“ICE”).
OAIA ETF is a passively managed ETF that seeks to track the total return performance, before fees and expenses, of the AiLA-S033 Market Neutral Absolute Return Index, and is designed to track the performance of a portfolio of agricultural commodities futures contracts designed to provide absolute returns through the implementation of a long/short trading strategy used to seek to achieve market neutral exposure to the global agriculture market.
OAIB ETF is a passively managed ETF that seeks to track the total return performance, before fees and expenses, of the AiLA-S022 Market Neutral Absolute Return Index, and is designed to track the performance of a portfolio of base metals commodities futures contracts designed to provide absolute returns through the implementation of a long/short trading strategy used to seek to achieve market neutral exposure to the global metals market.
2. | SIGNIFICANT ACCOUNTING POLICIES |
Each Fund is an investment company and accordingly follows the investment company accounting and reporting guidance of the Financial Accounting Standards Board (“FASB”) Accounting Standards Codification (“ASC”) Topic 946, Financial Services — Investment Companies. Each Fund prepares its financial statements in accordance with accounting principles generally accepted in the United States of America (“U.S. GAAP”) and follows the significant accounting policies described below.
Consolidation of Subsidiary
The Funds expect to gain exposure to commodities futures by each investing in a Cayman subsidiary, a wholly-owned subsidiary of each Fund organized under the laws of the Cayman Islands (each a “Subsidiary”, together the “Subsidiaries”). Teucrium Investment Advisors, LLC (the “Adviser”), the Funds’ Investment Adviser, also serves as the investment adviser to each Subsidiary. Each Fund’s investment in a Subsidiary is intended to provide the Funds with indirect exposure to commodities futures within the limits of current federal income tax laws applicable to investment companies such as the Funds, which limit the ability of investment companies to invest directly in commodities futures. Each Subsidiary has the same investment objective as each Fund, but may invest in commodities futures to a greater extent than the Funds. Except as otherwise noted, references to each Fund’s investments include each Fund’s indirect investments through the Subsidiary. Because the Funds intend to elect to be treated as a regulated investment companies under the Internal Revenue Code of 1986, as amended, the size of each Fund’s investment in the Subsidiary generally will be limited to 25% of the Fund’s total assets, tested at the end of each fiscal quarter. Information regarding each Fund and its Subsidiary has been consolidated in the Consolidated Schedules of Investments, Consolidated Schedules of Open Futures Contracts, Consolidated Statements of Assets and Liabilities, Consolidated Statements of Operations, Consolidated Statements of Changes in Net Assets and Consolidated Financial Highlights.
17
Teucrium ETFs
Notes to Consolidated Financial Statements
October 31, 2023 (Unaudited) (Continued)
All inter-company accounts and transactions have been eliminated. As of the end of the reporting period, the net assets of the Subsidiaries were as follows:
Fund | Subsidiary | | Net Assets of
Subsidiary | | | Net Assets of the
Subsidiary as a
Percentage of
Fund’s Net Assets | |
Teucrium Agricultural Strategy No K-1 ETF | TILL Cayman | | $ | 388,372 | | | | 5.93 | % |
Teucrium AiLA Long-Short Agriculture Strategy ETF | OAIA Cayman | | $ | 319,578 | | | | 3.97 | % |
Teucrium AiLA Long-Short Base Metals Strategy ETF | OAIB Cayman | | $ | 655,618 | | | | 11.61 | % |
Use of Estimates
The preparation of the financial statements in conformity with U.S. GAAP requires management to make estimates and assumptions that affect the reported amounts of assets and liabilities and disclosures of contingent assets and liabilities at the date of the financial statements and the reported amounts of increases and decreases in net assets from operations during the reporting period. Actual results could differ from these estimates.
Share Transactions
The net asset value (“NAV”) per share of the Funds is equal to each Fund’s total assets minus each Fund’s total liabilities divided by the total number of shares outstanding. The NAV that is published will be rounded to the nearest cent. The NAV is determined as of the close of trading (generally, 4:00 p.m. Eastern Time) on each day the New York Stock Exchange (“NYSE”) is open for trading.
Fair Value Measurement
In calculating the NAV, the Funds’ exchange-traded equity securities will be valued at fair value, which will generally be determined using the last reported official closing or last trading price on the exchange or market on which the security is primarily traded at the time of valuation. Such valuations are typically categorized as Level 1 in the fair value hierarchy described below.
Securities listed on the NASDAQ Stock Market, Inc. are generally valued at the NASDAQ official closing price.
If market quotations are not readily available, or if it is determined that a quotation of a security does not represent fair value, then the security is valued at fair value as determined in good faith by the Adviser using procedures adopted by the Board of Trustees of the Trust (the “Board”). The valuation of each Fund’s investments is performed in accordance with the principles found in Rule 2a-5 of the 1940 Act. The Board has designated the Adviser as the valuation designee of the Funds. The circumstances in which a security may be fair valued include, among others: the occurrence of events that are significant to a particular issuer, such as mergers, restructurings or defaults; the occurrence of events that are significant to an entire market, such as natural disasters in a particular region or government actions; trading restrictions on securities; thinly traded securities; and market events such as trading halts and early market closings. Due to the inherent uncertainty of valuations, fair values may differ significantly from the values that would have been used had an active market existed. Fair valuation could result in a different NAV than a NAV determined by using market quotations. Such valuations are typically categorized as Level 2 or Level 3 in the fair value hierarchy described below.
Money market deposit accounts are valued at NAV. If NAV is not readily available the securities will be valued at fair value.
An amortized cost method of valuation may be used with respect to debt obligations with sixty days or less remaining to maturity, unless the Adviser determines in good faith that such method does not represent fair value.
Futures contracts will be valued at the settlement price. If there is no current market price available, then the securities will be valued at fair value.
18
Teucrium ETFs
Notes to Consolidated Financial Statements
October 31, 2023 (Unaudited) (Continued)
FASB ASC Topic 820, Fair Value Measurements and Disclosures (“ASC 820”) defines fair value, establishes a framework for measuring fair value in accordance with U.S. GAAP, and requires disclosure about fair value measurements. It also provides guidance on determining when there has been a significant decrease in the volume and level of activity for an asset or liability, when a transaction is not orderly, and how that information must be incorporated into fair value measurements. Under ASC 820, various inputs are used in determining the value of the Funds’ investments. These inputs are summarized in the following hierarchy:
| | ● | Level 1 — Unadjusted quoted prices in active markets for identical assets or liabilities that the Funds have the ability to access. |
| | ● | Level 2 — Observable inputs other than quoted prices included in Level 1 that are observable for the asset or liability, either directly or indirectly. These inputs may include quoted prices for the identical instrument on an inactive market, prices for similar securities, interest rates, prepayment speeds, credit risk, yield curves, default rates and similar data. |
| | ● | Level 3 — Unobservable inputs for the asset or liability, to the extent relevant observable inputs are not available; representing the Funds’ own assumptions about the assumptions a market participant would use in valuing the asset or liability and would be based on the best information available. |
The fair value hierarchy gives the highest priority to quoted prices (unadjusted) in active markets for identical assets or liabilities (Level 1) and the lowest priority to unobservable inputs (Level 3).
The availability of observable inputs can vary from security to security and is affected by a wide variety of factors, including, for example, the type of security, whether the security is new and not yet established in the marketplace, the liquidity of markets, and other characteristics particular to the security. To the extent that valuation is based on models or inputs that are less observable or unobservable in the market, the determination of fair value requires more judgment. Accordingly, the degree of judgment exercised in determining fair value is greatest for instruments categorized in Level 3.
All other securities and investments for which market values are not readily available, including restricted securities, and those securities for which it is inappropriate to determine prices in accordance with the aforementioned procedures, are valued at fair value as determined in good faith under procedures adopted by the Board. Factors considered in making this determination may include, but are not limited to, information obtained by contacting the issuer, analysts, or the appropriate stock exchange (for exchange-traded securities), analysis of the issuer’s financial statements or other available documents and, if necessary, available information concerning other securities in similar circumstances.
The inputs or methodology used for valuing securities are not necessarily an indication of the risk associated with investing in those securities. The hierarchy classification of inputs used to value the Funds’ investments at October 31, 2023, are as follows:
Teucrium Agricultural Strategy No K-1 ETF | | Level 1 | | | Level 2 | | | Level 3 | | | Total | |
Investments - Assets: | | | | | | | | | | | | | | | | |
Deposit Accounts | | $ | 6,136,414 | | | $ | — | | | $ | — | | | $ | 6,136,414 | |
Total Investments - Assets | | $ | 6,136,414 | | | $ | — | | | $ | — | | | $ | 6,136,414 | |
| | | | | | | | | | | | | | | | | |
Other Financial Instruments* | | | | | | | | | | | | | | | | |
Open Long Futures Contracts | | $ | 31,682 | | | $ | — | | | $ | — | | | $ | 31,682 | |
Teucrium AiLA Long-Short Agriculture Strategy ETF | | Level 1 | | | Level 2 | | | Level 3 | | | Total | |
Investments - Assets: | | | | | | | | | | | | | | | | |
Deposit Accounts | | $ | 7,739,473 | | | $ | — | | | $ | — | | | $ | 7,739,473 | |
Total Investments - Assets | | $ | 7,739,473 | | | $ | — | | | $ | — | | | $ | 7,739,473 | |
| | | | | | | | | | | | | | | | | |
Other Financial Instruments* | | | | | | | | | | | | | | | | |
Open Futures Contracts | | $ | (98,312 | ) | | $ | — | | | $ | — | | | $ | (98,312 | ) |
19
Teucrium ETFs
Notes to Consolidated Financial Statements
October 31, 2023 (Unaudited) (Continued)
Teucrium AiLA Long-Short Base Metals Strategy ETF | | Level 1 | | | Level 2 | | | Level 3 | | | Total | |
Investments - Assets: | | | | | | | | | | | | | | | | |
Deposit Accounts | | $ | 5,235,404 | | | $ | — | | | $ | — | | | $ | 5,235,404 | |
Total Investments - Assets | | $ | 5,235,404 | | | $ | — | | | $ | — | | | $ | 5,235,404 | |
| | | | | | | | | | | | | | | | | |
Other Financial Instruments* | | | | | | | | | | | | | | | | |
Open Long Futures Contracts | | $ | (2,503,276 | ) | | $ | — | | | $ | — | | | $ | (2,503,276 | ) |
Open Short Futures Contracts | | | 2,054,099 | | | | — | | | | — | | | | 2,054,099 | |
Open Futures Contracts | | $ | (449,177 | ) | | $ | — | | | $ | — | | | $ | (449,177 | ) |
* | Other financial instruments are derivative instruments not reflected in the Consolidated Schedules of Investments, such as open futures contracts. Open futures contracts are reflected as the unrealized appreciation (depreciation) on the instrument. |
Security Transactions
Investment transactions are recorded as of the date that the securities are purchased or sold (trade date). Realized gains and losses from the sale or disposition of securities are calculated based on the specific identification basis.
Investment Income
Interest income is accrued daily.
Tax Information, Dividends and Distributions to Shareholders and Uncertain Tax Positions
The Funds are treated as separate entities for Federal income tax purposes. Each Fund intends to qualify as a regulated investment company (“RIC”) under Subchapter M of the Internal Revenue Code of 1986, as amended (the “Internal Revenue Code”). To qualify and remain eligible for the special tax treatment accorded to RICs, the Funds must meet certain annual income and quarterly asset diversification requirements and must distribute annually at least 90% of the sum of (i) its investment company taxable income (which includes dividends, interest and net short-term capital gains) and (ii) certain net tax-exempt income, if any. If so qualified, the Funds will not be subject to Federal income tax.
Distributions to shareholders are recorded on the ex-dividend date. The Funds generally pay out dividends from net investment income, if any, annually, and distribute their net capital gains, if any, to shareholders at least annually. The Funds may also pay a special distribution at the end of the calendar year to comply with Federal tax requirements. The amount of dividends and distributions from net investment income and net realized capital gains are determined in accordance with Federal income tax regulations, which may differ from U.S. GAAP. These “book/tax” differences are either considered temporary or permanent in nature. To the extent these differences are permanent in nature, such amounts are reclassified within the components of net assets based on their Federal tax basis treatment; temporary differences do not require reclassification. Dividends and distributions which exceed earnings and profit for tax purposes are reported as a tax return of capital.
Management evaluates the Funds’ tax positions to determine if the tax positions taken meet the minimum recognition threshold in connection with accounting for uncertainties in income tax positions taken or expected to be taken for the purposes of measuring and recognizing tax liabilities in the financial statements. Recognition of tax benefits of an uncertain tax position is required only when the position is “more likely than not” to be sustained assuming examination by taxing authorities. Interest and penalties related to income taxes would be recorded as income tax expense. The Funds’ Federal income tax returns are subject to examination by the Internal Revenue Service (the “IRS”) for a period of three fiscal years after they are filed. State and local tax returns may be subject to examination for an additional fiscal year depending on the jurisdiction. As of April 30, 2023, the Funds’ most recent fiscal period end, the Funds had no material uncertain tax positions and did not have a liability for any unrecognized tax benefits. As of April 30, 2023, the Funds’ most recent fiscal period end, the Funds had no examination in progress and management is not aware of any tax positions for which it is reasonably possible that the amounts of unrecognized tax benefits will significantly change in the next twelve months.
20
Teucrium ETFs
Notes to Consolidated Financial Statements
October 31, 2023 (Unaudited) (Continued)
The Funds recognized no interest or penalties related to uncertain tax benefits in the most recent period. At April 30, 2023, the Funds’ most recent period end, the tax periods from commencement of operations remained open to examination in the Funds’ major tax jurisdiction.
Indemnification
In the normal course of business, the Funds expect to enter into contracts that contain a variety of representations and warranties and which provide general indemnifications. The Funds’ maximum exposure under these anticipated arrangements is unknown, as this would involve future claims that may be made against the Funds that have not yet occurred. However, based on experience, the Funds expect the risk of loss to be remote.
Futures
The Funds will invest indirectly, via each Fund’s Subsidiary, in commodity futures, which are standardized futures contracts on commodities. When a fund purchases a futures contract, it agrees to purchase a specified underlying instrument at a specified future date. When a fund sells a futures contract, it agrees to sell the underlying instrument at a specified future date. The price at which the purchase and sale will take place is fixed when a fund enters into the contract. Futures can be held until their delivery dates or can be closed out before then if a liquid secondary market is available. During the period that the commodity futures contracts are open, changes in the value of the contracts are recognized as unrealized gains or losses by recalculating the value of the contracts on a daily basis. Subsequent or variation margin payments are received or made on non-London Metal Exchange commodity futures contracts depending upon whether unrealized gains or losses are incurred. For London Metal Exchange (“LME”) contracts, subsequent or variation margin payments are not made and the value of the contracts is presented as net unrealized appreciation (depreciation) on the Consolidated Statements of Operations. When LME or non-LME contracts are closed or expire, the Fund recognizes a realized gain or loss equal to the difference between the proceeds from, or cost of, the closing transaction and the Fund’s basis in the contract. Realized gains (losses) and changes in unrealized appreciation (depreciation) on open positions are determined on a specific identification basis and recognized in the Consolidated Statements of Operations.
TILL ETF’s holdings consist of four commodities futures holdings, one in each of the following commodities: corn, wheat, soybeans, and sugar. The portfolio will be rebalanced, generally on a monthly basis, in order to maintain approximately a 25% allocation of the Fund’s assets to each commodity.
OAIA ETF’s holdings may consist of the following commodities futures contracts: corn, soybeans, soybean meal, soybean oil, wheat, arabica coffee, cotton, NY cocoa and #11 sugar.
OAIB ETF may trade aluminum, copper, lead and zinc commodity futures contracts on either the Chicago Mercantile Exchange (“CME”) or London Metal Exchange (“LME”) and nickel and tin, each of which is traded on LME. For settlement of futures contracts traded on the LME, cash is not transferred until the settled futures contracts expire.
The average monthly notional amount of futures contracts during the period ended October 31, 2023 was:
| | | Long Commodity
Risk Futures
Contracts | | | Short Commodity
Risk Futures
Contracts | |
Teucrium Agricultural Strategy No K-1 ETF | | $ | 14,503,283 | | | $ | — | |
Teucrium AiLA Long-Short Agriculture Strategy ETF | | | 2,864,615 | | | | (841,627 | ) |
Teucrium AiLA Long-Short Base Metals Strategy ETF | | | 52,337,631 | | | | (51,948,927 | ) |
21
Teucrium ETFs
Notes to Consolidated Financial Statements
October 31, 2023 (Unaudited) (Continued)
The following is a summary of the effect of derivative instruments on the Funds’ Consolidated Statements of Assets and Liabilities as of October 31, 2023:
| | Location on Consolidated
Statements of Assets & Liabilities | | Asset Derivatives | | | Liability
Derivatives | |
Teucrium Agricultural Strategy No K-1 ETF |
Commodity Risk Futures Contracts | Variation margin on futures contracts, net | | $ | — | | | $ | 3,582 | |
Teucrium AiLA Long-Short Agriculture Strategy ETF |
Commodity Risk Futures Contracts | Variation margin on futures contracts, net | | | — | | | | 27,672 | |
Teucrium AiLA Long-Short Base Metals Strategy ETF |
Commodity Risk Futures Contracts | Receivable/(Payable) for unsettled open futures contracts | | | 2,085,249 | | | | 2,551,207 | |
Commodity Risk Futures Contracts | Variation margin on futures contracts, net | | | — | | | | 9,409 | |
The following is a summary of the effect of derivative instruments on the Funds’ Consolidated Statements of Operations for the period ended October 31, 2023:
| | | | Net Realized
Gain (Loss) | | | Change in
Unrealized
Appreciation/
(Depreciation) | |
Teucrium Agricultural Strategy No K-1 ETF | Commodity Risk Futures contracts | | $ | (3,861,618 | ) | | $ | 2,624,732 | |
Teucrium AiLA Long-Short Agriculture Strategy ETF | Commodity Risk Futures contracts | | | 11,724 | | | | 66,591 | |
Teucrium AiLA Long-Short Base Metals Strategy ETF | Commodity Risk Futures contracts | | | 255,308 | | | | (459,344 | ) |
The risks of using futures contracts in the Funds include: the risk that the counterparty to a derivative contract may fail to comply with its obligations to the Funds; the risk that there may not be a liquid secondary market for the derivative at a time when the Funds would look to disengage the position; the risk that additional capital from the Funds may be called upon to fulfill the conditions of the derivative contract; the risk that the use of derivatives in the Funds may induce leverage in the Funds, and the risk that the cost of the derivative contracts may reduce the overall returns experienced by the Funds.
22
Teucrium ETFs
Notes to Consolidated Financial Statements
October 31, 2023 (Unaudited) (Continued)
The following tables present the Funds’ gross Commodity Risk Futures contracts by counterparty, net of amounts available for offset under a master netting agreement, or similar arrangement, and the related collateral received or pledged by the Funds as of October 31, 2023:
Teucrium Agricultural Strategy No K-1 ETF
| | | | | | | | | | | | | | | | Gross Amounts not offset in
the Consolidated Statements
of Assets & Liabilities | | | | | |
Counterparty | Investment Type | | Gross
Amounts of
Recognized
Assets | | | Gross
Amounts
Offset in the
Consolidated
Statements
of Assets and
Liabilities | | | Net Amounts
Presented
in the
Consolidated
Statements
of Assets &
Liabilities | | | Financial
Instruments | | | Collateral
Received | | | Net Amount | |
StoneX Financial, Inc. | Commodity Risk Futures Contracts | | $ | 17,868 | | | $ | (17,868 | ) | | $ | — | | | $ | — | | | $ | — | | | $ | — | |
Total Financial Instruments Subject to a Master Netting Arrangement or Similar Arrangement | | | $ | 17,868 | | | $ | (17,868 | ) | | $ | — | | | $ | — | | | $ | — | | | $ | — | |
| | | | | | | | | | | | | | | | Gross Amounts not offset in
the Consolidated Statements
of Assets & Liabilities | | | | | |
Counterparty | Investment Type | | Gross
Amounts of
Recognized
Liabilities | | | Gross
Amounts
Offset in the
Consolidated
Statements
of Assets and
Liabilities | | | Net Amounts
Presented
in the
Consolidated
Statements
of Assets &
Liabilities | | | Financial
Instruments | | | Collateral
Pledged | | | Net Amount | |
StoneX Financial, Inc. | Commodity Risk Futures Contracts | | $ | 21,450 | | | $ | (17,868 | ) | | $ | 3,582 | | | $ | — | | | $ | (3,582 | ) | | $ | ��� | |
Total Financial Instruments Subject to a Master Netting Arrangement or Similar Arrangement | | | $ | 21,450 | | | $ | (17,868 | ) | | $ | 3,582 | | | $ | — | | | $ | (3,582 | ) | | $ | — | |
23
Teucrium ETFs
Notes to Consolidated Financial Statements
October 31, 2023 (Unaudited) (Continued)
Teucrium AiLA Long-Short Agriculture Strategy ETF
| | | | | | | | | | | | | | | | Gross Amounts not offset in
the Consolidated Statements
of Assets & Liabilities | | | | | |
Counterparty | Investment Type | | Gross
Amounts of
Recognized
Assets | | | Gross
Amounts
Offset in the
Consolidated
Statements
of Assets and
Liabilities | | | Net Amounts
Presented
in the
Consolidated
Statements
of Assets &
Liabilities | | | Financial
Instruments | | | Collateral
Received | | | Net Amount | |
StoneX Financial, Inc. | Commodity Risk Futures Contracts | | $ | 9,300 | | | $ | (9,300 | ) | | $ | — | | | $ | — | | | $ | — | | | $ | — | |
Total Financial Instruments Subject to a Master Netting Arrangement or Similar Arrangement | | | $ | 9,300 | | | $ | (9,300 | ) | | $ | — | | | $ | — | | | $ | — | | | $ | — | |
| | | | | | | | | | | | | | | | Gross Amounts not offset in
the Consolidated Statements
of Assets & Liabilities | | | | | |
Counterparty | Investment Type | | Gross
Amounts of
Recognized
Liabilities | | | Gross
Amounts
Offset in the
Statement of
Assets and
Liabilities | | | Net Amounts | | | Financial
Instruments | | | Collateral
Pledged | | | Net Amount | |
StoneX Financial, Inc. | Commodity Risk Futures Contracts | | $ | 36,972 | | | $ | (9,300 | ) | | $ | 27,672 | | | $ | — | | | $ | (27,672 | ) | | $ | — | |
Total Financial Instruments Subject to a Master Netting Arrangement or Similar Arrangement | | | $ | 36,972 | | | $ | (9,300 | ) | | $ | 27,672 | | | $ | — | | | $ | (27,672 | ) | | $ | — | |
24
Teucrium ETFs
Notes to Consolidated Financial Statements
October 31, 2023 (Unaudited) (Continued)
Teucrium AiLA Long-Short Base Metals Strategy ETF
| | | | | | | | | | | | | | | | Gross Amounts not offset in
the Consolidated Statements
of Assets & Liabilities | | | | | |
Counterparty | Investment Type | | Gross
Amounts of
Recognized
Assets | | | Gross
Amounts
Offset in the
Consolidated
Statements
of Assets and
Liabilities | | | Net Amounts
Presented
in the
Consolidated
Statements
of Assets &
Liabilities | | | Financial
Instruments | | | Collateral
Received | | | Net Amount | |
StoneX Financial, Inc. | Commodity Risk Futures Contracts | | $ | 2,085,249 | | | $ | — | | | $ | 2,085,249 | | | $ | (2,085,249 | ) | | $ | — | | | $ | — | |
Total Financial Instruments Subject to a Master Netting Arrangement or Similar Arrangement | | | $ | 2,085,249 | | | $ | — | | | $ | 2,085,249 | | | $ | (2,085,249 | ) | | $ | — | | | $ | — | |
| | | | | | | | | | | | | | | | Gross Amounts not offset in
the Consolidated Statements
of Assets & Liabilities | | | | | |
Counterparty | Investment Type | | Gross
Amounts of
Recognized
Liabilities | | | Gross
Amounts
Offset in the
Consolidated
Statements
of Assets and
Liabilities | | | Net Amounts
Presented
in the
Consolidated
Statements
of Assets &
Liabilities | | | Financial
Instruments | | | Collateral
Pledged | | | Net Amount | |
StoneX Financial, Inc. | Commodity Risk Futures Contracts | | $ | 2,560,616 | | | $ | — | | | $ | 2,560,616 | | | $ | (2,085,249 | ) | | $ | (475,367 | ) | | $ | — | |
Total Financial Instruments Subject to a Master Netting Arrangement or Similar Arrangement | | | $ | 2,560,616 | | | $ | — | | | $ | 2,560,616 | | | $ | (2,085,249 | ) | | $ | (475,367 | ) | | $ | — | |
3. | INVESTMENT ADVISORY AND OTHER AGREEMENTS |
Investment Advisory Agreement
The Trust has entered into Investment Advisory Agreements (the “Advisory Agreement”) with the Adviser. Under the Advisory Agreement, the Adviser provides a continuous investment program for the Funds’ assets in accordance with their investment objectives, policies and limitations, and oversees the day-to-day operations of the Funds subject to the supervision of the Board, including the Trustees who are not “interested persons” of the Trust as defined in the 1940 Act.
Pursuant to the Advisory Agreement between the Trust, on behalf of the Funds and Subsidiaries, and the Adviser, each Fund and Subsidiary pays a unified management fee to the Adviser, which is calculated daily and paid monthly, at an annual rate of 1.49% of each Fund’s and Subsidiary’s average daily net assets. The Adviser has agreed to pay all expenses of the Funds and Subsidiaries except the fee paid to the Adviser under the Advisory Agreement, interest charges on any borrowings, dividends and other expenses on securities sold short, taxes, brokerage commissions and other expenses incurred in placing orders for the purchase and sale of securities and other investment instruments, acquired fund fees and expenses, accrued deferred tax liability, extraordinary expenses, and distribution (12b-1) fees and expenses (if any).
25
Teucrium ETFs
Notes to Consolidated Financial Statements
October 31, 2023 (Unaudited) (Continued)
Fee Waiver Agreement
The Adviser contractually agreed to waive the unitary management fee it receives from the Funds in an amount equal to the management fee of 1.49% paid by each Subsidiary. The waiver will remain in effect for a period of one year from the effective date of each Fund’s prospectus, and therefore from year to year for successive one-year periods unless terminated sooner. Pursuant to the Fee Waiver Agreement, waived fees are not subject to recoupment by the Adviser.
The Adviser contractually agreed to waive 0.60% of its management fees of the Teucrium Agricultural Strategy No K-1 ETF. The waiver will remain in effect from year to year for successive one-year periods unless terminated sooner. Pursuant to the Fee Waiver Agreement, waived fees are not subject to recoupment by the Adviser.
The Adviser waived the following amounts during the period ended October 31, 2023:
Teucrium Agricultural Strategy No K-1 ETF | | $ | 64,883 | |
Teucrium AiLA Long-Short Agriculture Strategy ETF | | | 2,033 | |
Teucrium AiLA Long-Short Base Metals Strategy ETF | | | 2,981 | |
Distribution Agreement and 12b-1 Plan
Foreside Fund Services, LLC, a wholly-owned subsidiary of Foreside Financial Group, LLC (dba ACA Group) (the “Distributor”), serves as each Fund’s distributor pursuant to an ETF Distribution Agreement. The Distributor receives compensation for the statutory underwriting services it provides to the Funds. The Distributor enters into agreements with certain broker-dealers and others that will allow those parties to be “Authorized Participants” and to subscribe for and redeem shares of the Funds. The Distributor will not distribute shares in less than whole Creation Units and does not maintain a secondary market in shares.
The Board has adopted a 12b-1 Distribution and Service Plan pursuant to Rule 12b-1 under the 1940 Act (“Rule 12b-1 Plan”). In accordance with the Rule 12b-1 Plan, each Fund is authorized to pay an amount up to 0.25% of each Fund’s average daily net assets each year for certain distribution-related activities. As authorized by the Board, no Rule 12b-1 fees are currently paid by the Funds and there are no plans to impose these fees. However, in the event Rule 12b-1 fees are charged in the future, they will be paid out of each Fund’s assets. The Adviser and its affiliates may, out of their own resources, pay amounts to third parties for distribution or marketing services on behalf of the Funds.
Administrator, Custodian and Transfer Agent
U.S. Bancorp Fund Services, LLC, doing business as U.S. Bank Global Fund Services (“Fund Services” or “Administrator”) serves as administrator, transfer agent and fund accountant of the Funds pursuant to a Fund Servicing Agreement. U.S. Bank N.A. (the “Custodian”), an affiliate of Fund Services, serves as the Funds’ custodian pursuant to a Custody Agreement. Under the terms of these agreements, the Adviser pays the Funds’ administrative, custody and transfer agency fees.
A Trustee and all officers of the Trust are affiliated with the Administrator and the Custodian.
4. | CREATION AND REDEMPTION TRANSACTIONS |
Shares of the Funds are listed and traded on the NYSE Arca, Inc. (the “Exchange”). Each Fund issues and redeems shares on a continuous basis at NAV only in large blocks of shares called “Creation Units.” Creation Units are to be issued and redeemed principally in kind for a basket of securities and a balancing cash amount. Shares generally will trade in the secondary market in amounts less than a Creation Unit at market prices that change throughout the day. Market prices for the shares may be different from their NAV. The NAV is determined as of the close of trading (generally, 4:00 p.m. Eastern Time) on each day the New York Stock Exchange (“NYSE”) is open for trading. The NAV of the shares of each Fund will be equal to a Fund’s total assets minus a Fund’s total liabilities divided by the total number of shares outstanding. The NAV that is published will be rounded to the nearest cent; however, for purposes of determining the price of Creation Units, the NAV will be calculated to four decimal places.
26
Teucrium ETFs
Notes to Consolidated Financial Statements
October 31, 2023 (Unaudited) (Continued)
Creation Unit Transaction Fee
Authorized Participants may be required to pay to the Custodian a fixed transaction fee (the “Creation Transaction Fee”) in connection with the issuance or redemption of Creation Units. The standard Creation Transaction Fee will be the same regardless of the number of Creation Units purchased by an investor on the applicable business day. The Creation Transaction Fee charged by each Fund for each creation order is $300.
An additional variable fee of up to a maximum of 2% of the value of the Creation Units subject to the transaction may be imposed for (1) creations effected outside the Clearing Process and (2) creations made in an all-cash amount (to offset the Trust’s brokerage and other transaction costs associated with using cash to purchase the requisite Deposit Securities). Investors are responsible for the costs of transferring the securities constituting the Deposit Securities to the account of the Trust. Each Fund may determine to not charge a variable fee on certain orders when the Adviser has determined that doing so is in the best interests of Fund shareholders. Variable fees, if any, received by the Funds are displayed in the Capital Share Transactions section on the Consolidated Statements of Changes in Net Assets.
Only “Authorized Participants” may purchase or redeem shares directly from the Funds. An Authorized Participant is either (i) a broker-dealer or other participant in the clearing process through the Continuous Net Settlement System of National Securities Clearing Corporation or (ii) a DTC participant and, in each case, must have executed a Participant Agreement with the Distributor. Most retail investors will not qualify as Authorized Participants or have the resources to buy and sell whole Creation Units. Therefore, they will be unable to purchase or redeem the shares directly from the Funds. Rather, most retail investors will purchase shares in the secondary market with the assistance of a broker and will be subject to customary brokerage commissions or fees. Securities received or delivered in connection with in-kind creates and redeems are valued as of the close of business on the effective date of the creation or redemption.
A Creation Unit will generally not be issued until the transfer of good title of the deposit securities to the Funds and the payment of any cash amounts have been completed. To the extent contemplated by the applicable participant agreement, Creation Units of the Funds will be issued to such authorized participant notwithstanding the fact that the Funds’ deposits have not been received in part or in whole, in reliance on the undertaking of the authorized participant to deliver the missing deposit securities as soon as possible. If the Funds or their agents do not receive all of the deposit securities, or the required cash amounts, by such time, then the order may be deemed rejected and the authorized participant shall be liable to the Funds for losses, if any.
5. FEDERAL INCOME TAX
The tax character of distributions paid for the periods ended October 31, 2023 and April 30, 2023, were as follows:
| | | Period Ended October 31, 2023 | | | Period Ended April 30, 2023 | |
| | | Ordinary
Income(1) | | | Long-Term
Capital Gain | | | Ordinary
Income(1) | | | Long-Term
Capital Gain | |
Teucrium Agricultural Strategy No K-1 ETF | | $ | — | | | $ | — | | | $ | 620,467 | | | $ | — | |
Teucrium AiLA Long-Short Agriculture Strategy ETF | | | — | | | | — | | | | — | | | | — | |
Teucrium AiLA Long-Short Base Metals Strategy ETF | | | — | | | | — | | | | — | | | | — | |
(1) | Ordinary income includes short-term capital gains. |
27
Teucrium ETFs
Notes to Consolidated Financial Statements
October 31, 2023 (Unaudited) (Continued)
At April 30, 2023, the Funds’ most recent fiscal period end, the components of distributable earnings (accumulated losses) and cost of investments on a tax basis, including the adjustments for financial reporting purposes as of the most recently completed Federal income tax reporting year, were as follows:
| | | Teucrium
Agricultural
Strategy No
K-1 ETF | | | Teucrium AiLA
Long-Short
Agriculture
Strategy ETF | | | Teucrium AiLA
Long-Short
Base Metals
Strategy ETF | |
Federal Tax Cost of Investments | | $ | 80,441,326 | | | $ | 6,228,930 | | | $ | 4,818,349 | |
Undistributed Ordinary Income | | | 1,023,866 | | | | 50,080 | | | | 46,639 | |
Other Accumulated Gain (Loss) | | | — | | | | — | | | | 10,167 | |
Total Distributable Earnings / (Accumulated Losses) | | $ | 1,023,866 | | | $ | 50,080 | | | $ | 56,806 | |
Under current tax law, net capital losses realized and specified ordinary losses after October 31st may be deferred and treated as occurring on the first day of the following fiscal year. The Funds’ carryforward losses and post-October losses are determined only at the end of each fiscal year. At April 30, 2023, the Funds’ most recent period end, the Funds had no carryforward losses to be carried forward indefinitely to offset future realized capital gains. The Funds did not defer any later year losses or post-October losses for the most recent fiscal period ended April 30, 2023.
6. | INVESTMENT TRANSACTIONS |
During the period ended October 31, 2023, there were no realized gains and losses from in-kind redemptions.
During the period ended October 31, 2023, there were no long-term purchases and sales of investments, creations in-kind or redemptions in-kind.
As with all ETFs, shareholders of the Funds are subject to the risk that their investment could lose money. The Funds are subject to the principal risks, any of which may adversely affect a Fund’s NAV, trading price, yield, total return and ability to meet its investment objective.
The price and availability of agricultural commodities is influenced by economic and industry conditions, including but not limited to supply and demand factors such as: crop disease; weed control; water availability; various planting, growing, or harvesting problems; severe weather conditions such as drought, floods, heavy rains, frost, or natural disasters that are difficult to anticipate and that cannot be controlled. The U.S. prices of certain agricultural commodities such as soybeans and sugar are subject to risks relating to the growth of such commodities in foreign countries, such as: uncontrolled fires (including arson); challenges in doing business with foreign companies; legal and regulatory restrictions; transportation costs; interruptions in energy supply; currency exchange rate fluctuations; and political and economic instability. Additionally, demand for agricultural commodities is affected by changes in consumer tastes, national, regional and local economic conditions, and demographic trends. Agricultural commodity production is subject to United States and foreign policies and regulations that materially affect operations. Governmental policies affecting the agricultural industry, such as taxes, tariffs, duties, subsidies, incentives, acreage control, and import and export restrictions on agricultural commodities and commodity products, can influence the planting of certain crops, the location and size of crop production, the volume and types of imports and exports, and industry profitability. Additionally, commodity production is affected by laws and regulations relating to, but not limited to, the sourcing, transporting, storing and processing of agricultural raw materials as well as the transporting, storing and distributing of related agricultural products. Agricultural commodity producers also may need to comply with various environmental laws and regulations, such as those regulating the use of certain pesticides, and local laws that regulate the production of genetically modified crops. In addition, international trade disputes can adversely affect agricultural commodity trade flows by limiting or disrupting trade between countries or regions. Seasonal fluctuations in the price of agricultural commodities may cause risk to an investor because of the possibility that Fund Share prices will be depressed because of the relevant harvest cycles. In the futures market, fluctuations are typically reflected in contracts expiring in the harvest season (i.e., in the case of corn and soybeans, contracts
28
Teucrium ETFs
Notes to Consolidated Financial Statements
October 31, 2023 (Unaudited) (Continued)
expiring during the fall are typically priced lower than contracts expiring in the winter and spring, while in the case of wheat and sugar, contracts expiring during the spring and early summer are typically priced lowest). Thus, seasonal fluctuations could result in an investor incurring losses upon the sale of Fund Shares, particularly if the investor needs to sell Fund Shares when a Component Futures Contract is, in whole or part, expiring in the harvest season for the specified commodity.
A complete description of principal risks is included in the prospectus under the heading “Principal Investment Risks’’.
8. | OTHER REGULATORY MATTERS |
In October 2022, the Securities and Exchange Commission (the “SEC”) adopted a final rule relating to Tailored Shareholder Reports for Mutual Funds and Exchange-Traded Funds; Fee Information in Investment Company Advertisements. The rule and form amendments will, among other things, require the Funds to transmit concise and visually engaging shareholder reports that highlight key information. The amendments will require that funds tag information in a structured data format and that certain more in-depth information be made available online and available for delivery free of charge to investors on request. The amendments became effective January 24, 2023. There is an 18-month transition period after the effective date of the amendment.
On December 19, 2023, the Funds declared a distribution to shareholders of record on December 21, 2023 , as follows:
| | | Ordinary
Income Rate | | | Ordinary Income
Distribution Paid | |
Teucrium Agricultural Strategy No K-1 ETF | | $ | 11.37 | | | $ | 1,421,046 | |
Teucrium AiLA Long-Short Agriculture Strategy ETF | | | 0.85 | | | | 233,581 | |
Teucrium AiLA Long-Short Base Metals Strategy ETF | | | 1.17 | | | | 176,237 | |
Other than as disclosed, there were no other subsequent events requiring recognition or disclosure through the date the financial statements were issued.
29
Teucrium ETFs
Supplemental Information
(Unaudited)
Investors should consider the investment objective and policies, risk considerations, charges and ongoing expenses of an investment carefully before investing. The prospectus contains this and other information relevant to an investment in the Funds. Please read the prospectus carefully before investing. A copy of the prospectus for each Fund may be obtained without charge by writing to the Funds, c/o U.S. Bank Global Fund Services, P.O. Box 701, Milwaukee, Wisconsin 53201-0701 or by calling 1-800-617-0004, or by visiting the Funds’ website at https://teucrium.com/etfs.
QUARTERLY PORTFOLIO HOLDING INFORMATION
Each Fund files its complete schedule of portfolio holdings for its first and third fiscal quarters with the Securities and Exchange Commission (“SEC”) on Part F of Form N-PORT. The Funds’ Part F of Form N-PORT is available without charge, upon request, by calling toll-free at 1-800-617-0004. Furthermore, you may obtain the Part F of Form N-PORT on the SEC’s website at www.sec.gov.
PROXY VOTING INFORMATION
Each Fund is required to file a Form N-PX, with the Funds’ complete proxy voting record for the 12 months ended June 30, no later than August 31 of each year. Information regarding how the Funds voted proxies relating to portfolio securities during the most recent 12-mond period ended June 30 is available without charge, upon request, by calling toll-free 1-800-617-0004, and on the SEC’s website at www.sec.gov.
FREQUENCY DISTRIBUTION OF PREMIUMS AND DISCOUNTS
Information regarding how often shares of the Funds trade on an exchange at a price above (i.e., at a premium) or below (i.e., at a discount) the NAV of the Funds is available without charge, on the Funds’ website at https://teucrium.com/etfs.
30
THIS PAGE INTENTIONALLY LEFT BLANK
THIS PAGE INTENTIONALLY LEFT BLANK
THIS PAGE INTENTIONALLY LEFT BLANK
Investment Adviser:
Teucrium Investment Advisors, LLC
Three Main Street, Suite 215
Burlington, VT 05401
Legal Counsel:
Morgan, Lewis & Bockius LLP
1111 Pennsylvania Avenue, N.W.
Washington, D.C. 20004
Independent Registered Public Accounting Firm:
Cohen & Company, Ltd.
1350 Euclid Avenue, Suite 800
Cleveland, OH 44115
Distributor:
Foreside Fund Services, LLC
Three Canal Plaza, Suite 100
Portland, ME 04101
Administrator, Fund Accountant & Transfer Agent:
U.S. Bancorp Fund Services, LLC
d/b/a U.S. Bank Global Fund Services
615 E. Michigan St.
Milwaukee, WI 53202
Custodian:
U.S. Bank N.A.
1555 North RiverCenter Drive, Suite 302
Milwaukee, WI 53212
This information must be preceded or accompanied by a current prospectus for the Funds.
Item 2. Code of Ethics.
Not applicable for semi-annual reports.
Item 3. Audit Committee Financial Expert.
Not applicable for semi-annual reports.
Item 4. Principal Accountant Fees and Services.
Not applicable for semi-annual reports.
Item 5. Audit Committee of Listed Registrants.
(a) Not applicable for semi-annual reports.
(b) Not applicable.
Item 6. Investments.
| (a) | Schedule of Investments is included as part of the report to shareholders filed under Item 1 of this Form. |
Item 7. Disclosure of Proxy Voting Policies and Procedures for Closed-End Management Investment Companies.
Not applicable to open-end investment companies.
Item 8. Portfolio Managers of Closed-End Management Investment Companies.
Not applicable to open-end investment companies.
Item 9. Purchases of Equity Securities by Closed-End Management Investment Company and Affiliated Purchasers.
Not applicable to open-end investment companies.
Item 10. Submission of Matters to a Vote of Security Holders.
There have been no material changes to the procedures by which shareholders may recommend nominees to the registrant’s Board of Trustees.
Item 11. Controls and Procedures.
| (a) | The Registrant’s President and Treasurer have reviewed the Registrant’s disclosure controls and procedures (as defined in Rule 30a-3(c) under the Investment Company Act of 1940 (the “Act”)) as of a date within 90 days of the filing of this report, as required by Rule 30a-3(b) under the Act and Rules 13a-15(b) or 15d 15(b) under the Securities Exchange Act of 1934. Based on their review, such officers have concluded that the disclosure controls and procedures are effective in ensuring that information required to be disclosed in this report is appropriately recorded, processed, summarized and reported and made known to them by others within the Registrant and by the Registrant’s service provider. |
| (b) | There were no changes in the Registrant’s internal control over financial reporting (as defined in Rule 30a-3(d) under the Act) that occurred during the period covered by this report that have materially affected, or are reasonably likely to materially affect, the Registrant’s internal control over financial reporting. |
Item 12. Disclosure of Securities Lending Activities for Closed-End Management Investment Companies
Not applicable to open-end investment companies.
Item 13. Exhibits.
| (a) | (1) Any code of ethics or amendment thereto, that is the subject of the disclosure required by Item 2, to the extent that the registrant intends to satisfy Item 2 requirements through filing an exhibit. Not Applicable. |
(2) A separate certification for each principal executive officer and principal financial officer pursuant to Section 302 of the Sarbanes-Oxley Act of 2002. Filed herewith.
(3) Any written solicitation to purchase securities under Rule 23c-1 under the Act sent or given during the period covered by the report by or on behalf of the registrant to 10 or more persons. Not applicable to open-end investment companies.
| (4) | Change in the registrant’s independent public accountant. There was no change in the registrant’s independent public accountant for the period covered by this report. |
SIGNATURES
Pursuant to the requirements of the Securities Exchange Act of 1934 and the Investment Company Act of 1940, the registrant has duly caused this report to be signed on its behalf by the undersigned, thereunto duly authorized.
| (Registrant) | Listed Funds Trust | |
| | | |
| By (Signature and Title)* | /s/ Gregory C. Bakken | |
| | Gregory C. Bakken, President/Principal Executive Officer | |
| | | |
| Date | 1/3/2024 | |
Pursuant to the requirements of the Securities Exchange Act of 1934 and the Investment Company Act of 1940, this report has been signed below by the following persons on behalf of the registrant and in the capacities and on the dates indicated.
| By (Signature and Title)* | /s/ Gregory C. Bakken | |
| | Gregory C. Bakken, President/Principal Executive Officer | |
| | | |
| Date | 1/3/2024 | |
| | | |
| By (Signature and Title)* | /s/ Travis G. Babich | |
| | Travis G. Babich, Treasurer/Principal Financial Officer | |
| | | |
| Date | 1/3/2024 | |
| * | | Print the name and title of each signing officer under his or her signature. |