UNITED STATES
SECURITIES AND EXCHANGE COMMISSION
Washington, D.C. 20549
FORM N-CSR
CERTIFIED SHAREHOLDER REPORT OF REGISTERED
MANAGEMENT INVESTMENT COMPANIES
Investment Company Act file number (811-23226)
Listed Funds Trust
(Exact name of registrant as specified in charter)
615 East Michigan Street
Milwaukee, WI 53202
(Address of principal executive offices) (Zip code)
Gregory C. Bakken, President
Listed Funds Trust
c/o U.S. Bancorp Fund Services, LLC
777 East Wisconsin Avenue, 6th Floor
Milwaukee, WI 53202
(Name and address of agent for service)
(414) 516-3097
Registrant's telephone number, including area code
Date of fiscal year end: December 31
Date of reporting period: December 31, 2023
Item 1. Reports to Stockholders.
(a)

TrueShares Structured Outcome ETFs
TrueShares Structured Outcome (July) ETF (JULZ)
TrueShares Structured Outcome (August) ETF (AUGZ)
TrueShares Structured Outcome (September) ETF (SEPZ)
TrueShares Structured Outcome (October) ETF (OCTZ)
TrueShares Structured Outcome (November) ETF (NOVZ)
TrueShares Structured Outcome (December) ETF (DECZ)
TrueShares Structured Outcome (January) ETF (JANZ)
TrueShares Structured Outcome (February) ETF (FEBZ)
TrueShares Structured Outcome (March) ETF (MARZ)
TrueShares Structured Outcome (April) ETF (APRZ)
TrueShares Structured Outcome (May) ETF (MAYZ)
TrueShares Structured Outcome (June) ETF (JUNZ)
ANNUAL REPORT
December 31, 2023
This report is submitted for the general information of shareholders of the Funds. It is not authorized for distribution unless preceded or accompanied by a current prospectus for the Funds.
TrueShares Structured Outcome ETFs
Table of Contents
Shareholder Letter (Unaudited) | 2 |
Shareholder Expense Example (Unaudited) | 4 |
Performance Overviews (Unaudited) | 6 |
Schedules of Investments and Written Options | 11 |
Statements of Assets and Liabilities | 24 |
Statements of Operations | 27 |
Statements of Changes in Net Assets | 30 |
Financial Highlights | 36 |
Notes to Financial Statements | 42 |
Report of Independent Registered Public Accounting Firm | 58 |
Board of Trustees and Officers (Unaudited) | 60 |
Supplemental Information (Unaudited) | 62 |
Privacy Policy (Unaudited) | 63 |
1
TrueShares Structured Outcome ETFs
Shareholder Letter
December 31, 2023 (Unaudited)
Dear Shareholder,
Calendar year 2023 provided a very different tale than the previous year. The S&P 500 performance reversed 2022 losses, while interest rates, albeit volatile, remained roughly the same as the speed of the Federal Reserve rate hikes waned. The other component, often a biproduct of strong equity performance, was the dissipating volatility in the equity markets. The VIX Index began the year at 22.90 and closed the year at 12.45. This sharp reduction in the “fear index” indicated investors were in a comfortable position as equities were once again approaching all-time highs. Also notable, was the headline of the entire rally, or the “Magnificent 7’s” spectacular contribution to the S&P 500 performance, given their large market capitalizations and their combined impact on a market capitalization weighted index such as the S&P 500. This is an important headline but should not be surprising.
This year, the TrueShares Structured Outcome monthly series began celebrating its 3-year anniversary. More importantly, it delivered the upside participation in the bull market of 2023, as opposed to the buffer that investors tend to covet during years like 2022. TrueShares Structured Outcome ETFs continue to attract investors, with the July ETF and Sept ETF Series being awarded a 5-Star Rating by the industry rating agency Morningstar.
Performance Comparison:
The following table details the total returns for calendar year 2023 for the Funds and the Funds’ volatility against the S&P 500 Price Index for the same period:
FUND | INCEPTION1 | FUND TOTAL | FUND TOTAL | S&P 500 | FUND | S&P 500 | ||||||||||||||||||
JULZ | 6/30/2020 | 17.65 | % | 17.81 | % | 24.23 | % | 8.99 | % | 13.08 | % | |||||||||||||
AUGZ | 7/31/2020 | 17.33 | % | 17.25 | % | 24.23 | % | 8.57 | % | 13.08 | % | |||||||||||||
SEPZ | 8/31/2020 | 17.94 | % | 17.72 | % | 24.23 | % | 9.07 | % | 13.08 | % | |||||||||||||
OCTZ | 9/30/2020 | 18.18 | % | 18.23 | % | 24.23 | % | 9.89 | % | 13.08 | % | |||||||||||||
NOVZ | 10/30/2020 | 18.07 | % | 18.21 | % | 24.23 | % | 9.86 | % | 13.08 | % | |||||||||||||
DECZ | 11/30/2020 | 18.32 | % | 17.97 | % | 24.23 | % | 9.50 | % | 13.08 | % | |||||||||||||
JANZ | 12/31/2020 | 19.10 | % | 18.91 | % | 24.23 | % | 10.06 | % | 13.08 | % | |||||||||||||
FEBZ | 1/29/2021 | 20.66 | % | 20.64 | % | 24.23 | % | 9.68 | % | 13.08 | % | |||||||||||||
MARZ | 2/26/2021 | 20.23 | % | 20.45 | % | 24.23 | % | 8.62 | % | 13.08 | % | |||||||||||||
APRZ | 3/31/2021 | 22.23 | % | 22.28 | % | 24.23 | % | 9.46 | % | 13.08 | % | |||||||||||||
MAYZ | 4/30/2021 | 15.90 | % | 15.87 | % | 24.23 | % | 8.06 | % | 13.08 | % | |||||||||||||
JUNZ | 5/28/2021 | 17.29 | % | 17.02 | % | 24.23 | % | 8.43 | % | 13.08 | % | |||||||||||||
(1) | Inception date may not agree to commencement date. |
By design, the TrueShares structured outcome series seeks to deliver a more “predictable” return given the performance of the S&P 500 Index over a one-year period from its “initialization date” (first trading day of each series) by buffering the first 10% of losses. The protection is generated while looking to participate as much as possible, given market conditions, in the market upside over a one-year period.
All ETF series delivered a return and volatility within an expected range under the market conditions experienced. The use of derivatives, implicit in the structures, delivered within our expected ranges as implied volatility levels changed throughout the course of 2023. All of the series are positively correlated to the S&P 500 Index performance over the period, as we would expect in the majority of market conditions. Hence, the direction of the S&P 500 Index will have the largest impact on the performance of the series.
2
TrueShares Structured Outcome ETFs
Shareholder Letter
December 31, 2023 (Unaudited) (Continued)
The second largest contributing factor has been the level of volatility and, more specifically, the relationship between the Implied Volatility in the put options the strategy has sold, and the call options the strategy has purchased. This factor and relationship will dictate the participation ratio which subsequently determines the “upside capture” of the series. The actual volatility profile of each series is lower than the benchmark (S&P 500 Index) This is intentional and expected in the majority of environments as the structure is designed to deliver this feature and 2023 once again exemplified this dynamic. The design of the structures delivered performance in line with our expectations. As the TrueShares’ subadvisor we continue to have confidence in the structural design of the strategy and its ability to deliver a consistent “Structured Outcome” while striving to simultaneously deliver superior risk-adjusted returns as compared with other like funds or ETFs.
Broadly speaking, the series will lag the S&P 500 Index performance in an up market, as our “participation ratio” will be less than 1.0; however, but on a risk-adjusted basis, the structure has outperformed over those time frames. The series as a whole performed fairly consistently throughout 2023 and maintained an acceptable participation ratio throughout. There were not any significant factors that have unexpectedly contributed positively or negatively to the performance realized during 2023. We have a keen focus on managing flows as the funds continually grow and adhering to a consistent tracking error through time in order to deliver upon the “structured outcome” philosophy that TrueShares has brought to market.
On behalf of SpiderRock Advisors, thank you for your trust and confidence,
Sincerely,
Eric Metz
President & Chief Investment Officer
Investment Sub-adviser
SpiderRock Advisors, LLC
Additional Information:
Performance data quoted represents past performance and does not guarantee future results. Investment return and principal value of an investment will fluctuate so that an investor’s shares, when redeemed or sold in the secondary market, may be worth more or less than the original cost. Investors will incur usual and customary brokerage commissions when buying or selling shares of the exchange-traded funds (“ETFs”) in the secondary market, and that, if reflected, the brokerage commissions would reduce the performance returns. Current performance may be lower or higher than the performance shown. Shares are bought and sold at market price not net asset value (“NAV”) and are not individually redeemable from the fund. Call 877-774-TRUE (8783) for performance data current to the most recent month end.
Index performance does not represent TrueShares fund performance. It is not possible to invest directly in an index. All performance figures assume reinvestment of dividend and capital gains at net asset value; actual returns may differ. Performance 7-year and less are cumulative; performance over 7-year are average annualized total returns. Market price performance is determined using the bid/ask midpoint at 4:00pm Eastern time, when the NAV is typically calculated. NAV price performance is determined using the daily calculated NAV. They do not represent the returns you would receive if you traded shares at other times. Performance figures do not reflect the deduction of taxes that a shareholder would pay on Fund distributions or upon redemption or sale of fund shares.
The TrueShares Structured Outcome ETF Series utilizes a “buffer protect” options strategy, that seeks to provide investors with returns (before fees and expenses) that track those of the S&P 500 Index while seeking to provide an 8-12% downside buffer (with the advisor targeting 70%) on the first of that index’s losses over a 72-month investment period.**
** | In the event an investor purchases Shares after the date on which the options were entered into or sells Shares prior to the expiration of the options, the buffer that the Fund seeks to provide may not be available and there may be limited to no upside potential. The Fund does not provide principal protection and an investor may experience significant losses on its investment, including the loss of its entire investment. |
The S&P 500 Index is a widely recognized capitalization-weighted index that measures the performance of the large-capitalization sector of the U.S. stock market. The S&P 500 Price Index does not include reinvestment of dividends.
3
TrueShares Structured Outcome ETFs
Shareholder Expense Example
(Unaudited)
As a shareholder of a fund you incur two types of costs: (1) transaction costs, including brokerage commissions on purchases and sales of fund shares; and (2) ongoing costs, including management fees and other fund expenses. The following example is intended to help you understand your ongoing costs (in dollars and cents) of investing in the Funds and to compare these costs with the ongoing costs of investing in other funds. The examples are based on an investment of $1,000 invested at the beginning of the period and held throughout the entire period (July 1, 2023 to December 31, 2023).
ACTUAL EXPENSES
The following table provides information about actual account values and actual expenses. You may use the information in this line, together with the amount you invested, to estimate the expenses that you paid over the period. Simply divide your account value by $1,000 (for example, an $8,600 account value divided by $1,000 = 8.6), then multiply the result by the number in the applicable line under the heading entitled “Expenses Paid During Period” to estimate the expenses you paid on your account during this period.
Beginning | Ending | Annualized | Expenses | |
TrueShares Structured Outcome (July) ETF | $ 1,000.00 | $ 1,059.90 | 0.79% | $4.10 |
TrueShares Structured Outcome (August) ETF | 1,000.00 | 1,060.40 | 0.79 | 4.10 |
TrueShares Structured Outcome (September) ETF | 1,000.00 | 1,059.20 | 0.79 | 4.10 |
TrueShares Structured Outcome (October) ETF | 1,000.00 | 1,054.20 | 0.79 | 4.09 |
TrueShares Structured Outcome (November) ETF | 1,000.00 | 1,056.10 | 0.79 | 4.09 |
TrueShares Structured Outcome (December) ETF | 1,000.00 | 1,056.00 | 0.79 | 4.09 |
TrueShares Structured Outcome (January) ETF | 1,000.00 | 1,062.00 | 0.79 | 4.11 |
TrueShares Structured Outcome (February) ETF | 1,000.00 | 1,058.70 | 0.79 | 4.10 |
TrueShares Structured Outcome (March) ETF | 1,000.00 | 1,060.30 | 0.79 | 4.10 |
TrueShares Structured Outcome (April) ETF | 1,000.00 | 1,061.00 | 0.79 | 4.10 |
TrueShares Structured Outcome (May) ETF | 1,000.00 | 1,060.50 | 0.79 | 4.10 |
TrueShares Structured Outcome (June) ETF | 1,000.00 | 1,062.00 | 0.79 | 4.11 |
(1) | Expenses are calculated using the Fund’s annualized expense ratio, multiplied by the average account value for the period, multiplied by 184/365 (to reflect the six-month period). |
4
TrueShares Structured Outcome ETFs
Shareholder Expense Example
(Unaudited) (Continued)
HYPOTHETICAL EXAMPLE FOR COMPARISON PURPOSES
The following table provides information about hypothetical account values and hypothetical expenses based on the Funds’ actual expense ratios and an assumed rate of return of 5% per year before expenses, which are not the Funds’ actual returns. The hypothetical account values and expenses may not be used to estimate the actual ending account balance or expenses you paid for the period. You may use this information to compare the ongoing costs of investing in the Funds and other funds. To do so, compare this 5% hypothetical example with the 5% hypothetical examples that appear in the shareholder reports of the other funds. Please note that the expenses shown in the table are meant to highlight your ongoing costs only and do not reflect any transactional costs, such as brokerage commissions paid on purchases and sales of Fund shares with respect to the Funds. Therefore, the table below is useful in comparing ongoing costs only and will not help you determine the relative total costs of owning different funds. In addition, if these transactional costs were included, your costs would have been higher.
Beginning | Ending | Annualized | Expenses | |
TrueShares Structured Outcome (July) ETF | $ 1,000.00 | $ 1,021.22 | 0.79% | $4.02 |
TrueShares Structured Outcome (August) ETF | 1,000.00 | 1,021.22 | 0.79 | 4.02 |
TrueShares Structured Outcome (September) ETF | 1,000.00 | 1,021.22 | 0.79 | 4.02 |
TrueShares Structured Outcome (October) ETF | 1,000.00 | 1,021.22 | 0.79 | 4.02 |
TrueShares Structured Outcome (November) ETF | 1,000.00 | 1,021.22 | 0.79 | 4.02 |
TrueShares Structured Outcome (December) ETF | 1,000.00 | 1,021.22 | 0.79 | 4.02 |
TrueShares Structured Outcome (January) ETF | 1,000.00 | 1,021.22 | 0.79 | 4.02 |
TrueShares Structured Outcome (February) ETF | 1,000.00 | 1,021.22 | 0.79 | 4.02 |
TrueShares Structured Outcome (March) ETF | 1,000.00 | 1,021.22 | 0.79 | 4.02 |
TrueShares Structured Outcome (April) ETF | 1,000.00 | 1,021.22 | 0.79 | 4.02 |
TrueShares Structured Outcome (May) ETF | 1,000.00 | 1,021.22 | 0.79 | 4.02 |
TrueShares Structured Outcome (June) ETF | 1,000.00 | 1,021.22 | 0.79 | 4.02 |
(1) | Expenses are calculated using the Fund’s annualized expense ratio, multiplied by the average account value for the period, multiplied by 184/365 (to reflect the six-month period). |
5
TrueShares Structured Outcome ETFs
Performance Overviews
December 31, 2023 (Unaudited)
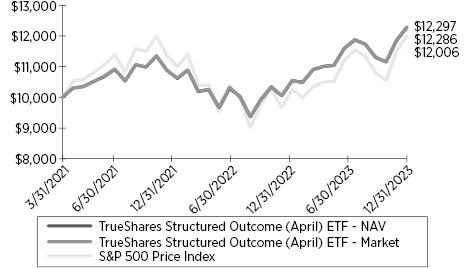
Hypothetical Growth of $10,000 Investment
(Since Commencement through 12/31/2023)
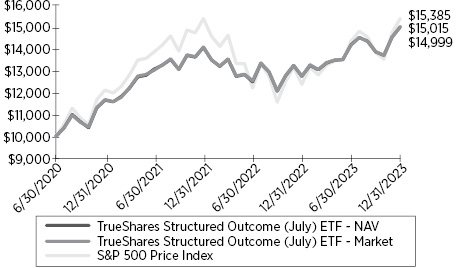
1 | The Fund has an inception date of June 30, 2020 and commenced operations on July 1, 2020. |
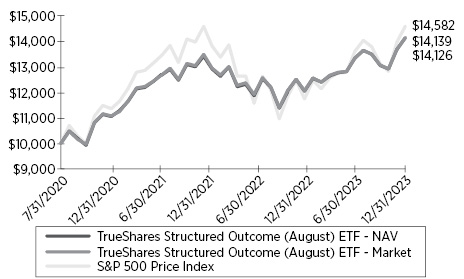
1 | The Fund has an inception date of July 31, 2020 and commenced operations on August 3, 2020. |
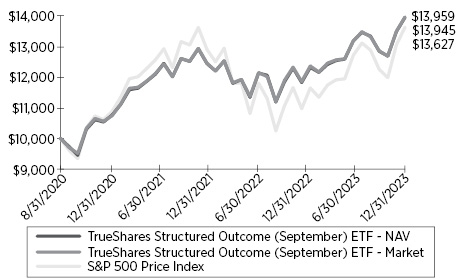
1 | The Fund has an inception date of August 31, 2020 and commenced operations on September 1, 2020. |
ANNUALIZED TOTAL RETURN | |||
Total Returns | 1 Year | 3 Year | Since |
TrueShares Structured Outcome (July) ETF – NAV | 17.81% | 8.73% | 12.30% |
TrueShares Structured Outcome (July) ETF – Market | 17.65% | 8.77% | 12.27% |
S&P 500 Price Index | 24.23% | 8.29% | 13.08% |
ANNUALIZED TOTAL RETURN | |||
Total Returns | 1 Year | 3 Year | Since |
TrueShares Structured Outcome (August) ETF – NAV | 17.25% | 8.22% | 10.66% |
TrueShares Structured Outcome (August) ETF – Market | 17.33% | 8.27% | 10.63% |
S&P 500 Price Index | 24.23% | 8.29% | 11.66% |
ANNUALIZED TOTAL RETURN | |||
Total Returns | 1 Year | 3 Year | Since |
TrueShares Structured Outcome (September) ETF – NAV | 17.72% | 9.44% | 10.52% |
TrueShares Structured Outcome (September) ETF – Market | 17.94% | 9.54% | 10.49% |
S&P 500 Price Index | 24.23% | 8.29% | 9.73% |
6
TrueShares Structured Outcome ETFs
Performance Overviews
December 31, 2023 (Unaudited) (Continued)
Hypothetical Growth of $10,000 Investment
(Since Commencement through 12/31/2023)
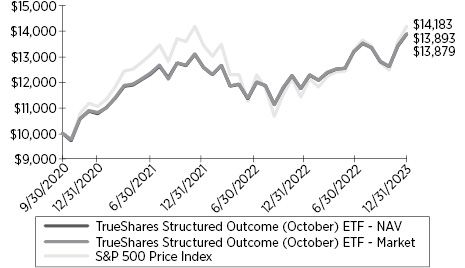
1 | The Fund has an inception date of September 30, 2020 and commenced operations on October 1, 2020. |
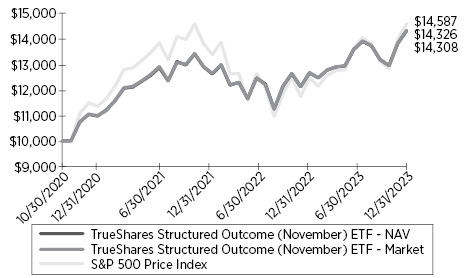
1 | The Fund has an inception date of October 30, 2020 and commenced operations on November 2, 2020. |
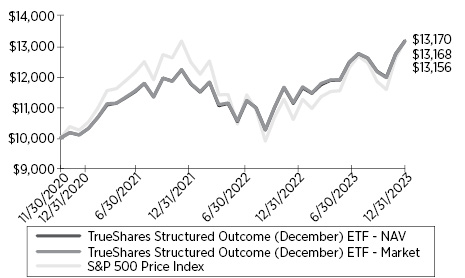
1 | The Fund has an inception date of November 30, 2020 and commenced operations on December 1, 2020. |
ANNUALIZED TOTAL RETURN | |||
Total Returns | 1 Year | 3 Year | Since |
TrueShares Structured Outcome (October) ETF – NAV | 18.23% | 8.47% | 10.64% |
TrueShares Structured Outcome (October) ETF – Market | 18.18% | 8.53% | 10.61% |
S&P 500 Price Index | 24.23% | 8.29% | 11.35% |
ANNUALIZED TOTAL RETURN | |||
Total Returns | 1 Year | 3 Year | Since |
TrueShares Structured Outcome (November) ETF – NAV | 18.21% | 9.04% | 12.01% |
TrueShares Structured Outcome (November) ETF – Market | 18.07% | 9.05% | 11.97% |
S&P 500 Price Index | 24.23% | 8.29% | 12.65% |
ANNUALIZED TOTAL RETURN | |||
Total Returns | 1 Year | 3 Year | Since |
TrueShares Structured Outcome (December) ETF – NAV | 17.97% | 8.94% | 9.30% |
TrueShares Structured Outcome (December) ETF – Market | 18.32% | 8.99% | 9.33% |
S&P 500 Price Index | 24.23% | 8.29% | 9.34% |
7
TrueShares Structured Outcome ETFs
Performance Overviews
December 31, 2023 (Unaudited) (Continued)
Hypothetical Growth of $10,000 Investment
(Since Commencement through 12/31/2023)
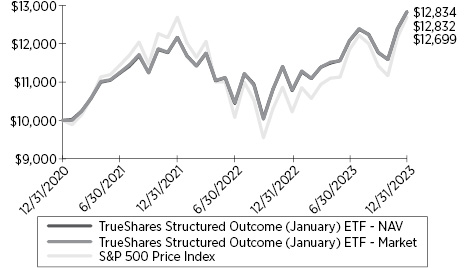
1 | The Fund has an inception date of December 31, 2020 and commenced operations on January 4, 2021. |
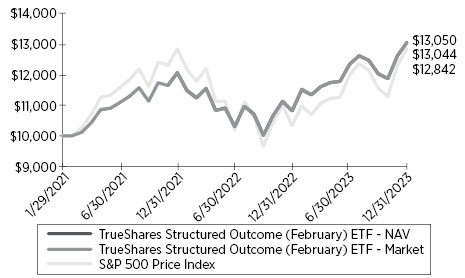
1 | The Fund has an inception date of January 29, 2021 and commenced operations on February 1, 2021. |

1 | The Fund has an inception date of February 26, 2021 and commenced operations on March 1, 2021. |
ANNUALIZED TOTAL RETURN | ||
Total Returns | 1 Year | Since |
TrueShares Structured Outcome (January) ETF – NAV | 18.91% | 8.67% |
TrueShares Structured Outcome (January) ETF – Market | 19.10% | 8.67% |
S&P 500 Price Index | 24.23% | 8.29% |
ANNUALIZED TOTAL RETURN | ||
Total Returns | 1 Year | Since |
TrueShares Structured Outcome (February) ETF – NAV | 20.64% | 9.54% |
TrueShares Structured Outcome (February) ETF – Market | 20.66% | 9.53% |
S&P 500 Price Index | 24.23% | 8.94% |
ANNUALIZED TOTAL RETURN | ||
Total Returns | 1 Year | Since |
TrueShares Structured Outcome (March) ETF – NAV | 20.45% | 7.61% |
TrueShares Structured Outcome (March) ETF – Market | 20.38% | 7.58% |
S&P 500 Price Index | 24.23% | 8.21% |
8
TrueShares Structured Outcome ETFs
Performance Overviews
December 31, 2023 (Unaudited) (Continued)
Hypothetical Growth of $10,000 Investment
(Since Commencement through 12/31/2023)
1 | The Fund has an inception date of March 31, 2021 and commenced operations on April 1, 2021. |
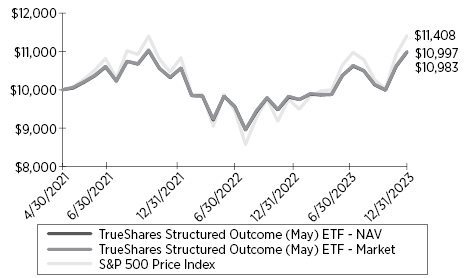
1 | The Fund has an inception date of April 30, 2021 and commenced operations on May 3, 2021. |
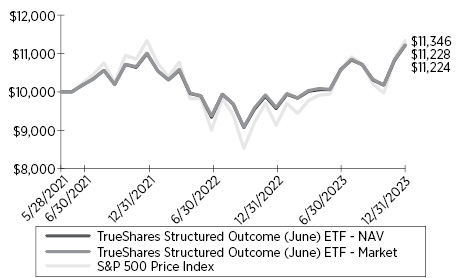
1 | The Fund has an inception date of May 28, 2021 and commenced operations on June 1, 2021. |
ANNUALIZED TOTAL RETURN | ||
Total Returns | 1 Year | Since |
TrueShares Structured Outcome (April) ETF – NAV | 22.28% | 7.80% |
TrueShares Structured Outcome (April) ETF – Market | 22.23% | 7.76% |
S&P 500 Price Index | 24.23% | 6.86% |
ANNUALIZED TOTAL RETURN | ||
Total Returns | 1 Year | Since |
TrueShares Structured Outcome (May) ETF – NAV | 15.87% | 3.62% |
TrueShares Structured Outcome (May) ETF – Market | 15.90% | 3.57% |
S&P 500 Price Index | 24.23% | 5.05% |
ANNUALIZED TOTAL RETURN | ||
Total Returns | 1 Year | Since |
TrueShares Structured Outcome (June) ETF – NAV | 17.02% | 4.57% |
TrueShares Structured Outcome (June) ETF – Market | 17.29% | 4.55% |
S&P 500 Price Index | 24.23% | 4.99% |
9
TrueShares Structured Outcome ETFs
Performance Overviews
December 31, 2023 (Unaudited) (Continued)
The performance data quoted represents past performance. Past performance does not guarantee future results. Current performance may be lower or higher than the performance data quoted. The investment return and principal value of an investment will fluctuate so that an investor’s shares, when sold or redeemed, may be worth more or less than their original cost. For the most recent month-end performance, please call (877) 774-8789. You cannot invest directly in an index. Shares are bought and sold at market price, not net asset value (NAV), and are individually redeemed from the Fund. Market performance is determined using the bid/ask midpoint at 4:00pm Eastern time when the NAV is typically calculated. Brokerage commissions will reduce returns. Returns shown include the reinvestment of all dividends and distribution. Returns shown do not reflect the deduction of taxes that a shareholder would pay on fund distributions or the redemption of fund shares. In the absence of fee waivers and reimbursements, total returns would be reduced.
The S&P 500® Index is a widely recognized capitalization-weighted index that measures the performance of the large-capitalization sector of the U.S. stock market. The S&P 500 Price Index does not include reinvestment of dividends.
10
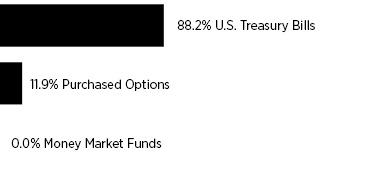
TrueShares Structured Outcome (July) ETF
Schedule of Investments
December 31, 2023
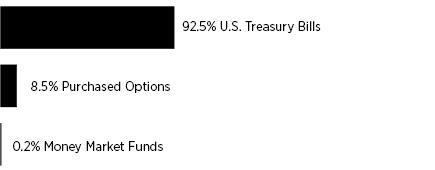
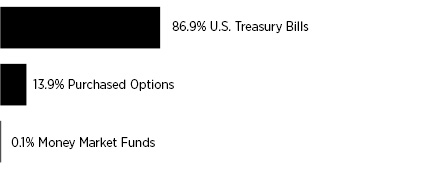
Sector Diversification *

* | Percentages are stated as a percent of net assets. Percentages expressed exclude written options. |
| Shares | Value |
| |||||||||
SHORT-TERM INVESTMENTS — 92.3% | ||||||||||||
Money Market Funds — 0.3% | ||||||||||||
First American Treasury Obligations Fund - Class X, 5.29%(d) | 43,615 | $ | 43,615 | |||||||||
Total Money Market Funds (Cost $43,615) | 43,615 | |||||||||||
Par | ||||||||||||
U.S. Treasury Bills — 92.0% | ||||||||||||
5.20%, 06/13/2024(b)(c)(e) | $ | 12,272,000 | 11,991,613 | |||||||||
Total U.S. Treasury Bills (Cost $11,985,554) | 11,991,613 | |||||||||||
TOTAL SHORT-TERM INVESTMENTS (Cost $12,029,169) | 12,035,228 | |||||||||||
| Notional | Contract | Value | |||||||||
PURCHASED OPTIONS — 8.5% | ||||||||||||
Call Options — 8.5%(a) | ||||||||||||
SPDR S&P 500 ETF, Expires June 28, 2024 at $443.28 | $ | 10,884,599 | 229 | $ | 1,102,262 | |||||||
Total Call Options | 1,102,262 | |||||||||||
TOTAL PURCHASED OPTIONS (Cost $822,155) | 1,102,262 | |||||||||||
TOTAL INVESTMENTS — 100.8% (Cost $12,851,324) | 13,137,490 | |||||||||||
Liabilities in Excess of Other Assets — (0.8)% | (101,262 | ) | ||||||||||
TOTAL NET ASSETS — 100.0% | $ | 13,036,228 | ||||||||||
Percentages are stated as a percent of net assets.
SPDR Standard & Poor’s Depositary Receipt
(a) | Exchange-traded. |
(b) | The rate shown is the effective yield. |
(c) | Zero coupon bonds make no periodic interest payments but are issued at a discount from par value. |
(d) | The rate shown represents the 7-day effective yield as of December 31, 2023. |
(e) | Designated as collateral for written options. |
Schedule of Written Options
December 31, 2023
| Notional | Contract | Value | |||||||||
Written Options — (0.7)% (a) | ||||||||||||
Put Options — (0.7)% | ||||||||||||
SPDR S&P 500 ETF, Expires June 28, 2024 at $398.95 | $ | 14,639,548 | 308 | $ | 96,373 | |||||||
Total Put Options | 96,373 | |||||||||||
Total Written Options (Premiums received $343,868) | $ | 96,373 | ||||||||||
(a) | Exchange-traded. |
The accompanying notes are an integral part of the financial statements.
11
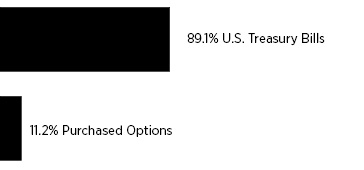
TrueShares Structured Outcome (August) ETF
Schedule of Investments
December 31, 2023
Sector Diversification *

* | Percentages are stated as a percent of net assets. Percentages expressed exclude written options. |
| Shares | Value |
| |||||||||
SHORT-TERM INVESTMENTS – 94.0% | ||||||||||||
Money Market Funds — 0.1% | ||||||||||||
First American Treasury Obligations Fund - Class X, 5.29%(d) | 8,078 | $ | 8,078 | |||||||||
Total Money Market Funds (Cost $8,078) | 8,078 | |||||||||||
Par | ||||||||||||
U.S. Treasury Bills — 93.9% | ||||||||||||
4.88%, 07/11/2024(b)(c)(e) | $ | 14,922,000 | 14,547,330 | |||||||||
Total U.S. Treasury Bills (Cost $14,517,021) | 14,547,330 | |||||||||||
TOTAL SHORT-TERM INVESTMENTS (Cost $14,525,099) | 14,555,408 | |||||||||||
| Notional | Contract | Value | |||||||||
PURCHASED OPTIONS — 7.0% | ||||||||||||
Purchased Call Options — 7.0%(a) | ||||||||||||
SPDR S&P 500 ETF, Expires July 31, 2024 at $457.79 | $ | 12,928,432 | 272 | $ | 1,082,914 | |||||||
Total Purchased Call Options | 1,082,914 | |||||||||||
TOTAL PURCHASED OPTIONS (Cost $1,059,148) | 1,082,914 | |||||||||||
TOTAL INVESTMENTS – 101.0% (Cost $15,584,247) | 15,638,322 | |||||||||||
Liabilities in Excess of Other Assets — (1.0)% | (149,394 | ) | ||||||||||
TOTAL NET ASSETS — 100.0% | $ | 15,488,928 | ||||||||||
Percentages are stated as a percent of net assets.
SPDR Standard & Poor’s Depositary Receipt
(a) | Exchange-traded. |
(b) | The rate shown is the effective yield. |
(c) | Zero coupon bonds make no periodic interest payments but are issued at a discount from par value. |
(d) | The rate shown represents the 7-day effective yield as of December 31, 2023. |
(e) | Designated as collateral for written options. |
Schedule of Written Options
December 31, 2023
| Notional | Contract | Value | |||||||||
Written Options - (1.2)% (a) | ||||||||||||
Put Options - (1.2)% | ||||||||||||
SPDR S&P 500 ETF, Expires July 31, 2024 at $412.01 | $ | 17,706,222 | 362 | $ | 174,122 | |||||||
Total Written Options (Premiums received $418,620) | $ | 174,122 | ||||||||||
(a) | Exchange-traded. |
The accompanying notes are an integral part of the financial statements.
12
TrueShares Structured Outcome (September) ETF
Schedule of Investments
December 31, 2023
Sector Diversification *
* | Percentages are stated as a percent of net assets. Percentages expressed exclude written options. |
| Shares | Value |
| |||||||||
SHORT-TERM INVESTMENTS — 92.7% | ||||||||||||
Money Market Funds — 0.2% | ||||||||||||
First American Treasury Obligations Fund - Class X, 5.29%(d) | 32,364 | $ | 32,364 | |||||||||
Total Money Market Funds (Cost $32,364) | 32,364 | |||||||||||
Par | ||||||||||||
U.S. Treasury Bills — 92.5% | ||||||||||||
4.89%, 08/08/2024(b)(c)(e) | $ | 16,401,000 | 15,929,561 | |||||||||
Total U.S. Treasury Bills (Cost $15,890,670) | 15,929,561 | |||||||||||
TOTAL SHORT-TERM INVESTMENTS (Cost $15,923,034) | 15,961,925 | |||||||||||
| Notional | Contract | Value | |||||||||
PURCHASED OPTIONS — 8.5% | ||||||||||||
Purchased Call Options — 8.5%(a) | ||||||||||||
SPDR S&P 500 ETF, Expires August 30, 2024 at $450.35 | $ | 14,306,831 | 301 | $ | 1,461,156 | |||||||
Total Purchased Call Options | 1,461,156 | |||||||||||
TOTAL PURCHASED OPTIONS (Cost $1,194,082) | 1,461,156 | |||||||||||
TOTAL INVESTMENTS – 101.2% (Cost $17,117,116) | 17,423,081 | |||||||||||
Liabilities in Excess of Other Assets — (1.2)% | (193,419 | ) | ||||||||||
TOTAL NET ASSETS — 100.0% | $ | 17,229,662 | ||||||||||
Percentages are stated as a percent of net assets.
SPDR Standard & Poor’s Depositary Receipt
(a) | Exchange-traded. |
(b) | The rate shown is the effective yield. |
(c) | Zero coupon bonds make no periodic interest payments but are issued at a discount from par value. |
(d) | The rate shown represents the 7-day effective yield as of December 31, 2023. |
(e) | Designated as collateral for written options. |
Schedule of Written Options
December 31, 2023
| Notional | Contract | Value | |||||||||
Written Options - (1.2)% (a) | ||||||||||||
Put Options - (1.2)% | ||||||||||||
SPDR S&P 500 ETF, Expires August 30, 2024 at $405.32 | $ | 19,250,055 | 405 | $ | 204,047 | |||||||
Total Put Options | 204,047 | |||||||||||
Total Written Options (Premiums received $460,461) | $ | 204,047 | ||||||||||
(a) | Exchange-traded. |
The accompanying notes are an integral part of the financial statements.
13
TrueShares Structured Outcome (October) ETF
Schedule of Investments
December 31, 2023
Sector Diversification *

* | Percentages are stated as a percent of net assets. Percentages expressed exclude written options. |
| Shares | Value |
| |||||||||
SHORT-TERM INVESTMENTS — 89.4% | ||||||||||||
Money Market Funds — 0.4% | ||||||||||||
First American Treasury Obligations Fund - Class X, 5.29%(d) | 14,908 | $ | 14,908 | |||||||||
Total Money Market Funds (Cost $14,908) | 14,908 | |||||||||||
Par | ||||||||||||
U.S. Treasury Bills — 89.0% | ||||||||||||
4.91%, 09/05/2024(b)(c)(e) | $ | 3,379,000 | 3,269,327 | |||||||||
Total U.S. Treasury Bills (Cost $3,259,877) | 3,269,327 | |||||||||||
TOTAL SHORT-TERM INVESTMENTS (Cost $3,274,785) | 3,284,235 | |||||||||||
| Notional | Contract | Value | |||||||||
PURCHASED OPTIONS — 11.7% | ||||||||||||
Purchased Call Options — 11.7%(a) | ||||||||||||
SPDR S&P 500 ETF, Expires September 30, 2024 at $427.48 | $ | 2,994,453 | 63 | $ | 431,269 | |||||||
Total Purchased Call Options | 431,269 | |||||||||||
TOTAL PURCHASED OPTIONS (Cost $248,379) | 431,269 | |||||||||||
TOTAL INVESTMENTS – 101.1% (Cost $3,523,164) | 3,715,504 | |||||||||||
Liabilities in Excess of Other Assets — (1.1)% | (40,703 | ) | ||||||||||
TOTAL NET ASSETS — 100.0% | $ | 3,674,801 | ||||||||||
Percentages are stated as a percent of net assets.
SPDR Standard & Poor’s Depositary Receipt
(a) | Exchange-traded. |
(b) | The rate shown is the effective yield. |
(c) | Zero coupon bonds make no periodic interest payments but are issued at a discount from par value. |
(d) | The rate shown represents the 7-day effective yield as of December 31, 2023. |
(e) | Designated as collateral for written options. |
Schedule of Written Options
December 31, 2023
| Notional | Contract | Value | |||||||||
Written Options — (1.1)% (a) | ||||||||||||
Put Options — (1.1)% | ||||||||||||
SPDR S&P 500 ETF, Expires September 30, 2024 at $384.73 | $ | 4,182,728 | 88 | $ | 38,936 | |||||||
Total Put Options | 38,936 | |||||||||||
Total Written Options (Premiums received $107,693) | $ | 38,936 | ||||||||||
(a) | Exchange-traded. |
The accompanying notes are an integral part of the financial statements.
14
TrueShares Structured Outcome (November) ETF
Schedule of Investments
December 31, 2023
Sector Diversification *
* | Percentages are stated as a percent of net assets. Percentages expressed exclude written options. |
| Shares | Value |
| |||||||||
SHORT-TERM INVESTMENTS — 87.0% | ||||||||||||
Money Market Funds — 0.1% | ||||||||||||
First American Treasury Obligations Fund - Class X, 5.29%(d) | 23,644 | $ | 23,644 | |||||||||
Total Money Market Funds (Cost $23,644) | 23,644 | |||||||||||
Par | ||||||||||||
U.S. Treasury Bills — 86.9% | ||||||||||||
4.89%, 10/03/2024(b)(c)(e) | $ | 16,285,000 | 15,699,857 | |||||||||
Total U.S. Treasury Bills (Cost $15,640,844) | 15,699,857 | |||||||||||
TOTAL SHORT-TERM INVESTMENTS (Cost $15,664,488) | 15,723,501 | |||||||||||
| Notional | Contract | Value | |||||||||
PURCHASED OPTIONS — 13.9% | ||||||||||||
Purchased Call Options — 13.9%(a) | ||||||||||||
SPDR S&P 500 ETF, Expires October 31, 2024 at $418.20 | $ | 15,162,389 | 319 | $ | 2,510,045 | |||||||
Total purchased Call Options | 2,510,045 | |||||||||||
TOTAL PURCHASED OPTIONS (Cost $1,282,658) | 2,510,045 | |||||||||||
TOTAL INVESTMENTS – 100.9% (Cost $16,947,146) | 18,233,546 | |||||||||||
Liabilities in Excess of Other Assets — (0.9)% | (160,710 | ) | ||||||||||
TOTAL NET ASSETS — 100.0% | $ | 18,072,836 | ||||||||||
Percentages are stated as a percent of net assets.
SPDR Standard & Poor’s Depositary Receipt
(a) | Exchange-traded. |
(b) | The rate shown is the effective yield. |
(c) | Zero coupon bonds make no periodic interest payments but are issued at a discount from par value. |
(d) | The rate shown represents the 7-day effective yield as of December 31, 2023. |
(e) | Designated as collateral for written options. |
Schedule of Written Options
December 31, 2023
| Notional | Contract | Value | |||||||||
Written Options — (1.1)% (a) | ||||||||||||
Put Options — (1.1)% | ||||||||||||
SPDR S&P 500 ETF, Expires October 31, 2024 at $376.38 | $ | 20,580,923 | 433 | $ | 195,859 | |||||||
Total Put Options | 195,859 | |||||||||||
Total Written Options (Premiums received $514,489) | $ | 195,859 | ||||||||||
(a) | Exchange-traded. |
The accompanying notes are an integral part of the financial statements.
15
TrueShares Structured Outcome (December) ETF
Schedule of Investments
December 31, 2023
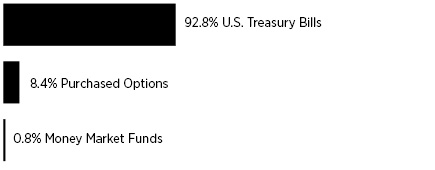
Sector Diversification *
* | Percentages are stated as a percent of net assets. Percentages expressed exclude written options. |
| Shares | Value |
| |||||||||
SHORT-TERM INVESTMENTS — 93.6% | ||||||||||||
Money Market Funds — 0.8% | ||||||||||||
First American Treasury Obligations Fund - Class X, 5.29%(d) | 334,979 | $ | 334,979 | |||||||||
Total Money Market Funds (Cost $334,979) | 334,979 | |||||||||||
Par | ||||||||||||
U.S. Treasury Bills – 92.8% | ||||||||||||
4.74%, 07/31/2023(b)(c)(e) | $ | 38,901,000 | 37,268,790 | |||||||||
Total U.S. Treasury Bills (Cost $37,154,295) | 37,268,790 | |||||||||||
TOTAL SHORT-TERM INVESTMENTS (Cost $37,489,274) | 37,603,769 | |||||||||||
| Notional | Contract | Value | |||||||||
PURCHASED OPTIONS — 8.4% | ||||||||||||
Purchased Call Options — 8.4%(a) | ||||||||||||
SPDR S&P 500 ETF, Expires November 29, 2024 at $456.40 | $ | 31,750,708 | 668 | $ | 3,391,035 | |||||||
Total Purchased Call Options | 3,391,035 | |||||||||||
TOTAL PURCHASED OPTIONS (Cost $2,653,861) | 3,391,035 | |||||||||||
TOTAL INVESTMENTS – 102.0% (Cost $40,143,135) | 40,994,804 | |||||||||||
Liabilities in Excess of Other Assets — (2.0)% | (820,197 | ) | ||||||||||
TOTAL NET ASSETS — 100.0% | $ | 40,174,607 | ||||||||||
Percentages are stated as a percent of net assets.
SPDR Standard & Poor’s Depositary Receipt
(a) | Exchange-traded. |
(b) | The rate shown is the effective yield. |
(c) | Zero coupon bonds make no periodic interest payments but are issued at a discount from par value. |
(d) | The rate shown represents the 7-day effective yield as of December 31, 2023. |
(e) | Designated as collateral for written options. |
Schedule of Written Options
December 31, 2023
| Notional | Contract | Value | |||||||||
Written Options — (1.9)% (a) | ||||||||||||
Put Options — (1.9)% | ||||||||||||
SPDR S&P 500 ETF, Expires November 29, 2024 at $410.76 | $ | 45,011,857 | 947 | $ | 777,004 | |||||||
Total Put Options | 777,004 | |||||||||||
Total Written Options (Premiums received $1,029,375) | $ | 777,004 | ||||||||||
(a) | Exchange-traded. |
The accompanying notes are an integral part of the financial statements.
16
TrueShares Structured Outcome (January) ETF
Schedule of Investments
December 31, 2023
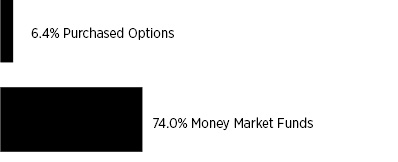
Sector Diversification *
* | Percentages are stated as a percent of net assets. Percentages expressed exclude written options. |
| Shares | Value |
| |||||||||
SHORT-TERM INVESTMENTS — 74.0% | ||||||||||||
Money Market Funds — 74.0% | ||||||||||||
First American Treasury Obligations Fund - Class X, 5.29%(b) | 3,978,685 | $ | 3,978,685 | |||||||||
TOTAL SHORT-TERM INVESTMENTS (Cost $3,978,685) | 3,978,685 | |||||||||||
| Notional | Contract | Value | |||||||||
PURCHASED OPTIONS — 6.4% | ||||||||||||
Purchased Call Options — 6.4%(a) | ||||||||||||
SPDR S&P 500 ETF, Expires December 31, 2024 at $475.31 | $ | 4,182,728 | 88 | $ | 344,696 | |||||||
TOTAL PURCHASED OPTIONS (Cost $344,809) | 344,696 | |||||||||||
TOTAL INVESTMENTS — 80.4% (Cost $4,323,494) | 4,323,381 | |||||||||||
Other Assets in Excess of Liabilities — 19.6% | 1,054,324 | |||||||||||
TOTAL NET ASSETS — 100.0% | $ | 5,377,705 | ||||||||||
Percentages are stated as a percent of net assets.
SPDR Standard & Poor’s Depositary Receipt
(a) | Exchange-traded. |
(b) | The rate shown represents the 7-day effective yield as of December 31, 2023. |
Schedule of Written Options
December 31, 2023
| Notional | Contract | Value | |||||||||
Written Options — (2.6)% (a) | ||||||||||||
Written Put Options — (2.6)% | ||||||||||||
SPDR S&P 500 ETF, Expires December 31, 2024 at $427.78 | $ | 5,988,906 | 126 | $ | 140,868 | |||||||
Total Written Options (Premiums received $140,704) | $ | 140,868 | ||||||||||
(a) | Exchange-traded. |
The accompanying notes are an integral part of the financial statements.
17
TrueShares Structured Outcome (February) ETF
Schedule of Investments
December 31, 2023
Sector Diversification *

* | Percentages are stated as a percent of net assets. Percentages expressed exclude written options. |
| Par | Value |
| |||||||||
SHORT-TERM INVESTMENTS — 91.0% | ||||||||||||
U.S. Treasury Bills — 91.0% | ||||||||||||
5.19%, 01/25/2024(b)(c)(d) | $ | 3,346,000 | $ | 3,334,740 | ||||||||
TOTAL SHORT-TERM INVESTMENTS (Cost $3,335,825) | 3,334,740 | |||||||||||
| Notional | Contract | Value | |||||||||
PURCHASED OPTIONS — 9.1% | ||||||||||||
Purchased Call Options — 9.1%(a) | ||||||||||||
SPDR S&P 500 ETF, Expires January 31, 2024 at $406.48 | $ | 2,233,957 | 47 | $ | 334,938 | |||||||
Total Call Options | 334,938 | |||||||||||
TOTAL PURCHASED OPTIONS (Cost $175,813) | 334,938 | |||||||||||
TOTAL INVESTMENTS — 100.1% (Cost $3,511,638) | 3,669,678 | |||||||||||
Liabilities in Excess of Other Assets — (0.1)% | (4,224 | ) | ||||||||||
TOTAL NET ASSETS — 100.0% | $ | 3,665,454 | ||||||||||
Percentages are stated as a percent of net assets.
SPDR Standard & Poor’s Depositary Receipt
(a) | Exchange-traded. |
(b) | The rate shown is the effective yield. |
(c) | Zero coupon bonds make no periodic interest payments but are issued at a discount from par value. |
(d) | Designated as collateral for written options. |
Schedule of Written Options
December 31, 2023
| Notional | Contract | Value | |||||||||
Written Options — 0.0% (a)(b) | ||||||||||||
Put Options — 0.0% (b) | ||||||||||||
SPDR S&P 500 ETF, Expires January 31, 2024 at $365.83 | $ 4,325,321 | 91 | $ | 763 | ||||||||
Total Put Options | 763 | |||||||||||
Total Written Options (Premiums received $117,222) | $ | 763 | ||||||||||
(a) | Exchange-traded. |
(b) | Represents less than 0.05% of net assets. |
The accompanying notes are an integral part of the financial statements.
18
TrueShares Structured Outcome (March) ETF
Schedule of Investments
December 31, 2023
Sector Diversification *

* | Percentages are stated as a percent of net assets. Percentages expressed exclude written options. |
| Par | Value |
| |||||||||
SHORT-TERM INVESTMENTS — 89.0% | ||||||||||||
U.S. Treasury Bills — 89.0% | ||||||||||||
5.30%, 02/22/2024(b)(c)(e) | $ | 3,491,000 | $ | 3,465,074 | ||||||||
TOTAL SHORT-TERM INVESTMENTS (Cost $3,466,988) | 3,465,074 | |||||||||||
| Notional | Contract | Value | |||||||||
PURCHASED OPTIONS — 11.0% | ||||||||||||
Call Options — 11.0%(a) | ||||||||||||
SPDR S&P 500 ETF, Expires February 29, 2024 at $396.26 | $ | 2,424,081 | 51 | $ | 426,297 | |||||||
TOTAL PURCHASED OPTIONS (Cost $201,401) | 426,297 | |||||||||||
TOTAL INVESTMENTS — 100.0% (Cost $3,668,389) | 3,891,371 | |||||||||||
Other Assets in Excess of Liabilities — 0.0%(d) | 1,104 | |||||||||||
TOTAL NET ASSETS — 100.0% | $ | 3,892,475 | ||||||||||
Percentages are stated as a percent of net assets.
SPDR Standard & Poor’s Depositary Receipt
(a) | Exchange-traded. |
(b) | The rate shown is the effective yield. |
(c) | Zero coupon bonds make no periodic interest payments but are issued at a discount from par value. |
(d) | Represents less than 0.05% of net assets. |
(e) | Designated as collateral for written options. |
Schedule of Written Options
December 31, 2023
| Notional | Contract | Value | |||||||||
Written Options — (0.1)% (a) | ||||||||||||
Put Options — (0.1)% | ||||||||||||
SPDR S&P 500 ETF, Expires February 29, 2024 at $356.63 | $ | 4,658,038 | 98 | $ | 1,995 | |||||||
Total Put Options | 1,995 | |||||||||||
Total Written Options (Premiums received $127,950) | $ | 1,995 | ||||||||||
(a) | Exchange-traded. |
The accompanying notes are an integral part of the financial statements.
19
TrueShares Structured Outcome (April) ETF
Schedule of Investments
December 31, 2023
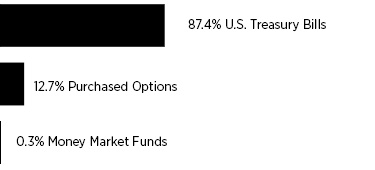
Sector Diversification *
* | Percentages are stated as a percent of net assets. Percentages expressed exclude written options. |
| Shares | Value |
| |||||||||
SHORT-TERM INVESTMENTS — 87.7% | ||||||||||||
Money Market Funds — 0.3% | ||||||||||||
First American Treasury Obligations Fund - Class X — 5.29%(d) | 15,173 | $ | 15,173 | |||||||||
Total Money Market Funds (Cost $15,173) | 15,173 | |||||||||||
Par | ||||||||||||
U.S. Treasury Bills — 87.4% | ||||||||||||
5.29%, 03/21/2024(b)(c)(e) | $ | 4,462,000 | 4,411,214 | |||||||||
Total U.S. Treasury Bills (Cost $4,418,713) | 4,411,214 | |||||||||||
TOTAL SHORT-TERM INVESTMENTS (Cost $4,433,886) | 4,426,387 | |||||||||||
| Notional | Contract | Value | |||||||||
PURCHASED OPTIONS — 12.7% | ||||||||||||
Purchased Call Options — 12.7%(a) | ||||||||||||
SPDR S&P 500 ETF, Expires March 28, 2024 at $409.39 | $ | 4,230,259 | 89 | $ | 638,836 | |||||||
TOTAL PURCHASED OPTIONS (Cost $344,524) | 638,836 | |||||||||||
TOTAL INVESTMENTS (Cost $4,778,410) — 100.4% | 5,065,223 | |||||||||||
Liabilities in Excess of Other Assets — (0.4)% | (15,221 | ) | ||||||||||
TOTAL NET ASSETS — 100.0% | $ | 5,050,002 | ||||||||||
Percentages are stated as a percent of net assets.
SPDR Standards & Poor’s Depositary Receipt
(a) | Exchange-traded. |
(b) | The rate shown is the effective yield. |
(c) | Zero coupon bonds make no periodic interest payments but are issued at a discount from par value. |
(d) | The rate shown represents the 7-day effective yield as of December 31, 2023. |
(e) | Designated as collateral for written options. |
Schedule of Written Options
December 31, 2023
| Notional | Contract | Value | |||||||||
Written Options — (0.1)% (a) | ||||||||||||
Put Options — (0.1)% | ||||||||||||
SPDR S&P 500 ETF, Expires March 28, 2024 at $368.45 | $ | 5,751,251 | 121 | $ | 6,496 | |||||||
Total Written Options (Premiums received $175,322) | $ | 6,496 | ||||||||||
(a) | Exchange-traded. |
The accompanying notes are an integral part of the financial statements.
20
TrueShares Structured Outcome (May) ETF
Schedule of Investments
December 31, 2023
Sector Diversification *
* | Percentages are stated as a percent of net assets. Percentages expressed exclude written options. |
| Shares | Value |
| |||||||||
SHORT-TERM INVESTMENTS — 88.2% | ||||||||||||
Money Market Funds — 0.0%(d) | ||||||||||||
First American Treasury Obligations Fund - Class X, 5.29%(e) | 231 | $ | 231 | |||||||||
Total Money Market Funds (Cost $231) | 231 | |||||||||||
Par | ||||||||||||
U.S. Treasury Bills — 88.2% | ||||||||||||
5.32%, 04/18/2024(b)(c)(f) | $ | 3,970,000 | 3,908,792 | |||||||||
Total U.S. Treasury Bills (Cost $3,915,792) | 3,908,792 | |||||||||||
TOTAL SHORT-TERM INVESTMENTS (Cost $3,916,023) | 3,909,023 | |||||||||||
| Notional | Contract | Value | |||||||||
PURCHASED OPTIONS — 11.9% | ||||||||||||
Purchased Call Options — 11.9%(a) | ||||||||||||
SPDR S&P 500 ETF, Expires April 30, 2024 at $415.93 | $ | 3,659,887 | 77 | $ | 525,571 | |||||||
TOTAL PURCHASED OPTIONS (Cost $299,048) | 525,571 | |||||||||||
TOTAL INVESTMENTS — 100.1% (Cost $4,215,071) | 4,434,594 | |||||||||||
Liabilities in Excess of Other Assets — (0.1)% | (560 | ) | ||||||||||
TOTAL NET ASSETS — 100.0% | $ | 4,434,034 | ||||||||||
Percentages are stated as a percent of net assets.
SPDR Standard & Poor’s Depositary Receipt
(a) | Exchange-traded. |
(b) | The rate shown is the effective yield. |
(c) | Zero coupon bonds make no periodic interest payments but are issued at a discount from par value. |
(d) | Represents less than 0.05% of net assets. |
(e) | The rate shown represents the 7-day effective yield as of December 31, 2023. |
(f) | Designated as collateral for written options. |
Schedule of Written Options
December 31, 2023
| Notional | Contract | Value | |||||||||
Written Options — (0.3)% (a) | ||||||||||||
Put Options — (0.3)% | ||||||||||||
SPDR S&P 500 ETF, Expires April 30, 2024 at $374.34 | $ | 5,038,286 | 106 | $ | 11,215 | |||||||
Total Put Options | 11,215 | |||||||||||
Total Written Options (Premiums received $152,657) | $ | 11,215 | ||||||||||
(a) | Exchange-traded. |
The accompanying notes are an integral part of the financial statements.
21
TrueShares Structured Outcome (June) ETF
Schedule of Investments
December 31, 2023
Sector Diversification *
* | Percentages are stated as a percent of net assets. Percentages expressed exclude written options. |
| Par | Value |
| |||||||||
SHORT-TERM INVESTMENTS — 89.1% | ||||||||||||
U.S. Treasury Bills — 89.1% | ||||||||||||
5.25%, 05/16/2024(b)(c)(d) | $ | 2,979,000 | $ | 2,921,937 | ||||||||
TOTAL SHORT-TERM INVESTMENTS (Cost $2,923,844) | 2,921,937 | |||||||||||
| Notional | Contract | Value | |||||||||
PURCHASED OPTIONS — 11.2% | ||||||||||||
Call Options — 11.2%(a) | ||||||||||||
SPDR S&P 500 ETF, Expires May 31, 2024 at $417.85 | $ | 2,519,143 | 53 | $ | 367,183 | |||||||
Total Call Options | 367,183 | |||||||||||
TOTAL PURCHASED OPTIONS (Cost $204,105) | 367,183 | |||||||||||
TOTAL INVESTMENTS — 100.3% Cost $3,127,949) | 3,289,120 | |||||||||||
Liabilities in Excess of Other Assets — (0.3)% | (8,214 | ) | ||||||||||
TOTAL NET ASSETS — 100.0% | $ | 3,280,906 | ||||||||||
Percentages are stated as a percent of net assets.
SPDR Standard & Poor’s Depositary Receipt
(a) | Exchange-traded. |
(b) | The rate shown is the effective yield. |
(c) | Zero coupon bonds make no periodic interest payments but are issued at a discount from par value. |
(d) | Designated as collateral for written options. |
Schedule of Written Options
December 31, 2023
| Notional | Contract | Value | |||||||||
Written Options — (0.4)% (a) | ||||||||||||
Put Options — (0.4)% | ||||||||||||
SPDR S&P 500 ETF, Expires May 31, 2024 at $376.07 | $ | 3,754,949 | 79 | $ | 12,637 | |||||||
Total Put Options | 12,637 | |||||||||||
Total Written Options (Premiums received $106,057) | $ | 12,637 | ||||||||||
(a) | Exchange-traded. |
The accompanying notes are an integral part of the financial statements.
22
THIS PAGE INTENTIONALLY LEFT BLANK
TrueShares Structured Outcome ETFs
Statements of Assets and Liabilities
December 31, 2023
TrueShares | TrueShares | TrueShares | TrueShares | |||||||||||||
Assets | ||||||||||||||||
Investments, at value(1) | $ | 13,137,490 | $ | 15,638,322 | $ | 17,423,081 | $ | 3,715,504 | ||||||||
Deposits at broker for options | 9,759 | 33,698 | 1,284 | 1,976 | ||||||||||||
Interest receivable | 381 | 283 | 222 | 90 | ||||||||||||
Receivable for investment securities sold | — | 7,917 | 29,170 | — | ||||||||||||
Total assets | 13,147,630 | 15,680,220 | 17,453,757 | 3,717,570 | ||||||||||||
Liabilities | ||||||||||||||||
Payable to Adviser | 11,583 | 10,705 | 12,094 | 2,497 | ||||||||||||
Written options, at value(2) | 96,373 | 174,122 | 204,047 | 38,936 | ||||||||||||
Payable for investment securities purchased | 3,446 | 6,465 | 7,954 | 1,336 | ||||||||||||
Total liabilities | 111,402 | 191,292 | 224,095 | 42,769 | ||||||||||||
Net Assets | $ | 13,036,228 | $ | 15,488,928 | $ | 17,229,662 | $ | 3,674,801 | ||||||||
Net Assets Consists of: | ||||||||||||||||
Paid-in capital | $ | 12,488,759 | $ | 15,468,757 | $ | 17,029,129 | $ | 3,752,082 | ||||||||
Total distributable earnings (accumulated losses) | 547,469 | 20,171 | 200,533 | (77,281 | ) | |||||||||||
Net Assets | $ | 13,036,228 | $ | 15,488,928 | $ | 17,229,662 | $ | 3,674,801 | ||||||||
Shares of beneficial interest outstanding (unlimited number of shares authorized, no par value) | 360,000 | 455,000 | 515,000 | 110,000 | ||||||||||||
Net Asset Value, redemption price and offering price per share | $ | 36.21 | $ | 34.04 | $ | 33.46 | $ | 33.41 | ||||||||
(1) Cost of investments | $ | 12,851,324 | $ | 15,584,247 | $ | 17,117,116 | $ | 3,523,164 | ||||||||
(2) Premiums received | $ | 343,868 | $ | 418,620 | $ | 460,461 | $ | 107,693 | ||||||||
The accompanying notes are an integral part of the financial statements.
24
TrueShares Structured Outcome ETFs
Statements of Assets and Liabilities
December 31, 2023 (Continued)
TrueShares | TrueShares | TrueShares | TrueShares | |||||||||||||
Assets | ||||||||||||||||
Investments, at value(1) | $ | 18,233,546 | $ | 40,994,804 | $ | 4,323,381 | $ | 3,669,678 | ||||||||
Receivable for fund shares sold | — | — | 597,398 | — | ||||||||||||
Deposits at broker for options | 20,379 | — | 21,975 | 1,910 | ||||||||||||
Interest receivable | 250 | 1,914 | 3,498 | 45 | ||||||||||||
Receivable for investment securities sold | 31,343 | — | 920,782 | 128,046 | ||||||||||||
Total assets | 18,285,518 | 40,996,718 | 5,867,034 | 3,799,679 | ||||||||||||
Liabilities | ||||||||||||||||
Payable to Adviser | 12,170 | 25,699 | 3,651 | 2,516 | ||||||||||||
Written options, at value(2) | 195,859 | 777,004 | 140,868 | 763 | ||||||||||||
Payable to broker for options | — | 19,408 | — | — | ||||||||||||
Payable for investment securities purchased | 4,653 | — | 344,810 | 30 | ||||||||||||
Payable to custodian | — | — | — | 130,916 | ||||||||||||
Total liabilities | 212,682 | 822,111 | 489,329 | 134,225 | ||||||||||||
Net Assets | $ | 18,072,836 | $ | 40,174,607 | $ | 5,377,705 | $ | 3,665,454 | ||||||||
Net Assets Consists of: | ||||||||||||||||
Paid-in capital | $ | 17,602,881 | $ | 39,192,128 | $ | 5,774,446 | $ | 3,338,050 | ||||||||
Total distributable earnings (accumulated losses) | 469,955 | 982,479 | (396,741 | ) | 327,404 | |||||||||||
Net Assets | $ | 18,072,836 | $ | 40,174,607 | $ | 5,377,705 | $ | 3,665,454 | ||||||||
Shares of beneficial interest outstanding (unlimited number of shares authorized, no par value) | 520,000 | 1,260,000 | 180,000 | 120,000 | ||||||||||||
Net Asset Value, redemption price and offering price per share | $ | 34.76 | $ | 31.88 | $ | 29.88 | $ | 30.55 | ||||||||
(1) Cost of investments | $ | 16,947,146 | $ | 40,143,135 | $ | 4,323,494 | $ | 3,511,638 | ||||||||
(2) Premiums received | $ | 514,489 | $ | 1,029,375 | $ | 140,704 | $ | 117,222 | ||||||||
The accompanying notes are an integral part of the financial statements.
25
TrueShares Structured Outcome ETFs
Statements of Assets and Liabilities
December 31, 2023 (Continued)
TrueShares | TrueShares | TrueShares | TrueShares | |||||||||||||
Assets | ||||||||||||||||
Investments, at value(1) | $ | 3,891,371 | $ | 5,065,223 | $ | 4,434,594 | $ | 3,289,120 | ||||||||
Deposits at broker for options | 1,517 | 1,307 | 13,869 | 1,938 | ||||||||||||
Interest receivable | 35 | 82 | 104 | 59 | ||||||||||||
Receivable for investment securities sold | 158,586 | — | — | 55,357 | ||||||||||||
Total assets | 4,051,509 | 5,066,612 | 4,448,567 | 3,346,474 | ||||||||||||
Liabilities | ||||||||||||||||
Payable to Adviser | 2,734 | 3,418 | 2,999 | 2,280 | ||||||||||||
Written options, at value(2) | 1,995 | 6,496 | 11,215 | 12,637 | ||||||||||||
Payable to custodian | 154,241 | — | — | 49,981 | ||||||||||||
Broker interest payable | — | 6,483 | — | — | ||||||||||||
Payable for investment securities purchased | 64 | 213 | 319 | 670 | ||||||||||||
Total liabilities | 159,034 | 16,610 | 14,533 | 65,568 | ||||||||||||
Net Assets | $ | 3,892,475 | $ | 5,050,002 | $ | 4,434,034 | $ | 3,280,906 | ||||||||
Net Assets Consists of: | ||||||||||||||||
Paid-in capital | $ | 3,460,162 | $ | 4,791,660 | $ | 4,406,040 | $ | 3,007,641 | ||||||||
Total distributable earnings (accumulated losses) | 432,313 | 258,342 | 27,994 | 273,265 | ||||||||||||
Net Assets | $ | 3,892,475 | $ | 5,050,002 | $ | 4,434,034 | $ | 3,280,906 | ||||||||
Shares of beneficial interest outstanding (unlimited number of shares authorized, no par value) | 140,000 | 170,000 | 170,000 | 125,000 | ||||||||||||
Net Asset Value, redemption price and offering price per share | $ | 27.80 | $ | 29.71 | $ | 26.08 | $ | 26.25 | ||||||||
(1) Cost of investments | $ | 3,668,389 | $ | 4,778,410 | $ | 4,215,071 | $ | 3,127,949 | ||||||||
(2) Premiums received | $ | 127,950 | $ | 175,322 | $ | 152,657 | $ | 106,057 | ||||||||
The accompanying notes are an integral part of the financial statements.
26
TrueShares Structured Outcome ETFs
Statements of Operations
For the Year Ended December 31, 2023
TrueShares | TrueShares | TrueShares | TrueShares | |||||||||||||
Investment Income | ||||||||||||||||
Interest income | $ | 575,786 | $ | 648,328 | $ | 763,835 | $ | 150,341 | ||||||||
Total investment income | 575,786 | 648,328 | 763,835 | 150,341 | ||||||||||||
Expenses | ||||||||||||||||
Investment advisory fees | 110,780 | 119,162 | 152,966 | 29,858 | ||||||||||||
Interest expense | 469 | 163 | 72 | 60 | ||||||||||||
Total expenses | 111,249 | 119,325 | 153,038 | 29,918 | ||||||||||||
Net investment income | 464,537 | 529,003 | 610,797 | 120,423 | ||||||||||||
Realized and Unrealized Gain (Loss) on Investments | ||||||||||||||||
Net realized gain (loss) on: | ||||||||||||||||
Investments | (11,417 | ) | (19,892 | ) | (15,416 | ) | (6,594 | ) | ||||||||
Purchased options | 581,580 | 164,855 | 573,057 | 275,629 | ||||||||||||
Written options | 806,967 | 809,642 | 1,188,772 | 243,070 | ||||||||||||
Net realized gain | 1,377,130 | 954,605 | 1,746,413 | 512,105 | ||||||||||||
Net change in unrealized appreciation/depreciation on: | ||||||||||||||||
Investments | 106,473 | 135,290 | 178,782 | 21,408 | ||||||||||||
Purchased options | 480,504 | 613,976 | 852,677 | 87,581 | ||||||||||||
Written options | (159,001 | ) | 191,068 | (30,395 | ) | (64,119 | ) | |||||||||
Net change in unrealized appreciation/depreciation | 427,976 | 940,334 | 1,001,064 | 44,870 | ||||||||||||
Net realized and unrealized gain on investments | 1,805,106 | 1,894,939 | 2,747,477 | 556,975 | ||||||||||||
Net increase in net assets from operations | $ | 2,269,643 | $ | 2,423,942 | $ | 3,358,274 | $ | 677,398 | ||||||||
The accompanying notes are an integral part of the financial statements.
27
TrueShares Structured Outcome ETFs
Statements of Operations
For the Year Ended December 31, 2023 (Continued)
TrueShares | TrueShares | TrueShares | TrueShares | |||||||||||||
Investment Income | ||||||||||||||||
Interest income | $ | 499,247 | $ | 672,827 | $ | 150,856 | $ | 136,005 | ||||||||
Total investment income | 499,247 | 672,827 | 150,856 | 136,005 | ||||||||||||
Expenses | ||||||||||||||||
Investment advisory fees | 88,862 | 110,589 | 28,427 | 25,730 | ||||||||||||
Interest expense | 60 | — | 143 | 134 | ||||||||||||
Total expenses | 88,922 | 110,589 | 28,570 | 25,864 | ||||||||||||
Net investment income | 410,325 | 562,238 | 122,286 | 110,141 | ||||||||||||
Realized and Unrealized Gain (Loss) on Investments | ||||||||||||||||
Net realized gain (loss) on: | ||||||||||||||||
Investments | (3,602 | ) | (2,860 | ) | (732 | ) | 183,931 | |||||||||
Purchased options | (493,356 | ) | 304,311 | 462,062 | 46,678 | |||||||||||
Written options | 504,069 | 341,280 | 163,469 | 25 | ||||||||||||
Net realized gain | 7,111 | 642,731 | 624,799 | 230,634 | ||||||||||||
Net change in unrealized appreciation/depreciation on: | ||||||||||||||||
Investments | 66,875 | 114,806 | - | 4,641 | ||||||||||||
Purchased options | 1,380,157 | 915,443 | (31 | ) | 165,297 | |||||||||||
Written options | 238,720 | 303,063 | (43 | ) | 101,416 | |||||||||||
Net change in unrealized appreciation/depreciation | 1,685,752 | 1,333,312 | (74 | ) | 271,354 | |||||||||||
Net realized and unrealized gain on investments | 1,692,863 | 1,976,043 | 624,725 | 501,988 | ||||||||||||
Net increase in net assets from operations | $ | 2,103,188 | $ | 2,538,281 | $ | 747,011 | $ | 612,129 | ||||||||
The accompanying notes are an integral part of the financial statements.
28
TrueShares Structured Outcome ETFs
Statements of Operations
For the Year Ended December 31, 2023 (Continued)
TrueShares | TrueShares | TrueShares | TrueShares | |||||||||||||
Investment Income | ||||||||||||||||
Interest income | $ | 157,856 | $ | 185,977 | $ | 153,458 | $ | 171,850 | ||||||||
Total investment income | 157,856 | 185,977 | 153,458 | 171,850 | ||||||||||||
Expenses | ||||||||||||||||
Investment advisory fees | 30,863 | 40,019 | 31,801 | 33,885 | ||||||||||||
Interest expense | 12 | 17 | — | 14 | ||||||||||||
Total expenses | 30,875 | 40,036 | 31,801 | 33,899 | ||||||||||||
Net investment income | 126,981 | 145,941 | 121,657 | 137,951 | ||||||||||||
Realized and Unrealized Gain (Loss) on Investments | ||||||||||||||||
Net realized gain (loss) on: | ||||||||||||||||
Investments | 650 | (9,074 | ) | (398 | ) | (9,801 | ) | |||||||||
Purchased options | 40,421 | (369,722 | ) | (266,246 | ) | 83,779 | ||||||||||
Written options | 200,305 | 321,433 | 235,607 | 299,255 | ||||||||||||
Net realized gain (loss) | 241,376 | (57,363 | ) | (31,037 | ) | 373,233 | ||||||||||
Net change in unrealized appreciation/depreciation on: | ||||||||||||||||
Investments | 15,925 | 27,330 | 18,653 | 26,772 | ||||||||||||
Purchased options | 263,476 | 657,747 | 454,384 | 311,561 | ||||||||||||
Written options | 78,157 | 248,612 | 46,126 | 34,143 | ||||||||||||
Net change in unrealized appreciation/depreciation | 357,558 | 933,689 | 519,163 | 372,476 | ||||||||||||
Net realized and unrealized gain on investments | 598,934 | 876,326 | 488,126 | 745,709 | ||||||||||||
Net increase in net assets from operations | $ | 725,915 | $ | 1,022,267 | $ | 609,783 | $ | 883,660 | ||||||||
The accompanying notes are an integral part of the financial statements.
29
TrueShares Structured Outcome ETFs
Statements of Changes in Net Assets
TrueShares Structured | TrueShares Structured | |||||||||||||||
Year Ended | Year Ended | Year Ended | Year Ended | |||||||||||||
From Operations | ||||||||||||||||
Net investment income | $ | 464,537 | $ | 64,777 | $ | 529,003 | $ | 78,427 | ||||||||
Net realized gain (loss) on investments, purchased options and written options | 1,377,130 | (447,076 | ) | 954,605 | (152,816 | ) | ||||||||||
Net change in unrealized appreciation/depreciation on investments, purchased options and written options | 427,976 | (993,945 | ) | 940,334 | (1,782,216 | ) | ||||||||||
Net increase (decrease) in net assets resulting from operations | 2,269,643 | (1,376,244 | ) | 2,423,942 | (1,856,605 | ) | ||||||||||
From Distributions | ||||||||||||||||
Distributable earnings | (467,976 | ) | (8,369 | ) | (528,891 | ) | (52,402 | ) | ||||||||
Total distributions | (467,976 | ) | (8,369 | ) | (528,891 | ) | (52,402 | ) | ||||||||
From Capital Share Transactions | ||||||||||||||||
Proceeds from shares sold | 17,524,625 | 825,110 | 24,728,402 | 1,552,810 | ||||||||||||
Cost of shares redeemed | (18,234,425 | ) | (2,464,597 | ) | (23,899,508 | ) | (5,421,015 | ) | ||||||||
Transaction fees (Note 4) | 4,984 | 658 | 4,448 | 1,395 | ||||||||||||
Net increase (decrease) in net assets resulting from capital share transactions | (704,816 | ) | (1,638,829 | ) | 833,342 | (3,866,810 | ) | |||||||||
Total Increase (Decrease) in Net Assets | 1,096,851 | (3,023,442 | ) | 2,728,393 | (5,775,817 | ) | ||||||||||
Net Assets | ||||||||||||||||
Beginning of year | 11,939,377 | 14,962,819 | 12,760,535 | 18,536,352 | ||||||||||||
End of year | $ | 13,036,228 | $ | 11,939,377 | $ | 15,488,928 | $ | 12,760,535 | ||||||||
Changes in Shares Outstanding | ||||||||||||||||
Shares outstanding, beginning of year | 375,000 | 425,000 | 425,000 | 550,000 | ||||||||||||
Shares sold | 500,000 | 25,000 | 750,000 | 50,000 | ||||||||||||
Shares redeemed | (515,000 | ) | (75,000 | ) | (720,000 | ) | (175,000 | ) | ||||||||
Shares outstanding, end of year | 360,000 | 375,000 | 455,000 | 425,000 | ||||||||||||
The accompanying notes are an integral part of the financial statements.
30
TrueShares Structured Outcome ETFs
Statements of Changes in Net Assets
(Continued)
TrueShares Structured | TrueShares Structured | |||||||||||||||
Year Ended | Year Ended | Year Ended | Year Ended | |||||||||||||
From Operations | ||||||||||||||||
Net investment income | $ | 610,797 | $ | 142,160 | $ | 120,423 | $ | 29,464 | ||||||||
Net realized gain (loss) on investments, purchased options and written options | 1,746,413 | (841,784 | ) | 512,105 | (500,538 | ) | ||||||||||
Net change in unrealized appreciation/depreciation on investments, purchased options and written options | 1,001,064 | (1,546,738 | ) | 44,870 | (267,860 | ) | ||||||||||
Net increase (decrease) in net assets resulting from operations | 3,358,274 | (2,246,362 | ) | 677,398 | (738,934 | ) | ||||||||||
From Distributions | ||||||||||||||||
Distributable earnings | (611,030 | ) | (142,172 | ) | (120,431 | ) | (29,502 | ) | ||||||||
Total distributions | (611,030 | ) | (142,172 | ) | (120,431 | ) | (29,502 | ) | ||||||||
From Capital Share Transactions | ||||||||||||||||
Proceeds from shares sold | 18,931,165 | 5,282,900 | 3,486,747 | 710,545 | ||||||||||||
Cost of shares redeemed | (25,048,972 | ) | (8,159,950 | ) | (4,746,859 | ) | (3,754,253 | ) | ||||||||
Transaction fees (Note 4) | 1,840 | 2,689 | 629 | 893 | ||||||||||||
Net decrease in net assets resulting from capital share transactions | (6,115,967 | ) | (2,874,361 | ) | (1,259,483 | ) | (3,042,815 | ) | ||||||||
Total Decrease in Net Assets | (3,368,723 | ) | (5,262,895 | ) | (702,516 | ) | (3,811,251 | ) | ||||||||
Net Assets | ||||||||||||||||
Beginning of year | 20,598,385 | 25,861,280 | 4,377,317 | 8,188,568 | ||||||||||||
End of year | $ | 17,229,662 | $ | 20,598,385 | $ | 3,674,801 | $ | 4,377,317 | ||||||||
Changes in Shares Outstanding | ||||||||||||||||
Shares outstanding, beginning of year | 700,000 | 800,000 | 150,000 | 250,000 | ||||||||||||
Shares sold | 580,000 | 175,000 | 110,000 | 25,000 | ||||||||||||
Shares redeemed | (765,000 | ) | (275,000 | ) | (150,000 | ) | (125,000 | ) | ||||||||
Shares outstanding, end of year | 515,000 | 700,000 | 110,000 | 150,000 | ||||||||||||
The accompanying notes are an integral part of the financial statements.
31
TrueShares Structured Outcome ETFs
Statements of Changes in Net Assets
(Continued)
TrueShares Structured | TrueShares Structured | |||||||||||||||
Year Ended | Year Ended | Year Ended | Year Ended | |||||||||||||
From Operations | ||||||||||||||||
Net investment income (loss) | $ | 410,325 | $ | 27,593 | $ | 562,238 | $ | (11,564 | ) | |||||||
Net realized gain (loss) on investments, purchased options and written options | 7,111 | (1,145,771 | ) | 642,731 | (295,446 | ) | ||||||||||
Net change in unrealized appreciation/depreciation on investments, purchased options and written options | 1,685,752 | (347,523 | ) | 1,333,312 | (396,354 | ) | ||||||||||
Net increase (decrease) in net assets resulting from operations | 2,103,188 | (1,465,701 | ) | 2,538,281 | (703,364 | ) | ||||||||||
From Distributions | ||||||||||||||||
Distributable earnings | (410,218 | ) | (24,115 | ) | (483,192 | ) | (78,840 | ) | ||||||||
Total distributions | (410,218 | ) | (24,115 | ) | (483,192 | ) | (78,840 | ) | ||||||||
From Capital Share Transactions | ||||||||||||||||
Proceeds from shares sold | 9,982,697 | 769,145 | 67,518,061 | 2,907,555 | ||||||||||||
Cost of shares redeemed | (3,377,846 | ) | (3,688,620 | ) | (34,877,739 | ) | (2,739,967 | ) | ||||||||
Transaction fees (Note 4) | 2,672 | 1,058 | 6,884 | 1,130 | ||||||||||||
Net increase (decrease) in net assets resulting from capital share transactions | 6,607,523 | (2,918,417 | ) | 32,647,206 | 168,718 | |||||||||||
Total Increase (Decrease) in Net Assets | 8,300,493 | (4,408,233 | ) | 34,702,295 | (613,486 | ) | ||||||||||
Net Assets | ||||||||||||||||
Beginning of year | 9,772,343 | 14,180,576 | 5,472,312 | 6,085,798 | ||||||||||||
End of year | $ | 18,072,836 | $ | 9,772,343 | $ | 40,174,607 | $ | 5,472,312 | ||||||||
Changes in Shares Outstanding | ||||||||||||||||
Shares outstanding, beginning of year | 325,000 | 425,000 | 200,000 | 200,000 | ||||||||||||
Shares sold | 300,000 | 25,000 | 2,180,000 | 100,000 | ||||||||||||
Shares redeemed | (105,000 | ) | (125,000 | ) | (1,120,000 | ) | (100,000 | ) | ||||||||
Shares outstanding, end of year | 520,000 | 325,000 | 1,260,000 | 200,000 | ||||||||||||
The accompanying notes are an integral part of the financial statements.
32
TrueShares Structured Outcome ETFs
Statements of Changes in Net Assets
(Continued)
TrueShares Structured | TrueShares Structured | |||||||||||||||
Year Ended | Year Ended | Year Ended | Year Ended | |||||||||||||
From Operations | ||||||||||||||||
Net investment income (loss) | $ | 122,286 | $ | (13,936 | ) | $ | 110,141 | $ | (3,026 | ) | ||||||
Net realized gain (loss) on investments, purchased options and written options | 624,799 | (495,703 | ) | 230,634 | 123,088 | |||||||||||
Net change in unrealized appreciation/depreciation on investments, purchased options and written options | (74 | ) | 9,717 | 271,354 | (465,195 | ) | ||||||||||
Net increase (decrease) in net assets resulting from operations | 747,011 | (499,922 | ) | 612,129 | (345,133 | ) | ||||||||||
From Distributions | ||||||||||||||||
Distributable earnings | (123,195 | ) | (8,073 | ) | (249,641 | ) | — | |||||||||
Total distributions | (123,195 | ) | (8,073 | ) | (249,641 | ) | — | |||||||||
From Capital Share Transactions | ||||||||||||||||
Proceeds from shares sold | 7,407,427 | 2,823,720 | 598,630 | 3,537,113 | ||||||||||||
Cost of shares redeemed | (6,520,236 | ) | (632,698 | ) | — | (4,256,143 | ) | |||||||||
Transaction fees (Note 4) | 839 | 691 | 120 | 133 | ||||||||||||
Net increase (decrease) in net assets resulting from capital share transactions | 888,030 | 2,191,713 | 598,750 | (718,897 | ) | |||||||||||
Total Increase (Decrease) in Net Assets | 1,511,846 | 1,683,718 | 961,238 | (1,064,030 | ) | |||||||||||
Net Assets | ||||||||||||||||
Beginning of year | 3,865,859 | 2,182,141 | 2,704,216 | 3,768,246 | ||||||||||||
End of year | $ | 5,377,705 | $ | 3,865,859 | $ | 3,665,454 | $ | 2,704,216 | ||||||||
Changes in Shares Outstanding | ||||||||||||||||
Shares outstanding, beginning of year | 150,000 | 75,000 | 100,000 | 125,000 | ||||||||||||
Shares sold | 250,000 | 100,000 | 20,000 | 125,000 | ||||||||||||
Shares redeemed | (220,000 | ) | (25,000 | ) | — | (150,000 | ) | |||||||||
Shares outstanding, end of year | 180,000 | 150,000 | 120,000 | 100,000 | ||||||||||||
The accompanying notes are an integral part of the financial statements.
33
TrueShares Structured Outcome ETFs
Statements of Changes in Net Assets
(Continued)
TrueShares Structured | TrueShares Structured | |||||||||||||||
Year Ended | Year Ended | Year Ended | Year Ended | |||||||||||||
From Operations | ||||||||||||||||
Net investment income | $ | 126,981 | $ | 1,583 | $ | 145,941 | $ | 33,062 | ||||||||
Net realized gain (loss) on investments, purchased options and written options | 241,376 | 187,620 | (57,363 | ) | 409,156 | |||||||||||
Net change in unrealized appreciation/depreciation on investments, purchased options and written options | 357,558 | (937,517 | ) | 933,689 | (1,159,867 | ) | ||||||||||
Net increase (decrease) in net assets resulting from operations | 725,915 | (748,314 | ) | 1,022,267 | (717,649 | ) | ||||||||||
From Distributions | ||||||||||||||||
Distributable earnings | (284,981 | ) | (29,055 | ) | (145,986 | ) | (33,064 | ) | ||||||||
Total distributions | (284,981 | ) | (29,055 | ) | (145,986 | ) | (33,064 | ) | ||||||||
From Capital Share Transactions | ||||||||||||||||
Proceeds from shares sold | 267,159 | 5,942,770 | — | 7,484,830 | ||||||||||||
Cost of shares redeemed | (531,454 | ) | (7,174,000 | ) | (1,450,210 | ) | (7,500,717 | ) | ||||||||
Transaction fees (Note 4) | 160 | 773 | 290 | 796 | ||||||||||||
Net decrease in net assets resulting from capital share transactions | (264,135 | ) | (1,230,457 | ) | (1,449,920 | ) | (15,091 | ) | ||||||||
Total Increase (Decrease) in Net Assets | 176,799 | (2,007,826 | ) | (573,639 | ) | (765,804 | ) | |||||||||
Net Assets | ||||||||||||||||
Beginning of year | 3,715,676 | 5,723,502 | 5,623,641 | 6,389,445 | ||||||||||||
End of year | $ | 3,892,475 | $ | 3,715,676 | $ | 5,050,002 | $ | 5,623,641 | ||||||||
Changes in Shares Outstanding | ||||||||||||||||
Shares outstanding, beginning of year | 150,000 | 200,000 | 225,000 | 225,000 | ||||||||||||
Shares sold | 10,000 | 225,000 | — | 275,000 | ||||||||||||
Shares redeemed | (20,000 | ) | (275,000 | ) | (55,000 | ) | (275,000 | ) | ||||||||
Shares outstanding, end of year | 140,000 | 150,000 | 170,000 | 225,000 | ||||||||||||
The accompanying notes are an integral part of the financial statements.
34
TrueShares Structured Outcome ETFs
Statements of Changes in Net Assets
(Continued)
TrueShares Structured | TrueShares Structured | |||||||||||||||
Year Ended | Year Ended | Year Ended | Year Ended | |||||||||||||
From Operations | ||||||||||||||||
Net investment income | $ | 121,657 | $ | 23,907 | $ | 137,951 | $ | 16,664 | ||||||||
Net realized gain (loss) on investments, purchased options and written options | (31,037 | ) | (164,620 | ) | 373,233 | (34,529 | ) | |||||||||
Net change in unrealized appreciation/depreciation on investments, purchased options and written options | 519,163 | (720,575 | ) | 372,476 | (496,415 | ) | ||||||||||
Net increase (decrease) in net assets resulting from operations | 609,783 | (861,288 | ) | 883,660 | (514,280 | ) | ||||||||||
From Distributions | ||||||||||||||||
Distributable earnings | (121,887 | ) | (23,776 | ) | (197,592 | ) | (16,658 | ) | ||||||||
Total distributions | (121,887 | ) | (23,776 | ) | (197,592 | ) | (16,658 | ) | ||||||||
From Capital Share Transactions | ||||||||||||||||
Proceeds from shares sold | 476,954 | 5,598,692 | 8,940,188 | 584,553 | ||||||||||||
Cost of shares redeemed | — | (6,662,275 | ) | (9,321,322 | ) | (1,198,208 | ) | |||||||||
Transaction fees (Note 4) | 95 | 486 | 3,652 | 123 | ||||||||||||
Net increase (decrease) in net assets resulting from capital share transactions | 477,049 | (1,063,097 | ) | (377,482 | ) | (613,532 | ) | |||||||||
Total Increase (Decrease) in Net Assets | 964,945 | (1,948,161 | ) | 308,586 | (1,144,470 | ) | ||||||||||
Net Assets | ||||||||||||||||
Beginning of year | 3,469,089 | 5,417,250 | 2,972,320 | 4,116,790 | ||||||||||||
End of year | $ | 4,434,034 | $ | 3,469,089 | $ | 3,280,906 | $ | 2,972,320 | ||||||||
Changes in Shares Outstanding | ||||||||||||||||
Shares outstanding, beginning of year | 150,000 | 200,000 | 125,000 | 150,000 | ||||||||||||
Shares sold | 20,000 | 225,000 | 360,000 | 25,000 | ||||||||||||
Shares redeemed | — | (275,000 | ) | (360,000 | ) | (50,000 | ) | |||||||||
Shares outstanding, end of year | 170,000 | 150,000 | 125,000 | 125,000 | ||||||||||||
The accompanying notes are an integral part of the financial statements.
35
TrueShares Structured Outcome ETFs
Financial Highlights
For a Share Outstanding Throughout each Period
Per Share | ||||||||||||||||||||||||||||
Income from | Less | |||||||||||||||||||||||||||
Net Asset | Net | Net realized | Total from | Net | Net realized | Total | ||||||||||||||||||||||
TrueShares Structured Outcome (July) ETF | ||||||||||||||||||||||||||||
For the year 01/01/2023- 12/31/2023 | $ | 31.84 | 1.15 | 4.51 | 5.66 | (1.30 | ) | — | (1.30 | ) | ||||||||||||||||||
For the year 01/01/2022 - 12/31/2022 | $ | 35.21 | 0.16 | (3.51 | ) | (3.35 | ) | (0.02 | ) | — | (0.02 | ) | ||||||||||||||||
For the year 01/01/2021 - 12/31/2021 | $ | 29.20 | (0.25 | ) | 6.25 | 6.00 | — | — | — | |||||||||||||||||||
For the period 7/01/2020(7) — 12/31/2020 | $ | 25.00 | (0.09 | ) | 4.29 | 4.20 | — | — | — | |||||||||||||||||||
TrueShares Structured Outcome (August) ETF | ||||||||||||||||||||||||||||
For the year 01/01/2023- 12/31/2023 | $ | 30.02 | 1.14 | 4.03 | 5.17 | (1.16 | ) | — | (1.16 | ) | ||||||||||||||||||
For the year 01/01/2022 - 12/31/2022 | $ | 33.70 | 0.16 | (3.72 | ) | (3.56 | ) | (0.12 | ) | — | (0.12 | ) | ||||||||||||||||
For the year 01/01/2021 - 12/31/2021 | $ | 27.89 | (0.24 | ) | 6.04 | 5.80 | — | — | — | |||||||||||||||||||
For the period 8/03/2020(7) — 12/31/2020 | $ | 25.00 | (0.08 | ) | 2.96 | 2.88 | — | — | — | |||||||||||||||||||
TrueShares Structured Outcome (September) ETF | ||||||||||||||||||||||||||||
For the year 01/01/2023- 12/31/2023 | $ | 29.43 | 1.00 | 4.22 | 5.22 | (1.19 | ) | — | (1.19 | ) | ||||||||||||||||||
For the year 01/01/2022 - 12/31/2022 | $ | 32.33 | 0.18 | (2.88 | ) | (2.70 | ) | (0.20 | ) | — | (0.20 | ) | ||||||||||||||||
For the year 01/01/2021 - 12/31/2021 | $ | 26.63 | (0.23 | ) | 5.94 | 5.71 | — | (0.02 | ) | (0.02 | ) | |||||||||||||||||
For the period 9/01/2020(7) — 12/31/2020 | $ | 25.00 | (0.06 | ) | 1.68 | 1.62 | — | — | — | |||||||||||||||||||
TrueShares Structured Outcome (October) ETF | ||||||||||||||||||||||||||||
For the year 01/01/2023- 12/31/2023 | $ | 29.18 | 1.00 | 4.31 | 5.31 | (1.09 | ) | — | (1.09 | ) | ||||||||||||||||||
For the year 01/01/2022 - 12/31/2022 | $ | 32.75 | 0.14 | (3.51 | ) | (3.37 | ) | (0.20 | ) | — | (0.20 | ) | ||||||||||||||||
For the year 01/01/2021 - 12/31/2021 | $ | 27.21 | (0.23 | ) | 5.77 | 5.54 | — | — | — | |||||||||||||||||||
For the period 10/01/2020(7) — 12/31/2020 | $ | 25.00 | (0.05 | ) | 2.26 | 2.21 | — | — | — | |||||||||||||||||||
(1) | Per share net investment income (loss) was calculated using average shares outstanding. |
(2) | Annualized for periods less than one year. |
(3) | Total return in the table represents the rate that the investor would have earned or lost on an investment in the Fund, assuming reinvestment of dividends. |
(4) | Not annualized for periods less than one year. |
(5) | Excludes in-kind transactions associated with creations and redemptions of the Fund. |
(6) | The returns reflect the actual performance for the period and do not include the impact of trades executed on the last business day of the period that were recorded on the first business day of the next period. |
(7) | Commencement of operations. |
(8) | Less than $0.005. |
(9) | Includes interest expense of 0.01%. |
The accompanying notes are an integral part of the financial statements.
36
TrueShares Structured Outcome ETFs
Financial Highlights
For a Share Outstanding Throughout each Period (Continued)
Per Share | Ratios/ | ||||||||||||||||||||||||||||||
Capital Share | Ratios to | ||||||||||||||||||||||||||||||
Transaction fees | Net Asset Value, | Total return, | Total return, | Net assets, | Expenses | Net investment | Portfolio | ||||||||||||||||||||||||
| 0.01 | $ | 36.21 | 17.81 | % | 17.65 | % | $ | 13,036 | 0.79 | % | 3.31 | % | 0 | % | |||||||||||||||||
| 0.00 | (8) | $ | 31.84 | (9.50 | )% | (9.35 | )% | $ | 11,939 | 0.79 | % | 0.49 | % | 0 | % | ||||||||||||||||
| 0.01 | $ | 35.21 | 20.56 | % | 20.66 | % | $ | 14,963 | 0.79 | % | (0.76 | )% | 1307 | % | |||||||||||||||||
| 0.00 | (8) | $ | 29.20 | 16.81 | % | 16.55 | % | $ | 6,571 | 0.79 | % | (0.68 | )% | 0 | % | ||||||||||||||||
| 0.01 | $ | 34.04 | 17.25 | % | 17.33 | % | $ | 15,489 | 0.79 | % | 3.51 | % | 228 | % | |||||||||||||||||
| 0.00 | (8) | $ | 30.02 | (10.55 | )% | (10.42 | )% | $ | 12,761 | 0.80 | %(9) | 0.51 | % | 134 | % | ||||||||||||||||
| 0.01 | $ | 33.70 | 20.83 | % | 20.74 | % | $ | 18,536 | 0.79 | % | (0.77 | )% | 1297 | % | |||||||||||||||||
| 0.01 | $ | 27.89 | 11.57 | % | 11.31 | % | $ | 9,065 | 0.79 | % | (0.73 | )% | 0 | % | |||||||||||||||||
| 0.00 | (8) | $ | 33.46 | 17.72 | % | 17.94 | % | $ | 17,230 | 0.79 | % | 3.15 | % | 0 | % | ||||||||||||||||
| 0.00 | (8) | $ | 29.43 | (8.34 | )% | (8.51 | )% | $ | 20,598 | 0.79 | % | 0.60 | % | 0 | % | ||||||||||||||||
| 0.01 | $ | 32.33 | 21.47 | % | 21.83 | % | $ | 25,861 | 0.79 | % | (0.76 | )% | 1301 | % | |||||||||||||||||
| 0.01 | $ | 26.63 | 6.51 | % | 6.08 | % | $ | 10,651 | 0.79 | % | (0.73 | )% | 0 | % | |||||||||||||||||
| 0.01 | $ | 33.41 | 18.23 | % | 18.18 | % | $ | 3,675 | 0.79 | % | 3.19 | % | 3 | % | |||||||||||||||||
| 0.00 | (8) | $ | 29.18 | (10.31 | )% | (10.23 | )% | $ | 4,377 | 0.79 | % | 0.48 | % | 0 | % | ||||||||||||||||
| 0.00 | (8) | $ | 32.75 | 20.37 | % | 20.49 | % | $ | 8,189 | 0.79 | % | (0.77 | )% | 1021 | % | ||||||||||||||||
| 0.00 | (8) | $ | 27.21 | 8.85 | % | 8.57 | % | $ | 4,082 | 0.79 | % | (0.73 | )% | 0 | % | ||||||||||||||||
The accompanying notes are an integral part of the financial statements.
37
TrueShares Structured Outcome ETFs
Financial Highlights
For a Share Outstanding Throughout each Period (Continued)
Per Share | ||||||||||||||||||||||||||||
Income from | Less | |||||||||||||||||||||||||||
Net Asset | Net | Net realized | Total from | Net | Net realized | Total | ||||||||||||||||||||||
TrueShares Structured Outcome (November) ETF | ||||||||||||||||||||||||||||
For the year 01/01/2023- 12/31/2023 | $ | 30.07 | 1.20 | 4.27 | 5.47 | (0.79 | ) | — | (0.79 | ) | ||||||||||||||||||
For the year 01/01/2022 - 12/31/2022 | $ | 33.37 | 0.07 | (3.30 | ) | (3.23 | ) | (0.07 | ) | — | (0.07 | ) | ||||||||||||||||
For the year 01/01/2021 - 12/31/2021 | $ | 27.62 | (0.24 | ) | 6.14 | 5.90 | — | (0.17 | ) | (0.17 | ) | |||||||||||||||||
For the period 11/02/2020(7) — 12/31/2020 | $ | 25.00 | (0.03 | ) | 2.65 | 2.62 | — | — | — | |||||||||||||||||||
TrueShares Structured Outcome (December) ETF | ||||||||||||||||||||||||||||
For the year 01/01/2023- 12/31/2023 | $ | 27.36 | 1.22 | 3.68 | 4.90 | (0.39 | ) | — | (0.39 | ) | ||||||||||||||||||
For the year 01/01/2022 - 12/31/2022 | $ | 30.43 | (0.05 | ) | (2.63 | ) | (2.68 | ) | — | (0.39 | ) | (0.39 | ) | |||||||||||||||
For the year 01/01/2021 - 12/31/2021 | $ | 25.44 | (0.21 | ) | 5.33 | 5.12 | — | (0.14 | ) | (0.14 | ) | |||||||||||||||||
For the period 12/01/2020(7) — 12/31/2020 | $ | 25.00 | (0.02 | ) | 0.46 | 0.44 | — | — | — | |||||||||||||||||||
TrueShares Structured Outcome (January) ETF | ||||||||||||||||||||||||||||
For the year 01/01/2023- 12/31/2023 | $ | 25.77 | 0.95 | 3.92 | 4.87 | (0.77 | ) | — | (0.77 | ) | ||||||||||||||||||
For the year 01/01/2022 - 12/31/2022 | $ | 29.10 | (0.08 | ) | (3.20 | ) | (3.28 | ) | — | (0.05 | ) | (0.05 | ) | |||||||||||||||
For the period 01/04/2021(7) — 12/31/2021 | $ | 25.00 | (0.19 | ) | 5.61 | 5.42 | — | (1.32 | ) | (1.32 | ) | |||||||||||||||||
TrueShares Structured Outcome (February) ETF | ||||||||||||||||||||||||||||
For the year 01/01/2023- 12/31/2023 | $ | 27.04 | 1.01 | 4.58 | 5.59 | (0.92 | ) | (1.16 | ) | (2.08 | ) | |||||||||||||||||
For the year 01/01/2022 - 12/31/2022 | $ | 30.15 | (0.02 | ) | (3.09 | ) | (3.11 | ) | — | — | — | |||||||||||||||||
For the period 02/01/2021(7) — 12/31/2021 | $ | 25.00 | (0.20 | ) | 5.35 | 5.15 | — | — | — | |||||||||||||||||||
(1) | Per share net investment income (loss) was calculated using average shares outstanding. |
(2) | Annualized for periods less than one year. |
(3) | Total return in the table represents the rate that the investor would have earned or lost on an investment in the Fund, assuming reinvestment of dividends. |
(4) | Not annualized for periods less than one year. |
(5) | Excludes in-kind transactions associated with creations and redemptions of the Fund. |
(6) | The returns reflect the actual performance for the period and do not include the impact of trades executed on the last business day of the period that were recorded on the first business day of the next period. |
(7) | Commencement of operations. |
(8) | Less than $0.005. |
(9) | Includes interest expense of 0.01%. |
The accompanying notes are an integral part of the financial statements.
38
TrueShares Structured Outcome ETFs
Financial Highlights
For a Share Outstanding Throughout each Period (Continued)
Per Share | Ratios/ | ||||||||||||||||||||||||||||||
Capital Share | Ratios to | ||||||||||||||||||||||||||||||
Transaction fees | Net Asset Value, | Total return, | Total return, | Net assets, | Expenses | Net investment | Portfolio | ||||||||||||||||||||||||
| 0.01 | $ | 34.76 | 18.21 | % | 18.07 | % | $ | 18,073 | 0.79 | % | 3.65 | % | 0 | % | |||||||||||||||||
| 0.00 | (8) | $ | 30.07 | (9.66 | )% | (9.58 | )% | $ | 9,772 | 0.79 | % | 0.23 | % | 0 | % | ||||||||||||||||
| 0.02 | $ | 33.37 | 21.40 | % | 21.46 | % | $ | 14,181 | 0.79 | % | (0.76 | )% | 1302 | % | |||||||||||||||||
| 0.00 | (8) | $ | 27.62 | 10.51 | %(6) | 10.35 | %(6) | $ | 1,381 | 0.79 | % | (0.75 | )% | 0 | % | ||||||||||||||||
| 0.01 | $ | 31.88 | 17.97 | % | 18.32 | % | $ | 40,175 | 0.79 | % | 4.02 | % | 0 | % | |||||||||||||||||
| 0.00 | (8) | $ | 27.36 | (8.80 | )% | (8.94 | )% | $ | 5,472 | 0.80 | %(9) | (0.17 | )% | 0 | % | ||||||||||||||||
| 0.01 | $ | 30.43 | 20.17 | % | 20.15 | % | $ | 6,086 | 0.79 | % | (0.77 | )% | 1286 | % | |||||||||||||||||
| 0.00 | (8) | $ | 25.44 | 1.75 | % | 1.72 | % | $ | 5,723 | 0.79 | % | (0.74 | )% | 0 | % | ||||||||||||||||
| 0.01 | $ | 29.88 | 18.91 | % | 19.10 | % | $ | 5,378 | 0.79 | % | 3.40 | % | 0 | % | |||||||||||||||||
| 0.00 | (8) | $ | 25.77 | (11.29 | )% | (11.43 | )% | $ | 3,866 | 0.79 | % | (0.32 | )% | 2899 | % | ||||||||||||||||
| 0.00 | (8) | $ | 29.10 | 21.65 | % | 21.66 | % | $ | 2,182 | 0.79 | % | (0.77 | )% | 0 | % | ||||||||||||||||
| 0.00 | (8) | $ | 30.55 | 20.64 | % | 20.66 | % | $ | 3,665 | 0.79 | % | 3.38 | % | 0 | % | ||||||||||||||||
| 0.00 | (8) | $ | 27.04 | (10.30 | )% | (10.32 | )% | $ | 2,704 | 0.79 | % | (0.09 | )% | 1309 | % | ||||||||||||||||
| 0.00 | (8) | $ | 30.15 | 20.58 | % | 20.56 | % | $ | 3,768 | 0.79 | % | (0.77 | )% | 0 | % | ||||||||||||||||
The accompanying notes are an integral part of the financial statements.
39
TrueShares Structured Outcome ETFs
Financial Highlights
For a Share Outstanding Throughout each Period (Continued)
Per Share | ||||||||||||||||||||||||||||
Income from | Less | |||||||||||||||||||||||||||
Net Asset | Net | Net realized | Total from | Net | Net realized | Total | ||||||||||||||||||||||
TrueShares Structured Outcome (March) ETF | ||||||||||||||||||||||||||||
For the year 01/01/2023- 12/31/2023 | $ | 24.77 | 0.88 | 4.19 | 5.07 | (0.91 | ) | (1.13 | ) | (2.04 | ) | |||||||||||||||||
For the year 01/01/2022 - 12/31/2022 | $ | 28.62 | 0.01 | (3.67 | ) | (3.66 | ) | (0.01 | ) | (0.18 | ) | (0.19 | ) | |||||||||||||||
For the period 03/01/2021(7) — 12/31/2021 | $ | 25.00 | (0.17 | ) | 4.48 | 4.31 | (0.70 | ) | (0.70 | ) | ||||||||||||||||||
TrueShares Structured Outcome (April) ETF | ||||||||||||||||||||||||||||
For the year 01/01/2023- 12/31/2023 | $ | 24.99 | 0.80 | 4.78 | 5.58 | (0.86 | ) | — | (0.86 | ) | ||||||||||||||||||
For the year 01/01/2022 - 12/31/2022 | $ | 28.40 | 0.14 | (3.40 | ) | (3.26 | ) | (0.15 | ) | — | (0.15 | ) | ||||||||||||||||
For the period 04/01/2021(7) — 12/31/2021 | $ | 25.00 | (0.16 | ) | 3.56 | 3.40 | — | — | — | |||||||||||||||||||
TrueShares Structured Outcome (May) ETF | ||||||||||||||||||||||||||||
For the year 01/01/2023- 12/31/2023 | $ | 23.13 | 0.75 | 2.92 | 3.67 | (0.72 | ) | — | (0.72 | ) | ||||||||||||||||||
For the year 01/01/2022 - 12/31/2022 | $ | 27.09 | 0.13 | (3.93 | ) | (3.80 | ) | (0.16 | ) | — | (0.16 | ) | ||||||||||||||||
For the period 05/03/2021(7) — 12/31/2021 | $ | 25.00 | (0.13 | ) | 2.72 | 2.59 | — | (0.51 | ) | (0.51 | ) | |||||||||||||||||
TrueShares Structured Outcome (June) ETF | ||||||||||||||||||||||||||||
For the year 01/01/2023- 12/31/2023 | $ | 23.78 | 0.82 | 3.21 | 4.03 | (1.10 | ) | (0.48 | ) | (1.58 | ) | |||||||||||||||||
For the year 01/01/2022 - 12/31/2022 | $ | 27.45 | 0.11 | (3.65 | ) | (3.54 | ) | (0.13 | ) | — | (0.13 | ) | ||||||||||||||||
For the period 06/01/2021(7) — 12/31/2021 | $ | 25.00 | (0.12 | ) | 2.66 | 2.54 | — | (0.09 | ) | (0.09 | ) | |||||||||||||||||
(1) | Per share net investment income (loss) was calculated using average shares outstanding. |
(2) | Annualized for periods less than one year. |
(3) | Total return in the table represents the rate that the investor would have earned or lost on an investment in the Fund, assuming reinvestment of dividends. |
(4) | Not annualized for periods less than one year. |
(5) | Excludes in-kind transactions associated with creations and redemptions of the Fund. |
(6) | The returns reflect the actual performance for the period and do not include the impact of trades executed on the last business day of the period that were recorded on the first business day of the next period. |
(7) | Commencement of operations. |
(8) | Less than $0.005. |
(9) | Includes interest expense of 0.01%. |
The accompanying notes are an integral part of the financial statements.
40
TrueShares Structured Outcome ETFs
Financial Highlights
For a Share Outstanding Throughout each Period (Continued)
Per Share | Ratios/ | ||||||||||||||||||||||||||||||
Capital Share | Ratios to | ||||||||||||||||||||||||||||||
Transaction fees | Net Asset Value, | Total return, | Total return, | Net assets, | Expenses | Net investment | Portfolio | ||||||||||||||||||||||||
| 0.00 | (8) | $ | 27.80 | 20.45 | % | 20.38 | % | $ | 3,892 | 0.79 | % | 3.25 | % | 67 | % | ||||||||||||||||
| 0.00 | (8) | $ | 24.77 | (12.76 | )% | (12.70 | )% | $ | 3,716 | 0.79 | % | 0.03 | % | 1280 | % | ||||||||||||||||
| 0.01 | $ | 28.62 | 17.24 | % | 17.14 | % | $ | 5,724 | 0.79 | % | (0.76 | )% | 0 | % | |||||||||||||||||
| 0.00 | (8) | $ | 29.71 | 22.28 | % | 22.23 | % | $ | 5,050 | 0.79 | % | 2.88 | % | 0 | % | ||||||||||||||||
| 0.00 | (8) | $ | 24.99 | (11.47 | )% | (11.43 | )% | $ | 5,624 | 0.79 | % | 0.55 | % | 1153 | % | ||||||||||||||||
| 0.00 | (8) | $ | 28.40 | 13.59 | % | 13.49 | % | $ | 6,389 | 0.79 | % | (0.77 | )% | 0 | % | ||||||||||||||||
| 0.00 | (8) | $ | 26.08 | 15.87 | % | 15.90 | % | $ | 4,434 | 0.79 | % | 3.02 | % | 0 | % | ||||||||||||||||
| 0.00 | (8) | $ | 23.13 | (14.03 | )% | (13.99 | )% | $ | 3,469 | 0.79 | % | 0.54 | % | 0 | % | ||||||||||||||||
| 0.01 | $ | 27.09 | 10.39 | % | 10.17 | % | $ | 5,417 | 0.79 | % | (0.77 | )% | 0 | % | |||||||||||||||||
| 0.02 | $ | 26.25 | 17.02 | % | 17.29 | % | $ | 3,281 | 0.79 | % | 3.22 | % | 637 | % | |||||||||||||||||
| 0.00 | (8) | $ | 23.78 | (12.87 | )% | (12.97 | )% | $ | 2,972 | 0.79 | % | 0.46 | % | 0 | % | ||||||||||||||||
| 0.00 | (8) | $ | 27.45 | 10.13 | % | 9.96 | % | $ | 4,117 | 0.79 | % | (0.77 | )% | 0 | % | ||||||||||||||||
The accompanying notes are an integral part of the financial statements.
41
TrueShares Structured Outcome ETFs
Notes to Financial Statements
December 31, 2023
1. ORGANIZATION
The TrueShares ETFs are a series of Listed Funds Trust (the “Trust”), formerly Active Weighting Funds ETF Trust. The Trust was organized as a Delaware statutory trust on August 26, 2016, under a Declaration of Trust amended on December 21, 2018 and is registered with the U.S. Securities and Exchange Commission (the “SEC”) as an open-end management investment company under the Investment Company Act of 1940, as amended (the “1940 Act”). As of December 31, 2023, the TrueShares ETFs consist of eighteen active series identified below, twelve of which are covered in this report (each a “Fund,” and collectively, the “Funds” or “Structured Outcome ETFs”).
Fund Name | Ticker | Diversified/ | Commencement |
TrueShares Structured Outcome (July) ETF (“JULZ ETF”) | JULZ | Diversified | July 1, 2020 |
TrueShares Structured Outcome (August) ETF (“AUGZ ETF”) | AUGZ | Diversified | August 3, 2020 |
TrueShares Structured Outcome (September) ETF (“SEPZ ETF”) | SEPZ | Diversified | September 1, 2020 |
TrueShares Structured Outcome (October) ETF (“OCTZ ETF”) | OCTZ | Diversified | October 1, 2020 |
TrueShares Structured Outcome (November) ETF (“NOVZ ETF”) | NOVZ | Diversified | November 2, 2020 |
TrueShares Structured Outcome (December) ETF (“DECZ ETF”) | DECZ | Diversified | December 1, 2020 |
TrueShares Structured Outcome (January) ETF (“JANZ ETF”) | JANZ | Non-Diversified | January 4, 2021 |
TrueShares Structured Outcome (February) ETF (“FEBZ ETF”) | FEBZ | Non-Diversified | February 1, 2021 |
TrueShares Structured Outcome (March) ETF (“MARZ ETF”) | MARZ | Non-Diversified | March 1, 2021 |
TrueShares Structured Outcome (April) ETF (“APRZ ETF”) | APRZ | Non-Diversified | April 1, 2021 |
TrueShares Structured Outcome (May) ETF (“MAYZ ETF”) | MAYZ | Non-Diversified | May 3, 2021 |
TrueShares Structured Outcome (June) ETF (“JUNZ ETF”) | JUNZ | Non-Diversified | June 1, 2021 |
The operational TrueShares ETFs covered outside of this report consists of:
Fund Name | Ticker | Diversified/ | Commencement |
TrueShares Technology, AI & Deep Learning ETF (“AI ETF”) | LRNZ | Non-diversified | February 28, 2020 |
TrueShares Low Volatility Equity Income ETF (“DIVZ ETF”) | DIVZ | Non-diversified | January 27, 2021 |
TrueShares Eagle Global Renewable Energy Income ETF (“RNWZ ETF”) | RNWZ | Non-diversified | December 8, 2022 |
RiverNorth Patriot ETF (“FLDZ ETF”) | FLDZ | Non-diversified | December 31, 2021 |
RiverNorth Enhanced Pre-Merger SPAC ETF (“SPCZ ETF”) | SPCZ | Non-diversified | July 11, 2022 |
Each Fund is an actively-managed exchange-traded fund (“ETF”) that seeks to achieve its total return investment objective by investing in Options that reference the S&P 500® Price Index, employing a “buffer protect” options strategies that uses such options to seek to achieve exposure to the S&P 500® Price Index while mitigating the first 8% to 12% decline in the S&P 500® Price Index over a 12-month period.
2. SIGNIFICANT ACCOUNTING POLICIES
Each Fund is an investment company and accordingly follows the investment company accounting and reporting guidance of the Financial Accounting Standards Board (“FASB”) Accounting Standards Codification (“ASC”) Topic 946, Financial Services — Investment Companies. Each Fund prepares its financial statements in accordance with accounting principles generally accepted in the United States of America (“U.S. GAAP”) and follows the significant accounting policies described below.
42
TrueShares Structured Outcome ETFs
Notes to Financial Statements
December 31, 2023 (Continued)
Use of Estimates
The preparation of the financial statements in conformity with U.S. GAAP requires management to make estimates and assumptions that affect the reported amounts of assets and liabilities and disclosures of contingent assets and liabilities at the date of the financial statements and the reported amounts of increases and decreases in net assets from operations during the reporting period. Actual results could differ from these estimates.
Share Transactions
The net asset value (“NAV”) per share of each Fund will be equal to a Fund’s total assets minus a Fund’s total liabilities divided by the total number of shares outstanding. The NAV that is published will be rounded to the nearest cent. The NAV is determined as of the close of trading (generally, 4:00 p.m. Eastern Time) on each day the New York Stock Exchange (“NYSE”) is open for trading.
Fair Value Measurement
In calculating the NAV, each Fund’s exchange-traded equity securities will be valued at fair value, which will generally be determined using the last reported official closing or last trading price on the exchange or market on which the security is primarily traded at the time of valuation. Such valuations are typically categorized as Level 1 in the fair value hierarchy described below.
Securities listed on the NASDAQ Stock Market, Inc. are generally valued at the NASDAQ official closing price.
Money market funds are valued at NAV. If NAV is not readily available the securities will be valued at fair value.
FASB ASC Topic 820, Fair Value Measurements and Disclosures (“ASC 820”) defines fair value, establishes a framework for measuring fair value in accordance with U.S. GAAP, and requires disclosure about fair value measurements. It also provides guidance on determining when there has been a significant decrease in the volume and level of activity for an asset or liability, when a transaction is not orderly, and how that information must be incorporated into fair value measurements. Under ASC 820, various inputs are used in determining the value of the Funds’ investments. These inputs are summarized in the following hierarchy:
● | Level 1 — Unadjusted quoted prices in active markets for identical assets or liabilities that the Funds have the ability to access. |
● | Level 2 — Observable inputs other than quoted prices included in Level 1 that are observable for the asset or liability, either directly or indirectly. These inputs may include quoted prices for the identical instrument on an inactive market, prices for similar securities, interest rates, prepayment speeds, credit risk, yield curves, default rates and similar data. |
● | Level 3 — Unobservable inputs for the asset or liability, to the extent relevant observable inputs are not available; representing the Funds’ own assumptions about the assumptions a market participant would use in valuing the asset or liability, and would be based on the best information available. |
The fair value hierarchy gives the highest priority to quoted prices (unadjusted) in active markets for identical assets or liabilities (Level 1) and the lowest priority to unobservable inputs (Level 3).
The availability of observable inputs can vary from security to security and is affected by a wide variety of factors, including, for example, the type of security, whether the security is new and not yet established in the marketplace, the liquidity of markets, and other characteristics particular to the security. To the extent that valuation is based on models or inputs that are less observable or unobservable in the market, the determination of fair value requires more judgment. Accordingly, the degree of judgment exercised in determining fair value is greatest for instruments categorized in Level 3.
If market quotations are not readily available, or if it is determined that a quotation of a security does not represent fair value, then the security is valued at fair value as determined in good faith by the Adviser using procedures adopted by the Board of Trustees of the Trust (the “Board”). The valuation of each Fund’s investments is performed in accordance with the principles found in Rule 2a-5 of the 1940 Act. The circumstances in which a security may be fair valued include, among others: the
43
TrueShares Structured Outcome ETFs
Notes to Financial Statements
December 31, 2023 (Continued)
occurrence of events that are significant to a particular issuer, such as mergers, restructurings or defaults; the occurrence of events that are significant to an entire market, such as natural disasters in a particular region or government actions; trading restrictions on securities; thinly traded securities; and market events such as trading halts and early market closings. Due to the inherent uncertainty of valuations, fair values may differ significantly from the values that would have been used had an active market existed. Fair valuation could result in a different NAV than a NAV determined by using market quotations. Such valuations are typically categorized as Level 2 or Level 3 in the fair value hierarchy described below.
Debt securities, including short-term debt instruments having a maturity of less than 60 days, are generally valued using the last available evaluated mean or current market quotations provided by dealers or prices (including evaluated prices) supplied by approved independent third-party pricing services. Pricing services may use matrix pricing or valuation models that utilize certain inputs and assumptions to derive values. Due to the inherent uncertainty of valuations, fair values may differ significantly from the values that would have been used had an active market existed. An amortized cost method of valuation may be used with respect to debt obligations with sixty days or less remaining to maturity, unless the Adviser determines in good faith that such method does not represent fair value.
Exchange-traded options are valued at the composite mean price, which calculates the mean of the highest bid price and lowest asked price across the exchange. On the last trading day prior to expiration, expiring options may be priced at intrinsic value. The premium a fund pays when purchasing a call or put option or receives when writing a call or put option will reflect, among other things, the market price of the security, the relationship of the exercise price to the market price of the security, the relationship of the exercise price to the volatility of the security, the length of the option period and supply and demand factors. The premium is the value of an option at the date of purchase.
FLexible EXchange Options (“FLEX Options”) are valued at a model-based price provided by the exchange on which the option is traded. If the exchange on which the option is traded is unable to provide a price, FLEX Options are valued at a model-based price provided by an approved secondary pricing service.
All other securities and investments for which market values are not readily available, including restricted securities, and those securities for which it is inappropriate to determine prices in accordance with the aforementioned procedures, are valued at fair value as determined in good faith under procedures adopted by the Board, although the actual calculations may be done by others. Factors considered in making this determination may include, but are not limited to, information obtained by contacting the issuer, analysts, or the appropriate stock exchange (for exchange-traded securities), analysis of the issuer’s financial statements or other available documents and, if necessary, available information concerning other securities in similar circumstances.
The inputs or methodology used for valuing securities are not necessarily an indication of the risk associated with investing in those securities. The hierarchy classification of inputs used to value the Funds’ investments at December 31, 2023, are as follows:
Level 1 | Level 2 | Level 3 | Total | |||||||||||||
TrueShares Structured Outcome (July) ETF | ||||||||||||||||
Investments - Assets: | ||||||||||||||||
Money Market Funds | $ | 43,615 | $ | — | $ | — | $ | 43,615 | ||||||||
U.S. Treasury Bills | — | 11,991,613 | — | 11,991,613 | ||||||||||||
Purchased Call Options | — | 1,102,262 | — | 1,102,262 | ||||||||||||
Total Investments - Assets | $ | 43,615 | $ | 13,093,875 | $ | — | $ | 13,137,490 | ||||||||
Other Financial Instruments - Liabilities: | ||||||||||||||||
Written Put Options | $ | — | $ | 96,373 | $ | — | $ | 96,373 | ||||||||
44
TrueShares Structured Outcome ETFs
Notes to Financial Statements
December 31, 2023 (Continued)
Level 1 | Level 2 | Level 3 | Total | |||||||||||||
TrueShares Structured Outcome (August) ETF | ||||||||||||||||
Investments - Assets: | ||||||||||||||||
Money Market Funds | $ | 8,078 | $ | — | $ | — | $ | 8,078 | ||||||||
U.S. Treasury Bills | — | 14,547,330 | — | 14,547,330 | ||||||||||||
Purchased Call Options | — | 1,082,914 | — | 1,082,914 | ||||||||||||
Total Investments - Assets | $ | 8,078 | $ | 15,630,244 | $ | — | $ | 15,638,322 | ||||||||
Other Financial Instruments - Liabilities: | ||||||||||||||||
Written Put Options | $ | — | $ | 174,122 | $ | — | $ | 174,122 | ||||||||
Level 1 | Level 2 | Level 3 | Total | |||||||||||||
TrueShares Structured Outcome (September) ETF | ||||||||||||||||
Investments - Assets: | ||||||||||||||||
Money Market Funds | $ | 32,364 | $ | — | $ | — | $ | 32,364 | ||||||||
U.S. Treasury Bills | — | 15,929,561 | — | 15,929,561 | ||||||||||||
Purchased Call Options | — | 1,461,156 | — | 1,461,156 | ||||||||||||
Total Investments - Assets | $ | 32,364 | $ | 17,390,717 | $ | — | $ | 17,423,081 | ||||||||
Other Financial Instruments - Liabilities: | ||||||||||||||||
Written Put Options | $ | — | $ | 204,047 | $ | — | $ | 204,047 | ||||||||
Level 1 | Level 2 | Level 3 | Total | |||||||||||||
TrueShares Structured Outcome (October) ETF | ||||||||||||||||
Investments - Assets: | ||||||||||||||||
Money Market Funds | $ | 14,908 | $ | — | $ | — | $ | 14,908 | ||||||||
U.S. Treasury Bills | — | 3,269,327 | — | 3,269,327 | ||||||||||||
Purchased Call Options | — | 431,269 | — | 431,269 | ||||||||||||
Total Investments - Assets | $ | 14,908 | $ | 3,700,596 | $ | — | $ | 3,715,504 | ||||||||
Other Financial Instruments - Liabilities: | ||||||||||||||||
Written Put Options | $ | — | $ | 38,936 | $ | — | $ | 38,936 | ||||||||
Level 1 | Level 2 | Level 3 | Total | |||||||||||||
TrueShares Structured Outcome (November) ETF | ||||||||||||||||
Investments - Assets: | ||||||||||||||||
Money Market Funds | $ | 23,644 | $ | — | $ | — | $ | 23,644 | ||||||||
U.S. Treasury Bills | — | 15,699,857 | — | 15,699,857 | ||||||||||||
Purchased Call Options | — | 2,510,045 | — | 2,510,045 | ||||||||||||
Total Investments - Assets | $ | 23,644 | $ | 18,209,902 | $ | — | $ | 18,233,546 | ||||||||
Other Financial Instruments - Liabilities: | ||||||||||||||||
Written Put Options | $ | — | $ | 195,859 | $ | — | $ | 195,859 | ||||||||
45
TrueShares Structured Outcome ETFs
Notes to Financial Statements
December 31, 2023 (Continued)
Level 1 | Level 2 | Level 3 | Total | |||||||||||||
TrueShares Structured Outcome (December) ETF | ||||||||||||||||
Investments - Assets: | ||||||||||||||||
Money Market Funds | $ | 334,979 | $ | — | $ | — | $ | 334,979 | ||||||||
U.S. Treasury Bills | — | 37,268,790 | — | 37,268,790 | ||||||||||||
Purchased Call Options | — | 3,391,035 | — | 3,391,035 | ||||||||||||
Total Investments - Assets | $ | 334,979 | $ | 40,659,825 | $ | — | $ | 40,994,804 | ||||||||
Other Financial Instruments - Liabilities: | ||||||||||||||||
Written Put Options | $ | — | $ | 777,004 | $ | — | $ | 777,004 | ||||||||
Level 1 | Level 2 | Level 3 | Total | |||||||||||||
TrueShares Structured Outcome (January) ETF | ||||||||||||||||
Investments - Assets: | ||||||||||||||||
Money Market Funds | $ | 3,978,685 | $ | — | $ | — | $ | 3,978,685 | ||||||||
Purchased Call Options | — | 344,696 | — | 344,696 | ||||||||||||
Total Investments - Assets | $ | 3,978,685 | 344,696 | $ | — | $ | 4,323,381 | |||||||||
Other Financial Instruments - Liabilities: | ||||||||||||||||
Written Put Options | $ | — | $ | 140,868 | $ | — | $ | 140,868 | ||||||||
Level 1 | Level 2 | Level 3 | Total | |||||||||||||
TrueShares Structured Outcome (February) ETF | ||||||||||||||||
Investments - Assets: | ||||||||||||||||
U.S. Treasury Bills | $ | — | $ | 3,334,740 | $ | — | $ | 3,334,740 | ||||||||
Purchased Call Options | — | 334,938 | — | 334,938 | ||||||||||||
Total Investments - Assets | $ | — | $ | 3,669,678 | $ | — | $ | 3,669,678 | ||||||||
Other Financial Instruments - Liabilities: | ||||||||||||||||
Written Put Options | $ | — | $ | 763 | $ | — | $ | 763 | ||||||||
Level 1 | Level 2 | Level 3 | Total | |||||||||||||
TrueShares Structured Outcome (March) ETF | ||||||||||||||||
Investments - Assets: | ||||||||||||||||
U.S. Treasury Bills | $ | — | $ | 3,465,074 | $ | — | $ | 3,465,074 | ||||||||
Purchased Call Options | — | 426,297 | — | 426,297 | ||||||||||||
Total Investments - Assets | $ | — | $ | 3,891,371 | $ | — | $ | 3,891,371 | ||||||||
Other Financial Instruments - Liabilities: | ||||||||||||||||
Written Put Options | $ | — | $ | 1,995 | $ | — | $ | 1,995 | ||||||||
46
TrueShares Structured Outcome ETFs
Notes to Financial Statements
December 31, 2023 (Continued)
Level 1 | Level 2 | Level 3 | Total | |||||||||||||
TrueShares Structured Outcome (April) ETF | ||||||||||||||||
Investments - Assets: | ||||||||||||||||
Money Market Funds | $ | 15,173 | $ | — | $ | — | $ | 15,173 | ||||||||
U.S. Treasury Bills | — | 4,411,214 | — | 4,411,214 | ||||||||||||
Purchased Call Options | — | 638,836 | — | 638,836 | ||||||||||||
Total Investments - Assets | $ | 15,173 | $ | 5,050,050 | $ | — | $ | 5,065,223 | ||||||||
Other Financial Instruments - Liabilities: | ||||||||||||||||
Written Put Options | $ | — | $ | 6,496 | $ | — | $ | 6,496 | ||||||||
Level 1 | Level 2 | Level 3 | Total | |||||||||||||
TrueShares Structured Outcome (May) ETF | ||||||||||||||||
Investments - Assets: | ||||||||||||||||
Money Market Funds | $ | 231 | $ | — | $ | — | $ | 231 | ||||||||
U.S. Treasury Bills | — | 3,908,792 | — | 3,908,792 | ||||||||||||
Purchased Call Options | — | 525,571 | — | 525,571 | ||||||||||||
Total Investments - Assets | $ | 231 | $ | 4,434,363 | $ | — | $ | 4,434,594 | ||||||||
Other Financial Instruments - Liabilities: | ||||||||||||||||
Written Put Options | $ | — | $ | 11,215 | $ | — | $ | 11,215 | ||||||||
Level 1 | Level 2 | Level 3 | Total | |||||||||||||
TrueShares Structured Outcome (June) ETF | ||||||||||||||||
Investments - Assets: | ||||||||||||||||
U.S. Treasury Bills | $ | — | $ | 2,921,937 | $ | — | $ | 2,921,937 | ||||||||
Purchased Call Options | — | 367,183 | — | 367,183 | ||||||||||||
Total Investments - Assets | $ | — | $ | 3,289,120 | $ | — | $ | 3,289,120 | ||||||||
Other Financial Instruments - Liabilities: | ||||||||||||||||
Written Put Options | $ | — | $ | 12,637 | $ | — | $ | 12,637 | ||||||||
Security Transactions
Investment transactions are recorded as of the date that the securities are purchased or sold (trade date). Realized gains and losses from the sale or disposition of securities are calculated based on the specific identification basis.
Investment Income
Interest income is accrued daily. Discounts and premiums on fixed income securities purchased are accreted or amortized using the effective interest method.
Tax Information, Dividends and Distributions to Shareholders and Uncertain Tax Positions
The Funds are treated as separate entities for Federal income tax purposes. Each Fund intends to qualify as a regulated investment company (“RIC”) under Subchapter M of the Internal Revenue Code of 1986, as amended (the “Internal Revenue Code”). To qualify and remain eligible for the special tax treatment accorded to RICs, each Fund must meet certain annual income and quarterly asset diversification requirements and must distribute annually at least 90% of the sum of (i) its investment company taxable income (which includes dividends, interest and net short-term capital gains) and (ii) certain net tax-exempt income, if any. If so qualified, each Fund will not be subject to Federal income tax.
47
TrueShares Structured Outcome ETFs
Notes to Financial Statements
December 31, 2023 (Continued)
Distributions to shareholders are recorded on the ex-dividend date. The Funds will declare and pay capital gain distributions, if any, in cash at least annually. The Funds may also pay a special distribution at the end of the calendar year to comply with Federal tax requirements. The amount of dividends and distributions from net investment income and net realized capital gains are determined in accordance with Federal income tax regulations, which may differ from U.S. GAAP. These “book/tax” differences are either considered temporary or permanent in nature. To the extent these differences are permanent in nature, such amounts are reclassified within the components of net assets based on their Federal tax basis treatment; temporary differences do not require reclassification. Dividends and distributions which exceed earnings and profit for tax purposes are reported as a tax return of capital.
Management evaluates the Funds’ tax positions to determine if the tax positions taken meet the minimum recognition threshold in connection with accounting for uncertainties in income tax positions taken or expected to be taken for the purposes of measuring and recognizing tax liabilities in the financial statements. Recognition of tax benefits of an uncertain tax position is required only when the position is “more likely than not” to be sustained assuming examination by taxing authorities. Interest and penalties related to income taxes would be recorded as income tax expense. The Funds’ Federal income tax returns are subject to examination by the Internal Revenue Service (the “IRS”) for a period of three fiscal years after they are filed. State and local tax returns may be subject to examination for an additional fiscal year depending on the jurisdiction. As of December 31, 2023, the Funds’ most recent fiscal year end, the Funds had no material uncertain tax positions and did not have a liability for any unrecognized tax benefits. As of December 31, 2023, the Funds’ most recent fiscal year end, the Funds had no examination in progress and management is not aware of any tax positions for which it is reasonably possible that the amounts of unrecognized tax benefits will significantly change in the next twelve months.
The Funds recognized no interest or penalties related to uncertain tax benefits in the 2023 fiscal year. At December 31, 2023, the Funds’ fiscal period end, the tax periods from previous three fiscal years (or commencement of operations, if shorter) remained open to examination in the Funds’ major tax jurisdiction.
Indemnification
In the normal course of business, the Funds expect to enter into contracts that contain a variety of representations and warranties and which provide general indemnifications. The Funds’ maximum exposure under these anticipated arrangements is unknown, as this would involve future claims that may be made against the Funds that have not yet occurred. However, based on experience, the Funds expect the risk of loss to be remote.
Derivatives
The Structured Outcome ETFs employ a “buffer protect” options strategy that uses such options to seek to achieve exposure to the S&P 500® Price Index while mitigating the first 8% to 12% decline in the S&P 500® Price Index (the “Buffer”) over a 12-month period beginning on a specified day (each, a “Roll Date”). The period from one Roll Date to the next Roll Date is referred to as the “Investment Period,” and the first day of the Investment Period is referred to as the initial investment day. In the event an investor purchases shares after the date on which the options were entered into or sells shares prior to the expiration of the options, the Buffer that the Structured Outcome ETFs seeks to provide may not be available. The Structured Outcome ETFs are not designed to protect against declines of more than 8% to 12% in the level of the S&P 500® Price Index, and there can be no guarantee that the Structured Outcome ETFs will be successful in implementing the buffer protect options strategy to avoid the first 8% to 12% decline.
In general, the Structured Outcome ETFs invest in exchange-traded FLEX Options only. FLEX Options are customized option contracts made available by the Cboe Options Exchange with the ability to customize key contract terms like exercise price, style and expiration date while achieving price discovery in competitive, transparent auctions markets and avoiding the counterparty exposure of over–the–counter options positions. Like traditional exchange–traded options, FLEX Options are guaranteed for settlement by the Options Clearing Corporation, a market clearinghouse that guarantees performance by counterparties to certain derivatives contracts. The FLEX Options in which the Structured Outcome ETFs invest generally have a term of up to one year and are all European style options (options that are exercisable only on the expiration date) based on the S&P 500® Price Index or an ETF that tracks the S&P 500® Price Index and have an expiration date that is the last day of the Investment Period.
48
TrueShares Structured Outcome ETFs
Notes to Financial Statements
December 31, 2023 (Continued)
The Structured Outcome ETFs will purchase and sell call and put FLEX Options. In general, put and call options on indices give the holder the right to receive, upon exercise of the option, an amount of cash if the closing level of the underlying index is greater than (or less than, in the case of puts) the exercise price of the option. This amount of cash is equal to the difference between the closing price of the index and the exercise price of the option, expressed in dollars multiplied by a specified number. The premium paid to the writer is the consideration for undertaking the obligations under the option contract.
The Structured Outcome ETFs purchasing put and call options pay a premium; therefore, if price movements in the underlying securities are such that exercise of the options would not be profitable for the Structured Outcome ETFs, loss of the premium paid may be offset by an increase in the value of the Structured Outcome ETFs’ securities or by a decrease in the cost of acquisition of securities by the Structured Outcome ETFs. When the Structured Outcome ETFs write an option, if the underlying securities do not increase or decrease to a price level that would make the exercise of the option profitable to the holder thereof, the option generally will expire without being exercised and the Structured Outcome ETFs will realize as profit the premium received for such option. When a call option of which the Structured Outcome ETFs are the writer is exercised, the Structured Outcome ETFs will be required to sell the underlying securities to the option holder at the strike price and will not participate in any increase in the price of such securities above the strike price. When a put option of which the Structured Outcome ETFs are the writer is exercised, the Structured Outcome ETFs will be required to purchase the underlying securities at a price in excess of the market value of such securities. The Structured Outcome ETFs maintain minimal counterparty risk through contracts bought or sold on an exchange. As of December 31, 2023, the Structured Outcome ETFs’ derivative instruments are not subject to a master netting arrangement.
Derivative Investments
The average monthly value outstanding of purchased and written options during the year ended December 31, 2023, were as follows:
TrueShares | TrueShares | TrueShares | TrueShares | TrueShares | TrueShares | |||||||||||||||||||
Purchased Options | $ | 901,299 | $ | 622,843 | $ | 1,283,754 | $ | 465,937 | $ | 1,194,878 | $ | 957,246 | ||||||||||||
Written Options | 225,916 | 307,185 | 334,519 | 42,728 | 154,006 | 223,380 | ||||||||||||||||||
TrueShares | TrueShares | TrueShares | TrueShares | TrueShares | TrueShares | |||||||||||||||||||
Purchased Options | $ | 365,327 | $ | 258,387 | $ | 354,508 | $ | 372,823 | $ | 284,205 | $ | 274,511 | ||||||||||||
Written Options | 48,676 | 51,032 | 52,452 | 98,510 | 59,378 | 68,996 | ||||||||||||||||||
49
TrueShares Structured Outcome ETFs
Notes to Financial Statements
December 31, 2023 (Continued)
The following is a summary of the effect of derivative instruments on the Funds’ Statements of Assets and Liabilities as of December 31, 2023:
Equity Risk | Asset | Liability | |||||||
TrueShares Structured Outcome (July) ETF | Purchased Options | $ | 1,102,262 | $ | — | ||||
Written Options | — | 96,373 | |||||||
TrueShares Structured Outcome (August) ETF | Purchased Options | 1,082,914 | — | ||||||
Written Options | — | 174,122 | |||||||
TrueShares Structured Outcome (September) ETF | Purchased Options | 1,461,156 | — | ||||||
Written Options | — | 204,047 | |||||||
TrueShares Structured Outcome (October) ETF | Purchased Options | 431,269 | — | ||||||
Written Options | — | 38,936 | |||||||
TrueShares Structured Outcome (November) ETF | Purchased Options | 2,510,045 | — | ||||||
Written Options | — | 195,859 | |||||||
TrueShares Structured Outcome (December) ETF | Purchased Options | 3,391,035 | — | ||||||
Written Options | — | 777,004 | |||||||
TrueShares Structured Outcome (January) ETF | Purchased Options | 344,696 | — | ||||||
Written Options | — | 140,868 | |||||||
TrueShares Structured Outcome (February) ETF | Purchased Options | 334,938 | — | ||||||
Written Options | — | 763 | |||||||
TrueShares Structured Outcome (March) ETF | Purchased Options | 426,297 | — | ||||||
Written Options | — | 1,995 | |||||||
TrueShares Structured Outcome (April) ETF | Purchased Options | 638,836 | — | ||||||
Written Options | — | 6,496 | |||||||
TrueShares Structured Outcome (May) ETF | Purchased Options | 525,571 | — | ||||||
Written Options | — | 11,215 | |||||||
TrueShares Structured Outcome (June) ETF | Purchased Options | 367,183 | — | ||||||
Written Options | — | 12,637 | |||||||
50
TrueShares Structured Outcome ETFs
Notes to Financial Statements
December 31, 2023 (Continued)
The following is a summary of the effect of derivative instruments on the Funds’ Statements of Operations for the year ended December 31, 2023:
Net Realized Gain (Loss) | Change in Unrealized | ||||||||||||||||
Purchased | Written | Purchased | Written | ||||||||||||||
TrueShares Structured Outcome (July) ETF | Equity Risk Contracts | $ | 581,580 | $ | 806,967 | $ | 480,504 | $ | (159,001 | ) | |||||||
TrueShares Structured Outcome (August) ETF | Equity Risk Contracts | 164,855 | 809,642 | 613,976 | 191,068 | ||||||||||||
TrueShares Structured Outcome (September) ETF | Equity Risk Contracts | 573,057 | 1,188,772 | 852,677 | (30,395 | ) | |||||||||||
TrueShares Structured Outcome (October) ETF | Equity Risk Contracts | 275,629 | 243,070 | 87,581 | (64,119 | ) | |||||||||||
TrueShares Structured Outcome (November) ETF | Equity Risk Contracts | (493,356 | ) | 504,069 | 1,380,157 | 238,720 | |||||||||||
TrueShares Structured Outcome (December) ETF | Equity Risk Contracts | 304,311 | 341,280 | 915,443 | 303,063 | ||||||||||||
TrueShares Structured Outcome (January) ETF | Equity Risk Contracts | 462,062 | 163,469 | (31 | ) | (43 | ) | ||||||||||
TrueShares Structured Outcome (February) ETF | Equity Risk Contracts | 46,678 | 25 | 165,297 | 101,416 | ||||||||||||
TrueShares Structured Outcome (March) ETF | Equity Risk Contracts | 40,421 | 200,305 | 263,476 | 78,157 | ||||||||||||
TrueShares Structured Outcome (April) ETF | Equity Risk Contracts | (369,722 | ) | 321,433 | 657,747 | 248,612 | |||||||||||
TrueShares Structured Outcome (May) ETF | Equity Risk Contracts | (266,246 | ) | 235,607 | 454,384 | 46,126 | |||||||||||
TrueShares Structured Outcome (June) ETF | Equity Risk Contracts | 83,779 | 299,255 | 311,561 | 34,143 | ||||||||||||
3. INVESTMENT ADVISORY AND OTHER AGREEMENTS
Investment Advisory Agreement
The Trust has entered into an Investment Advisory Agreement (the “Advisory Agreement”) with the Adviser. Under the Advisory Agreement, the Adviser provides a continuous investment program for the Funds’ assets in accordance with its investment objectives, policies and limitations, and oversees the day-to-day operations of the Funds subject to the supervision of the Board, including the Trustees who are not “interested persons” of the Trust as defined in the 1940 Act (the “Independent Trustees”).
Pursuant to the Advisory Agreement between the Trust, on behalf of the Funds, and TrueMark, each Fund pays a unified management fee to the Adviser, which is calculated daily and paid monthly, at an annual rate of 0.79% of the Structured Outcome ETF’s average daily net assets, respectively. TrueMark has agreed to pay all expenses of the Funds except the fee paid to TrueMark under the Advisory Agreement, interest charges on any borrowings, dividends and other expenses on securities sold short, taxes, brokerage commissions and other expenses incurred in placing orders for the purchase and sale of securities and other investment instruments, acquired fund fees and expenses, accrued deferred tax liability, extraordinary expenses, and distribution (12b-1) fees and expenses (if any). TrueMark, in turn, compensates the Sub-Advisers from the management fee it receives.
51
TrueShares Structured Outcome ETFs
Notes to Financial Statements
December 31, 2023 (Continued)
SpiderRock Advisors, LLC (the “Sub-Adviser”), a Delaware limited liability company serves as the sub-adviser to the Structured Outcome ETFs. Pursuant to a Sub-Advisory Agreement between the Adviser and the Sub-Adviser, the Sub-Adviser is responsible for trading portfolio securities on behalf of the Funds, including selecting broker-dealers to execute purchase and sale transactions, subject to the supervision of the Adviser and the Board, including the Independent Trustees. For its services, the Sub-Adviser is entitled to a sub-advisory fee paid by the Adviser, which is calculated daily and paid monthly at an annual rate of 0.69% per Fund effective October 1, 2023. Prior to this date, the Sub-Adviser was entitled to a fee as follows:
Assets Under Management | Sub-Advisory Fee Rate |
<$200,000,000 | The lesser of 0.34% annually or $32,500 per month |
$200,000,001-$350,000,000 | 0.285% |
>$350,000,000 | 0.375% |
Distribution Agreement and 12b-1 Plan
Foreside Fund Services, LLC, a wholly owned subsidiary of Foreside Financial Group, LLC (dba ACA Group) (the “Distributor”), serves as each Fund’s distributor pursuant to a Distribution Agreement. The Distributor receives compensation from the Adviser for certain statutory underwriting services it provides to the Funds. The Distributor enters into agreements with certain broker-dealers and others that will allow those parties to be “Authorized Participants” and to subscribe for and redeem shares of the Funds. The Distributor will not distribute shares in less than whole Creation Units and does not maintain a secondary market in shares.
The Board has adopted a Distribution and Service Plan pursuant to Rule 12b-1 under the 1940 Act (“Rule 12b-1 Plan”). In accordance with the Rule 12b-1 Plan, each Fund is authorized to pay an amount up to 0.25% of the Fund’s average daily net assets each year for certain distribution-related activities. As authorized by the Board, no Rule 12b-1 fees are currently paid by the Funds and there are no plans to impose these fees. However, in the event Rule 12b-1 fees are charged in the future, they will be paid out of each Fund’s assets. The Adviser and its affiliates may, out of their own resources, pay amounts to third parties for distribution or marketing services on behalf of the Funds.
Administrator, Custodian and Transfer Agent
U.S. Bancorp Fund Services LLC, doing business as U.S. Bank Global Fund Services (“Fund Services” or “Administrator”) serves as administrator, transfer agent and fund accountant of the Funds pursuant to a Fund Servicing Agreement. U.S. Bank N.A. (the “Custodian”), an affiliate of Fund Services, serves as the Funds’ custodian pursuant to a Custody Agreement. Under the terms of these agreements, the Adviser pays each Fund’s administrative, custody and transfer agency fees.
A Trustee and all officers of the Trust are affiliated with the Administrator and the Custodian.
4. CREATION AND REDEMPTION TRANSACTIONS
Shares of the Structured Outcome ETFs are listed and traded on the Cboe BZX Exchange, Inc. Each Fund issues and redeems shares on a continuous basis at NAV only in large blocks of shares called “Creation Units”. Creation Units are to be issued and redeemed principally in kind for a basket of securities and a balancing cash amount. Shares generally will trade in the secondary market in amounts less than a Creation Unit at market prices that change throughout the day. Market prices for the shares may be different from their NAV. The NAV is determined as of the close of trading (generally, 4:00 p.m. Eastern Time) on each day the NYSE is open for trading. The NAV of the shares of each Fund will be equal to a Fund’s total assets minus a Fund’s total liabilities divided by the total number of shares outstanding. The NAV that is published will be rounded to the nearest cent; however, for purposes of determining the price of Creation Units, the NAV will be calculated to four decimal places.
52
TrueShares Structured Outcome ETFs
Notes to Financial Statements
December 31, 2023 (Continued)
Creation Unit Transaction Fee
Authorized Participants will be required to pay to the Custodian a fixed transaction fee (the “Creation Unit Transaction Fee”) in connection with the issuance or redemption of Creation Units. The standard Creation Unit Transaction Fee will be the same regardless of the number of Creation Units purchased or redeemed by an investor on the applicable business day. The Creation Unit Transaction Fee charged by the Fund for each creation order is $300.
An additional variable fee of up to a maximum of 2% of the value of the Creation Units subject to the transaction may be imposed for (1) creations effected outside the clearing process and (2) creations made in an all cash amount (to offset the Trust’s brokerage and other transaction costs associated with using cash to purchase the requisite Deposit Securities). Investors are responsible for the costs of transferring the securities constituting the Deposit Securities to the account of the Trust. Each Fund may determine to not charge a variable fee on certain orders when the Adviser has determined that doing so is in the best interests of Fund shareholders. Variable fees, if any, received by the Funds are displayed in the Capital Share Transactions section on the Statements of Changes in Net Assets.
Only “Authorized Participants” may purchase or redeem shares directly from the Funds. An Authorized Participant is either (i) a broker-dealer or other participant in the clearing process through the Continuous Net Settlement System of National Securities Clearing Corporation or (ii) a DTC participant and, in each case, must have executed a Participant Agreement with the Distributor. Most retail investors will not qualify as Authorized Participants or have the resources to buy and sell whole Creation Units. Therefore, they will be unable to purchase or redeem the shares directly from the Funds. Rather, most retail investors will purchase shares in the secondary market with the assistance of a broker and will be subject to customary brokerage commissions or fees. Securities received or delivered in connection with in-kind creates and redeems are valued as of the close of business on the effective date of the creation or redemption.
A creation unit will generally not be issued until the transfer of good title of the deposit securities to the Funds and the payment of any cash amounts have been completed. To the extent contemplated by the applicable participant agreement, Creation Units of the Funds will be issued to such authorized participant notwithstanding the fact that the Funds’ deposits have not been received in part or in whole, in reliance on the undertaking of the authorized participant to deliver the missing deposit securities as soon as possible. If the Funds or their agents do not receive all of the deposit securities, or the required cash amounts, by such time, then the order may be deemed rejected and the authorized participant shall be liable to the Funds for losses, if any.
5. FEDERAL INCOME TAX
The tax character of distributions paid was as follows:
Year Ended December 31, 2023 | Year Ended December 31, 2022 | |||||||||||||||
Ordinary | Long-Term | Ordinary | Long-Term | |||||||||||||
TrueShares Structured Outcome (July) ETF | $ | 467,976 | $ | — | $ | 8,369 | $ | — | ||||||||
TrueShares Structured Outcome (August) ETF | 528,891 | — | $ | 52,402 | — | |||||||||||
TrueShares Structured Outcome (September) ETF | 611,030 | — | $ | 142,172 | — | |||||||||||
TrueShares Structured Outcome (October) ETF | 120,431 | — | $ | 29,502 | — | |||||||||||
TrueShares Structured Outcome (November) ETF | 410,218 | — | $ | 24,115 | — | |||||||||||
TrueShares Structured Outcome (December) ETF | 483,192 | — | $ | 78,840 | — | |||||||||||
TrueShares Structured Outcome (January) ETF | 123,195 | — | $ | 8,073 | — | |||||||||||
TrueShares Structured Outcome (February) ETF | 249,641 | — | $ | — | — | |||||||||||
TrueShares Structured Outcome (March) ETF | 284,891 | — | $ | 29,055 | — | |||||||||||
TrueShares Structured Outcome (April) ETF | 145,986 | — | $ | 33,064 | — | |||||||||||
TrueShares Structured Outcome (May) ETF | 121,887 | — | $ | 23,776 | — | |||||||||||
TrueShares Structured Outcome (June) ETF | 197,592 | — | $ | 16,658 | — | |||||||||||
(1) | Ordinary income includes short-term capital gains. |
53
TrueShares Structured Outcome ETFs
Notes to Financial Statements
December 31, 2023 (Continued)
At December 31, 2023, the Funds’ most recent fiscal year end, the components of distributable earnings (accumulated losses) and cost of investments on a tax basis, including the adjustments for financial reporting purposes as of the most recently completed Federal income tax reporting year, were as follows:
TrueShares | TrueShares | TrueShares | TrueShares | TrueShares | TrueShares | |||||||||||||||||||
Federal Tax Cost of Investments* | $ | 12,507,456 | $ | 15,165,626 | $ | 16,656,655 | $ | 3,415,471 | $ | 16,432,657 | $ | 39,113,760 | ||||||||||||
Gross Tax Unrealized Appreciation | $ | 533,661 | $ | 298,573 | $ | 562,379 | $ | 261,096 | $ | 1,605,030 | $ | 1,104,040 | ||||||||||||
Gross Tax Unrealized Depreciation | — | — | — | — | — | — | ||||||||||||||||||
Net Tax Unrealized Appreciation (Depreciation) | 533,661 | 298,573 | 562,379 | 261,096 | 1,605,030 | 1,104,040 | ||||||||||||||||||
Undistributed Ordinary Income | 52,969 | 26,137 | — | — | 3,585 | 79,046 | ||||||||||||||||||
Other Accumulated Gain (Loss) | (39,161 | ) | (304,539 | ) | (361,846 | ) | (338,377 | ) | (1,138,660 | ) | (200,607 | ) | ||||||||||||
Total Distributable Earnings / (Accumulated Losses) | $ | 547,469 | $ | 20,171 | $ | 200,533 | $ | (77,281 | ) | $ | 469,955 | $ | 982,479 | |||||||||||
TrueShares | TrueShares | TrueShares | TrueShares | TrueShares | TrueShares | |||||||||||||||||||
Federal Tax Cost of Investments* | $ | 4,182,790 | $ | 3,394,489 | $ | 3,540,572 | $ | 4,603,088 | $ | 4,062,414 | $ | 3,026,105 | ||||||||||||
Gross Tax Unrealized Appreciation | $ | — | $ | 275,585 | $ | 350,851 | $ | 463,139 | $ | 367,964 | $ | 256,497 | ||||||||||||
Gross Tax Unrealized Depreciation | (277 | ) | (1,160 | ) | (2,047 | ) | (7,500 | ) | (7,000 | ) | (6,119 | ) | ||||||||||||
Net Tax Unrealized Appreciation (Depreciation) | (277 | ) | 274,425 | 348,804 | 455,639 | 360,964 | 250,378 | |||||||||||||||||
Undistributed Ordinary Income | — | 52,979 | 83,509 | — | — | — | ||||||||||||||||||
Undistributed Capital Gains | — | — | — | — | — | 22,887 | ||||||||||||||||||
Other Accumulated Gain (Loss) | (396,464 | ) | — | — | (197,297 | ) | (332,970 | ) | — | |||||||||||||||
Total Distributable Earnings / (Accumulated Losses) | $ | (396,741 | ) | $ | 327,404 | $ | 432,313 | $ | 258,342 | $ | 27,994 | $ | 273,265 | |||||||||||
* | Includes written option premiums. |
54
TrueShares Structured Outcome ETFs
Notes to Financial Statements
December 31, 2023 (Continued)
The difference between book-basis and tax-basis unrealized appreciation/(depreciation) is attributable primarily to the tax deferral of losses on wash sales.
Under current tax law, net capital losses realized and specified ordinary losses after October 31st may be deferred and treated as occurring on the first day of the following fiscal year. The Funds’ carryforward losses and post-October losses are determined only at the end of each fiscal year. During the fiscal year ended December 31, 2023, the Funds’ most recent fiscal year end, the Funds had carryforward losses and post-October losses which will be carried forward indefinitely to offset future realized capital gains and utilized short-term capital loss carryforwards as follows:
Short Term | Indefinite Short- | Indefinite Long- | ||||||||||
TrueShares Structured Outcome July ETF | $ | 405,500 | $ | 39,161 | $ | — | ||||||
TrueShares Structured Outcome August ETF | — | 304,539 | — | |||||||||
TrueShares Structured Outcome September ETF | 474,243 | 361,847 | — | |||||||||
TrueShares Structured Outcome October ETF | 236,892 | 338,378 | — | |||||||||
TrueShares Strucutred Outcome Novemeber ETF | 7,111 | 1,137,580 | 1,080 | |||||||||
TrueShares Structured Outcome December ETF | 61,016 | 200,595 | 13 | |||||||||
TrueShares Structured Outcome January ETF | — | 396,465 | — | |||||||||
TrueShares Structured Outcome February ETF | 38,228 | — | — | |||||||||
TrueShares Structured Outcome March ETF | — | — | — | |||||||||
TrueShares Structured Outcome April ETF | — | 197,297 | — | |||||||||
TrueShares Structured Outcome May ETF | — | 332,970 | — | |||||||||
TrueShares Structured Outcome June ETF | 34,545 | — | — | |||||||||
U.S. GAAP requires that certain components of net assets relating to permanent differences be reclassified between financial and tax reporting. These reclassifications have no effect on net assets or NAV per share. The permanent differences primarily relate to redemptions in-kind. For the year ended December 31, 2023, the following reclassifications were made for permanent tax differences on the Statements of Assets and Liabilities.
Total | Paid-In | |||||||
TrueShares Structured Outcome July ETF | $ | (969,215 | ) | $ | 969,215 | |||
TrueShares Structured Outcome August ETF | (1,106,328 | ) | 1,106,328 | |||||
TrueShares Structured Outcome September ETF | (1,266,242 | ) | 1,266,242 | |||||
TrueShares Structured Outcome October ETF | (275,205 | ) | 275,205 | |||||
TrueShares Strucutred Outcome Novemeber ETF | — | — | ||||||
TrueShares Structured Outcome December ETF | (547,892 | ) | 547,892 | |||||
TrueShares Structured Outcome January ETF | (501,031 | ) | 501,031 | |||||
TrueShares Structured Outcome February ETF | — | — | ||||||
TrueShares Structured Outcome March ETF | (1 | ) | 1 | |||||
TrueShares Structured Outcome April ETF | 46 | (46 | ) | |||||
TrueShares Structured Outcome May ETF | 98 | (98 | ) | |||||
TrueShares Structured Outcome June ETF | (260,379 | ) | 260,379 | |||||
55
TrueShares Structured Outcome ETFs
Notes to Financial Statements
December 31, 2023 (Continued)
6. INVESTMENT TRANSACTIONS
During the year ended December 31, 2023, the Funds realized amounts in net capital gains resulting from in-kind redemptions, in which shareholders exchanged Fund shares for securities held by the Funds rather than for cash. Because such gains are not taxable to the Funds, and are not distributed to shareholders, they have been reclassified from distributable earnings (accumulated losses) to paid in-capital. The amounts of realized gains and losses from in-kind redemptions included in realized gain/(loss) on investments in the Statements of Operations is as follows:
Realized Gains | Realized Losses | |||||||
TrueShares Structured Outcome (July) ETF | $ | 1,339,651 | $ | (370,436 | ) | |||
TrueShares Structured Outcome (August) ETF | 1,147,802 | — | ||||||
TrueShares Structured Outcome (September) ETF | 3,808,511 | (2,539,008 | ) | |||||
TrueShares Structured Outcome (October) ETF | 275,213 | — | ||||||
TrueShares Structured Outcome (November) ETF | — | — | ||||||
TrueShares Structured Outcome (December) ETF | 560,849 | — | ||||||
TrueShares Structured Outcome (January) ETF | 501,941 | — | ||||||
TrueShares Structured Outcome (February) ETF | — | — | ||||||
TrueShares Structured Outcome (March) ETF | — | — | ||||||
TrueShares Structured Outcome (April) ETF | — | — | ||||||
TrueShares Structured Outcome (May) ETF | — | — | ||||||
TrueShares Structured Outcome (June) ETF | — | — | ||||||
Purchases and sales of investments (excluding short-term investments), creations in-kind and redemptions in-kind for the year ended December 31, 2023, were as follows:
Purchases | Sales | Creations | Redemptions | |||||||||||||
TrueShares Structured Outcome (July) ETF | $ | — | $ | — | $ | — | $ | — | ||||||||
TrueShares Structured Outcome (August) ETF | 1,242,264 | 431,146 | — | 184,328 | ||||||||||||
TrueShares Structured Outcome (September) ETF | — | — | — | — | ||||||||||||
TrueShares Structured Outcome (October) ETF | 266,558 | 1,336 | — | — | ||||||||||||
TrueShares Structured Outcome (November) ETF | 1,599,065 | — | — | — | ||||||||||||
TrueShares Structured Outcome (December) ETF | — | — | — | — | ||||||||||||
TrueShares Structured Outcome (January) ETF | 485,514 | — | — | — | ||||||||||||
TrueShares Structured Outcome (February) ETF | 2,894,695 | 2,885,871 | — | — | ||||||||||||
TrueShares Structured Outcome (March) ETF | 439,057 | 179,205 | — | — | ||||||||||||
TrueShares Structured Outcome (April) ETF | — | — | — | — | ||||||||||||
TrueShares Structured Outcome (May) ETF | 405,050 | 319 | — | — | ||||||||||||
TrueShares Structured Outcome (June) ETF | 1,244,267 | 1,064,650 | — | — | ||||||||||||
7. PRINCIPAL RISKS
As with all ETFs, shareholders of the Funds are subject to the risk that their investment could lose money. Each Fund is subject to the principal risks, any of which may adversely affect a Fund’s NAV, trading price, yield, total return and ability to meet its investment objective.
A complete description of principal risks is included in the prospectus under the heading “Principal Investment Risks.”
56
TrueShares Structured Outcome ETFs
Notes to Financial Statements
December 31, 2023 (Continued)
8. SUBSEQUENT EVENTS
Management has evaluated the Funds’ related event and transactions that occurred subsequent to December 31, 2023, through the date of issuance of the Funds’ financials statements. Management has determined that there were no subsequent events requiring recognition or disclosure in the financial statements.
57
TrueShares Structured Outcome ETFs
Report of Independent Registered Public Accounting Firm
To the Shareholders of TrueShares Structured Outcome ETFs and
Board of Trustees of Listed Funds Trust
Opinion on the Financial Statements
We have audited the accompanying statements of assets and liabilities, including the schedules of investments and written options, of TrueShares Structured Outcome (July) ETF, TrueShares Structured Outcome (August) ETF, TrueShares Structured Outcome (September) ETF, TrueShares Structured Outcome (October) ETF, TrueShares Structured Outcome (November) ETF, TrueShares Structured Outcome (December) ETF, TrueShares Structured Outcome (January) ETF, TrueShares Structured Outcome (February) ETF, TrueShares Structured Outcome (March) ETF, TrueShares Structured Outcome (April) ETF, TrueShares Structured Outcome (May) ETF, and TrueShares Structured Outcome (June) ETF (“TrueShares Structured Outcome ETFs” or the “Funds”), each a series of Listed Funds Trust, as of December 31, 2023, the related statements of operations, the statements of changes in net assets, the related notes, and the financial highlights for each of the periods indicated below (collectively referred to as the “financial statements”). In our opinion, the financial statements present fairly, in all material respects, the financial position of each of the Funds as of December 31, 2023, the results of their operations, the changes in net assets, and the financial highlights for each of the periods indicated below in conformity with accounting principles generally accepted in the United States of America.
Fund Name | Statements of | Statements of Changes | Financial Highlights |
TrueShares Structured Outcome (July) ETF | For the year ended December 31, 2023 | For the years ended December 31, 2023 and 2022 | For the years ended December 31, 2023, 2022, 2021 and for the period from July 1, 2020 (commencement of operations) through December 31, 2020 |
TrueShares Structured Outcome (August) ETF | For the year ended December 31, 2023 | For the years ended December 31, 2023 and 2022 | For the years ended December 31, 2023, 2022, 2021 and for the period from August 3, 2020 (commencement of operations) through December 31, 2020 |
TrueShares Structured Outcome (September) ETF | For the year ended December 31, 2023 | For the years ended December 31, 2023 and 2022 | For the years ended December 31, 2023, 2022, 2021 and for the period from September 1, 2020 (commencement of operations) through December 31, 2020 |
TrueShares Structured Outcome (October) ETF | For the year ended December 31, 2023 | For the years ended December 31, 2023 and 2022 | For the years ended December 31, 2023, 2022, 2021 and for the period from October 1, 2020 (commencement of operations) through December 31, 2020 |
TrueShares Structured Outcome (November) ETF | For the year ended December 31, 2023 | For the years ended December 31, 2023 and 2022 | For the years ended December 31, 2023, 2022, 2021 and for the period from November 2, 2020 (commencement of operations) through December 31, 2020 |
TrueShares Structured Outcome (December) ETF | For the year ended December 31, 2023 | For the years ended December 31, 2023 and 2022 | For the years ended December 31, 2023, 2022, 2021 and for the period from December 1, 2020 (commencement of operations) through December 31, 2020 |
TrueShares Structured Outcome (January) ETF | For the year ended December 31, 2023 | For the years ended December 31, 2023 and 2022 | For the years ended December 31, 2023 and 2022 and for the period from January 4, 2021 (commencement of operations) through December 31, 2021 |
58
TrueShares Structured Outcome ETFs
Report of Independent Registered Public Accounting Firm
(Continued)
Fund Name | Statements of | Statements of Changes | Financial Highlights |
TrueShares Structured Outcome (February) ETF | For the year ended December 31, 2023 | For the years ended December 31, 2023 and 2022 | For the years ended December 31, 2023 and 2022 and for the period from February 1, 2021 (commencement of operations) through December 31, 2021 |
TrueShares Structured Outcome (March) ETF | For the year ended December 31, 2023 | For the years ended December 31, 2023 and 2022 | For the years ended December 31, 2023 and 2022 and for the period from March 1, 2021 (commencement of operations) through December 31, 2021 |
TrueShares Structured Outcome (April) ETF | For the year ended December 31, 2023 | For the years ended December 31, 2023 and 2022 | For the years ended December 31, 2023 and 2022 and for the period from April 1, 2021 (commencement of operations) through December 31, 2021 |
TrueShares Structured Outcome (May) ETF | For the year ended December 31, 2023 | For the years ended December 31, 2023 and 2022 | For the years ended December 31, 2023 and 2022 and for the period from May 3, 2021 (commencement of operations) through December 31, 2021 |
TrueShares Structured Outcome (June) ETF | For the year ended December 31, 2023 | For the years ended December 31, 2023 and 2022 | For the years ended December 31, 2023 and 2022 and for the period from June 1, 2021 (commencement of operations) through December 31, 2021 |
Basis for Opinion
These financial statements are the responsibility of the Funds’ management. Our responsibility is to express an opinion on the Funds’ financial statements based on our audits. We are a public accounting firm registered with the Public Company Accounting Oversight Board (United States) (“PCAOB”) and are required to be independent with respect to the Funds in accordance with the U.S. federal securities laws and the applicable rules and regulations of the Securities and Exchange Commission and the PCAOB.
We conducted our audits in accordance with the standards of the PCAOB. Those standards require that we plan and perform the audit to obtain reasonable assurance about whether the financial statements are free of material misstatement whether due to error or fraud.
Our audits included performing procedures to assess the risks of material misstatement of the financial statements, whether due to error or fraud, and performing procedures that respond to those risks. Such procedures included examining, on a test basis, evidence regarding the amounts and disclosures in the financial statements. Our procedures included confirmation of securities owned as of December 31, 2023, by correspondence with the custodian and brokers. Our audits also included evaluating the accounting principles used and significant estimates made by management, as well as evaluating the overall presentation of the financial statements. We believe that our audits provide a reasonable basis for our opinion.
We have served as the Funds’ auditor since 2019.

COHEN & COMPANY, LTD.
Cleveland, Ohio
February 29, 2024
59
TrueShares Structured Outcome ETFs
Board of Trustees and Officers
December 31, 2023 (Unaudited)
The Funds’ Statement of Additional Information includes additional information about the Funds’ Trustees and Officers, and is available, without charge upon request by calling 1-800-617-0004, or by visiting the Funds’ website at www.true-shares.com.
Name, Address and Year of Birth | Position Held | Term of Office | Principal Occupation(s) | Number of | Other |
Independent Trustees | |||||
John L. Jacobs 615 East Michigan St. Milwaukee, WI 53202 Year of birth: 1959 | Trustee and Audit Committee Chair | Indefinite term; since 2017 | Chairman of VettaFi, LLC (since June 2018); Founder and CEO of Q3 Advisors, LLC (financial consulting firm) (since 2015); Executive Director of Center for Financial Markets and Policy (2016–2022); Distinguished Policy Fellow and Executive Director, Center for Financial Markets and Policy, Georgetown University (2015–2022); Senior Advisor, Nasdaq OMX Group (2015–2016); Executive Vice President, Nasdaq OMX Group (2013–2015) | 51 | Independent Trustee, SHP ETF Trust (since 2021) (2 portfolios); Director, tZERO Group, Inc. (since 2020); Independent Trustee, Procure ETF Trust II (since 2018) (1 portfolio); Independent Trustee, Horizons ETF Trust I (2015-2019) |
Koji Felton Milwaukee, WI 53202 Year of birth: 1961 | Trustee | Indefinite term; since 2019 | Retired; formerly Counsel, Kohlberg Kravis Roberts & Co. L.P. (investment firm) (2013–2015); Counsel, Dechert LLP (law firm) (2011–2013) | 51 | Independent Trustee, Series Portfolios Trust (since 2015) (10 portfolios) |
Pamela H. Conroy 615 East Michigan St. Milwaukee, WI 53202 Year of birth: 1961 | Trustee and Nominating and Governance Committee Chair | Indefinite term; since 2019 | Retired; formerly Executive Vice President, Chief Operating Officer & Chief Compliance Officer, Institutional Capital Corporation (investment firm) (1994–2008) | 51 | Independent Trustee, Frontier Funds, Inc. (since 2020) (6 portfolios) |
Interested Trustee* |
| ||||
Paul R. Fearday, CPA 615 East Michigan St. Milwaukee, WI 53202 Year of birth: 1979 | Trustee and Chairman | Indefinite term; since 2019 | Senior Vice President, U.S. Bank, N.A. (since 2022); Senior Vice President, U.S. Bancorp Fund Services, LLC (2008–2022) | 51 | None |
* | This Trustee is considered an “Interested Trustee” as defined in the 1940 Act because of his affiliation with U.S. Bancorp Fund Services, d/b/a U.S. Bank Global Fund Services and U.S. Bank N.A., which provide fund accounting, administration, transfer agency and custodian services to the Funds. |
60
TrueShares Structured Outcome ETFs
Board of Trustees and Officers
December 31, 2023 (Unaudited) (Continued)
The officers of the Trust conduct and supervise the Trust’s and the Funds’ daily business. Additional information about each officer of the Trust is as follows:
Name, Address and Year of Birth | Position(s) | Term of Office | Principal Occupation(s) During Past 5 Years |
Officers | |||
Gregory C. Bakken 615 East Michigan St. Milwaukee, WI 53202 Year of birth: 1983 | President and Principal Executive Officer | Indefinite term, February 2019 | Vice President, U.S. Bancorp Fund Services, LLC (since 2006) |
Travis G. Babich 615 East Michigan St. Milwaukee, WI 53202 Year of birth: 1980 | Treasurer and Principal Financial Officer | Indefinite term, September 2019 | Vice President, U.S. Bancorp Fund Services, LLC (since 2005) |
Kacie G. Briody 615 East Michigan St. Milwaukee, WI 53202 Year of birth: 1992 | Assistant Treasurer | Indefinite term, March 2019 | Assistant Vice President, U.S. Bancorp Fund Services, LLC (since 2021); Officer, U.S. Bancorp Fund Services, LLC (2014 to 2021) |
Rachel A. Spearo 615 East Michigan St. Milwaukee, WI 53202 Year of birth: 1979 | Secretary | Indefinite term, November 2023 | Vice President (since 2021), U.S. Bancorp Fund Services, LLC; Vice President (2004 to 2019), U.S. Bancorp Fund Services, LLC |
Christi C. Powitzky 615 East Michigan St. Milwaukee, WI 53202 Year of birth: 1974 | Chief Compliance Officer and Anti-Money Laundering Officer | Indefinite term, July 2022 | Senior Vice President, U.S. Bancorp Fund Services, LLC (since 2022); Principal Consultant, ACA Group (2021 to 2022); Lead Manager, Communications Compliance, T. Rowe Price Investment Services, Inc. (2018 to 2021); Compliance & Legal Manager, CR Group LP (2017 to 2018) |
Jay S. Fitton 615 East Michigan St. Milwaukee, WI 53202 Year of birth: 1970 | Assistant Secretary | Indefinite term, May 2023 | Vice President, U.S. Bancorp Fund Services, LLC (since 2022); Assistant Vice President, U.S. Bancorp Fund Services, LLC (2019 to 2022); Partner, Practus, LLP (2018 to 2019); Counsel, Drinker Biddle & Reath LLP (2016 to 2018) |
61
TrueShares Structured Outcome ETFs
Supplemental Information
(Unaudited)
Investors should consider the investment objective and policies, risk considerations, charges and ongoing expenses of an investment carefully before investing. The prospectus contains this and other information relevant to an investment in the Funds. Please read the prospectus carefully before investing. A copy of the Prospectus for the Funds may be obtained without charge by writing to the Funds, c/o U.S. Bank Global Fund Services, P.O. Box 701, Milwaukee, Wisconsin 53201-0701, by calling 1-800-617-0004, or by visiting the Funds’ website at www.true-shares.com.
QUARTERLY PORTFOLIO HOLDING INFORMATION
Each Fund files its complete schedule of portfolio holdings for its first and third fiscal quarters with the Securities and Exchange Commission (“SEC”) on Part F of Form N-PORT. The Funds’ Part F of Form N-PORT is available without charge, upon request, by calling toll-free at 1-800-617-0004. Furthermore, you may obtain the Part F of Form N-PORT on the SEC’s website at www.sec.gov, or by visiting the Funds’ website at www.true-shares.com.
PROXY VOTING INFORMATION
Each Fund is required to file a Form N-PX, with the Fund’s complete proxy voting record for the 12 months ended June 30, no later than August 31 of each year. The Fund’s proxy voting record will be available without charge, upon request, by calling toll-free 1-800-617-0004 and on the SEC’s website at www.sec.gov.
FREQUENCY DISTRIBUTION OF PREMIUMS AND DISCOUNTS
Information regarding how often shares of the Funds trade on an exchange at a price above (i.e., at a premium) or below (i.e., at a discount) the NAV of the Funds is available without charge, on the Funds’ website at www.true-shares.com.
TAX INFORMATION
The percent of taxable ordinary income distributions that are designated as short-term capital gain distributions under Internal Revenue Section 871(k)(2)(C) for the fiscal year ended December 31, 2023, was as follows:
TrueShares Structured Outcome (July) ETF | 0.00% |
TrueShares Structured Outcome (August) ETF | 0.00% |
TrueShares Structured Outcome (September) ETF | 0.00% |
TrueShares Structured Outcome (October) ETF | 0.00% |
TrueShares Structured Outcome (November) ETF | 0.00% |
TrueShares Structured Outcome (December) ETF | 0.00% |
TrueShares Structured Outcome (January) ETF | 0.00% |
TrueShares Structured Outcome (February) ETF | 0.00% |
TrueShares Structured Outcome (March) ETF | 94.55% |
TrueShares Structured Outcome (April) ETF | 0.00% |
TrueShares Structured Outcome (May) ETF | 0.00% |
TrueShares Structured Outcome (June) ETF | 0.00% |
62
TrueShares Structured Outcome ETFs
Privacy Policy
(Unaudited)
We are committed to respecting the privacy of personal information you entrust to us in the course of doing business with us.
The Funds collect non-public information about you from the following sources:
● | Information we receive about you on applications or other forms; |
● | Information you give us orally; and/or |
● | Information about your transactions with us or others. |
We do not disclose any non-public personal information about our customers or former customers without the customer’s authorization, except as permitted by law or in response to inquiries from governmental authorities. We may share information with affiliated and unaffiliated third parties with whom we have contracts for servicing the Funds. We will provide unaffiliated third parties with only the information necessary to carry out their assigned responsibilities. We maintain physical, electronic and procedural safeguards to guard your non-public personal information and require third parties to treat your personal information with the same high degree of confidentiality.
In the event that you hold shares of the Funds through a financial intermediary, including, but not limited to, a broker-dealer, bank, or trust company, the privacy policy of your financial intermediary would govern how your non-public personal information would be shared by those entities with unaffiliated third parties.
63
THIS PAGE INTENTIONALLY LEFT BLANK
THIS PAGE INTENTIONALLY LEFT BLANK
Investment Adviser:
TrueMark Investments, LLC
433 W. Van Buren St., 1150-E
Chicago, IL 60607
Investment Sub-Adviser:
SpiderRock Advisors, LLC
300 South Wacker Drive, Suite 2840
Chicago, IL 60606
Legal Counsel:
Morgan, Lewis & Bockius LLP
1111 Pennsylvania Avenue, N.W.
Washington, D.C. 20004
Independent Registered Public Accounting Firm:
Cohen & Company, Ltd.
1350 Euclid Avenue, Suite 800
Cleveland, OH 44115
Distributor:
Foreside Fund Services, LLC
Three Canal Plaza, Suite 100
Portland, ME 04101
Administrator, Fund Accountant & Transfer Agent:
U.S. Bancorp Fund Services, LLC
d/b/a U.S. Bank Global Fund Services
615 E. Michigan St.
Milwaukee, WI 53202
Custodian:
U.S. Bank N.A.
1555 North RiverCenter Drive, Suite 302
Milwaukee, WI 53212
This information must be preceded or accompanied by a current prospectus for the Funds.
| (b) | Not applicable. |
Item 2. Code of Ethics.
The registrant has adopted a code of ethics that applies to the registrant’s principal executive officer and principal financial officer. The Registrant has not made any substantive amendments to its code of ethics during the period covered by this report. The registrant has not granted any waivers from any provisions of the code of ethics during the period covered by this report.
A copy of the registrant’s Code of Ethics is filed herewith.
Item 3. Audit Committee Financial Expert.
The registrant’s Board of Trustees has determined that there is at least one audit committee financial expert serving on its audit committee. Mr. John Jacobs is the “audit committee financial expert” and is considered to be “independent” as each term is defined in Item 3 of Form N-CSR.
Item 4. Principal Accountant Fees and Services.
The registrant has engaged its principal accountant to perform audit services, audit-related services, tax services and other services during the past fiscal year. “Audit services” refer to performing an audit of the registrant’s annual financial statements or services that are normally provided by the accountant in connection with statutory and regulatory filings or engagements for the fiscal year. “Audit-related services” refer to the assurance and related services by the principal accountant that are reasonably related to the performance of the audit. “Tax services” refer to professional services rendered by the principal accountant for tax compliance, tax advice, and tax planning. There were no “Other services” provided by the principal accountant. The following table details the aggregate fees billed or expected to be billed for the last two fiscal years for audit fees, audit-related fees, tax fees and other fees by the principal accountant.
| FYE 12/31/2023 | FYE 12/31/2022 | |||||||
| Audit Fees | $84,000 | $84,000 | ||||||
| Audit-Related Fees | $0 | $0 | ||||||
| Tax Fees | $36,000 | $36,000 | ||||||
| All Other Fees | $0 | $0 | ||||||
(e)(1) The audit committee has adopted pre-approval policies and procedures that require the audit committee to pre-approve all audit and non-audit services of the registrant, including services provided to any entity affiliated with the registrant.
(e)(2) The percentage of fees billed by Cohen & Company, Ltd. applicable to non-audit services pursuant to waiver of pre-approval requirement were as follows:
| FYE 12/31/2023 | FYE 12/31/2022 | |
| Audit-Related Fees | 0% | 0% |
| Tax Fees | 0% | 0% |
| All Other Fees | 0% | 0% |
(f) All of the principal accountant’s hours spent on auditing the registrant’s financial statements were attributed to work performed by full-time permanent employees of the principal accountant.
(g) The following table indicates the non-audit fees billed or expected to be billed by the registrant’s accountant for services to the registrant and to the registrant’s investment adviser (and any other controlling entity, etc.—not sub-adviser) for the last two years.
| Non-Audit Related Fees | FYE 12/31/2023 | FYE 12/31/2022 |
| Registrant | N/A | N/A |
| Registrant’s Investment Adviser | N/A | N/A |
(h) The audit committee of the board of trustees/directors has considered whether the provision of non-audit services that were rendered to the registrant’s investment adviser is compatible with maintaining the principal accountant’s independence and has concluded that the provision of such non-audit services by the accountant has not compromised the accountant’s independence.
The registrant has not been identified by the U.S. Securities and Exchange Commission as having filed an annual report issued by a registered public accounting firm branch or office that is located in a foreign jurisdiction where the Public Company Accounting Oversight Board is unable to inspect or completely investigate because of a position taken by an authority in that jurisdiction.
The registrant is not a foreign issuer.
Item 5. Audit Committee of Listed Registrants.
| (a) | The registrant is an issuer as defined in Rule 10A-3 under the Securities Exchange Act of 1934, (the “Act”) and has a separately-designated standing audit committee established in accordance with Section 3(a)(58)(A) of the Act. The entire Board of Trustees is acting as the registrant’s audit committee. |
| (b) | Not applicable. |
Item 6. Investments.
| (a) | Schedule of Investments is included as part of the report to shareholders filed under Item 1 of this Form. |
| (b) | Not applicable. |
Item 7. Disclosure of Proxy Voting Policies and Procedures for Closed-End Management Investment Companies.
Not applicable to open-end investment companies.
Item 8. Portfolio Managers of Closed-End Management Investment Companies.
Not applicable to open-end investment companies.
Item 9. Purchases of Equity Securities by Closed-End Management Investment Company and Affiliated Purchasers.
Not applicable to open-end investment companies.
Item 10. Submission of Matters to a Vote of Security Holders.
There have been no material changes to the procedures by which shareholders may recommend nominees to the registrant’s Board of Trustees.
Item 11. Controls and Procedures.
| (a) | The Registrant’s President and Treasurer have reviewed the Registrant’s disclosure controls and procedures (as defined in Rule 30a-3(c) under the Investment Company Act of 1940 (the “Act”)) as of a date within 90 days of the filing of this report, as required by Rule 30a-3(b) under the Act and Rules 13a-15(b) or 15d-15(b) under the Securities Exchange Act of 1934. Based on their review, such officers have concluded that the disclosure controls and procedures are effective in ensuring that information required to be disclosed in this report is appropriately recorded, processed, summarized and reported and made known to them by others within the Registrant and by the Registrant’s service provider. |
| (b) | There were no changes in the Registrant’s internal control over financial reporting (as defined in Rule 30a-3(d) under the Act) that occurred during the period covered by this report that have materially affected, or are reasonably likely to materially affect, the Registrant’s internal control over financial reporting. |
Item 12. Disclosure of Securities Lending Activities for Closed-End Management Investment Companies
Not applicable to open-end investment companies.
Item 13. Exhibits.
| (a) | (1) Any code of ethics or amendment thereto, that is the subject of the disclosure required by Item 2, to the extent that the registrant intends to satisfy Item 2 requirements through filing an exhibit. Filed herewith. |
(2) A separate certification for each principal executive officer and principal financial officer pursuant to Section 302 of the Sarbanes-Oxley Act of 2002. Filed herewith.
(3) Any written solicitation to purchase securities under Rule 23c-1 under the Act sent or given during the period covered by the report by or on behalf of the registrant to 10 or more persons. Not applicable to open-end investment companies.
(4) Change in the registrant’s independent public accountant. There was no change in the registrant’s independent public accountant for the period covered by this report.
| (b) | Certifications pursuant to Section 906 of the Sarbanes-Oxley Act of 2002. Furnished herewith. |
SIGNATURES
Pursuant to the requirements of the Securities Exchange Act of 1934 and the Investment Company Act of 1940, the registrant has duly caused this report to be signed on its behalf by the undersigned, thereunto duly authorized.
| (Registrant) | Listed Funds Trust | |
| By (Signature and Title)* | /s/ Gregory C. Bakken | |
| Gregory C. Bakken, President/Principal Executive Officer | ||
| Date | 3/8/2024 | |
Pursuant to the requirements of the Securities Exchange Act of 1934 and the Investment Company Act of 1940, this report has been signed below by the following persons on behalf of the registrant and in the capacities and on the dates indicated.
| By (Signature and Title)* | /s/ Gregory C. Bakken | |
| Gregory C. Bakken, President/Principal Executive Officer | ||
| Date | 3/8/2024 | |
| By (Signature and Title)* | /s/ Travis G. Babich | |
| Travis G. Babich, Treasurer/Principal Financial Officer | ||
| Date | 3/8/2024 |
| * | Print the name and title of each signing officer under his or her signature. |