Exhibit 99.2
|

CARS.COM
Investor Presentation
MAY 2017
|
Safe Harbor Statement
Forward-Looking Statements
This presentation contains “forward-looking statements” within the meaning of the federal securities laws, including those statements under “Financial Objectives.” All statements other than statements of historical facts are forward-looking statements. Forward-looking statements include information concerning our business strategies, plans and objectives, market potential, future financial performance, planned operational and product improvements, liquidity and other matters. These statements often include words such as “believe,” “expect,” “project,” “anticipate,” “intend,” “plan,” “estimate,” “target,” “seek,” “will,” “may,” “would,” “should,” “could,” “forecasts,” “mission,” “strive,” “more,” “goal” or similar expressions. Forward-looking statements are based on our current expectations, beliefs, estimates, projections and assumptions, based on our experience in the industry as well as our perceptions of historical trends, current conditions, expected future developments and other factors we think are appropriate. These statements are expressed in good faith and we believe these judgments are reasonable. However, you should understand that these statements are not guarantees of performance or results. Our actual results could differ materially from those expressed in the forward-looking statements. Given these uncertainties, forward-looking statements should not be relied on in making investment decisions.
Forward-looking statements are subject to a number of risks, uncertainties and other important factors, many of which are beyond our control, that could cause our actual results to differ materially from those expressed in the forward-looking statements contained in this presentation. Such risks, uncertainties, and other important factors include, among others, risks related to our business, our separation from our parent company and our common stock. For a detailed discussion of many of these risks and uncertainties, see the section entitled “Risk Factors” in our Registration Statement on Form 10, which was filed with the Securities and Exchange Commission on May 4,
2017 (the “Registration Statement”). All forward-looking statements contained in this presentation are qualified by these cautionary statements. The forward-looking statements contained in this presentation speak only as of the date of this presentation. We undertake no obligation, other than as may be required by law, to update or revise any forward-looking or cautionary statements to reflect changes in assumptions, the occurrence of events, unanticipated or otherwise, or changes in future operating results over time or otherwise. Comparisons of results between current and prior periods are not intended to express any future trends, or indications of future performance, unless expressed as such, and should only be viewed as historical data.
The forward-looking statements in this presentation are intended to be subject to the safe harbor protection provided by the federal securities laws.
Non-GAAP Financial Measures
This presentation contains certainnon-GAAP financial measures, including EBITDA Margin, Adjusted EBITDA, Adjusted EBITDA Margin and Free Cash Flow. Thesenon-GAAP financial measures exclude the impact of certain items and, therefore, have not been calculated in accordance with GAAP. We believe thesenon-GAAP financial measures provide meaningful supplemental information about our operating performance because they exclude amounts that we do not consider part of our core operating results when assessing our performance.
We use thesenon-GAAP financial measures (a) to evaluate our historical and prospective financial performance as well as our performance relative to our competitors as they assist in highlighting trends, (b) to set internal sales targets and spending budgets, (c) to measure operational profitability and the accuracy of forecasting, (d) to assess financial discipline over operational expenditures and (e) as an important factor in determining variable compensation for management and employees. Adjusted EBITDA is also used for certain covenants and restricted activities under our debt agreements. We believe thesenon-GAAP financial measures are frequently used by securities analysts, investors and other interested parties to evaluate companies in our industry. We caution readers that our presentation of these measures may not be the same as similarly-titled measures used by other companies.Non-GAAP financial measures should not be considered in isolation or as an alternative to GAAP financial measures, but rather as supplements to GAAP financial measures. For reconciliations of thenon-GAAP financial measures to their most comparable GAAP financial measures, see the Appendix to this presentation and the section entitled “Management’s Discussion and Analysis of Financial Condition and Results of Operations” in the
Registration Statement.
No reconciliation of the forecasted range of Adjusted EBITDA Margin to net income (loss) is included in this presentation because we are unable to quantify certain amounts that would be required to be included in the GAAP measure without unreasonable efforts, including tax rates and interest expense which were not part of our financial results due to our status as a subsidiary not subject to federal income taxation. Moreover, we believe such a reconciliation would imply a degree of precision that would be confusing or misleading to investors
2
|
Spin-off Transaction Summary
1 Based Overview on
Listing
Distribution
Capital structure
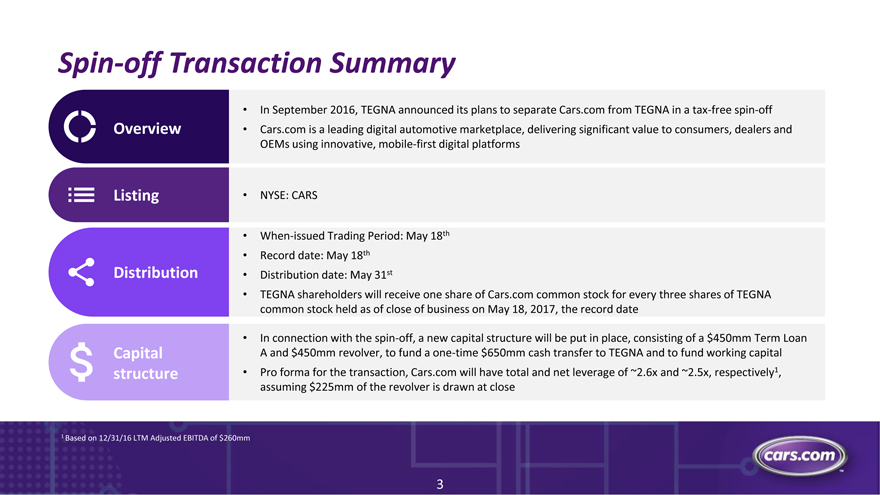
In September 2016, TEGNA announced its plans to separate Cars.com from TEGNA in atax-freespin-off
Cars.com is a leading digital automotive marketplace, delivering significant value to consumers, dealers and OEMs using innovative, mobile-first digital platforms
NYSE: CARS
When-issued Trading Period: May 18th
Record date: May 18th
Distribution date: May 31st
TEGNA shareholders will receive one share of Cars.com common stock for every three shares of TEGNA common stock held as of close of business on May 18, 2017, the record date
In connection with thespin-off, a new capital structure will be put in place, consisting of a $450mm Term Loan A and $450mm revolver, to fund aone-time $650mm cash transfer to TEGNA and to fund working capital
Pro forma for the transaction, Cars.com will have total and net leverage of ~2.6x and ~2.5x, respectively1, assuming $225mm of the revolver is drawn at close
1 Based on 12/31/16 LTM Adjusted EBITDA of $260mm
3
|
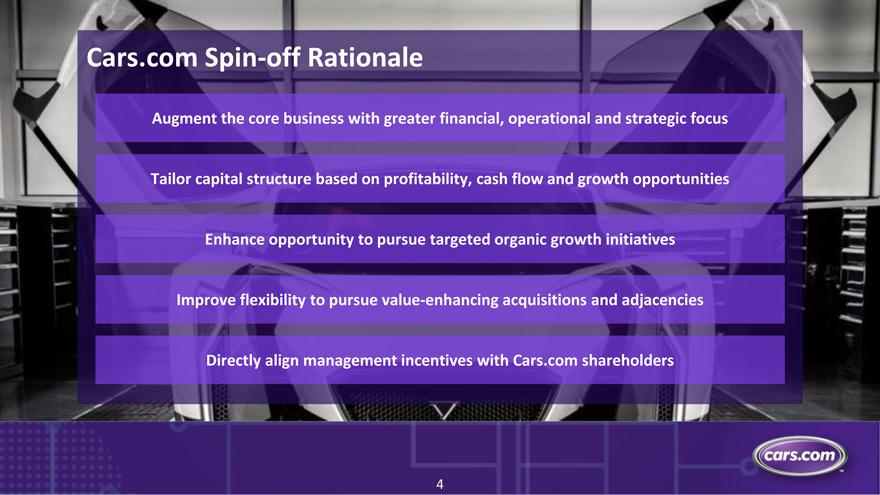
Cars.comSpin-off Rationale
Augment the core business with greater financial, operational and strategic focus Tailor capital structure based on profitability, cash flow and growth opportunities Enhance opportunity to pursue targeted organic growth initiatives Improve flexibility to pursue value-enhancing acquisitions and adjacencies Directly align management incentives with Cars.com shareholders
4
|

Company Overview
Alex Vetter,Co-Founder and Chief Executive Officer
5
|
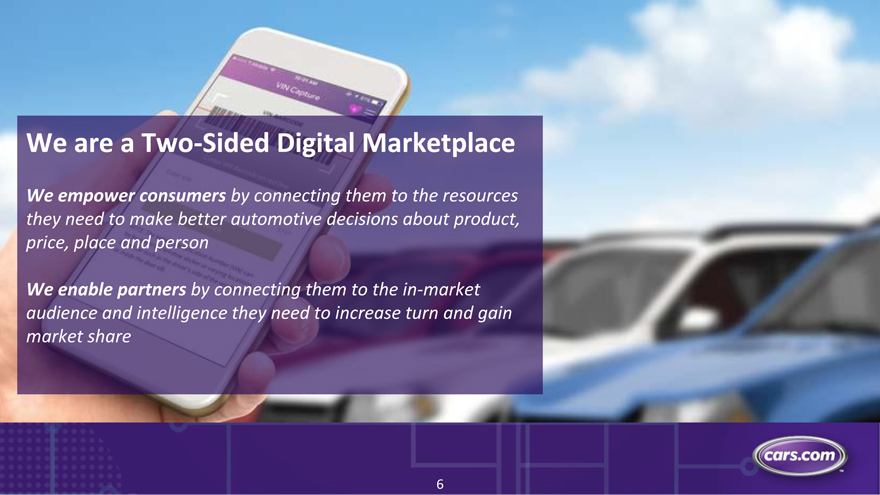
We are aTwo-Sided Digital Marketplace
We empower consumers by connecting them to the resources they need to make better automotive decisions about product, price, place and person
We enable partners by connecting them to thein-market audience and intelligence they need to increase turn and gain market share
6
|
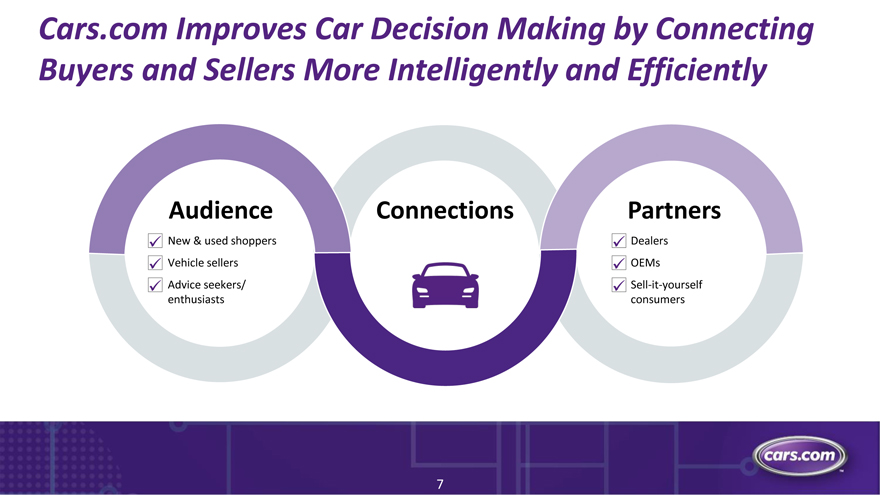
Cars.com Improves Car Decision Making by Connecting Buyers and Sellers More Intelligently and Efficiently
Audience Connections Partners
New & used shoppers Dealers Vehicle sellers OEMs Adviceseekers/ Sell-it-yourself enthusiasts consumers
7
|
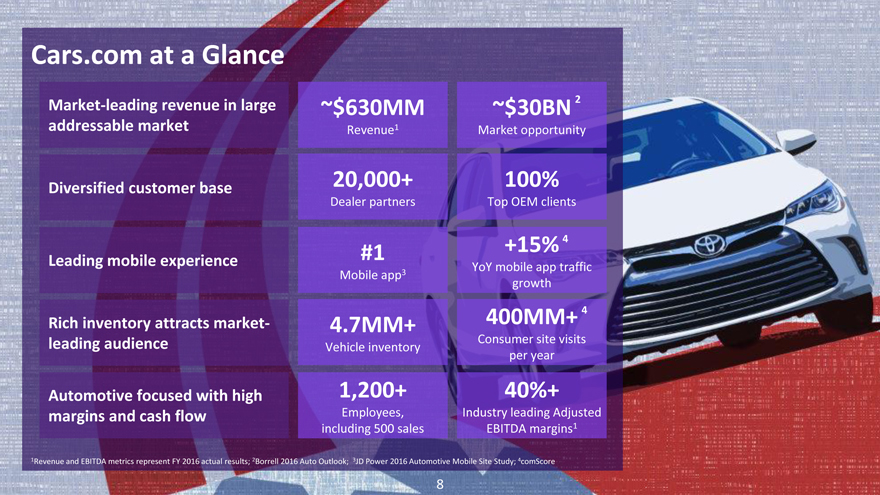
Cars.com at a Glance
Market-leading revenue in large ~$630MM ~$30BN 2
addressable market Revenue1 Market opportunity
Diversified customer base 20,000+ 100%
Dealer partners Top OEM clients
#1 +15% 4
Leading mobile experience YoY mobile app traffic
Mobile app3
growth
Rich inventory attracts market- 4.7MM+ 400MM+ 4
leading audience Vehicle inventory Consumer site visits
per year
Automotive focused with high 1,200+ 40%+
margins and cash flow Employees, Industry leading Adjusted
including 500 sales EBITDA margins1
1Revenue and EBITDA metrics represent FY 2016 actual results; 2Borrell 2016 Auto Outlook; 3JD Power 2016 Automotive Mobile Site Study; 4comScore
8
|
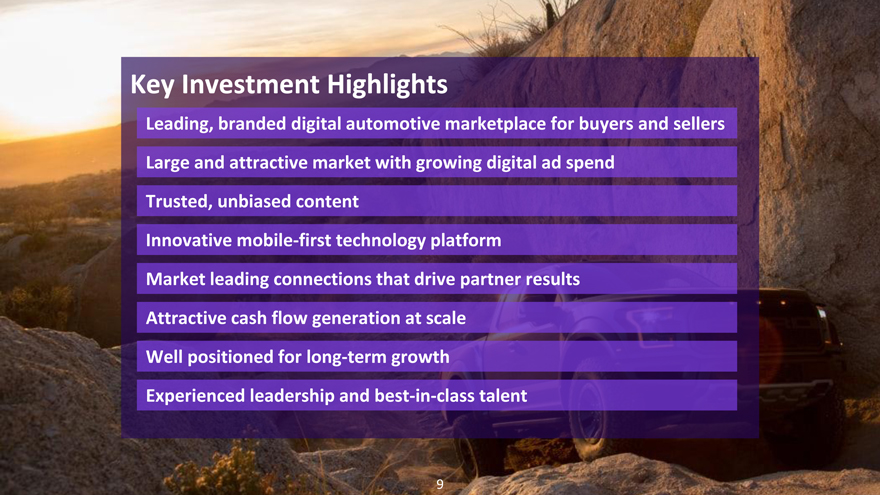
Key Investment Highlights
Leading, branded digital automotive marketplace for buyers and sellers Large and attractive market with growing digital ad spend Trusted, unbiased content Innovative mobile-first technology platform Market leading connections that drive partner results Attractive cash flow generation at scale Well positioned for long-term growth Experienced leadership andbest-in-class talent
9
|
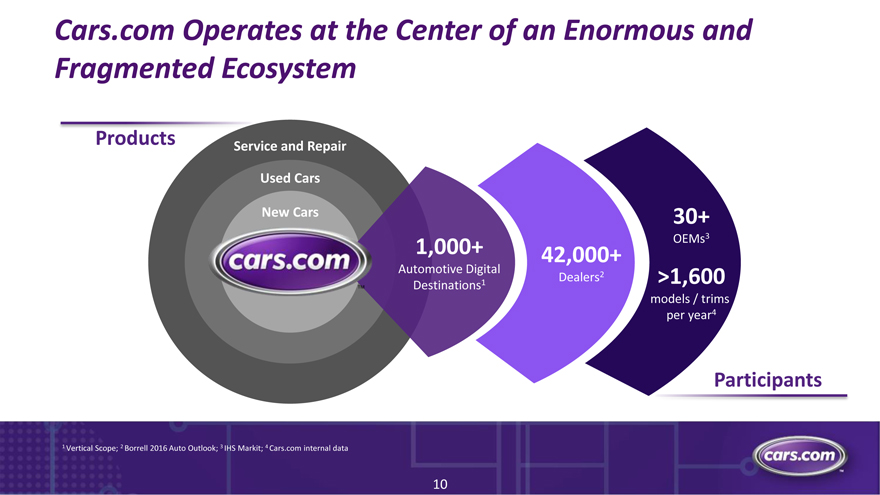
Cars.com Operates at the Center of an Enormous and
Fragmented Ecosystem
Products Service and Repair
Used Cars
New Cars 30+
OEMs3
1,000+ 42,000+
Digital
Automotive Dealers2>1,600
Destinations1
models / trims
per year4
Participants
1 Vertical Scope; 2 Borrell 2016 Auto Outlook; 3 IHS Markit; 4 Cars.com internal data
10
|
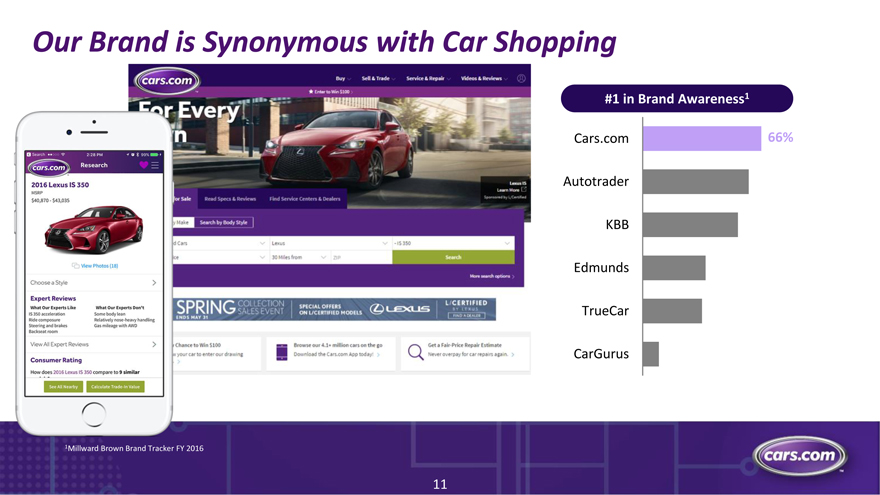
Our Brand is Synonymous with Car Shopping
#1 in Brand Awareness1
Cars.com66%
Autotrader
KBB
Edmunds
TrueCar
CarGurus
1Millward Brown Brand Tracker FY 2016
11
|
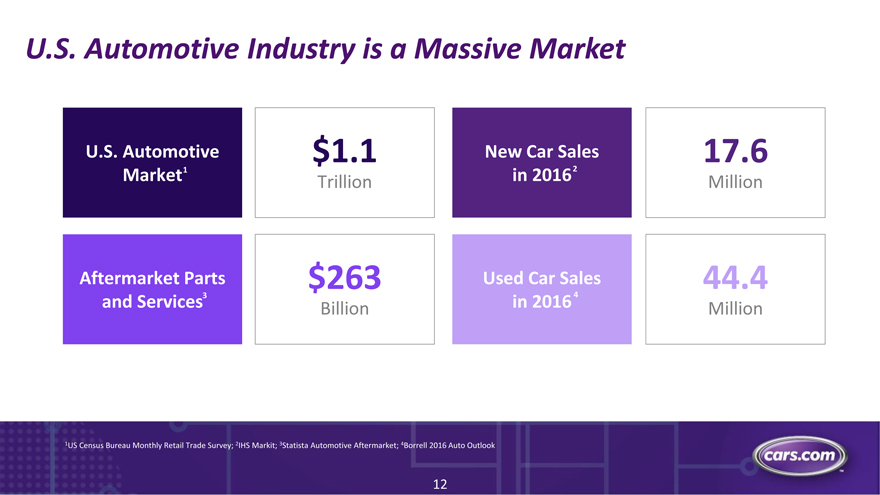
U.S. Automotive Industry is a Massive Market
U.S. Automotive $1.1 New Car Sales17.6
Market1 in 2016 2
Trillion Million
Aftermarket Parts $263 Used Car Sales44.4
and Services3 in 2016 4
Billion Million
1US Census Bureau Monthly Retail Trade Survey; 2IHS Markit; 3Statista Automotive Aftermarket; 4Borrell 2016 Auto Outlook
12
|
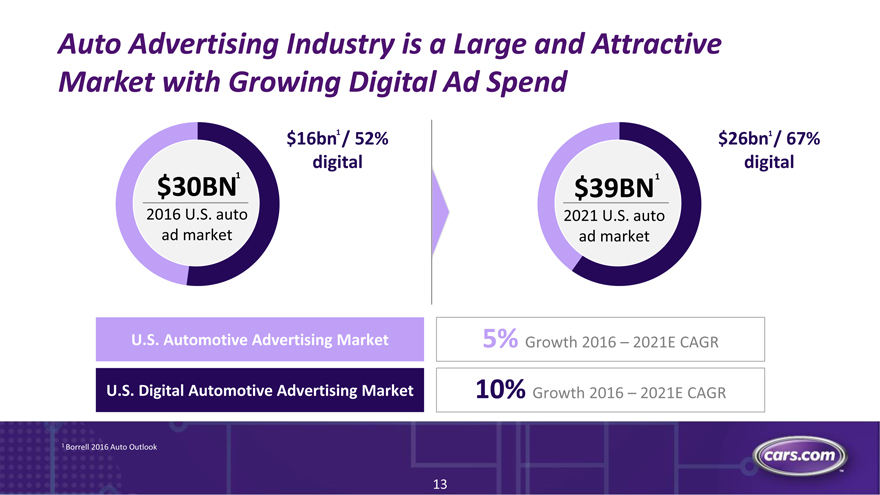
Auto Advertising Industry is a Large and Attractive
Market with Growing Digital Ad Spend
$16bn1 / 52% $26bn1 / 67%
digital digital
$30BN1 $39BN1
2016 U.S. auto 2021 U.S. auto
ad market ad market
U.S. Automotive Advertising Market 5% Growth 2016 – 2021E CAGR
U.S. Digital Automotive Advertising Market 10% Growth 2016 – 2021E CAGR
1 Borrell 2016 Auto Outlook
13
|
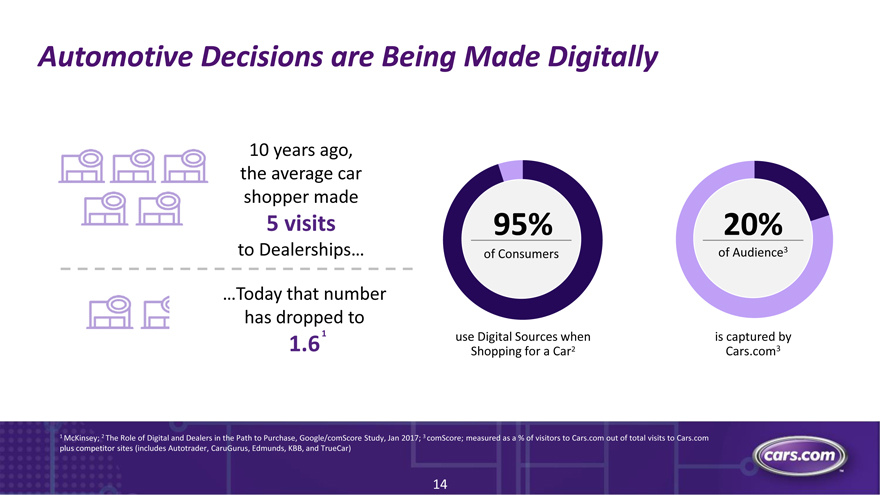
Automotive Decisions are Being Made Digitally
10 years ago,
the average car
shopper made
5 visits 95% 20%
to Dealerships… of Consumers of Audience3
…Today that number
has dropped to
1.6 1 use Digital Sources when is captured by
Shopping for a Car2 Cars.com3
1 McKinsey; 2 The Role of Digital and Dealers in the Path to Purchase, Google/comScore Study, Jan 2017; 3 comScore; measured as a % of visitors to Cars.com out of total visits to Cars.com
plus competitor sites (includes Autotrader, CaruGurus, Edmunds, KBB, and TrueCar)
14
|

Expert Advice and Unbiased Coverage Empower
Consumers in the Auto-buying Process
15
|

Video: Cars.com Knows Cars
|
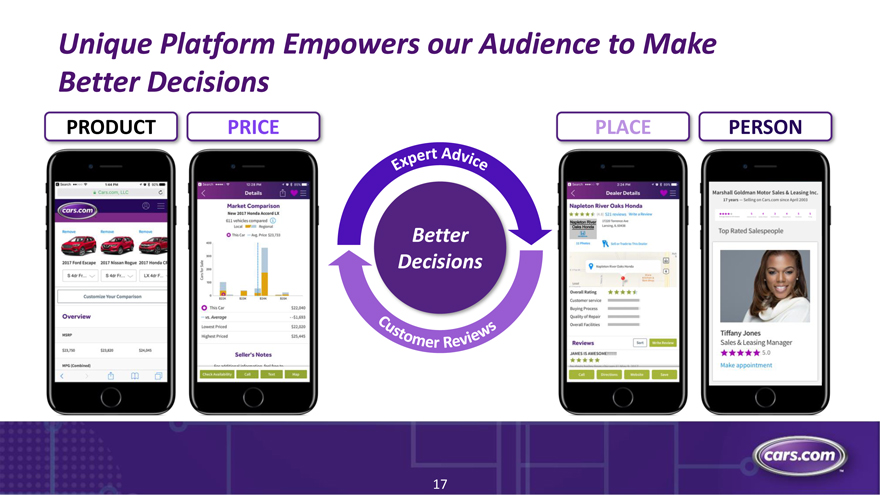
Unique Platform Empowers our Audience toMake
Better Decisions
Better
Decisions
17
|
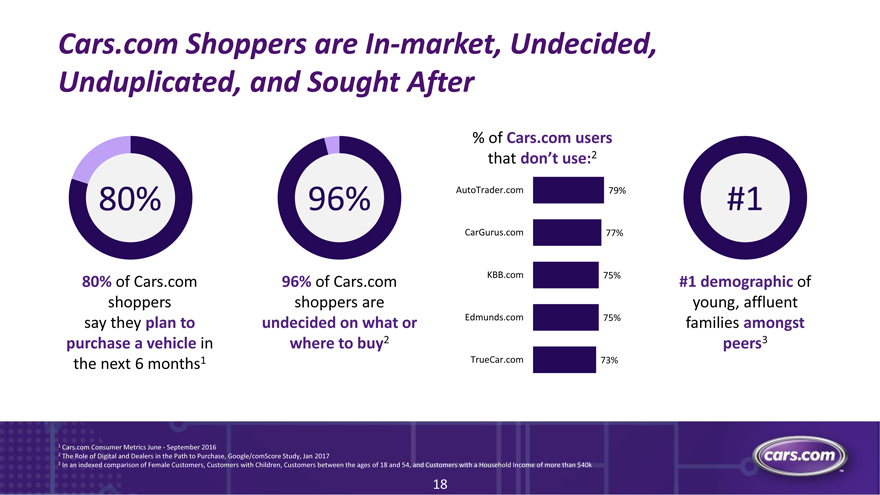
Cars.com Shoppers areIn-market, Undecided,
Unduplicated, and Sought After
% of Cars.com users
that don’t use:2
80% 96% AutoTrader.com79%#1
CarGurus.com77%
80% of Cars.com 96% of Cars.com KBB.com75%#1 demographic of
shoppers shoppers are young, affluent
say they plan to undecided on what or Edmunds.com75%families amongst
purchase a vehicle in where to buy2 peers3
the next 6 months1 TrueCar.com73%
1 Cars.com Consumer Metrics June—September 2016
2 The Role of Digital and Dealers in the Path to Purchase, Google/comScore Study, Jan 2017
3 In an indexed comparison of Female Customers, Customers with Children, Customers between the ages of 18 and 54, and Customers with a Household Income of more than $40k
18
|
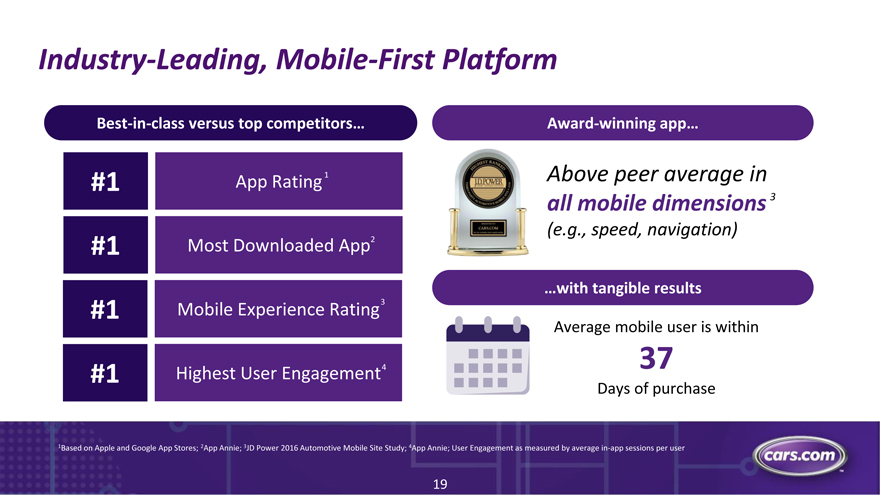
Industry-Leading, Mobile-First Platform
Best-in-class versus top competitors… Award-winning app…
#1 App Rating 1 Above peer average in
all mobile dimensions 3
(e.g., speed, navigation)
#1 Most Downloaded App2
…with tangible results
#1 Mobile Experience Rating 3
Average mobile user is within
#1 Highest User Engagement4 37
Days of purchase
1Based on Apple and Google App Stores; 2App Annie; 3JD Power 2016 Automotive Mobile Site Study; 4App Annie; User Engagement as measured by averagein-app sessions per user
19
|
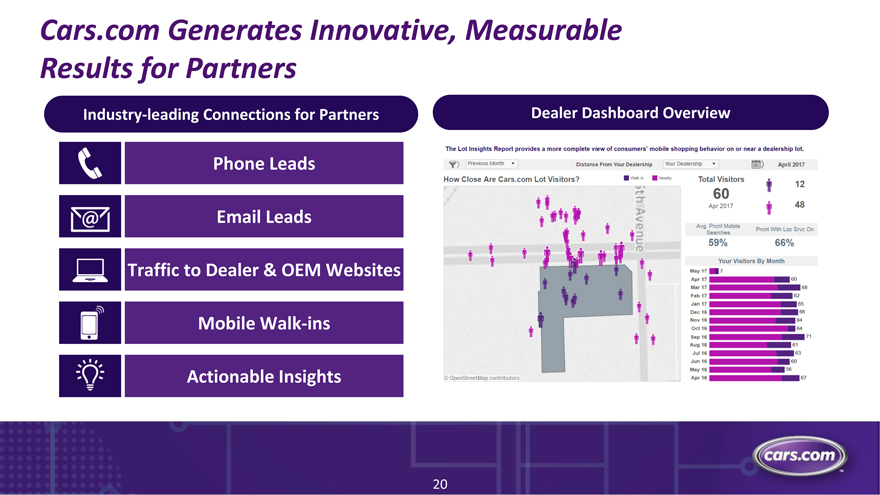
Cars.com Generates Innovative, Measurable
Results for Partners
Industry-leading Connections for Partners Dealer Dashboard Overview
Phone Leads
Email Leads
Traffic to Dealer & OEM Websites
MobileWalk-ins
Actionable Insights
20
|
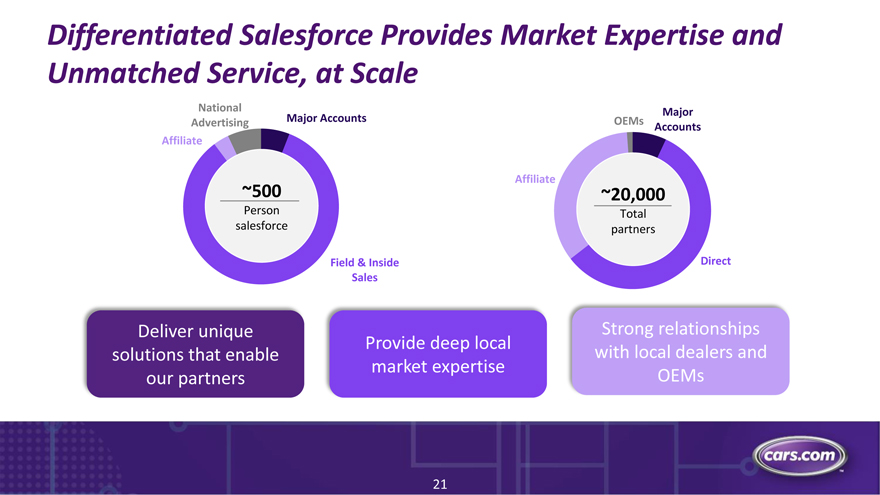
Differentiated Salesforce Provides Market Expertise and
Unmatched Service, at Scale
National Major
Advertising Major Accounts OEMs Accounts
Affiliate
Affiliate
~500 ~20,000
Person Total
salesforce partners
Field & Inside Direct
Sales
Deliver unique Strong relationships
Provide deep local
solutions that enable with local dealers and
market expertise
our partners OEMs
21
|
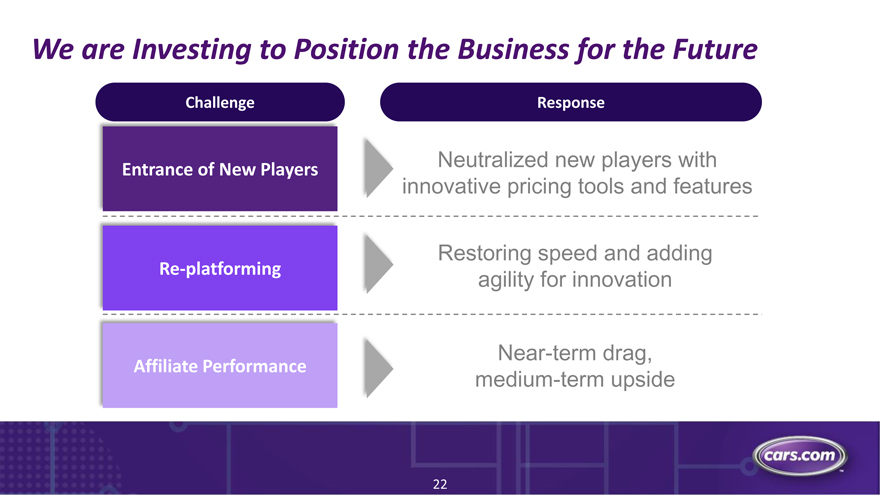
We are Investing to Position the Business for the Future
Challenge Response
Entrance of New Players Neutralized new players with
innovative pricing tools and features
Restoring speed and adding
Re-platforming agility for innovation
Near-term drag,
Affiliate Performance
medium-term upside
22
|
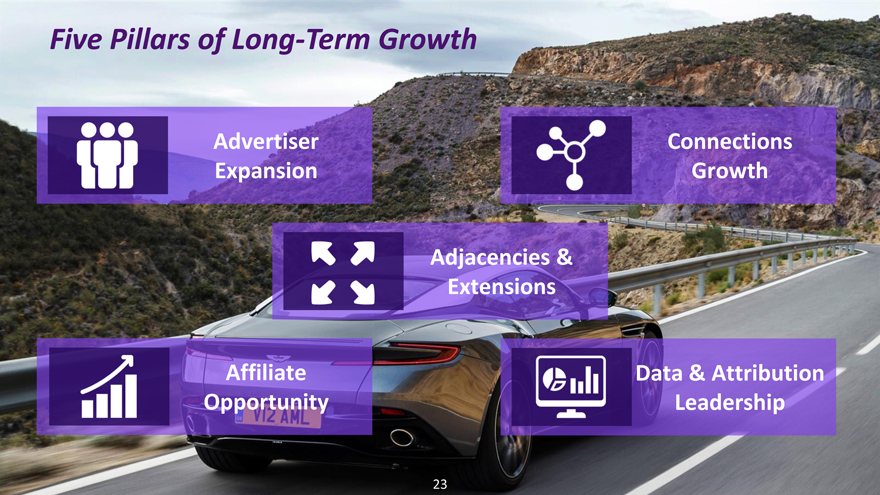
Five Pillars of Long-TermGrowth
AdvertiserConnections
ExpansionGrowth
Adjacencies &
Extensions
AffiliateData & Attribution
OpportunityLeadership
23
|
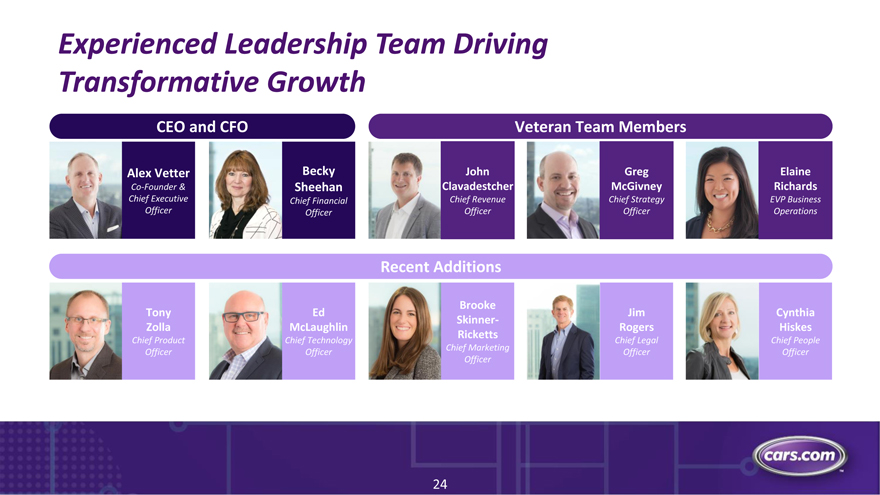
Experienced Leadership Team Driving
Transformative Growth
CEO and CFO Veteran Team Members
Alex Vetter Becky JohnGregElaine
Co-Founder & Sheehan ClavadestcherMcGivneyRichards
Chief Executive Chief Financial Chief RevenueChief StrategyEVP Business
Officer Officer OfficerOfficerOperations
Recent Additions
Brooke
Tony Ed JimCynthia
Skinner-
Zolla McLaughlin RogersHiskes
Ricketts
Chief Product Chief Technology Chief LegalChief People
Chief Marketing
Officer Officer OfficerOfficer
Officer
24
5 |
Financial Overview
Becky Sheehan, Chief Financial Officer
25
|
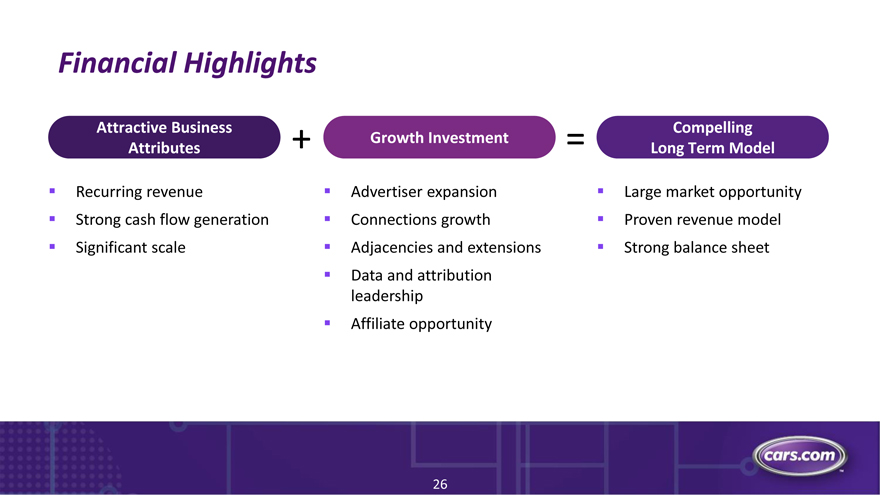
Financial Highlights
Attractive Business +Growth Investment=Compelling
Attributes Long Term Model
Recurring revenue Advertiser expansion Large market opportunity
Strong cash flow generation Connections growth Proven revenue model
Significant scale Adjacencies and extensions Strong balance sheet
Data and attribution
leadership
Affiliate opportunity
26
|
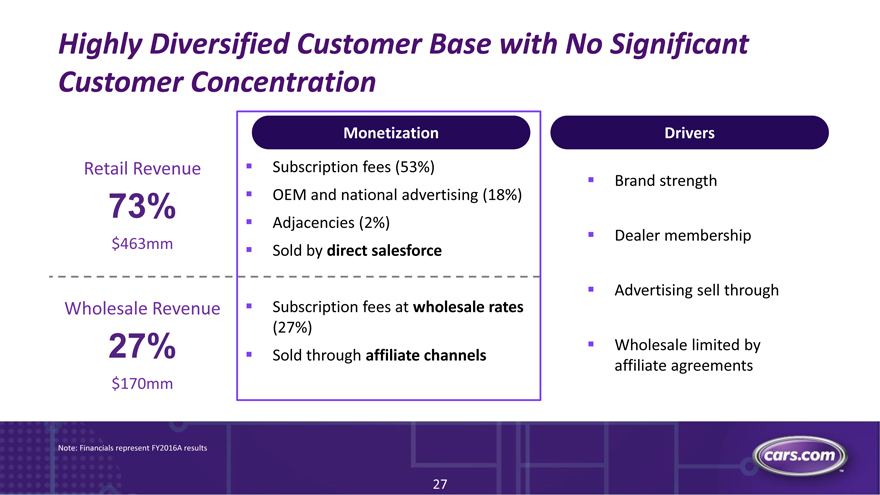
Highly Diversified Customer Base with No Significant
Customer Concentration
MonetizationDrivers
Retail Revenue Subscription fees (53%) Brand strength
73% OEM and national advertising (18%)
Adjacencies (2%)
Dealer membership
$463mm Sold by direct salesforce
Advertising sell through
Wholesale Revenue Subscription fees at wholesale rates
(27%)
27% Wholesale limited by
Sold through affiliate channels
affiliate agreements
$170mm
Note: Financials represent FY2016A results
27
|
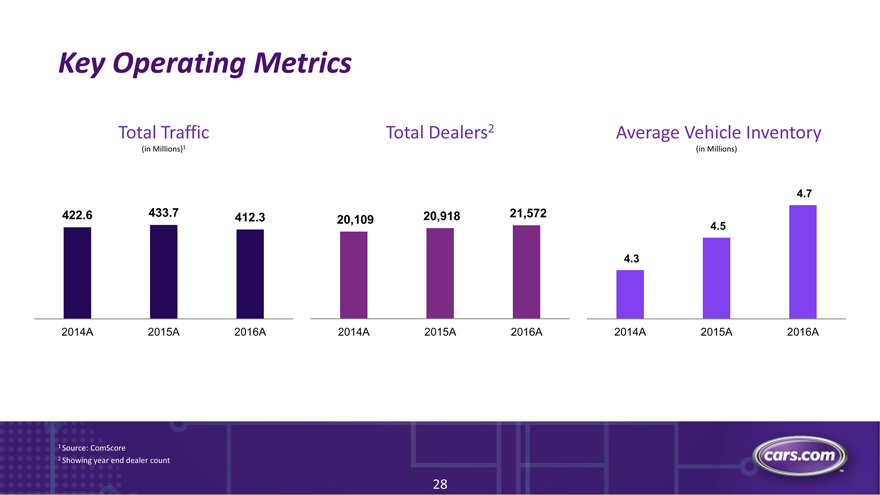
Key Operating Metrics
Total Traffic Total Dealers2Average Vehicle Inventory
(in Millions)1 (in Millions)
4.7
422.6 433.7 412.320,10920,91821,5724.5
4.3
2014A 2015A 2016A2014A2015A2016A2014A2015A2016A
1 Source: ComScore
2 Showing year end dealer count
28
|
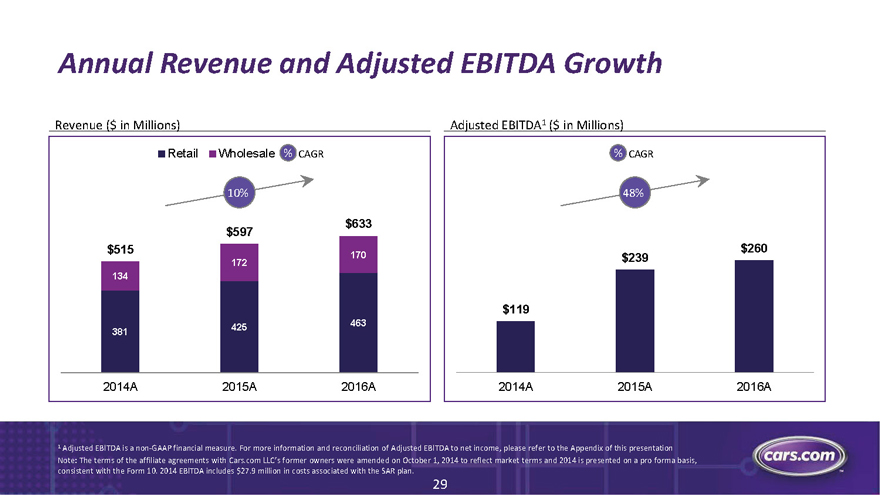
Annual Revenue and Adjusted EBITDA Growth
Revenue ($ in Millions) Adjusted EBITDA1 ($ in Millions)
Retail Wholesale % CAGR % CAGR
10% 48%
$597 $633
$515 $260
172 170$239
134
$119
425 463
381
2014A 2015A 2016A2014A2015A2016A
1 Adjusted EBITDA is anon-GAAP financial measure. For more information and reconciliation of Adjusted EBITDA to net income, please refer to the Appendix of this presentation
Note: The terms of the affiliate agreements with Cars.com LLC’s former owners were amended on October 1, 2014 to reflect market terms and 2014 is presented on a pro forma basis,
consistent with the Form 10. 2014 EBITDA includes $27.9 million in costs associated with the SAR plan.
29
|
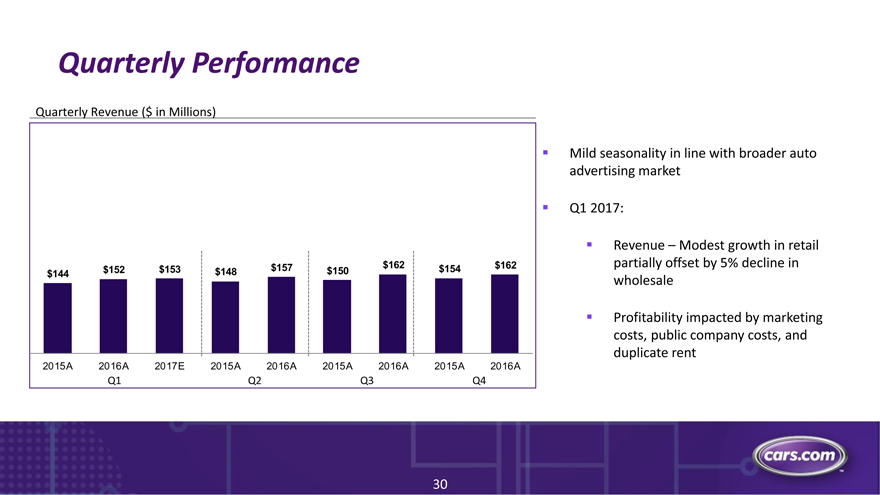
Quarterly Performance
Quarterly Revenue ($ in Millions)
Mild seasonality in line with broader auto
advertising market
Q1 2017:
Revenue – Modest growth in retail
$144 $152 $153$148$157$150$162$154$162partially offset by 5% decline in
wholesale
Profitability impacted by marketing
costs, public company costs, and
duplicate rent
2015A 2016A 2017E2015A2016A2015A2016A2015A2016A
Q1 Q2Q3Q4
30
|
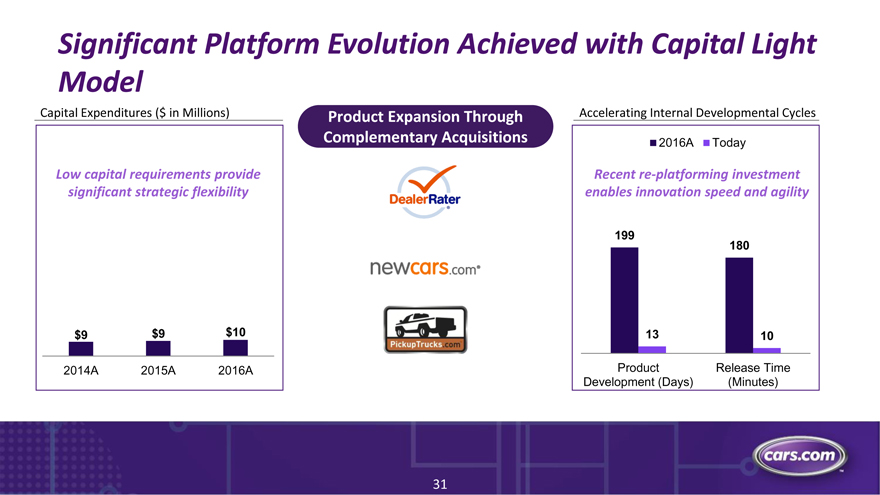
Significant Platform Evolution Achieved with Capital Light
Model
Capital Expenditures ($ in Millions) Product Expansion Through Accelerating Internal Developmental Cycles
Complementary Acquisitions2016AToday
Low capital requirements provide Recentre-platforming investment
significant strategic flexibility enables innovation speed and agility
199
180
$9 $9 $101310
2014A 2015A 2016AProductRelease Time
Development (Days)(Minutes)
31
|
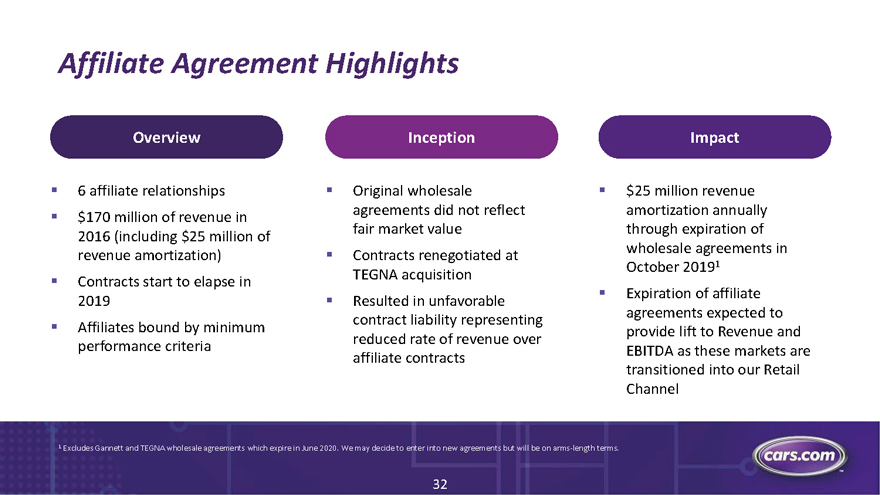
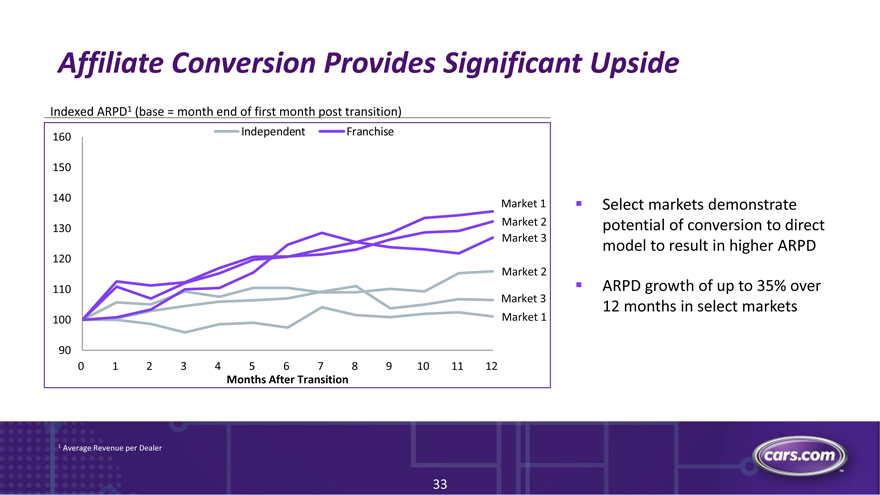
Affiliate Agreement Highlights
Overview InceptionImpact
6 affiliate relationships Original wholesale $25 million revenue
$170 million of revenue in agreements did not reflectamortization annually
2016 (including $25 million of fair market valuethrough expiration of
revenue amortization) Contracts renegotiated atwholesale agreements in
October 20191
Contracts start to elapse in TEGNA acquisition
2019 Resulted in unfavorable Expiration of affiliate
agreements expected to
Affiliates bound by minimum contract liability representingprovide lift to Revenue and
reduced rate of revenue over
performance criteria EBITDA as these markets are
affiliate contracts
transitioned into our Retail
Channel
1 Excludes Gannett and TEGNA wholesale agreements which expire in June 2020. We may decide to enter into new agreements but will be on arms-length terms.
32
|
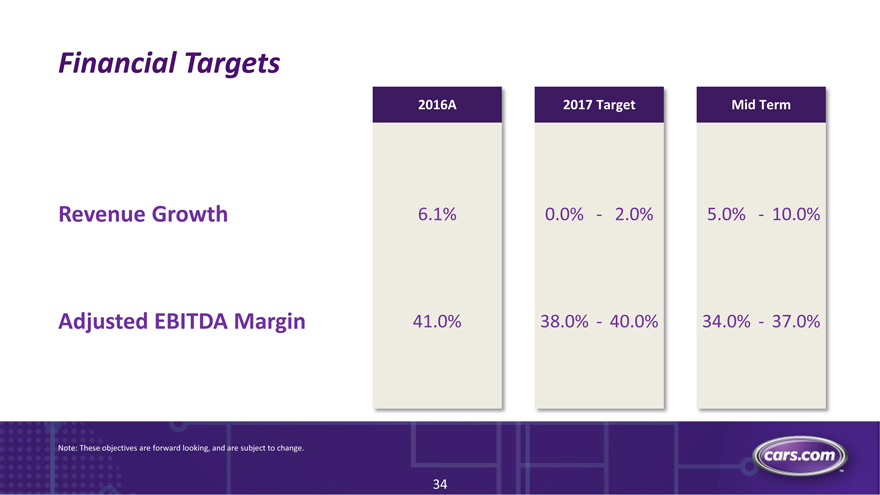
Financial Targets
2016A 2017TargetMid Term
Revenue Growth 6.1% 0.0%- 2.0%5.0%- 10.0%
Adjusted EBITDA Margin 41.0% 38.0%- 40.0%34.0%- 37.0%
Note: These objectives are forward looking, and are subject to change.
34
|

CARS.COM
Investor Presentation
MAY 2017
|

Closing Remarks
|

Appendix
35
|
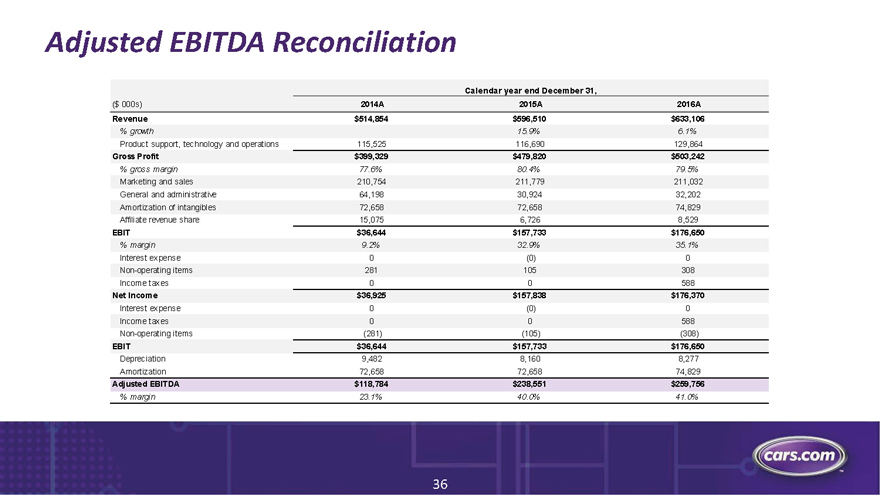
Adjusted EBITDA Reconciliation
Calendar year end December 31,
($ 000s) 2014A 2015A2016A
Revenue $514,854 $596,510$633,106
% growth 15.9%6.1%
Product support, technology and operations 115,525 116,690129,864
Gross Profit $399,329 $479,820$503,242
% gross margin 77.6% 80.4%79.5%
Marketing and sales 210,754 211,779211,032
General and administrative 64,198 30,92432,202
Amortization of intangibles 72,658 72,65874,829
Affiliate revenue share 15,075 6,7268,529
EBIT $36,644 $157,733$176,650
% margin 9.2% 32.9%35.1%
Interest expense 0 (0)0
Non-operating items 281 105308
Income taxes 0 0588
Net Income $36,925 $157,838$176,370
Interest expense 0 (0)0
Income taxes 0 0588
Non-operating items (281) (105)(308)
EBIT $36,644 $157,733$176,650
Depreciation 9,482 8,1608,277
Amortization 72,658 72,65874,829
Adjusted EBITDA $118,784 $238,551$259,756
% margin 23.1% 40.0%41.0%
36
|

CARS.COM
Investor Presentation
MAY 2017