Exhibit 99.1
Summer 2019Investor Presentation
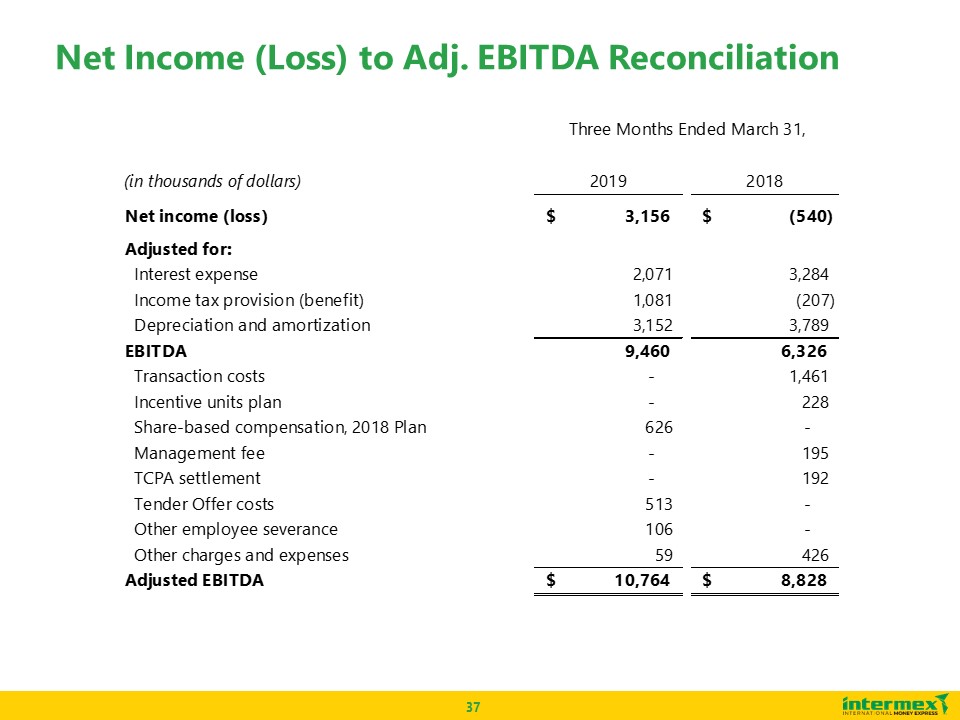
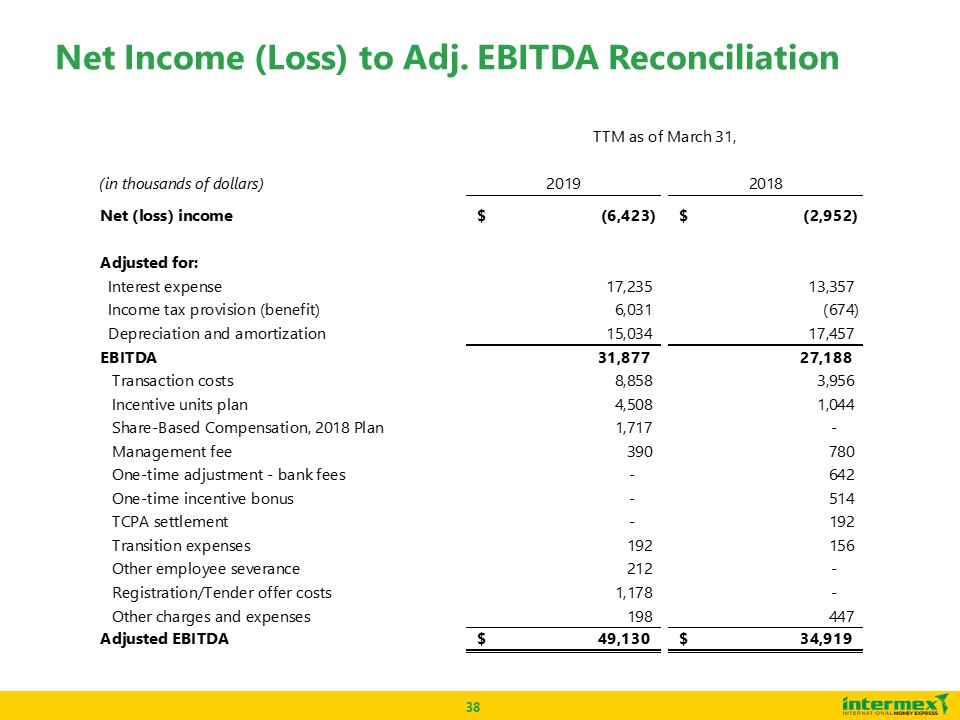
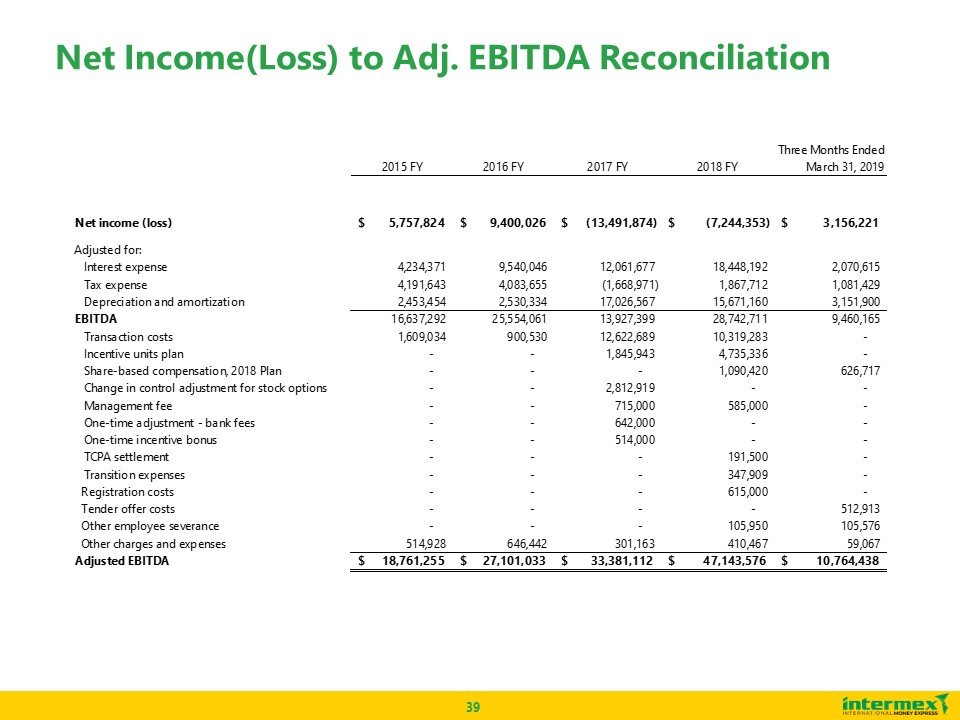
This presentation contains “forward-looking statements” within the meaning of Section 27A of the Securities Act of 1933, as amended, and Section 21E of the Securities Exchange Act of 1934, as amended, which reflect our current view with respect to certain events that could have an effect on our future financial performance. These statements relate to expectations concerning matters that are not historical fact and may include the words or phrases such as “will,” “should,” “expects,” “believes,” “anticipates,” “plans,” “intends,” “estimates,” “approximately,” “our planning assumptions,” “future outlook,” and similar expressions. Except for historical information, matters discussed in such statements are forward-looking statements. All of these forward-looking statements are based largely on information currently available to our management and on our current expectations, assumptions, estimates, judgments and projections about our business and our industry, and are subject to various risks and uncertainties that could cause actual results to differ materially from historical results or those currently anticipated. While we believe these expectations, assumptions, estimates, judgments and projections are reasonable, such forward-looking statements are only predictions and involve known and unknown risks and uncertainties, many of which are beyond our control. These and other important factors may cause our actual results, performance or achievements to differ materially from any future results, performance or achievements expressed or implied by these forward-looking statements, or could affect our share price. Accordingly, there is no assurance that our expectations will, in fact, occur or that our estimates or assumptions will be correct, and we caution investors and all others not to place undue reliance on such forward-looking statements. Some of the factors that could cause actual results to differ materially from those expressed or implied by the forward-looking statements include among other things, competition in the markets in which we operate; our ability to maintain agent relationships on terms consistent with those currently in place; our ability to maintain banking relationships necessary for us to conduct our business; credit risks from our agents and the financial institutions with which we do business; bank failures, sustained financial market illiquidity, or illiquidity at our clearing, cash management or custodial financial institutions; new technology or competitors that disrupt the current ecosystem; cyber-attacks or disruptions to our information technology, computer network systems and data centers; our success in developing and introducing new products, services and infrastructure; customer confidence in our brand and in consumer money transfers generally; our ability to maintain compliance with the regulatory requirements of the jurisdictions in which we operate or plan to operate; international political factors or implementation of tariffs, border taxes or restrictions on remittances or transfers of money out of the United States; changes in tax laws and unfavorable outcomes of tax positions we take; political instability, currency restrictions and devaluation in countries in which we operate or plan to operate; weakness in U.S. or international economic conditions; change or disruption in international migration patterns; our ability to protect our brand and intellectual property rights; our ability to retain key personnel; and other factors described in the “Risk Factors” section in periodic reports we file with the Securities and Exchange Commission. All statements other than statements of historical fact included in this press release are forward-looking statements including, but not limited to, expected financial outlook for the year 2019 and all forward-looking statements that are made or attributable to us are expressly qualified in their entirety by this cautionary notice. Any forward-looking statement that we make in this presentation speaks only as of the date of this presentation. We undertake no obligation to update or revise, or to publicly announce any update or revision to, any of the forward-looking statements made herein, whether as a result of new information, future events or otherwise except as required by law.This presentation includes certain non-GAAP financial measures, including Adjusted EBITDA, Adjusted EBITDA growth, Adjusted EBITDA margin and Revenue CAGR. These non-GAAP financial measures should be considered only as supplemental to, and not as superior to, financial measures prepared in accordance with U.S. GAAP. Please refer to Slides 37, 38 and 39 of this presentation for a reconciliation of Adjusted EBITDA to net income (loss). Adjusted EBITDA is defined as net income (loss) before depreciation and amortization, interest expense, income taxes, and also adjusted to add back certain charges and expenses, such as transaction costs and non-cash compensation costs, as these charges and expenses are not considered a part of our core business operations and are not an indicator of ongoing, future company performance. Safe Harbor Statement / Non-GAAP Financial Measures
Company Overview
Intermex Overview Leading Money Transfer service provider to the $90B US to Latin America and Caribbean corridor (LAC)(1)Recent launch in Africa (inbound) and Canada (outbound)Unique and differentiated approach has driven rapid market share growthImpressive Financial Performance – Revenue CAGR of 31% from 2013 - 2018 TT as of Mar 31st ‘18 TT as of Mar 31st ‘19 Revenue $225.3M $286.1M AdjustedEBITDA(2) $35.0M $49.1M Adjusted EBITDA Growth(2) 22% 40% AdjustedEBITDA Margin %(2) 15.5% 17.2% Money Transfer Transactions 20.1M 25.6M Remittance Volume $7.3B+ $9.5B+ Countries 17 21 Total Employees 588 723 To 17 Latin American CountriesTo 4 African Countries Sending Side Receiving Side Mexico(Elektra, BanCoppel) Other Countries Guatemala(Banrural, Banco Industrial) Paying Agent Network Computer Orders Sending Agent Network 2 Call Centers(Mexico / Guatemala) Computer Orders 32 Company Stores(U.S.) Phone/Fax Orders Efficient, High Growth Platform El Salvador and Honduras World Bank (2018). Reflects LAC market size as of 2018.Adjusted EBITDA reflects add-backs for one-time, non-recurring items. Please see pages 37, 38 and 39 for more detail and a reconciliation of Adjusted EBITDA to net income (loss). Licensed in 50 U.S. states, DC and Puerto Rico, served through a sending agent base of independent, non-exclusive agents and 32 company stores
Intermex – Evolution of a Market Leader History of sustained market share growth provides a strong platform for future growth Early Years Expansion Intermex was founded in 1994 as a money transfer provider headquartered in Miami, FloridaAcquired Servimex, Americana and Maniflo and expanded into 13 new U.S. statesOpened call centers in Mexico and GuatemalaCompleted re-engineering and business model shift to focus on efficient agents and profitabilityInvestment in innovative and highly scalable technology FoundationInception - 2012 Accelerated Growth 2013 - Present Further market penetration into western and northeastern U.S.Economic recovery sets in, providing backdrop for market growthAcceleration of market share gainsIncreased proprietary payor network coverage and penetrationLaunched differentiated Customer Management platform and loyalty program to capture additional customersBegan developing mobile / online strategyExpansion into new regions of the world 2009 – 2012 Revenue CAGR: 8% ($ in millions) 2013 – 2018Revenue CAGR: 31%
Strong and Accelerating Financial Performance Intermex has an attractive financial profile with strong momentum Intermex’s differentiated approach, along with its unique and efficient platform, has allowed the Company to significantly grow scale and profitabilityStrong top-line and margin growth demonstrates business scalability and operational leverageFull year 2018 results demonstrate execution of strategic prioritiesSignificant market share growth opportunities in West, Midwest and Northeast U.S. send markets, and within existing Latin American receive markets Revenue Adjusted EBITDA(1) ($ in millions) ($ in millions) 2015 – 2019PCAGR: 27% Please see pages 37, 38 and 39 for detail on adjustments to EBITDA and a reconciliation of Adjusted EBITDA to net income (loss).A quantitative reconciliation of projected 2019 Adjusted EBITDA to the most comparable GAAP measure is not available without unreasonable efforts because of the inherent difficulty in forecasting and qualifying the amounts necessary under GAAP guidance for one-time, non-recurring items including, without limitation, costs related to acquisitions and the registration of the Company’s securities, and losses related to legal contingencies or disposal of assets. 2015 – 2019PCAGR: 30% (2)
Experienced and Proven Management Team Results-driven management team with 110+ years of combined industry experience Execution focused management with deep industry experience and operational expertise that has successfully increased scale, expanded the ecosystem and driven growthMaintain an efficient client and regulatory focused organization with 234 employees in the U.S. and 351 employees in Latin America Years With Company Years In Industry Prior Experience Robert LisyChairman and CEO 10 28 Tony LauroChief Financial Officer 1 21 Randy NilsenChief Sales & Marketing Officer 3 26 Jose Perez-VillarrealChief Compliance Officer and Chief Administration Officer 17 24 William VelezChief Information Officer 5 12 Eduardo AzcarateChief Business Development Officer 11 19 /
Capital Markets Progression
Recent Capital Markets Events Warrant Exchange offer expired April 25, 2019Announced completion and settlement of the exchange in April 30 press releaseExchanged 8.9 million or 99.5% of the outstanding warrants and converted the remaining 0.5% leaving no outstanding warrantsIssued 1.8 million common shares and made an approximately $10 million cash payment in conformance with the offerImproved liquidity and removed overhangRussell 2000 and 3000 index inclusionAdded to the indices on July 1st, 2019Improved liquidity and recognition of IMXI’s expanded market capitalization since initial listingRecast credit facilityEffective as of November 2018 via Key BankReduced funding cost from LIBOR+ 900 basis points to LIBOR+ 450 basis points
First Quarter 2019
Review of Key Performance Indicators Revenue and Adjusted EBITDA growth of 22% year-over-year(1) Intermex continues to aggregate share in Mexico / Guatemala Key growth initiatives across new products and markets IMXI shares have appreciated over 40%(2) since initial listing Growth Market Share Expansion Returns Please see pages 37, 38 and 39 for detail on adjustments to EBITDA and a reconciliation of Adjusted EBITDA to net income (loss).As of market close on July 19, 2019.
Intermex Growth Story Money Transfer Transactions Volume (# In millions) ($ in millions) Adjusted EBITDA reflects add-backs for one-time, non-recurring items. Please see pages 37, 38 and 39 for detail on adjustments to EBITDA and a reconciliation of Adjusted EBITDA to net income (loss). Revenue Adjusted EBITDA(1) ($ in millions) ($ in millions) 24% 23% 22% 22%
First Quarter 2019 Performance Highlights Generated impressive year-over-year growth of key metrics:22.1% revenue growth21.9% Adjusted EBITDA growth(1)23.3% growth in remittance volumeNet income of $3.2 million vs. a net loss of $0.5 million in Q1 2018Adjusted EBITDA margin remained relatively flat year-over-year at 15.8%(1)Year-to-date as of March 31, Intermex has captured 45% of the total growth in US to Mexico remittance volume and 51% of the total growth in US to Guatemala remittance volume.(2)Launched our outbound business to Africa, which includes Nigeria, Ghana, Ethiopia and Kenya Adjusted EBITDA reflects add-backs for one-time, non-recurring items. Please see pages 37, 38 and 39 for detail on adjustments to EBITDA and a reconciliation of Adjusted EBITDA to net income (loss).Source: Banco de Mexico, Banco de Guatemala, World Bank US outbound volumes and Intermex company data
On Track to Execute on 2019 Strategic Priorities Priority #1 is to continue driving core growth initiativesLong runway aheadCore expansion in both growth and stronghold statesContinued growth opportunity in secondary and tertiary Latin American marketsExpanding our breadth and depth of service Outbound US is live to Africa and Canada outbound now live New products with our general purpose reloadable card (GPR), online and white label capabilitiesEnhanced infrastructure and dedication to customer serviceNew Active / Active network and data center capabilitiesBanking service optimization
Reiterating 2019 Financial Guidance A quantitative reconciliation of projected 2019 Adjusted EBITDA to the most comparable GAAP measure is not available without unreasonable efforts because of the inherent difficulty in forecasting and qualifying the amounts necessary under GAAP guidance for one-time, non-recurring items including, without limitation, costs related to acquisitions and the registration of the Company’s securities, and losses related to legal contingencies or disposal of assets. $320-$330 million Revenue $54-$58 million Adjusted EBITDA(1)
Competitive Overview
Global Remittance Market The World Bank. “Migration and Remittances Factbook 2016.” The World Bank. “Bilateral Remittance Matrix - 2017” accessed on May 17, 2018 247M $613BUSD $148BUSD $31BUSD people live outside of their country of birth.(1) estimated amount of remittances sent, worldwide in 2017(2) was sent from the U.S. alone(2) was sent from the U.S. to Mexico in 2017, the largest remittance corridor in the world(2)
Large Industry with Accelerating Growth The LAC Remittance Market Hispanics represent over 50% of foreign-born residents in the U.S. and are highly concentrated in California, Texas, Florida, and New YorkSubstantial opportunities exist for continued increases in LAC remittance volume as housing starts grow and wages for foreign-born Hispanics increaseAs the number of Hispanic foreign-born workers continues to rise, volumes of remittances sent back to families in LAC countries should increase accordingly Strong Remittance Volume Growth in Intermex’s Core Markets (1) Banco de Guatemala, Banco de Mexico and World Bank. Represents total remittance volume. (Total Remittance Volume, $ in billions) 2005 – 2017 CAGR 4.4% 5.6% 8.0% 2.3% Recession Softness $70.4 $75.4 $82.0
2014 2018 1Q19 14.0% 24.0%(3) 25.5%(3) All Others 86.0% 76.0% 74.5% 2014 2018 1Q19 7.9% 17.4%(3) 18.0%(3) All Others 92.1% 82.6% 82.0% Favorable, Fragmented Competitive Landscape LAC Market Landscape Intermex enjoys a strong and growing position across key target markets Intermex Share of Key Target Markets (2) Total Market Size:~$90 Billion (1) LAC Countries - 2018 Mexico Market Share Breakdown Guatemala Market Share Breakdown World Bank (2018). Reflects estimated LAC market size as of April 2019.Management estimated market share of remittances as of 2018.Source: Banco de Guatemala, Banco de Mexico and World Bank 2018 Country Size(US$B)1 Region MEX 35.7 40% GUA 9.6 11% DOM 6.8 8% COL 6.4 7% ELS 5.5 6% HON 4.7 5% PRU 3.2 4% ECU 3.1 3% HAI 3.0 3% BRA 2.9 3% JAM 2.5 3% NIC 1.5 2% BOL 1.3 1% OTHER 3.6 4%
Volume Growth captured by Others Intermex Market Share 80%20% 57%43% 61%39% 62%38% 67%33% 74%26% 57%43% 59%41% 58%42% 59%41% 55%45% 49%51% Mexico Remittance Volume Growth Guatemala Remittance Volume Growth Volume Growth captured by Intermex Source: Banco de Guatemala and Banco de Mexico – US originating Volume Market Share and Percent Of Industry GrowthTier I Countries Intermex outperforms market growth in its core markets of Mexico and Guatemala.A consistent and large portion of the growth in the Mexico market is captured by Intermex.
Industry Growth(1) Business Model Resiliency Intermex has exhibited impressive growth even during recessionary periods Banco de Guatemala, Banco de Mexico and World Bank. Represents total remittance volume. CAGR: 3.7% (Total Remittance Volume, $ in billions) Intermex Growth CAGR: 12.5% (Total Remittance Volume, $ in billions) Intermex grew at 3.4x the industry between 2009-2015, reflecting resilience in the business model during extended periods of market softness
Customer Transaction Flow Illustrative example of $375 transaction to Mexico U.S. Customer sends $375 to Mexico through:• In person wire transfersOnline money transfers Agent records $375 transaction to Mexico and charges the customer $385 and provides customer with transaction code. Intermex processes transaction through proprietary platform with an integrated regulatory compliance model and payer network relationships.Intermex earns $10.00 Fee Revenue plus ~$2.50 Foreign Exchange Spread RevenueIntermex pays sending and paying agent commissions $375 is wired to Mexico.Customer picks up money with transaction code in local currency. $375+$10 fee $375 Intermex earns $5.05 net on $12.50 gross revenue $375
Intermex sustains strong margins while increasing volume growth to Mexico Intermex Grows in Excess of the Industry Margin Expansion (Mexico) Intermex has been able to capture additional market share while increasing strong margins. Source: Banco de Mexico.
Core Growth Opportunity Long runway for same-store and greenfield growth in “stronghold” states There are more zip codes with high foreign born populations in our “stronghold” states that we want to operate in than zip codes that we currently operate inGrowth in our 15 “stronghold” states is ~2x that of Mexico market growth30%+ growth in 5 of 1520%+ growth in 10 of 1510%+ growth in 15 of 15Continued effort to penetrate with the right retailers
Core Growth Opportunity Further penetration is a long-term driver of meaningful growth Intermex transaction volume could grow up to 3x the current total if transaction per foreign born is replicated in “growth states” Note: Includes Mexico and Guatemala markets only; foreign born population data as of May 31, 2019; transaction data as of March 31, 2019 Region Transaction / Population Southeast 4.18 Northeast 3.12 Midwest 1.29 Northwest .72 Southwest .54 Central .36
Core Growth Opportunity Significant greenfield opportunity in “growth” states CA TX Intermex could add up to ~10.7 million wires per quarter in California and Texas at similar penetration to stronghold states Stronghold states (15) Currently, much lower transaction per foreign born in CA and TX vs. stronghold states Solid = Actual Stripes = Hypothetical Note: Includes Mexico and Guatemala markets only; foreign born population data as of May 31, 2019; transaction data as of March 31, 2019
Systematic and Efficient Sales Strategy and Execution Target U.S. ZIP codes with high concentrations of Latin American foreign born residents 1 2 Partner with agent to:Provide SolutionsSell BenefitsComplete Business ReviewFinalize Commitments 3 Locate and interview agents in target Zip codes that meet Intermex Agent profile. High transaction volume Trusted member of communityStrong compliance environmentCredit Worthy Average number ofwires per agent 4 ~2x lift inproductivitysince 2011 = concentration of Latin American foreign born residents Note: Agent count reflects yearly average of transacting agents. 13% CAGR
CaptureSpeed Problem Resolution System Reliability Local Language Loyalty Program Community Member Trust Reliability Differentiators – Deliver Agent and Consumer Value Why Agents Choose Intermex Why Consumers Choose Intermex Banking Solutions Trust Increased Transaction Volume
Incremental Growth We believe these opportunities should contribute to revenue and EBITDA in 2020 and beyond New markets and value-add customer services are long-term growth opportunities Africa inbound – 1Q19 launchAfrica’s total addressable market could be similar to Guatemala in terms of remittance volumeFirst wire completed January 10th, 2019Canada outbound – 3Q19 launchCanada’s total addressable market could be similar to Texas in terms of remittance volumeFirst wire completed July 9th, 2019White label processingLive with first partner and in market with additional opportunities for 2H19
Superior Compliance Culture Intermex maintains a highly comprehensive, rigorous compliance process Transaction entry at Sending Agent requires completion of mandatory fields and ID requirements Sender and receiver screened against government-required lists (OFAC, etc.) Transaction screened for limit restrictions, velocity levels, structuring, and ID requirements Transaction sent to payer; flagged exceptions sent to Compliance for investigation and release / rejection Intermex Risk and Compliance Tools Key Milestones in the Process Conduct all compliance checks through the extensive compliance module which is part of our proprietary POS system“Know Your Customer” due diligence“Anti-Money Laundering” checksStrong policies, procedures and internal stricter controls than regulatory requirements Compliance Checks Transaction Monitoring Ongoing Agent Overview All transactions subject to real-time AML and OFAC screeningPost-transaction analysis to detect, report and prevent suspicious activityTransactions are instantly flagged when ID verification and source of funds is required Rigorous Agent oversight performed by compliance field examinersComprehensive and ongoing Agent training on regulatory requirementsEnhanced due diligence process for sending and paying Agents
Competitive Strengths The growth potential is significant and durable in both our established and newer entry markets Our differentiated approach focuses on prioritizing agent productivity and consistently growing transactions per agent Our technology infrastructure allows for the dependable transfer of money with one of the lowest cancellation rates in the industry Incremental opportunities, including new markets, expanded ancillary products and B2B processing relationships supplement our core growth and strengthen our competitive advantage Dedication to superior customer service is our key competitive advantage and is scalable as we add new agents and products
Appendix
Speed of POS TransactionsRepeat sender transactions completed in half the time of most competitors Systems Uptime and Reliability99.95% historical uptime SLA with 3-datacenter balancing and auto failover Technical Support Response TimeLeading 8-second answer time, most issues solved in under 5 minutes Processing Capacity and Easy ScalabilityCapacity to process 10 times current volume, scalable by adding more servers Proprietary Business SoftwarePowerful engine allows granular FX customization and real-time risk analysis Highly Scalable and Industry-Leading Technology Platform
Note: Graphs show minimal to no impact to business operations. From Irma to Earthquake – Testing Resilience Hurricane IrmaIntermex deployed its Business Continuity Plan (BCP) 3 days before the eventMexico and Guatemala subsidiaries supported key stakeholders in MiamiEquipment supplied to key personnel (i.e. satellite phones, hotspots and backup laptops) allowed for uninterrupted communicationsHQ facilities ran on generator for 5 daysData and voice circuits were unaffected Mexico Earthquake (Tuesday, Sept 19 2017)Facilities in Puebla, Mexico were evacuated at 2:14PM ESTIntermex immediately activated its BCP to enable operations center supportWithin a 2-hour period, calls were routed and processes handled as per BCP by Miami and Guatemala backup personnel
Consolidated Balance Sheets
Consolidated Statements of Operations
Net Income (Loss) to Adj. EBITDA Reconciliation
Net Income(Loss) to Adj. EBITDA Reconciliation