Filed Pursuant to Rule 424(b)(3)
Registration No. 333-222986
CNL STRATEGIC CAPITAL, LLC
SUPPLEMENT NO. 4 DATED MAY 16, 2018
TO THE PROSPECTUS DATED MARCH 7, 2018
We are providing this Supplement No. 4 to you in order to supplement our prospectus dated March 7, 2018 (as supplemented to date, the “Prospectus”). This supplement provides information that shall be deemed part of, and must be read in conjunction with, the Prospectus. Capitalized terms used in this supplement have the same meanings in the Prospectus unless otherwise stated herein. The terms “we,” “our,” “us” and “Company” refer to CNL Strategic Capital, LLC.
Before investing in our shares you should read the entire Prospectus and this supplement, and consider carefully our business objectives, risks, fees and expenses. You should also carefully consider the information disclosed in the section of the Prospectus captioned “Risk Factors” before you decide to invest in our shares.
The purpose of this supplement is to disclose the following:
| ● | the status of our current public offering; |
| ● | an update to our prospectus summary; |
| ● | an update to our risk factors; |
| ● | an update to the prior performance of the Manager, the Sub-Manager and their respective affiliates; |
| ● | a “Management’s Discussion and Analysis of Financial Condition and Results of Operations” section substantially the same as that which was included in our Quarterly Report on Form 10-Q, filed on May 15, 2018; |
| ● | an update to our portfolio; |
| ● | an update to our security ownership; |
| ● | an update to information regarding conflicts of interest and certain relationships and related party transactions; |
| ● | an update to our ERISA considerations; |
| ● | an update to our plan of distribution; |
| ● | our condensed consolidated unaudited financial statements and the notes thereto as of and for the period ended March 31, 2018, as included in our Quarterly Report on Form 10-Q, filed on May 15, 2018; and |
| ● | an update to our prior performance tables included in Appendix A of our Prospectus. |
Status of our Current Public Offering
Our registration statement on Form S-1 relating to our current public offering (the “Offering”) was declared effective by the Securities and Exchange Commission (the “SEC”) on March 7, 2018. As of May 10, 2018, we had issued 18,247 common shares (consisting of 299 Class A shares and 17,948 Class I shares) pursuant to the Offering, which includes 299 Class A shares issued pursuant to our distribution reinvestment plan, and received aggregate gross offering proceeds of $457,500.
Prospectus Summary
The following disclosure supersedes and replaces the third sentence of the second paragraph under the section “Prospectus Summary—Q: Who are Levine Leichtman Strategic Capital, LLC and LLCP?” and the third sentence of the third paragraph under the section “Business—The Manager and the Sub-Manager,” which appear on pages 3 and 77, respectively, of the Prospectus.
From 1984 through 1993, LLCP Founding Principals Arthur E. Levine and Lauren B. Leichtman made seven investments in their individual capacities prior to establishing LLCP. From 1994 through March 31, 2018, LLCP and its senior executives have managed approximately $9.6 billion of institutional capital, invested in a total of over 75 middle-market companies and currently has a team of 56 transactional and supporting professionals.
The following disclosure supersedes and replaces the structure chart and related disclosure under the section “Prospectus Summary—Q: What is the current ownership structure of CNL Strategic Capital, LLC?” which appears on page 6 of the Prospectus.
| Q: | What is the current ownership structure of CNL Strategic Capital, LLC? |
| A: | The following chart illustrates the general structure and ownership of the company and the management relationship between the Manager, the Sub-Manager and us.(1) |
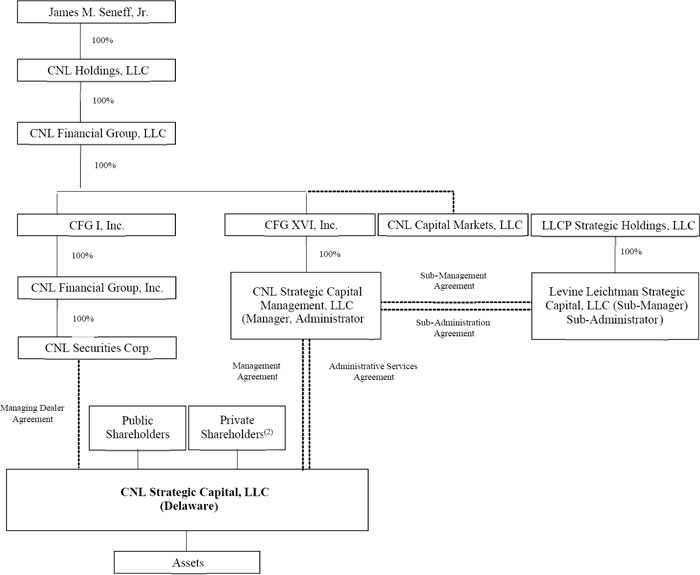
| (1) | We have entered into the Management Agreement with the Manager and the Sub-Management Agreement with the Manager and the Sub-Manager. We have entered into a managing dealer agreement (the “Managing Dealer Agreement”) with the Managing Dealer. We have also entered into an administrative services agreement with the Administrator (the “Administrative Services Agreement”) and a sub-administration agreement with the Administrator and the Sub-Administrator (the “Sub-Administration Agreement”). Please see the disclosure below under “Compensation of The Manager, the Sub-Manager and the Managing Dealer” and “Management—Administrative Services” for a description of the compensation, reimbursements and distributions we contemplate paying (directly or indirectly) to the Manager, the Sub-Manager, the Managing Dealer, the Administrator, the Sub-Administrator and other affiliates in exchange for services provided to us. |
| (2) | Represents shareholders who purchased Class FA shares in the private offering. |
- 2 -
The following disclosure supersedes and replaces the first sentence of the sixth bullet under the sections “Prospectus Summary—Q: What conflicts of interest exist between us, the Manager, the Sub-Manager and their respective affiliates?” and “Conflicts of Interest and Certain Relationships and Related Party Transactions—Conflicts of Interest,” which appear on pages 7 and 130, respectively, of the Prospectus, and the twelfth sentence under the section “Risk Factors—Risks Related to the Manager, the Sub-Manager and Their Respective Affiliates—The Manager, the Sub-Manager and their respective affiliates, including our officers and some of our directors will face conflicts of interest including conflicts that may result from compensation arrangements with us and our affiliates, which could result in actions that are not in the best interests of our shareholders,” which appears on page 29 of the Prospectus.
Our board of directors will determine our net asset value with assistance from the Manager and the Sub-Manager and, because the base management fee is payable monthly and the base management fee for a certain month is calculated based on the average value of our gross assets at the end of that month and the immediately preceding calendar month and because the total return incentive fee reflects changes to our net asset value, a higher net asset value would result in a higher base management fee and incentive fee to the Manager and the Sub-Manager.
Risk Factors
The following risk factor supersedes and replaces the risk factor under the section “Risk Factors—Risks Related to This Offering and Our Shares—The U.S. Department of Labor, or the Department of Labor, has issued regulations that revise the definition of an ERISA fiduciary, and these regulations could have a significant effect on an investment in our shares,” which appears on page 24 of the Prospectus.
The U.S. Department of Labor, or the Department of Labor, has issued regulations that revise the definition of an ERISA fiduciary, and these regulations could have a significant effect on an investment in our shares.
The U.S. Department of Labor issued in 2016 its final regulation redefining “investment advice fiduciary” under ERISA and the Code. The final regulation significantly expanded the class of advisers and the scope of investment advice that are subject to fiduciary standards, imposing the same fiduciary standards on advisers to IRAs that have historically only applied to plans covered by ERISA. The Department of Labor also finalized certain prohibited transaction exemptions that allow investment advisers to receive compensation for providing investment advice under arrangements that would otherwise be prohibited due to conflicts of interest. Financial institutions that had been relying on the “Best Interest Contract Exemption” were permitted to comply with only a limited set of requirements through July 1, 2019. The United States Court of Appeals for the Fifth Circuit is currently expected to issue an order vacating the entire final regulation, the two special prohibited transaction exemptions that had come with the new rule, including the Best Interest Contract Exemption, and amendments to other long-standing prohibited transaction exemptions. The Department of Labor has announced that it intends to issue appropriate guidance in the future that will address the consequences of the disposition of the final regulation. Because the status of the final regulation is still developing and the application of the final regulation remains uncertain, plan fiduciaries and the beneficial owners of IRAs are urged to consult with their own advisors regarding this development.
The following risk factor is added to immediately follow the risk factor under the section “Risk Factors—Risks Related to This Offering and Our Shares—The U.S. Department of Labor, or the Department of Labor, has issued regulations that revise the definition of an ERISA fiduciary, and these regulations could have a significant effect on an investment in our shares,” which appears on page 24 of the Prospectus.
- 3 -
Our business could be adversely affected if we fail to maintain our qualification as a venture capital operating company, or VCOC, under the “plan assets” regulation under ERISA.
We sold and issued our Class FA shares in the private offering and used a substantial portion of the net proceeds from the private offering to acquire our initial businesses. We currently operate our business in a manner so that it is intended to qualify as a VCOC, as defined in the regulations governing plan assets, or the Plan Asset Regulations, promulgated under ERISA by the Department of Labor, and therefore are not subject to the ERISA fiduciary requirements with respect to our assets. However, if we fail to satisfy the requirements to qualify as a VCOC for any reason and no other exception under the Plan Asset Regulations applies, such failure could materially interfere with our activities or expose us to risks related to our failure to comply with the requirements. If no exception under the Plan Asset Regulations applied, the fiduciary responsibility standards of ERISA would apply to us, including the requirement of investment prudence and diversification, and certain transactions that we enter into, or may have entered into, in the ordinary course of business, might constitute or result in non-exempt prohibited transactions under Section 406 of ERISA or Section 4975 of the Code. A non-exempt prohibited transaction, in addition to imposing potential liability upon fiduciaries of a plan subject to Title I of ERISA or Section 4975 of the Code, may also result in the imposition of an excise tax under the Code upon a “party in interest” (as defined in ERISA) or “disqualified person” (as defined in the Code) with whom we engaged in the transaction. Therefore, our business could be adversely affected if we fail to quality as a VCOC under the Plan Asset Regulations.
Prior Performance of the Manager, the Sub-Manager and Their Respective Affiliates
This section supersedes and replaces the disclosure under the section “Prior Performance of the Manager, the Sub-Manager and their Respective Affiliates,”which begins on pages 60 of the Prospectus.
PRIOR PERFORMANCE OF THE MANAGER, THE SUB-MANAGER AND THEIR RESPECTIVE AFFILIATES
General
The information presented in this section represents the historical experience of certain programs sponsored or managed in the last ten years by CNL affiliates and LLCP and its affiliates, through December 31, 2017, except as otherwise indicated. The purpose of this prior performance information is to enable investors to evaluate accurately the experience of CNL affiliates and LLCP and its affiliates in sponsoring programs. Investors should not assume that they will experience returns, if any, comparable to those experienced by investors in the prior programs summarized in this section. Investors who purchase our shares will not thereby acquire an ownership interest in any of the entities to which the following information relates. Further, the private funds discussed in this section were conducted through privately held entities that were subject neither to the up-front commissions, fees and other expenses associated with this offering nor all of the laws and regulations that will apply to us as a publicly offered company.
Our structure and business strategy are different from certain of these prior programs and our performance will depend on factors that may not be applicable to or affect the performance of these programs. We consider a prior program to have a business objective similar to us if the program acquires, or has acquired, controlling and minority equity stakes in growing middle-market businesses located primarily in the United States. Although a business objective is similar, the specific acquisition criteria of a prior program may vary from program to program as compared to our acquisition criteria.
The prior performance tables included in this prospectus, beginning on page A-1, include further information regarding certain of the prior programs described herein.
- 4 -
Prior Programs Sponsored by CNL Affiliates
Since 1973, CNL affiliates have formed or acquired companies with more than $34 billion in assets. Prior to this offering, CNL affiliates have only sponsored real estate and credit investment programs. The company is the first program sponsored by CNL and its affiliates that targets the acquisition of controlling equity stakes in middle-market businesses. During the ten year period ended December 31, 2017, CNL affiliates have sponsored and managed seven public programs (the “CNL Public Programs”), which can be divided into two basic categories: the CNL Public REITs and the CNL BDCs. During the ten year period ended December 31, 2017, the CNL Public REITs have focused on investing in real properties, including healthcare, hotel, leisure, recreation and multifamily located primarily in the United States. The CNL Public REITs have raised a total of approximately $5.6 billion from retail investors and distributed approximately $2.6 billion in distributions to its investors through the end of year 2017. During this time, more than 250 properties have been disposed by the CNL Public REITs, representing approximately $5.0 billion in value. During the ten year period ended December 31, 2017, the CNL BDCs, which have focused on making debt investments in medium- and large-sized private companies located primarily in the United States and Western Europe, raised a total of approximately $3.6 billion from retail investors, invested approximately $10.9 billion, and distributed approximately $907.4 million in dividends to its investors through the end of year 2017. On November 14, 2017, shares of common stock of Corporate Capital Trust, Inc. (“CCT I”), one of the CNL BDCs, commenced trading on the New York Stock Exchange (the “Listing”) with the ticker symbol “CCT”. As part of the Listing, CNL terminated its advisory agreement with CCT I. As of December 31, 2017, Corporate Capital Trust II (“CCT II”), the other CNL BDC, had approximately 2,605 investors and $163.9 million invested across 98 positions in 82 issuers. Approximately $93.6 million of these investments were first lien senior secured loans.
Below is a description of the CNL Public Programs. All CNL Public Programs information is as of December 31, 2017, unless otherwise indicated. We believe that we do not share a comparable business strategy or business objective with any of the CNL Public Programs.
CNL Public REITs
The CNL Public REITs primarily focus on investing in real properties located in the United States. The five CNL Public REITs are described below:
| ● | CNL Lifestyle Properties, Inc. (“CNL Lifestyle Properties”) launched in 2004, closed in 2011 with a total of approximately $3.42 billion of capital raised and acquired approximately 150 properties. CNL Lifestyle Properties primarily focused on properties such as ski and mountain lifestyle properties, golf courses, attractions, marinas, senior living properties and additional lifestyle retail properties, and is in the process of selling its assets. As part of executing under its strategic alternative to provide liquidity to its stockholders, CNL Lifestyle Properties sold its remaining assets in April 2017, paid an interim liquidating distribution to its stockholders and made a final liquidating distribution and dissolved the company in December 2017. |
| ● | CNL Growth Properties, Inc. (“CNL Growth Properties”) launched in 2009, closed in 2014 with a total of approximately $209 million of capital raised and acquired more than ten properties. CNL Growth Properties primarily focused on investing in multifamily development properties that offered the potential for capital appreciation. As part of executing under its strategic alternative to provide liquidity to its stockholders, CNL Growth Properties sold its last property in September 2017, paid liquidating distributions to its stockholders and dissolved the company in October 2017. |
| ● | Global Income Trust, Inc.(“Global Income Trust”) launched in 2010, closed in 2013 with a total of approximately $83 million of capital raised and acquired nine properties. Global Income Trust primarily focused on investing in a portfolio of income-oriented commercial real estate and real estate-related assets. Global Income’s investments were made in both the United States and Germany. As part of executing under its strategic alternative to provide liquidity to its stockholders, Global Income Trust sold its remaining assets, paid a liquidating distribution to its shareholders and dissolved the company in December 2015. |
| ● | CNL Healthcare Properties, Inc.(“CNL Healthcare Properties”) launched in 2011, closed in 2015 with a total of approximately $1.77 billion of capital raised and acquired 152 properties. CNL Healthcare Properties primarily focuses on investing in senior housing, medical office building, acute care and post-acute care facility sectors, including stabilized, value add and development properties. |
| ● | CNL Healthcare Properties II, Inc. (“CNL Healthcare Properties II”) launched in 2016. As of December 31, 2017, it was in its primary offering period and had raised approximately $31.4 million and had acquired two properties. CNL Healthcare Properties II primarily focuses on investing in seniors housing, medical office building, acute care and post-acute care facility sectors, including stabilized, value add and development properties. |
- 5 -
CNL BDCs
The CNL BDCs primarily focus on making debt investments in medium- and large-sized private companies located primarily in the United States. The two CNL BDCs are described below:
| ● | CCT Ilaunched in 2011, closed in 2016 with a total of approximately $3.47 billion of capital raised. CCT I primarily focused on investing in medium- and large-sized private companies. Most of CCT I’s investments were made in both the United States and Western Europe. On November 14, 2017, as part of the Listing, CNL terminated its advisory agreement with CCT I. As of September 30, 2017, CCT I had 69,445 investors and $4.0 billion invested across 154 positions in 105 issuers. Approximately 61 of these investments were first lien senior secured loans. |
| ● | CCT II launched in 2016 and suspended its continuous public offering of its common shares of beneficial interest effective as of January 10, 2018. As of December 31, 2017, approximately $119.1 million in capital had been raised for CCT II. CCT II primarily focused on investing in medium- and large-sized private companies. Most of CCT II’s investments were made in the United States. As of December 31, 2017, CCT II had 2,605 investors and $163.9 million invested across 98 positions in 82 issuers. Approximately 49 of these investments were first lien senior secured loans. In connection with a transaction to transition the investment advisory services, as of April 9, 2018, CCT II is no longer sponsored or managed by CNL affiliates. |
As described above, we consider a program that acquires, or has acquired, controlling and minority equity stakes in growing middle-market businesses located primarily in the United States to have a business objective similar to ours. We believe the CNL Public REITs do not have business objectives similar to ours because they primarily invest in real properties. We also believe the CNL BDCs do not have business objectives similar to ours because they primarily make debt investments in medium- and large-sized private companies. Thus, we believe none of the CNL Public Programs has comparable business strategies or business objectives to that of the company and we have determined that no further historical performance information is necessary to be included in the prospectus in the form of prior performance tables.
Upon written request, you may obtain, without charge, a copy of the most recent annual report on Form 10-K filed with the SEC by any public program described above. We will provide exhibits to each such Form 10-K upon payment of a reasonable fee for copying and mailing expenses. These reports and exhibits, as well as other reports required to be filed with the SEC, are also available at the SEC’s website atwww.sec.gov.
Adverse Conditions and Other Developments Affecting CNL Public Programs
Certain of the prior programs sponsored by CNL affiliates have been affected by general economic conditions, capital market trends and other external factors during their respective operating periods.
CNL Lifestyle Properties
CNL Lifestyle Properties was a real estate investment trust that invested in income-producing properties with a focus on lifestyle-related industries. CNL Lifestyle Properties became effective on April 16, 2004 and invested in a total of 214 properties, with an aggregate initial purchase price of approximately $4.3 billion, across a variety of different lifestyle industries, including a majority within the ski & mountain lifestyle, golf, attractions, healthcare and marina industries. Commencing with the onset of the global financial crisis in 2008, certain properties owned by CNL Lifestyle Properties suffered declines in performance which had a negative impact on the fund’s net asset value. The public primary offering price for CNL Lifestyle Properties was $10.00 per share throughout three public primary offerings from April 2004 to April 2011.
- 6 -
Beginning in the second quarter of 2010, CNL Lifestyle Properties limited redemption requests to $1.75 million per quarter and in April 2012, increased this limitation to $3.0 million per quarter, prior to the suspension of its redemption plan effective September 26, 2014. Consistent with its articles of incorporation, in March 2014, CNL Lifestyle Properties appointed a special committee comprised of its independent directors of the board and announced the engagement of a financial advisor to assist management and its board of directors in evaluating various strategic alternatives to provide liquidity to stockholders. Beginning in March 2014 and continuing through April 2017, CNL Lifestyle Properties liquidated its assets through multiple transactions in order to provide liquidity to its stockholders.
In April 2017, CNL Lifestyle Properties sold its remaining 36 properties to EPR Properties (“EPR”) and Ski Resort Holdings, LLC in exchange for both cash and EPR stock. As a result of this transaction, CNL Lifestyle Properties paid an interim liquidating distribution to its stockholders in the form of cash and EPR stock. Inception to dissolution, CNL Lifestyle Properties has paid total distributions with a value from $10.37 to $6.50 for each outstanding share of the company’s common stock,depending on the timing of the stockholders’ initial investment, excluding shares sold under thedistribution reinvestment plan. CNL Lifestyle Properties finalized the liquidation process of its remaining de minimis assets and outstanding liabilities, made a final distribution to stockholders and dissolved the company in December 2017.
Global Income Trust
Global Income Trust (formally known as Macquarie CNL Global Income Trust, Inc.) was formed in March 2009 with the intent to acquire and operate a diverse portfolio of commercial real estate assets and real estate-related assets on a global basis. The company began raising capital in a public offering in April 2010, and the offering closed in April 2013. Global Income Trust acquired two Class A office buildings and two industrial warehouses in the United States. Those properties were leased to third-party tenants and those tenants included subsidiaries of Samsonite, Mercedes-Benz Financial, and FedEx Ground. Additionally, Global Income Trust acquired a portfolio of five neighborhood retail centers in Germany. BlackRock Real Estate, as successor toMacquarie Capital Funds Inc., was a co-investor and sub-advisor to Global Income Trust on the German properties. The aggregate initial purchase price of the nine properties was approximately $121 million.
Global Income Trust did not achieve a critical mass of investments which negatively impacted the net asset value of the fund relative to the $10.00 per share public primary offering price in effect from April 2010 through April 2013. In April 2013, when its offering closed, Global Income Trust terminated its dividend reinvestment program and suspended its share redemption plan. In August 2013, Global Income Trust’s board of directors appointed a special committee comprised of the independent directors of the board and announced the engagement of a financial advisor to assist management and its board of directors in evaluating strategic alternatives to provide liquidity to stockholders. During 2015, Global Income Trust, through multiple transactions, sold all of its net assets and paid a liquidating distribution of $7.01 for each outstanding share of the company’s common stock. As part of the $7.01 liquidating distribution, CNL Global Income Advisors, LLC, Global Income Trust’s advisor, made a direct payment to Global Income Trust’s stockholders with respect to previously paid reimbursements of certain organizational, offering and operating expenses. Global Income Trust paid total cash distributions from $10.46 to $8.45 for each outstanding share of the company’s common stock, depending on the timing of the stockholders’ investment, excluding shares sold under thedistribution reinvestment plan. Global Income Trust dissolved on December 31, 2015.
CNL Growth Properties
CNL Growth Properties (formally known as Global Growth Trust, Inc.) was launched in 2009 and acquired an interest in 18 properties with a capitalized cost of approximately $640 million. CNL Growth Properties acquired, developed, and operated 17 Class A multifamily communities in nine states with eight different regional and national development joint venture partners. CNL Growth Properties was the majority owner and managing member in each joint venture, with an ownership interest ranging from 54-95%. Beginning in January 2015 and continuing through September 2017, CNL Growth Properties successfully liquidated these properties through individual sales of each of the seventeen communities. CNL Growth Properties also acquired a three building office complex in 2011 which was sold in 2014.
The public primary offering price for CNL Growth Properties was $10.00 per share during the initial offering from October 2009 to April 2013, $10.84 per share during the follow-on offering from August 2013 to January 15, 2014, and then $11.00 per share thereafter until the offering closed in April 2014. Stockholders of CNL Growth Properties received total distributions, depending on the timing of the stockholders’ initial investment from $18.21 to $13.71 for each outstanding share of the company’s common stock (excluding shares sold under the distribution reinvestment plan). CNL Growth Properties was dissolved on October 31, 2017.
- 7 -
Prior Programs Sponsored by LLCP and its Affiliates
From 1984 through 1993, LLCP Founding Principals Arthur E. Levine and Lauren B. Leichtman made seven investments in their individual capacities prior to establishing LLCP. From 1994 through March 31, 2018, LLCP and the LLCP Senior Executives have managed approximately $9.6 billion of institutional capital. Over this time, LLCP has sponsored private funds that have focused on the acquisition of controlling and minority equity stakes in middle-market businesses located primarily in the United States. LLCP has also sponsored private funds that have focused on making value-oriented and special situation investments and acquiring stressed, distressed or over-leveraged companies, and private funds focused on acquiring regional businesses. LLCP has sponsored and managed twelve private funds (the “LLCP Private Funds”), raised a total of approximately $7.2 billion of capital commitments from over 130 institutional and other investors, and invested approximately $4.7 billion (excluding follow-on investments) in over 75 middle-market companies across various industries, including restaurant franchisors, consumer products and business services. See “Appendix A: Prior Performance Tables—Table I” for more detailed information about LLCP and its affiliates’ experience in raising and investing funds in connection with certain of these private funds. During this time, 43 businesses have been sold by the LLCP Private Funds. The aggregate investment cost of these businesses was approximately $1.4 billion with a realized value of approximately $3.0 billion. See “Appendix A: Prior Performance Tables—Table V” for more detailed information about sales of individual middle-market companies by certain of the LLCP Private Funds.
Below is a description of the LLCP Private Funds, which are divided into three basic categories: Private Acquisition Funds; Value Funds; and Regional Based Funds. All LLCP Private Funds information is as of December 31, 2017, unless otherwise indicated. We believe that we share a similar business objective with the Private Acquisition Funds, although the specific acquisition criteria for the businesses we acquire may vary from the Private Acquisition Funds’ acquisition criteria. We believe that we do not share a similar business objective with the Value Funds or the Regional Based Funds.
Private Acquisition Funds
The Private Acquisition Funds acquire, or have acquired, controlling and minority equity stakes in growing middle-market businesses located primarily in the United States.
The seven Private Acquisition Funds are described below:
| ● | Levine Leichtman Capital Partners, L.P.(“LLCP I”) launched in 1994, closed in 1994 with a total of approximately $102.5 million of capital commitments and made six investments. LLCP I primarily focused on companies in the U.S. with annual revenues of $50 to $500 million. LLCP I dissolved on November 30, 2009. |
| ● | Levine Leichtman Capital Partners II, L.P. (“LLCP II”) launched in December 1997, closed in August 1999 with a total of approximately $350 million of capital commitments and has made 12 investments. LLCP II primarily focused on companies in the U.S. with annual revenues ranging from $50 million to $500 million. LLCP II is currently in its wind-down period. |
| ● | Levine Leichtman Capital Partners III, L.P. (“LLCP III”) launched in June 2002, closed in December 2004 with a total of approximately $500 million of capital commitments and has made 14 investments. LLCP III primarily focused on companies in the U.S. with annual revenues ranging from $50 million to $500 million. LLCP III is currently in its liquidation period. |
| ● | Levine Leichtman Capital Partners IV, L.P. (“LLCP IV”) launched in September 2007, closed in October 2009 with a total of approximately $1.1 billion of capital commitments and has made 11 investments. LLCP IV primarily focused on companies in the U.S. with annual revenues ranging from $50 million to $500 million. LLCP IV’s investment period has expired; however, it may be called upon to provide follow-on capital for existing investments. |
- 8 -
| ● | Levine Leichtman Capital Partners V, L.P. (“LLCP V”) launched in September 2012, closed in March 2014 with a total of approximately $1.6 billion of capital commitments and has made 10 investments. LLCP V primarily focuses on companies in the U.S. with annual revenues ranging from $50 million to $500 million. LLCP V is not actively seeking new investment opportunities; however, it may be called upon to provide follow-on capital for existing investments. |
| ● | Levine Leichtman Capital Partners VI, L.P. (“LLCP VI”) launched in May 2017, and is currently fundraising with commitments of approximately $1.97 billion and a target size of $2.2 billion. LLCP VI has made two investments to date and primarily focuses on companies in the U.S. with annual revenues ranging from $50 million to $500 million. LLCP VI is currently in its investment period. |
| ● | Levine Leichtman Capital Partners Small Business Fund, L.P. (“SB Fund”) launched in May 2010, closed in February 2011 with a total of approximately $226 million of capital commitments and has made seven investments. The SB Fund focuses on companies in the U.S. with annual revenues of less than $50 million at the time of investment. The SB Fund’s investment period has expired; however, it may be called upon to provide follow-on capital for existing investments. |
| ● | LLCP Lower Middle Market Fund, L.P. (“LMM Fund”) launched in March 2016, closed in October 2016 with a total of $615 million of capital commitments and has made three investments. The LMM Fund focuses on U.S companies with annual revenues of less than $50 million at the time of investment. The LLM Fund is currently in its investment period. |
The table below sets forth certain performance data relating to the Private Acquisition Funds. From July 1995 through December 31, 2017, the Private Acquisition Funds invested approximately $3.9 billion in 66 investments generating a gross realized internal rate of return of 20.2% and a 2.1x cash-on-cash multiple. This performance and other data is not a guarantee or prediction of the returns that we may achieve in the future.
Private Acquisition Funds
Performance From Inception through December 31, 2017(1)
| ($ in thousands) | As of December 31, 2017 | |||||||||||||||||||||||||||
Total Number of | Investment Amount(2)(3) | Realized Value(4)(5) | Unrealized Value(4) | Gross Internal Rate of Return(6) | Net Internal Rate of Return(7) | Management & Incentive Fees, Expenses(8) | ||||||||||||||||||||||
| LLCP I | 6 | $ | 98,560 | $ | 159,945 | $ | — | 44.2 | % | 18.7 | % | $ | 32,534 | |||||||||||||||
| LLCP II | 12 | $ | 346,772 | $ | 497,128 | $ | — | 10.7 | % | 6.0 | % | $ | 61,098 | |||||||||||||||
| LLCP III | 14 | $ | 470,356 | $ | 919,192 | $ | — | 16.3 | % | 9.8 | % | $ | 142,596 | |||||||||||||||
| LLCP IV | 11 | $ | 899,654 | $ | 1,701,345 | $ | 436,616 | 29.0 | % | 20.0 | % | $ | 316,280 | |||||||||||||||
| LLCP V | 11 | $ | 1,376,220 | $ | 367,970 | $ | 1,676,556 | 19.0 | % | 12.1 | % | $ | 118,158 | |||||||||||||||
| LLCP VI | 2 | $ | 402,924 | $ | 2,043 | $ | 420,071 | 30.9 | % | — | (9) | $ | 21,726 | |||||||||||||||
| SB Fund | 7 | $ | 141,097 | $ | 162,106 | $ | 160,390 | 41.9 | %(10) | 32.5 | %(10) | $ | 43,148 | |||||||||||||||
| LMM Fund | 3 | $ | 195,650 | $ | 9,910 | $ | 209,780 | 17.4 | % | — | (9) | $ | 20,519 | |||||||||||||||
| (1) | The private funds shown in this table were conducted through privately held entities that were subject neither to the up-front commissions, fees and other expenses associated with this offering nor all of the laws and regulations that will apply to us. |
| (2) | Excludes capital called for fund-level fees and expenses. |
| (3) | Investment Amount is determined as of the closing of the investment and includes all equity called and all debt funded or contractually committed to be funded by the collective investments herein. LLCP V and LLCP VI Investment Amounts include bridge financing, which is expected to be repaid to investors within two years of the closing of each investment and therefore will not be considered permanent capital. |
- 9 -
| (4) | Realized and Unrealized Value is calculated before fees, expenses, and general partner’s carried interest. Realized value represents the combination of cumulative interest and dividend payments as well as net proceeds derived from the ultimate sale transaction. Determinations of Unrealized Value are based upon the principal amount of the Fund’s investment in the underlying portfolio company’s debt securities (or possibly less if such debt security is impaired) at the time of determination plus the value of such Fund’s equity investment in the portfolio company, as valued by LLCP’s valuation committee. LLCP believes these values are reasonable and appropriate; however, there can be no assurance that proceeds will be realized on these investments, or that, if or when realized, the proceeds will be equal to the values estimated by LLCP. Unrealized Values are as of December 31, 2017. U.S. GAAP requires that foreign currency fluctuations be taken into account in determining value for purposes of the Fund’s financial statements; however fluctuations are removed for GL Education’s value in this table and the value is presented on a constant currency basis utilizing the applicable foreign exchange rate at closing of the investment. |
| (5) | Realized Value may include notes receivables, escrows, holdbacks, residual interests and other reserves that each fund believes will be received at the expiration of any applicable time periods or otherwise. |
| (6) | Gross Internal Rate of Return is calculated before fees, expenses, and general partner’s carried interest, calculated using a “time-zero” methodology in which the cash flows of all investments (actual amounts of contributions and distributions) are based from the same hypothetical starting date. |
| (7) | Net Internal Rate of Return is calculated after fees, expenses, and general partner’s carried interest, calculated using a “time-zero” methodology in which the cash flows of all investments (actual amounts of contributions and distributions) are based from the same hypothetical starting date. |
| (8) | Does not include unrealized carried interest. |
| (9) | Net Internal Rates of Return for LLCP VI and LMM Fund are not meaningful as these funds’ investments have been held for less than 18 months as of December 31, 2017. |
| (10) | The Gross Internal Rate of Return for the SB Fund is calculated excluding the effect of any fund-level leverage and, accordingly, is calculated based on limited partner capital only. The Net Internal Rate of Return for the SB Fund reflects the reduction of any debt service charges in connection with fund-level leverage. |
Regional Focused Funds
The two Regional Focused Funds are described below:
| ● | Levine Leichtman Capital Partners California Growth Fund, L.P. (“California Growth Fund”) launched in May 2007, closed in May 2007 with a total of approximately $40 million of capital commitments and has made two investments. The California Growth Fund primarily focused on investments in portfolio companies located in the State of California, with annual revenues of $50 million or less at the time of investment. The California Growth Fund also invested in one or more subsidiaries that directly hold or invest primarily in loan or debt obligations or participations therein of third parties. The California Growth Fund is currently in its wind-down period. |
| ● | Levine Leichtman Capital Partners Europe, L.P. (“Europe Fund”) launched in November 2014, closed in November 2014 with a total of approximately €100 million of capital commitments and has made two investments. The Europe Fund primarily focuses on investments in companies located in Western Europe (excluding the United Kingdom). The Europe Fund is currently in its investment period. |
Value Funds
The Value Funds primarily focus on making value-oriented investments. The two Value Funds are described below:
| ● | Levine Leichtman Capital Partners Deep Value Fund, L.P.(“Deep Value Fund”) launched in May 2005, closed in December 2006 with a total of approximately $508 of capital commitments and has made 39 investments. The Deep Value Fund focused primarily on investments in debt, debt-related and other securities of small and middle capitalization U.S.-based companies in stressed, distressed or other special situations. The Deep Value Fund dissolved in March 2018. |
| ● | Levine Leichtman Capital Partners Private Capital Solutions, L.P. (“PCS Fund”) launched in May 2011, closed in December 2012 with a total of approximately $227 million of capital commitments and has made five investments. The PCS Fund focuses primarily on making debt and equity investments in value-oriented, slower growth middle-market companies. The PCS Fund is currently in its investment period. |
- 10 -
As described above, we consider a private fund that acquires, or has acquired, controlling and minority equity stakes in growing middle-market businesses located primarily in the United States to have a business objective similar to ours. Thus, we believe the Private Acquisition Funds have business objectives similar to ours. With respect to the Value Funds, the Deep Value Fund did not have business objectives similar to ours because it primarily made debt investments in stressed, distressed or over-leveraged companies and the PCS Fund does not have business objectives similar to ours because it primarily makes investments in value-oriented, slower growth middle-market companies. With respect to the Regional Focused Funds, the California Growth Fund does not have business objectives similar to ours because it limits its investments to only companies in California and invests in loan and debt originations of third parties. The Europe Fund also does not have business objectives similar to ours because it limits its investment to only companies in Europe.
Adverse Conditions and Other Developments Affecting LLCP Private Funds
Certain of the prior programs sponsored by LLCP affiliates have been affected from time to time by general economic conditions, capital market trends and other external factors during their respective operating periods. However, there have been no major adverse business developments or conditions experienced by any LLCP-affiliated programs that would be material to investors, including as a result of recent general economic conditions. You should not rely on the past performance of investments by other LLCP-affiliated entities to predict our future results. Our business strategy and key employees differ from the business strategies and key employees of certain other LLCP-affiliated programs in the past, present and future.
Management’s Discussion and Analysis of Financial Condition and Results of Operations
The Prospectus is hereby supplemented with the following “Management’s Discussion and Analysis of Financial Condition and Results of Operations,” which is substantially the same as that which was included in our Quarterly Report on Form 10-Q for the quarterly period ended March 31, 2018. Unless otherwise defined in this supplement, capitalized terms are defined in such Quarterly Report.
MANAGEMENT’S DISCUSSION AND ANALYSIS OF FINANCIAL CONDITION AND RESULTS OF OPERATIONS
The following discussion is based on the unaudited condensed financial statements as of March 31, 2018 and for the period February 7, 2018 (commencement of operations) through March 31, 2018. This information should be read in conjunction with the accompanying unaudited condensed financial statements and the notes thereto included elsewhere in this supplement. Capitalized terms used in this section have the same meaning as in the accompanying unaudited condensed financial statements unless otherwise defined herein.
Overview
CNL Strategic Capital, LLC is a limited liability company that primarily seeks to acquire and grow durable, middle-market businesses. We are externally managed by CNL Strategic Capital Management, LLC, an entity that is registered as an investment adviser under the Investment Advisers Act of 1940, as amended. The Manager is controlled by CNL Financial Group, LLC, a private investment management firm specializing in alternative investment products. We have engaged the Manager under a management agreement pursuant to which the Manager is responsible for the overall management of our activities. The Manager has engaged Levine Leichtman Strategic Capital, LLC, a registered investment advisor, under a sub-management agreement pursuant to which the Sub-Manager is responsible for the day-to-day management of our assets. The Sub-Manager is an affiliate of Levine Leichtman Capital Partners, Inc.
The Manager and the Sub-Manager are collectively responsible for sourcing potential acquisition and debt financing opportunities, subject to approval by the Manager’s management committee that such opportunity meets our investment objectives and final approval of such opportunity by our board of directors, and monitoring and managing the businesses we acquire and/or finance on an ongoing basis. The Sub-Manager is primarily responsible for analyzing and conducting due diligence on prospective acquisitions and debt financings, as well as the overall structuring of transactions.
- 11 -
We target, for acquisition, businesses that are highly cash flow generative with annual revenues of primarily between $25 million and $500 million. Our business strategy is to acquire controlling equity stakes in combination with loan positions in middle-market businesses. Our business strategy seeks to provide long-term capital appreciation and current income, while protecting invested capital. In addition and to a lesser extent, we intend to acquire other debt and minority equity positions, which may include acquiring debt in the secondary market as well as minority equity stakes and loan positions via co-investments with other funds managed by the Sub-Manager or their affiliates. We expect that these positions will comprise a minority of our total assets.
We were formed as a Delaware limited liability company on August 9, 2016 and we intend to operate our business in a manner that will permit us to avoid registration under the Investment Company Act. We are not a “blank check” company within the meaning of Rule 419 of the Securities Act. We did not commence operations until February 7, 2018 as described below.
We offered through a private placement up to $85 million of Class FA limited liability company interests and up to $115 million of Class A limited liability company interests (one of the classes of Shares that constitute non-founder shares).
In October 2016, we confidentially submitted a registration statement on Form S-1 with the SEC in connection with the Public Offering. Through our Public Offering, we are offering, in any combination, four classes of shares: Class A shares, Class T shares, Class D shares and Class I shares. See “Notes to Condensed Consolidated Financial Statements” — Note 7. “Capital Transactions” included in this supplement for additional information related to our Offerings.
On February 7, 2018, we commenced operations when we met the minimum offering requirement of $80 million in Class FA shares under the Private Placement and issued approximately 3.3 million shares of Class FA shares for aggregate gross proceeds of $81.7 million, as described below under “Our Common Shares Offering.” On February 7, 2018, we acquired the initial businesses using a substantial portion of the net proceeds from the Private Placement. For a discussion of the initial businesses, see “—Portfolio and Investment Activity” below.
On March 7, 2018, our Registration Statement was declared effective by the SEC and we began offering $1,000,000,000 of Shares under the Public Offering, as further described below under “—Our Common Shares Offering—Public Offering.”
Our Common Shares Offering
As of December 31, 2017, we had issued 4,000 shares of the Company’s Class FA shares, to each of the Manager and Sub-Manager, for an aggregate purchase price of $200,000 (total of 8,000 Class FA shares). No selling commissions or dealer manager fees were paid in connection with the issuances.
Private Placement
We offered through the Private Placement up to $85 million of Class FA shares and up to $115 million of Class A shares (one of the classes of Shares that constitute non-founder shares) on a best efforts basis, which meant that the Placement Agent in connection with the Private Placement used its best efforts but was not required to sell any specific amount of shares. On February 7, 2018, we commenced operations when we met our minimum offering requirement of $80 million in Class FA shares under the Private Placement and we issued approximately 3.3 million Class FA shares at $25.00 per Class FA share resulting in gross proceeds of approximately $81.7 million. The $81.7 million in gross proceeds included a cash capital contribution of $2.4 million from the Manager in exchange for 96,000 Class FA shares and a cash capital contribution of $9.5 million from CNL Strategic Capital Investment, LLC, which is indirectly controlled by James M. Seneff, Jr., the chairman of the Company, in exchange for 380,000 Class FA shares. The $81.7 million also included 96,000 Class FA shares received in exchange for $2.4 million of non-cash consideration in the form of equity interests in Lawn Doctor received from an affiliate of the Sub-Manager pursuant to the Exchange Agreement. The $81.7 million in gross proceeds also included a cash capital contribution of approximately $0.4 million in exchange for 15,000 Class FA shares, from other individuals affiliated with the Manager. The Class FA shares and Class A shares in the Private Placement were offered for sale only to persons that were “accredited investors,” as that term is defined under the Securities Act, and Regulation D promulgated thereunder. No Class A shares were sold under the Private Placement.
- 12 -
We did not incur any selling commissions or placement agent fees from the sale of the approximately 3.3 million Class FA shares sold under the terms of the Private Placement. We did incur obligations to reimburse the Manager and Sub-Manager for organization and offering costs based on actual amounts raised. These organization and offering costs related to the Private Placement had been previously advanced by the Manager and Sub-Manager, as described further in “Notes to Condensed Consolidated Financial Statements” — Note 5. “Related Party Transactions” included in this supplement. Through March 31, 2018, we incurred approximately $0.7 million of organization and offering costs.
Public Offering
Once the Registration Statement became effective on March 7, 2018, we began offering up to $1,000,000,000 of Shares, on a best efforts basis, which means that CNL Securities Corp., as the Managing Dealer of the Public Offering, will use its best efforts, but is not required to sell any specific amount of Shares. We are offering, in any combination, four classes of Shares in the Public Offering: Class A shares, Class T shares, Class D shares and Class I shares. The initial minimum permitted purchase amount is $5,000 in Shares. The initial per share Public Offering price was $27.32 per Class A share, $26.25 per Class T share, $25.00 per Class D share and $25.00 per Class I share. There are differing selling fees and commissions for each class. We will also pay annual distribution and shareholder servicing fees, subject to certain limits, on the Class T and Class D shares sold in the Public Offering (excluding sales pursuant to the Company’s distribution reinvestment plan).
In April 2018, our board of directors approved new per share public offering prices for each share class in the Public Offering. The new public offering prices became effective on April 27, 2018. The following table provides the new public offering prices and applicable upfront selling commissions and dealer manager fees for each share class available in the Public Offering:
| Class A | Class T | Class D | Class I | ||||||||||||||
| Public Offering Price, Per Share | $ | 27.46 | $ | 26.38 | $ | 25.13 | $ | 25.13 | |||||||||
| Selling Commissions, Per Share | $ | 1.65 | $ | 0.79 | $ | — | $ | — | |||||||||
| Dealer Manager Fees, Per Share | $ | 0.68 | $ | 0.46 | $ | — | $ | — | |||||||||
In May 2018, after taking in consideration the effect of subsequent post-closing adjustments during the true up period relating to the working capital and tax indebtedness of our portfolio companies, our net asset value per Class FA share was adjusted to $25.16 as of March 31, 2018. See “Notes to Condensed Consolidated Financial Statements” — Note 9. “Financial Highlights” included in this supplement for information on the end of period net asset value for Class FA shares.
We are also offering, in any combination, up to $100,000,000 of Class A shares, Class T shares, Class D shares and Class I shares to be issued pursuant to our distribution reinvestment plan. The Public Offering had a minimum offering requirement of $2 million in Shares under the Private Placement or the Public Offering. As of February 2018, we had met the minimum offering requirement of $2 million of the Public Offering through the sale of more than $80 million in Class FA shares under the Private Placement.
Portfolio and Investment Activity
In October 2017, we entered into a merger agreement with LD Merger Sub, Inc., a wholly owned subsidiary of the Company, and LD Parent, Inc., the parent company of Lawn Doctor. The merger agreement was amended on February 6, 2018. On February 7, 2018, pursuant to the terms of the merger agreement and the Exchange Agreement, we acquired an approximately 63.9% equity interest in Lawn Doctor from an affiliate of the Sub-Manager, through an investment consisting of common equity and a debt investment in the form of a secured second lien loan to Lawn Doctor. After the closing of the merger, the consummation of the equity contribution pursuant to the Exchange Agreement and subsequent purchases of common equity in Lawn Doctor by certain members of Lawn Doctor’s senior management team, we own approximately 62.9% of the outstanding equity in Lawn Doctor. As of March 31, 2018, the cost basis of our investments in Lawn Doctor was approximately $30.5 million of common equity and $15.0 million of a debt investment. The purchase price is subject to adjustment based on, among other factors, Lawn Doctor’s working capital and indebtedness at closing.
- 13 -
In October 2017, we entered into a merger agreement with PFHI Merger Sub, Inc., a wholly owned subsidiary of the Company, and Polyform. The merger agreement was amended on February 6, 2018. On February 7, 2018, pursuant to the terms of the merger agreement, we acquired an approximately 87.1% equity interest in Polyform from an affiliate of the Sub-Manager, through an investment consisting of common equity and a debt investment in the form of a first lien secured term loan to Polyform. As of March 31, 2018, the cost basis of our investments in Polyform was approximately $15.8 million of common equity and $15.7 million of a debt investment. The purchase price is subject to adjustment based on, among other factors, Polyform’s working capital and indebtedness at closing.
The debt investments in the form of a secured second lien loan to Lawn Doctor and in the form of a first lien secured term loan to Polyform as described above accrue interest at a per annum rate of 16%. Each loan will mature in August 2023. The note purchase agreements contain customary covenants and events of default.
As of March 31, 2018, our investment portfolio included four distinct investment positions and the fair value of our portfolio was comprised of the following:
| As of March 31, 2018 | ||||||||||||
| Asset Category | Cost | Fair Value | Fair Value Percentage of Investment Portfolio | |||||||||
| Senior debt | ||||||||||||
| Senior secured debt - first lien | $ | 15,700,000 | $ | 15,700,000 | 20.3 | % | ||||||
| Senior secured debt - second lien | 15,000,000 | 15,000,000 | 19.4 | |||||||||
| Total senior debt | $ | 30,700,000 | $ | 30,700,000 | 39.7 | |||||||
| Equity | 46,231,763 | 46,756,212 | 60.3 | |||||||||
| Total investments | $ | 76,931,763 | $ | 77,456,212 | 100.0 | % | ||||||
As of March 31, 2018, the weighted average yield on our debt portfolio was 16.0%.
Lawn Doctor
Lawn Doctor is a leading franchisor of residential lawn care programs and services. Lawn Doctor’s core service offerings provide residential homeowners with year-round monitoring and treatment by focusing on weed and insect control, seeding, and professionally and consistently-administered fertilization, using its proprietary line of equipment. Lawn Doctor is not involved in other lawn maintenance services, such as mowing, edging, and leaf blowing.
Lawn Doctor’s franchised business model has repeatedly received recognition as a leading franchisor of lawn care services by industry associations and trade magazines, and has a customer retention rate of more than 80% over the past three years, which reflects the high level of quality and customer service that Lawn Doctor has been able to sustain over the years. Lawn Doctor’s efforts on behalf of its franchisees (which include shared marketing programs and infrastructure, an extensive online presence, and comprehensive training) have attracted a strong core of dedicated franchise owners who, in turn, contribute to the continued growth and success of the Lawn Doctor brand.
Polyform
Polyform is a leading developer, manufacturer and marketer of polymer clay products worldwide. Through its two primary brands, Sculpey® and Premo!®, Polyform sells a comprehensive line of premium craft products to a diverse mix of customers including specialty and big box retailers, distributors and e-tailers. We believe Polyform is well regarded for its high quality, comprehensive line of polymer clays, clay molds, children kits, wax-base clays, non-dry clays, clay tools and accessories. Polyform’s strong brand recognition, unique product attributes and strong customer network have earned it one of the leading market share positions in the polymer clay segment within the United States. Polyform estimates that its products are available in approximately 8,900 retail locations through its major customers, plus many other locations through independent retailers. Products are shipped directly to 48 countries worldwide.
- 14 -
See “Notes to Condensed Consolidated Financial Statements” — Note 3. “Investments” included in this supplement for additional information related to our investments.
Adjusted EBITDA
When evaluating the performance of our portfolio, we monitor adjusted EBITDA to measure the financial and operational performance of our portfolio companies and their ability to pay contractually obligated debt payments to us. In connection with this evaluation, the Manager and Sub-Manager review monthly portfolio company operating performance versus budgeted expectations and conduct regular operational review calls with the management teams of the portfolio companies.
We present Adjusted EBITDA as a supplemental measure of the performance of our initial businesses. We define Adjusted EBITDA as net income (loss), plus (i) interest expense, net, and loan cost amortization, (ii) taxes and (iii) depreciation and amortization, as further adjusted for certain other non-recurring items that we do not consider indicative of the ongoing operating performance of our initial businesses. These further adjustments are itemized below. You are encouraged to evaluate these adjustments and the reasons we consider them appropriate for supplemental analysis. In evaluating Adjusted EBITDA, you should be aware that in the future our initial businesses may incur expenses that are the same as or similar to some of the adjustments in this presentation. This presentation of Adjusted EBITDA should not be construed as an inference that the future results of our initial businesses will be unaffected by unusual or non-recurring items.
We present Adjusted EBITDA because we believe it assists investors in comparing the performance of such businesses across reporting periods on a consistent basis by excluding items that we do not believe are indicative of their core operating performance.
Adjusted EBITDA has limitations as an analytical tool. Some of these limitations are: (i) Adjusted EBITDA does not reflect cash expenditures, or future requirements, for capital expenditures or contractual commitments; (ii) Adjusted EBITDA does not reflect changes in, or cash requirements for, working capital needs; (iii) Adjusted EBITDA does not reflect the significant interest expense, or the cash requirements necessary to service interest or principal payments, on indebtedness; (iv) although depreciation and amortization are non-cash charges, the assets being depreciated and amortized will often have to be replaced in the future and Adjusted EBITDA does not reflect any cash requirements for such replacements; (v) Adjusted EBITDA does not reflect the impact of certain cash charges resulting from matters we do not consider to be indicative of the on-going operations of our initial businesses; and (vi) other companies in similar industries as our initial businesses may calculate Adjusted EBITDA differently, limiting its usefulness as a comparative measure.
Because of these limitations, Adjusted EBITDA should not be considered in isolation or as a substitute for performance measures calculated in accordance with GAAP. We compensate for these limitations by relying primarily on the GAAP results and using Adjusted EBITDA only supplementally.
Summarized Net Income to Adjusted EBITDA Reconciliations (Unaudited)
Lawn Doctor
Period February 7, 2018(1) through | ||||
| Net Income (GAAP) | $ | 23,635 | ||
| Interest and Debt Related Expenses | 606,186 | |||
| Depreciation and Amortization | 127,088 | |||
| Income Tax Expense | 7,825 | |||
| Transaction Costs | 313,895 | |||
| Adjusted EBITDA (non-GAAP) | $ | 1,078,629 | ||
- 15 -
Polyform
Period February 7, 2018(1) through March 31, 2018 | ||||
| Net Loss (GAAP) | $ | (431,736 | ) | |
| Interest and Debt Related Expenses | 428,946 | |||
| Depreciation and Amortization | 291,465 | |||
| Income Tax Benefit | (48,000 | ) | ||
| Transaction Costs | 313,895 | |||
| Adjusted EBITDA (non-GAAP) | $ | 554,570 | ||
| (1) | February 7, 2018 is the date we acquired the portfolio companies. |
Factors Impacting Our Operating Results
We expect that the results of our operations will be affected by a number of factors. Many of the factors that will affect our operating results are beyond our control.
We will be dependent upon the earnings of and cash flow from the businesses that we acquire to meet our corporate overhead and management fee expenses and to make distributions. These earnings and cash flows, net of any minority interests in these businesses, will be available:
| ● | first, to meet management fees and corporate overhead expenses of the company; and |
| ● | second, to fund business operations and distributions by the company to shareholders. |
Size of assets
If we are unable to raise substantial funds, we will be limited in the number and type of acquisitions we may make. The size of our assets will be a key revenue driver. Generally, as the size of our assets grows, the amount of income we receive will increase. In addition, our assets may grow at an uneven pace as opportunities to acquire assets may be irregularly timed, and the timing and extent of the Manager’s and the Sub-Manager’s success in identifying such opportunities, and our success in making acquisitions, cannot be predicted.
Market conditions
From time to time, the global capital markets may experience periods of disruption and instability, which could materially and adversely impact the broader financial and credit markets and reduce the availability to us of debt and equity capital. Significant changes or volatility in the capital markets may also have a negative effect on the valuations of our businesses and other assets. While all of our assets are likely to not be publicly traded, applicable accounting standards require us to assume as part of our valuation process that our assets are sold in a principal market to market participants (even if we plan on holding an asset long term or through its maturity) and impairments of the market values or fair market values of our assets, even if unrealized, must be reflected in our financial statements for the applicable period, which could result in significant reductions to our net asset value for the period. Significant changes in the capital markets may also affect the pace of our activity and the potential for liquidity events involving our assets. Thus, the illiquidity of our assets may make it difficult for us to sell such assets to access capital if required, and as a result, we could realize significantly less than the value at which we have recorded our assets if we were required to sell them for liquidity purposes.
Results of Operations
From the time of our formation on August 9, 2016 through February 6, 2018, we had not commenced operations. Operations commenced on February 7, 2018, when aggregate subscription proceeds in excess of the minimum offering amount of $80 million were received in the Private Placement. We acquired our initial businesses on February 7, 2018 using a substantial portion of the net proceeds from the Private Placement. See “—Our Common Shares Offering” and “—Portfolio and Investment Activity” above for additional information.
- 16 -
As of March 31, 2018, the fair value of our investment portfolio totaled approximately $77.5 million. Our investments at March 31, 2018 consisted of two debt investments and two equity investments. See section entitled “—Portfolio and Investment Activity” above for discussion of the general terms and characteristics of our investments, and for information regarding investment activities during the period from February 7, 2018 (commencement of operations) through March 31, 2018.
The following is a summary of our operating results for the period from February 7, 2018 (commencement of operations) through March 31, 2018:
| Total investment income | $ | 728,216 | ||
| Net operating expense | 425,375 | |||
| Net investment income | 302,841 | |||
| Net change in unrealized appreciation | 524,449 | |||
| Net increase in net assets resulting from operations | $ | 827,290 |
Investment Income
Investment income consisted of the following for the period from February 7, 2018 (commencement of operations) through March 31, 2018:
| Interest income | $ | 728,216 | ||
| Total investment income | $ | 728,216 |
As of March 31, 2018, our weighted average annual yield on our accruing debt investments was 16.0% based on amortized cost, as defined above in “—Portfolio and Investment Activity.” As of March 31, 2018, all of our debt investments had fixed rate interest. Interest income and total investment income for the period February 7, 2018 (commencement of operations) through March 31, 2018 was $728,216. We believe that our interest income and total investment income is not representative of either our stabilized performance or our future performance. We expect an increase in interest income and dividend income in future periods due to an increasing base of investments that we expect to result from the expected increase in capital available for investment as related to our Public Offering.
Operating Expenses
Our operating expenses for the period from February 7, 2018 (commencement of operations) through March 31, 2018 were as follows:
| Organization and offering expenses | $ | 221,564 | ||
| Base management fees | 88,562 | |||
| Professional services | 73,581 | |||
| Director fees and expenses | 37,070 | |||
| Administrative services | 32,493 | |||
| Custodian and accounting fees | 15,000 | |||
| Other | 317 | |||
| Total operating expenses | 468,587 | |||
| Expense support | (43,212 | ) | ||
| Net expenses | $ | 425,375 |
Operating expenses were partially offset by expense support of $43,212 for the period from February 7, 2018 (commencement of operations) through March 31, 2018. We consider the following expense categories to be relatively fixed in the near term: administrative services, director fees and expenses, and custodian and accounting fees. Variable operating expenses include professional services, base management fees, performance–based incentive fees, distribution and shareholder servicing fees, and a component of other operating expenses related to transfer agency services and shareholder services. We expect these variable operating expenses to increase either in connection with the growth in the asset base (investment advisory fees and total return incentive fees), the number of shareholders and open accounts (transfer agency services and shareholder services, distribution and shareholder servicing fees) and the complexity of our investment processes and capital structure (professional services).
- 17 -
Organization and Offering Expenses
Organization expenses are expensed on our statement of operations as incurred. Offering expenses, which consist of amounts incurred for items such as legal, accounting, regulatory and printing work incurred related to our Offerings, are capitalized on our statement of assets and liabilities as deferred offering expenses and expensed to our statement of operations over the lesser of the offering period or 12 months; however, the end of the deferral period will not exceed 12 months from the date the offering expense is incurred by the Manager and the Sub-Manager.
Base Management Fee
Our base management fee is calculated for each share class at an annual rate of (i) for the non-founder shares, 2% of the product of (x) our average gross assets and (y) the ratio of non-founder share Average Adjusted Capital for a particular class to total Average Adjusted Capital and (ii) for the founder shares, 1% of the product of (x) our average gross assets and (y) the ratio of outstanding founder share Average Adjusted Capital to total Average Adjusted Capital, in each case excluding cash, and is payable monthly in arrears.
Total Return Incentive Fee
The Manager and Sub-Manager are also eligible to receive incentive fees based on the Total Return to Shareholders, as defined in the Management Agreement and Sub-Management Agreement, for each share class in any calendar year, payable annually in arrears. We will accrue (but not pay) the total return incentive fee on a quarterly basis, to the extent that it is earned, and will perform a final reconciliation at completion of each calendar year and the total return incentive fee shall be due and payable to the Manager no later than ninety (90) calendar days following the end of the applicable calendar year. The total return incentive fee may be reduced or deferred by the Manager and the Sub-Manager under the Management Agreement and the Expense Support and Conditional Reimbursement Agreement. We did not incur any total return incentive fees during the period February 7, 2018 (commencement of operations) through March 31, 2018.
Expense Support and Conditional Reimbursement Agreement
We have entered into an Expense Support and Conditional Reimbursement Agreement with the Manager and the Sub-Manager, pursuant to which each of the Manager and the Sub-Manager agrees to reduce the payment of base management fees, total return incentive fees and the reimbursements of reimbursable expenses due to the Manager and the Sub-Manager under the Management Agreement and the Sub-Management Agreement, as applicable, to the extent that our annual regular cash distributions exceed our annual net income (with certain adjustments). Expense Support is equal to the annual (calendar year) excess, if any, of (a) the distributions (as defined in the Expense Support and Conditional Reimbursement Agreement) declared and paid (net of our distribution reinvestment plan) to shareholders minus (b) the available operating funds. The Expense Support amount will be borne equally by the Manager and the Sub-Manager and will be calculated as of the last business day of the calendar year. Beginning on February 7, 2018 and continuing until the Expense Support and Conditional Reimbursement Agreement is terminated, the Manager and Sub-Manager shall equally conditionally reduce the payment of fees and reimbursements of reimbursable expenses in an amount equal to the conditional waiver amount (as defined in and subject to limitations described in the Expense Support and Conditional Reimbursement Agreement). The term of the Expense Support and Conditional Reimbursement Agreement has the same initial term and renewal terms as the Management Agreement or the Sub-Management Agreement, as applicable to the Manager or the Sub-Manager.
If, on the last business day of the calendar year, there are Excess Operating Funds, we will use such Excess Operating Funds to pay the Manager and the Sub-Manager all or a portion of the outstanding unreimbursed Expense Support amounts for each share class, as applicable, subject to the Conditional Reimbursements as described further in the Expense Support and Conditional Reimbursement Agreement. Our obligation to make Conditional Reimbursements shall automatically terminate and be of no further effect three years following the date which the Expense Support amount was provided and to which such Conditional Reimbursement relates, as described further in the Expense Support and Conditional Reimbursement Agreement.
- 18 -
Net Change in Unrealized Appreciation
For the period February 7, 2018 (commencement of operations) through March 31, 2018, net unrealized appreciation on investments consisted of the following:
| Unrealized appreciation | $ | 524,449 | ||
| Unrealized depreciation | — | |||
| Total net unrealized appreciation | $ | 524,449 |
The unrealized appreciation of $524,449 pertains solely to our investment in the equity of Lawn Doctor, primarily as a result of, among other things, strong performance above expectations and the future growth opportunities of Lawn Doctor.
We are not aware of any material trends or uncertainties, favorable or unfavorable, that may be reasonably anticipated to have a material impact on either capital resources or the revenues or income to be derived from our investments, other than those described above, the risk factors, if any, identified in the “Risk Factors” of the Prospectus.
Net Assets
Net assets increased approximately $82.0 million during the period February 7, 2018 (commencement of operations) through March 31, 2018. The most significant increase in net assets during the quarter ended March 31, 2018 was attributable to capital transactions including the issuance of Class FA shares resulting in net proceeds of approximately $81.5 million. Additionally, during the quarter ended March 31, 2018, our operations resulted in an increase in net assets of approximately $0.8 million. These increases in net assets were partially offset by distributions to shareholders of approximately $0.3 million during the quarter ended March 31, 2018.
Our shares are illiquid investments for which there is currently not a secondary market. You should not expect to be able to resell your shares regardless of how we perform. If you are able to sell your shares, you will likely receive less than your purchase price. Our net asset value and annualized returns, which are based in part upon determinations of fair value of Level 3 investments by our board of directors, not active market quotations, are inherently uncertain. Past performance is not a guarantee of future results.
Liquidity and Capital Resources
Liquidity is a measure of our ability to meet potential cash requirements, including ongoing commitments, fund and maintain our assets and operations, repay borrowings, make distributions to our shareholders and other general business needs. We will use significant cash to fund acquisitions, repay principal and interest on our borrowings, make distributions to our shareholders and fund our operations. Our primary sources of cash will generally consist of:
| ● | the net proceeds of the Public Offering; |
| ● | distributions, interest earned and fees from our assets; |
| ● | proceeds from sales of assets and principal repayments from our assets; and |
| ● | unused borrowing capacity under our financing sources. |
We expect we will have sufficient cash from current sources to meet our liquidity needs for the next twelve months. However, we may opt to supplement our equity capital and increase potential returns to our shareholders through the use of prudent levels of borrowings. We may use debt when the available terms and conditions are favorable to long-term investing and well-aligned with our business strategy. In determining whether to borrow money, we seek to optimize maturity, covenant packages and rate structures. Most importantly, the risks of borrowing within the context of our business outlook and the impact on our businesses are extensively analyzed by the Manager and our board of directors in making this determination.
- 19 -
While we generally intend to hold our assets for the long term, certain assets may be sold in order to manage our liquidity needs, meet other operating objectives and adapt to market conditions. The timing and impact of future sales of our assets, if any, cannot be predicted with any certainty.
As of March 31, 2018 and December 31, 2017, we had approximately $5.6 million and $0.2 million of cash and cash equivalents, respectively.
We raised approximately $81.5 million in net proceeds (3.3 million shares of Class FA shares) during the period February 7, 2018 (commencement of operations) through March 31, 2018 under the Private Placement, which included a $2.4 million non-cash contribution by our Sub-Manager, as described above under “—Our Common Shares Offering.” As of March 31, 2018, we had approximately 947 million common shares available for sale through our Public Offering.
During the period February 7, 2018 (commencement of operations) through March 31, 2018, we generated cash flows primarily from interest earned on our debt investments. We used approximately $74.4 million of the cash proceeds from our Private Placement to purchase our initial businesses. We also declared four weekly distributions in March 2018 totaling approximately $0.3 million, which were paid to shareholders in April 2018. See “—Distributions” below for information regarding our distribution policy.
Hedging Activities
In an effort to stabilize our revenue and input costs where applicable, we may enter into derivatives or other financial instruments in an attempt to hedge our commodity risk. With respect to any potential financings, general increases in interest rates over time may cause the interest expense associated with our borrowings to increase, and the value of our debt investments to decline. We may seek to stabilize our financing costs as well as any potential decline in our assets by entering into derivatives, swaps or other financial products in an attempt to hedge our interest rate risk. In the event we pursue any assets outside of the United States we may have foreign currency risks related to our revenue and operating expenses denominated in currencies other than the U.S. dollar. We may in the future, enter into derivatives or other financial instruments in an attempt to hedge any such foreign currency exchange risk. It is difficult to predict the impact hedging activities may have on our results of operations.
Distributions
Subject to our board of directors’ discretion and applicable legal restrictions, our board of directors intends to declare cash distributions to shareholders based on weekly record dates and we intend to pay such distributions on a monthly basis. Shareholders may elect to reinvest their distributions as additional common shares under our distribution reinvestment plan. Our shareholders will be taxed on their allocable share of income, even if their distributions are reinvested in additional shares of our common shares. The following table reflects, by share class, the cash distributions per share and the total amount of distributions that we have declared on our common shares during the period February 7, 2018 (commencement of operations) through March 31, 2018:
| Quarter Ended March 31, 2018 | |||||||||
| Per Share | Amount | ||||||||
| March 31, 2018 (4 record dates) | |||||||||
| Class FA shares | $ | 0.092718 | $ | 302,841 | |||||
| Class A shares | 0.092718 | — | |||||||
| Class T shares | 0.074177 | — | |||||||
| Class D shares | 0.083449 | — | |||||||
| Class I shares | 0.092718 | — | |||||||
Our board of directors also declared cash distributions on the outstanding shares of all classes of our common shares based on weekly record dates for the time period beginning on April 3, 2018 through and including May 29, 2018, as set forth below:
| Distribution Record Date | Distribution Payment Date | Declared Distribution Per Share for Each Share Class | ||||||||||||||||||||
Class FA | Class A | Class T | Class D | Class I | ||||||||||||||||||
| April 3, 2018 | May 10, 2018 | $ | 0.024038 | $ | 0.024038 | $ | 0.019231 | $ | 0.021635 | $ | 0.024038 | |||||||||||
| April 10, 2018 | May 10, 2018 | $ | 0.024038 | $ | 0.024038 | $ | 0.019231 | $ | 0.021635 | $ | 0.024038 | |||||||||||
| April 17, 2018 | May 10, 2018 | $ | 0.024038 | $ | 0.024038 | $ | 0.019231 | $ | 0.021635 | $ | 0.024038 | |||||||||||
| April 24, 2018 | May 10, 2018 | $ | 0.024038 | $ | 0.024038 | $ | 0.019231 | $ | 0.021635 | $ | 0.024038 | |||||||||||
| May 1, 2018 | June 11, 2018 | $ | 0.024038 | $ | 0.024038 | $ | 0.019231 | $ | 0.021635 | $ | 0.024038 | |||||||||||
| May 8, 2018 | June 11, 2018 | $ | 0.024038 | $ | 0.024038 | $ | 0.019231 | $ | 0.021635 | $ | 0.024038 | |||||||||||
| May 15, 2018 | June 11, 2018 | $ | 0.024038 | $ | 0.024038 | $ | 0.019231 | $ | 0.021635 | $ | 0.024038 | |||||||||||
| May 22, 2018 | June 11, 2018 | $ | 0.024038 | $ | 0.024038 | $ | 0.019231 | $ | 0.021635 | $ | 0.024038 | |||||||||||
| May 29, 2018 | June 11, 2018 | $ | 0.024038 | $ | 0.024038 | $ | 0.019231 | $ | 0.021635 | $ | 0.024038 | |||||||||||
- 20 -
We calculate each shareholder’s specific distribution amount for the period using record and declaration dates. Distributions are made on all classes of our shares at the same time. Amounts distributed are allocated among each class in proportion to the number of shares of each class outstanding. Amounts distributed to each class are allocated among the holders of our shares in such class in proportion to their shares. The per share amount of distributions on Class A, Class T, Class D and Class I shares will differ because of different allocations of certain class-specific expenses. Specifically, distributions on Class T shares and Class D shares will be lower than distributions on Class A, Class FA and Class I shares because the company is required to pay ongoing annual distribution and shareholder servicing fees with respect to the Class T shares and Class D shares sold in the primary offering. Additionally, distributions on the non-founder shares will likely be lower than distributions on Class FA shares because we are required to pay higher management and incentive fees to the Manager and the Sub-Manager with respect to the non-founder shares. There is no assurance that we will pay distributions in any particular amount, if at all. See “Notes to Condensed Consolidated Financial Statements” — Note 6. “Distributions” included in this supplement for additional disclosures regarding distributions.
We do not expect to use equity capital or borrowed funds to pay distributions to shareholders. See “Notes to Condensed Consolidated Financial Statements” — Note 6. “Distributions” included in this supplement for a discussion of the sources of funds used to pay distributions on a GAAP basis for the periods presented.
Distribution Reinvestment Plan
We have adopted a distribution reinvestment plan pursuant to which shareholders who purchase shares in our Public Offering (other than shareholders who are residents of Alabama, Idaho, Kansas, Kentucky, Maine, Maryland, Massachusetts, Minnesota, Mississippi, Nebraska, New Hampshire, New Jersey, North Carolina, Ohio, Oregon, Washington (collectively the “Opt-in States”) and clients of certain participating broker-dealers that do not permit automatic enrollment in our distribution reinvestment plan) will have their cash distributions automatically reinvested in additional shares having the same class designation as the class of shares to which such distributions are attributable, unless such shareholders elect to receive distributions in cash. Shareholders who are residents of Opt-in States, holders of Class FA shares and clients of certain participating broker-dealers that do not permit automatic enrollment in our distribution reinvestment plan will automatically receive their distributions in cash unless they elect to have their cash distributions reinvested in additional shares. Cash distributions paid on Class FA shares will be reinvested in additional shares of Class A shares. The following discussion summarizes the principal terms of this plan.
The purchase price for shares purchased under our distribution reinvestment plan will be equal to the most recently determined and published net asset value per share of the applicable class of shares. Because the annual distribution and shareholder servicing fee is calculated based on net asset value, it reduces net asset value and/or distributions with respect to Class T shares and Class D shares, including shares issued under the distribution reinvestment plan with respect to such share classes. To the extent newly issued shares are purchased from us under the distribution reinvestment plan or shareholders elect to reinvest their cash distribution in our shares, we will retain and/or receive additional funds for acquisitions and general purposes including the repurchase of shares under our share repurchase program.
We will not pay selling commissions or dealer manager fees on shares sold pursuant to our distribution reinvestment plan. However, the amount of the annual distribution and shareholder servicing fee payable with respect to Class T or Class D shares, respectively, sold in this offering will be allocated among all Class T or Class D shares, respectively, including those sold under our distribution reinvestment plan and those received as distributions.
- 21 -
Contractual Obligations
We have entered into the Management Agreement with the Manager and the Sub-Management Agreement with the Manager and the Sub-Manager pursuant to which the Manager and the Sub-Manager are entitled to receive a base management fee and the reimbursement of certain expenses. Certain incentive fees based on our performance are payable to the Manager and the Sub-Manager after our performance thresholds are met. Each of the Manager and the Sub-Manager is entitled to 50% of the base management fee and incentive fees, subject to any reduction or deferral of any such fees pursuant to the terms of the Expense Support and Conditional Reimbursement Agreement. We have also entered into the Administrative Services Agreement with the Administrator and the Sub-Administration Agreement with the Administrator and the Sub-Administrator pursuant to which the Administrator and the Sub-Administrator will provide us with administrative services and are entitled to reimbursement of expenses for such services. For a discussion of the compensation we pay in connection with the management of our business, see “Notes to Condensed Consolidated Financial Statements” — Note 5. “Related Party Transactions” included in this supplement.
Off-Balance Sheet Arrangements
We currently have no off-balance sheet arrangements, including any risk management of commodity pricing or other hedging practices.
Inflation
We do not anticipate that inflation will have a significant effect on our results of operations. However, in the event of a significant increase in inflation, interest rates could rise and our assets may be materially adversely affected.
Seasonality
We do not anticipate that seasonality will have a significant effect on our results of operations.
Critical Accounting Policies and Use of Estimates
Our most critical accounting policies will involve decisions and assessments that could affect our reported assets and liabilities, as well as our reported revenues and expenses. We believe that all of the decisions and assessments upon which our financial statements are based are reasonable at the time made and based upon information available to us at that time. Our critical accounting policies and accounting estimates will be expanded over time as we continue to implement our business and operating strategy. Our significant accounting policies are described in “Notes to Condensed Consolidated Financial Statements” — Note 2. “Significant Accounting Policies” included in this supplement. Those material accounting policies and estimates that we initially expect to be most critical to an investor’s understanding of our financial results and condition, as well as those that require complex judgment decisions by our management, are discussed below.
Basis of Presentation
Our financial statements are prepared in accordance with GAAP, which requires the use of estimates, assumptions and the exercise of subjective judgment as to future uncertainties.
Although we are organized and intend to conduct our business in a manner so that we are not required to register as an investment company under the Investment Company Act, our financial statements are prepared using the specialized accounting principles of ASC Topic 946 to utilize investment company accounting. We obtain funds through the issuance of equity interests to multiple unrelated investors, and provide such investors with investment management services. Further, our business strategy is to acquire interests in middle-market businesses to provide current income and long term capital appreciation, while protecting invested capital. Overall, we believe that the use of investment company accounting on a fair value basis is consistent with the management of our assets on a fair value basis, and make our financial statements more useful to investors and other financial statement users in facilitating the evaluation of an investment in us as compared to other investment products in the marketplace.
- 22 -
Valuation of Investments
We have adopted, and our valuation policy is performed in accordance with, ASC Topic 820, as described in “Notes to Condensed Consolidated Financial Statements” — Note 2. “Significant Accounting Policies” included in this supplement. As of March 31, 2018, all of our investments were categorized as Level 3. Our investments are valued utilizing a market approach, an income approach (i.e. discounted cash flow approach), a transaction approach, or a combination of such approaches, as appropriate. The market comparables approach uses prices, including third party indicative broker quotes, and other relevant information generated by market transactions involving identical or comparable assets or liabilities (including a business). The transaction approach uses pricing indications derived from recent precedent merger and acquisition transactions involving comparable target companies. The income approach uses valuation techniques to convert future amounts (for example, cash flows or earnings) that are discounted based on a required or expected discount rate to derive a single present value amount. The measurement is based on the value indicated by current market expectations about those future amounts. In following these approaches, the types of factors we may take into account to determine the fair value of our investments include, as relevant: available current market data, including an assessment of the credit quality of the security’s issuer, relevant and applicable market trading and transaction comparables, applicable market yields and multiples, illiquidity discounts, security covenants, call protection provisions, information rights, the nature and realizable value of any collateral, the portfolio company’s ability to make payments, its earnings and cash flows, the markets in which the portfolio company does business, comparisons of financial ratios of peer companies that are public, data derived from merger and acquisition activities for comparable companies, and enterprise values, among other factors.
Our board of directors is ultimately responsible for determining in good faith the fair value of our investments in accordance with the valuation policy and procedures approved by the board of directors, based on, among other things, the input of the Manager, the Sub-Manager, the Company’s management, audit committee, and independent third-party valuation firm. The determination of the fair value of our assets requires judgment, especially with respect to assets for which market prices are not available. For most of our assets, market prices will not be available. Due to the inherent uncertainty of determining the fair value of assets that do not have a readily available market value, the fair value of the assets may differ significantly from the values that would have been used had a readily available market value existed for such assets, and the differences could be material. Because the calculation of our net asset value is based, in part, on the fair value of our assets, our calculation of net asset value is subjective and could be adversely affected if the determinations regarding the fair value of its assets were materially higher than the values that we ultimately realize upon the disposal of such assets. Furthermore, through the valuation process, our board of directors may determine that the fair value of our assets differs materially from the values that were provided by the independent valuation firm.
U.S. Federal Income Taxes
We believe that we are properly characterized as a partnership for U.S. Federal income tax purposes and expect to continue to qualify as a partnership (and not be treated as a publicly traded partnership or otherwise be treated as a taxable corporation) for such purposes. As a partnership, we are generally not subject to U.S Federal income tax at the entity level.
Recently Issued Accounting Pronouncements
We will adopt all authoritative accounting standards relevant to our financial statements as required.
JOBS Act
We qualify as an “emerging growth company” pursuant to the provisions of the JOBS Act, enacted on April 5, 2012. For as long as we are an “emerging growth company,” we may take advantage of certain exemptions from various reporting requirements that are applicable to other public companies that are not “emerging growth companies,” including, but not limited to, not being required to comply with the auditor attestation requirements of Section 404(b) of the Sarbanes-Oxley Act, reduced disclosure obligations regarding executive compensation in our periodic reports and proxy statements, and exemptions from the requirements of holding advisory “say-on-pay” votes on executive compensation and shareholder advisory votes on golden parachute compensation. Although these exemptions will be available to us, we do not expect these exemptions to have a material impact on our public reporting and disclosure. Because we are not a “large accelerated filer” or an “accelerated filer” under the Exchange Act, and will not be so long as our shares are not traded on a securities exchange, we are not subject to the auditor attestation requirements of Section 404(b) of the Sarbanes-Oxley Act. In addition, because we have no employees, we do not have any executive compensation or golden parachute payments to report in our periodic reports and proxy statements.
- 23 -
Under the JOBS Act, we will remain an “emerging growth company” until the earliest of:
| ● | the last day of the fiscal year during which we have total annual gross revenues of $1.07 billion or more; |
| ● | the last day of the fiscal year following the fifth anniversary of the completion of this offering; |
| ● | the date on which we have, during the previous three-year period, issued more than $1 billion in non-convertible debt; and |
| ● | the date on which we are deemed to be a “large accelerated filer” under the Exchange Act. We will qualify as a large accelerated filer as of the first day of the first fiscal year after we have (i) more than $700 million in outstanding common equity held by our non-affiliates as of the last day of our most recently completed second fiscal quarter, (ii) been a public company for at least 12 months and (iii) filed at least one annual report with the SEC. The value of our outstanding common equity will be measured each year on the last day of our second fiscal quarter. |
The JOBS Act also provides that an “emerging growth company” can utilize the extended transition period provided in Section 7(a)(2)(B) of the Securities Act for complying with new or revised accounting standards. However, we are choosing to opt out of that extended transition period, and, as a result, we will comply with new or revised accounting standards on the relevant dates on which adoption of such standards is required for companies that are not “emerging growth companies.” Section 107 of the JOBS Act provides that our decision to opt out of the extended transition period for complying with new or revised accounting standards is irrevocable.
Our Portfolio
The following disclosure supersedes and replaces the fourth paragraph under the section “Our Portfolio—Lawn Doctor—Overview,” which appears on page 90 of the Prospectus.
As of March 31, 2018, Lawn Doctor had 43 employees. None of Lawn Doctor’s employees are subject to collective bargaining agreements. Lawn Doctor’s corporate headquarters (which it owns) are in Holmdel, New Jersey, and it leases an approximately 27,680 square foot manufacturing site in Marlboro, New Jersey.
The following disclosure is added to immediately follow the fourth paragraph under the section “Our Portfolio—Lawn Doctor—Overview,” which appears on page 90 of the Prospectus.
In May 2018, Lawn Doctor acquired an 80% equity interest in Mosquito Hunters, LLC, a franchisor of mosquito and pest control services (“Mosquito Hunters”). Mosquito Hunters was founded in 2013, is based in Northbrook Illinois and specializes in the eradication of mosquitos through regular spraying applications and follow-up maintenance. There are currently eight Mosquito Hunters franchises spread over five states. This acquisition furthers Lawn Doctor’s strategy of both growing organically and also via acquisition of additional home service brands. Pest control is an approximately $2.5 billion market in the United States as of December 31, 2017 and is the fastest growing building maintenance service segment.
The following disclosure supersedes and replaces the first paragraph under the section “Our Portfolio—Lawn Doctor—Investment Highlights,” which appears on page 90 of the Prospectus.
- 24 -
Investment Highlights. Lawn Doctor operates a nationwide network of independently owned franchise units in 39 states. The franchisee unit base has grown from 452 in 2012 to 557 as of March 31, 2018, with strong average annual openings of approximately 30 units and an average annual closure rate of approximately 2%. There is minimal franchisee concentration with the top ten franchisees accounting for approximately 27.1% and 22.1% of total royalty revenue for the year ended December 31, 2017 and the three months ended March 31, 2018, respectively. Lawn Doctor benefits from a scalable business model, which does not require significant capital expenditures or additional fixed costs to support future growth. Lawn Doctor earns revenue from franchisee royalty fees, equipment lease fees, initial franchisee fees, equipment parts sales, vendor rebates, and interest on franchise loans. The primary source of revenue is the franchisee royalty fee. The total revenue for the twelve months ended December 31, 2017 and the three months ended March 31, 2018 was approximately $15.8 million and $4.7 million, respectively, of which approximately $12.1 million and $2.9 million was the franchisee royalty fees for Lawn Doctor. Lawn Doctor’s total revenue has grown at a compound annual growth rate of approximately 6.0% from 2009 to 2017 and Lawn Doctor’s franchisee royalty fees have grown at a compound annual growth rate of approximately 4.9% from 2009 to 2017. Total system-wide sales for Lawn Doctor were approximately $118 million and $27 million for the twelve months ended December 31, 2017 and the three months ended March 31, 2018, respectively.
The following disclosure supersedes and replaces the third paragraph under the section “Our Portfolio—Polyform—Overview,” which appears on page 91 of the Prospectus.
Polyform estimates that its products are available in approximately 8,900 retail locations through its major customers, plus many other locations through independent retailers. Products are shipped directly to 48 countries worldwide. As of March 31, 2018, Polyform had 48 employees. None of Polyform’s employees are subject to collective bargaining agreements. Polyform’s corporate headquarters (which consists of approximately 58,000 square feet of leased space) are in Elk Grove Village, Illinois.
The following disclosure supersedes and replaces the first paragraph under the section “Our Portfolio—Lawn Doctor—Investment Highlights,” which appears on page 90 of the Prospectus.
Investment Highlights. Polyform has grown its signature product lines, Sculpey® and Premo!®, into global names with a strong retail presence in the United States and growing presences abroad. Polyform ships its products directly to 48 countries worldwide, but a significant portion of its sales occur in the domestic market with 85% of its revenues coming from the United States over the trailing twelve months ended December 31, 2017. The clay products are clean, economical, easy to work with and only require oven baking at 275 degrees Fahrenheit. Polyform’s success in the arts and crafts market is a result of its unique product formulations that offer superior molding and color profiles, and Polyform believes the proprietary product formulas and manufacturing methodologies create significant barriers to entry or duplication. The primary source of Polyform’s revenue is the sale of its products. Net sales for Polyform were approximately $15.9 million and $4.2 million for the twelve months ended December 31, 2017 and the three months ended March 31, 2018, respectively, and sales have grown at a compound annual growth rate of approximately 4.3% from 2009 to 2017.
Security Ownership
The following disclosure supersedes and replaces the third footnote to the security ownership table under the section “Security Ownership,” which appears on page 129 of the Prospectus.
(3) Represents 100,000 shares held of record by the Manager, CNL Strategic Capital Management, LLC, an indirect subsidiary of CNL Financial Group, LLC, which is indirectly wholly owned by Mr. Seneff. Also represents 380,000 shares held of record by CNL Strategic Capital Investment, LLC, which is indirectly controlled by Mr. Seneff.
Conflicts of Interest and Certain Relationships and Related Party Transactions
The following disclosure supersedes and replaces the last sentence of the first paragraph under the section “Conflicts of Interest and Certain Relationships and Related Party Transactions—The Acquisition of Our Initial Businesses—Lawn Doctor Acquisition,” which appears on page 135 of the Prospectus.
- 25 -
The proceeds of our investment, in combination with the proceeds of a $3.0 million secured second lien loan from Aspire Capital Group, LLC, an affiliate of Lawn Doctor CEO Scott Frith, and the proceeds from the senior credit facility described below, were used in part to retire existing Lawn Doctor debt (approximately $8.5 million), purchase (subject to adjustment as described above) equity from the SB Fund (approximately $39.8 million) and a former member of Lawn Doctor’s senior management team (approximately $4.8 million), and make option termination payments to current employees of Lawn Doctor (approximately $1.6 million).
The following disclosure supersedes and replaces the third and fourth sentences of the first paragraph under the section “Conflicts of Interest and Certain Relationships and Related Party Transactions—The Acquisition of Our Initial Businesses—Polyform Acquisition,” which appears on page 136 of the Prospectus.
The purchase price is subject to adjustment based on, among other factors, Polyform’s working capital and indebtedness at the closing with a true-up adjustment no later than 120 days thereafter; provided that if the purchase price is adjusted downward, the amount by which the purchase price is decreased will be limited to a maximum of $500,000, which is the portion of the merger consideration held in escrow for such purpose. The proceeds of our investment were used in part to retire existing Polyform debt (approximately $12.7 million), purchase (subject to adjustment as described above) equity from the SB Fund (approximately $16.5 million), and minority stockholders excluding Ms. Steinmann (approximately $1.5 million), and make option termination payments to current employees of Polyform (approximately $0.2 million).
ERISA Considerations
The following disclosure supersedes and replaces the fourth, fifth and sixth paragraphs under the section “ERISA Considerations—Plan Assets,” which appears on page 167 of the Prospectus.
We anticipate having over 100 shareholders for each non-founder class of shares following the completion of this offering. Thus, the second criterion of the publicly offered exception security should be satisfied.
The non-founder shares are being sold as part of an offering of securities to the public pursuant to an effective registration statement under the Securities Act, and such shares are part of a class that is registered under the Exchange Act before the 120th day after the end of our fiscal year during which the offering of such shares to the public occurred. Any such shares purchased, therefore, should satisfy the third criterion of the publicly-offered security exemption.
We believe that such shares should constitute “publicly-offered securities,” and that our underlying assets should not be considered “plan assets” under the Regulation, assuming that such shares are “freely transferable” and widely held (as contemplated above) and that the offering otherwise takes place as described in this prospectus. However, even if any class of non-founder shares is determined not to be a “publicly offered security,” we still expect not to be subject to the ERISA fiduciary requirements, as described in the following paragraph, and our assets should not be treated as “plan assets” within the meaning of the Plan Asset Regulations.
We sold and issued our Class FA shares in the private offering and used a substantial portion of the net proceeds from the private offering to acquire our initial businesses. The Class FA shares sold in the private offering were not registered under the Exchange Act. However, we currently operate our business in a manner so that it is intended to qualify as a VCOC, as defined in the regulations governing plan assets, or the Plan Asset Regulations, promulgated under ERISA by the Department of Labor, and therefore are not subject to the ERISA fiduciary requirements with respect to our assets. However, if we fail to satisfy the requirements to qualify as a VCOC for any reason and no other exception under the Plan Asset Regulations applies, such failure could materially interfere with our activities or expose us to risks related to our failure to comply with the requirements. If no exception under the Plan Asset Regulations applied, the fiduciary responsibility standards of ERISA would apply to us, including the requirement of investment prudence and diversification, and certain transactions that we enter into, or may have entered into, in the ordinary course of business, might constitute or result in non-exempt prohibited transactions under Section 406 of ERISA or Section 4975 of the Code.
- 26 -
Plan of Distribution
The following disclosure supersedes and replaces the first four paragraphs under the section “Plan of Distribution—Compensation Paid for Sales of Shares—Purchases Net of Selling Commissions and Dealer Manager Fees,” which begins on page 177 of the Prospectus.
Purchases Net of Selling Commissions and Dealer Manager Fees
We expect the Managing Dealer to utilize multiple distribution channels to sell our shares, including through FINRA-registered broker-dealers, registered investment advisers and other financial intermediaries exempt from broker-dealer registration. Selling commissions and dealer manager fees generally will be paid in connection with such sales. However, in the event of the sale of Class A shares and Class T shares in this offering through certain categories of investors or certain investment advisory representatives as described below, we will waive some or all of the sales load, reflecting the fact that we will not pay the Managing Dealer the 6.00% selling commission with respect to such Class A shares and the 3.00% selling commission with respect to such Class T shares and, in some cases, the 2.50% dealer manager fee on such Class A shares and the 1.75% dealer manager fee on such Class T shares, as described in more detail below.
We will not pay selling commissions or dealer manager fees in connection with the following special sales of Class A shares:
| ● | the purchase of Class A shares by directors, the Manager, the Sub-Manager or our affiliates or any of their or our officers, employees, or any family members of those individuals, any Plan established exclusively for the benefit of such persons or entities, or, if approved by our board of directors, our partners, consultants or other third party service providers; |
| ● | the purchase of Class A shares by the directors, officers, registered representatives or employees of a participating broker-dealer (or family members of any of the foregoing) who requests and is entitled to purchase Class A shares net of selling commissions; and |
| ● | the purchase of shares under our distribution reinvestment plan. |
We will not pay selling commissions, but will pay the dealer manager fee, in connection with the following special sales of Class A shares in the offering:
| ● | the sale of Class A shares through registered investment advisers that are affiliated with or duly registered with a participating broker-dealer whom the investor has agreed to pay compensation for investment advisory services or other financial or investment advice; and |
| ● | the sale of Class A shares to investors whose contracts for investment advisory and related brokerage services with participating broker-dealers include a fixed fee or fee-based program, also known as “wrap” accounts or other alternative fee arrangements. |
In each of the two types of special sales specified directly above the dealer manager fee will be paid by us to the Managing Dealer, which may then reallow all or a portion of the dealer manager fee to the participating broker-dealer. Neither the Managing Dealer nor its affiliates will compensate any person engaged as an investment adviser by a potential investor as an inducement for such investment adviser to advise favorably for an investment in us. However, in the case of certain sales of Class A shares to the client of a registered investment adviser in which the registered investment adviser is affiliated with a participating broker-dealer that is a party to a participating broker agreement with the Managing Dealer, the Managing Dealer may reallow all or a portion of the dealer manager fee to the participating broker-dealer entity. If the registered investment adviser is not affiliated with a participating broker-dealer that is a party to a participating broker agreement with the Managing Dealer, the dealer manager fee will not be reallowed. We may also make certain sales directly to these groups or certain institutional investors designated by our management without a broker-dealer intermediary. For such direct sales, all selling commissions and dealer manager fees will be waived.
- 27 -
We will not pay upfront selling commissions or upfront dealer manager fees in connection with the following special sales of Class T shares:
| ● | the purchase of Class T shares by directors, the Manager, the Sub-Manager or our affiliates or any of their or our officers, employees, or any family members of those individuals, any Plan established exclusively for the benefit of such persons or entities, or, if approved by our board of directors, our partners, consultants or other third party service providers; |
| ● | the purchase of Class T shares by the directors, officers, registered representatives or employees of a participating broker-dealer (or family members of any of the foregoing) who requests and is entitled to purchase Class T shares net of upfront selling commissions or upfront dealer manager fees; and |
| ● | the purchase of shares under our distribution reinvestment plan. |
- 28 -
Financial Statements
The Prospectus is hereby supplemented with the following financial information, which is excerpted from Part I—Item 1. “Financial Statements” in our Quarterly Report on Form 10-Q for the quarterly period ended on March 31, 2018.
INDEX TO CONDENSED CONSOLIDATED FINANCIAL STATEMENTS (UNAUDITED)
- F-1 -
CNL Strategic Capital, LLC
Condensed Consolidated Statements of Assets and Liabilities
| March 31, 2018 (unaudited) | December 31, 2017 | |||||||
| Assets | ||||||||
| Investments, at fair value (amortized cost $76,931,763 and $— as of March 31, 2018 and December 31, 2017, respectively) | $ | 77,456,212 | $ | — | ||||
| Cash and cash equivalents | 5,633,760 | 199,683 | ||||||
| Deferred offering expenses | 485,482 | 317 | ||||||
| Total assets | 83,575,454 | 200,000 | ||||||
| Liabilities | ||||||||
| Due to related parties (Note 5) | $ | 772,290 | $ | — | ||||
| Distributions payable | 302,841 | — | ||||||
| Payable for investments purchased | 181,126 | — | ||||||
| Accounts payable and other accrued expenses | 115,345 | — | ||||||
| Accrued directors’ fees | 22,903 | — | ||||||
| Total liabilities | 1,394,505 | — | ||||||
| Commitments and contingencies (Note 8) | ||||||||
| Members’ Equity (Net Assets) | ||||||||
| Preferred shares, $0.001 par value 50,000,000 shares authorized and unissued | $ | — | $ | — | ||||
| Common shares, $0.001 par value 94,660,000 Class A shares authorized and unissued | — | — | ||||||
| Common shares, $0.001 par value 3,400,000 Class FA shares authorized; 3,266,260 and 8,000 shares issued and outstanding at March 31, 2018 and December 31, 2017, respectively | 3,266 | 8 | ||||||
| Common shares, $0.001 par value 662,620,000 Class T shares authorized and unissued | — | — | ||||||
| Common shares, $0.001 par value 94,660,000 Class D shares authorized and unissued | — | — | ||||||
| Common shares, $0.001 par value 94,660,000 Class I shares authorized and unissued | — | — | ||||||
| Capital in excess of par value | 81,653,234 | 199,992 | ||||||
| Accumulated net unrealized appreciation on investments | 524,449 | — | ||||||
| Total Members’ Equity | $ | 82,180,949 | $ | 200,000 | ||||
| Net assets, Class FA shares | $ | 82,180,949 | $ | 200,000 | ||||
| Total Members’ Equity | $ | 82,180,949 | $ | 200,000 | ||||
See notes to condensed consolidated financial statements.
- F-2 -
CNL Strategic Capital, LLC
Condensed Consolidated Statement of Operations
(unaudited)
| For the Period from February 7, 2018 (Commencement of Operations) to March 31, 2018 | ||||
| Investment Income | ||||
| Interest income | $ | 728,216 | ||
| Total investment income | 728,216 | |||
| Operating Expenses | ||||
| Organization and offering expenses | 221,564 | |||
| Base management fees | 88,562 | |||
| Professional services | 73,581 | |||
| Director fees and expenses | 37,070 | |||
| Administrative services | 32,493 | |||
| Custodian and accounting fees | 15,000 | |||
| Other | 317 | |||
| Total operating expenses | 468,587 | |||
| Expense support | (43,212 | ) | ||
| Net expenses | 425,375 | |||
| Net investment income | 302,841 | |||
| Net change in unrealized appreciation on investments | 524,449 | |||
| Net increase in net assets resulting from operations | $ | 827,290 | ||
| Class FA common stock: | ||||
| Net investment income per share | $ | 0.09 | ||
| Diluted and basic earnings per share | $ | 0.25 | ||
| Weighted average number of common shares outstanding (basic and diluted) | 3,266,430 | |||
| Distributions declared per share | $ | 0.09 | ||
See notes to condensed consolidated financial statements.
- F-3 -
CNL Strategic Capital, LLC
Condensed Consolidated Statement of Changes in Net Assets
(unaudited)
| For the Period from February 7, 2018 (Commencement of Operations) to March 31, 2018 | ||||
| Operations: | ||||
| Net investment income | $ | 302,841 | ||
| Net change in unrealized appreciation on investments | 524,449 | |||
| Net increase in net assets resulting from operations | 827,290 | |||
| Distributions to shareholders from: | ||||
| Net investment income | (302,841 | ) | ||
| Net decrease in net assets resulting from distributions to shareholders | (302,841 | ) | ||
| Capital share transactions: | ||||
| Issuance of Class FA shares | 81,456,500 | |||
| Net increase in net assets resulting from capital share transactions | 81,456,500 | |||
| Total increase in net assets | 81,980,949 | |||
| Net assets at beginning of period | 200,000 | |||
| Net assets at end of period | $ | 82,180,949 | ||
| Capital share activity: | ||||
| Issuance of Class FA shares | 3,258,260 | |||
| Net increase in shares outstanding | 3,258,260 | |||
See notes to condensed consolidated financial statements.
- F-4 -
CNL Strategic Capital, LLC
Condensed Consolidated Statement of Cash Flows
(unaudited)
| For the Period from February 7, 2018 (Commencement of Operations) to March 31, 2018 | ||||
| Operating Activities: | ||||
| Net increase in net assets resulting from operations | $ | 827,290 | ||
| Adjustments to reconcile net increase in net assets resulting from operations to net cash used in operating activities: | ||||
| Purchases of investments, net | (74,531,763 | ) | ||
| Net change in unrealized appreciation on investments | (524,449 | ) | ||
| Amortization of deferred offering expenses | 196,041 | |||
| Increase in payable to related parties | 772,290 | |||
| Increase in payable for investments purchased | 181,126 | |||
| Increase in accrued directors’ fees | 22,903 | |||
| Increase in accounts payable and other accrued expenses | 115,345 | |||
| Increase in deferred offering expenses | (681,206 | ) | ||
| Net cash used in operating activities | (73,622,423 | ) | ||
| Financing Activities: | ||||
| Proceeds from issuance of common shares | 79,056,500 | |||
| Net cash provided by financing activities | 79,056,500 | |||
| Net increase in cash | 5,434,077 | |||
| Cash and cash equivalents, beginning of period | 199,683 | |||
| Cash and cash equivalents, end of period | $ | 5,633,760 | ||
| Supplemental disclosure of cash flow information and non-cash financing activities: | ||||
| Amounts incurred but not paid (including amounts due to related parties): | ||||
| Distributions payable | $ | 302,841 | ||
| Offering costs | $ | 681,523 | ||
| Non-cash contribution from Sub-Manager | $ | 2,400,000 | ||
| Non-cash purchase of investments | $ | (2,400,000 | ) | |
As described further in Note 3. “Investments” and Note 5. “Related Party Transactions” to the condensed consolidated financial statements, the approximate $77 million purchase price to acquire the investment in the portfolio companies was partially funded using the $2.4 million non-cash contribution from the Sub-Manager.
See notes to condensed consolidated financial statements.
- F-5 -
CNL Strategic Capital, LLC
Condensed Consolidated Schedule of Investments
(unaudited)
Company(a) | Industry | Interest Rate | Base Floor | Maturity Date | No. Shares/ Principal Amount | Cost | Fair Value | ||||||||||||||
| Senior Secured Loan – First Lien–19.1% | |||||||||||||||||||||
| Polyform Products, Co. | Modeling Clay | 16.0 | % | N/A | 8/7/2023 | $ | 15,700,000 | $ | 15,700,000 | $ | 15,700,000 | ||||||||||
| Senior Secured Loan – Second Lien–18.3% | |||||||||||||||||||||
| Lawn Doctor | Commercial and Professional Services | 16.0 | % | N/A | 8/7/2023 | 15,000,000 | 15,000,000 | 15,000,000 | |||||||||||||
| Total Senior Secured Loans | $ | 30,700,000 | $ | 30,700,000 | |||||||||||||||||
| Equity–56.9% | |||||||||||||||||||||
| Polyform Products, Co. | Modeling Clay | 10,820 | $ | 15,756,212 | $ | 15,756,212 | |||||||||||||||
| Lawn Doctor | Commercial and Professional Services | 7,746 | 30,475,551 | 31,000,000 | |||||||||||||||||
| Total Equity | $ | 46,231,763 | $ | 46,756,212 | |||||||||||||||||
| TOTAL INVESTMENTS–94.3% | $ | 76,931,763 | $ | 77,456,212 | |||||||||||||||||
| OTHER ASSETS IN EXCESS OF LIABILITIES–5.7% | 4,724,737 | ||||||||||||||||||||
| NET ASSETS–100.0% | $ | 82,180,949 | |||||||||||||||||||
| (a) | Security may be an obligation of one or more entities affiliated with the named company. |
See notes to condensed consolidated financial statements.
- F-6 -
CNL Strategic Capital, LLC
Notes to Condensed Consolidated Financial Statements (Unaudited)
1. Principal Business and Organization
CNL Strategic Capital, LLC (the “Company”) is a limited liability company that primarily seeks to acquire and grow durable, middle-market businesses. The Company is externally managed by CNL Strategic Capital Management, LLC (the “Manager”), an entity that is registered as an investment adviser under the Investment Advisers Act of 1940, as amended. The Manager is controlled by CNL Financial Group, LLC, a private investment management firm specializing in alternative investment products. The Company has engaged the Manager under a management agreement (the “Management Agreement”) pursuant to which the Manager is responsible for the overall management of the Company’s activities. The Manager has engaged Levine Leichtman Strategic Capital, LLC (the “Sub-Manager”), a registered investment advisor, under a sub-management agreement (the “Sub-Management Agreement”) pursuant to which the Sub-Manager is responsible for the day-to-day management of the Company’s assets. The Sub-Manager is an affiliate of Levine Leichtman Capital Partners, Inc.
The Company targets, for acquisition, businesses that are highly cash flow generative with annual revenues of primarily between $25 million and $500 million. The Company’s business strategy is to acquire controlling equity stakes in combination with loan positions in middle-market businesses. The Company’s business strategy seeks to provide long-term capital appreciation and current income, while protecting invested capital. In addition, and to a lesser extent, the Company intends to acquire other debt and minority equity positions, which may include acquiring debt in the secondary market as well as minority equity stakes and loan positions via co-investments with other funds managed by affiliates of the Sub-Manager. The Company expects that these positions will comprise a minority of its total assets.
The Company was formed as a Delaware limited liability company on August 9, 2016 and intends to operate its business in a manner that will permit it to avoid registration under the Investment Company Act of 1940, as amended (the “Investment Company Act”). The Company did not commence operations until February 7, 2018, as described below.
The Company offered through a private placement (the “Private Placement”) up to $85 million of Class FA limited liability company interests (the “Class FA” shares, or the “founder shares”) and up to $115 million of Class A limited liability company interests (the “Class A” shares) (one of the classes of shares that constitute non-founder shares). On February 7, 2018, the Company met the minimum offering requirement of $80 million in Class FA shares under the Private Placement, at which point the Company commenced operations, and it issued approximately 3.3 million Class FA shares at $25.00 per Class FA share resulting in gross proceeds of approximately $81.7 million. No Class A shares were sold under the Private Placement.
In October 2016, the Company confidentially submitted a registration statement on Form S-1 (the “Registration Statement”) with the Securities and Exchange Commission (the “SEC”) in connection with the proposed offering of shares of its limited liability company interests (the “Public Offering” and together with the Private Placement, the “Offerings”). The Registration Statement for the Public Offering was declared effective by the SEC on March 7, 2018. Through its Public Offering, the Company is offering, in any combination, four classes of shares: Class A shares, Class T shares, Class D shares and Class I shares (collectively, the “non-founder shares” and together with the Founder Shares, the “Shares”). See Note 7. “Capital Transactions” for additional information related to the Offerings.
2. Significant Accounting Policies
Basis of Presentation
The Company’s financial statements are prepared in accordance with principles generally accepted in the United States (“GAAP”) as contained in the Financial Accounting Standards Board Accounting Standards Codification (the “Codification” or “ASC”), which requires the use of estimates, assumptions and the exercise of subjective judgment as to future uncertainties.
- F-7 -
Although the Company is organized and intends to conduct its business in a manner so that it is not required to register as an investment company under the Investment Company Act, its financial statements are prepared using the specialized accounting principles of ASC Topic 946 to utilize investment company accounting. The Company obtains funds through the issuance of equity interests to multiple unrelated investors, and provides such investors with investment management services. Further, the Company’s business strategy is to acquire interests in middle-market businesses to provide current income and long term capital appreciation, while protecting invested capital. Overall, the Company believes that the use of investment company accounting on a fair value basis is consistent with the management of its assets on a fair value basis, and makes the Company’s financial statements more useful to investors and other financial statement users in facilitating the evaluation of an investment in the Company as compared to other investment products in the marketplace.
Principles of Consolidation
Under ASC Topic 946, “Financial Services—Investment Companies” (“ASC Topic 946”) the Company is precluded from consolidating any entity other than another investment company or an operating company which provides substantially all of its services to benefit the Company. In accordance therewith, the Company has consolidated the results of its wholly owned subsidiaries in its condensed consolidated financial statements. All intercompany account balances and transactions have been eliminated in consolidation.
Cash and Cash Equivalents
Cash consists of demand deposits at commercial banks with original maturities of three months or less from the date of purchase.
Use of Estimates
Management makes estimates and assumptions related to the reporting of assets and liabilities and the disclosure of contingent assets and liabilities to prepare the financial statement in conformity with generally accepted accounting principles. Actual results could differ from those estimates.
Valuation of Investments
ASC Topic 820 clarifies that the fair value is the price in an orderly transaction between market participants to sell an asset or transfer a liability in the market in which the reporting entity would transact for the asset or liability, that is, the principal or most advantageous market for the asset or liability. The transaction to sell the asset or transfer the liability is a hypothetical transaction at the measurement date, considered from the perspective of a market participant that holds the asset or owes the liability. ASC Topic 820 provides a consistent definition of fair value which focuses on exit price and prioritizes, within a measurement of fair value, the use of market-based inputs over entity-specific inputs.
In addition, ASC Topic 820 provides a framework for measuring fair value and establishes a three-level hierarchy for fair value measurements based upon the transparency of inputs to the valuation of an asset or liability as of the measurement date. The three levels of valuation hierarchy established by ASC Topic 820 are defined as follows:
Level 1 – Quoted prices (unadjusted) for identical assets or liabilities in active markets. An active market is defined as a market in which transactions for the asset or liability occur with sufficient pricing information on an ongoing basis. Publicly listed equity and debt securities and listed derivatives that are traded on major securities exchanges and publicly traded equity options are generally valued using Level 1 inputs. If a price for a Level 1 asset cannot be determined based upon this established process, it shall then be valued as a Level 2 asset.
Level 2 – Inputs other than quoted prices included within Level 1 that are observable for the asset or liability, either directly or indirectly. Level 2 inputs include the following: (i) quoted prices for similar assets in active markets; (ii) quoted prices for identical or similar assets in markets that are not active; (iii) inputs that are derived principally from or corroborated by observable market data by correlation or other means; and (iv) inputs other than quoted prices that are observable for the assets. Fixed income and derivative assets, where there is an observable secondary trading market and through which pricing inputs are available through pricing services or broker quotes, are generally valued using Level 2 inputs. If a price for a Level 2 asset cannot be determined based upon this established process, it shall then be valued as a Level 3 asset.
- F-8 -
Level 3 – Unobservable inputs for the asset or liability being valued. Unobservable inputs will be used to measure fair value to the extent that observable inputs are not available and such inputs will be based on the best information available in the circumstances, which under certain circumstances might include the Manager’s or the Sub-Manager’s own data. Level 3 inputs may include, but are not limited to, capitalization and discount rates and earnings before interest, taxes, depreciation and amortization (“EBITDA”) multiples. The information may also include pricing information or broker quotes which include a disclaimer that the broker would not be held to such a price in an actual transaction. Certain assets may be valued based upon estimated value of underlying collateral and include adjustments deemed necessary for estimates of costs to obtain control and liquidate available collateral. The non-binding nature of consensus pricing and/or quotes accompanied by disclaimer would result in classification as Level 3 information, assuming no additional corroborating evidence. Debt and equity investments in private companies or assets valued using the market or income approach are generally valued using Level 3 inputs.
In all cases, the level in the fair value hierarchy within which the fair value measurement in its entirety falls will be determined based on the lowest level of input that is significant to the fair value measurement. The Company’s assessment of the significance of a particular input to the fair value measurement in its entirety requires judgment and considers factors specific to each asset.
The Company’s board of directors is responsible for determining in good faith the fair value of the Company’s investments in accordance with the valuation policy and procedures approved by the board of directors, based on, among other things, the input of the Manager, the Sub-Manager, the Company’s management, audit committee, and independent third-party valuation firm. The determination of the fair value of the Company’s assets requires judgment, especially with respect to assets for which market prices are not available. For most of the Company’s assets, market prices will not be available. Due to the inherent uncertainty of determining the fair value of assets that do not have a readily available market value, the fair value of the assets may differ significantly from the values that would have been used had a readily available market value existed for such assets, and the differences could be material. Because the calculation of the Company’s net asset value is based, in part, on the fair value of its assets, the Company’s calculation of net asset value is subjective and could be adversely affected if the determinations regarding the fair value of its assets were materially higher than the values that the Company ultimately realizes upon the disposal of such assets. Furthermore, through the valuation process, the Company’s board of directors may determine that the fair value of the Company’s assets differs materially from the values that were provided by the independent valuation firm.
The Company may also look to private merger and acquisition statistics, public trading multiples adjusted for illiquidity and other factors, valuations implied by third-party investments in the businesses or industry practices in determining fair value. The Company may also consider the size and scope of a business and its specific strengths and weaknesses, as well as any other factors it deems relevant in assessing the value.
Net Realized Gains or Losses and Net Change in Unrealized Appreciation or Depreciation on Investments
The Company will measure realized gains or losses as the difference between the net proceeds from the sale, repayment, or disposal of an asset and the adjusted cost basis of the asset, without regard to unrealized appreciation or depreciation previously recognized. Net change in unrealized appreciation or depreciation will reflect the change in asset values during the reporting period, including any reversal of previously recorded unrealized appreciation or depreciation, when gains or losses are realized.
Income Recognition
Interest Income– Interest income is recorded on an accrual basis to the extent that the Company expects to collect such amounts. The Company does not accrue as a receivable interest on loans and debt securities for accounting purposes if it has reason to doubt its ability to collect such interest.
The Company places loans on non-accrual status when principal and interest are past due 90 days or more or when there is a reasonable doubt that the Company will collect principal or interest. Accrued interest is generally reversed when a loan is placed on non-accrual. Interest payments received on non-accrual loans may be recognized as income or applied to principal depending upon management’s judgment. Non-accrual loans are generally restored to accrual status when past due and principal and interest is paid and, in management’s judgment, is likely to remain current.
- F-9 -
Dividend Income — Dividend income is recorded (1) on the ex-dividend date for publicly issued securities and (2) on the record date for privately issued securities.
Paid in Capital – The Company records the proceeds from the sale of its common shares on a net basis to (i) capital stock and (ii) paid in capital in excess of par value, excluding upfront selling commissions and dealer manager fees.
Organization and Offering Expenses
Organization expenses are expensed on the Company’s statement of operations as incurred. Offering expenses, which consist of amounts incurred for items such as legal, accounting, regulatory and printing work incurred related to the Offerings, are capitalized on the Company’s statements of assets and liabilities as deferred offering expenses and expensed to the Company’s statements of operations over the lesser of the offering period or 12 months; however, the end of the deferral period will not exceed 12 months from the date the offering expense is incurred by the Manager and the Sub-Manager.
Earnings per Share
Earnings per share is calculated for each share class of common shares based upon the weighted average number of common shares outstanding during the reporting period.
Distributions
In March 2018, the Company’s board of directors began to declare cash distributions to shareholders based on weekly record dates and such distributions are expected to be paid on a monthly basis. Distributions are made on all classes of the Company’s shares at the same time.
U.S. Federal Income Taxes
The Company expects that it will operate so that it will qualify to be treated for U.S. federal income tax purposes as a partnership, and not as an association or a publicly traded partnership taxable as a corporation. Generally, the Company will not be taxable as a corporation if 90% or more of its gross income for each taxable year consists of “qualifying income” (generally, interest (other than interest generated from a financial business), dividends, real property rents, gain from the sale of assets that produce qualifying income and certain other items) and the Company is not required to register under the Investment Company Act (the “qualifying income exception”).
3. Investments
In October 2017, the Company entered into a merger agreement with LD Merger Sub, Inc., a wholly owned subsidiary of the Company, and LD Parent, Inc., the parent company of Lawn Doctor, Inc. (“Lawn Doctor”). The merger agreement was amended on February 6, 2018. On February 7, 2018, pursuant to the terms of the merger agreement and an exchange agreement between the Company and the Leichtman-Levine Living Trust, an affiliate of the Sub-Manager (the “Exchange Agreement”), the Company acquired an approximately 63.9% equity interest in Lawn Doctor from an affiliate of the Sub-Manager, through an investment consisting of common equity and a debt investment in the form of a secured second lien loan to Lawn Doctor. After the closing of the merger, the consummation of the equity contribution pursuant to the Exchange Agreement and subsequent purchases of common equity in Lawn Doctor by certain members of Lawn Doctor’s senior management team, the Company owns approximately 62.9% of the outstanding equity in Lawn Doctor. As of March 31, 2018, the cost basis of the Company’s investments in Lawn Doctor was approximately $30.5 million of common equity and $15.0 million of a debt investment. The purchase price is subject to adjustment based on, among other factors, Lawn Doctor’s working capital and indebtedness at the closing with a true-up adjustment.
- F-10 -
In October 2017, the Company entered into a merger agreement with PFHI Merger Sub, Inc., a wholly owned subsidiary of the Company, and Polyform Holdings, Inc. (“Polyform”). The merger agreement was amended on February 6, 2018. On February 7, 2018, pursuant to the terms of the merger agreement, the Company acquired an approximately 87.1% equity interest in Polyform from an affiliate of the Sub-Manager, through an investment consisting of common equity and a debt investment in the form of a first lien secured term loan to Polyform. As of March 31, 2018, the cost basis of the Company’s investments in Polyform was approximately $15.8 million of common equity and $15.7 million of a debt investment. The purchase price is subject to adjustment based on, among other factors, Polyform’s working capital and indebtedness at the closing with a true-up adjustment.
The debt investments in the form of a secured second lien loan to Lawn Doctor and in the form of a first lien secured term loan to Polyform, as described above, accrue interest at a per annum rate of 16%. Each loan will mature in August 2023. The note purchase agreements contain customary covenants and events of default.
As of March 31, 2018, the Company’s investment portfolio consisted of four distinct positions, summarized as follows:
| As of March 31, 2018 | ||||||||||||||||
| Asset Category | Cost | Fair Value | Fair Value Percentage of Investment Portfolio | Fair Value Percentage of Net Assets | ||||||||||||
| Senior debt | ||||||||||||||||
| Senior secured debt - first lien | $ | 15,700,000 | $ | 15,700,000 | 20.3 | % | 19.1 | % | ||||||||
| Senior secured debt - second lien | 15,000,000 | 15,000,000 | 19.4 | 18.3 | ||||||||||||
| Total senior debt | $ | 30,700,000 | $ | 30,700,000 | 39.7 | 37.4 | ||||||||||
| Equity | 46,231,763 | 46,756,212 | 60.3 | 56.9 | ||||||||||||
| Total investments | $ | 76,931,763 | $ | 77,456,212 | 100.0 | % | 94.3 | % | ||||||||
As of March 31, 2018, none of the Company’s debt investments were on non-accrual status.
The industry and geographic dispersion of the Company’s investment portfolio as a percentage of total fair value of the Company’s investments as of March 31, 2018 were as follows:
| Industry | As of March 31, 2018 | |||
| Modeling Clay | 40.6 | % | ||
| Commercial and Professional Services | 59.4 | |||
| Total | 100.0 | % | ||
Geographic Dispersion(1) | As of March 31, 2018 | |||
| United States | 100.0 | % | ||
| Total | 100.0 | % | ||
| (1) | The geographic dispersion is determined by the portfolio company’s country of domicile or the jurisdiction of the security’s issuer. |
All portfolio companies held at March 31, 2018 were denominated in U.S. dollars.
- F-11 -
Summarized Operating Data
The following tables present unaudited summarized operating data for Lawn Doctor and Polyform (the “initial businesses”) for the period February 7, 2018 (the date we acquired the initial businesses) through March 31, 2018 and unaudited summarized balance sheet data as of March 31, 2018:
Lawn Doctor
Summarized Operating Data (Unaudited)
Period February 7, 2018(1) through March 31, 2018 | ||||
| Revenues | $ | 3,118,748 | ||
| Expenses | (3,087,288 | ) | ||
| Income before taxes | 31,460 | |||
| Income tax expense | (7,825 | ) | ||
| Net Income | $ | 23,635 | ||
Summarized Balance Sheet Data (Unaudited)
| As of March 31, 2018 | ||||
| Current assets | $ | 7,016,164 | ||
| Non-current assets | $ | 28,927,037 | ||
| Current liabilities | $ | 4,081,423 | ||
| Non-current liabilities | $ | 38,785,943 | ||
| Stockholders’ Equity | $ | (6,924,165 | ) | |
Polyform
Summarized Operating Data (Unaudited)
Period February 7, 2018(1) through March 31, 2018 | ||||
| Revenues | $ | 2,417,593 | ||
| Expenses | (2,897,329 | ) | ||
| Net loss before taxes | (479,736 | ) | ||
| Income tax benefit | 48,000 | |||
| Net loss | $ | (431,736 | ) | |
Summarized Balance Sheet Data (Unaudited)
| As of March 31, 2018 | ||||
| Current assets | $ | 5,771,064 | ||
| Non-current assets | $ | 22,436,533 | ||
| Current liabilities | $ | 1,167,304 | ||
| Non-current liabilities | $ | 20,567,473 | ||
| Stockholders’ Equity | $ | 6,472,820 | ||
| (1) | February 7, 2018 is the date the Company acquired the portfolio companies. |
4. Fair Value of Financial Instruments
The Company’s investments were categorized in the fair value hierarchy described in Note 2. “Significant Accounting Policies”, as follows as of March 31, 2018:
| As of March 31, 2018 | ||||||||||||||||
| Description | Level 1 | Level 2 | Level 3 | Total | ||||||||||||
| Senior debt | $ | — | $ | — | $ | 30,700,000 | $ | 30,700,000 | ||||||||
| Equity | — | — | 46,756,212 | 46,756,212 | ||||||||||||
| Total investments | $ | — | $ | — | $ | 77,456,212 | $ | 77,456,212 | ||||||||
- F-12 -
There were no transfers between Level 1 and Level 2 during the period from February 7, 2018 (commencement of operations) through March 31, 2018. The carrying value of cash is classified as Level 1 with respect to the fair value hierarchy. For the period from February 7, 2018 (commencement of operations) through March 31, 2018, the Company held four distinct investment positions classified as Level 3, representing an aggregate fair value of $77.5 million or 100.0% of the total investment portfolio. The ranges of unobservable inputs used in the fair value measurement of the Company’s Level 3 investments as of March 31, 2018 were as follows:
| As of March 31, 2018 | ||||||||||||||
| Asset Group | Fair Value(1) | Valuation Techniques | Unobservable Inputs | Range (Weighted Average)(2) | Impact to Valuation from an Increase in Input(3) | |||||||||
| Senior Debt | $ | 30,700,000 | Discounted Cash Flow Market Comparables Transaction Method | Discount Rate EBITDA Multiple EBITDA Multiple | 10.5% - 13.5% (11.5%) 7.5x – 12.1x (10.5x) 8.0x – 12.0x (10.7x) | Decrease Increase Increase | ||||||||
| Equity | 46,756,212 | Discounted Cash Flow Market Comparables Transaction Method | Discount Rate EBITDA Multiple EBITDA Multiple | 10.5% - 13.5% (11.5%) 7.5x – 12.1x (10.5x) 8.0x – 12.0x (10.7x) | Decrease Increase Increase | |||||||||
| Total | $ | 77,456,212 | ||||||||||||
| (1) | Certain investments may be valued at cost for a period of time after an acquisition as the best indicator of fair value. |
| (2) | Weighted average amounts are based on the estimated fair values. |
| (3) | This column represents the directional change in the fair value of the Level 3 investments that would result from an increase to the corresponding unobservable input. A decrease to the input would have the opposite effect. Significant changes in these inputs in isolation could result in significantly higher or lower fair value measurements. |
The preceding tables represent the significant unobservable inputs as they relate to the Company’s determination of fair values for its investments categorized within Level 3 as of March 31, 2018. In addition to the techniques and inputs noted in the table above, according to the Company’s valuation policy, the Company may also use other valuation techniques and methodologies when determining the fair value estimates for the Company’s investments. Any significant increases or decreases in the unobservable inputs would result in significant increases or decreases in the fair value of the Company’s investments.
Investments that do not have a readily available market value are valued utilizing a market approach, an income approach (i.e. discounted cash flow approach), a transaction approach, or a combination of such approaches, as appropriate. The market comparables approach uses prices, including third party indicative broker quotes, and other relevant information generated by market transactions involving identical or comparable assets or liabilities (including a business). The transaction approach uses pricing indications derived from recent precedent merger and acquisition transactions involving comparable target companies. The income approach uses valuation techniques to convert future amounts (for example, cash flows or earnings) that are discounted based on a required or expected discount rate to derive a single present value amount. The measurement is based on the value indicated by current market expectations about those future amounts. In following these approaches, the types of factors the Company may take into account to determine the fair value of its investments include, as relevant: available current market data, including an assessment of the credit quality of the security’s issuer, relevant and applicable market trading and transaction comparables, applicable market yields and multiples, illiquidity discounts, security covenants, call protection provisions, information rights, the nature and realizable value of any collateral, the portfolio company’s ability to make payments, its earnings and cash flows, the markets in which the portfolio company does business, comparisons of financial ratios of peer companies that are public, data derived from merger and acquisition activities for comparable companies, and enterprise values, among other factors.
- F-13 -
The following tables provide reconciliations for the period from February 7, 2018 (commencement of operations) through March 31, 2018 of investments for which Level 3 inputs were used in determining fair value:
| Period from February 7, 2018 (commencement of operations) through March 31, 2018 | ||||||||||||
| Senior Debt | Equity | Total | ||||||||||
| Fair value balance as of February 7, 2018 | $ | — | $ | — | $ | — | ||||||
| Additions | 30,700,000 | 46,231,763 | 76,931,763 | |||||||||
| Net change in unrealized appreciation(1) | — | 524,449 | 524,449 | |||||||||
| Fair value balance as of March 31, 2018 | $ | 30,700,000 | $ | 46,756,212 | $ | 77,456,212 | ||||||
| Change in net unrealized appreciation in investments held as of March 31, 2018(1) | $ | — | $ | 524,449 | $ | 524,449 | ||||||
| (1) | Included in net change in unrealized appreciation in the consolidated statement of operations. |
No securities were transferred into or out of the Level 3 hierarchy during the period from February 7, 2018 (commencement of operations) through March 31, 2018. All realized and unrealized gains and losses are included in earnings and are reported as separate line items within the Company’s statement of operations.
5. Related Party Transactions
As of December 31, 2017, the Company had issued 4,000 shares of the Company’s Class FA shares, to each of the Manager and Sub-Manager, for an aggregate purchase price of $0.2 million (total of 8,000 Class FA shares). No selling commissions or dealer manager fees were paid in connection with the issuances.
On February 7, 2018, the Company commenced operations when it met the minimum offering requirement of $80 million in Class FA shares under its Private Placement. The $81.7 million in gross proceeds included a cash capital contribution of $2.4 million from the Manager in exchange for 96,000 Class FA shares and a cash capital contribution of $9.5 million from CNL Strategic Capital Investment, LLC, which is indirectly controlled by James M. Seneff, Jr., the chairman of the Company, in exchange for 380,000 Class FA shares. The $81.7 million also included 96,000 Class FA shares received in exchange for $2.4 million of non-cash consideration in the form of equity interests in Lawn Doctor received from an affiliate of the Sub-Manager pursuant to the Exchange Agreement. The $81.7 million in gross proceeds also included a cash capital contribution of approximately $0.4 million in exchange for 15,000 Class FA shares, from other individuals affiliated with the Manager.
The Manager and Sub-Manager, along with certain affiliates of the Manager or Sub-Manager, will receive fees and compensation in connection with the Private Placement and Public Offering as well as the acquisition, management and sale of the assets of the Company, as follows:
Placement Agent/Dealer Manager
Commissions — Under the Private Placement, there was no selling commission for the sale of Class FA shares. Under the Public Offering, the Company will pay CNL Securities Corp. (the “Managing Dealer” in connection with the Public Offering and the “Placement Agent” in connection with the Private Placement) a selling commission up to 6.00% of the sale price for each Class A share and 3.00% of the sale price for each Class T share sold in the Public Offering (excluding sales pursuant to the Company’s distribution reinvestment plan). The Managing Dealer may reallow all or a portion of the selling commissions to participating broker-dealers.
Placement Agent/Dealer Manager Fee— Under the Private Placement, there was no placement agent fee for the sale of Class FA shares. Under the Public Offering, the Company will pay the Managing Dealer a dealer manager fee of 2.50% of the price of each Class A share and 1.75% of the price of each Class T share sold in the Public Offering (excluding sales pursuant to the Company’s distribution reinvestment plan). The Managing Dealer may reallow all or a portion of such dealer manager fees to participating broker-dealers.
Annual Distribution and Shareholder Servicing Fee— Under the Public Offering, beginning no later than the end of June 2018, the Company will also pay the Managing Dealer an annual distribution and shareholder servicing fee, subject to certain limits, with respect to its Class T and Class D shares (excluding Class T Shares and Class D shares sold through the distribution reinvestment plan and those received as share distributions) in an annual amount equal to 1.00% and 0.50%, respectively, of its current net asset value per share, as disclosed in its periodic or current reports, payable on a monthly basis. The annual distribution and shareholder servicing fee will accrue daily and be paid monthly in arrears. The Managing Dealer may reallow all or a portion of the annual distribution and shareholder servicing fee to the broker-dealer who sold the Class T or Class D shares or, if applicable, to a servicing broker-dealer of the Class T or Class D shares or a fund supermarket platform featuring Class D shares, so long as the broker-dealer or financial intermediary has entered into a contractual agreement with the Managing Dealer that provides for such reallowance. The annual distribution and shareholder servicing fees is an ongoing fee that will be allocated among all Class T and Class D shares, respectively, and will not be paid at the time of purchase.
- F-14 -
Manager and/or Sub-Manager
Organization and Offering Costs — Under each of the Private Placement and Public Offering, the Company will reimburse the Manager and its Sub-Manager, along with their respective affiliates, for the organization and offering costs (other than selling commissions and placement agent fees) they have incurred on the Company’s behalf only to the extent that such expenses do not exceed (A) 1.0% of the cumulative gross proceeds from the Private Placement and (B) 1.5% of the cumulative gross proceeds from the Public Offering. As of March 31, 2018, the Manager and Sub-Manager, along with their respective affiliates, have incurred organization and offering costs of approximately $3.6 million. As of March 31, 2018, the Company had incurred an obligation to reimburse the Manager and Sub-Manager for approximately $0.7 million in organization and offering costs based on actual amounts raised of Class FA shares under its Private Placement, all of which was outstanding as of March 31, 2018.
Base Management Fee to Manager and Sub-Manager— The Company will pay each of the Manager and the Sub-Manager 50% of the total base management fee for their services under the Management Agreement and the Sub-Management Agreement, subject to any reduction or deferral of any such fees pursuant to the terms of the Expense Support and Conditional Reimbursement Agreement described below. The base management fee will be calculated for each share class at an annual rate of (i) for the non-founder shares of a particular class, 2% of the product of (x) the Company’s average gross assets and (y) the ratio of non-founder share Average Adjusted Capital (as defined below), for a particular class to total Average Adjusted Capital and (ii) for the founder shares, 1% of the product of (x) the Company’s average gross assets and (y) the ratio of outstanding founder share Average Adjusted Capital to total Average Adjusted Capital, in each case excluding cash, and will be payable monthly in arrears. The management fee for a certain month is calculated based on the average value of the Company’s gross assets at the end of that month and the immediately preceding calendar month. The determination of gross assets will reflect changes in the fair market value of the Company’s assets, which will not necessarily equal their notional value, reflecting both realized and unrealized capital appreciation. Average Adjusted Capital of an applicable class is computed on the daily Adjusted Capital for such class for the actual number of days in such applicable month. The base management fee may be reduced or deferred by the Manager and the Sub-Manager under the Management Agreement and the Expense Support and Conditional Reimbursement Agreement described below. For purposes of this calculation, “Average Adjusted Capital” for an applicable class is computed on the daily Adjusted Capital for such class for the actual number of days in such applicable quarter. The annual preference return of 7% and the relevant breakpoints of 8.75% and 7.777%, respectively, are also adjusted for the actual number of days in each calendar year, measured as of each calendar quarter end. “Adjusted Capital” is defined as cumulative proceeds generated from sales of our shares of a particular share class (including proceeds from the sale of shares pursuant to the distribution reinvestment plan, if any), net of sales load (upfront selling commissions and dealer manager fees), if any, reduced for the full amounts paid for share repurchases pursuant to any share repurchase program, if any, for such class.
Total Return Incentive Fee on Income to the Manager and Sub-Manager — The Company will also pay each of the Manager and the Sub-Manager 50% of the total return incentive fee for their services under the Management Agreement and the Sub-Management Agreement. The total return incentive fee will be based on the Total Return to Shareholders (as defined below) for each share class in any calendar year, payable annually in arrears. The Company will accrue (but not pay) the total return incentive fee on a quarterly basis, to the extent that it is earned, and will perform a final reconciliation at completion of each calendar year. The total return incentive fee may be reduced or deferred by the Manager and the Sub-Manager under the Management Agreement and the Expense Support and Conditional Reimbursement Agreement described below. For purposes of this calculation, “Total Return to Shareholders” for any calendar quarter is calculated for each share class as the change in the net asset value for such share class plus total distributions for such share class calculated based on the Average Adjusted Capital for such class as of such calendar quarter end. The terms “Total Return to Non-founder Shareholders” and “Total Return to Founder Shareholders” means the Total Return to Shareholders specifically attributable to each particular share class of non-founder shares or founder shares, as applicable.
- F-15 -
The total return incentive fee for each share class will be calculated as follows:
| ● | No total return incentive fee will be payable in any calendar year in which the annual Total Return to Shareholders of a particular share class does not exceed 7% (the “Annual Preferred Return”). |
| ● | As it relates to the non-founder shares, all of the Total Return to Shareholders with respect to each particular share class of non-founder shares, if any, that exceeds the annual preferred return, but is less than or equal to 8.75%, or the “non-founder breakpoint,” in any calendar year, will be payable to the Manager (“Non-founder Catch Up”). The Non-Founder Catch Up is intended to provide an incentive fee of 20% of the Total Return to Non-founder Shareholders of a particular share class once the Total Return to Non-founder Shareholders of a particular class exceeds 8.75% in any calendar year. |
| ● | As it relates to founder shares, all of the Total Return to Founder Shareholders, if any, that exceeds the annual preferred return, but is less than or equal to 7.777%, or the “founder breakpoint,” in any calendar year, will be payable to the Manager (“Founder Catch Up”). The Founder Catch Up is intended to provide an incentive fee of 10% of the Total Return to Founder Shareholders once the Total Return to Founder Shareholders exceeds 7.777% in any calendar year. For any quarter in which the Total Return to Shareholders of a particular share class exceeds the relevant breakpoint, the total return incentive fee of a particular share class shall equal, for non-founder shares, 20% of the Total Return to Non-founder Shareholders of a particular class, and for founder shares, 10% of the Total Return to Founder Shareholders, in each case because the annual preferred and relevant catch ups will have been achieved. |
| ● | For purposes of calculating the Total Return to Shareholders, the change in the Company’s net asset value is subject to a High Water Mark. The “High Water Mark” is equal to the highest year-end net asset value, for each share class of the Company since inception, adjusted for any special distributions resulting from the sale of the Company’s assets, provided such adjustment is approved by the Company’s board of directors. If, as of each calendar year end, the Company’s net asset value for the applicable share class is (A) above the High Water Mark, then, for such calendar year, the Total Return to Shareholders calculation will include the increase in the Company’s net asset value for such share class in excess of the High Water Mark, and (B) if the Company’s net asset value for the applicable share class is below the High Water Mark, for such calendar year, (i) any increase in the Company’s per share net asset value will be disregarded in the calculation of Total Return to Shareholders for such share class while (ii) any decrease in the Company’s per share net asset value will be included the calculation of Total Return to Shareholders for such share class. For the year ending December 31, 2018, the High Water Mark will be $24.75. |
The Company did not incur any incentive fees during the period from February 7, 2018 (commencement of operations) through March 31, 2018.
Reimbursement to Manager and Sub-Manager for Operating Expenses — The Company will reimburse the Manager and the Sub-Manager and their respective affiliates for certain operating costs and expenses of third parties incurred in connection with their provision of services to the Company, including fees, costs, expenses, liabilities and obligations relating to the Company’s activities, acquisitions, dispositions, financings and business, subject to the terms of the Company’s limited liability company agreement, the Management Agreement, the Sub-Management Agreement and the Expense Support and Conditional Reimbursement Agreement (as defined below). The Company will not reimburse the Manager and Sub-Manager for administrative services performed by the Manager or Sub-Manager for the benefit of the Company.
Expense Support and Conditional Reimbursement Agreement— The Company entered into an expense support and conditional reimbursement agreement with the Manager and the Sub-Manager (the “Expense Support and Conditional Reimbursement Agreement”), which became effective on February 7, 2018, pursuant to which each of the Manager and the Sub-Manager agrees to reduce the payment of base management fees, total return incentive fees and the reimbursements of reimbursable expenses due to the Manager and the Sub-Manager under the Management Agreement and the Sub-Management Agreement, as applicable, to the extent that the Company’s annual regular cash distributions exceed its annual net income (with certain adjustments). The amount of such expense support is equal to the annual (calendar year) excess, if any, of (a) the distributions (as defined in the Expense Support and Conditional Reimbursement Agreement) declared and paid (net of the Company’s distribution reinvestment plan) to shareholders minus (b) the available operating funds, as defined in the Expense Support and Conditional Reimbursement Agreement (the “Expense Support”). The Expense Support amount will be borne equally by the Manager and the Sub-Manager and will be calculated as of the last business day of the calendar year. Beginning on February 7, 2018 and continuing until the Expense Support and Conditional Reimbursement Agreement is terminated, the Manager and Sub-Manager shall equally conditionally reduce the payment of fees and reimbursements of reimbursable expenses in an amount equal to the conditional waiver amount (as defined in and subject to limitations described in the Expense Support and Conditional Reimbursement Agreement). The term of the Expense Support and Conditional Reimbursement Agreement has the same initial term and renewal terms as the Management Agreement or the Sub-Management Agreement, as applicable, to the Manager or the Sub-Manager.
- F-16 -
If, on the last business day of the calendar year, the annual (calendar year) year-to-date available operating funds exceeds the sum of the annual (calendar year) year-to-date distributions paid per share class (the “Excess Operating Funds”), the Company will use such Excess Operating Funds to pay the Manager and the Sub-Manager all or a portion of the outstanding unreimbursed Expense Support amounts for each share class, as applicable, subject to certain conditions (the “Conditional Reimbursements”) as described further in the Expense Support and Conditional Reimbursement Agreement. The Company’s obligation to make Conditional Reimbursements shall automatically terminate and be of no further effect three years following the date which the Expense Support amount was provided and to which such Conditional Reimbursement relates, as described further in the Expense Support and Conditional Reimbursement Agreement.
Related party fees and expenses incurred during the period February 7, 2018 (commencement of operations) through March 31, 2018 are summarized below:
| Related Party | Source Agreement & Description | Period from February 7, 2018 (commencement of operations) through March 31, 2018 | ||||
| Manager and Sub-Manager | Management Agreement and Sub-Management Agreement: | |||||
| Organization and offering reimbursement(1) | $ | 707,046 | ||||
| Base management fees(1) | 88,562 | |||||
| Manager and Sub-Manager | Expense Support and Conditional Reimbursement Agreement: | |||||
| Expense Support Provided | (43,212 | ) | ||||
| Manager | Administrative Services Agreement: | |||||
| Operating, administrative and compliance services(1) | 19,894 | |||||
| (1) | Expenses subject to Expense Support. |
The following table presents amounts due from (to) related parties as of March 31, 2018:
| Due from related parties: | ||||
| Expense Support | $ | 43,212 | ||
| Total due from related parties | 43,212 | |||
| Due to related parties: | ||||
| Organization and offering expenses | 707,046 | |||
| Base management fees | 88,562 | |||
| Operating, administrative and compliance expense reimbursement | 19,894 | |||
| Total due to related parties | 815,502 | |||
| Net due to related parties | $ | (772,290 | ) | |
There were no amounts due to related parties as of December 31, 2017.
Other Related Party Transactions
Prior to the Company’s acquisition of Lawn Doctor and Polyform as described in Note 3. “Investments,” Lawn Doctor and Polyform were majority owned by an affiliate of the Sub-Manager.
- F-17 -
6. Distributions
The total and the sources of declared distributions on a GAAP basis for the period from February 7, 2018 (commencement of operations) through March 31, 2018 are presented in the tables below.
| Period from February 7, 2018 (commencement of operations) through March 31, 2018 | ||||||||||||
Class FA | ||||||||||||
Per Share | Amount | Allocation | ||||||||||
| Total Declared Distributions | $ | 0.09 | $ | 302,841 | 100.0 | % | ||||||
| From net investment income | $ | 0.09 | $ | 302,841 | 100.0 | % | ||||||
Net investment income includes Expense Support of $43,212 which supported distributions of $302,841 during the period from February 7, 2018 (commencement of operations) through March 31, 2018.
7. Capital Transactions
As of December 31, 2017, the Company had issued 4,000 shares of the Company’s Class FA shares, to each of the Manager and Sub-Manager, for an aggregate purchase price of $200,000 (total of 8,000 Class FA shares). No selling commissions or dealer manager fees were paid in connection with the issuances.
On February 7, 2018, the Company commenced operations when it met the minimum offering requirement of $80 million in Class FA shares under its Private Placement and issued approximately 3.3 million shares of Class FA shares for aggregate gross proceeds of $81.7 million. The Company did not incur any selling commissions or placement agent fees from the sale of the approximately 3.3 million Class FA shares sold under the terms of the Private Placement. See Note 5. “Related Party Transactions” for additional information on shares issued to the Manager, Sub-Manager and their affiliates.
Private Placement
The Company offered through the Private Placement up to $85 million of Class FA shares and up to $115 million of Class A shares on a best efforts basis, which meant that the Placement Agent, used its best efforts but was not required to sell any specific amount of shares. On February 7, 2018, the Company met the minimum offering requirement of $80 million in Class FA shares under the Private Placement and the Company issued approximately 3.3 million Class FA shares at $25.00 per Class FA share resulting in gross proceeds of approximately $81.7 million. No Class A shares were sold under the Private Placement. There was no selling commission or Placement Agent fee for the sale of Class FA shares. The Class FA shares and Class A shares in the Private Placement were offered for sale only to persons that were “accredited investors,” as that term is defined under the Securities Act of 1933, as amended (the “Securities Act”), and Regulation D promulgated thereunder.
Public Offering
Once the Registration Statement became effective on March 7, 2018, the Company began offering up to $1,000,000,000 of Shares, on a best efforts basis, which means that CNL Securities Corp., as the Managing Dealer of the Public Offering, will use its best efforts but is not required to sell any specific amount of Shares. The Company is offering, in any combination, four classes of Shares in the Public Offering: Class A shares, Class T shares, Class D shares and Class I shares. The initial minimum permitted purchase amount is $5,000 in Shares. The initial per share Public Offering price was $27.32 per Class A share, $26.25 per Class T share, $25.00 per Class D share and $25.00 per Class I share. There are differing selling fees and commissions for each class. The Company will also pay annual distribution and shareholder servicing fees, subject to certain limits, on the Class T and Class D shares sold in the Public Offering (excluding sales pursuant to the Company’s distribution reinvestment plan). See Note 10. “Subsequent Events” for information on changes to the Public Offering price, selling commissions and dealer manager fees per share class.
The Company is also offering, in any combination, up to $100,000,000 of Class A shares, Class T shares, Class D shares and Class I shares to be issued pursuant to its distribution reinvestment plan. The Public Offering has a minimum offering requirement of $2 million in Shares under the Private Placement or the Public Offering. As of February 7, 2018, the Company had met the minimum offering requirement of $80 million in Class FA shares under the Private Placement. See Note 10. “Subsequent Events” for information related to the Public Offering.
- F-18 -
The following table summarizes the total shares issued and proceeds received in connection with the Private Placement for the period ended March 31, 2018.
| Period from February 7, 2018 (commencement of operations) through March 31, 2018 | ||||||||
Class FA | ||||||||
Shares | Amount | |||||||
| Gross proceeds | 3,258,260 | $ | 81,456,500 | |||||
| Up-front selling commissions and dealer manager fees(1) | — | — | ||||||
| Net proceeds to Company | 3,258,260 | $ | 81,456,500 | |||||
| Average net proceeds per share | $25.00 | |||||||
| (1) | The Company did not incur any selling commissions or placement agent fees from the sale of the approximately 3.3 million Class FA shares sold under the terms of the Private Placement. |
8. Commitment & Contingences
See Note 5. “Related Party Transactions” for information on contingent amounts due to the Manager and Sub-Manager for the reimbursement of organization and offering costs under the Public Offering.
9. Financial Highlights
The following is a schedule of financial highlights of the Company attributed to Class FA shares for the period from February 7, 2018 (commencement of operations) through March 31, 2018.
Period ended March 31, 2018(1) | ||||
Class FA Shares(2) | ||||
| OPERATING PERFORMANCE PER SHARE | ||||
| Net Asset Value, Beginning of Period | $ | 25.00 | ||
| Net investment income, before expense support(3) | 0.08 | |||
| Expense support(3) | 0.01 | |||
| Net investment income(3) | 0.09 | |||
| Net realized and unrealized gains(3)(4) | 0.16 | |||
| Net increase resulting from investment operations | 0.25 | |||
| Distributions from net investment income(5) | (0.09 | ) | ||
| Net Asset Value, End of Period | $ | 25.16 | ||
| Net assets, end of period | $ | 82,180,949 | ||
| Average net assets(6) | $ | 81,716,492 | ||
| Shares outstanding, end of period | 3,266,260 | |||
| Weighted average shares outstanding | 3,266,430 | |||
| Total investment return based on net asset value(7) | 1.01 | % | ||
| RATIOS/SUPPLEMENTAL DATA (annualized): | ||||
| Ratios to average net assets:(6)(8) | ||||
| Total operating expenses before expense support | 3.95 | % | ||
| Total operating expenses after expense support | 3.58 | % | ||
| Net investment income | 2.55 | % | ||
| Portfolio turnover rate | — | % | ||
| (1) | Operations commenced on February 7, 2018. |
| (2) | As of March 31, 2018, the Company had not sold any Class A, Class T, Class D or Class I shares. |
| (3) | The per share data was derived by using the weighted average shares outstanding during the period. |
| (4) | The amount shown at this caption is the balancing figure derived from the other figures in the schedule. The amount shown at this caption for a share outstanding throughout the period may not agree with the change in the aggregate gains and losses in portfolio securities for the period because of the timing of sales of the Company’s shares in relation to fluctuating market values for the portfolio. |
| (5) | The per share data for distributions is the actual amount of distributions paid or payable per common share outstanding during the entire period; distributions per share are rounded to the nearest $0.01. |
- F-19 -
| (6) | The computation of average net assets during the period is based on the monthly value of net assets. |
| (7) | Total investment return based on asset value is a measure of the change in total value for shareholders who held the Company’s common shares at the beginning and end of the period, including distributions declared during the period. Total investment return based on net asset value is based on (i) net asset value per share on the first day of the period, (ii) the net asset value per share on the last day of the period, of (A) one share plus (B) any fractional shares issued in connection with the reinvestment of monthly distributions, and (iii) distributions payable relating to one share, if any, on the last day of the period. The total investment return based on net asset value calculation assumes that (i) monthly cash distributions are reinvested in accordance with the Company’s distribution reinvestment plan and (ii) the fractional shares issued pursuant to the distribution reinvestment plan are issued at the then current public offering price, net of sales load, on each monthly distribution payment date. Since there is no public market for the Company’s shares, terminal market value per share is assumed to be equal to net asset value per share on the last day of the period presented. The Company’s performance changes over time and currently may be different than that shown above. Past performance is no guarantee of future results. Investment performance is presented without regard to sales load that may be incurred by shareholders in the purchase of the Company’s shares. |
| (8) | Annualized assuming consistent results over a full fiscal year consisting of 365 days; however, this may not be indicative of actual results over a full fiscal year. |
10. Subsequent Events
The Company’s board of directors declared cash distributions on the outstanding shares of all classes of the Company’s common shares based on weekly record dates for the time period beginning on April 3, 2018 through and including May 29, 2018, as set forth below:
| Distribution Record Date | Distribution Payment Date | Declared Distribution Per Share for Each Share Class | ||||||||||||||||||||
Class FA | Class A | Class T | Class D | Class I | ||||||||||||||||||
| April 3, 2018 | May 10, 2018 | $ | 0.024038 | $ | 0.024038 | $ | 0.019231 | $ | 0.021635 | $ | 0.024038 | |||||||||||
| April 10, 2018 | May 10, 2018 | $ | 0.024038 | $ | 0.024038 | $ | 0.019231 | $ | 0.021635 | $ | 0.024038 | |||||||||||
| April 17, 2018 | May 10, 2018 | $ | 0.024038 | $ | 0.024038 | $ | 0.019231 | $ | 0.021635 | $ | 0.024038 | |||||||||||
| April 24, 2018 | May 10, 2018 | $ | 0.024038 | $ | 0.024038 | $ | 0.019231 | $ | 0.021635 | $ | 0.024038 | |||||||||||
| May 1, 2018 | June 11, 2018 | $ | 0.024038 | $ | 0.024038 | $ | 0.019231 | $ | 0.021635 | $ | 0.024038 | |||||||||||
| May 8, 2018 | June 11, 2018 | $ | 0.024038 | $ | 0.024038 | $ | 0.019231 | $ | 0.021635 | $ | 0.024038 | |||||||||||
| May 15, 2018 | June 11, 2018 | $ | 0.024038 | $ | 0.024038 | $ | 0.019231 | $ | 0.021635 | $ | 0.024038 | |||||||||||
| May 22, 2018 | June 11, 2018 | $ | 0.024038 | $ | 0.024038 | $ | 0.019231 | $ | 0.021635 | $ | 0.024038 | |||||||||||
| May 29, 2018 | June 11, 2018 | $ | 0.024038 | $ | 0.024038 | $ | 0.019231 | $ | 0.021635 | $ | 0.024038 | |||||||||||
In April 2018, the Company’s board of directors also approved new per share public offering prices for each share class in the Public Offering. The new public offering prices became effective on April 27, 2018. The following table provides the new public offering prices and applicable upfront selling commissions and dealer manager fees for each share class available in the Public Offering:
| Class A | Class T | Class D | Class I | ||||||||||||||
| Public Offering Price, Per Share | $ | 27.46 | $ | 26.38 | $ | 25.13 | $ | 25.13 | |||||||||
| Selling Commissions, Per Share | $ | 1.65 | $ | 0.79 | $ | — | $ | — | |||||||||
| Dealer Manager Fees, Per Share | $ | 0.68 | $ | 0.46 | $ | — | $ | — | |||||||||
During the period April 1, 2018 through May 10, 2018, the Company received additional net proceeds of $450,000 from the sale of 17,948 Class I shares from its Public Offering and net proceeds of $7,500 from the issuance of 299 Class A shares through its distribution reinvestment plan.
- F-20 -
Appendix A: Prior Performance Tables
This section supersedes and replaces the disclosure under the section “Appendix A: Prior Performance Tables,” which begins on page A-1 of the Prospectus.
APPENDIX A: PRIOR PERFORMANCE TABLES
The following unaudited prior performance tables disclose certain information relating to the performance, operations and investment for certain private funds sponsored by LLCP and its affiliates. We have presented all prior programs that have business objectives similar to ours and for certain other prior programs that do not have business objectives similar to ours, as required by applicable SEC guidance.
This information should be read together with the summary information included in the “Prior Performance of the Manager, the Sub-Manager and Their Respective Affiliates” section of this prospectus.
The purpose of this prior performance information is to enable investors to evaluate accurately the experience of LLCP and its affiliates in sponsoring programs. The inclusion of the prior performance tables does not imply that we will make investments comparable to those reflected in the prior performance tables or that investors in our shares will experience returns, if any, comparable to returns experienced in the programs referred to in the prior performance tables. By purchasing shares in this offering, you will not acquire any ownership interest in any prior programs to which the prior performance tables relate. Further, the private funds discussed in this section were conducted through privately held entities that were subject neither to the up-front commissions, fees and other expenses associated with this offering nor all of the laws and regulations that will apply to us as a publicly offered company.
The following tables are included herein:
| Table I- | Experience in Raising and Investing Funds |
| TableII- | Compensation to Sponsor |
| Table III - | Operating Results of Prior Private Funds |
| TableIV - | (Omitted) Results of Completed Private Funds has been omitted since none of the prior programs has completed its operations during the five year period ended December 31, 2017. |
| Table V - | Sales of Investments |
- A-1 -
TABLE I
EXPERIENCE IN RAISING AND INVESTING FUNDS
Table I provides a summary of the experience of LLCP as a sponsor in raising and investing funds in programs for which the offerings have closed during the three year period ended December 31, 2017.
As of December 31, 2017 | ||||||||||||
| ($ and € in thousands) | LLCP V | LMM Fund | Europe Fund | |||||||||
| Dollar amount offered | $ | 1,500,000 | $ | 500,000 | € | 100,000 | ||||||
| Dollar amount raised | $ | 1,644,082 | $ | 615,365 | € | 100,000 | ||||||
| Length of offering (in months) | 18 | 7 | 1 | |||||||||
| Months to invest 90% of amount available for investment (measured from beginning of offering)(1) | N/A | N/A | N/A | |||||||||
| (1) | As of December 31, 2017, LMM Fund and Europe Fund were in the investment period and had not reached 90% invested. |
- A-2 -
TABLE II
COMPENSATION TO SPONSOR
Table II summarizes the aggregate payments made to LLCP as a sponsor by certain prior programs for which the offerings have closed during the three year period ended December 31, 2017.
| ($ and € in thousands) | LLCP V | LMM Fund | Europe Fund | |||||||||
| Date offering commenced | Sep 2012 | Mar 2016 | Nov 2014 | |||||||||
| Dollar amount raised | $ | 1,644,082 | $ | 615,365 | € | 100,000 | ||||||
| Aggregate compensation paid or reimbursed to the sponsor or its affiliates(1) | $ | 112,856 | $ | 20,203 | € | 2,097 | ||||||
| (1) | Aggregate compensation includes management and incentive fees. |
- A-3 -
TABLE III
OPERATING RESULTS OF CERTAIN PRIOR PROGRAMS
Table III summarizes the operating results of certain prior programs sponsored by LLCP, the offerings of which have closed during the five year period ended December 31, 2017.
| LLCP V | ||||||||||||||||||||
| ($ in thousands) | Year Ended December 31 | |||||||||||||||||||
| 2013 | 2014 | 2015 | 2016 | 2017 | ||||||||||||||||
| Summary Operating Results | ||||||||||||||||||||
| Investment income | $ | 4,066 | $ | 30,835 | $ | 100,638 | $ | 93,929 | $ | 177,003 | ||||||||||
| Expenses | (2,431 | ) | (975 | ) | (711 | ) | (765 | ) | (695 | ) | ||||||||||
| Income before special allocation items | 1,635 | 29,860 | 99,927 | 93,164 | 176,308 | |||||||||||||||
| Special allocation items: | ||||||||||||||||||||
| Professional fees | — | — | — | — | — | |||||||||||||||
| Administrative expenses | — | — | (117 | ) | (34 | ) | (101 | ) | ||||||||||||
| Management fee expense | (19,581 | ) | (24,812 | ) | (25,925 | ) | (19,170 | ) | (22,653 | ) | ||||||||||
| Net investment income | (17,946 | ) | 5,048 | 73,885 | 73,960 | 153,554 | ||||||||||||||
| Realized loss on portfolio investments and foreign currency | — | — | — | (2,075 | ) | — | ||||||||||||||
| Change in unrealized gain on portfolio investments and foreign currency | — | 55,717 | 28,652 | 31,282 | 131,625 | |||||||||||||||
| Net change in partners’ capital as a result of operations | $ | (17,946 | ) | $ | 60,765 | $ | 102,536 | $ | 103,167 | $ | 285,179 | |||||||||
| Summary Statements of Cash Flows | ||||||||||||||||||||
| Operating Activities: | ||||||||||||||||||||
| Net change in partners’ capital as a result of operations | $ | (17,946 | ) | $ | 60,765 | $ | 102,536 | $ | 103,167 | $ | 285,179 | |||||||||
| Adjustments to reconcile net change in partners’ capital as a result of operations to net cash used in operating activities | (180,500 | ) | (273,367 | ) | (604,001 | ) | (316,130 | ) | (285,452 | ) | ||||||||||
| Change in assets and liabilities | (927 | ) | 58 | 669 | (433 | ) | (32 | ) | ||||||||||||
| Net cash used in operating activities | (199,373 | ) | (212,544 | ) | (500,796 | ) | (213,396 | ) | (305 | ) | ||||||||||
| Financing Activities: | ||||||||||||||||||||
| Net cash provided by financing activities | 200,608 | 211,537 | 501,956 | 212,921 | 11,477 | |||||||||||||||
| Net increase in cash at end of the period | 1,236 | (1,007 | ) | 1,160 | (475 | ) | 11,172 | |||||||||||||
| Cash, at beginning of period | — | 1,236 | 229 | 1,389 | 914 | |||||||||||||||
| Cash, at end of period | $ | 1,236 | $ | 229 | $ | 1,389 | $ | 914 | $ | 12,086 | ||||||||||
| Amount and Source of Cash Distributions | ||||||||||||||||||||
| Refund of Contributed Capital | $ | (104,888 | ) | $ | (14,610 | ) | $ | (57,532 | ) | $ | (19,988 | ) | $ | (7,200 | ) | |||||
| Return of Principal - Recallable | — | (20,000 | ) | (278,950 | ) | (107,080 | ) | (38,100 | ) | |||||||||||
| Return of Excess Org Expenses | (335 | ) | (122 | ) | — | — | — | |||||||||||||
| Cash Distribution - Investment Interest | (1,132 | ) | (15,515 | ) | (34,828 | ) | (39,517 | ) | (43,195 | ) | ||||||||||
| Cash Distribution - Investment Interest-recallable | — | — | — | — | — | |||||||||||||||
| Cash Distribution - Dividend Income | (1,445 | ) | (13,488 | ) | (64,592 | ) | (48,969 | ) | (84,314 | ) | ||||||||||
| Cash Distribution - Dividend Income-recallable | — | — | — | — | — | |||||||||||||||
| Cash Distribution - Partner to Partner Interest | (71 | ) | (191 | ) | — | — | — | |||||||||||||
| Distribution from Blocker Entities | — | (1,449 | ) | (422 | ) | — | (3,362 | ) | ||||||||||||
| $ | (107,871 | ) | $ | (65,375 | ) | $ | (436,324 | ) | $ | (215,554 | ) | $ | (176,171 | ) | ||||||
| Summary Balance Sheet | ||||||||||||||||||||
| Assets | ||||||||||||||||||||
| Cash | $ | 1,236 | $ | 229 | $ | 1,389 | $ | 914 | $ | 12,086 | ||||||||||
| Interest receivable | — | — | — | — | 174 | |||||||||||||||
| Prepaid management fees | 929 | 958 | 994 | 860 | 705 | |||||||||||||||
| Portfolio investments (amortized cost of $180,500, $398,150, $973,500, $1,258,348, $1,412,175) | 180,500 | 453,867 | 1,057,868 | 1,374,156 | 1,659,450 | |||||||||||||||
| Total assets | $ | 182,665 | $ | 455,054 | $ | 1,060,251 | $ | 1,375,930 | $ | 1,672,415 | ||||||||||
| Liabilities and Partners’ Capital | ||||||||||||||||||||
| Line of Credit | $ | — | $ | — | $ | — | $ | 2,600 | $ | — | ||||||||||
| Accounts payable and accrued expenses | 2 | 89 | 149 | 51 | 99 | |||||||||||||||
| Withholding taxes payable | — | — | 644 | 334 | 115 | |||||||||||||||
| Distribution payable | — | — | — | — | — | |||||||||||||||
| Total liabilities | 2 | 89 | 793 | 2,985 | 214 | |||||||||||||||
| Partners’ capital | 182,663 | 454,965 | 1,059,458 | 1,372,945 | 1,672,201 | |||||||||||||||
| Total liabilities and partners’ capital | $ | 182,665 | $ | 455,054 | $ | 1,060,251 | $ | 1,375,930 | $ | 1,672,415 | ||||||||||
- A-4 -
Europe Fund | ||||||||||||
(€ in thousands) | Year Ended December 31 | |||||||||||
2015 | 2016 | 2017 | ||||||||||
| Summary Operating Results | ||||||||||||
| Investment income: | ||||||||||||
| Interest income | € | 564 | € | 727 | € | 806 | ||||||
| Dividend income | 1,727 | 2,480 | 2,666 | |||||||||
| 2,291 | 3,207 | 3,472 | ||||||||||
| Expenses | (383 | ) | (1,000 | ) | (995 | ) | ||||||
| Net investment income | 1,908 | 2,207 | 2,477 | |||||||||
| Change in unrealized gain on portfolio investments, net | — | 5,188 | 3,826 | |||||||||
| Net change in partners’ capital as a result of operations | € | 1,908 | € | 7,395 | € | 6,303 | ||||||
| Summary Statements of Cash Flows | ||||||||||||
| Operating Activities: | ||||||||||||
| Net change in partners’ capital as a result of operations | € | 1,908 | € | 7,395 | € | 6,303 | ||||||
| Adjustments to reconcile net change in partners’ capital as a result of operations to net cash used in operating activities | (24,400 | ) | (2,480 | ) | (21,419 | ) | ||||||
| Change in assets and liabilities | (1,725 | ) | (5,188 | ) | (62 | ) | ||||||
| Net cash used in operating activities | (24,217 | ) | (273 | ) | (15,178 | ) | ||||||
| Financing Activities: | ||||||||||||
| Partners’ capital contributions | 25,000 | — | 20,500 | |||||||||
| Partners’ capital distributions | — | — | (5,573 | ) | ||||||||
| Net cash provided by financing activities | 25,000 | — | 14,926 | |||||||||
| Net increase in cash at end of the period | 783 | (273 | ) | (252 | ) | |||||||
| Cash, at beginning of period | — | 783 | 510 | |||||||||
| Cash, at end of period | € | 783 | € | 510 | € | 258 | ||||||
| Summary Balance Sheet | ||||||||||||
| Assets | ||||||||||||
| Cash | € | 783 | € | 510 | € | 258 | ||||||
| Dividend receivable | 1,727 | — | — | |||||||||
| Interest receivable | — | — | 62 | |||||||||
| Portfolio investments (amortized cost of €24,400, €24,400, €46,200) | 24,400 | 33,795 | 55,214 | |||||||||
| Total assets | € | 26,910 | € | 34,305 | € | 55,534 | ||||||
| Liabilities and Partners’ Capital | ||||||||||||
| Accounts payable | € | 2 | € | 2 | € | 2 | ||||||
| Investment purchase payable | — | — | — | |||||||||
| Partners’ capital | 26,908 | 34,303 | 55,532 | |||||||||
| Total liabilities and partners’ capital | € | 26,910 | € | 34,305 | € | 55,534 | ||||||
| Amount and Source of Cash Distributions | ||||||||||||
| Return of Principal - Recallable | — | — | (5,573 | ) | ||||||||
- A-5 -
LMM Fund(1) | ||||||||
| ($ in thousands) | Year Ended December 31 | |||||||
| 2016 | 2017 | |||||||
| Summary Operating Results | ||||||||
| Investment income: | ||||||||
| Interest income | $ | 896 | $ | 9,034 | ||||
| 896 | $ | 9,034 | ||||||
| Expenses: | ||||||||
| Management fee | $ | (7,703 | ) | $ | (12,018 | ) | ||
| Organization expenses | (262 | ) | 0 | |||||
| Professional fees | (8 | ) | (43 | ) | ||||
| Administrative expenses | (2 | ) | (29 | ) | ||||
| Net change in partners’ capital as a result of operations | $ | (7,079 | ) | $ | (3,056 | ) | ||
| Change in unrealized gain on portfolio investments and foreign currency | $ | 0 | $ | 14,131 | ||||
| Net change in partners’ capital as a result of operations | $ | (7,079 | ) | $ | 11,075 | |||
| Summary Statements of Cash Flows | ||||||||
| Operating Activities: | ||||||||
| Net change in partners’ capital as a result of operations | $ | (7,079 | ) | $ | 11,075 | |||
| Adjustments to reconcile net change in partners’ capital as a result of operations to net cash used in operating activities | ||||||||
| Change in unrealized gain on portfolio investments | 0 | $ | (14,131 | ) | ||||
| Purchase of portfolio investments | (70,500 | ) | (125,150 | ) | ||||
| Change in assets and liabilities: | ||||||||
| (Increase) / decrease in prepaid management fees | (486 | ) | 3 | |||||
| Increase in distributions payable | 3 | — | ||||||
| Increase in accounts payable and accrued expenses | 2 | 19 | ||||||
| Net cash used in operating activities | (78,060 | ) | (128,184 | ) | ||||
| Financing Activities: | ||||||||
| Partners’ capital contributions | 78,954 | 137,164 | ||||||
| Partners’ capital distributions | (891 | ) | (8,968 | ) | ||||
| Net cash provided by financing activities | 78,063 | 128,196 | ||||||
| Net increase in cash at end of the period | $ | 3 | $ | 12 | ||||
| Cash, at beginning of period | — | $ | 3 | |||||
| Cash, at end of period | $ | 3 | $ | 15 | ||||
| Amount and Source of Cash Distributions | ||||||||
| Cash Distribution – Investment Interest | $ | (888 | ) | $ | (8,968 | ) | ||
| Summary Balance Sheet | ||||||||
| Assets | ||||||||
| Cash | $ | 3 | $ | 15 | ||||
| Prepaid management fees | 486 | 483 | ||||||
| Portfolio investments (amortized cost of $70,500, $195,650) | 70,500 | 209,781 | ||||||
| Total assets | $ | 70,989 | $ | 210,279 | ||||
| Liabilities and Partners’ Capital | ||||||||
| Distributions payable | $ | 3 | $ | 3 | ||||
| Accounts payable and accrued expenses | 2 | 20 | ||||||
| Partners’ capital | 70,984 | 210,256 | ||||||
| Total liabilities and partners’ capital | $ | 70,989 | $ | 210,279 | ||||
(1) This fund began operations in March 2016.
- A-6 -
TABLE V
SALES OF INVESTMENTS(1)
Table V presents summary information on the results of sales of companies from certain prior programs sponsored by LLCP with business objectives similar to ours during the three year period ended December 31, 2017.
| Year Ended December 31, 2017 | ||||||||||||||||||
| ($ in thousands) | Operating Company | Industry | Date Acquired | Date of Sale | Investment Cost | Realized Value(2) | ||||||||||||
| LLCP III | Werner Ladder | Ladder Manufacturer | Apr 2005 | Jul 2017 | $ | 71,272 | $ | 95,770 | ||||||||||
| LLCP III | Poma | Card Lock Fueling | Jun 2006 | Jan 2015 | $ | 38,788 | $ | 58,724 | ||||||||||
| LLCP III | Wetzel’s Pretzels | Restaurant Franchisor | Jan 2007 | Aug 2016 | $ | 22,700 | $ | 140,299 | ||||||||||
| LLCP III | Dexter Magnetics | Magnetics Solutions | Jul 2007 | Mar 2015 | $ | 53,400 | $ | 135,215 | ||||||||||
| LLCP III | Beef O’ Bradys | Restaurant Franchisor | Jul 2007 | Jun 2017 | $ | 24,550 | $ | 67,528 | ||||||||||
| LLCP IV | Revenew International | Contract Compliance | Oct 2010 | Jul 2016 | $ | 50,250 | $ | 114,142 | ||||||||||
| LLCP IV | Tronair | Aviation Ground Equipment | Mar 2012 | Aug 2016 | $ | 95,664 | $ | 277,217 | ||||||||||
| LLCP IV | Magnolia Bluffs | Casino Complex | Jun 2012 | Aug 2015 | $ | 20,000 | $ | 33,407 | ||||||||||
| LLCP IV | Mander Portman Woodward | Private Education | Aug 2012 | Jan 2016 | $ | 57,818 | $ | 154,748 | ||||||||||
| SB Fund | Senior Helpers | Senior Health Care | Oct 2012 | Oct 2016 | $ | 18,505 | $ | 76,533 | ||||||||||
| SB Fund | Champion Manufacturing | Healthcare Products | Aug 2013 | May 2017 | $ | 22,500 | $ | 53,706 | ||||||||||
| (1) | The private funds shown in this table were conducted through privately held entities that were subject neither to the up-front commissions, fees and other expenses associated with this offering nor all of the laws and regulations that will apply to us. |
| (2) | Realized value represents the combination of cumulative interest and dividend payments as well as net proceeds derived from the ultimate sale transaction. Realized Value may include notes receivables, escrows, holdbacks, residual interests and other reserves that each fund believes will be received at the expiration of any applicable time periods or otherwise. |
- A-7 -