UNITED STATES SECURITIES AND EXCHANGE COMMISSION
Washington, D.C. 20549
Form 20-F
ANNUAL REPORT PURSUANT TO SECTION 13 OR 15(d) OF
THE SECURITIES EXCHANGE ACT OF 1934
For the fiscal year ended December 31, 2010
Commission file number001-04192
Terra Nova Royalty Corporation
(Exact name of Registrant as specified in its charter)
British Columbia, Canada
(Jurisdiction of incorporation or organization)
Suite 1620 – 400 Burrard Street, Vancouver, British Columbia, Canada V6C 3A6
(Address of principal offices)
| | | |
Michael J. Smith
Suite 1620 – 400 Burrard Street
Vancouver, British Columbia, Canada V6C 3A6
Telephone: +1604-683-8286
Facsimile: +1604-683-3205 | | with a copy to:H.S. Sangra,Sangra Moller LLP
1000 Cathedral Place, 925 West Georgia Street
Vancouver, British Columbia,Canada V6C 3L2
Facsimile: +1 604-669-8803 |
(Name, Telephone,E-mail and/or Facsimile number and Address of Company Contact Person)
Securities registered or to be registered pursuant to Section 12(b) of the Act:
| | | |
Title of each class | | Name of each exchange on which registered |
| |
Common Shares | | New York Stock Exchange |
Securities registered or to be registered pursuant to Section 12(g) of the Act: None.
Securities for which there is a reporting obligation pursuant to Section 15(d) of the Act: None.
Indicate the number of outstanding shares of each of the issuer’s classes of capital or common stock as of the close of the period covered by the annual report.
There were 62,561,421 common shares, without par value, issued and outstanding as of December 31, 2010.
Indicate by check mark if the registrant is a well-known seasoned issuer, as defined in Rule 405 of the Securities Act. o YES þ NO
If this report is an annual or transition report, indicate by check mark if the registrant is not required to file reports pursuant to Section 13 or 15(d) of the Securities Exchange Act of 1934. o YES þ NO
Note — Checking the box above will not relieve any registrant required to file reports pursuant to Section 13 or 15(d) of the Securities Exchange Act of 1934 from their obligations under those Sections.
Indicate by check mark whether the registrant (1) has filed all reports required to be filed by Section 13 or 15(d) of the Securities Exchange Act of 1934 during the preceding 12 months (or for such shorter period that the registrant was required to file such reports), and (2) has been subject to such filing requirements for the past 90 days. þ YES o NO
Indicate by check mark whether the registrant is a large accelerated filer, an accelerated filer, or a non-accelerated filer. See definition of “accelerated filer and large accelerated filer” in Rule 12b-2 of the Exchange Act.
| | | | | |
Large accelerated filer o | | Accelerated filer þ | | Non-accelerated filer o |
Indicate by check mark which basis of accounting the registrant has used to prepare the financial statements included in this filing.
| | | | | |
U.S. GAAP o | | International Financial Reporting Standards as issued by the International Accounting Standards Board þ | | Other o |
If “Other” has been checked in response to the previous question, indicate by check mark which financial statement item the registrant has elected to follow. o Item 17 o Item 18
If this is an annual report, indicate by check mark whether the registrant is a shell company (as defined inRule 12b-2 of the Exchange Act) o YES þ NO
TERRA NOVA ROYALTY CORPORATION
DEAR FELLOW SHAREHOLDERS
2010 has been a year of transition for our company. During the year, we completed the distribution of our former subsidiary, KHD Humboldt Wedag International AG (“KID”) to our shareholders and we acquired Mass Financial Corp. (“Mass”). This has allowed us to create a very interesting platform for future growth. Our current goal is to expand our existing businesses and to grow by our traditional acquisition method, with a focus on larger projects.
All references to dollar amounts are in United States dollars unless otherwise stated.
Here is how we look in a simple way:
| | | | | |
|
| Book value | | $ | 548 | million |
| Book value per share | | $ | | 8.76 |
| Cash & securities | | $ | 426 | million |
| Working capital | | $ | 412 | million |
| 2011 Projected revenues with Mass* | | $ | 410 to 425 | million |
| Common share listing | | New York Stock Exchange |
| | |
| * | | note: This projection, without new projects, is being provided for illustrative purposes for our company going forward after the acquisition of Mass and is based on various assumptions made by management, including that the financial results of the businesses remain consistent with the preceding year and is based on current economic and operating conditions. Readers are cautioned that such information is subject to various risks and uncertainties, including those set forth underRisk Factorsin our annual report on Form 20-F, is not indicative of actual results and is not appropriate for other purposes. |
Results
It should be clearly noted that our results of operations for 2010 only include the results of the businesses acquired through our acquisition of Mass from November 16, 2010, or less than 30 working days. Accordingly, they are not comparable to prior periods.
The results also include expenses for the period and negative goodwill in the amount of $41.1 million, which do not have a direct relationship to our business platform going forward.
For the year ended December 31, 2010, our total revenues were $85.4 million (excluding negative goodwill of $41.1 million) with net income to our shareholders of $30.3 million or $0.85 per diluted share.
Revenues for 2009 from our continuing operations were $14.7 million, and net income to our shareholders was $36.7 million, or $1.21 per share.
At December 31, 2010, we had $426 million in cash and securities, our current ratio was 3.77 and our long-term debt-to-shareholders’ equity ratio was 0.09. Our acid test ratio (cash, receivable and short term investments, divided by current liabilities) was 3.07 and book value was $8.76 per share.
CHAIRMAN’S LETTER
1
TERRA NOVA ROYALTY CORPORATION
Our total revenues by operating segment were as follows for each of the years ended December 31, 2010 (which includes less than 30 working days for the consolidation of Mass and excludes the negative goodwill described below) and 2009.
All amounts in thousands
| | | | | | | | | |
| | | 2010 | | | 2009 | |
| Commodities and resources | | $ | 76,478 | | | $ | 13,530 | |
| Merchant banking | | | 4,821 | | | | — | |
| Other | | | 4,131 | | | | 1,188 | |
| | | | | | | |
| Total revenues | | $ | 85,430 | | | $ | 14,718 | |
| | | | | | | |
Negative Goodwill
In 2010, we recognized negative goodwill in the amount of $41.1 million, which arose as the market price of our shares on the acquisition dates, being $7.99 was less than the fair value of the net identifiable assets acquired from Mass. Also, Mass had positive goodwill on its books, in the amount of $5.4 million, which was offset against such negative goodwill.
Pro Forma Consolidated Results for 2010
The following table presents the results of our continuing operations as if the businesses of Mass had been acquired and consolidated as of January 1, 2010. The amounts include the results of Mass, depreciation, amortization and depletion of the acquired fixed assets and intangible assets recognized on acquisition. The amounts do not include any possible synergies from the acquisition. The results of Mass for the period before acquisition have not been adjusted to reflect our accounting policies nor to reflect the fair value adjustments made on acquisition. The information is provided for illustrative purposes only and does not necessarily reflect the actual results that would have occurred, nor is it necessarily indicative of our future results and is not appropriate for other purposes.
All amounts in thousands (unaudited)
| | | | | |
|
| Revenues | | $ | 379,695 | |
| Net income | | $ | 29,307 | |
| Net income attributable to equity shareholders | | $ | 28,619 | |
CHAIRMAN’S LETTER
2
TERRA NOVA ROYALTY CORPORATION
Liquidity
Our management believes we currently have adequate liquidity and acceptable financial ratios. As at December 31, 2010, we had cash and securities of $426 million, working capital of $412 million, total assets of $854 million and our shareholders’ equity was $548 million.
We also have lines of credit in the amount of $379 million. As part of our activities, we establish, utilize and maintain various kinds of credit lines and facilities with banks, insurers and finance providers, including accounts receivable financing and letters of credit. We often enhance the credit of such facilities through insurance. Trade finance is often layered with varying limitations and exceptions.
We believe that cash flow from operating activities together with cash on hand and borrowings available under our credit facilities will be sufficient to fund currently anticipated capital spending and debt service requirements. We generally fund our operations from cash generated by operations.
Financial Highlights
All amounts in thousands, except per share data
| | | | | | | | | |
| December 31 | | 2010 | | | 2009 | |
| Cash and cash equivalent | | $ | 397,697 | | | $ | 38,046 | |
| Securities | | $ | 27,894 | | | $ | 11,212 | |
| Current assets | | $ | 560,471 | | | $ | 736,747 | |
| Total assets | | $ | 854,256 | | | $ | 951,720 | |
| Current liabilities | | $ | 148,551 | | | $ | 365,926 | |
| Working capital | | $ | 411,920 | | | $ | 370,821 | |
| Current ratio | | | 3.77 | | | | 2.01 | |
| Acid test ratio | | | 3.07 | | | | 8.72 | |
| Long-term debt, less current portion | | $ | 48,604 | | | | N/A | |
| Long-term debt-to-shareholders’ equity | | | 0.09 | | | | N/A | |
| Total liabilities | | $ | 301,816 | | | $ | 510,628 | |
| Shareholders’ equity | | $ | 547,756 | | | $ | 435,689 | |
| Equity per common share | | $ | 8.76 | | | $ | 14.40 | |
CHAIRMAN’S LETTER
3
TERRA NOVA ROYALTY CORPORATION
Business
We are active in a broad spectrum of activities related to the integrated combination of commodities and resources and merchant banking. Our business is divided into three reportable segments: (i) commodities and resources, which includes our commodities trading activities and mineral and royalty interests; (ii) merchant banking, which includes our trading, trade finance, financial services and proprietary investing activities; and (iii) other, which encompasses our corporate and other investments, including our medical supplies and services businesses.
Trading of Commodities and Resources
Our commodities and resources operations include our integrated commodities trading activities and our mineral interests. We conduct trading primarily through our subsidiaries based in Vienna, Austria and supply various commodities, including minerals and metals, chemicals and plastics and wood products to our customers. Such commodities originate either from our directly or indirectly held interests in resource projects or are secured by us from third parties. Our commodities trading activities are globally focused. We also derive production royalty revenue from a mining sub-lease of the lands upon which the Wabush iron ore mine is situated.
Through our commodities and resources business, we also provide logistics and other services to producers and consumers of commodities. These activities are supported by strategic direct or indirect investments in resource assets operating in our core commodities, including plastics, non-ferrous metals and minerals, including iron ore.
Our commodities trading activities include purchasing, selling and conducting product swaps of various commodities. To a lesser extent, we also act as a trading agent for clients. Our trading activities often utilize innovative trading strategies and structures. We currently trade with commodity and other producers who are unable to effectively realize sales due to their specific circumstances.
Generally we purchase or produce the underlying commodity and sell it to an end buyer or further trade it for another commodity which will subsequently be sold. Further, commodity producers and end customers often work with us to better manage their internal supply, distribution risk, and currency and capital requirements. In such trading activities, we try to capture various trading, financing and currency spreads. Through our trading activities, we have been able to develop ongoing relationships with commodity producers, end customers and trade financiers.
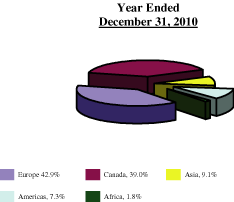
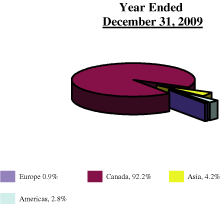
We generally source commodities from Asia, Africa, Europe, the United States and the Middle East. Our commodities sales for the most part include the European, Middle Eastern, Asian and North and South American markets.
Through our commodities trading activities, we have sourced, supplied and traded, primarily for our own account, the following commodities:
CHAIRMAN’S LETTER
4
TERRA NOVA ROYALTY CORPORATION
| | | | | |
| Metals and Minerals | | Chemicals and Plastics | | Wood Products |
iron-ore
bauxite
manganese-ore
cobalt
base metals
magnesium
steel products
zinc alloys
aluminum foils
aluminum sheets
coal
clinker
cement
ferrous alloys
silicon metals | | polystyrene
high density polyethylene
linear low density
polyethylene
low density polyethylene
polyethylene terephthalate
polypropylene
polyvinyl chloride
| | pulp
saw logs
round logs
sawn timber
plywood
medium density
fiberboard
wood pellets |
Merchant Banking
Our merchant banking business includes merchant banking and financial services, including specialized banking, corporate finance, trade finance and other services, proprietary investing and our real estate and investment properties. We seek to invest in many industries, emphasizing those businesses or assets where the perceived intrinsic value is not properly recognized nor properly reflected in their share price valuation. Our investments are generally not passive. We seek investments where our management and financial expertise can be used to actively add or unlock value. Our merchant banking activities also include our trading and financial experience and relationships to provide trading services, such as transportation and logistics and trade finance services to our trading customers.
Other
Our other segment encompasses corporate and our investments in joint ventures through our subsidiary which provides medical equipment and supplies. Specifically, we are engaged in the operation of technically advanced eye care centers through cooperative joint ventures with government-controlled hospitals in China. These hospitals provide the necessary space and medical staff to operate the centers, and we provide the specialized medical equipment and supplies, training and supervision with respect to certain surgical procedures. We also sell and service medical equipment.
Transactions Highlights for 2010
| | • | | January 6th, we announced our intention to restructure our assets and operations by dividing into two independent publicly traded companies; one company to focus on the industrial engineering business and the other to focus on our resource-focused business. To effect this division we effected a reorganization whereby substantially all of our subsidiaries engaged in the industrial engineering business were transferred to KID. |
CHAIRMAN’S LETTER
5
TERRA NOVA ROYALTY CORPORATION
| | • | | February 26th, we entered into an Arrangement Agreement with KID, which was approved by our shareholders on March 29, 2010. |
| |
| | • | | March 30th, pursuant to the arrangement we separated into two distinct owned and operated businesses: a mineral royalty and natural resources business conducted by Terra Nova Royalty Corporation; and an industrial plant technology, equipment and service business conducted by our former subsidiary, KID. |
| |
| | • | | March 30th, we distributed to our shareholders, by way of return of capital, approximately 26% of the issued KID shares at such time without any withholding taxes. This was tax efficient. |
| |
| | • | | July 1st, we distributed to our shareholders approximately 23% of the issued KID shares at such time, for which there was Canadian withholding tax of 15% for U.S. residents, which wasnottax efficient. |
| |
| | • | | July 27th, we announced a rights offering (the “Rights Offering”), pursuant to which, each holder of our common shares of record as of August 6, 2010, received one transferable right (a “Right”) for every common share held. Every four Rights entitled a holder to purchase one common share at a price of $6.60. On September 8, 2010, we announced that the Rights Offering was fully subscribed. We issued a total of 7,571,227 common shares under the Rights Offering, representing total gross proceeds of approximately $50 million. The Rights Offering provided us with much needed paid-up capital to assist with further distributions of the KID shares. |
| |
| | • | | September 23rd, we distributed to our shareholders, by way of a return of capital, approximately 29% of the issued KID shares at such time without any withholding taxes. This was tax efficient. |
| |
| | • | | September 27th, we announced that we had entered into an agreement with Mass for us to acquire all of the issued and outstanding shares of Mass by way of a take-over bid. We offered one of our common shares for each Mass share pursuant to our offer, valuing the transaction at approximately $225 million. The offer ratio was based upon the adjusted book value of each company and valued our shares at $8.91 per share. |
| |
| | • | | November 9th, we announced the expiry of our offer to acquire all of the common shares of Mass through our wholly-owned subsidiary. Mass shares, representing over 93% of the outstanding shares of Mass, were tendered pursuant to the Offer. |
| |
| | • | | December 31st, we distributed to our shareholders by way of a return of capital, the substantial balance of the KID shares held by us, without any withholding tax for our shareholders. This was tax efficient. |
We also established an annual dividend policy as follows:
| | • | | The annual dividend is based on the annual dividend yield of the New York Stock Exchange Composite Index for the preceding year plus 25 basis points. |
CHAIRMAN’S LETTER
6
TERRA NOVA ROYALTY CORPORATION
| | • | | On January 15, 2011, we announced the declaration of an aggregate cash dividend for 2011 of $0.20 per common share, representing a dividend yield of 2.58 percent, payable in quarterly instalments. |
| |
| | • | | The first payment of $0.05 per common share was paid on January 31, 2011 to shareholders of record on January 20, 2011. The second payment will be made on April 11, 2011 to shareholders of record on March 31, 2011. In the future, we plan to announce and declare the cash dividend during the first full week of each year. The declaration, timing and payment of future dividends will depend on, among other things, our financial results. |
Accounting Changes
We have changed our financial reporting standards from Canadian GAAP to International Financial Reporting Standards (“IFRS”) from January 1, 2010. Pursuant toIFRS 1, First-time Adoption of International Financial Reporting Standards,we increased the value of the Wabush royalty asset to its fair value as of January 1, 2009. Based upon our January 1, 2009 valuation including the then royalty rates and forecasted demand, the effect of such an increase was as follows:
All amounts in thousands, except per share data
| | | | | |
|
| Carrying value January 1, 2009 | | $ | 24,861 | |
| Valuation increase | | $ | 175,139 | |
| Revised book value | | $ | 200,000 | |
| Deferred income tax liability | | $ | (51,133 | ) |
| Increase in shareholders’ equity | | $ | 124,006 | |
| Shares outstanding (000’s) | | | 62,561 | |
| Increase in shareholder’s equity per share | | $ | 1.98 | |
| | |
| notes: | | Number of shares outstanding after the acquisition of 100 percent of the common shares of Mass. |
The above-mentioned increase of our royalty asset valuation does not take into consideration the increase in the current pricing developments of the underlying commodity.
The final distribution of the KID shares in the fourth quarter and the change to IFRS allows us to present a clearer picture of our financial position by presenting KID as a discontinued operation which, in effect removes KID results from our profit and loss statement and year end balance sheet. We believe this presentation provides a very clearer foundation going forward, but is not helpful in reviewing the 2010 year.
CHAIRMAN’S LETTER
7
TERRA NOVA ROYALTY CORPORATION
Corporate Tax
We are a company organized under the laws of Canada, with operations through a subsidiary that is organized under the laws of Barbados and licensed as an “international business company” under Barbados laws. As an international business company, it is subject to Barbados income tax at regressive rates ranging from 2.5% to 1%. Such rates being 2.5% on all profits and gains up to Barbados dollars (“Bds”) $10 million, 2% on all profits and gains exceeding Bds$10��million but not exceeding Bds$20 million, 1.5% on all profits and gains exceeding Bds$20 million but not exceeding Bds$30 million and 1% on all profits and gains in excess of Bds$30 million. Barbados does not levy any form of tax on capital gains, nor does it tax earnings of foreign corporations in which there is an equity interest. In 2010 we recorded a mining royalty tax of $6.7 million and tax on other income of $231,000.
Objectives
Our prime objective is simply to do good business. Given our liquid resources, we are well positioned to take advantage of opportunities arising from the global market downturn. These are interesting times for business opportunities but we must maintain our financial discipline. As we progress this year, we plan to change our name and image to better reflect our new direction and platform.
Management Disappointments for 2010
Our disappointments for last year included the following:
| | • | | Our general and administrative expenses are still way too high. It should now come down as we have completed all our major transactions in 2010; |
| |
| | • | | we have several new projects that we are working on, but have yet completed, but we are pleased that we controlled our risk in assessing these new opportunities; and |
| |
| | • | | we did not cut off all expenses related to the former industrial business quickly enough. |
These are the key areas for management to improve upon.
Summary
We believe that the growth of our asset base and net worth are the only true valuation measures of our performance. Going forward, we will utilize our foundation of commodities and resources and merchant banking and our strategic of operating businesses to vigorously pursue international opportunities for future growth. We will continue to manage our business activities for the long term, investing on the basis of our traditional disciplined approach while paying particular attention to the potential value to be realized by applying our financial expertise and patience. I would like to thank our shareholders for their support and look forward to generating a return on our assets.
Respectfully Submitted,

Michael J. Smith
Chairman of the BoardCHAIRMAN’S LETTER
8
TERRA NOVA ROYALTY CORPORATION
Form 20-F
TABLE OF CONTENTS
PART I
FORWARD-LOOKING STATEMENTS
This document contains certain forward-looking information and statements, including statements relating to matters that are not historical facts and statements of our beliefs, intentions and expectations about developments, results and events which will or may occur in the future, which constitute “forward-looking information” within the meaning of applicable Canadian securities legislation and “forward-looking statements” within the meaning of the “safe harbour” provisions of theUnited States Private Securities Litigation Reform Act of 1995, collectively referred to as “forward-looking statements”. Forward-looking statements are typically identified by words such as “anticipate”, “could”, “should”, “expect”, “seek”, “may”, “intend”, “likely”, “will”, “plan”, “estimate”, “believe” and similar expressions suggesting future outcomes or statements regarding an outlook.
Forward-looking statements are included throughout this document and include, but are not limited to, statements with respect to: our projected revenues; markets; production, demand and prices for products and services, including iron ore and other minerals; trading; trends, economic conditions, performance, business prospects, results of operations; capital expenditures; the economy; foreign exchange rates; derivatives; our ability to expand our business; and other such matters. All such forward-looking statements are based on certain assumptions and analyses made by us in light of our experience and perception of historical trends, current conditions and expected future developments, as well as other factors we believe are appropriate in the circumstances. These statements are, however, subject to known and unknown risks and uncertainties and other factors. As a result, actual results, performance or achievements could differ materially from those expressed in, or implied by, these forward-looking statements and, accordingly, no assurance can be given that any of the events anticipated by the forward-looking statements will transpire or occur, or if any of them do so, what benefits will be derived therefrom. These risks, uncertainties and other factors include, among others:
| | |
| | • | our financial results may fluctuate substantially from period to period; |
| |
| | • | our earnings and, therefore, our profitability, may be affected by commodities price volatility; |
| |
| | • | a weak global economy can adversely affect our business and financial results and have a material adverse effect on our liquidity and capital resources; |
| |
| | • | the commodities and resources and merchant banking businesses are highly competitive; |
| |
| | • | the operation of the Wabush iron ore mine is generally determined by a third party owner and we have no decision making power as to how the property is operated. In addition, we have no or very limited access to technical or geological data respecting the mine including as to reserves. The owner’s failure to perform or other operating decisions made by the owner, including as to scaling back or ceasing operations, could have a material adverse effect on our revenue, our results of operations and financial condition; |
| |
| | • | the profitability of our commodities and resources operations depends, in part, on the availability of adequate sources of supply; |
| |
| | • | we may face a lack of suitable acquisition or merger or other proprietary investment candidates, which may limit our future growth; |
| |
| | • | we may be unable to successfully compete for mineral interests with companies that have greater financial resources; |
| |
| | • | strategic investments or acquisitions and joint ventures, or our entry into new business areas, may result in additional risks and uncertainties in our business; |
| |
| | • | we may fail to realize all of the anticipated benefits of our acquisition of Mass Financial Corp., referred to as “Mass”; |
| |
| | • | the industries in which we operate may be affected by disruptions beyond our control; |
| |
| | • | our trading activities are subject to counterparty risks associated with performance of obligations by our trading partners and suppliers; |
| |
| | • | larger and more frequent capital commitments in our merchant banking business increase the potential for significant losses; |
1
| | |
| | • | our income from royalty and other similar interests will be dependent on the payments made by the owners and operators of our royalty and similar interests, and any delay in or failure of such royalty payments will affect the revenues generated by our royalty interests; |
| |
| | • | we are subject to transaction risks that may have a material adverse effect on our business, results of operations, financial condition and cash flow; |
| |
| | • | our risk management strategies expose us to unidentified or unanticipated risks that could impact our risk management strategies in the future and could negatively affect our results of operations and financial condition; |
| |
| | • | derivative transactions may expose us to unexpected risks and potential losses; |
| |
| | • | fluctuations in interest rates and foreign currency exchange rates may affect our results of operations and financial condition; |
| |
| | • | our operations and infrastructure may malfunction or fail; |
| |
| | • | the exploration and development of resource properties is inherently dangerous and subject to risks beyond our control; |
| |
| | • | our commodities and resources operations are subject to environmental laws and regulations that may increase the costs of doing business and may restrict such operations; |
| |
| | • | we or the operators of our current and any future resource interests may not be able to secure required permits and licenses; |
| |
| | • | there can be no assurance that we will be able to obtain adequate financing in the future or that the terms of such financing will be favourable and, as a result, we may have to raise additional capital through the issuance of additional equity, which will result in dilution to our shareholders; |
| |
| | • | limitations on our access to capital could impair our liquidity and our ability to conduct our business; |
| |
| | • | we may substantially increase our debt in the future; |
| |
| | • | we are exposed to political, economic, legal, operational and other risks as a result of our global operations that could negatively affect our business, and our results of operations, financial condition and cash flow could be adversely affected; |
| |
| | • | we are exposed to litigation risks in our business that are often difficult to assess or quantify. We anticipate that we will incur significant legal expenses every year in defending against litigation; |
| |
| | • | we rely significantly on the skills and experience of our executives and the loss of these individuals could harm our business; |
| |
| | • | we may experience difficulty attracting and retaining qualified management and technical personnel to efficiently operate our business, and the failure to operate our business effectively could have a material and adverse effect on our profitability, financial condition and results of operations; |
| |
| | • | certain of our directors and officers may, from time to time, serve in similar positions with other public companies, which may put them in a conflict position from time to time; |
| |
| | • | we conduct business in countries with a history of corruption and transactions with foreign governments increases the risks associated with our international activities; |
| |
| | • | employee misconduct could harm us and is difficult to detect and deter; |
| |
| | • | we may incur losses as a result of unforeseen or catastrophic events, including the emergence of a pandemic, terrorist attacks or natural disasters; |
| |
| | • | investors’ interests may be diluted and investors may suffer dilution in their net book value per share if we issue additional shares or raise funds through the sale of equity securities; |
| |
| | • | our constating documents contain indemnification provisions, and we have entered into agreements indemnifying our officers and directors against all costs, charges and expenses incurred by them; and |
2
| | |
| | • | certain factors may inhibit, delay or prevent a takeover of our company, which may adversely affect the price of our common shares. |
Although we believe that the expectations reflected in such forward-looking information and statements are reasonable, we can give no assurance that such expectations will prove to be accurate. Accordingly, readers should not place undue reliance upon any of the forward-looking information and statements set out in this document. All of the forward-looking information and statements of ours contained in this document are expressly qualified, in their entirety, by this cautionary statement. The various risks to which we are exposed are described in additional detail in this document under the section entitled “Item 3: Key Information — D. Risk Factors”. The forward-looking information and statements are made as of the date of this document, and we assume no obligation to update or revise them except as required pursuant to applicable securities laws.
As used in this annual report, the terms “we”, “us” and “our” mean Terra Nova Royalty Corporation and our subsidiaries, unless otherwise indicated.
CURRENCY
Unless otherwise indicated, all references in this document to “$” and “dollars” are to United States dollars and all references to “CDN$” and “Canadian dollars” are to Canadian dollars and all references to “Euro” or “€” are to the European Union Euro. On March 25, 2010, the noon buying rate in New York City for cable transfers as certified by the Federal Reserve Bank of New York for the conversion of Canadian dollars and Euros to United States dollars was CDN$1.00 = 0.9779 and €1.00 = 1.4144, respectively.
PRESENTATION OF FINANCIAL INFORMATION
In December 2010, applicable Canadian securities commissions granted us exemptive relief permitting us to adopt International Financial Reporting Standards as issued by the International Accounting Standards Board, referred to as “IFRS”, effective from January 1, 2010. In connection therewith, we have filed amended financial statements, and related Management’s Discussion and Analysis, prepared in accordance with IFRS for each of the interim periods ended March 31, June 30 and September 30, 2010 with Canadian securities regulators and onForm 6-K with the United States Securities and Exchange Commission. Unless otherwise stated, all financial information presented herein has been prepared in accordance with IFRS. All prior period amounts have been reclassified to conform to IFRS. Please note that our prior annual financial statements were prepared in accordance with Canadian generally accepted accounting principles, which may not be comparable to the financial statements contained herein. Please refer to Note 36 of our annual financial statements included herewith for a discussion on the impact of our transition from Canadian generally accepted accounting principles to IFRS.
In 2010, we disposed of our former industrial plant technology, equipment and service business, referred to as the “Industrial Business”, which resulted in its being accounted for as discontinued operations in our financial statements. See the section of this annual report onForm 20-F entitled “Item 5: Operating and Financial Review and Prospects — Operating Results — Discontinued Operations” for further information respecting such discontinued operations.
| |
| ITEM 1: | Identity of Directors, Senior Management and Advisers |
Not applicable.
| |
| ITEM 2: | Offer Statistics and Expected Timetable |
Not applicable.
3
| |
| A. | Selected Financial Data |
The following table summarizes selected consolidated financial data prepared in accordance with IFRS, for each of the fiscal years ended December 31, 2010 and 2009. The information in the table was extracted from the detailed consolidated financial statements and related notes included elsewhere in this annual report onForm 20-F and should be read in conjunction with such financial statements and with the information appearing under the heading “Item 5: Operating and Financial Review and Prospects”.
Selected Financial Data
(Stated in United States dollars in accordance with IFRS)
(in thousands, other than per share amounts)
| | | | | | | | | |
| | | Fiscal Years Ended December 31, |
| | | 2010(1) | | 2009 |
| |
| Net sales | | $ | 84,476 | | | $ | 14,718 | |
Net income (loss) from continuing operations(2) | | | 45,839 | | | | (16,320 | ) |
Net income (loss) income from discontinued operations(2) | | | (15,523 | ) | | | 52,992 | |
| Basic earnings (loss) per share: | | | | | | | | |
| Continuing operations | | | 1.28 | | | | (0.54 | ) |
| Discontinued operations | | | (0.43 | ) | | | 1.75 | |
| Diluted earnings (loss) per share | | | | | | | | |
| Continuing operations | | | 1.28 | | | | (0.54 | ) |
| Discontinued operations | | | (0.43 | ) | | | 1.75 | |
Net income(2) | | | 30,316 | | | | 36,672 | |
| Net income per share | | | | | | | | |
| Basic | | | 0.85 | | | | 1.21 | |
| Diluted | | | 0.85 | | | | 1.21 | |
| Total assets | | | 854,256 | | | | 951,720 | |
| Net assets | | | 552,440 | | | | 441,092 | |
| Long-term debt, less current portion | | | 48,604 | | | | — | |
| Shareholders’ equity | | | 547,756 | | | | 435,689 | |
| Capital stock, net of treasury stock | | | 314,172 | | | | 58,270 | |
| Weighted average common stock outstanding, diluted | | | 35,859 | | | | 30,354 | |
Notes
| | |
| (1) | | We consolidated the operations of Mass from November 16, 2010. |
| |
| (2) | | Net income attributable to our shareholders. |
| |
| B. | Capitalization and Indebtedness |
Not applicable.
| |
| C. | Reasons for the Offer and Use of Proceeds |
Not applicable.
Certain statements in this annual report onForm 20-F are forward-looking statements, which reflect our management’s expectations regarding our future growth, results of operations, performance, and business prospects
4
and opportunities. Forward-looking statements consist of statements that are not purely historical, including any statements regarding beliefs, plans, expectations, projections or intentions regarding the future. While these forward-looking statements, and any assumptions upon which they are based, are made in good faith and reflect our current judgment regarding the direction of our business, actual results will almost always vary, sometimes materially, from any estimates, predictions, projections, assumptions or other future performance suggested herein.
Such estimates, projections or other forward-looking statements involve various risks and uncertainties as outlined below. We caution the reader that important factors in some cases have affected and, in the future, could materially affect actual results and cause actual results to differ materially from the results expressed in any such estimates, projections or other forward-looking statements.
An investment in our common shares involves a number of risks. You should carefully consider the following risks and uncertainties in addition to other information in this annual report onForm 20-F in evaluating our company and our business before purchasing our common shares. Our business, operations and financial condition could be materially and adversely affected by one or more of the following risks.
Risk Factors Relating to Our Business
Our financial results may fluctuate substantially from period to period.
We expect our business to experience in the future significant periodic variations in its revenues and results of operations. These variations may be attributed in part to the fact that our merchant banking revenues are often earned upon the successful completion of a transaction, the timing of which is uncertain and beyond our control. In many cases, we may receive little or no payment for engagements that do not result in the successful completion of a transaction. Additionally, through our merchant banking business, we seek to acquire undervalued assets where we can use our experience and management to realize upon the value. Often we will hold or build upon these assets over time and the timing of its realization is not predictable. As a result, we are unlikely to achieve steady and predictable earnings, which could in turn adversely affect our financial condition and results of operations.
Our earnings and, therefore, our profitability, may be affected by commodities price volatility.
The majority of our revenue from our commodities and resources business is derived from the sale of commodities, including metals, plastics and other materials. As a result, our earnings are directly related to the prices of these commodities. In addition, our revenues from our royalty business and our other iron ore interests are directly connected to the price of iron ore. There are many factors influencing the price of metals, plastics and other commodities, including expectations for inflation; global and regional demand and production; political and economic conditions; and production costs in major producing regions. These factors are beyond our control and are impossible for us to predict. Changes in the prices of iron ore, plastics, metals and other commodities may adversely affect our operating results. We have not engaged in material hedging transactions or alternative measures to manage possible price fluctuations.
A weak global economy can adversely affect our business and financial results and have a material adverse effect on our liquidity and capital resources.
Our business, by its nature, does not produce predictable earnings, and it may be materially affected by conditions in the global financial markets and economic conditions generally.
Global financial markets experienced extreme and unprecedented disruption in the latter part of 2008, including, among other things, extreme volatility in security prices, severely diminished liquidity and credit availability, rating downgrades of certain investments and declining valuations of others. Although financial markets stabilized and signs of a global economic recovery began to emerge in the latter part of 2009 and continued through 2010, the economic environment, particularly in the United States and Europe, continues to be generally weak and we remain exposed to a number of risks associated with weak or adverse economic conditions.
Market deterioration and weakness can result in a material decline in the number and size of the transactions that we execute for our own account and for our clients and to a corresponding decline in our revenues. Market weakness can further result in losses to the extent that we own assets in such market.
5
The nature of the recovery in the global economy in general remains uncertain, and there can be no assurance that market conditions will continue to improve in the near future.
The commodities and resources and merchant banking businesses are highly competitive.
All aspects of the commodities and resources and merchant banking businesses are highly competitive, and we expect them to remain so.
Our competitors include merchant and investment banks, brokerage firms, commercial banks, private equity firms, hedge funds, financial advisory firms and natural resource and mineral royalty companies. Many of our competitors have substantially greater capital and resources, including access to commodities supply, than we do. We believe that the principal factors affecting competition in our business include transaction execution, our products and services, client relationships, reputation, innovations, credit worthiness and price. We have experienced price competition in some of our trading business.
The scale of our competitors has increased in recent years as a result of substantial consolidation. These firms have the ability to offer a wider range of products than we do which may enhance their competitive position. They also have the ability to support their business with other financial services such as commercial lending in an effort to gain market share, which has resulted, and could further result, in pricing pressure in our businesses.
If we are unable to compete effectively with our competitors, our business and results of operations will be adversely affected.
The operation of the Wabush iron ore mine is generally determined by a third party owner and we have no decision making power as to how the property is operated. In addition, we have no or very limited access to technical or geological data respecting the mine including as to reserves. The owner’s failure to perform or other operating decisions made by the owner, including as to scaling back or ceasing operations, could have a material adverse effect on our revenue, our results of operations and financial condition.
The commodities and resources segment of our business includes our royalty interests in the Wabush iron ore mine. The revenue derived from the interest is based on production generated by the mine’s third party owner. The owner generally has the power to determine the manner in which the iron ore is exploited, including decisions to expand, continue or reduce production from the mine, and decisions about the marketing of products extracted from the mine. The interests of the third party owner and our interests may not always be aligned. As an example, it will, in almost all cases, be in our interest to advance production as rapidly as possible in order to maximize near-term cash flow, while the third party operator may, in many cases, take a more cautious approach to development as it is at risk with respect to the cost of development and operations. Our inability to control the operations of the mine can adversely affect our profitability, results of operations and financial condition. Similar adverse effects may result from any other interests we may acquire that are primarily operated by a third party owner.
In addition, we have no or very limited access to technical, geological data relating to the Wabush iron ore mine, including data as to reserves, nor have we received a Canadian National Instrument43-101 compliant technical report in respect of the Wabush iron ore mine. As such, we cannot independently determine reserve amounts or the estimated life of the mine and are instead wholly dependent on the determination of the reserves by the owner of the mine. We can provide no assurances as to the level of reserves at the mine. If the owner of the mine determines there are insufficient reserves to economically operate the mine, it may scale back or cease operations, which could have a material adverse effect on our profitability, results of operations and financial condition.
The profitability of our commodities and resources operations depends, in part, on the availability of adequate sources of supply.
Our commodities and resources business relies, among other things, on numerous outside sources of supply for our trading activities. These suppliers generally are not bound by long-term contracts and will have no obligation to provide commodities to us in the future. In periods of low industry prices, suppliers may elect to hold commodities to wait for higher prices or intentionally slow their activities. If a substantial number of suppliers cease selling commodities to us, we will be unable to execute commodities trades at desired levels and our results of operations and financial condition could be materially adversely affected.
6
We may face a lack of suitable acquisition or merger or other proprietary investment candidates, which may limit our growth.
In order to grow our business, we may seek to acquire or merge with or invest in new companies or opportunities. Our failure to make acquisitions or investments may limit our growth. In pursuing acquisition and investment opportunities, we face competition from other companies having similar growth and investment strategies, many of which may have substantially greater resources than us. Competition for these acquisitions or investment targets could result in increased acquisition or investment prices, higher risks and a diminished pool of businesses, services or products available for acquisition or investment.
We may be unable to successfully compete for mineral interests with companies having greater financial resources than we have.
Mines have limited lives and as a result, we seek to expand our commodities and resources business through the acquisition of additional mineral interests. As there is a limited supply of desirable mineral deposits in the regions in which we operate, we face strong competition for such interests from other companies, some of which have greater financial resources than we have. Accordingly, we may not be able to acquire attractive additional mineral interests, including obtaining sufficient supply for our trading operations, on acceptable terms, which may adversely affect our financial condition and results of operations.
Strategic investments or acquisitions and joint ventures, or our entry into new business areas, may result in additional risks and uncertainties in our business.
We have grown and intend to continue to grow our business both through internal expansion and through strategic investments, acquisitions or joint ventures. When we make strategic investments or acquisitions or enter into joint ventures, we expect to face numerous risks and uncertainties in combining or integrating the relevant businesses and systems, including the need to combine accounting and data processing systems and management controls and to integrate relationships with customers and business partners.
Acquisitions also frequently result in recording of goodwill and other intangible assets, which are subject to potential impairments in the future that could have a material adverse effect on our operating results. Furthermore, the costs of integrating acquired businesses (including restructuring charges associated with the acquisitions, as well as other acquisition costs, such as accounting fees, legal fees and investment banking fees) could significantly impact our operating results.
Although we perform diligence on the businesses we purchase, in light of the circumstances of each transaction, an unavoidable level of risk remains regarding the actual condition of these businesses. We may not be able to ascertain the value or understand the potential liabilities of the acquired businesses and their operations until we assume operating control of the assets and operations of these businesses.
Furthermore, any future acquisitions of businesses or facilities could entail a number of risks, including:
| | |
| | • | problems with the effective integration of operations; |
| |
| | • | inability to maintain key pre-acquisition business relationships; |
| |
| | • | increased operating costs; |
| |
| | • | exposure to substantial unanticipated liabilities; |
| |
| | • | difficulties in realizing projected efficiencies, synergies and cost savings; |
| |
| | • | the risks of entering markets in which we have limited or no prior experience; and |
| |
| | • | the possibility that we may be unable to recruit additional managers with the necessary skills to supplement the management of the acquired businesses. |
In addition, geographic and other expansions, acquisitions or joint ventures may require significant managerial attention, which may be diverted from our other operations. If we are unsuccessful in overcoming these risks, our business, financial condition or results of operations could be materially and adversely affected.
7
We may fail to realize all of the anticipated benefits of our acquisition of Mass.
In 2010 we completed the acquisition of all of the outstanding shares of Mass. Realization of the anticipated benefits of the combination of the companies will require the successful integration of Mass’s business with ours. It is possible that the integration process could result in the disruption to our ongoing businesses or in inconsistencies in standards, controls, procedures and policies that may adversely affect our ability to maintain relationships with clients, customers and employees. If we experience difficulties with the integration process, the anticipated benefits of the successful completion of the acquisition of Mass may not be realized fully or at all, or may take longer to realize than expected. Integration efforts will also divert management attention and resources. These integration matters could have an adverse effect for an undetermined period.
The industries in which we operate may be affected by disruptions beyond our control.
Our commodities and resources operations include direct or indirect investments in assets, such as smelting, refining, mining and processing operations. Transport disruption, weather and natural disasters such as hurricanes and flooding, unexpected maintenance problems, collapse or damage to mines, unexpected geological variations, labor disruptions and changes in laws and regulations relating to occupational safety, health and environmental matters are some of the factors that may adversely affect our financial condition and results of operations. These factors can affect costs at particular industrial assets for varying periods. In addition, smelting, refining, mining and processing operations also rely on key inputs, such as labor, spare parts, fuel and electricity. Disruption to the supply of key inputs, or changes in their pricing, may have a significant adverse impact on our future results.
Our trading activities are subject to counterparty risks associated with performance of obligations by our trading partners and suppliers.
Our business is subject to commercial risks, which include counterparty risk, such as failure of performance by commodities suppliers and failure of payment by our trading customers. We seek to reduce the risk of supplier non-performance by requiring credit support from creditworthy financial institutions where appropriate. We attempt to reduce the risk of non-payment by purchasers of commodities by imposing limits on open accounts extended to creditworthy customers and imposing credit support requirements for other customers. Nevertheless, we are exposed to the risk that parties owing us or our clients and other financial intermediaries may default on their obligations to us due to bankruptcy, lack of liquidity, operational failure or other reasons. These counterparty obligations may arise, for example, from placing deposits, the extension of credit in trading and investment activities, and participation in payment, securities and commodity trading transactions on our behalf and as an agent on behalf of our clients. If any of these parties defaults on their obligations, our business, results of operations, financial condition and cash flow could be adversely affected.
Larger and more frequent capital commitments in our merchant banking business increase the potential for significant losses.
We may enter into large transactions in which we commit our own capital as part of our commodities and resources business to facilitate client trading activities. The number and size of these large transactions may materially affect our results of operations in a given period. Market fluctuations may also cause us to incur significant losses from our trading activities. To the extent that we own assets, i.e., have long positions, a downturn in the value of those assets or in the markets in which those assets are traded could result in losses. Conversely, to the extent that we have sold assets we do not own, i.e., have short positions, in any of those markets, an upturn in those markets could expose us to potentially large losses as we attempt to cover our short positions by acquiring assets in a rising market.
We will be dependent on the payments made by the owners and operators of our royalty and similar interests, and any delay in or failure of such royalty payments will affect the revenues generated by such interests.
To the extent that we retain our current royalty interest, we will be dependent to a large extent upon the financial viability and operational effectiveness of owners and operators of our interests. Payments from production generally flow through the operator, and there is a risk of delay and additional expense in receiving such revenues. Payments may be delayed by restrictions imposed by lenders, delays in the sale or delivery of products, accidents, the recovery by operators of expenses incurred in the operation of any royalty properties, the establishment by operators of reserves for such expenses or the insolvency of an operator. Our rights to payment under the royalties will likely have to be enforced by
8
contract. This may inhibit our ability to collect outstanding royalties upon a default. Failure to receive any payments from the owners and operators of mines in which we have or may acquire a royalty interest may result in a material and adverse effect on our profitability, results of operations and financial condition.
As a royalty holder, we have no or very limited access to operational data or to the actual properties underlying our royalty interests. Such limited access will likely be the case with any future royalty or similar interests acquired by us. Operators of royalty interests may inaccurately report data relating to the calculation of our royalty payments and underpay such royalty payments to us, which could adversely affect our results of operations and financial condition.
To the extent grantors of royalties and other interests do not abide by their contractual obligations, we may be forced to take legal action to enforce our contractual rights. Such litigation may be time consuming and costly and, as with all litigation, there is no guarantee of success. Should any such decision be determined adversely to us, such decision may have a material and adverse effect on our profitability, results of operations and financial condition.
We are subject to transaction risks that may have a material adverse effect on our business, results of operations, financial condition and cash flow.
We manage transaction risks through allocating and monitoring our capital investments in circumstances where the risk to our capital is minimal, carefully screening clients and transactions, and engaging qualified personnel to manage transactions. Nevertheless, transaction risks can arise from, among other things, our trading and merchant banking activities. These risks include market and credit risks associated with our merchant banking operations. We intend to make investments in highly unstructured situations and in companies undergoing severe financial distress. Such investments often involve severe time constraints. These investments may expose us to significant transaction risks. An unsuccessful investment may result in the total loss of such an investment and may have a material adverse effect on our business, results of operations, financial condition and cash flow.
Our risk management strategies leave us exposed to unidentified or unanticipated risks that could impact our risk management strategies in the future and could negatively affect our results of operations and financial condition.
We use a variety of instruments and strategies to manage exposure to various types of risks. For example, we use derivative foreign exchange contracts to manage our exposure and our clients’ exposure to foreign currency exchange rate risks. If any of the variety of instruments and strategies we utilize to manage our exposure to various types of risk are not effective, we may incur losses. Many of our strategies are based on historical trading patterns and correlations. However, these strategies may not be fully effective in mitigating our risk exposure in all market environments or against all types of risk. Unexpected market developments may affect our risk management strategies during this time, and unanticipated developments could impact our risk management strategies in the future.
Derivative transactions may expose us to unexpected risk and potential losses.
We, from time to time, enter into derivative transactions that require us to deliver to the counterparty the underlying security, loan or other obligation in order to receive payment. In a number of cases, we may not hold the underlying security, loan or other obligation and may have difficulty obtaining, or be unable to obtain, the underlying security, loan or other obligation through the physical settlement of other transactions. As a result, we are subject to the risk that we may not be able to obtain the security, loan or other obligation within the required contractual time frame for delivery. This could cause us to forfeit the payments due to us under these contracts or result in settlement delays with the attendant credit and operational risk as well as increased costs to us.
Fluctuations in interest rates and foreign currency exchange rates may affect our results of operations and financial condition.
Fluctuation in interest rates may affect the fair value of our financial instruments sensitive to interest rates. An increase in market interest rates may decrease the fair value of our fixed interest rate financial instrument assets and a decrease in market interest rates may decrease the fair value of our fixed interest rate financial instrument liabilities, thereby resulting in a reduction in the fair value of our equity. Similarly, fluctuations in foreign currency exchange rates may affect the fair value of our financial instruments sensitive to foreign currency exchange rates.
9
Our operations and infrastructure may malfunction or fail.
Our business is highly dependent on our ability to process, on a daily basis, a number of transactions across diverse markets, and the transactions we process have become increasingly complex. The inability of our systems to accommodate an increasing volume of transactions could also constrain our ability to expand our businesses. If any of these systems do not operate properly or are disabled, or if there are other shortcomings or failures in our internal processes, people or systems, we could suffer impairments, financial loss, a disruption of our businesses, liability to clients, regulatory intervention or reputational damage.
The exploration and development of mining and resource properties is inherently dangerous and subject to risk beyond our control.
Companies engaged in resource activities are subject to all of the hazards and risks inherent in exploring for and developing natural resource projects. These risks and uncertainties include, but are not limited to, environmental hazards, industrial accidents, labor disputes, increase in the cost of labour, social unrest, fires, changes in the regulatory environment, impact of non-compliance with laws and regulations, fire, explosion, encountering unusual or unexpected geological formations or other geological or grade problems, unanticipated metallurgical characteristics or less than expected mineral recovery, encountering unanticipated ground or water conditions, cave-ins, pit wall failures, flooding, rock bursts, periodic interruptions due to inclement or hazardous weather conditions, earthquakes, seismic activity, other natural disasters or unfavourable operating conditions and losses. Should any of these risks or hazards affect a company’s exploration or development activities, it may (i) cause the cost of development or production to increase to a point where it would no longer be economic to produce the metal or oil and natural gas from the company’s resources or expected reserves, (ii) result in a write down or write-off of the carrying value of one or more projects, (iii) cause delays or stoppage of mining or processing, (iv) result in the destruction of properties, processing facilities or third party facilities necessary to the company’s operations, (v) cause personal injury or death and related legal liability, or (vi) result in the loss of insurance coverage. The occurrence of any of above mentioned risks or hazards could result in an interruption or suspension of operation of the properties in which we hold an interest or any other properties we acquire in the future and have a material and adverse effect on our results of operations and financial condition.
Our commodities and resources operations are subject to environmental laws and regulations that may increase the costs of doing business and may restrict the operations.
All phases of a resource business present environmental risks and hazards and are subject to environmental regulation pursuant to a variety of government laws and regulations. Compliance with such laws and regulations can require significant expenditures and a breach may result in the imposition of fines and penalties, which may be material. Environmental legislation is evolving in a manner expected to result in stricter standards and enforcement, larger fines and liability and potentially increased capital expenditures and operating costs. Any breach of environmental legislation by the operator of properties underlying our interests or by us, as an owner or operator of a property, could have a material impact on the viability of the relevant property and impair the revenue derived from the owned property or applicable royalty or other interest, which could have a material and adverse affect on our results of operations and financial condition.
Operating cost increases could have a negative effect on the value of, and income from, any royalty interests we may acquire by potentially causing an operator to curtail, delay or close operations at a mine site.
We or the operators of our current and any future resource interests may not be able to secure required permits and licenses.
Operations underlying our resource interests may require licenses and permits from various governmental authorities. There can be no assurance that we or the operator of any given project will be able to obtain all necessary licenses and permits that may be required to carry out exploration, development and mining operations.
10
There can be no assurance that we will be able to obtain adequate financing in the future or that the terms of such financing will be favourable and, as a result, we may have to raise additional capital through the issuance of additional equity, which will result in dilution to our shareholders.
There can be no assurance that we will be able to obtain adequate financing in the future or that the terms of such financing will be favourable. Failure to obtain such additional financing could result in delay or indefinite postponement of further business activities. We may require new capital to grow our business and there are no assurances that capital will be available when needed, if at all. It is likely such additional capital will be raised through the issuance of additional equity which would result in dilution to our shareholders.
Limitations on our access to capital could impair our liquidity and our ability to conduct our businesses.
Liquidity, or ready access to funds, is essential to companies engaged in commodities trading and financing and merchant banking. Failures of financial firms have often been attributable in large part to insufficient liquidity. Liquidity is of particular importance to our commodities and resources business and perceived liquidity issues may affect our clients’ and counterparties’ willingness to engage in transactions with us. Our liquidity could be impaired due to circumstances that we may be unable to control, such as a general market disruption or an operational problem that affects our clients, counterparties, our lenders or us. Further, our ability to sell assets may be impaired if other market participants are seeking to sell similar assets at the same time.
We may substantially increase our debt in the future.
We expect that it may be necessary for us to obtain financing with a bank or financial institution to provide funds for working capital, capital purchases, potential acquisitions and business development. However, because of our cash flow position, we do not expect that we will have any immediate need to obtain additional financing. Interest costs associated with any debt financing may adversely affect our profitability. Further, the terms on which amounts may be borrowed — including standard financial covenants regarding the maintenance of financial ratios, the prohibition against engaging in major corporate transactions or reorganizations and the payment of dividends — may impose additional constraints on our business operations and our financial strength.
As a result of our global operations, we are exposed to political, economic, legal, operational and other risks that could adversely affect our business, our results of operations, financial condition and cash flow.
In conducting our business in major markets around the world, we are subject to political, economic, legal, operational and other risks that are inherent in operating in other countries. These risks range from difficulties in settling transactions in emerging markets to possible nationalization, expropriation, price controls and other restrictive governmental actions, and terrorism. We also face the risk that exchange controls or similar restrictions imposed by foreign governmental authorities may restrict our ability to convert local currency received or held by us in their countries into Swiss francs, Canadian dollars, Euros or other hard currencies, or to take those other currencies out of those countries. If any of these risks become a reality, our business, results of operations, financial condition and cash flow could be negatively impacted.
We are exposed to litigation risks in our business that are often difficult to assess or quantify. We anticipate that we will incur significant legal expenses every year in defending against litigation.
We are exposed to legal risks in our business and the volume and amount of damages claimed in litigation against financial intermediaries are increasing. These risks include potential liability under securities or other laws for materially false or misleading statements made in connection with securities and other transactions, potential liability for advice we provide to participants in corporate transactions, and disputes over the terms and conditions of complex trading arrangements. We also face the possibility that counterparties in complex or risky trading transactions will claim that we improperly failed to tell them of the risks involved or that they were not authorized or permitted to enter into such transactions with us and that their obligations to us are not enforceable. During a prolonged market downturn, we expect these types of claims to increase. We are also exposed to legal risks in our merchant banking activities.
We seek to invest in undervalued businesses or assets often as a result of financial, legal, regulatory or other distress affecting them. Investing in distressed businesses and assets can involve us in complex legal issues relating to priorities, claims and other rights of stakeholders. These risks are often difficult to assess or quantify and their existence and
11
magnitude often remains unknown for substantial periods of time. We may incur significant legal and other expenses in defending against litigation involved with any of these risks and may be required to pay substantial damages for settlementsand/or adverse judgments. Substantial legal liability or significant regulatory action against us could have a material adverse effect on our results of operations.
We rely significantly on the skills and experience of our executives and the loss of these individuals may harm our business.
Our future success depends to a significant degree on the skills, experience and efforts of our executives and the loss of their services may compromise our ability to effectively conduct our business. We do not maintain “key person” insurance in relation to any of our employees.
We may experience difficulty attracting and retaining qualified management and technical personnel to efficiently operate our business, and the failure to operate our business effectively could have a material and adverse effect on our profitability, financial condition and results of operations.
We are dependent upon the continued availability and commitment of our management, whose contributions to immediate and future operations are of significant importance. The loss of any such management could negatively affect our business operations. From time to time, we will also need to identify and retain additional skilled management and specialized technical personnel to efficiently operate our business. The number of persons skilled in the acquisition, exploration and development of royalties and interests in natural resource properties is limited and competition for such persons is intense. Recruiting and retaining qualified personnel is critical to our success and there can be no assurance of our ability to attract and retain such personnel. If we are not successful in attracting and training qualified personnel, our ability to execute our business model and growth strategy could be affected, which could have a material and adverse impact on our profitability, results of operations and financial condition.
Certain of our directors and officers may, from time to time, serve in similar positions with other public companies, which may put them in a conflict position from time to time.
Certain of our directors and officers may, from time to time, serve as directors or officers of other companies involved in similar businesses to us and, to the extent that such other companies may participate in the same ventures in which we may seek to participate, such directors and officers may have a conflict of interest in negotiating and concluding terms respecting the extent of such participation. In all cases where our directors and officers have an interest in other companies, such other companies may also compete with us in commodities trading, financing and merchant banking and for the acquisition of royalties, similar interests or resources properties or projects. Such conflicts of our directors and officers may result in a material and adverse effect on our results of operations and financial condition.
We conduct business in countries with a history of corruption and transactions with foreign governments, and doing so increases the risks associated with our international activities.
As we operate internationally, we will be subject to the United StatesForeign Corrupt Practices Act, and other laws that prohibit improper payments or offers of payments to foreign governments and their officials and political parties by United States and other business entities that have securities registered in the United States for the purpose of obtaining or retaining business. We have operations and agreements with third parties in countries known to experience corruption. Further international expansion may involve more exposure to such practices. Our activities in these countries create the risk of unauthorized payments or offers of payments by one of our employees or consultants that could be in violation of various laws including theForeign Corrupt Practices Act, even though these parties are not always subject to our control. It is our policy to implement safeguards to discourage these practices by employees. However, our existing safeguards and any future improvements may prove to be less than effective, and our employees or consultants may engage in conduct for which we might be held responsible. Violations of theForeign Corrupt Practices Actmay result in criminal or civil sanctions, and we may be subject to other liabilities, which could negatively affect our business, operating results and financial condition.
12
Employee misconduct could harm us and is difficult to detect and deter.
It is not always possible to detect and deter employee misconduct. The precautions we take to detect and prevent employee misconduct may not be effective in all cases, and we could suffer significant reputational and economic harm for any misconduct by our employees. The potential harm to our reputation and to our business caused by such misconduct is impossible to quantify.
We may incur losses as a result of unforeseen or catastrophic events, including the emergence of a pandemic, terrorist attacks or natural disasters.
The occurrence of unforeseen or catastrophic events, including the emergence of a pandemic or other widespread health emergency (or concerns over the possibility of such an emergency), terrorist attacks or natural disasters, could create economic and financial disruptions, could lead to operational difficulties (including travel limitations) that could impair our ability to manage our business and could expose our insurance subsidiaries to significant losses.
General Risks Faced by Us
Investors’ interests may be diluted and investors may suffer dilution in their net book value per share if we issue additional shares or raise funds through the sale of equity securities.
Our constating documents authorize the issuance of our common shares, class A common shares and class A preference shares, issuable in series. In the event that we are required to issue any additional shares or enter into private placements to raise financing through the sale of equity securities, investors’ interests in us will be diluted and investors may suffer dilution in their net book value per share depending on the price at which such securities are sold. If we issue any such additional shares, such issuances will also cause a reduction in the proportionate ownership of all other shareholders. Further, any such issuance may result in a change of control of our company.
Our constating documents contain indemnification provisions, and we have entered into agreements indemnifying our officers and directors against all costs, charges and expenses incurred by them.
Our constating documents contain indemnification provisions, and we have entered into agreements with respect to the indemnification of our officers and directors against all costs, charges and expenses, including amounts payable to settle actions or satisfy judgments, actually and reasonably incurred by them, and amounts payable to settle actions or satisfy judgments in civil, criminal or administrative actions or proceedings to which they are made a party by reason of being or having been a director or officer of our company. Such limitations on liability may reduce the likelihood of litigation against our officers and directors and may discourage or deter shareholders from suing our officers and directors based upon breaches of their duties to us, though such an action, if successful, might otherwise benefit us and our shareholders.
Certain factors may inhibit, delay or prevent a takeover of our company, which may adversely affect the price of our common shares.
Certain provisions of our charter documents and the corporate legislation which govern us may discourage, delay or prevent a change of control or changes in our management that shareholders may consider favourable. Such provisions include authorizing the issuance by our board of directors of preferred stock in series, providing for a classified board of directors with staggered, three-year terms and limiting the persons who may call special meetings of shareholders. In addition, theInvestment Canada Actimposes certain limitations on the rights of non-Canadians to acquire our common shares, although it is highly unlikely that this will apply. If a change of control or change in management is delayed or prevented, the market price of our common shares could decline.
| |
| ITEM 4: | Information on the Company |
| |
| A. | History and Development of the Company |
Corporate Information
We are a corporation organized under the laws of the Province of British Columbia, Canada. We were originally incorporated in June 1951 by letters patent issued pursuant to theCompanies Act of 1934 (Canada). We were continued
13
under theCanada Business Corporations Actin March 1980, under theBusiness Corporations Act(Yukon) in August 1996 and under theBusiness Corporations Act(British Columbia) in November 2004. Our name was changed from “MFC Bancorp Ltd.” to “KHD Humboldt Wedag International Ltd.” on October 28, 2005 and, in connection with the divestiture of our Industrial Business, to “Terra Nova Royalty Corporation” on March 30, 2010.
Our principal office is located at Suite 1620 – 400 Burrard Street, Vancouver, British Columbia, Canada V6C 3A6 and the telephone number is(604) 683-8286. Our registered office is located at Suite 1000 – 925 West Georgia Street, Vancouver, British Columbia, Canada, V6C 3L2.
General
We are active in a broad spectrum of activities related to the integrated combination of commodities and resources, which includes commodity trading and our resource interests and merchant banking, which includes trade finance, financial services and proprietary investing. Until the first quarter of 2010, we were also active in the Industrial Business through our interest in KHD Humboldt Wedag International (Deutschland) AG, referred to as “KID”. Our former Industrial Business supplied plant systems as well as machinery and equipment worldwide for the manufacture of cement, whether for new plants, redevelopments of existing plants or capacity increases for existing plants. It also designed and provided equipment that produced clinker and cement and offered basic engineering, detail engineering, plant and equipment for complete plants and plant sections. In the fourth quarter of 2009, we considered the merits of dividing our Industrial Business into a separate publicly-traded company. Our board considered the feasibility, benefits and other considerations of dividing the Industrial Business into a separate, stand-alone entity, including implications for our shareholders, potential market reaction and the financial viability after giving effect to such a transaction. Following consideration of such factors, our board subsequently determined that such a separation would be beneficial to our shareholders and, during the course of 2010, we distributed our shares of KID to our shareholders. Upon the distribution to our shareholders of our Industrial Business, we operated primarily in the royalty and resources business.
In connection with our long-term strategic plans, involving internal growth initiatives, acquisitions or business combinations, we seek out and evaluate strategic acquisition candidates. As a result of the deconsolidation of our Industrial Business, our board reviewed opportunities and strategic alternatives to enhance shareholder value in light of our then focus on the resources business. In the third quarter of 2010, our board of directors gave serious consideration as to whether or not a business combination with Mass could be accomplished on favourable terms. Mass was engaged in the commodities, merchant banking and proprietary investment business. In the fourth quarter of 2010, we acquired all of the outstanding shares of Mass and consolidated its results of operations from November 16, 2010.
Recent Developments
The following is a summary of selected key developments in our business that occurred in 2010 and the start of 2011.
Separation of the Industrial Business
On March 30, 2010, we effected a reorganization and plan of arrangement, referred to as the “Arrangement”, pursuant to which, among other things, we distributed a portion of our interest in KID, which held our Industrial Business, to our shareholders and ceased to consolidate KID as at March 31, 2010.
Pursuant to the terms of the Arrangement, among other things, our shareholders received one share of KID for every three and one-half of our common shares held (calculated after atwo-for-one forward split of KID). As a result, we distributed approximately 26% of KID’s outstanding shares (at such time) to our shareholders. In connection with the Arrangement, we entered into a shareholder agreement with another corporate shareholder of KID, referred to as the “Custodian”, dated March 27, 2010, pursuant to which we engaged the Custodian to direct the voting of the remainder of our holdings of KID shares. As a result, and given that we did not share any common directors or officers with KID, we no longer considered KID a subsidiary and ceased to consolidate it as at March 31, 2010.
In 2010, we distributed the balance of the KID shares held by us to our shareholders as follows:
| | |
| | • | approximately 23% of the total issued shares of KID (at such time) were distributed to our shareholders of record on July 1, 2010 by way of apro-rataspecial dividend on the basis of one common share of KID for every four of our common shares held; |
14
| | |
| | • | approximately 29% of the total issued shares of KID (at such time) were distributed to our shareholders of record on September 23, 2010, by way of apro-ratareturn of capital on the basis of one common share of KID for every four of our common shares held; and |
| |
| | • | approximately 19.3% of the total issued shares of KID (at such time) were distributed to our shareholders of record on December 31, 2010, by way of apro-ratareturn of capital on the basis of one share of KID for every ten of our common shares held. |
Rights Offering
On July 27, 2010, we announced a rights offering, referred to as the “Rights Offering”, pursuant to which each holder of our common shares of record as of August 6, 2010 received one transferable right, referred to as a “Right”, for every common share held as of such date. Every four Rights entitled a holder to purchase one common share at a price of $6.60. The Rights Offering expired on September 2, 2010, and on September 8, 2010 we announced that the Rights Offering was oversubscribed, with subscriptions and requests for oversubscription amounting to over twice the amount we offered for sale. A total of 7,571,227 of our common shares, representing approximately 25% of our issued and outstanding common shares, as of September 8, 2010, were issued under the Rights Offering pursuant to the subscription privileges, representing total gross proceeds of approximately $50.0 million.
Acquisition of Mass Financial Corp.
On September 27, 2010, we announced that we had entered into an agreement with Mass and our wholly-owned subsidiary, which provided for our acquisition of Mass by way of a multi-step transaction, including a tender offer for all of the outstanding common shares of Mass, referred to as the “Offer”, and the subsequent amalgamation of Mass with our wholly-owned subsidiary. The Offer was made on October 7, 2010 on the basis of one of our common shares for each common share of Mass. The Offer expired on November 8, 2010 and, pursuant thereto, we acquired approximately 93% of the outstanding common shares of Mass, excluding Mass shares already held by us. We completed our acquisition of Mass by effecting a compulsory acquisition of the Mass shares not tendered under the Offer pursuant to applicable laws and, subsequently, caused the amalgamation of Mass and our wholly-owned subsidiary in December 2010. As a result of the successful Offer, we commenced consolidating Mass’s operations, including its commodities and merchant banking activities from November 16, 2010.
Cash Dividend Policy
On January 10, 2011, we announced that our board of directors had adopted an annual dividend policy, providing for an annual dividend based on the annual dividend yield of the New York Stock Exchange, referred to as the “NYSE”, Composite Index for the preceding year plus 25 basis points. On the same date, we announced an annual cash dividend for 2011 of $0.20 per common share, payable in four quarterly instalments. The first dividend payment of $0.05 per share was made on January 31, 2011 to shareholders of record on January 20, 2011. On March 15, 2011, we announced that the second 2011 cash dividend payment of $0.05 per share would be made on April 11, 2011 to shareholders of record on March 31, 2011.
As a result of the acquisition of Mass, we are now active in a broad spectrum of activities related to the integrated combination of commodities and resources, commodities trading and our resource interests and merchant banking, including trade finance, financial services and proprietary investing.
Business Segments
Our business is divided into three reportable segments: (i) commodities and resources, which includes our mineral and royalty interests and commodities trading activities; (ii) merchant banking, which includes our trade finance, financial services and proprietary investing activities; and (iii) other, which encompasses our corporate and other investments and business interests.
15
Commodities and Resources
Our commodities and resources operations include our integrated commodities trading activities and our mineral interests. We conduct trading primarily through our subsidiaries based in Vienna, Austria and supply various commodities, including minerals and metals, chemical and plastics and wood products to our customers. Such commodities originate either from our directly or indirectly held interests in resource projects or are secured by us from third parties. Our commodities trading activities are globally focused. We also derive production royalty revenue from a miningsub-lease of the lands upon which the Wabush iron ore mine is situated.
Through our commodities and resources business, we also provide logistics and other services to producers and consumers of commodities. These activities are supported by strategic direct or indirect investments in natural resource assets operating in our core commodities, including the production of plastics, non-ferrous metals and minerals, including iron ore.
Our commodities trading activities include purchasing, selling and conducting product swaps of various commodities. To a lesser extent, we also act as a trading agent for our clients. Our trading activities often utilize innovative trading strategies and structures. We currently trade with commodity and other producers who are unable to effectively realize sales due to their specific circumstances.
Generally we purchase or produce the underlying commodity and sell it to an end buyer or further trade it for another commodity which will subsequently be sold. Further, commodity producers and end customers often work with us to better manage their internal supply, distribution risk, and currency and capital requirements. In such trading activities, we try to capture various trading, financing and currency spreads. Through our trading activities, we have been able to develop ongoing relationships with commodity producers, end customers and trade financiers and integrate them into our financial activities.
Through our commodities trading activities, we have sourced, supplied and traded, primarily for our own account, the following commodities:
| | | | | |
Metals and Minerals | | Chemicals and Plastics | | Wood Products |
| • iron-ore; | | • general purpose polystyrene; | | • pulp and saw logs; |
| • bauxite; | | • high density polyethylene; | | • round logs; |
| • manganese-ore; | | • linear low density polyethylene; | | • sawn timber; |
| • cobalt; | | • low density polyethylene; | | • plywood; |
| • base metals; | | • polyethylene terephthalate; | | • medium density fiberboard; and |
| • magnesium; | | • polypropylene; and | | • wood pellets. |
| • steel products; | | • polyvinyl chloride. | | |
| • zinc alloys; | | | | |
| • aluminum foils and sheets; | | | | |
| • coal; | | | | |
| • clinker; | | | | |
| • cement; | | | | |
| • ferrous alloys; and | | | | |
| • silicon metals | | | | |
We generally source commodities from Asia, Africa, Europe, Australia, the United States and the Middle East. Our commodities sales include the European, Middle Eastern, Asian and North and South American markets.
In the polyethylene terephthalate, referred to as “PET”, market, we source material from Malaysia, Taiwan, India and the Middle East. Through our agents in Europe and the United States, we sell PET on an outright basis, with a major portion of our PET sales being made to the pre-bottling industry in such regions. We have off-take agreements with sizeable polyvinyl chloride, referred to as “PVC”, and chemicals producers, which allow us to sell their products in the European market. Through an off-take agreement with a Southeast Asian supplier, we source and sell polymers mainly to the Middle Eastern markets as well as Germany and the United Kingdom.
16
Our trading activities are supported by our logistics and finance activities in order to provide cost effective and efficient transportation, as well as granting of payment terms for working capital requirements for our customers and partners.
Our commodities and resources business employs over 320 people worldwide. Our main marketing office is located in Vienna, Austria. In addition, we establish relationships with and seek to further market our products through agents located worldwide. Our marketing and investment activities in the commodities and resource sector are supported by a global network of agents and relationships. This network provides us with worldwide sourcing and distribution capabilities.
We have entered into agreements, through a subsidiary, with a third party leaseholder or an iron ore mine in Goa, India, pursuant to which the leaseholder has agreed to sell iron ore to our subsidiary at a fixed price per ton based on the extraction costs plus a royalty payment to the owner dependent upon the iron content of the iron ore. Pursuant to the agreements, our subsidiary has also been contracted to extract iron ore on behalf of the leaseholder at a fixed fee per ton. The initial term of the agreements expires on September 4, 2011 and our subsidiary has been granted the right to renew the agreements for three year terms until September 4, 2020.
We currently indirectly derive production royalty revenue from a miningsub-lease of the lands upon which the Wabush iron ore mine is situated in Newfoundland and Labrador, Canada. Thissub-lease commenced in 1956 and expires in 2055. The lessor is Knoll Lake Minerals Ltd., referred to as “Knoll Lake Minerals”, which holds a direct mining lease from the Province of Newfoundland and Labrador. The mine is currently operated by Cliffs Natural Resources Inc., referred to as “Cliffs”. Iron ore is shipped from the Wabush iron ore mine to Pointe Noire, Québec, Canada, where it is pelletized. In 2010, 2009 and 2008, 3.8 million, 3.2 million and 4.0 million tons of iron pellets, respectively, were shipped from Pointe Noire. Such shipments are subject to seasonal and cyclical fluctuations.
Pursuant to the terms of the miningsub-lease, the royalty payment is not to be less than CDN$3.25 million per annum until its expiry. In 1988, the royalty rate was amended to require a base royalty rate of CDN$1.685 per ton with escalations as defined in thesub-lease. We are indirectly obligated to make royalty payments of CDN$0.22 per ton on shipments of iron ore pellets from Pointe Noire, Québec, to Knoll Lake Minerals, which holds the direct lease over the Wabush mine property with the Province of Newfoundland and Labrador. Cliffs applies a portion of the royalty payments under thesub-lease to make such royalty payments to Knoll Lake Minerals on our behalf.
The Wabush royalty is paid quarterly and is based on the tonnage of iron ore pellets shipped from Pointe Noire, Quebec. One of the major components in the calculation of the Wabush royalty rate payable is based on the most recently published prices of a basket of five particular iron ore pellets, only two of which were published in the latter part of 2010.
Historically, iron-ore benchmark prices were determined in the first quarter of the calendar year through negotiations between the major producers and their most significant customers. These prices were then generally adopted by the other suppliers when published.
The significant increase in benchmark prices from 2007 to 2008 was resisted by the major Chinese steel mills in particular, who also refused to accept the lowered benchmark pricing offered in 2009. This led many major iron ore suppliers to move away from the annual international benchmark pricing mechanism that had been prevalent in the industry and in many customer supply agreements. This resulted in a shift in the industry towards shorter term pricing arrangements linked more closely to the spot market. In 2010, major iron ore producers moved to quarterly benchmark pricing which culminated in the negotiation of proprietary pricing agreements with specific customers that were not published.
This shift in the marketplace has, among other things, made obsolete certain of the world iron ore pellet pricing methodology for calculating the royalty rate due to us contained in oursub-lease for the Wabush iron mine. As a result of these market changes, and as thesub-lease permits us to renegotiate an increase in the royalty rates when the mine achieves certain profitability thresholds, which we believe have been obtained, we have served the mine owner with notice of arbitration respecting our entitlement to a new base rate for the royalty. We have also provided the mine owners notice of arbitration seeking recovery for royalty underpayments in 2010. The outcome of such proceedings cannot be determined at this time.
Iron ore is typically sold either as a concentrate, whereby the iron ore is in granular form, or as a pellet, whereby iron ore concentrate has been mixed with a binding agent, formed into a pellet and then fired in a furnace. Iron ore pellets can be charged directly into blast furnaces without further processing and are primarily used to produce pig iron which is subsequently transformed into steel. As such, the demand and, consequently the pricing of iron ore are dependent upon the raw material requirements of integrated steel producers. Demand for blast furnace steel is in turn cyclical in nature and is influenced by, among other things, the level of global economic activity.
17
The Wabush iron ore mine is operated by Cliffs, who on February 1, 2010 announced that it had acquired the interests of its other joint venture partners in the mine. Under the miningsub-lease, Cliffs pays royalties to the holder of the royalty interest based upon the amount of iron ore pellets shipped. One of the major components in the calculation of the Wabush royalty rate payable is based on the most recently published prices of a basket of five particular iron ore pellets. Although there can be no assurance as to future production levels, our management believes that since the operator is now also the sole owner of the Wabush iron ore mine, production from the mine will generally be maintained at relatively consistent levels, subject to market conditions.
The following highlights selected key developments relating to our royalty interest in the Wabush iron ore mine in 2010:
| | |
| | • | we received a favorable decision from the arbitration panel relating to our claims against the mine owners and received an award for an aggregate royalty underpayment of approximately CDN$11.7 million. We are currently seeking to recover interest and expenses of approximately CDN$4.0 million. |
| |
| | • | the current royalty rate went up to CDN$6.63 per ton in the fourth quarter from CDN$6.57, CDN$5.96 and CDN$5.16 per ton, for the third, second and first quarters of 2010, respectively; |
| |
| | • | the fourth quarter of 2010 showed a slightly lower than average tons shipped, primarily related to approximately 18 days of scheduled maintenance taken by the mine operator; |
| |
| | • | we have given notice pursuant to our rights under the terms of the lease agreement underlying the Wabush royalty to renegotiate the royalty rate; and |
| |
| | • | the operator of the Wabush mine has indicated planned capital expenditures for 2011 of approximately $40.0 to $45.0 million for conversion of the production lines to reduce manganese, an additional $30.0 million for other equipment upgrades and replacement and approximately $30.0 million for environmental matters. |
The following table sets forth historical total iron ore shipments (which include pellets, chips and concentrates) and royalty payments to us based upon the amounts reported to us by the Wabush mine operator:
| | | | | | | | | | | | | | | | | | | | | | | | | | | | | |
| | | | | | | | | | | | | | | Gross
|
| | | | | | | | | | | | | | | Average
|
| | | | | | | | | | | Total
| | Gross
| | Royalty
|
| | | Tonnage Shipped | | Tonnage
| | Royalties
| | Rate/Ton
|
Year | | Q1 | | Q2 | | Q3 | | Q4 | | Shipped | | Received(1) | | Received |
| | | (In thousands, other than the Royalty Rate) |
| | | (All monetary amounts in Canadian dollars) |
| |
| 2005 | | | 789 | | | | 1,392 | | | | 1,299 | | | | 982 | | | | 4,462 | | | $ | 13,736 | | | $ | 3.08 | |
| 2006 | | | 751 | | | | 1,296 | | | | 942 | | | | 1,289 | | | | 4,278 | | | | 16,393 | | | | 3.83 | |
| 2007 | | | 472 | | | | 1,607 | | | | 1,591 | | | | 1,339 | | | | 5,009 | | | | 22,357 | | | | 4.46 | |
| 2008 | | | 694 | | | | 1,437 | | | | 1,117 | | | | 705 | | | | 3,953 | | | | 31,288 | | | | 7.91 | |
| 2009 | | | 402 | | | | 386 | | | | 1,202 | | | | 1,198 | | | | 3,188 | | | | 17,350 | | | | 5.44 | |
| 2010 | | | 874 | | | | 941 | | | | 832 | | | | 1,105 | | | | 3,752 | | | | 22,915 | (2) | | | 6.11 | |
Average Shipments (Tons) | | | 664 | | | | 1,177 | | | | 1,164 | | | | 1,102 | | | | 4,107 | | | | | | | | | |
Notes
| | |
| (1) | | Subject to a 20% resource property revenue tax. |
| |
| (2) | | Does not include the amount of arbitration award. |
Merchant Banking
Our merchant banking operations include merchant banking and financial services, including specialized banking, corporate finance, trade finance and other services, proprietary investing and our real estate and investment properties. We seek to invest in many industries, emphasizing those business opportunities where the perceived intrinsic value is not properly recognized.
We use our financial and management expertise to add or unlock value within a relatively short time period. Our merchant banking activity is generally not passive and we seek investments where our financial expertise and
18
management can add or unlock value. Proprietary investments are generated and made as part of our overall merchant banking activities and are realized upon over time, sometimes taking more than one year. In addition, we often seek to acquire interests or establish relationships with commodity producers to realize upon potential synergies. Such interests can be acquired through purchases of, or investments in, commodity producers, or through contractual arrangements with them, including off-take agreements. The investments we make in commodity producers are part of our merchant banking strategy.
Our activities include making proprietary investments through investing our own capital and utilizing our expertise to capture investment opportunities. We seek to invest in businesses or assets whose intrinsic value is not properly reflected in their share or other price. Often such investments are in companies or assets that are under financial, legal or regulatory distress and our services include resolving such distress. Our investing takes many forms and can include acquiring entire businesses or portions thereof, investing in equity, investing in the existing indebtedness (secured and unsecured) of a business or in new equity or debt issues. Our investing is generally not passive and we invest where we believe our expertise in financial restructuring and management and complementary trading and corporate finance capabilities can add or unlock value. Our investing in distressed businessesand/or assets can result in complex and intricate legal issues relating to priorities, claims and other rights of stakeholders. Such issues can result in our being involved in legal and other claims as part of our overall proprietary investment strategy. Our proprietary investments are often made as a part of, or complementary to our commodity and resources trading activities.
We consider investment opportunities where: (i) our existing participation in the marketing and production of commodities provides expert insight; (ii) we can obtain a satisfactory return of future capital investment; and (iii) such investment integrates with our business. Our philosophy is to utilize our financial strength to realize the commercial potential of assets in markets where we have a comprehensive understanding of the drivers of value.
Our merchant banking operations provide innovative finance services for corporate and trade finance transactions. We focus on meeting the financial needs of small to mid-sized companies and other business enterprises primarily in Europe and Asia. We believe that many of these clients are underserviced by the large global investment banks and financial service providers. We specialize in advising and structuring business enterprises involved in unstructured and novel situations where a strong financial partner is needed and traditional,off-the-shelf solutions are not workable.
In addition, we utilize our established relationships with international financial institutions, credit insurance and factoring companies to provide flexible customized financial tools, extensive credit and risk management and structured finance to our customers. Working closely with our customers, our professional staff arranges support of hedging and trading of materials, arrangements of financing and risk management solutions.
Our merchant banking activities also include leveraging our trading and financial experience and relationships to provide trading services, such as transportation and logistics, and trade finance services to our trading customers.
Our merchant banking business generates revenues in the form of corporate and trade finance service fees and interest income. We also realize gains from time to time on our proprietary investments, upon their sale, upon the execution of an equity or debt restructuring, or the completion of other forms of divestment.
Through our acquisition of Mass in November 2010, we acquired an indirect 52.9% interest in Canoro Resources Ltd., referred to as “Canoro”, which operated certain oil and gas interests in India. Prior to our consolidation of Mass, Canoro’s interests in such assets were terminated by the governmental regulator. The matter is currently subject to arbitration and appeal, the outcome of which cannot be determined at this time. As a result, we have not recognized such oil and gas interests in our statement of financial position as at December 31, 2010.
Other
Our other segment includes our corporate and investments, which include financing joint ventures through our Shanghai-based subsidiary which provides medical equipment and supplies. Specifically, such subsidiary is engaged in the operation of eye care centers through joint ventures with government-controlled hospitals in China. Under such joint ventures, the hospitals provide the necessary space and medical staff to operate the centers, and our subsidiary provides the centers with specialized medical equipment and supplies, training and supervision with respect to certain surgical procedures. We retain ownership of the equipment we supply to the centers during the term of such joint ventures. We also sell and service medical equipment.
19
Company Strategy
Our primary and over-riding business objective is to enhance value and create wealth for our shareholders. The key elements of our strategy include the following:
| | |
| | • | Investing in Undervalued Opportunities. We seek to invest in businesses or assets whose intrinsic value is not properly reflected in their share price, or where we perceive that our commodities and financial expertise and management can add or unlock value. These include investments in highly unstructured situations and in companies undergoing financial or operational stress. Such investments often involve severe time constraints, and given our liquid resources, we are well positioned to capitalize on such opportunities. Unlike traditional companies in the financial services sector, our investing is generally not passive. |
| |
| | • | Geographic Scope of Operations. We operate globally so we supply a diversified range of commodities to our customers, develop new relationships with producers and consumers of commodities and selectively target new business and investment opportunities worldwide. |
| |
| | • | Strategic Investments. Strategic investments in resource assets are an important component of our commodities trading activities and value added services. We pursue selective strategic acquisitions and alliances to support and strengthen our commodities operations as and when opportunities arise. We will continue to apply our investment criteria to our acquisitions, pursuing investments in assets that are of strategic importance to our core businesses. At the same time, we continue to evaluate dispositions of investments or assets, in particular when they are no longer deemed to support our core business or when attractive selling opportunities arise. |
| |
| | • | Create Shareholder Value. The nature of our business is cyclical and affected by several factors that do not lend themselves to regular evaluation. Therefore, we do not evaluate our performance and do not believe we should be scrutinized in terms of ourprice-to-earnings multiple. We seek to grow our asset base and net worth and believe these are the best valuation measures for our business. |
| |
| | • | Financial Profile. We seek to maintain our fiscal profile so we can access necessary financing on competitive terms. In addition, we believe our fiscal approach helps us to manage acquisition risks and maintain a high level of liquidity. |
| |
| | • | Risk Approach. We have adopted policies intended to mitigate and manage commodity price and counterparty risks associated with our commodities trading activities. For example, a substantial portion of our inventory of commodities is at any time under contract for sale at a pre-determined price. We also reduce the risk of non-payment by customers by imposing limits on open accounts extended to creditworthy customers and imposing credit support requirements for other customers. |
Competitive Strengths
We believe that our competitive strengths include the following:
| | |
| | • | International Capabilities. Unlike other similarly sized companies, we have sought to develop a broad geographic scope rather than focusing on any one particular market. While many of our larger competitors have greater presences in more international markets, including merchant and investment banks, trading firms, brokerage firms, commercial banks and hedge funds, we believe our smaller size and collegiality allow us to work as a team on cross-border transactions better than many of our competitors. |
| |
| | • | Liquidity. Liquidity is of critical importance to companies in the merchant banking industry and commodities and resources business and is key to strategic acquisitions to further expand and support our commodities and resources business. We therefore maintain liquidity in order to be able to capitalize on business opportunities in time sensitive transactions, fund our core businesses to continue to generate revenues, and fund a broad range of potential cash outflows in stressed environments, including financing obligations. Our approach to liquidity allows us to meet immediate obligations without needing to sell other assets or depend on additional funding from credit-sensitive markets, and affords us significant flexibility in structuring our affairs and managing through difficult funding environments. Historically, we have funded our businesses with cash generated from our operations. |
| |
| | • | Independence. We are an independent company managed by our directors and officers, rather than part of a larger, diversified financial services institution. Such financial services companies can develop conflicts with their |
20
| | |
| | | clients due to the large number of customers they service, their own investment and trading position and the broad range of products and services they offer. We believe that awareness of these potential conflicts has heightened and that such awareness has resulted in increased opportunities for independent firms like us in respect of merger, acquisition, restructuring and similar transactions. |
| | |
| | • | Management. We believe that our management has expertise in the commodities and resources and merchant banking industries, including critical expertise with respect to our specialized financial services and corporate finance services internationally, including on corporate restructurings and mergers and acquisitions. |
| |
| | • | Integrated Service Approach. We believe our logistics and financing activities allow us to provide a full-service solution to our commodities trading customers and suppliers. We are able to provide our customers and suppliers assistance with transportation and logistics as well as trading, hedging, financing and risk management services. |
| |
| | • | Operating Structure Allows Prompt Response to Investment Opportunities. We have a lean operating structure and are therefore able to quickly assess whether a business venture represents an appropriate investment for us, responding promptly to all desirable business opportunities. We carefully select the business opportunities we investigate and do not move forward unless we have a high level of confidence that the opportunities fit within our objectives and core competencies. |
Competitive Conditions
All segments of our business are intensely competitive, and we expect them to remain so.
Our operations are relatively small compared to our competitors. Many of our competitors have far greater financial resources, a broader range of products and services, larger customer bases, greater name recognition and marketing resources, a larger number of senior professionals to serve their clients’ needs, greater global reach and more established relationships with clients than we do. These competitors may be better able to respond to changes in business conditions, to compete for skilled professionals, to finance acquisitions, to fund internal growth and to compete for market share generally. Further many companies are engaged in the acquisition of resource interests. We may also be at a competitive disadvantage in acquiring such properties and interests as many competitors may have greater financial resources and technical staff. Accordingly, there can be no assurance that we will be able to compete successfully against other companies in acquiring additional interests and resource properties.
The scale of our competitors in the merchant banking business has increased in recent years as a result of substantial consolidation among companies, especially in the banking and financial industries. These firms have the ability to offer a wider range of products than we do which may enhance their competitive position. They also have the ability to support their businesses with other services such as commercial lending in an effort to gain market share, which has resulted, and could further result, in pricing pressure in our businesses.
We believe that our experience and operating structure permit us to respond more rapidly to our clients’ needs than many of our larger competitors. These traits are important to small and mid-sized business enterprises, many of which do not have large internal corporate finance departments to handle their capital requirements. We develop a partnership approach to assist clients. This often permits us to develop multiple revenue sources from the same client. For example, we may purchase and sell a client’s products, or commit our own capital to make a proprietary investment in its business or capital structure.
21
| |
| C. | Organizational Structure |
The following table describes our direct and indirect significant subsidiaries as at the date hereof, their respective jurisdictions of organization and our beneficial interest in respect of each subsidiary. The table excludes subsidiaries which only hold inter-company assets and liabilities and do not have any active business.
| | | | | | | |
| | | Country of
| | Beneficial
|
| | | Incorporation | | Interest(1) |
| |
| M Financial Corp. | | Barbados | | | 100 | % |
| MFC Commodities GmbH | | Austria | | | 100 | % |
| MFC Trade & Financial Service GmbH | | Austria | | | 100 | % |
| IC Management Service GmbH | | Austria | | | 100 | % |
| Global Bulk Transport GmbH | | Austria | | | 100 | % |
| International Trade Service GmbH | | Austria | | | 100 | % |
| Magnum Minerals Private Limited | | India | | | 100 | % |
| AFM Aluminiumfolie Merseberg GmbH | | Germany | | | 55 | % |
| MAW Mansfelder Alumiumwerk GmbH | | Germany | | | 55 | % |
| MFC(A) Ltd | | Marshall Islands | | | 100 | % |
| MFC(D) Ltd | | Marshall Islands | | | 100 | % |
| Brock Metals s.r.o. | | Slovakia | | | 100 | % |
| MFC Corporate Services AG | | Switzerland | | | 100 | % |
| Mednet (Shanghai) Medical Technical Developing Co., Ltd | | China | | | 90 | % |
| Chongqing Lasernet Guangji Eye Hospital (a limited company) | | China | | | 52 | % |
| Hangzhou Zhe-er Optical Co. Ltd | | China | | | 46 | % |
| MFC Metal Trading GmbH | | Austria | | | 100 | % |
| MEG International Services Ltd | | Canada | | | 100 | % |
Note
| | |
| (1) | | Percentages rounded to nearest whole number. |
| |
| D. | Property, Plants and Equipment |
Office Space
Our principal office is located at Suite 1620 — 400 Burrard Street, Vancouver, British Columbia, Canada V6C 3A6. We also maintain offices in Vienna, Austria, Hong Kong and Shanghai, China and Goa, India.
We believe that our existing facilities are adequate for our needs through the end of the year ending December 31, 2011. Should we require additional space at that time, or prior thereto, we believe that such space can be secured on commercially reasonable terms.
Royalty Interest
We participate in a royalty interest which consists of a miningsub-lease of the lands upon which the Wabush iron ore mine is situated. For a discussion of the royalty interest, see “Item 4: Information on the Company — B. Business Overview — Business Segments — Commodities and Resources”.
| |
| ITEM 4A: | Unresolved Staff Comments |
None.
22
| |
| ITEM 5: | Operating and Financial Review and Prospects |
The following discussion and analysis of our financial condition and results of operations for the fiscal years ended December 31, 2010 and 2009 should be read in conjunction with our audited consolidated financial statements and related notes included in this annual report onForm 20-F. Our financial statements included in this annual report onForm 20-F were prepared in accordance with IFRS. We adopted IFRS as of January 1, 2010. The impact of the transition from Canadian generally accepted accounting principles to IFRS is explained in Note 36 to the audited consolidated financial statements included in this annual report onForm 20-F.
General
We are an integrated commodities and resources and merchant banking company and conduct our operations internationally. Our activities include the supply and sale of commodities. We also commit our own capital to promising enterprises and invest and otherwise trade to capture investment opportunities for our own account. We seek to invest in businesses or assets whose intrinsic value is not properly reflected in their share price or value. Our investing is generally not passive. We actively seek investments where our financial expertise and management can add or unlock value.
Our results of operations have been and may continue to be affected by many factors of a global nature, including economic and market conditions, the availability of capital, the level and volatility of equity prices and interest rates, currency values, commodity prices and other market indices, technological changes, the availability of credit, inflation and legislative and regulatory developments. Our results of operations may also be materially affected by competitive factors. Competition includes firms traditionally engaged in merchant banking and financial services such as merchant and investment banks, along with other capital sources such as hedge funds, private equity firms and insurance companies, and other trade companies engaged in commodities in Europe, Asia and globally.
Our results of operations for any particular period may also be materially affected by our realization on proprietary investments. These investments are made to maximize total return through long-term appreciation and recognized gains on divestment. We realize on our proprietary investments through a variety of methods including sales, capital restructuring or other forms of divestment.
A majority of our revenues has traditionally been derived from resources, commodities sales and trade and financial services. The remaining portions are generally derived from sales of properties and net realized and unrealized gains on securities.
Business Environment
Our financial performance is, and our consolidated results in any period can be, materially affected by global economic conditions and financial markets generally.
Our favourable business environment is characterized by many factors, including a stable geopolitical climate, transparent financial markets, low inflation, low interest rates, availability of credit, low unemployment, strong business profitability and high business and investor confidence. Unfavourable or uncertain economic and market conditions can be caused by declines in economic growth, business activity or investor or business confidence, limitations on the availability or increase in the cost of credit and capital, increases in inflation, interest rates, exchange rate volatility, outbreaks of hostilities or other geopolitical instability, corporate, political or other scandals that reduce investor confidence in the capital markets, or a combination of these or other factors.
Commencing in mid-2008 and continuing through most of 2009, the macro business environment for many of our activities was extremely challenging. During such period, capital and securities markets generally were materially and adversely affected by significant declines in the values of nearly all investment classes and by a serious lack of liquidity. The global markets were characterized by substantially increased volatility and an overall loss of investor confidence, initially in financial institutions, but later in companies in a number of other industries and in the broader markets. The decline in asset values has caused increases in margin calls for investors, requirements that derivatives counterparties post additional collateral and redemptions by mutual and hedge fund investors, all of which have increased the downward pressure on asset values and outflows of funds across the financial services industry. In addition, increased redemptions and unavailability of credit caused hedge funds and other investors to rapidly reduce leverage, which has increased volatility and further contributed to the decline in asset values.
23
Although economic conditions recovered through 2010, such recovery remains generally weak and the pace of recovery is still uncertain. There can be no assurance that these economic conditions will continue to improve in the near term.
Operating Results
We are active in a broad spectrum of activities related to the integrated combination of commodities and resources and merchant banking. Our business is divided into three reportable segments: (i) commodities and resources, which includes our commodities trading activities and mineral and royalty interests; (ii) merchant banking, which includes trading, trade finance, logistics and financial services and proprietary investing activities; and (iii) other, which encompasses our corporate and other investments and business interests, including our medical supplies and servicing business and corporate.
During the third quarter of 2010, our board of directors began evaluating the benefits of acquiring Mass and integrating its commodities trading and merchant banking business with our increased focus on mineral royalties and resources interests. On September 27, 2010, we announced that we had entered into an agreement with Mass and our wholly-owned subsidiary, which provided for our acquisition of Mass by way of the Offer and the subsequent amalgamation of Mass and our wholly-owned subsidiary. The Offer was made on October 7, 2010 on the basis of one of our common shares for each common share of Mass. Pursuant to the Offer, we acquired approximately 93% of the outstanding shares of Mass other than shares held by us and our affiliates. Accordingly, we consolidated Mass from November 16, 2010. Subsequently, we completed our acquisition of Mass by effecting a compulsory acquisition of the Mass shares not tendered under the Offer pursuant to applicable laws, and caused the amalgamation of Mass with our wholly-owned subsidiary in December 2010.
As a result of the economic and competitive factors discussed above, our results of operations may vary significantly from period to period. We intend to manage our business for the long-term and to mitigate the effects of such factors by focusing on our core operations.
Discontinued Operations
Until March 30, 2010, we also operated in the Industrial Business through KID. As at March 30, 2010, we effected the Arrangement pursuant to which, among other things, we distributed approximately 26% of the outstanding shares of KID (at such time) to our shareholders and ceased to consolidate KID as at March 31, 2010. We distributed the substantial balance of our interest in KID over the course of 2010.
The disposition of our former Industrial Business in 2010 resulted in the Industries Business being accounted for as discontinued operations. Accordingly, prior period financial statements have been reclassified to reflect this change. Please refer to the discussion in Note 4 to our consolidated annual financial statements included in this annual report. Because we are reclassifying prior years’ financial statements for the presentation of discontinued operations, our reported results including, among other things, earnings and earnings per share, may not be consistent with that which was originally presented.
24
Summary of Quarterly Results
The following tables provide selected financial information for the most recent eight quarters presented in accordance with IFRS:
| | | | | | | | | | | | | | | | | |
| | | December 31,
| | September 30,
| | June 30,
| | March 31,
|
| | | 2010(1) | | 2010 | | 2010 | | 2010 |
| | | (United States dollars in thousands, except per share amounts) |
| |
| Net sales | | $ | 57,006 | | | $ | 17,622 | | | $ | 5,836 | | | $ | 4,012 | |
| Equity income | | | 954 | | | | — | | | | — | | | | — | |
| Total revenues | | | 57,960 | | | | 17,622 | | | | 5,836 | | | | 4,012 | |
Net income (loss) from continuing operations(2) | | | 46,565 | | | | 71 | | | | 1,004 | | | | (1,801 | ) |
| Basic earnings (loss) from continuing operations, per share | | | 0.92 | | | | 0.00 | | | | 0.03 | | | | (0.06 | ) |
| Diluted earnings (loss) from continuing operations, per share | | | 0.92 | | | | 0.00 | | | | 0.03 | | | | (0.06 | ) |
Net income (loss)(2) | | | 46,374 | | | | 4,941 | | | | (1,721 | ) | | | (19,278 | ) |
| Basic earnings (loss), per share | | | 0.92 | | | | 0.15 | | | | (0.06 | ) | | | (0.64 | ) |
| Diluted earnings (loss), per share | | | 0.92 | | | | 0.15 | | | | (0.06 | ) | | | (0.64 | ) |
Notes
| | |
| (1) | | We consolidated the operations of Mass from November 16, 2010. |
| |
| (2) | | Net income attributable to our shareholders. |
| | | | | | | | | | | | | | | | | |
| | | December 31,
| | September 30,
| | June 30,
| | March 31,
|
| | | 2009 | | 2009 | | 2009 | | 2009 |
| | | (United States dollars in thousands, except per share amounts) |
| |
| Net sales and total revenues | | $ | 5,573 | | | $ | 4,914 | | | $ | 1,920 | | | $ | 2,311 | |
Net loss from continuing operations(1) | | | (1,483 | ) | | | (2,246 | ) | | | (11,049 | ) | | | (1,542 | ) |
| Basic loss from continuing operations, per share | | | (0.05 | ) | | | (0.07 | ) | | | (0.36 | ) | | | (0.05 | ) |
| Diluted loss from continuing operations, per share | | | (0.05 | ) | | | (0.07 | ) | | | (0.36 | ) | | | (0.05 | ) |
Net income (loss)(1) | | | 37,691 | | �� | | 5,883 | | | | (7,751 | ) | | | 849 | |
| Basic earnings (loss), per share | | | 1.25 | | | | 0.19 | | | | (0.26 | ) | | | 0.03 | |
| Diluted earnings (loss), per share | | | 1.25 | | | | 0.19 | | | | (0.26 | ) | | | 0.03 | |
Note
| | |
| (1) | | Net income attributable to our shareholders. |
25
Overview of 2010 Results Compared to 2009
The following table sets forth, for the periods indicated, certain key operating results and other financial information:
| | | | | | | | | |
| | | Year Ended December 31 |
| | | 2010(1) | | 2009 |
| | | (United States dollars in thousands, except per share amounts) |
| |
| Net sales | | $ | 84,476 | | | $ | 14,718 | |
| Gross revenues | | | 85,430 | | | | 14,718 | |
| Costs and expenses | | | 70,724 | | | | 22,763 | |
| Costs of sales | | | 49,352 | | | | 8,525 | |
| Selling, general and administrative expense | | | 18,316 | | | | 16,474 | |
Net income (loss) from continuing operations(2) | | | 45,839 | | | | (16,320 | ) |
Net income (loss) from discontinued operations(2) | | | (15,523 | ) | | | 52,992 | |
Net income(2) | | | 30,316 | | | | 36,672 | |
| Basic earnings (loss) per share: | | | | | | | | |
| Continuing operations | | | 1.28 | | | | (0.54 | ) |
| Discontinued operations | | | (0.43 | ) | | | 1.75 | |
| Diluted earnings (loss) per share: | | | | | | | | |
| Continuing operations discontinued operations | | | 1.28 | | | | (0.54 | ) |
| Discontinued operations | | | (0.43 | ) | | | 1.75 | |
Notes
| | |
| (1) | | We consolidated the operations of Mass from November 16, 2010. |
| |
| (2) | | Net income attributable to our shareholders. |
Year Ended December 31, 2010 Compared to the Year Ended December 31, 2009
The following is a breakdown of our total revenues by activity for each of the fiscal years ended December 31, 2010 and 2009:
| | | | | | | | | |
| | | December 31, | |
| | | 2010(1) | | | 2009 | |
| | | (United States dollars in thousands) | |
| |
Gross Revenues: | | | | | | | | |
| Commodities and resources | | $ | 76,478 | | | $ | 13,530 | |
| Proprietary investing | | | 4,821 | | | | — | |
| Other | | | 4,131 | | | | 1,188 | |
| | | | | | | | | |
| | | $ | 85,430 | | | $ | 14,718 | |
| | | | | | | | | |
Note
| | |
| (1) | | The operations of Mass were consolidated from November 16, 2010. |
26
The following charts illustrate geographic distribution of our revenues in 2010 and 2009:
Based upon the yearly average exchange rates for the year ended December 31, 2010, the United States dollar increased by approximately 4.7% in value against the Euro and decreased by approximately 9.8% in value against the Canadian dollar, compared to the yearly average exchange rates in 2009. As at December 31, 2010, the United States dollar had increased by approximately 7.0% against the Euro and decreased by 5.0% against the Canadian dollar since December 31, 2009.
Gross revenues for the fiscal year ended December 31, 2010 increased to $85.4 million (consisting of net sales of $84.5 million and equity income from medical joint ventures of $1.0 million) from $14.7 million (consisting wholly of net sales) in 2009, primarily as a result of the consolidation of Mass and its commodities operations from November 16, 2010 and increased shipments from the Wabush iron ore mine and the collection of underpayment of resource property royalties in prior years during 2010.
Gross revenues for our commodities and resources business were $76.5 million for the fiscal year ended December 31, 2010, compared to $13.5 million for the same period in 2009, primarily as a result of the consolidation of Mass and its commodities operations from November 16, 2010, increased shipments from the Wabush iron ore mine and the collection of underpayment of resource property royalties in prior years during 2010.
Gross revenues for our merchant banking business were $4.8 million for the fiscal year ended December 31, 2010, compared to $nil for the same period in 2009, primarily as a result of the consolidation of Mass from November 16, 2010.
Gross revenues for our other segment were $4.1 million for the fiscal year ended December 31, 2010, compared to $1.2 million for the same period in 2009, primarily as a result of the consolidation of Mass’s operations from November 16, 2010.
During 2010, income generated by the Wabush royalty increased to approximately $31.7 million from approximately $13.5 million in 2009. This increase in royalty income was mainly attributable to a higher royalty rate and increased shipments from Pointe Noire, Québec, and the collection of underpayment of resource property royalty of $11.2 million in prior years. A total of 3.8 tons and 3.2 tons of iron ore pellets were shipped from Pointe Noire, Québec by the Wabush iron ore mine during 2010 and 2009, respectively.
Costs of sales increased to $49.4 million during the fiscal year ended December 31, 2010 from $8.5 million for the same period in 2009, primarily as a result of the consolidation of Mass’s operations from November 16, 2010.
Selling, general and administrative expenses, excluding share-based compensation increased slightly to $18.3 million in 2010 from $16.5 million in 2009. The increase is primarily linked to increases in the professional fees on our projects and activities and the consolidation of Mass’s operations from November 16, 2010.
Share-based compensation expense was $72,000 in the year ended December 31, 2010, compared to $2.7 million recovered during the year ended December 31, 2009. The $72,000 expense in 2010 was due to a subsidiary’s stock option plan.
27
We incurred a loss on derivative contracts in the amount of $2.0 million for the fiscal year ended December 31, 2010 compared to $nil for the same period in 2009, primarily as a result of unfavourable changes in exchange rates on our currency contracts.
We incurred no loss or gain from the settlement of investment in preferred shares of former subsidiaries for the fiscal year ended December 31, 2010 compared to a loss of $9.5 million for the same period in 2009.
We recognized a gain of $41.1 million on negative goodwill during fiscal year ended December 31, 2010 in connection with the acquisition of Mass. The negative goodwill arose as the market price of our common shares on the acquisition dates was less than the fair value of the net identifiable assets acquired from Mass.
We recognized an income tax expense of $7.0 million (provision for income taxes of $0.2 million and provision for resource property taxes of $6.7 million) in 2010, compared to an income tax recovery of $4.5 million (recovery of income taxes of $7.5 million and resource property taxes of $3.0 million) in 2009. Our statutory tax rate was 28.5% in 2010, compared to 29% in 2009, and our effective tax rates are lower than our statutory tax rates. The increase in income tax expense was primarily a result of profitable operations in the current year, partially offset by non-taxable income. We paid $3.0 million cash in income tax (other than resource property revenue tax) in 2010, compared to $nil in 2009. The increase in income tax paid is mainly due to the withholding tax on dividends collected from KID in 2010 which had been reallocated to discontinued operations.
In 2010, our income from continuing operations was $45.8 million, or $1.28 per share on a basic and diluted basis. In 2009, our loss from continuing operations was $16.3 million, or $0.54 per share on a basic and diluted basis.
Liquidity and Capital Resources
General
Liquidity is of importance to companies in our businesses. Insufficient liquidity often results in underperformance and can even result in the failure of such businesses.
Our objective when managing capital is to safeguard our ability to continue as a going concern, generate revenues and realize upon strategic opportunities, even during adverse market conditions. We actively and regularly review and manage capital structure to ensure optimal shareholder returns when evaluating our capital structure. Our management takes into consideration future capital requirements and capital efficiency, prevailing and projected profitability, projected operating cash flows, projected capital expenditures and projected strategic investment opportunities.
Liquidity is of importance to companies in our businesses. Insufficient liquidity often results in underperformance and can even result in the failure of such businesses.
Our objectives when managing capital are: (i) to safeguard our ability to continue as a going concern so that we can continue to provide returns for shareholders and benefits for other stakeholders, (ii) to provide an adequate return to our shareholders by pricing products and services commensurately with the level of risk, and (iii) to maintain a flexible capital structure which optimizes the cost of capital at acceptable risk. We set the amount of capital in proportion to risk. We manage our capital structure and make adjustments to it in the light of changes in economic conditions and the risk characteristics of the underlying assets. In order to maintain or adjust the capital structure, we may adjust the amount of dividends paid to shareholders, return capital to shareholders, issue new shares or sell assets to reduce debt.
Consistently with others in our industry, we monitor capital on the basis of ourdebt-to-adjusted capital ratio and long-termdebt-to-equity ratio. Thedebt-to-adjusted capital ratio is calculated as net debt divided by adjusted capital. Net debt is calculated as total debt less cash and cash equivalents. Adjusted capital comprises all components of equity and some forms of subordinated debt, if any. The long-termdebt-to-equity ratio is calculated as long-term debt divided by shareholders’ equity. The computations are based on continuing operations.
| | | | | | | | | |
| | | 2010 | | 2009 |
| | | (United States dollars in thousands) |
| |
| Total debt | | $ | 52,748 | | | $ | — | |
| Less: cash and cash equivalents | | | (397,697 | ) | | | (38,046 | ) |
| | | | | | | | | |
| Net debt (net cash and cash equivalents) | | | (344,949 | ) | | | (38,046 | ) |
| Shareholders’ equity | | | 547,756 | | | | 435,689 | |
Debt-to-adjusted capital ratio | | | Not applicable | | | | Not applicable | |
28
There were no amounts in accumulated other comprehensive income relating to cash flow hedges nor were there any subordinated debt instruments as at December 31, 2010 and 2009. Thedebt-to-adjusted capital ratio in 2010 and 2009 were not applicable as we had a net cash and cash equivalents balance.
| | | | | | | | | |
| | | 2010 | | 2009 |
| | | (United States dollars in thousands) |
| |
| Long-term debt | | $ | 48,604 | | | $ | — | |
| Shareholders’ equity | | | 547,756 | | | | 435,689 | |
Long-termdebt-to-equity ratio | | | 0.09 | | | | Not applicable | |
During 2010, our strategy, which was unchanged from 2009, was to maintain thedebt-to-adjusted capital ratio and the long-termdebt-to-equity ratio at a low level. We had a net cash and cash equivalent balance after deduction of the total debt. Our long-termdebt-to-equity ratio was 0.09 and nil as at December 31, 2010 and 2009, respectively.
Financial Position
The following table sets out our selected financial information as at the dates indicated:
| | | | | | | | | |
| | | December 31, |
| | | 2010 | | 2009 |
| | | (United States Dollars in thousands) |
| |
| Cash and cash equivalents | | $ | 397,697 | | | $ | 38,046 | |
| Short-term securities | | | 27,894 | | | | 11,212 | |
| Total assets | | | 854,256 | | | | 951,720 | |
| Working capital | | | 411,920 | | | | 370,821 | |
| Long-term debt, less current portion | | | 48,604 | | | | — | |
| Shareholders’ equity | | | 547,756 | | | | 435,689 | |
We maintain a level of liquidity, with a substantial amount of our assets held in cash and cash equivalents, and securities. The liquid nature of these assets provides us with flexibility in managing and financing our business and the ability to realize upon investment or business opportunities as they arise. We also use this liquidity in client-related services by acting as a financial intermediary for third parties (e.g. by acquiring a position or assets and reselling such position or assets) and for our own proprietary trading and investing activities.
As at December 31, 2010, cash and cash equivalents were $397.7 million, compared to $38.0 million as at December 31, 2009. The increase in cash was primarily a result of the consolidation of Mass. As at December 31, 2010: (i) short-term securities increased to $27.9 million from $11.2 million at December 31, 2009; (ii) trade receivables and other receivables were $13.1 million and $12.1 million, respectively, compared to $nil and $5.7 million at December 31, 2009; (iii) the value of our inventories were $67.1 million, compared to $nil as at December 31, 2009; (iv) the value of real estate held for sale was $12.5 million, compared to $nil as at December 31, 2009; and (v) the value of contract deposits, prepaid and other assets was $20.8 million as at December 31, 2010, compared to $0.8 million as at December 31, 2009. The respective increases in such current assets were primarily a result of assets acquired pursuant to our consolidation of Mass.
The value of current assets of discontinued operations was $nil as at December 31, 2010 compared to $681.0 million as at December 31, 2009, as a result of the reclassification and disposition of our former Industrial Business.
Short-Term Bank Loans and Facilities
As part of our merchant banking and financial service activities, we establish, utilize and maintain various kinds of credit lines and facilities with banks, insurers and trade finance providers. Most of these facilities are short-term. These facilities are used forday-to-day business, trade financing and activities in commodities, and structured trade finance, a special trade financing. The amounts drawn under such facilities fluctuate with the kind and level of transactions being undertaken.
29
As at December 31, 2010, we had credit facilities aggregating $379.0 million as follows: (i) we had unsecured revolving credit facilities aggregating $190.8 million from banks. The banks generally charge an interest rate at the inter-bank rate plus an interest margin; (ii) we had revolving credit facilities aggregating $7.4 million from banks for structured trade finance, a special trade financing. The margin is negotiable when the facility is used; (iii) we had a non-recourse revolving factoring arrangement with a bank up to a credit limit of $113.8 million for our commodities activities. Generally, we factor our trade receivable accounts upon invoicing at the inter-bank rate plus a margin; and (iv) we had a foreign exchange credit facility of $67.0 million with a bank. All of these facilities are renewable on a yearly basis.
Long-Term Debt
Other than lines of credit drawn and as may be outstanding for trade financing and commodities and structured trade financing activities, as of December 31, 2010, the maturities of long-term debt were as follows:
| | | | | | | | | |
Maturity | | Principal | | | Interest(1) | |
| | | (United States dollars in thousands) | |
| |
| 2011 | | $ | 4,144 | | | $ | 1,841 | |
| 2012 | | | 27,845 | | | | 1,076 | |
| 2013 | | | 19,152 | | | | 585 | |
| 2014 | | | 1,607 | | | | 33 | |
| | | | | | | | | |
| | | $ | 52,748 | | | $ | 3,535 | |
| | | | | | | | | |
Note
We expect our maturing debt to be satisfied primarily through the settlement of underlying commodities transactions, trade financing transactions, including structured trade finance transactions, cash on hand and cash flow from operations. Much of our maturing debt may either subsequently be made re-available to us by the applicable financial institution or we may replace such facilities with new facilities depending upon particular capital requirements.
Cash Flows
Due to the type of businesses we engage in, our cash flows are not necessarily reflective of net earnings and net assets for any reporting period. As a result, instead of using a traditional cash flow analysis, our management believes it is more useful and meaningful to analyze our cash flows by the overall liquidity and credit availability. Please see the discussion on our financial position, short-term bank loans, facilities and long term debt earlier in this section.
Our business and, in particular, the commodities and resources and merchant banking, can be cyclical and the cash flows vary accordingly. Our principal operating cash expenditures are for financing trading of securities, commodities for customers, for our own account, and general and administrative expenses.
Working capital levels fluctuate throughout the year and are affected by the level of our trading activities, the markets and prices for commodities and the timing of receivables and the payment of payables and expenses. Changes in trading activities by customers and for our own account can affect the level of receivables and influence overall working capital levels. We have a high level of cash on hand and credit facility amounts. Our management is of the opinion that we have sufficient cash flow from operations to meet our working capital and other requirements and to meet unexpected cash demands.
Cash from Operating Activities
Operating activities provided cash of $43.9 million in 2010, compared to using cash of $7.6 million in 2009, primarily due to an increase of accounts payable. In 2010, changes in short — term securities used cash of $0.4 million, versus $nil in the comparable period of 2009. A decrease in restricted cash provided $0.7 million in 2010, compared to $nil in 2009. A decrease in receivables provided cash of $4.4 million in 2010, versus using cash of $1.0 million resulting from increases in receivables in 2009. An increase of inventories used cash of $4.4 million in 2010, compared to $nil in 2009. An increase in accounts payables and accrued expenses provided cash of $23.8 million in 2010, compared to a decrease in same using cash of $1.7 million in 2009. A decrease in contract deposits, prepaid and other provided cash of
30
$7.3 million in 2010, compared to $0.4 million in 2009. A decrease of short-term bank borrowings used $4.9 million in 2010, compared to $nil in 2009.
Cash Flows from Investing Activities
Investing activities provided cash of $224.2 million in 2010, compared to $6.2 million in 2009, primarily as a result of the acquisition of Mass, which provided cash of $213.9 million compared to $nil in 2009. A net increase in loan receivables used cash of $1.7 million for 2010, compared to $nil in 2009. In 2010, proceeds from sales of long-term investments, net of purchases, provided cash of $12.2 million, compared to $nil in 2009. Purchases of property, plant and equipment, net of sales, used cash of $1.1 million compared to $6,000 in 2009. Settlement of investment in preferred shares of former subsidiaries provided no cash in 2010 compared to $6.2 million in 2009.
Cash Flows from Financing Activities
Net cash provided by financing activities was $46.2 million in 2010, compared to $nil in 2009, primarily as a result of an increase in the issuance of shares, which provided cash of $48.2 million in 2010, compared to $nil in 2009. There was a net increase in debt repayment which used cash of $0.8 million in 2010, compared to $nil in 2009. Dividends paid to non-controlling interests used $1.2 million in 2010, compared to $nil in 2009.
Future Liquidity
We had no material commitments to acquire assets or operating businesses as at December 31, 2010. We anticipate that there will be acquisitions of businesses or commitments to projects in the future. To achieve the long-term goals of expanding our assets and earnings, including through acquisitions, capital resources will be required. Depending on the size of a transaction, the capital resources that will be required can be substantial. The necessary resources will be generated from cash flow from operations, cash on hand, borrowing against our assets, sales of proprietary investments or the issuance of securities.
Foreign Currency
Substantially all of our operations are conducted in international markets and our consolidated financial results are subject to foreign currency exchange rate fluctuations.
Our reporting currency is the United States dollar. We translate foreign self-sustained subsidiaries’ assets, liabilities, contingent liabilities and other financial obligations into United States dollars at the rate of exchange on the balance sheet date. Revenues and expenses are translated at exchange rates approximating those at the date of the transactions. As a substantial amount of revenues are received in Euros, Chinese yuans and Canadian dollars, the financial position for any given period, when reported in United States dollars, can be significantly affected by the exchange rates for Euros, Chinese yuans and Canadian dollars prevailing during that period.
In the year ended December 31, 2010, we reported approximately a net $3.9 million currency transaction loss, compared to a net gain of $16.9 million in 2009.
31
Contractual Obligations
The following table sets out our contractual obligations and commitments as at December 31, 2010, in connection with our long — term liabilities.
| | | | | | | | | | | | | | | | | |
| | | Payments Due by Period | |
| | | Less than
| | | | | | | | | More than
| |
Contractual Obligations(1)(2) | | 1 Year | | | 1-3 Years | | | 3-5 Years | | | 5 Years | |
| | | (United States dollars in thousands) | |
| |
| Long-term debt obligations | | $ | 5,985 | | | $ | 48,658 | | | $ | 1,640 | | | $ | — | |
| Capital lease obligations | | | — | | | | — | | | | — | | | | — | |
| Operating lease obligations | | | 2,077 | | | | 2,581 | | | | 1,471 | | | | 12 | |
| Purchase obligations | | | 32,748 | | | | — | | | | — | | | | — | |
| Other long — term liabilities, provision | | | 362 | | | | 232 | | | | — | | | | — | |
| | | | | | | | | | | | | | | | | |
| Total | | $ | 41,172 | | | $ | 51,471 | | | $ | 3,111 | | | $ | 12 | |
| | | | | | | | | | | | | | | | | |
Notes
| | |
| (1) | | The table does not include non-financial instrument liabilities and guarantees. |
| |
| (2) | | In addition to the tabular information, we have granted a credit facility up to $20.0 million to an affiliate, of which $5.8 million had been drawn and remains outstanding as at December 31, 2010. |
Indebtedness
As at December 31, 2010, our total short-term bank loans have been increased to approximately $70.0 million from $nil at December 31, 2009.
Risk Management
Risk is an inherent part of our business and activities. The extent to which we properly and effectively identify, assess, monitor and manage each of the various types of risk involved in our activities is critical to our financial soundness and profitability. We seek to identify, assess, monitor and manage the following principal risks involved in our business activities: market, credit, liquidity, operational, legal and compliance, new business, reputational and other. Risk management is a multi-faceted process that requires communication, judgment and knowledge of financial products and markets. Our management takes an active role in the risk management process and requires specific administrative and business functions to assist in the identification, assessment and control of various risks. Our risk management policies, procedures and methodologies are fluid in nature and are subject to ongoing review and modification.
Sensitivities
Our earnings are sensitive to, among other things, fluctuations in:
Interest Rates. Our long-term debt may be exposed to interest rate price risk. At December 31, 2010, if benchmark interest rates at that date had been 100 basis points (1.0% per annum) lower with all other variables held constant, income from continuing operations for the year would have been $0.1 million higher. Conversely, if benchmark interest rates at that date had been 100 basis points (1.0% per annum) higher with all other variables held constant, income from continuing operations for the year would have been $0.1 million lower.
Foreign Exchange. Our major trading currencies are United States dollars and Euros. At December 31, 2010, if the U.S. dollar had weakened 10% against the local functional currencies with all other variables held constant, income from continuing operations for the year would have been $11.6 million lower. Conversely, if the U.S. dollar had strengthened 10% against the local functional currencies with all other variables held constant, income from continuing operations for the year would have been $11.6 million higher.
At December 31, 2010, if the Euro had weakened 10% against the local functional currencies with all other variables held constant, income from continuing operations for the year would have been $13.4 million lower. Conversely, if the Euro had strengthened 10% against the local functional currencies with all other variables held constant, income from continuing operations for the year would have been $16.1 million higher.
32
Equity Prices. We face equity price risk with respect to our investments in securities. At December 31, 2010, if the equity price in general had weakened 10% with all other variables held constant, income and comprehensive income from continuing operations for the year would have been $2.3 million and $1.0 million lower, respectively. Conversely, if the equity price in general had strengthened 10% with all other variables held constant, income and comprehensive income from continuing operations would have been $2.3 million and $1.0 million higher, respectively.
Inflation
We do not believe that inflation has had a material impact on our revenues or income over the past two fiscal years. However, increases in inflation could result in increases in our expenses, which may not be readily recoverable in the price of services provided to our clients. To the extent that inflation results in rising interest rates and has other adverse effects on capital markets, it could adversely affect our financial position and profitability.
Application of Critical Accounting Policies
The preparation of financial statements in conformity with IFRS requires our management to make estimates and assumptions that affect the reported amounts of assets and liabilities and disclosure of contingent assets and liabilities at the date of the financial statements and the reported amounts of revenues and expenses during the reporting periods.
Our management routinely makes judgments and estimates about the effects of matters that are inherently uncertain. As the number of variables and assumptions affecting the probable future resolution of the uncertainties increase, these judgments become even more subjective and complex. We have identified certain accounting policies, described below, that are the most important to the portrayal of our current financial condition and results of operations. Our significant accounting policies are disclosed in Note 1 to our audited consolidated financial statements included in this annual report onForm 20-F.
The following accounting policies are the most important to our ongoing financial condition and results of operations:
Revenue Recognition
We currently earn royalty income from our interest in the resource property which is situated in Newfoundland and Labrador, Canada. The property is leased to an operator and our royalty is based on a pre-determined formula consisting of certain market variables and shipment tonnage. We receive the royalty computation information from the operator.
Inventories
Our inventories consist of raw materials,work-in-progress and finished goods.
In general, inventories are recorded at the lower of cost or estimated net realizable value. Commodities acquired in commodity broker-trader activities with the purpose of selling in the near future and generating a profit from fluctuations in price or broker-traders’ margin are measured at fair value less costs to sell. Accordingly, our management must make estimates about their pricing when establishing the appropriate provisions for inventories. For the finished goods and commodity inventories, the estimated net selling price is the most important determining factor. However, our management also considers whether there are any alternatives to enhance the value of the finished goods by various marketing strategies and channels. Actual selling price could differ from the estimated selling price, and such differences could be material.
Receivables
Typically, receivables are financial instruments which are not classified as held for trading or available for sale. They are net of an allowance for credit losses, if any. We perform ongoing credit evaluations of customers and adjust our allowance accounts for specific customer risks and credit factors. Receivables are considered past due on an individual basis based on the terms of the contracts. Our allowance for credit losses is maintained at an amount considered adequate to absorb estimated credit-related losses. Such allowance reflects management’s best estimate of the losses in our receivables and judgments about economic conditions. As at December 31, 2010, we had recognized receivables (including loans, trade and other) aggregating $31.0 million.
33
Valuation of Securities
Securities held for trading are carried at current market value. Any unrealized gains or losses on securities held for trading are included in our results of operations.
Available-for-sale securities are also carried at current market value when current market value is available. Any unrealized gains or losses are included in other comprehensive income. When there has been a loss in value of anavailable-for-sale security that is other than a temporary decline, the security will be written down to recognize the loss in the determination of income. In determining whether the decline in value is other than temporary, quoted market price is not the only deciding factor, particularly for thinly traded securities, large block holdings and restricted shares. We consider, but such consideration is not limited to, the following factors: (i) the trend of the quoted market price and trading volume; (ii) the financial position and results for a period of years; (iii) liquidity or going concern problems of the investee; (iv) changes in or reorganization of the investeeand/or its future business plan; (v) outlook of the investee’s industry; (vi) the current fair value of the investment (based upon an appraisal thereof) relative to its carrying value; and (vii) our business plan and strategy to divest the security or to restructure the investee.
Recent market volatility has made it extremely difficult to value certain securities. Subsequent valuations, in light of factors prevailing at such time, may result in significant changes in the values of these securities in future periods. Any of these factors could require us to recognize further impairments in the value of our securities portfolio, which may have an adverse effect on our results of operations in future periods.
Income Taxes
Management believes that it has adequately provided for income taxes based on all of the information that is currently available. The calculation of income taxes in many cases, however, requires significant judgment in interpreting tax rules and regulations, which are constantly changing.
Our tax filings are also subject to audits, which could materially change the amount of current and future income tax assets and liabilities. Any change would be recorded as a charge or a credit to income tax expense. Any cash payment or receipt would be included in cash from operating activities.
We currently have deferred tax assets which are comprised primarily of tax loss carry-forwards and deductible temporary differences, both of which will reduce taxable income in the future. The amounts recorded for deferred tax are based upon various judgments, assumptions and estimates. We assess the realization of these deferred tax assets on a periodic basis to determine to what extent that it is probable that taxable profit will be available against which the deductible temporary differences and the carry-forward of unused tax credits and unused tax losses can be utilized. We determine whether it is probable that all or a portion of the deferred tax assets will be realized, based on currently available information, including, but not limited to, the following:
| | |
| | • | the history of the tax loss carry-forwards and their expiry dates; |
| |
| | • | future reversals of temporary differences; |
| |
| | • | our projected earnings; and |
| |
| | • | tax planning opportunities. |
On the reporting date, we also reassess unrecognized deferred tax assets. We recognized a previously unrecognized deferred tax asset to the extent that it has become probable that future taxable profit will allow the deferred tax asset to be recovered.
We provide for future liabilities in respect of uncertain tax positions where additional tax may become payable in future periods and such provisions are based on our management’s assessment of exposures. We did not recognize the full deferred tax liability on taxable temporary differences associated with investments in subsidiaries, joint ventures and associates where we are able to control the timing of the reversal of the temporary differences and it is probable that the temporary differences will not reverse in the foreseeable future. We may change our investment decision in the normal course of our business, thus resulting in additional tax liability.
34
New Standards and Interpretations Not Yet Adopted
Certain pronouncements were issued by the International Accounting Standards Board that are mandatory for accounting periods beginning after January 1, 2011 or later periods. The following new accounting standards and amendments are expected to have significant effects on our accounting policies, financial positionsand/or financial statement presentation.
IFRS 9,Financial Instruments,is expected to replace IAS 39,Financial Instruments: Recognition and Measurement,from 2013. New requirements for the classification and measurement of financial liabilities, derecognition of financial instruments, impairment and hedge accounting are expected to be added to IFRS 9.
Amendments, set out inDisclosures — Transfers of Financial Assets,were issued to amend IFRS 7,Financial Instruments,so as to enhance the disclosure requirements for transfers of financial assets that result in derecognition. These amendments respond, in part, to the recent financial crisis. Entities will be required to provide more extensive quantitative and qualitative disclosures about: (i) risk exposures relating to transfers of financial assets that are: (a) not derecognized in their entirety; or (b) derecognized in their entirety, but with which the entity continues to have some continuing involvement; and (ii) the effect of those risks on an entity’s financial position. The amendments are effective for annual periods beginning on or after July 1, 2011. Earlier application is permitted.
Amendments, set out inDeferred Tax: Recovery of Underlying Assets,were issued to amend IAS 12,Income Taxes. IAS 12 requires an entity to measure the deferred tax relating to an asset depending on whether the entity expects to recover the carrying amount of the asset through use or sale. It can be difficult and subjective to assess whether recovery will be through use or through sale when the asset is measured using the fair value model in IAS 40,Investment Property. The amendment provides a practical solution to the problem by introducing a presumption that recovery of the carrying amount will, normally, be through sale. The amendments are effective for annual periods beginning on or after January 1, 2012.
IAS 24,Related Party Disclosures,was revised to simplify the disclosure requirements for government-related entities and clarify the definition of a related party. The revised standard is effective for annual periods beginning on or after January 1, 2011, with earlier application permitted.
We are currently evaluating the impact, if any, that these new standards will have on our consolidated financial statements.
Trend Information
For a discussion of trends relating to revenues derived from our royalty interest, please see “Item 4: Information on the Company — B. Business Overview — Business Segments — Commodities and Resources”.
Off-Balance Sheet Arrangements
We do not have any off-balance sheet arrangements that have or are reasonably likely to have a current or future effect on our financial condition, changes in financial condition, revenues or expenses, results of operations, liquidity, capital expenditures or capital resources that are material to investors.
We have outstanding issued guarantees held by our trading and financial partners in connection with our commodities and resources activities, and as of December 31, 2010, we had outstanding issued guarantees of up to a maximum of $45.0 million. As of December 31, 2010, $24.8 million have been used and outstanding and have not been recorded as liabilities in the consolidated balance sheet. There has been no claim against the guarantees.
Safe Harbour
Not Applicable.
35
| |
| ITEM 6: | Directors, Senior Management and Employees |
| |
| A. | Directors and Senior Management |
We have no arrangement or understanding with major shareholders, customers, suppliers or others pursuant to which any of our directors or officers was selected as a director of officer. The following table sets forth the names of each of our directors and officers, as at the date hereof:
| | | | | | | | | | | |
| | | | | Date of
| | |
| | | | | Commencement of
| | Expiration of
|
| | | | | Office with our
| | Term of Office
|
Name (Age) | | Present Position | | Company | | with our Company |
| |
| Michael J. Smith (62) | | Chairman, Chief Executive Officer,
Interim Chief Financial Officer and Director | | | 1986 | | | | 2011 | |
Dr. Shuming Zhao (55)(1)(2)(3) | | Director | | | 2004 | | | | 2013 | |
Robert Ian Rigg (64)(1)(2)(3) | | Director | | | 2010 | | | | 2011 | |
Indrajit Chatterjee (66)(1)(2)(3) | | Director | | | 2005 | | | | 2012 | |
Notes
| | |
| (1) | | Member of our audit committee. |
| |
| (2) | | Member of our compensation committee. |
| |
| (3) | | Member of our nominating and corporate governance committee. |
Michael J. Smith — Chairman, Chief Executive Officer and Director
Mr. Smith has been our Chairman since 2003 and a director of our company since 1986. Mr. Smith was appointed our Chief Executive Officer in March 2010. He was our Chief Financial Officer from 2003 until October 16, 2007, is currently our interim Chief Financial Officer and was our Secretary until March 1, 2008. Mr. Smith was also our Chief Executive Officer between 1996 and 2006. Mr. Smith is the President, Secretary and a director of Blue Earth Refineries Inc., a public company with its common shares registered with the Securities and Exchange Commission under theSecurities Exchange Act of 1934. Mr. Smith was also previously the President, Chief Executive Officer, Secretary and a director of Mass. He is also a director of Canoro. Mr. Smith has experience in corporate finance, restructuring and taxation planning.
Dr. Shuming Zhao — Director
Dr. Zhao has been a director of our company since 2004. Dr. Zhao is a professor and the Dean of the School of Business, Nanjing University and the Dean of the School of Graduate Studies, Macau University of Science and Technology. Dr. Zhao is President of Jiangsu Provincial Association of Human Resource Management and Vice President of Jiangsu Provincial Association of Business Management and Entrepreneurs. Dr. Zhao is also a director of Little San Company Ltd. (China). Dr. Zhao organized and held four international symposia on multinational business management in 1992, 1996, 1999 and 2002. Since 1994, Dr. Zhao has also acted as a management consultant for several Chinese and international firms. Since 1997, Dr. Zhao has been a visiting professor at the Marshall School of Business at the University of Southern California and he has lectured in countries including the United States, Canada, Japan, the United Kingdom, Germany, Australia, the Netherlands and Singapore. Since 2004, Dr. Zhao has been an independent director on the board of directors of Suning Electronic Co. Ltd.
Robert Ian Rigg — Director
Mr. Rigg has been a director of our company since 2010. Mr. Rigg holds a commerce degree in economics and accounting from the University of Melbourne and was a member of the Institute of Chartered Accountants in Canada. Mr. Rigg has experience as both a director and chief financial officer of several public companies.
Indrajit Chatterjee — Director
Mr. Chatterjee has been a director of our company since 2005. Mr. Chatterjee is a retired businessman who was formerly responsible for marketing with the Transportation Systems Division of General Electric for India. Mr. Chatterjee is experienced in dealing with Indian governmental issues.
36
Family Relationships
There are no family relationships between any of our director and executive officers.
During fiscal year ended December 31, 2010, we paid an aggregate of approximately $2.1 million in cash compensation to our directors and officers, excluding directors’ fees. No other funds were set aside or accrued by our company during the fiscal year ended December 31, 2010 to provide pension, retirement or similar benefits for our directors or officers pursuant to any existing plan provided or contributed to by us.
Executive Officers
The following table provides a summary of compensation paid by us during the fiscal year ended December 31, 2010 to the senior management of our company:
| | | | | | | | | | | | | | | | | | | | | | | | | | | | | | | | | |
| | | | | | | | | Non-Equity Incentive Compensation Plan
| | | | | | |
| | | | | | | | | Compensation
| | | | | | |
| | | | | | | | | ($) | | | | | | |
| | | | | Share-
| | Option-
| | | | Long-
| | | | | | |
| | | | | Based
| | Based
| | Annual
| | Term
| | Pension
| | All Other
| | Total
|
| | | Salary
| | Awards
| | Awards
| | Incentive
| | Incentive
| | Value
| | Compensation
| | Compensation
|
Name and Principal Position | | ($) | | ($) | | ($)(1) | | Plans | | Plans | | ($) | | ($) | | ($) |
| |
Michael J. Smith
Chairman and Chief Executive Officer | | | 250,034 | | | | — | | | | — | | | | 100,000 | | | | — | | | | — | | | | 150,670(1 | ) | | | 500,704 | |
Jouni Salo(2) | | | 135,176 | | | | — | | | | — | | | | — | | | | — | | | | — | | | | 52,559(3 | ) | | | 187,735 | |
| Former President and Chief Executive Officer | | | | | | | | | | | | | | | | | | | | | | | | | | | | | | | | |
Alan Hartslief(4) | | | 265,404 | | | | — | | | | — | | | | — | | | | — | | | | — | | | | 150,042(5 | ) | | | 415,446 | |
| Former Chief Financial Officer and Secretary | | | | | | | | | | | | | | | | | | | | | | | | | | | | | | | | |
James Purkis(6) | | | 109,124 | | | | — | | | | — | | | | — | | | | — | | | | — | | | | 847,747(7 | ) | | | 956,871 | |
| Former Chief Operating Officer | | | | | | | | | | | | | | | | | | | | | | | | | | | | | | | | |
Notes
| | |
| (1) | | Consisting of housing expenses and medical expenses. |
| |
| (2) | | Mr. Salo was appointed as our President and Chief Executive Officer effective April 13, 2009. Mr. Salo ceased acting as our President and Chief Executive Officer effective March 30, 2010 and was replaced by Michael J. Smith. |
| |
| (3) | | Consisting of medical, health and other expenses. |
| |
| (4) | | Mr. Hartslief ceased acting as our Chief Financial Officer in October 2010. |
| |
| (5) | | Consisting of medical, housing and other expenses. |
| |
| (6) | | Mr. Purkis was appointed the President of our Construction Division effective June 1, 2008, Executive Vice-President effective November 1, 2008, and Chief Operating Officer effective August 12, 2009. Mr. Purkis resigned as Chief Operating Officer effective March 31, 2010. |
| |
| (7) | | Consisting of automobile, housing and termination payments. |
37
Directors’ Compensation
The following table provides a summary of compensation paid by us during the fiscal year ended December 31, 2010 to the directors of our company.
DIRECTOR COMPENSATION TABLE
| | | | | | | | | | | | | | | | | | | | | | | | | | | | | |
| | | | | | Share-
| | | Option-
| | | Non-Equity
| | | | | | | | | | |
| | | Fees
| | | Based
| | | Based
| | | Incentive Plan
| | | Pension
| | | All Other
| | | | |
| | | Earned
| | | Awards
| | | Awards
| | | Compensation
| | | Value
| | | Compensation
| | | Total
| |
Name | | ($) | | | ($) | | | ($) | | | ($) | | | ($) | | | ($) | | | ($) | |
| |
Michael J. Smith(1) | | | 3,000 | | | | — | | | | — | | | | — | | | | — | | | | — | | | | 3,000 | |
| Dr. Shuming Zhao | | | 39,750 | | | | — | | | | — | | | | — | | | | — | | | | — | | | | 39,750 | |
Ian Rigg(2) | | | 21,000 | | | | — | | | | — | | | | — | | | | — | | | | — | | | | 21,000 | |
| Indrajit Chatterjee | | | 114,750 | | | | — | | | | — | | | | — | | | | — | | | | — | | | | 114,750 | |
Gerhard Rolf(3) | | | 20,585 | | | | — | | | | — | | | | — | | | | — | | | | — | | | | 20,585 | |
Silke Stenger(3) | | | 3,750 | | | | — | | | | — | | | | — | | | | — | | | | — | | | | 3,750 | |
Notes
| | |
| (1) | | Compensation provided to our Chairman, Michael Smith, is disclosed in the table above under the heading “Executive Officers”. |
| |
| (2) | | Ian Rigg was appointed as director of our company on March 30, 2010. |
| |
| (3) | | Gerhard Rolf and Silke Stenger resigned as directors of our company effective March 30, 2010. |
A total of $0.2 million was paid to our directors for services rendered as directors, or for committee participation or assignments, during our most recently completed financial year. Our directors are each paid an annual fee of $30,000 and $750 for each directors’ meeting attended as well as additional fees, as applicable, for their respective participation on our Audit and Compensation Committees. We also reimburse our directors and officers for expenses incurred in connection with their services as directors and officers.
Termination and Change of Control Benefits
Effective March 1, 2008, we entered into an independent consulting agreement with Michael Smith, our Chairman and Chief Executive Officer, pursuant to which he provides consulting services to us. In the event that the agreement is terminated by us or in the event of a change of control, Mr. Smith is entitled to receive a termination payment equal to the sum of three times the aggregate consulting fee paid to Mr. Smith in the previous twelve months plus the higher of his current bonus or the highest bonus received by him in the previous five years prior to such termination. In addition, all unvested rights in any stock options or other equity awards made to Mr. Smith will vest in full in the event of a change of control. Mr. Smith will also be entitled, for a period of 365 days following the earlier of the date of the termination of the agreement and the date of the change of control, to require us to purchase all or any part of our common shares held by Mr. Smith on the date of termination or date of change of control, at a price equal to the average closing market price of our common shares on the NYSE for the ten preceding trading days. Assuming a discontinuance of Mr. Smith’s services as a result of termination or a change of control effective December 31, 2010, we would have been required to make a maximum payment to Mr. Smith in the aggregate amount of $2,432,650 pursuant to the terms of his consulting arrangement.
Effective January 1, 2009, we entered into a new employment arrangement with Jouni Salo whereby he agreed to act as our President and Chief Executive Officer and as an executive of one of our subsidiaries. Mr. Salo ceased acting as our President and Chief Executive Officer effective March 30, 2010 and did not receive any termination payment in connection therewith pursuant to the terms of his employment arrangement.
Effective January 1, 2009, we entered into a new employment arrangement with Alan Hartslief whereby he agreed to act as our Chief Financial Officer and as an executive of one of our subsidiaries. Mr. Hartslief ceased acting as our Chief Financial Officer in October 2010.
Effective January 1, 2009, we entered into a new employment arrangement with James Purkis whereby he agreed to act as our Chief Operating Officer and as an executive of one of our subsidiaries. Mr. Purkis resigned as of March 31, 2010
38
and received an aggregate payment of $792,000 (including certain incentive amounts) in connection therewith pursuant to the terms of his employment arrangement.
Pension Plan Benefits
As of December 31, 2010, we did not have any defined benefit, defined contribution or deferred compensation plans for any of our senior officers or directors.
Our Articles provide for three classes of directors with staggered terms. Each director holds office until the expiry of his or her term or until his or her successor is elected or appointed, unless such office is earlier vacated in accordance with our Articles or with the provisions of the British ColumbiaBusiness Corporations Act. At each annual meeting of our company, a class of directors is elected to hold office for a three-year term. Successors to the class of directors whose terms expire are identified as being of the same class as the directors they succeed and are elected to hold office for a term expiring at the third succeeding annual meeting of shareholders. A director appointed or elected to fill a vacancy on the board of directors holds office for the unexpired term of his predecessor. The following table sets forth the date of expiration of the current term of office of each of our directors, as well as the period during which that person has served as a director:
| | | | | | | | | |
| | | | | | Expiration of
| |
Name of Director | | Director Since | | | Current Term | |
| |
| Michael J. Smith | | | 1986 | | | | 2011 | |
| Ian Rigg | | | 2010 | | | | 2011 | |
| Indrajit Chatterjee | | | 2005 | | | | 2012 | |
| Dr. Shuming Zhao | | | 2004 | | | | 2013 | |
Other than as discussed elsewhere herein, there are no service contracts between our company and any of our directors providing for benefits upon termination of employment.
Our board of directors has established an audit committee. Our audit committee currently consists of Dr. Shuming Zhao, Ian Rigg and Indrajit Chatterjee. The audit committee operates pursuant to a charter adopted by the board of directors. A copy of our audit committee charter is attached as Exhibit 99.1 to our annual report filed with the Securities and Exchange Commission on April 3, 2006. The audit committee is appointed and generally acts on behalf of the board of directors. The audit committee is responsible primarily for monitoring: (i) the integrity of our financial statements; (ii) compliance with legal and regulatory requirements; and (iii) the independence and performance of our internal and external auditors. The audit committee also oversees our company’s financial reporting process and internal controls and consults with management and our independent auditors on matters related to our annual audit and internal controls, published financial statements, accounting principles and auditing procedures being applied.
Our board of directors has established a compensation committee. Our compensation committee currently consists of Dr. Shuming Zhao, Ian Rigg and Indrajit Chatterjee. The compensation committee operates pursuant to a compensation committee charter adopted by the board of directors. A copy of our compensation committee charter is attached as exhibit 99.2 to our annual report filed with the Securities and Exchange Commission on April 3, 2007. The compensation committee is appointed and generally acts on behalf of the board of directors. The compensation committee is responsible for reviewing and approving annual salaries, bonuses and other forms and items of compensation for the senior officers and employees of our company. Except for plans that are, in accordance with their terms or as required by law, administered by our board of directors or another particularly designated group, the compensation committee also administers and implements all of our stock option and other stock-based and equity-based benefit plans (including performance-based plans), recommends changes or additions to those plans and reports to our board of directors on compensation matters. Our Chief Executive Officer does not vote upon or participate in the deliberations regarding his compensation.
Effective July 15, 2005, we formed a nominating and corporate governance committee. The nominating and corporate governance committee currently consists of Ian Rigg, Dr. Shuming Zhao and Indrajit Chatterjee. The nominating and corporate governance committee operates pursuant to a charter adopted by our board of directors. A copy of our nominating and corporate governance charter is attached as Exhibit 99.3 to our annual report filed with the Securities and Exchange Commission on April 3, 2007. The primary function of the nominating and corporate governance
39
committee is to assist our board of directors in developing our approach to corporate governance issues and monitoring performance against the defined approach. The nominating and corporate governance committee is also responsible for the nomination of directors by identifying and reporting on candidates to be nominated to our board of directors.
At December 31, 2010, 2009 and 2008, we employed approximately 678, 780 and 1,270 people, respectively.
There were 62,561,421 common shares, 2,635,000 stock options and no share purchase warrants issued and outstanding as of March 31, 2011. Of the shares issued and outstanding on that date, our directors and officers, who served in such positions at any time during the fiscal year ended December 31, 2010, owned the following common shares:
| | | | | | | | | | | | | |
| | | Common Shares
| | Percentage of Total
| | |
| | | Beneficially
| | Common Shares
| | Stock Options
|
| | | Owned
| | Outstanding
| | Held
|
Name and Principal Position | | (#) | | (%) | | (#) |
| |
| Michael J. Smith | | | 92,727 | | | | 0.1 | | | | 390,000 | |
| Chairman and Chief Executive Officer | | | | | | | | | | | | |
| Director | | | | | | | | | | | | |
| Dr. Shuming Zhao | | | — | | | | — | | | | 55,000 | |
| Director | | | | | | | | | | | | |
| Ian Rigg | | | 7,230 | | | | 0.0 | | | | 55,000 | |
| Director | | | | | | | | | | | | |
| Indrajit Chatterjee | | | — | | | | — | | | | 55,000 | |
| Director | | | | | | | | | | | | |
Stock Option Plan
We have an incentive stock option plan that provides for the grant of incentive stock options to purchase our common shares to our directors, officers and key employees and other persons providing ongoing services to us. Our stock option plan is administered by our board of directors. The maximum number of our common shares which may be reserved and set aside for issuance under our stock option plan is 5,524,000. Each option upon its exercise entitles the grantee to purchase one common share. The exercise price of an option may not be less than the closing market price of our common shares on the NYSE, on the day prior to the date of grant of the option. In the event our common shares are not traded on such day, the exercise price may not be less than the average of the closing bid and ask prices of our common shares on the NYSE, for the ten trading days immediately prior to the date the option is granted. Options may be granted under our stock option plan for an exercise period of up to ten years from the date of grant of the option. We did not grant any options during the year ended December 31, 2010. There were no options outstanding as at December 31, 2010. There were 1,732,344 options available for grant under the stock option plan as at December 31, 2010. We granted 1,720,000 options subsequent to December 31, 2010.
Incentive Plan
At our annual and special meeting of our shareholders held in September 2008, our shareholders passed a resolution approving an equity incentive plan, referred to as the “Incentive Plan”, to further align the interests of employees and directors with those of our shareholders by providing incentive compensation opportunities tied to the performance of our common shares and by promoting increased ownership of our common stock by such individuals.
Pursuant to the terms of the Incentive Plan, our board of directors, our compensation committee or such other committee as is appointed by our board of directors to administer the Incentive Plan, may grant Awards (as hereinafter defined) under the Incentive Plan, establish the terms and conditions for those Awards, construe and interpret the Incentive Plan and establish the rules for the Incentive Plan’s administration. Such committee may grant nonqualified stock options, incentive stock options, stock appreciation rights, restricted stock awards, stock unit awards, stock awards, performance stock awards and tax bonus awards, each referred to as an “Award”, under the Incentive Plan. Awards may be granted to employees, directors, officers or consultants of ours or any affiliate or any person to whom an offer of employment with us or any affiliate is extended. Such committee has the authority to determine which employees, directors, officers,
40
consultants and prospective employees should receive Awards. Non-employee directors and consultants may not receive incentive stock options.
The maximum number of our common shares that may be issuable pursuant to all Awards granted under the Incentive Plan is 1,500,000 common shares. Forfeited, cancelled, returned and lapsed Awards are not counted against the 1,500,000 common shares. Any Awards or portions thereof that are settled in cash and not by issuance of our common shares are not counted against the 1,500,000 common shares. As of the date of this annual report onForm 20-F, 915,000 Awards have been issued pursuant to the Incentive Plan and 585,000 Awards are available for issuance.
| |
| ITEM 7: | Major Shareholders and Related Party Transactions |
There were 62,561,421 common shares issued and outstanding as of March 31, 2011. The following table sets forth, as of March 31, 2011, persons known to us to be the beneficial owner of more than five percent (5%) of our common shares:
| | | | | | | | | |
Name | | Amount Owned | | | Percent of Class(1) | |
| |
| Peter Kellogg | | | 13,820,910(2 | ) | | | 22.1 | % |
Notes
| | |
| (1) | | Based on 62,561,421 common shares issued and outstanding on March 31, 2011. |
| |
| (2) | | In his public filings, Mr. Kellogg disclaims beneficial ownership of 10,097,211 of the shares, or approximately 16.1% of the issued and outstanding common shares. |
The voting rights of our major shareholders do not differ from the voting rights of holders of our company’s shares who are not major shareholders.
As of March 25, 2011, there were 62,561,421 common shares issued and outstanding held by 587 registered holders. Of those common shares issued and outstanding, 62,380,757 common shares were registered in the United States (525 registered shareholders).
To the best of our knowledge, we are not directly or indirectly owned or controlled by another corporation, by any foreign government or by any other natural or legal person.
There are no arrangements known to us, the operation of which may at a subsequent date result in a change in the control of our company.
| |
| B. | Related Party Transactions |
Other than as disclosed herein, to the best of our knowledge, in 2010 there have been no material transactions or loans between our company and (a) enterprises that directly or indirectly through one or more intermediaries control or are controlled by, or are under common control with, our company; (b) associates; (c) individuals owning, directly or indirectly, an interest in the voting power of our company that gives them significant influence over our company, and close members of any such individual’s family; (d) key management personnel of our company, including directors and senior management of our company and close members of such individuals’ families; and (e) enterprises in which a substantial interest in the voting power is owned, directly or indirectly, by any person described in (c) or (d) or over which such a person is able to exercise significant influence.
In the normal course of operations, we enter into transactions with related parties which include, among others, affiliates whereby we have a significant equity interest (10% or more) in the affiliates or have the ability to influence the affiliates’ or our operating and financing policies through significant shareholding, representation on the board of directors, corporate charterand/or bylaws. These related party transactions are measured at the exchange value, which represents the amount of consideration established and agreed to by all the parties.
41
Continuing Operations
1. Transactions with related parties from January 1, 2010 until December 31, 2010:
| | | | | |
| | | (United States dollars in thousands) |
| |
Dividend income on common shares(1) | | $ | 193 | |
Royalty expense paid and payable(1) | | | (800 | ) |
| Fee income | | | 3 | |
| Purchase of goods | | | (1,856 | ) |
| Fee expense for managing resource property | | | (1,575 | ) |
| Fee expense for management services, including expense reimbursements | | | (333 | ) |
| Interest income | | | 44 | |
| | | | |
Note
| | |
| (1) | | Included in income from royalty interest in resource property. |
2. Balance with related parties at December 31, 2010:
| | | | | |
| | | (United States dollars in thousands) |
| |
| Loan receivable | | $ | 5,792 | |
| Other receivables, due from an affiliate | | | 8 | |
| Contract deposits, prepaid and other | | | 16,942 | |
| Long-term securities | | | 1,233 | |
| Equity method investments | | | 5,713 | |
| Accounts payable and accrued expenses, due to affiliates | | | 524 | |
Discontinued Operations
| | | | | |
| | | (United States dollars in thousands) |
| |
| Fee expense for management services, including expense reimbursements | | $ | (127 | ) |
Transactions with related parties are made in arm’s length transactions at normal market prices and on normal commercial terms.
In addition to transactions in the above two tables, in 2010 we entered into an agreement with our former wholly-owned subsidiary whereby we agreed to offset its payables to the former subsidiary against its note receivable (CDN$1.7 million) from the former subsidiary plus accrued interest thereon. Please refer to Note 13 of the audited annual financial statements for further information. Furthermore, we obtained bridge financing of $8.0 million from the affiliate for three days. We did not pay any interest and fees to this affiliate in relation to such bridge financing.
| |
| C. | Interests of Experts and Counsel |
Not applicable.
| |
| ITEM 8: | Financial Information |
| |
| A. | Consolidated Statements and Other Financial Information |
Effective January 1, 2010, we adopted IFRS following approval from the Canadian Securities Administrators under National Instrument52-107,Acceptable Accounting Principles, Auditing Standards and Reporting Currency. The consolidated financial statements have been prepared in compliance with IFRS. See “Item 18 — Financial Statements”. The consolidated unaudited management’s discussion and analysis and interim financial statements for each of the interim periods ended March 31, June 30 and September 30, 2010, have been restated in accordance with IFRS. Refer to Note 36 of the audited consolidated financial statements for explanations and the impact of the transition to IFRS.
42
Legal Proceedings
Other than as described in this annual report onForm 20-F, we are not involved in any material legal proceedings, nor are we aware of any proceedings that are contemplated that we believe would have a material adverse effect upon our financial condition or results of operations. We are subject to routine litigation incidental to our business and are named from time to time as a defendant in various legal actions arising in connection with our activities, certain of which may include large claims for punitive damages.
Dividend Distributions
On January 10, 2011, we announced that our board of directors had adopted an annual dividend policy, providing for an annual dividend based on the annual dividend yield of the NYSE Composite Index for the preceding year plus 25 basis points. We declared a cash dividend of $0.20 per common share for 2011, which is payable in four quarterly installments. The first dividend payment of $0.05 per common share was made on January 31, 2011 to shareholders of record on January 20, 2011 and a second payment of $0.05 per common share will be made on April 11, 2011 to shareholders of record on March 31, 2011.
The actual timing, payment and amount of dividends paid on our common shares is determined by our board of directors, based upon things such as our cash flow, results of operations and financial condition, the need for funds to finance ongoing operations and such other business consideration as our board of directors considers relevant.
Please refer to “Item 4 — A. History and Development of the Company — Recent Developments” and Notes 3 and 4 of our annual financial statements included herewith for a discussion of significant events that have occurred after December 31, 2010.
| |
| ITEM 9: | The Offer and Listing |
| |
| A. | Offer and Listing Details |
Since June 18, 2007, our common shares have been quoted on the NYSE, currently under the symbol “TTT”. Previously, our common shares were traded on the Nasdaq Global Select Market under the symbol “KHDH”. We voluntarily terminated our listing on the Nasdaq Global Select Market, and the last day of trading of our common shares
43
on the Nasdaq Global Select Market was June 15, 2007. The following table sets forth the high and low sales of prices of our common shares on the NYSE and the Nasdaq Global Select Market for the periods indicated.
| | | | | | | | | |
| | | Exchange(1) |
| | | | | Low
|
| | | High (U.S.$)(2) | | (U.S.$)(2) |
| |
Annual Highs and Lows | | | | | | | | |
| 2006 | | | 22.10 | | | | 10.34 | |
| 2007 | | | 45.74 | | | | 18.00 | |
| 2008 | | | 35.79 | | | | 6.50 | |
| 2009 | | | 14.20 | | | | 6.65 | |
| 2010 | | | 16.10 | | | | 6.60 | |
Quarterly Highs and Lows | | | | | | | | |
2009 | | | | | | | | |
| First Quarter | | | 13.59 | | | | 6.65 | |
| Second Quarter | | | 9.60 | | | | 6.81 | |
| Third Quarter | | | 12.39 | | | | 8.12 | |
| Fourth Quarter | | | 14.20 | | | | 8.90 | |
2010 | | | | | | | | |
| First Quarter | | | 16.10 | | | | 11.82 | |
| Second Quarter | | | 14.94 | | | | 7.00 | |
| Third Quarter | | | 8.94 | | | | 6.60 | |
| Fourth Quarter | | | 8.79 | | | | 7.46 | |
Monthly Highs and Lows | | | | | | | | |
| September 2010 | | | 8.57 | | | | 6.60 | |
| October 2010 | | | 8.18 | | | | 7.46 | |
| November 2010 | | | 8.36 | | | | 7.64 | |
| December 2010 | | | 8.79 | | | | 7.76 | |
| January 2011 | | | 7.87 | | | | 7.15 | |
| February 2011 | | | 8.79 | | | | 7.50 | |
| March 2011 | | | 9.00 | | | | 7.72 | |
Notes
| | |
| (1) | | Shares were traded on the Nasdaq Global Select Market up to and including June 15, 2007 and then on the NYSE on and after June 18, 2007. |
| |
| (2) | | All numbers have been adjusted to reflect the two (2) for one (1) stock split effective September 10, 2007. |
The transfer of our common shares is managed by our transfer agent, BNY Mellon Shareowner Services, 480 Washington Boulevard, Jersey City, NJ 07310 (Tel:201-680-5258; Fax:201-680-4604).
Not applicable.
Our common shares are quoted on the NYSE under the symbol “TTT”.
Not applicable.
Not applicable.
44
Not applicable.
| |
| ITEM 10: | Additional Information |
Not Applicable.
| |
| B. | Memorandum and Articles of Association |
We are organized under the laws of the Province of British Columbia, Canada and have been assigned the number C0707841.
Our Articles do not contain a description of our objects and purposes.
Our Articles do not restrict a director’s power to vote on a proposal, arrangement or contract in which the director is materially interested, vote compensation to themselves or any other members of their body in the absence of an independent quorum or exercise borrowing powers. There is no mandatory retirement age for our directors and our directors are not required to own securities of our company in order to serve as directors.
Our authorized capital consists of an unlimited number of common shares without par value and an unlimited number of Class A preferred shares without par value. Our Class A preferred shares may be issued in one or more series and our directors may fix the number of shares which is to comprise each series and designate the rights, privileges, restrictions and conditions attaching to each series.
Holders of our common shares are entitled to vote at all meetings of shareholders, except meetings at which only holders of a specified class of shares are entitled to vote, receive any dividend declared by us and, subject to the rights, privileges, restrictions and conditions attaching to any other class of shares, receive the remaining property of our company upon dissolution.
Our Class A preferred shares of each series rank on a parity with our Class A preferred shares of any other series and are entitled to a preference over our common shares with respect to the payment of dividends and the distribution of assets or return of capital in the event of liquidation, dissolution orwinding-up of our company.
The provisions in our Articles attaching to our common shares and Class A preferred shares may be altered, amended, repealed, suspended or changed by the affirmative vote of the holders of not less than two-thirds of the common shares and two-thirds of the Class A preferred shares, respectively, present in person or by proxy at any such meeting of holders.
Our Articles provide for three classes of directors with staggered terms. Each director holds office until the expiry of his term or until his successor is elected or appointed, unless his office is earlier vacated in accordance with our Articles or with the provisions of the British ColumbiaBusiness Corporations Act. At each annual meeting of our company, a class of directors is elected to hold office for a three-year term. Successors to the class of directors whose terms expire are identified as being of the same class as the directors they succeed and are elected to hold office for a term expiring at the third succeeding annual meeting of shareholders. A director appointed or elected to fill a vacancy on the board of directors holds office for the unexpired term of his predecessor.
An annual meeting of shareholders must be held at such time in each year that is not later than fifteen months after the last preceding annual meeting and at such place as our board of directors, or failing it, our Chairman, Managing Director or President, may from time to time determine. The holders of not less than five percent of our issued shares that carry the right to vote at a meeting may requisition our directors to call a meeting of shareholders for the purposes stated in the requisition. The quorum for the transaction of business at any meeting of shareholders is two persons who are entitled to vote at the meeting in person or by proxy. Only persons entitled to vote, our directors and auditors and others who, although not entitled to vote, are otherwise entitled or required to be present, are entitled to be present at a meeting of shareholders.
Except as provided in theInvestment Canada Act, there are no limitations specific to the rights of non-Canadians to hold or vote our common shares under the laws of Canada or British Columbia, or in our charter documents. See the
45
section of this annual report onForm 20-F entitled “Exchange Controls” below for a discussion of the principal features of theInvestment Canada Actfor non-Canadian residents proposing to acquire our common shares.
As set forth above, our Articles contain certain provisions that would have an effect of delaying, deferring or preventing a change in control of our company, including authorizing the issuance by our board of directors of preferred stock in series, providing for a classified board of directors with staggered, three-year terms and limiting the persons who may call special meetings of shareholders. Our Articles do not contain any provisions that would operate only with respect to a merger, acquisition or corporate restructuring of our company.
Our Articles do not contain any provisions governing the ownership threshold above which shareholder ownership must be disclosed.
Our Articles are not significantly different from the requirements of theBusiness Corporations Act (British Columbia), and the conditions imposed by our Articles governing changes in capital are not more stringent than what is required by theBusiness Corporations Act(British Columbia).
The following summary of certain material provisions of the agreements referenced below is not complete and these provisions are qualified in their entirety by reference to the full text of such agreements.
In September 2010, we entered into an agreement with Mass and our wholly-owned subsidiary, which provided for our acquisition of Mass by way of a multi-step transaction, including the offer to purchase all of the outstanding class A common shares of Mass and the subsequent amalgamation of Mass with our wholly-owned subsidiary. For further information, please see the section of this annual report onForm 20-F entitled “Item 4: Information on the Company— History and Development of the Company”.
In February 2010, we entered into an Arrangement Agreement with KID whereby we agreed, subject to receipt of shareholder approval and the satisfaction of other conditions as set forth in the agreement, to distribute to our shareholders all of the shares of KID currently held by us in several distributions. Pursuant to the Arrangement Agreement, we made distributions of the KID shares held by us to our shareholders on March 30, 2010, July 1, 2010, September 23, 2010 and December 31, 2010. For further information, please see the section of this annual report onForm 20-F entitled “Item 4: Information on the Company — History and Development of the Company”.
There are presently no governmental laws, decrees or regulations in Canada which restrict the export or import of capital, or which impose foreign exchange controls or affect the remittance of interest, dividends or other payments to non-resident holders of our common shares. However, any remittances of dividends to shareholders not resident in Canada are subject to withholding tax in Canada. See “Item 10: Additional Information — Taxation”.
Except as provided in theInvestment Canada Act, there are no limitations specific to the rights of non-Canadians to hold or vote our common shares under the laws of Canada or British Columbia or in our charter documents. The following summarizes the principal features of theInvestment Canada Act for non-Canadian residents proposing to acquire our common shares.
This summary is of a general nature only and is not intended to be, and should not be construed to be, legal advice to any holder or prospective holder of our common shares, and no opinion or representation to any holder or prospective holder of our common shares is hereby made. Accordingly, holders and prospective holders of our common shares should consult with their own legal advisors with respect to the consequences of purchasing and owning our common shares.
TheInvestment Canada Actgoverns the direct or indirect acquisition of control of an existing Canadian business by non-Canadians. Under theInvestment Canada Act, non-Canadian persons or entities acquiring “control” (as defined in theInvestment Canada Act) of a corporation carrying on business in Canada are required to either notify, or file an application for review with, Industry Canada, unless a specific exemption, as set out in theInvestment Canada Act, applies. Industry Canada may review any transaction which results in the direct or indirect acquisition of control of a Canadian business, where the gross value of corporate assets exceeds certain threshold levels (which are higher for investors from members of the World Trade Organization, including United States residents, or World Trade Organization member-controlled
46
companies) or where the activity of the business is related to Canada’s cultural heritage or national identity. No change of voting control will be deemed to have occurred, for purposes of theInvestment Canada Act, if less than one-third of the voting control of a Canadian corporation is acquired by an investor. In addition, theInvestment Canada Actpermits the Canadian government to review any investment where the responsible Minister has reasonable grounds to believe that an investment by a non-Canadian could be injurious to national security. No financial threshold applies to a national security review. The Minister may deny the investment, ask for undertakings, provide terms or conditions for the investment or, where the investment has already been made, require divestment. Review can occur before or after closing and may apply to corporate re-organizations where there is no change in ultimate control.
If an investment is reviewable under theInvestment Canada Act, an application for review in the form prescribed is normally required to be filed with Industry Canada prior to the investment taking place, and the investment may not be implemented until the review has been completed and the Minister responsible for theInvestment Canada Actis satisfied that the investment is likely to be of net benefit to Canada. If the Minister is not satisfied that the investment is likely to be of net benefit to Canada, the non-Canadian applicant must not implement the investment, or if the investment has been implemented, may be required to divest itself of control of the Canadian business that is the subject of the investment. The Minister is required to provide reasons for a decision that an investment is not of net benefit to Canada.
Certain transactions relating to our common shares will generally be exempt from theInvestment Canada Act, subject to the Minister’s prerogative to conduct a national security review, including:
| | |
| | (a) | the acquisition of our common shares by a person in the ordinary course of that person’s business as a trader or dealer in securities; |
| | |
| | (b) | the acquisition of control of our company in connection with the realization of security granted for a loan or other financial assistance and not for a purpose related to the provisions of theInvestment Canada Act; and |
| | |
| | (c) | the acquisition of control of our company by reason of an amalgamation, merger, consolidation or corporate reorganization following which the ultimate direct or indirect control in fact of our company, through ownership of our common shares, remains unchanged. |
Material Canadian Federal Income Tax Consequences
We consider that the following general summary fairly describes the principal Canadian federal income tax consequences applicable to a holder of our common shares who is a resident of the United States, who is not, will not be and will not be deemed to be, a resident of Canada for purposes of theIncome Tax Act(Canada) and any applicable tax treaty and who does not use or hold, and is not deemed to use or hold, his common shares in the capital of our company in connection with carrying on a business in Canada, referred to as a “non-resident holder”.
This summary is based upon the current provisions of theIncome Tax Act, the regulations thereunder, referred to as the “Regulations”, the current publicly announced administrative and assessing policies of the Canada Revenue Agency and the Canada-United States Tax Convention (1980), as amended, referred to as the “Treaty”. This summary also takes into account the amendments to theIncome Tax Actand the Regulations publicly announced by the Minister of Finance (Canada) prior to the date hereof, referred to as the “Tax Proposals”, and assumes that all such Tax Proposals will be enacted in their present form. However, no assurances can be given that the Tax Proposals will be enacted in the form proposed, or at all. This summary is not exhaustive of all possible Canadian federal income tax consequences applicable to a holder of our common shares and, except for the foregoing, this summary does not take into account or anticipate any changes in law, whether by legislative, administrative or judicial decision or action, nor does it take into account provincial, territorial or foreign income tax legislation or considerations, which may differ from the Canadian federal income tax consequences described herein.
This summary is of a general nature only and is not intended to be, and should not be construed to be, legal, business or tax advice to any particular holder or prospective holder of our common shares, and no opinion or representation with respect to the tax consequences to any holder or prospective holder of our common shares is made. Accordingly, holders and prospective holders of our common shares should consult their own tax advisors with respect to the income tax consequences of purchasing, owning and disposing of our common shares in their particular circumstances.
47
Dividends
Dividends paid on our common shares to a non-resident holder will be subject under theIncome Tax Actto withholding tax which tax is deducted at source by our company. The withholding tax rate for dividends prescribed by theIncome Tax Actis 25% but this rate may be reduced under the provisions of an applicable tax treaty. Under the Treaty, the withholding tax rate is reduced to 15% on dividends paid by our company to residents of the United States and is further reduced to 5% where the beneficial owner of the dividends is a corporation resident in the United States that owns at least 10% of the voting shares of our company.
Capital Gains
A non-resident holder is not subject to tax under theIncome Tax Actin respect of a capital gain realized upon the disposition of a common share of our company unless such share is “taxable Canadian property” (as defined in theIncome Tax Act) of the non-resident holder. Our common shares generally will not be taxable Canadian property of a non-resident holder unless the non-resident holder alone or together with non-arm’s length persons owned, or had an interest in an option in respect of, not less than 25% of the issued shares of any class of our capital stock at any time during the 60-month period immediately preceding the disposition of the shares. In the case of a non-resident holder resident in the United States for whom shares of our company are taxable Canadian property, no Canadian taxes will generally be payable on a capital gain realized on such shares by reason of the Treaty unless the value of such shares is derived principally from real property situated in Canada.
Material United States Federal Income Tax Consequences
The following is a general discussion of certain possible United States Federal foreign income tax matters under current law, generally applicable to a U.S. Holder (as defined below) of our common shares who holds such shares as capital assets. This discussion does not address all aspects of United States Federal income tax matters and does not address consequences peculiar to persons subject to special provisions of Federal income tax law, such as those described below as excluded from the definition of a U.S. Holder. In addition, this discussion does not cover any state, local or foreign tax consequences. See “Certain Canadian Federal Income Tax Consequences” above.
The following discussion is based upon theInternal Revenue Code of 1986, as amended, referred to as the “Code”, Treasury Regulations, published by the Internal Revenue Service, referred to as “IRS”, rulings, published administrative positions of the IRS and court decisions that are currently applicable, any or all of which could be materially and adversely changed, possibly on a retroactive basis, at any time. In addition, this discussion does not consider the potential effects, both adverse and beneficial, of any recently proposed legislation which, if enacted, could be applied, possibly on a retroactive basis, at any time. No assurance can be given that the IRS will agree with such statements and conclusions, or will not take, or a court will not adopt, a position contrary to any position taken herein.
The following discussion is for general information only and is not intended to be, nor should it be construed to be, legal, business or tax advice to any holder or prospective holder of our common shares, and no opinion or representation with respect to the United States Federal income tax consequences to any such holder or prospective holder is made. Accordingly, holders and prospective holders of common shares are urged to consult their own tax advisors with respect to Federal, state, local and foreign tax consequences of purchasing, owning and disposing of our common shares.
U.S. Holders
As used herein, a “U.S. Holder” includes a holder of less than 10% of our common shares who is a citizen or resident of the United States, a corporation created or organized in or under the laws of the United States or of any political subdivision thereof, any entity which is taxable as a corporation for United States tax purposes and any other person or entity whose ownership of our common shares is effectively connected with the conduct of a trade or business in the United States. A U.S. Holder does not include persons subject to special provisions of Federal income tax law, such as tax-exempt organizations, qualified retirement plans, financial institutions, insurance companies, real estate investment trusts, regulated investment companies, broker-dealers, non-resident alien individuals or foreign corporations whose ownership of our common shares is not effectively connected with the conduct of a trade or business in the United States and shareholders who acquired their shares through the exercise of employee stock options or otherwise as compensation.
48
Distributions
The gross amount of a distribution paid to a U.S. Holder will generally be taxable as dividend income to the U.S. Holder for United States Federal income tax purposes to the extent paid out of our current or accumulated earnings and profits, as determined under United States federal income tax principles. Distributions which are taxable dividends and which meet certain requirements will be “qualified dividend income” and taxed to U.S. Holders at a maximum United States Federal rate of 15%. Distributions in excess of our current and accumulated earnings and profits will be treated first as a tax-free return of capital to the extent the U.S. Holder’s tax basis in the common shares and, to the extent in excess of such tax basis, will be treated as a gain from a sale or exchange of such shares.
Capital Gains
In general, upon a sale, exchange or other disposition of common shares, a U.S. Holder will generally recognize a capital gain or loss for United States Federal income tax purposes in an amount equal to the difference between the amount realized on the sale or other distribution and the U.S. Holder’s adjusted tax basis in such shares. Such gain or loss will be a United States source gain or loss and will be treated as a long-term capital gain or loss if the U.S. Holder’s holding period of the shares exceeds one year. If the U.S. Holder is an individual, any capital gain will generally be subject to United States Federal income tax at preferential rates if specified minimum holding periods are met. The deductibility of capital losses is subject to significant limitations.
Foreign Tax Credit
A U.S. Holder who pays (or has had withheld from distributions) Canadian income tax with respect to the ownership of our common shares may be entitled, at the option of the U.S. Holder, to either a deduction or a tax credit for such foreign tax paid or withheld. Generally, it will be more advantageous to claim a credit because a credit reduces United States Federal income taxes on adollar-for-dollar basis, while a deduction merely reduces the taxpayer’s income subject to tax. This election is made on ayear-by-year basis and generally applies to all foreign income taxes paid by (or withheld from) the U.S. Holder during that year. There are significant and complex limitations which apply to the tax credit, among which is an ownership period requirement and the general limitation that the credit cannot exceed the proportionate share of the U.S. Holder’s United States income tax liability that the U.S. Holder’s foreign source income bears to his or its worldwide taxable income. In determining the application of this limitation, the various items of income and deduction must be classified into foreign and domestic sources. Complex rules govern this classification process. The availability of the foreign tax credit and the application of these complex limitations on the tax credit are fact specific and holders and prospective holders of our common shares should consult their own tax advisors regarding their individual circumstances.
Passive Foreign Investment Corporation
We do not believe that we are a passive foreign investment corporation, referred to as a “PFIC”. However, since PFIC status depends upon the composition of a company’s income and assets and the market value of its assets and shares from time to time, there is no assurance that we will not be considered a PFIC for any taxable year. If we were treated as a PFIC for any taxable year during which a U.S. Holder held shares, certain adverse tax consequences could apply to the U.S. Holder.
If we are treated as a PFIC for any taxable year, gains recognized by such U.S. Holder on a sale or other disposition of shares would be allocated ratably over the U.S. Holder’s holding period for the shares. The amount allocated to the taxable year of the sale or other exchange and to any year before we became a PFIC would be taxed as ordinary income. The amount allocated to each other taxable year would be subject to tax at the highest rate in effect for individuals or corporations, as applicable, and an interest charge would be imposed on the amount allocated to such taxable year. Further, any distribution in respect of shares in excess of 125% of the average of the annual distributions on shares received by the U.S. Holder during the preceding three years or the U.S. Holder’s holding period, whichever is shorter, would be subject to taxation as described above. Certain elections may be available to U.S. Holders that may mitigate some of the adverse consequences resulting from PFIC status. However, regardless of whether such elections are made, dividends paid by a PFIC will not be “qualified dividend income” and will generally be taxed at the higher rates applicable to other items of ordinary income.
U.S. Holders and prospective holders should consult their own tax advisors regarding the potential application of the PFIC rules to their ownership of our common shares.
49
| |
| F. | Dividends and Paying Agents |
Not applicable.
Not applicable.
Documents and agreements concerning our company may be inspected at the offices of Sangra Moller LLP, 1000 Cathedral Place, 925 West Georgia Street, Vancouver, British Columbia, Canada.
| |
| I. | Subsidiary Information |
For a list of our significant wholly-owned direct and indirect subsidiaries and significant non-wholly-owned subsidiaries, see “Item 4: Information on the Company — Organizational Structure”.
| |
| ITEM 11: | Quantitative and Qualitative Disclosures About Market Risk |
We are exposed to various market risks from changes in interest rates, foreign currency exchange rates and equity prices which may affect our results of operations and financial condition and, consequently, our fair value. Generally, our management believes that our current financial assets and financial liabilities, due to their short-term nature, do not pose significant financial risks. We use various financial instruments to manage our exposure to various financial risks. The policies for controlling the risks associated with financial instruments include, but are not limited to, standardized company procedures and policies on matters such as hedging of risk exposures, avoidance of undue concentration of risk and requirements for collateral (including letters of credit) to mitigate credit risk. We have risk managers to perform audits and checking functions to ensure that company procedures and policies are complied with.
We use derivative instruments to manage certain exposures to currency exchange rate risks. The use of derivative instruments depends on our management’s perception of future economic events and developments. These types of derivative instruments are generally highly speculative in nature. They are also very volatile as they are highly leveraged given that margin requirements are relatively low in proportion to notional amounts.
Many of our strategies, including the use of derivative instruments and the types of derivative instruments selected by us, are based on historical trading patterns and correlations and our management’s expectations of future events. However, these strategies may not be fully effective in all market environments or against all types of risks. Unexpected market developments may affect our risk management strategies during this time, and unanticipated developments could impact our risk management strategies in the future. If any of the variety of instruments and strategies we utilize is not effective, we may incur losses.
Please refer to Note 30 of our annual consolidated financial statements for a qualitative and quantitative discussion of our exposure to market risks.
| |
| ITEM 12: | Description of Securities Other Than Equity Securities |
Not applicable.
PART II
| |
| ITEM 13: | Defaults, Dividend Arrearages and Delinquencies |
Not applicable.
| |
| ITEM 14: | Material Modifications to Rights of Security Holders and Use Of Proceeds |
Not applicable.
50
| |
| ITEM 15: | Controls and Procedures |
Evaluation of Disclosure Controls and Procedures
Disclosure controls and procedures are controls and other procedures that are designed to ensure that information required to be disclosed in our company’s reports filed or submitted under theSecurities Exchange Act of 1934is recorded, processed, summarized and reported, within the time periods specified in the Securities and Exchange Commission’s rules and forms. Disclosure controls and procedures include, without limitation, controls and procedures designed to ensure that information required to be disclosed in our company’s reports filed under theSecurities Exchange Act of 1934is accumulated and communicated to management, including our company’s Chief Executive Officer and Chief Financial Officer as appropriate, to allow timely decisions regarding required disclosure.
As required byRule 13a-15 under theSecurities Exchange Act of 1934, we have carried out an evaluation of the effectiveness of the design and operation of our company’s disclosure controls and procedures as of the end of the period covered by this annual report onForm 20-F, being December 31, 2010. This evaluation was carried out by our Chief Executive Officer (being our principal executive officer) and Chief Financial Officer (being our principal financial officer). Based upon that evaluation, our Chief Executive Officer and Chief Financial Officer concluded that our company’s disclosure controls and procedures are effective.
Report of Management on Internal Control over Financial Reporting
Management is responsible for establishing and maintaining adequate internal control over financial reporting as defined inRule 13a-15(f) or13d-15(f) under the Securities Exchange Act of 1934, as amended. Our internal control over financial reporting is a process designed to provide reasonable assurance regarding the reliability of financial reporting and the preparation of consolidated financial statements for external purposes in accordance with IFRS. Our internal control over financial reporting includes those policies and procedures that:
| | |
| | 1. | pertain to the maintenance of records that, in reasonable detail, accurately and fairly reflect the transactions and dispositions of our assets and our consolidated entities; |
| |
| | 2. | provide reasonable assurance that transactions are recorded as necessary to permit preparation of the consolidated financial statements in accordance with IFRS, and that receipts and expenditures of our company are being made only in accordance with authorizations of management and our directors; and |
| |
| | 3. | provide reasonable assurance regarding prevention or timely detection of unauthorized acquisition, use, or disposition of our assets that could have a material effect on the consolidated financial statements. |
Management, including our Chief Executive Officer and Chief Financial Officer, conducted an evaluation of the effectiveness of our internal control over financial reporting as of December 31, 2010. In conducting this evaluation, management used the criteria set forth by the Committee of Sponsoring Organizations of the Treadway Commission (COSO) inInternal Control — Integrated Framework.
Based on this evaluation, management concluded that, as of December 31, 2010, our company’s internal control over financial reporting was effective.
The effectiveness of our company’s internal control over financial reporting as of December 31, 2010 has been audited by our independent registered chartered accountants, a member of NEXIA International, Davidson & Company LLP, who also audited our consolidated financial statements for the year ended December 31, 2010. Davidson & Company LLP have expressed an unqualified opinion on the effectiveness of our internal control over financial reporting as of December 31, 2010. Their report is included in this annual report onForm 20-F.
Acquired Business
In the fourth quarter of 2010, we acquired all of the outstanding shares of Mass and consolidated its results of operations from November 16, 2010. The businesses acquired pursuant to our acquisition of Mass have been excluded from management’s report on internal control over financial reporting as there was not sufficient time to complete an assessment of the internal controls of such businesses between the date of the acquisition and the date of management’s assessment of internal controls. Such acquired businesses represent $511.6 million of our total assets as at December 31, 2010 and $53.3 million of our total revenues for the year ended December 31, 2010.
51
Changes in Internal Control over Financial Reporting
As of January 1, 2010, we early adopted IFRS as our standard for financial reporting. In connection with the adoption of IFRS, we updated our internal controls over financial reporting, as necessary, to facilitate the IFRS convergence and transition as well as the ongoing compliance with the IFRS reporting requirements. The impact of the adoption of IFRS on our accounting systems was minimal. Other than the adoption of IFRS and our acquisition of Mass, no other significant changes in internal controls over financial reporting occurred during the period covered by this annual report onForm 20-F that have materially affected, or are reasonably likely to materially affect our internal control over financial reporting.
Inherent Limitations on Effectiveness of Controls
Internal control over financial reporting has inherent limitations. Internal control over financial reporting is a process that involves human diligence and compliance and is subject to lapses in judgment and breakdowns resulting from human failures. Internal control over financial reporting also can be circumvented by collusion or improper management override. Because of such limitations, there is a risk that material misstatements will not be prevented or detected on a timely basis by internal control over financial reporting. However, these inherent limitations are known features of the financial reporting process. Therefore, it is possible to design into the process safeguards to reduce, though not eliminate, this risk.
| |
| ITEM 16A: | Audit Committee Financial Expert |
Our board of directors has determined that Dr. Shuming Zhao, a member of our audit committee, qualifies as an “audit committee financial expert” and is “independent” as the term is used in Section 303A.02 of the NYSE’s Listed Company Manual.
Dr. Shuming Zhao is the Dean, a professor and Ph.D. Advisor of the School of Business, Nanjing University and the Dean of the School of Graduate Studies, Macau University of Science and Technology. He received his B. A. (English Language and Literature) from Nanjing University and his M. A. (Education) and Ph.D. in Higher Education Administration and Human Resource Management from Claremont Graduate School, U.S.A. He is one of the leading business educators in China. Under his leadership, Nanjing University has been selected as a National Key Program in Business Administration. He is a member, Science and Technology Academic Committee of the Ministry of Education; Vice Chairman, Advisory Committee for Business Programs, Ministry of Education; member, Review Committee for Management Sciences, National Natural Science Foundation of China; member, National MBA Advisory Committee; and member, Human Resource Development Committee of Macau Special Administration Region Government. Dr. Zhao is Vice President, China Human Resource Management Research Association; President, Jiangsu Province Human Resource Association; Vice President, Jiangsu Province Enterprise Management Association; and Vice President, Jiangsu Province Entrepreneur Association. Dr. Zhao organized and held four international symposia on multinational business management in 1992, 1996, 1999 and 2002. Since 1994, Dr. Zhao has also acted as a management consultant for several Chinese and international firms. Since 1997, Dr. Zhao has been a visiting professor at the Marshall School of Business at the University of Southern California and he has lectured in countries including the United States, Canada, Japan, the United Kingdom, Germany, Australia, the Netherlands and Singapore. Since 2004, Dr. Zhao has been an independent director on the board of directors of Suning Electronic Co. Ltd.
Code of Ethics and Code of Conduct
Our board of directors encourages and promotes a culture of ethical business conduct through the adoption and monitoring of our codes of ethics and conduct, the insider trading policy and such other policies as may be adopted from time to time.
Our Audit Committee adopted a Code of Ethics for the Senior Executive Officers and Senior Financial Officers on November 9, 2006. Since that date, our board of directors has conducted an assessment of its performance, including the extent to which the board and each director comply with the Code of Ethics. It is intended that such assessment will be conducted annually. The Code of Ethics applies to our Chief Executive Officer, President, Chief Financial Officer,
52
Principal Executive Officer, Principal Financial Officer, Principal Accounting Officer, Controller, persons performing similar functions, and other officers or employees of our company with prominent positions with respect to the filing of reports with securities regulators.
The purpose of the Code of Ethics is to promote: honest and ethical conduct, including the ethical handling of actual or apparent conflicts of interest between personal and professional relationships; full, fair, accurate and timely disclosure in all reports and documents filed with securities regulators; compliance with applicable governmental laws, rules and regulations; the prompt internal reporting of violations of the Code of Ethics; and accountability for adherence to the Code of Ethics.
There has been no conduct of any director or officer that would constitute a departure from the Code of Ethics, and therefore, no material change reports have been filed in this regard.
In addition, our Audit Committee has adopted a written Code of Conduct, which sets out the standards of ethical behaviour required for all employees and officers of our company and our subsidiaries. Our board of directors conducts regular reviews with management for compliance with such policies. The basic principles of the Code of Conduct include: providing customers with the best quality products and services at competitive prices; providing employees with a fair, polite and respectful work environment; keeping company information confidential; keeping client and business partner information confidential; being fair and honest to all parties having business relationships with our company; not doing business with any third parties who are likely to harm our company’s reputation; refraining from any form of discrimination or harassment; and being mindful of the interest of the public and the environment. The Code of Conduct emphasizes that all employees of our company, regardless of their position or status, are accountable for complying with all applicable legal requirements, the general provisions stipulated by the Code of Conduct, and our other business policies.
We will provide a copy of the Code of Ethics or the Code of Conduct to any person without charge, upon request. Requests can be sent by mail to: Terra Nova Royalty Corporation, Suite 1620 — 400 Burrard Street, Vancouver, British Columbia, Canada V6C 3A6.
| |
| ITEM 16C: | Principal Accountant Fees and Services |
Audit Fees
The aggregate fees billed for audit services rendered for the audit of our annual financial statements for the fiscal years ended December 31, 2010 by a member of NEXIA International, Davidson & Company LLP, and December 31, 2009 by Deloitte & Touche LLP were CDN$100,000 and CDN$1,802,425, respectively (including all fees related to the audit of our annual financial statements for the fiscal years ended December 31, 2010 and 2009).
Audit Related Fees
For the fiscal years ended December 31, 2010 and 2009, a member of NEXIA International, Davidson & Company LLP, and Deloitte & Touche LLP, respectively, performed assurance or related services relating to the performance of the audit or review of our financial statements which are not reported under the caption “Audit Fees” above, for aggregate fees totalling CDN$185,000 and CDN$56,858, respectively.
Tax Fees
For the fiscal years ended December 31, 2010 and 2009, the aggregate fees billed for tax compliance, tax advice and tax planning by a member of NEXIA International, Davidson & Company LLP, and Deloitte & Touche LLP, respectively, were $217,050 and $72,407, respectively.
All Other Fees
For the fiscal year ended December 31, 2010 the aggregate fees billed by a member of NEXIA International, Davidson & Company LLP, for non-audit professional services was CDN$46,950 in connection with non-management support services and for the fiscal year ended December 31, 2009 Deloitte & Touche LLP, did not perform any non-audit professional services, other than those services listed above.
53
Audit Committee Pre-approval Policies and Procedures
The audit committee pre-approves all services provided by our independent auditors. All of the services and fees described under the categories of “Audit Fees”, “Audit Related Fees”, “Tax Fees” and “All Other Fees” were reviewed and approved by the audit committee before the respective services were rendered and none of such services were approved by the audit committee pursuant to paragraph (c)(7)(i)(c) ofRule 2-01 ofRegulation S-X.
The audit committee has considered the nature and amount of the fees billed for the fiscal year ended December 31, 2010 by a member of NEXIA International, Davidson & Company LLP, and December 31, 2009 by Deloitte & Touche LLP, and believes that the provision of the services for activities unrelated to the audit is compatible with maintaining the independence of a member of NEXIA International, Davidson & Company LLP, and Deloitte & Touche LLP, respectively.
| |
| ITEM 16D: | Exemptions From the Listing Standards for Audit Committees |
Not applicable.
| |
| ITEM 16E: | Purchases of Equity Securities by the Issuer And Affiliated Purchasers |
In 2010, neither we nor any affiliated purchaser (as defined in theSecurities Exchange Act of 1934) purchased any of our common shares.
| |
| ITEM 16F: | Change in Registrant’s Certifying Accountant |
During the year ended December 31, 2010, one independent accountant who was previously engaged as the principal accountant to audit our financial statements, Deloitte & Touche LLP, resigned.
Resignation of Deloitte & Touche LLP
Upon mutual agreement, Deloitte & Touche LLP resigned as our principal accountant effective November 24, 2010 and we appointed a member of NEXIA International, Davidson & Company LLP as our independent registered public accounting firm for the year ended December 31, 2010. Our Audit Committee and board of directors considered and approved the decision to change accountants.
The audit reports of Deloitte & Touche LLP on our financial statements for the fiscal years ended December 31, 2009 and 2008 prepared in accordance with Canadian GAAP did not contain an adverse opinion, a disclaimer of opinion, a modification or a qualification.
During our two most recent fiscal years and any subsequent interim period preceding such resignation, there were no disagreements with Deloitte & Touche LLP on any matter of accounting principles or practices, financial statement disclosure, or auditing scope or procedure, which disagreements, if not resolved to the satisfaction of Deloitte & Touche LLP, would have caused it to make reference to the subject matter of the disagreements in connection with its report.
None of the following events occurred within our two most recent fiscal years and any subsequent interim period preceding Deloitte & Touche LLP’s resignation:
| | |
| | (A) | Deloitte & Touche LLP advised us that the internal controls necessary for us to develop reliable financial statements did not exist; |
| | |
| | (B) | Deloitte & Touche LLP advised us that information came to Deloitte & Touche LLP attention that has led it to no longer be able to rely on our management’s representations, or that had made it unwilling to be associated with the financial statements prepared by our management; |
| |
| | (C) | Deloitte & Touche LLP advised us of the need to expand significantly the scope of its audit, or that information came to Deloitte & Touche LLP’s attention during our two most recent fiscal years and any subsequent interim period, that if further investigated may: |
| | |
| | (i) | materially impact the fairness or reliability of either: a previously issued audit report or the underlying financial statements, or the financial statements issued or to be issued covering the fiscal period(s) subsequent to the date of the most recent financial statements covered by an audit report (including |
54
| | |
| | | information that may prevent it from rendering an unqualified audit report on those financial statements); or |
| | |
| | (ii) | cause it to be unwilling to rely on our management’s representations or be associated with our financial statements; and |
| | |
| | | due to Deloitte & Touche LLP’s resignation (due to audit scope limitations or otherwise), or for any other reason, Deloitte & Touche LLP did not so expand the scope of its audit or conduct such further investigation; or |
| | |
| | (D) | Deloitte & Touche LLP advised us that information came to Deloitte & Touche LLP’s attention that it had concluded materially impacts the fairness or reliability of either: |
| | |
| | (i) | a previously issued audit report or the underlying financial statements, or |
| |
| | (ii) | the financial statements issued or to be issued covering the fiscal period(s) subsequent to the date of the most recent financial statements covered by an audit report (including information that, unless resolved to Deloitte & Touche LLP’s satisfaction, would prevent it from rendering an unqualified audit report on those financial statements); and |
due to Deloitte & Touche LLP’s resignation (due to audit scope limitations or otherwise), or for any other reason, the issue had not been resolved to Deloitte & Touche LLP’s satisfaction prior to its resignation.
Appointment of a Member of NEXIA International, Davidson & Company LLP
Our board of directors appointed a member of NEXIA International, Davidson & Company LLP, to be our principal accountant effective November 24, 2010.
During our two most recent fiscal years and any subsequent interim period prior to engaging a member of NEXIA International, Davidson & Company LLP, we did not consult them regarding (i) the application of accounting principles to a specified transaction, either completed or proposed, or the type of audit opinion that might be rendered on our financial statements, or (ii) any matter that was either the subject of a disagreement or a reportable event as described in Item 16F(a)(1)(v) ofForm 20-F.
Disclosure Provided to Former Accountants
We have provided Deloitte & Touche LLP and a member of NEXIA International, Davidson & Company LLP, with a copy of our disclosure under Item 16F of this annual report onForm 20-F. We have requested that Deloitte & Touche LLP, and provided the opportunity to Davidson & Company LLP, to furnish us with a letter addressed to the Commission stating whether it agrees with the statements made by us in response to this Item 16F(a) and if not, stating the respects in which it does not agree. We have filed the letter from Deloitte & Touche LLP as Exhibit 15.1 to this annual report onForm 20-F.
| |
| ITEM 16G: | Corporate Governance |
Shares of our common stock are listed on the NYSE. Summarized below are the significant differences between our corporate governance rules and the corporate governance rules applicable to U.S. domestic issuers under the listing standards of the NYSE:
| | |
| | • | Section 303A.03 of the NYSE’s Listed Company Manual requires the non-management directors of a listed company to meet at regularly scheduled executive sessions without management. |
| | |
| | | Since January 1, 2006, our independent directors (all of whom are non-management directors) have not held any meetings at which non-independent directors and members of management were not in attendance. |
| | |
| | • | Section 303A.08 of the NYSE’s Listed Company Manual requires shareholder approval of all equity compensation plans and material revisions to such plans. |
Our current stock option plan requires shareholder approval of the plan, but not shareholder approval of material revisions to the plan.
55
| |
| ITEM 17: | Financial Statements |
Not applicable. See “Item 18 — Financial Statements”.
56
| |
| ITEM 18: | Financial Statements |
The following attached financial statements are incorporated herein:
| | | | | | | | | |
| | | | | | | | |
| | | | | Report of Independent Registered Chartered Accountants, a member of NEXIA International, Davidson & Company LLP, dated March 31, 2011 on the consolidated financial statements of our company for the years ended December 31, 2010 and 2009 | | | 58 | |
| | | | | | | | |
| | | | | Report of Independent Registered Chartered Accountants, a member of NEXIA International, Davidson & Company on the effectiveness of internal controls over financial reporting | | | 59 | |
| | | | | | | | |
| | | | | Report of Independent Chartered Accountants, Deloitte & Touche LLP, dated March 26, 2011 on the consolidated financial statements of our company for the year ended December 31, 2009 and 2008 prepared in accordance with Canadian generally accepted accounting principles | | | 61 | |
| | | | | | | | |
| | | | | Consolidated statements of financial position as at December 31, 2010, December 31, 2009 and January 1, 2009 | | | 62 | |
| | | | | | | | |
| | | | | Consolidated statements of operations for the years ended December 31, 2010 and 2009 | | | 63 | |
| | | | | | | | |
| | | | | Consolidated statements of comprehensive income for the years ended December 31, 2010 and 2009 | | | 64 | |
| | | | | | | | |
| | | | | Consolidated statements of changes in equity for the years ended December 31, 2010 and 2009 | | | 65 | |
| | | | | | | | |
| | | | | Consolidated statements of cash flows for the years ended December 31, 2010 and 2009 | | | 66 | |
| | | | | | | | |
| | | | | Notes to consolidated financial statements for the years ended December 31, 2010 and 2009 | | | 67 | |
57
INDEPENDENT AUDITORS’ REPORT
To the Board of Directors and Shareholders of
Terra Nova Royalty Corporation
(formerly KHD Humboldt Wedag International Ltd.)
We have audited the accompanying consolidated statements of financial position of Terra Nova Royalty Corporation (formerly KHD Humboldt Wedag International Ltd.) and subsidiaries (the “Company”) as at December 31, 2010, 2009 and January 1, 2009 and the related consolidated statements of operations, comprehensive income, changes in equity and cash flows for the years ended December 31, 2010 and 2009. The Company’s management is responsible for these financial statements. Our responsibility is to express an opinion on these financial statements based on our audits.
We conducted our audits in accordance with the standards of the Public Company Accounting Oversight Board (United States). Those standards require that we plan and perform an audit to obtain reasonable assurance whether the financial statements are free of material misstatement. An audit includes examining, on a test basis, evidence supporting the amounts and disclosures in the financial statements. An audit also includes assessing the accounting principles used and significant estimates made by management, as well as evaluating the overall financial statement presentation. We believe that our audits provide a reasonable basis for our opinion.
In our opinion, the consolidated financial statements present fairly, in all material respects, the financial position of the Company as at December 31, 2010, 2009 and January 1, 2009, and the results of its operations and cash flows for each of the years ended December 31, 2010 and 2009 in accordance with International Financial Reporting Standards as issued by the International Accounting Standards Board.
The consolidated statements of financial position as at December 31, 2009 and 2008 and the consolidated statements of income, shareholders’ equity and comprehensive income (loss) and cash flows for each of the two years in the period ended December 31, 2009 (not presented separately herein), prepared in accordance with Canadian generally accepted accounting principles, as presented in Note 36 to these consolidated financial statements, were audited by other auditors who expressed an opinion without reservation on those statements in their report dated March 26, 2010.
We have also audited, in accordance with the standards of the Public Accountability Oversight Board (United States), the effectiveness of the Company’s internal control over financial reporting as of December 31, 2010, based on criteria established inInternal Control — Integrated Framework issued by the Committee of Sponsoring Organizations of the Treadway Commission (COSO), and our report dated March 31, 2011 expressed an unqualified opinion.
“DAVIDSON & COMPANY LLP”
| |
| Vancouver, Canada | Chartered Accountants |
March 31, 2011
58
INDEPENDENT AUDITORS’ REPORT
To the Board of Directors and Shareholders of
Terra Nova Royalty Corporation
(formerly KHD Humboldt Wedag International Ltd.)
We have audited the internal control over financial reporting of Terra Nova Royalty Corporation (formerly KHD Humboldt Wedag International Ltd.) and subsidiaries (the “Company”) as of December 31, 2010, based on criteria established inInternal Control — Integrated Framework issued by the Committee of Sponsoring Organizations of the Treadway Commission (COSO). As described in Management’s Report on Internal Control over Financial Reporting, management excluded from its assessment the internal control over financial reporting of Mass Financial Corp. and its subsidiaries (“Mass”) which it acquired on November 15, 2010. The assets of Mass consist of 60% of the Company’s total assets; 47% of the Company’s net assets; 60% of the Company’s revenues; 12% of the income before income taxes; and 13% of the income from continuing operations as of and for the year ended December 31, 2010. Accordingly, our audit did not include the internal control over financial reporting of Mass. The Company’s management is responsible for maintaining effective internal control over financial reporting and for its assessment of the effectiveness of internal control over financial reporting included in the accompanying Management’s Report on Internal Control over Financial Reporting. Our responsibility is to express an opinion on the Company’s internal control over financial reporting based on our audit.
We conducted our audit in accordance with the standards of the Public Company Accounting Oversight Board (United States). Those standards require that we plan and perform the audit to obtain reasonable assurance about whether effective internal control over financial reporting was maintained in all material respects. Our audit included obtaining an understanding of internal control over financial reporting, assessing the risk that a material weakness exists, and testing and evaluating the design and operating effectiveness of internal control based on the assessed risk. Our audit also included performing such other procedures as we considered necessary in the circumstances. We believe that our audit provides a reasonable basis for our opinion.
A company’s internal control over financial reporting is a process designed by, or under the supervision of, the Company’s principal executive and principal financial officers, or persons performing similar functions, and effected by the Company’s board of directors, management, and other personnel to provide reasonable assurance regarding the reliability of financial reporting and the preparation of financial statements for external purposes in accordance with generally accepted accounting principles. A company’s internal control over financial reporting includes those policies and procedures that (1) pertain to the maintenance of records that, in reasonable detail, accurately and fairly reflect the transactions and dispositions of the assets of the company; (2) provide reasonable assurance that transactions are recorded as necessary to permit preparation of financial statements in accordance with generally accepted accounting principles, and that receipts and expenditures of the company are being made only in accordance with authorizations of management and directors of the company; and (3) provide reasonable assurance regarding prevention or timely detection of unauthorized acquisition, use, or disposition of the company’s assets that could have a material effect on the financial statements.

59
Because of the inherent limitations, internal control over financial reporting, including the possibility of collusion or improper management override of controls, material misstatements due to error or fraud may not be prevented or detected on a timely basis. Also, projections of any evaluation of effectiveness to future periods are subject to the risk that controls may become inadequate because of changes in conditions, or that the degree of compliance with the policies or procedures may deteriorate.
In our opinion, the Company maintained, in all material respects, effective internal control over financial reporting as of December 31, 2010, based on the criteria established inInternal Control — Integrated Framework issued by the Committee of Sponsoring Organizations of the Treadway Commission (COSO).
We have also audited, in accordance with Canadian generally accepted auditing standards and the standards of the Public Company Accounting Oversight Board (United States), the consolidated financial statements as at and for the year ended December 31, 2010 of the Company and our report dated March 31, 2011 expressed an unqualified opinion.
“DAVIDSON & COMPANY LLP”
| |
| Vancouver, Canada | Chartered Accountants |
March 31, 2011
60
Deloitte & Touche LLP
2800 – 1055 Dunsmuir Street
4 Bentall Centre
P.O. Box 49279
Vancouver BC V7X 1P4
Canada
Tel:604-669-4466
Fax:604-685-0395
www.deloitte.ca
Report of Independent Registered Chartered Accountants
To the Board of Directors and Shareholders of
Terra Nova Royalty Corporation (formerly KHD Humboldt Wedag International Ltd.)
We have audited the consolidated balance sheets of Terra Nova Royalty Corporation (formerly KHD Humboldt Wedag International Ltd.) and subsidiaries (the “Company”) as at December 31, 2009 and 2008 and the consolidated statements of income (loss), shareholders’ equity and comprehensive income (loss) and cash flows for each of the two years in the period ended December 31, 2009 (not presented separately herein). These financial statements are the responsibility of the Company’s management. Our responsibility is to express an opinion on these financial statements based on our audits.
We conducted our audits in accordance with Canadian generally accepted auditing standards and the standards of the Public Company Accounting Oversight Board (United States). Those standards require that we plan and perform the audit to obtain reasonable assurance whether the financial statements are free of material misstatement. An audit includes examining, on a test basis, evidence supporting the amounts and disclosures in the financial statements. An audit also includes assessing the accounting principles used and significant estimates made by management, as well as evaluating the overall financial statement presentation. We believe that our audits provide a reasonable basis for our opinion.
In our opinion, these consolidated financial statements present fairly, in all material respects, the financial position of Terra Nova Royalty Corporation (formerly KHD Humboldt Wedag International Ltd.) and subsidiaries as at December 31, 2009 and 2008 and the results of their operations and their cash flows for the years then ended in accordance with Canadian generally accepted accounting principles.
Independent Registered Chartered Accountants
March 26, 2010
Membre de / Member of Deloitte Touche Tohmatsu Limited
61
| | | | | | | | | | | | | | | | | |
| | | | | | December 31,
| | | December 31,
| | | January 1,
| |
| | | Notes | | | 2010 | | | 2009 | | | 2009 | |
| |
ASSETS |
| Current Assets | | | | | | | | | | | | | | | | |
| Cash and cash equivalents | | | | | | $ | 397,697 | | | $ | 38,046 | | | $ | 42,111 | |
| Securities | | | 6 | | | | 27,894 | | | | 11,212 | | | | 54 | |
| Restricted cash | | | 7 | | | | 3,464 | | | | — | | | | — | |
| Loan receivable | | | 8 | | | | 5,792 | | | | — | | | | — | |
| Trade receivables | | | 9 | | | | 13,088 | | | | — | | | | — | |
| Other receivables | | | 10 | | | | 12,107 | | | | 5,666 | | | | 13,243 | |
| Inventories | | | 11 | | | | 67,102 | | | | — | | | | — | |
| Real estate held for sale | | | | | | | 12,480 | | | | — | | | | — | |
| Contract deposits, prepaid and other | | | 12 | | | | 20,847 | | | | 774 | | | | 1,008 | |
| Current assets of discontinued operations | | | 4 | | | | — | | | | 681,049 | | | | 647,594 | |
| | | | | | | | | | | | | | | | | |
| Total current assets | | | | | | | 560,471 | | | | 736,747 | | | | 704,010 | |
| Non-current Assets | | | | | | | | | | | | | | | | |
| Note receivable | | | 13 | | | | — | | | | 1,672 | | | | — | |
| Investment in preferred shares of former subsidiaries | | | 13 | | | | — | | | | — | | | | 19,125 | |
| Securities | | | 14 | | | | 7,262 | | | | — | | | | — | |
| Equity method investments | | | 15 | | | | 5,713 | | | | — | | | | — | |
| Investment property | | | 16 | | | | 38,584 | | | | — | | | | — | |
| Property, plant and equipment | | | 17 | | | | 4,202 | | | | 152 | | | | 186 | |
| Interests in resource properties | | | 18 | | | | 231,297 | | | | 191,488 | | | | 200,000 | |
| Deferred income tax assets | | | 19 | | | | 6,727 | | | | 12,115 | | | | 5,571 | |
| Non-current assets of discontinued operations | | | 4 | | | | — | | | | 9,546 | | | | 7,693 | |
| | | | | | | | | | | | | | | | | |
| Total non-current assets | | | | | | | 293,785 | | | | 214,973 | | | | 232,575 | |
| | | | | | | | | | | | | | | | | |
| | | | | | | $ | 854,256 | | | $ | 951,720 | | | $ | 936,585 | |
| | | | | | | | | | | | | | | | | |
| |
| LIABILITIES AND EQUITY |
| Current Liabilities | | | | | | | | | | | | | | | | |
| Short-term bank borrowings | | | 20 | | | $ | 69,979 | | | $ | — | | | $ | — | |
| Debt, current portion | | | 21 | | | | 4,144 | | | | — | | | | — | |
| Account payables and accrued expenses | | | 22 | | | | 47,130 | | | | 6,022 | | | | 7,903 | |
| Provisions | | | 23 | | | | 362 | | | | — | | | | — | |
| Income tax liabilities | | | | | | | 3,803 | | | | 278 | | | | 125 | |
| Deferred sale liabilities | | | 11 | | | | 23,133 | | | | — | | | | — | |
| Current liabilities relating to discontinued operations | | | 4 | | | | — | | | | 359,626 | | | | 419,583 | |
| | | | | | | | | | | | | | | | | |
| Total current liabilities | | | | | | | 148,551 | | | | 365,926 | | | | 427,611 | |
| Long-term Liabilities | | | | | | | | | | | | | | | | |
| Debt, less current portion | | | 21 | | | | 48,604 | | | | — | | | | — | |
| Provisions | | | 23 | | | | 232 | | | | — | | | | 51,133 | |
| Deferred income tax liabilities | | | 19 | | | | 64,436 | | | | 48,664 | | | | — | |
| Deferred sale liabilities | | | 11 | | | | 39,993 | | | | — | | | | — | |
| Long-term liabilities relating to discontinued operations | | | 4 | | | | — | | | | 96,038 | | | | 68,212 | |
| | | | | | | | | | | | | | | | | |
| Total long-term liabilities | | | | | | | 153,265 | | | | 144,702 | | | | 119,345 | |
| | | | | | | | | | | | | | | | | |
| Total liabilities | | | | | | | 301,816 | | | | 510,628 | | | | 546,956 | |
| Equity | | | | | | | | | | | | | | | | |
| Capital stock | | | 24 | | | | 381,673 | | | | 141,604 | | | | 143,826 | |
| Treasury stock | | | 24 | | | | (67,501 | ) | | | (83,334 | ) | | | (93,793 | ) |
| Contributed surplus | | | | | | | 5,775 | | | | 7,232 | | | | 7,623 | |
| Retained earnings | | | | | | | 213,519 | | | | 354,334 | | | | 328,264 | |
| Accumulated other comprehensive income | | | | | | | 14,290 | | | | 15,853 | | | | — | |
| | | | | | | | | | | | | | | | | |
| Total shareholders’ equity | | | | | | | 547,756 | | | | 435,689 | | | | 385,920 | |
| Non-controlling interests | | | | | | | 4,684 | | | | 5,403 | | | | 3,709 | |
| | | | | | | | | | | | | | | | | |
| Total equity | | | | | | | 552,440 | | | | 441,092 | | | | 389,629 | |
| | | | | | | | | | | | | | | | | |
| | | | | | | $ | 854,256 | | | $ | 951,720 | | | $ | 936,585 | |
| | | | | | | | | | | | | | | | | |
The accompanying notes are an integral part of these consolidated financial statements.
62
TERRA NOVA ROYALTY CORPORATION
(Formerly KHD HUMBOLDT WEDAG INTERNATIONAL LTD.)
CONSOLIDATED STATEMENTS OF OPERATIONS
For the Years Ended December 31, 2010 and 2009
(United States Dollars in Thousands, Except Earnings per Share)
| | | | | | | | | | | | | |
| | | Notes | | | 2010 | | | 2009 | |
| |
| Net sales | | | 5&26 | | | $ | 84,476 | | | $ | 14,718 | |
| Equity income | | | 5&15 | | | | 954 | | | | — | |
| | | | | | | | | | | | | |
| Gross revenues | | | | | | | 85,430 | | | | 14,718 | |
| Costs and Expenses: | | | | | | | | | | | | |
| Costs of sales | | | 26 | | | | 49,352 | | | | 8,525 | |
| Selling, general and administrative | | | | | | | 18,316 | | | | 16,474 | |
| Share-based compensation (recovery) — selling, general and administrative | | | 25 | | | | 72 | | | | (2,713 | ) |
| Interest | | | 30 | | | | 974 | | | | 477 | |
| Loss on derivative contracts | | | | | | | 2,010 | | | | — | |
| | | | | | | | | | | | | |
| | | | | | | | 70,724 | | | | 22,763 | |
| | | | | | | | | | | | | |
| | | | | | | | 14,706 | | | | (8,045 | ) |
| Other items: | | | | | | | | | | | | |
| Currency transaction loss, net | | | | | | | (3,608 | ) | | | (3,208 | ) |
| Loss on settlement of investment in preferred shares of former subsidiaries | | | 13 | | | | — | | | | (9,538 | ) |
| Negative goodwill | | | 3 | | | | 41,058 | | | | — | |
| | | | | | | | | | | | | |
| Income (loss) before income taxes | | | | | | | 52,156 | | | | (20,791 | ) |
| Income tax (expense) recovery: | | | | | | | | | | | | |
| Income taxes | | | 27 | | | | (231 | ) | | | 7,510 | |
| Resource property revenue taxes | | | 27 | | | | (6,744 | ) | | | (3,039 | ) |
| | | | | | | | | | | | | |
| | | | | | | | (6,975 | ) | | | 4,471 | |
| | | | | | | | | | | | | |
| Income (loss) from continuing operations | | | | | | | 45,181 | | | | (16,320 | ) |
| Income (loss) from discontinued operations | | | 4 | | | | (15,449 | ) | | | 54,042 | |
| | | | | | | | | | | | | |
| Net income for the year | | | | | | | 29,732 | | | | 37,722 | |
| Less: Net (income) loss attributable to non-controlling interests | | | | | | | 584 | | | | (1,050 | ) |
| | | | | | | | | | | | | |
| Net income attributable to owners of the parent company | | | | | | $ | 30,316 | | | $ | 36,672 | |
| | | | | | | | | | | | | |
| Consisting of: Continuing operations | | | | | | $ | 45,839 | | | $ | (16,320 | ) |
| Discontinued operations | | | 4 | | | | (15,523 | ) | | | 52,992 | |
| | | | | | | | | | | | | |
| | | | | | | $ | 30,316 | | | $ | 36,672 | |
| | | | | | | | | | | | | |
| Basic earnings (loss) per share: Continuing operations | | | | | | $ | 1.28 | | | $ | (0.54 | ) |
| Discontinued operations | | | | | | | (0.43 | ) | | | 1.75 | |
| | | | | | | | | | | | | |
| | | | | | | $ | 0.85 | | | $ | 1.21 | |
| | | | | | | | | | | | | |
| Diluted earnings (loss) per share Continuing operations | | | | | | $ | 1.28 | | | $ | (0.54 | ) |
| Discontinued operations | | | | | | $ | (0.43 | ) | | | 1.75 | |
| | | | | | | | | | | | | |
| | | | | | | $ | 0.85 | | | $ | 1.21 | |
| | | | | | | | | | | | | |
| Weighted average number of common shares outstanding | | | | | | | | | | | | |
| — basic | | | 28 | | | | 35,857,873 | | | | 30,354,207 | |
| — diluted | | | 28 | | | | 35,858,911 | | | | 30,354,207 | |
The accompanying notes are an integral part of these consolidated financial statements.
63
| | | | | | | | | |
| | | 2010 | | | 2009 | |
| |
| Net income for the year | | $ | 29,732 | | | $ | 37,722 | |
| Other comprehensive income (loss), net of tax | | | | | | | | |
| Unrealized gains and losses on translating financial statements of self-sustaining foreign operations and adjustments from the application of U.S. dollar reporting | | | (7,810 | ) | | | 16,916 | |
| Reclassification adjustment for translation gains and losses to income statements for subsidiaries deconsolidated | | | 3,928 | | | | — | |
Fair value gain onavailable-for-sale securities | | | 10,313 | | | | — | |
Reclassification of fair value gain onavailable-for-sale securities to statements of operations for securities distributed | | | (8,322 | ) | | | — | |
| | | | | | | | | |
| Other comprehensive income (loss) | | | (1,891 | ) | | | 16,916 | |
| | | | | | | | | |
| Comprehensive income for the year | | | 27,841 | | | $ | 54,638 | |
| Less: comprehensive (income) loss attributable to non-controlling interests | | | (912 | ) | | | 2,113 | |
| | | | | | | | | |
| Comprehensive income attributable to owners of the parent company | | $ | 28,753 | | | $ | 52,525 | |
| | | | | | | | | |
| Consisting of: Continuing operations | | $ | 52,069 | | | $ | (2,288 | ) |
| Discontinued operations | | | (23,316 | ) | | | 54,813 | |
| | | | | | | | | |
| | | $ | 28,753 | | | $ | 52,525 | |
| | | | | | | | | |
The accompanying notes are an integral part of these consolidated financial statements.
64
| | | | | | | | | | | | | | | | | | | | | | | | | | | | | | | | | | | | | | | | | | | | | |
| | | | | | | | | | | | | | | Accumulated Other
| | | | | | | | | | |
| | | | | | | | | | | | | | | | | | | | | Comprehensive Income | | | | | | | | | | |
| | | Capital Stock | | | Treasury Stock | | | | | | | | | Available-
| | | Currency
| | | Total
| | | Non-
| | | | |
| | | Number of
| | | | | | Number of
| | | | | | Contributed
| | | Retained
| | | for-Sale
| | | Translation
| | | Shareholders’
| | | controlling
| | | Total
| |
| | | Shares | | | Amount | | | Shares | | | Amount | | | Surplus | | | Earnings | | | Securities | | | Adjustment | | | Equity | | | Interests | | | Equity | |
| |
| | | | | | | | | | | | | | | | | | | | | | | | | | | | | | | | | | | | | | | | | | | | | |
| Balance at January 1, 2009 | | | 36,135,528 | | | $ | 143,826 | | | | (5,612,883 | ) | | $ | (93,793 | ) | | $ | 7,623 | | | $ | 328,264 | | | $ | — | | | $ | — | | | $ | 385,920 | | | $ | 3,709 | | | $ | 389,629 | |
| | | | | | | | | | �� | | | | | | | | | | | | | | | | | | | | | | | | | | | | | | | | | | | |
| Net income | | | — | | | | — | | | | — | | | | — | | | | — | | | | 36,672 | | | | — | | | | — | | | | 36,672 | | | | 1,050 | | | | 37,722 | |
| | | | | | | | | | | | | | | | | | | | | | | | | | | | | | | | | | | | | | | | | | | | | |
| Settlement with an affiliate | | | — | | | | — | | | | (262,734 | ) | | | (2,365 | ) | | | — | | | | — | | | | — | | | | — | | | | (2,365 | ) | | | — | | | | (2,365 | ) |
| | | | | | | | | | | | | | | | | | | | | | | | | | | | | | | | | | | | | | | | | | | | | |
| Cancellation of treasury stock | | | (558,373 | ) | | | (2,222 | ) | | | 558,373 | | | | 12,824 | | | | — | | | | (10,602 | ) | | | — | | | | — | | | | — | | | | — | | | | — | |
| | | | | | | | | | | | | | | | | | | | | | | | | | | | | | | | | | | | | | | | | | | | | |
| Purchase of shares in a subsidiary | | | — | | | | — | | | | — | | | | — | | | | — | | | | — | | | | — | | | | — | | | | — | | | | (419 | ) | | | (419 | ) |
| | | | | | | | | | | | | | | | | | | | | | | | | | | | | | | | | | | | | | | | | | | | | |
| Stock-based compensation | | | — | | | | — | | | | — | | | | — | | | | (391 | ) | | | — | | | | — | | | | — | | | | (391 | ) | | | — | | | | (391 | ) |
| | | | | | | | | | | | | | | | | | | | | | | | | | | | | | | | | | | | | | | | | | | | | |
| Translation adjustment | | | — | | | | — | | | | — | | | | — | | | | — | | | | — | | | | — | | | | 15,853 | | | | 15,853 | | | | 1,063 | | | | 16,916 | |
| | | | | | | | | | | | | | | | | | | | | | | | | | | | | | | | | | | | | | | | | | | | | |
| | | | | | | | | | | | | | | | | | | | | | | | | | | | | | | | | | | | | | | | | | | | | |
| Balance at December 31, 2009 | | | 35,577,155 | | | $ | 141,604 | | | | (5,317,244 | ) | | $ | (83,334 | ) | | $ | 7,232 | | | $ | 354,334 | | | $ | — | | | $ | 15,853 | | | $ | 435,689 | | | $ | 5,403 | | | $ | 441,092 | |
| | | | | | | | | | | | | | | | | | | | | | | | | | | | | | | | | | | | | | | | | | | | | |
| Net income | | | — | | | | — | | | | — | | | | — | | | | — | | | | 30,316 | | | | — | | | | — | | | | 30,316 | | | | (584 | ) | | | 29,732 | |
| | | | | | | | | | | | | | | | | | | | | | | | | | | | | | | | | | | | | | | | | | | | | |
| Dividend paid | | | — | | | | — | | | | — | | | | — | | | | — | | | | — | | | | — | | | | — | | | | — | | | | (1,212 | ) | | | (1,212 | ) |
| | | | | | | | | | | | | | | | | | | | | | | | | | | | | | | | | | | | | | | | | | | | | |
| Cancellation of treasury stock | | | (2,174,988 | ) | | | (8,676 | ) | | | 2,174,988 | | | | 18,459 | | | | — | | | | (9,783 | ) | | | — | | | | — | | | | — | | | | — | | | | — | |
| | | | | | | | | | | | | | | | | | | | | | | | | | | | | | | | | | | | | | | | | | | | | |
| Purchase of shares in a company | | | 41,400 | | | | 303 | | | | — | | | | — | | | | — | | | | — | | | | — | | | | — | | | | 303 | | | | — | | | | 303 | |
| | | | | | | | | | | | | | | | | | | | | | | | | | | | | | | | | | | | | | | | | | | | | |
| Purchase of shares in a subsidiary | | | — | | | | — | | | | — | | | | — | | | | — | | | | — | | | | — | | | | — | | | | — | | | | (12 | ) | | | (12 | ) |
| | | | | | | | | | | | | | | | | | | | | | | | | | | | | | | | | | | | | | | | | | | | | |
| Distribution of shares in a former subsidiary | | | — | | | | — | | | | — | | | | — | | | | — | | | | (161,348 | ) | | | — | | | | — | | | | (161,348 | ) | | | (3,930 | ) | | | (165,278 | ) |
| | | | | | | | | | | | | | | | | | | | | | | | | | | | | | | | | | | | | | | | | | | | | |
| Rights offering | | | 7,571,227 | | | | 49,549 | | | | — | | | | — | | | | — | | | | — | | | | — | | | | — | | | | 49,549 | | | | — | | | | 49,549 | |
| | | | | | | | | | | | | | | | | | | | | | | | | | | | | | | | | | | | | | | | | | | | | |
| Acquisition of Mass Financial Corp. | | | 24,992,122 | | | | 198,487 | | | | (328,239 | ) | | | (2,626 | ) | | | — | | | | — | | | | — | | | | — | | | | 195,861 | | | | 5,313 | | | | 201,174 | |
| | | | | | | | | | | | | | | | | | | | | | | | | | | | | | | | | | | | | | | | | | | | | |
| Exercise of stock options | | | 25,000 | | | | 406 | | | | — | | | | — | | | | (80 | ) | | | — | | | | — | | | | — | | | | 326 | | | | — | | | | 326 | |
| | | | | | | | | | | | | | | | | | | | | | | | | | | | | | | | | | | | | | | | | | | | | |
| Stock-based compensation | | | — | | | | — | | | | — | | | | — | | | | (1,377 | ) | | | — | | | | | | | | — | | | | (1,377 | ) | | | 34 | | | | (1,343 | ) |
| | | | | | | | | | | | | | | | | | | | | | | | | | | | | | | | | | | | | | | | | | | | | |
Net change inavailable-for-sale securities | | | — | | | | — | | | | — | | | | — | | | | — | | | | — | | | | 1,991 | | | | — | | | | 1,991 | | | | — | | | | 1,991 | |
| | | | | | | | | | | | | | | | | | | | | | | | | | | | | | | | | | | | | | | | | | | | | |
| Translation adjustment | | | — | | | | — | | | | — | | | | — | | | | — | | | | — | | | | — | | | | (3,554 | ) | | | (3,554 | ) | | | (328 | ) | | | (3,882 | ) |
| | | | | | | | | | | | | | | | | | | | | | | | | | | | | | | | | | | | | | | | | | | | | |
| | | | | | | | | | | | | | | | | | | | | | | | | | | | | | | | | | | | | | | | | | | | | |
| Balance at December 31, 2010 | | | 66,031,916 | | | $ | 381,673 | | | | (3,470,495 | ) | | $ | (67,501 | ) | | $ | 5,775 | | | $ | 213,519 | | | $ | 1,991 | | | $ | 12,299 | | | $ | 547,756 | | | $ | 4,684 | | | $ | 552,440 | |
| | | | | | | | | | | | | | | | | | | | | | | | | | | | | | | | | | | | | | | | | | | | | |
Components of Capital Stock
| | | | | | | | | | | | | | | | | | | | | | | | | | | | | | | | | |
| | | Common Shares | | | Class A Common Shares* | | | Preferred Shares* | | | Total Capital Stock | |
| | | Number of
| | | | | | Number of
| | | | | | Number of
| | | | | | Number of
| | | | |
| | | Shares | | | Amount | | | Shares | | | Amount | | | Shares | | | Amount | | | Shares | | | Amount | |
| |
| Balance at January 1, 2009 | | | 36,135,528 | | | $ | 143,826 | | | | — | | | $ | — | | | | — | | | $ | — | | | | 36,135,528 | | | $ | 143,826 | |
| Cancellation of treasury stock | | | (558,373 | ) | | | (2,222 | ) | | | — | | | | — | | | | — | | | | — | | | | (558,373 | ) | | | (2,222 | ) |
| | | | | | | | | | | | | | | | | | | | | | | | | | | | | | | | | |
| Balance at December 31, 2009 | | | 35,577,155 | | | | 141,604 | | | | — | | | | — | | | | — | | | | — | | | | 35,577,155 | | | | 141,604 | |
| Cancellation and re-issuance | | | (5,317,244 | ) | | | (21,210 | ) | | | 2,174,988 | | | | 8,676 | | | | 3,142,256 | | | | 12,534 | | | | — | | | | — | |
| Cancellation of treasury stock | | | — | | | | — | | | | (2,174,988 | ) | | | (8,676 | ) | | | — | | | | — | | | | (2,174,988 | ) | | | (8,676 | ) |
| Purchase of shares in subsidiaries | | | 41,400 | | | | 303 | | | | — | | | | — | | | | — | | | | — | | | | 41,400 | | | | 303 | |
| Rights offering | | | 7,571,227 | | | | 49,549 | | | | — | | | | — | | | | — | | | | — | | | | 7,571,227 | | | | 49,549 | |
| Acquisition of Mass Financial Corp. | | | 24,992,122 | | | | 198,487 | | | | — | | | | — | | | | — | | | | — | | | | 24,992,122 | | | | 198,487 | |
| Exercise of stock options | | | 25,000 | | | | 406 | | | | — | | | | — | | | | — | | | | — | | | | 25,000 | | | | 406 | |
| | | | | | | | | | | | | | | | | | | | | | | | | | | | | | | | | |
| Balance at December 31, 2010 | | | 62,889,660 | | | $ | 369,139 | | | | — | | | $ | — | | | | 3,142,256 | | | $ | 12,534 | | | | 66,031,916 | | | $ | 381,673 | |
| | | | | | | | | | | | | | | | | | | | | | | | | | | | | | | | | |
| | |
| * | | All the Class A Common Shares and Preferred Shares were and are held by the Group as treasury stock. |
The accompanying notes are an integral part of these consolidated financial statements.
65
| | | | | | | | | |
| | | 2010 | | | 2009 | |
| |
| Cash flows from continuing operating activities | | | | | | | | |
| Income from continuing operations | | $ | 45,181 | | | $ | (16,320 | ) |
| Adjustments for: | | | | | | | | |
| Amortization, depreciation and depletion | | | 11,766 | | | | 8,563 | |
| Foreign currency transaction (gains) losses, net | | | 3,608 | | | | 3,208 | |
| (Gain) loss on short-term securities | | | 171 | | | | (324 | ) |
| Stock-based compensation (recovery) | | | 72 | | | | (2,713 | ) |
| Future income taxes | | | (1,447 | ) | | | (7,598 | ) |
| Equity income | | | (954 | ) | | | — | |
| Market value increment on commodity inventories | | | (1,982 | ) | | | — | |
| Negative goodwill | | | (41,058 | ) | | | — | |
| Loss on settlement of investment in preferred shares of former subsidiaries | | | — | | | | 9,538 | |
| Changes in operating assets and liabilities, net of effects of acquisitions and dispositions | | | | | | | | |
| Short-term securities | | | (395 | ) | | | — | |
| Restricted cash | | | 723 | | | | — | |
| Receivables | | | 4,380 | | | | (958 | ) |
| Inventories | | | (4,403 | ) | | | — | |
| Contract deposits, prepaid and other | | | 7,334 | | | | 371 | |
| Short-term bank borrowings | | | (4,893 | ) | | | — | |
| Accounts payable and accrued expenses | | | 23,755 | | | | (1,692 | ) |
| Income tax liabilities | | | 318 | | | | 129 | |
| Provisions | | | (73 | ) | | | — | |
| Other | | | 1,795 | | | | 175 | |
| | | | | | | | | |
| Cash flows (used in) provided by continuing operating activities | | | 43,898 | | | | (7,621 | ) |
| Cash flows from continuing investing activities | | | | | | | | |
| Purchases of property, plant and equipment, net | | | (1,111 | ) | | | (6 | ) |
| Purchases of long-term investments | | | (1,338 | ) | | | — | |
| Proceeds from sales of long-term investments | | | 13,519 | | | | — | |
| Settlement of investment in preferred shares of former subsidiaries | | | — | | | | 6,195 | |
| Increase in loan receivables | | | (9,715 | ) | | | — | |
| Decrease in loan receivables | | | 8,000 | | | | — | |
| Acquisition of a subsidiary (net of cash acquired) | | | 213,850 | | | | — | |
| Other | | | 981 | | | | — | |
| | | | | | | | | |
| Cash flows provided by continuing investing activities | | | 224,186 | | | | 6,189 | |
| Cash flows from continuing financing activities | | | | | | | | |
| Debt repayment | | | (813 | ) | | | — | |
| Issuance of shares | | | 48,224 | | | | — | |
| Dividend paid to non-controlling interests | | | (1,212 | ) | | | — | |
| | | | | | | | | |
| Cash flows provided by continuing financing activities | | | 46,199 | | | | — | |
| Cash flows used in discontinued operating activities | | | (15,671 | ) | | | (2,227 | ) |
| Cash flows (used in) provided by discontinued investing activities | | | (286,375 | ) | | | 1,095 | |
| Cash flows used in discontinued financing activities | | | (10,329 | ) | | | — | |
| Exchange rate effect on cash and cash equivalents | | | (24,762 | ) | | | 14,028 | |
| | | | | | | | | |
| Change in cash and cash equivalents | | | (22,854 | ) | | | 11,464 | |
| Cash and cash equivalents, beginning of year | | | 420,551 | | | | 409,087 | |
| | | | | | | | | |
| Cash and cash equivalents, end of year | | $ | 397,697 | | | $ | 420,551 | |
| | | | | | | | | |
| Cash and cash equivalents at end of year consisted of: | | | | | | | | |
| Cash | | $ | 219,109 | | | $ | 406,219 | |
| Money market and highly liquid funds | | | 178,588 | | | | 14,332 | |
| | | | | | | | | |
| | | $ | 397,697 | | | $ | 420,551 | |
| | | | | | | | | |
| Continuing operations | | $ | 397,697 | | | $ | 38,046 | |
| Discontinued operations | | | — | | | | 382,505 | |
| | | | | | | | | |
| | | $ | 397,697 | | | $ | 420,551 | |
| | | | | | | | | |
| Supplemental cash flows disclosure (see Note 32). | | | | | | | | |
The accompanying notes are an integral part of these consolidated financial statements.
66
| |
| Note 1. | Nature of Business and Summary of Significant Accounting Policies |
Terra Nova Royalty Corporation (“Terra Nova” or the “Company”) is incorporated under the laws of British Columbia, Canada. Terra Nova holds an indirect interest in the Wabush iron ore mine in the Province of Newfoundland and Labrador, Canada and is active in the royalty industry.
In November and December 2010, Terra Nova, through a share exchange, acquired all of the issued and outstanding shares of Mass Financial Corp. (“Mass”) (see Note 3). Mass and its subsidiaries (collectively, “Mass Group”) are primarily in the commodities and resources business, and merchant banking. The Group consolidated the results of the operations of Mass Group since November 16, 2010.
Until the end of March 2010, Terra Nova also operated in the industrial plant technology, equipment and service business for the cement and mining industries through its former subsidiary KHD Humboldt Wedag International AG in Germany and its subsidiaries and affiliates (collectively “KID”). Terra Nova ceased to consolidate KID from March 31, 2010 and completed the spin-off of KID by December 31, 2010 (see Note 4). As a result, the results of operations of KID have been presented as discontinued operations. Accordingly, prior period financial statements, including business segment information as disclosed in Note 5, have been reclassified to reflect this change.
These consolidated financial statements represent the first annual consolidated financial statements of Terra Nova prepared in accordance with the English language version of International Financial Reporting Standards (“IFRS”) as issued by the International Accounting Standards Board (“IASB”), which also include International Accounting Standards (“IAS”) and Interpretations (“IFRIC” and “SIC”). Terra Nova adopted IFRS in accordance with IFRS 1,First-time Adoption of International Financial Reporting Standards. The first date at which IFRS was applied was January 1, 2009. In accordance with IFRS, Terra Nova has:
| | |
| | • | provided comparative financial information; |
| |
| | • | applied the same accounting policies throughout all periods presented; |
| |
| | • | retrospectively applied all effective IFRS as of December 31, 2010, as required; and |
| |
| | • | applied certain optional exemptions and certain mandatory exceptions as applicable for first time IFRS adopters. |
Terra Nova’s consolidated financial statements were previously prepared in accordance with accounting principles generally accepted in Canada (“Canadian GAAP”). Canadian GAAP differs in some areas from IFRS. In preparing these financial statements, management has amended certain accounting, measurement and consolidation methods previously applied in the Canadian GAAP financial statements to comply with IFRS. See Note 36 for reconciliations and descriptions of the effect of the transition from Canadian GAAP to IFRS on equity, earnings and comprehensive income along withline-by-line reconciliations of the statements of financial position as at December 31, 2009 and January 1, 2009 and the statement of operations and statement of comprehensive income for the year ended December 31, 2009.
These financial statements were prepared on going concern and accrual bases (except for cash flow information), under the historical cost convention, as modified by the revaluation of investment property and certain financial assets and financial liabilities at fair value through the statement of operations.
The presentation currency of these consolidated financial statements is the United States (“US”) dollars ($), as rounded to the nearest thousand (except per share amounts).
Principles of Consolidation
The consolidated financial statements include the accounts of Terra Nova and entities it controls (collectively, the “Group” in these consolidated financial statements). Control comprises the power to govern the financial and operating
67
TERRA NOVA ROYALTY CORPORATION
(Formerly KHD HUMBOLDT WEDAG INTERNATIONAL LTD.)
NOTES TO CONSOLIDATED FINANCIAL STATEMENTS — (Continued)
policies of the investee so as to obtain benefit from its activities and is achieved through direct and indirect ownership of voting rights; currently exercisable or convertible potential voting rights; or by way of contractual agreement. Subsidiaries are consolidated from the date of their acquisition, being the date on which the Group obtains control, and continue to be consolidated until the date that such control ceases. The financial statements of subsidiaries are prepared for the same reporting year as Terra Nova, using consistent accounting policies. All intercompany balances and transactions, including unrealized profits arising from intragroup transactions, have been eliminated in full. Unrealized losses are eliminated unless the transaction provides evidence of an impairment of the asset transferred. Non-controlling interests represent the portion of profit or loss and net assets in subsidiaries that is not held by the Group.
Interest in a special interest entity (“SPE”) — A SPE is usually created to accomplish a narrow and well-defined objective. The Group consolidates a SPE because the substance of the relationship between the SPE and the Group indicates that the SPE is controlled by the Group pursuant to SIC-12,Consolidation — Special Purpose Entities.
Interests in joint ventures — A joint venture is a contractual arrangement whereby two or more parties (venturers) undertake an economic activity that is subject to joint control. Joint control exists only when the strategic financial and operating decisions relating to the activity require the unanimous consent of the venturers. A jointly controlled entity is a joint venture that involves the establishment of a company, partnership or other entity to engage in economic activity that the group jointly controls with its fellow venturers.
The results, assets and liabilities of a jointly controlled entity are incorporated in these financial statements using the equity method of accounting. Under the equity method, the investment in a jointly controlled entity is carried in the statement of financial position at cost, plus post-acquisition changes in the Group’s share of net assets of the jointly controlled entity, less distributions received and less any impairment in value of the investment. Loans advanced to jointly controlled entities are also included in the investment on the consolidated statement of financial position. The consolidated statement of operations reflects the Group’s share of the results after tax of the jointly controlled entity.
Financial statements of jointly controlled entities are prepared for the same reporting year as the Group. Where necessary, adjustments are made to those financial statements to bring the accounting policies used into line with those of the Group.
Unrealized gains on transactions between the Group and its jointly controlled entities are eliminated to the extent of the Group’s interest in the jointly controlled entities. Unrealized losses are also eliminated unless the transaction provides evidence of an impairment of the asset transferred.
The Group ceases to use the equity method of accounting on the date from which it no longer has joint control or significant influence over the joint venture, or when the interest becomes held for sale.
Interests in associates — An associate is an entity over which the Group is in a position to exercise significant influence through participation in the financial and operating policy decisions of the investee, but which is not a subsidiary or a joint venture. The results, assets and liabilities of an associate are incorporated in these financial statements using the equity method of accounting as described above for jointly controlled entities.
Foreign Currency Translation
The presentation currency of the Group’s consolidated financial statements is the US dollar. The Group conducts its businesses throughout the world through its subsidiaries whose principal functional currency is any of Canadian dollars, Euros, Chinese yuans, Swiss francs and Indian rupees. The Group chose to use US dollars as its presentation currency because the majority of its shareholders are from the US.
Functional currency is the currency of the primary economic environment in which an entity operates and is normally the currency in which the entity primarily generates and expends cash.
In individual companies, transactions in foreign currencies are initially recorded in the functional currency by applying the rate of exchange ruling at the date of the transaction. Monetary assets and liabilities denominated in foreign
68
TERRA NOVA ROYALTY CORPORATION
(Formerly KHD HUMBOLDT WEDAG INTERNATIONAL LTD.)
NOTES TO CONSOLIDATED FINANCIAL STATEMENTS — (Continued)
currencies are retranslated into the functional currency at the rate of exchange ruling at the date of the statement of financial position. Any resulting exchange differences are included in the statement of operations. Non-monetary assets and liabilities, other than those measured at fair value, are not retranslated subsequent to initial recognition.
In the consolidated financial statements whose presentation currency is US dollars, the assets and liabilities of non-US dollar functional currency subsidiaries, joint ventures and associates, including related goodwill, are translated into US dollars at the rate of exchange ruling at the date of the statement of financial position. The results and cash flows of non-US dollar functional currency subsidiaries, joint ventures and associates are translated into US dollars using average rates of exchange. Exchange adjustments arising when the opening net assets and the profits for the year retained by non-US dollar functional currency subsidiaries, joint ventures and associates are translated into US dollars are taken to a separate component of equity and reported in the other comprehensive income.
Exchange gains and losses arising on long-term intragroup foreign currency borrowings used to finance the Group’s non-US dollar investments are also taken to equity and reported in other comprehensive income. On disposal of a non-US dollar functional currency subsidiary, joint venture or associate, the deferred cumulative amount of exchange gains and losses recognized in equity relating to that particular non-US dollar operation is reclassified to the statement of operations.
The following table sets out exchange rates for the conversion of Canadian dollars (CDN), Euros (EUR or €) and Chinese yuans (Renminbi or RMB), which represented the major trading currencies of the Group, into US dollars:
| | | | | | | | | | | | | |
| | | CDN | | EUR | | RMB |
| |
| Closing rate at December 31, 2010 | | | 1.0054 | | | | 1.3390 | | | | 0.1517 | |
| Average rate for the year 2010 | | | 0.9710 | | | | 1.3264 | | | | 0.1477 | |
| Closing rate at December 31, 2009 | | | 0.9555 | | | | 1.4332 | | | | 0.1465 | |
| Average rate for the year 2009 | | | 0.8757 | | | | 1.3884 | | | | 0.1464 | |
Use of Estimates and Assumptions and Measurement Uncertainty
The preparation of financial statements in conformity with IFRS requires management to make estimates and assumptions that affect the reported amounts of assets and liabilities and disclosure of contingent assets and liabilities at the date of the financial statements and the reported amounts of revenues and expenses during the reporting period. Management’s best estimates are based on the facts and circumstances available at the time estimates are made, historical experience, general economic conditions and trends, and management’s assessment of probable future outcomes of these matters. Actual results could differ from these estimates, and such differences could be material.
| |
| B. | Significant Accounting Policies |
(i) Financial Instruments
All financial assets and financial liabilities are to be classified by characteristicand/or management intent. Except for certain financial instruments which are excluded from the scope, all financial assets are classified into one of four categories: at fair value through profit or loss,held-to-maturity, loans and receivables, andavailable-for-sale; and all financial liabilities are classified into one of two categories: at fair value through profit or loss and other financial liabilities.
Generally, a financial asset or financial liability at fair value through profit or loss is a financial asset or financial liability that meets either of the conditions: (a) it is classified as held for trading if it is (i) acquired or incurred principally for the purpose of selling or repurchasing it in the near term; (ii) part of a portfolio of identified financial instruments that are managed together and for which there is evidence of a recent actual pattern of short-term profit taking; or (iii) a derivative, except for a derivative that is a designated and effective hedging instrument; or (b) it is designated by the Group upon initial recognition as at fair value through profit or loss when certain conditions are met. Generally, a financial instrument cannot be reclassified into or out of the fair value through profit or loss category while it is held or issued. Only if a financial asset is no longer held for the purpose of selling it in the near term or in the rare circumstances that a reliable
69
TERRA NOVA ROYALTY CORPORATION
(Formerly KHD HUMBOLDT WEDAG INTERNATIONAL LTD.)
NOTES TO CONSOLIDATED FINANCIAL STATEMENTS — (Continued)
measure of fair value is no longer available, the Group reclassifies the financial asset at its fair value on the date of reclassification.
Available-for-sale financial assets are those non-derivative financial assets that are designated as available for sale, or that are not classified as loans and receivables,held-to-maturity investments, or fair value through profit or loss.
Non-derivative financial liabilities are classified as other financial liabilities.
When a financial asset or financial liability is recognized initially, the Group measures it at its fair value. The subsequent measurement of a financial instrument and the recognition of associated gains and losses is determined by the financial instrument classification category.
After initial recognition, the Group measures financial assets, including derivatives that are assets, at their fair values, without any deduction for transaction costs it may incur on sale or other disposal, except for the following financial assets:(a) held-to-maturity investments which are measured at amortized cost using the effective interest method; (b) loans and receivables which are measured at amortized cost using the effective interest method; (c) investments in equity instruments that do not have a quoted market price in an active market and whose fair value cannot be reliably measured and derivatives that are linked to and must be settled by delivery of such unquoted equity instruments are measured at cost. All financial assets except those measured at fair value through profit or loss are subject to review for impairment.
After initial recognition, the Group measures all financial liabilities at amortized cost using the effective interest method, except for financial liabilities that are classified as at fair value through profit or loss (including derivatives that are liabilities) which are measured at their fair values (except for derivative liabilities that are linked to and must be settled by delivery of an unquoted equity instrument whose fair value cannot be reliably measured, which should be measured at cost).
A gain or loss on a financial asset or financial liability classified as at fair value through profit or loss is recognized in the statement of operations for the period in which it arises. A gain or loss on anavailable-for-sale financial asset is recognized directly in other comprehensive income, except for impairment losses, until the financial asset is derecognized, at which time the cumulative gain or loss previously recognized in accumulated other comprehensive income is recognized in profit or loss for the period. For financial assets and financial liabilities carried at amortized cost, a gain or loss is recognized in the statement of operations when the financial asset or financial liability is derecognized or impaired, and through the amortization process.
Whenever quoted market prices are available, bid prices are used for the valuation of financial assets while ask prices are used for financial liabilities. When the market for a financial instrument is not active, the Group establishes fair value by using a valuation technique. Valuation techniques include using recent arm’s length market transactions between knowledgeable, willing parties, if available; reference to the current fair value of another instrument that is substantially the same; discounted cash flow analysis; option pricing models and other valuation techniques commonly used by market participants to price the instrument.
An entity classifies fair value measurements using a fair value hierarchy that reflects the significance of the inputs used in making the measurements. The fair value hierarchy has the following levels:
| | |
| | (a) | quoted prices (unadjusted) in active markets for identical assets or liabilities (Level 1); |
| | |
| | (b) | inputs other than quoted prices included in Level 1 that are observable for the asset or liability, either directly (i.e., as prices) or indirectly (i.e., derived from prices) (Level 2); and |
| | |
| | (c) | inputs for the asset or liability that are not based on observable market data (unobservable inputs) (Level 3). |
Assessing the significance of a particular input to the fair value measurement in its entirety requires judgment, considering factors specific to the asset or liability.
70
TERRA NOVA ROYALTY CORPORATION
(Formerly KHD HUMBOLDT WEDAG INTERNATIONAL LTD.)
NOTES TO CONSOLIDATED FINANCIAL STATEMENTS — (Continued)
Transaction costs related to the acquisition ofheld-for-trading financial assets and liabilities are expensed as incurred. Transaction costs are incremental costs that are directly attributable to the acquisition or disposal of a financial asset or liability.
(ii) Cash and Cash Equivalents
Cash and cash equivalents are measured at fair value through profit or loss and include cash on hand, cash at banks and highly liquid investments (e.g. money market funds) readily convertible to a known amount of cash and subject to an insignificant risk of change in value. They have original maturities of three months or less and are generally interest bearing.
(iii) Restricted Cash
Restricted cash, whose use is restricted pursuant to the terms of a contract or an agreement, is measured at fair value through profit or loss.
(iv) Securities
Securities are classified as at fair value through profit or loss (i.e. held for trading), or short-term or long-termavailable-for-sale securities.
Publicly-traded securities (debt and equity) which are acquired principally for the purpose of selling in the near term are classified as held for trading. Securities held for trading are marked to their bid prices on the reporting date and unrealized gains and losses are included in the statement of operations.
Available-for-sale securities consist of publicly-traded securities and unlisted equity securities which are not held for trading and not held to maturity. Long-termavailable-for-sale securities are purchased with the intention to hold until market conditions render alternative investments more attractive. Theavailable-for-sale securities are stated at bid price whenever quoted market prices are available. When the market for theavailable-for-sale security is not active, the Group establishes fair value by using a valuation technique. Unrealized gains and losses are recorded in other comprehensive income unless there has been an other than temporary decline in value, at which time theavailable-for-sale security is written down and the write-down is included in the statement of operations.
Gains and losses on sales of securities are recognized on the average cost basis.
(v) Receivables
Typically, receivables are financial instruments which are not classified as at fair value through profit or loss oravailable-for-sale. They are classified as loans and receivables and are measured at amortized cost without regard to the Group’s intention to hold them to maturity.
Receivables are net of an allowance for credit losses, if any. The Group performs ongoing credit evaluation of customers and adjusts the allowance accounts for specific customer risks and credit factors. Receivables are considered past due on an individual basis based on the terms of the contracts.
(vi) Allowance for Credit Losses
The Group applies credit risk assessment and valuation methods to its loans, trade and other receivables. The Group’s allowance for credit losses is maintained at an amount considered adequate to absorb estimated credit-related losses. Such allowance reflects management’s best estimate of the losses in the Group’s receivables and judgments about economic conditions. Estimates and judgments could change in the near-term, and could result in a significant change to a recognized allowance. Credit losses arise primarily from receivables but may also relate to other credit instruments issued by or on behalf of the Group, such as guarantees and letters of credit. An allowance for credit losses may be increased by provisions which are charged to income and reduced by write-offs net of any recoveries.
71
TERRA NOVA ROYALTY CORPORATION
(Formerly KHD HUMBOLDT WEDAG INTERNATIONAL LTD.)
NOTES TO CONSOLIDATED FINANCIAL STATEMENTS — (Continued)
Specific provisions are established on an individual basis. A country risk provision may be made based on exposures in less developed countries and on management’s overall assessment of the underlying economic conditions in those countries. Write-offs are generally recorded after all reasonable restructuring or collection activities have taken place and there is no realistic prospect of recovery.
(vii) Derivative Financial Instruments
Derivative financial instruments are financial contracts whose value is derived from interest rates, foreign exchange rates or other financial or commodity indices. These instruments are either exchange-traded or negotiated. Derivatives are included on the consolidated statement of financial position and are measured at fair value. The recognition and measurement of derivative financial instruments are covered by IAS 39,Financial Instruments: Recognition and Measurement,which does not apply to contracts that are entered into and continue to be held for the purpose of the receipt or delivery of a non-financial item in accordance with the entity’s expected purchase, sale or usage requirements.
The Group uses derivative financial instruments to manage interest rate risk and to hedge exposures to fluctuations in foreign currencies and commodity prices in accordance with its risk management policy. The Group does not use derivative financial instruments for speculative purposes. A description of the Group’s objectives, policies and strategies with regard to derivatives and other financial instruments is set out in Note 30.
Derivatives are initially recognized in the statement of financial position at fair value on the date the derivative transaction is entered into and are subsequently remeasured at their fair values. Changes in the fair value of derivatives that are designated and qualify as fair value hedges are recognized in the statement of operations together with any changes in the fair value of the hedged item that are attributable to the hedged risk.
Changes in the fair value of the effective portion of derivatives that are designated and qualify as cash flow hedges are recognized in equity through other comprehensive income. Changes in the fair value of the ineffective portion of cash flow hedges are recognized in the statement of operations. Amounts accumulated in equity are transferred to the statement of operations when the underlying transaction occurs or, if the transaction results in a non-financial asset or liability, are included in the initial cost of that asset or liability.
Hedge accounting is discontinued when the hedging instrument expires or is sold, terminated, or exercised, or no longer qualifies for hedge accounting. At that time, any cumulative gain or loss on the hedging instrument recognized in equity is retained in equity until the forecasted transaction occurs. If a hedged transaction is no longer expected to occur, the net cumulative gain or loss recognized in equity is transferred to the statement of operations.
The Group does not hedge its net investment in a foreign operation.
Changes in the fair value of derivative financial instruments that do not qualify for hedge accounting are recognized in the statement of operations as they arise.
Derivatives embedded in other financial instruments or other host contracts are treated as separate derivatives and recorded on the statement of financial position at fair value when their risks and characteristics are not closely related to those of the host contract. Changes in the fair value of those embedded derivatives recognized in the statement of financial position are recognized in the statement of operations as they arise.
Where the Group has both the legal right and intent to settle derivative assets and liabilities simultaneously with a counterparty, the net fair value of the derivative positions is reported as an asset or liability, as appropriate.
(viii) Inventories
Inventories consist of raw materials,work-in-progress, and finished goods. Inventories are recorded at the lower of cost or estimated net realizable value. Cost, where appropriate, includes an allocation of manufacturing overheads incurred in bringing inventories to their present location and condition. Net realizable value represents the estimated selling price less all estimated costs of completion and cost to be incurred in marketing, selling and distribution. The
72
TERRA NOVA ROYALTY CORPORATION
(Formerly KHD HUMBOLDT WEDAG INTERNATIONAL LTD.)
NOTES TO CONSOLIDATED FINANCIAL STATEMENTS — (Continued)
amount of any write-down of inventories to net realizable value and all losses of inventories are recognized as an expense in the period the write-down or loss occurs. The amount of any reversal of any write-down of inventories arising from an increase in net realizable value is recognized as a reduction in the amount of inventories recognized as an expense in the period in which the reversal occurs.
Commodities acquired in commodity broker-trader activities with the purpose of selling in the near future and generating a profit from fluctuations in price or broker-traders’ margin are measured at fair value less costs to sell.
(ix) Properties for Sale
Properties for sale are real estate intended for sale in the ordinary course of business or in the process of construction or development for such sale.
Properties for sale are accounted for as inventories at the lower of cost (on a specific item basis) and net realizable value. Net realizable value is determined by reference to sale proceeds of properties sold in the ordinary course of business less all estimated selling expenses around the reporting date, or by management estimates based on prevailing market conditions. The amount of any write-down of properties to net realizable value is recognized as an expense in the period the write-down occurs. The amount of any reversal of any write-down arising from an increase in net realizable value is recognized in the period in which the reversal occurs.
(x) Investment Property
Investment property is property that is held for generating rental income or for capital appreciation or both. The Group’s investment property comprises freehold land and buildings. Investment property is initially recognized at historical cost including related transaction costs. After initial recognition, investment property is held at fair value, with changes in value recognized in the Group’s profit or loss for the period in which it arises.
The fair value of investment property is the price at which the property could be exchanged between knowledgeable, willing parties in an arm’s length transaction. Fair value specifically excludes an estimated price inflated or deflated by special terms or circumstances, special considerations or concessions granted by anyone associated with the sale. An entity determines fair value without any deduction for transaction costs it may incur on sale or other disposal. Fair value on the Group’s investment property is based on valuations prepared annually by external evaluators in accordance with guidance issued by the International Valuation Standard Committee and reviewed by the Group in accordance with guidance on fair value in IAS 40,Investment Property.
(xi) Property, Plant and Equipment
Property, plant and equipment are carried at cost, net of accumulated depreciation and, if any, accumulated impairment losses. The initial cost of an asset comprises its purchase price or construction cost, any costs directly attributable to bringing the asset into operation, the initial estimate of any decommissioning obligation, if any, and, for qualifying assets, borrowing costs. The purchase price or construction cost is the aggregate amount paid and the fair value of any other consideration given to acquire the asset. Where an asset or part of an asset that was separately depreciated is replaced and it is probable that future economic benefits associated with the item will flow to the Group, the expenditure is capitalized and the carrying amount of the replaced asset is derecognized. Inspection costs associated with major maintenance programs are capitalized and amortized over the period to the next inspection.
Property, plant, and equipment are amortized according to the following lives and methods:
| | | | | | | | | |
| | | Lives | | Method |
| |
| Buildings (including leasehold improvement) | | | up to 25 years | | | | straight-line | |
| Processing plant equipment | | | 3 to 20 years | | | | straight-line | |
| Office equipment | | | 3 to 10 years | | | | straight-line | |
73
TERRA NOVA ROYALTY CORPORATION
(Formerly KHD HUMBOLDT WEDAG INTERNATIONAL LTD.)
NOTES TO CONSOLIDATED FINANCIAL STATEMENTS — (Continued)
The amortization expense is included in either cost of sales or selling, general and administrative expense, whichever is appropriate.
The expected useful lives of property, plant and equipment are reviewed on an annual basis and, if necessary, changes in useful lives are accounted for prospectively. The carrying value of property, plant and equipment is reviewed for impairment whenever events or changes in circumstances indicate the carrying value may not be recoverable.
An item of property, plant and equipment is derecognized upon disposal or when no future economic benefits are expected to arise from the continued use of the asset. Any gain or loss arising on derecognition of the asset (calculated as the difference between the net disposal proceeds and the carrying amount of the item) is included in the statement of operations in the period in which the item is derecognized.
Maintenance costs are expensed as incurred.
(xii) Interests in Resource Properties
Interests in resource properties are stated at cost, net of accumulated amortization and, if any, accumulated impairment losses. Depletion expense is provided on the unit of production basis. The estimate of the reserve of iron ore is reviewed annually. The resource properties are tested for recoverability whenever events or changes in circumstances indicate that their carrying amounts may not be recoverable and an impairment loss is measured and any resulting write-down to fair value is included in the statement of operations. No such losses have been recorded in these consolidated financial statements.
(xiii) Impairment of Property, Plant and Equipment
The Group assesses assets or groups of assets for impairment whenever events or changes in circumstances indicate that the carrying value of an asset may not be recoverable. If any indication of impairment exists, the Group makes an estimate of the asset’s recoverable amount. Individual assets are grouped for impairment assessment purposes at the lowest level at which there are identifiable cash flows that are largely independent of the cash flows of other groups of assets. An asset group’s recoverable amount is the higher of its fair value less costs to sell and its value in use. Where the carrying amount of an asset group exceeds its recoverable amount, the asset group is considered impaired and is written down to its recoverable amount. In assessing value in use, the estimated future cash flows are adjusted for the risks specific to the asset group and are discounted to their present value using a pre-tax discount rate that reflects current market assessments of the time value of money.
An assessment is made at each reporting date as to whether there is any indication that previously recognized impairment losses may no longer exist or may have decreased. If such indication exists, the recoverable amount is estimated. A previously recognized impairment loss is reversed only if there has been a change in the estimates used to determine the asset’s recoverable amount since the last impairment loss was recognized. If that is the case, the carrying amount of the asset is increased to its recoverable amount. That increased amount cannot exceed the carrying amount that would have been determined, net of depreciation, had no impairment loss been recognized for the asset in prior years. Such reversal is recognized in the statement of operations. After such a reversal, the depreciation charge is adjusted in future periods to allocate the asset’s revised carrying amount, less any residual value, on a systematic basis over its remaining useful life.
(xiv) Decommissioning
Liabilities for decommissioning costs are recognized when the Group has an obligation to dismantle and remove a facility or an item of plant and to restore the site on which it is located, and when a reliable estimate of that liability can be made. Where an obligation exists for a new facility, this will be on construction or installation. An obligation for decommissioning may also crystallize during the period of operation of a facility through a change in legislation or through a decision to terminate operations. The amount recognized is the present value of the estimated future expenditure determined in accordance with local conditions and requirements. A corresponding item of property, plant and equipment
74
TERRA NOVA ROYALTY CORPORATION
(Formerly KHD HUMBOLDT WEDAG INTERNATIONAL LTD.)
NOTES TO CONSOLIDATED FINANCIAL STATEMENTS — (Continued)
of an amount equivalent to the provision is also recognized. This is subsequently amortized as part of the asset. Other than the unwinding discount on the provision, any change in the present value of the estimated expenditure is reflected as an adjustment to the provision and the corresponding item of property, plant and equipment. Such changes include foreign exchange gains and losses arising on the retranslation of the liability into the functional currency of the reporting entity, when it is known that the liability will be settled in a foreign currency.
(xv) Provisions and Contingencies
Provisions are recognized when the Group has a present obligation as a result of a past event, it is probable that an outflow of resources embodying economic benefits will be required to settle the obligation and a reliable estimate can be made of the amount of the obligation. Provisions are measured at the management’s best estimate of the expenditure required to settle the obligation at the reporting date. Where appropriate, the future cash flow estimates are adjusted to reflect risks specific to the liability. If the effect of the time value of money is material, provisions are determined by discounting the expected future cash flows at a pre-tax rate that reflects current market assessments of the time value of money. Where discounting is used, the increase in the provision due to the passage of time is recognized within finance costs.
Contingent liabilities are possible obligations whose existence will only be confirmed by future events not wholly within the control of the Group. Contingent liabilities, other than those assumed in connection with business combinations which are measured at fair value at the acquisition date, are not recognized in the financial statements but are disclosed unless the possibility of an outflow of economic resources is considered remote. Legal costs in connection with a loss contingency are recognized when incurred.
(xvi) Own Equity Instruments
The Group’s holdings of its own equity instruments, including common stock and preferred stock, are classified as “treasury stock”, and are deducted from shareholders’ equity at cost and in the determination of the number of equity shares outstanding. No gain or loss is recognized in the statement of operations on the purchase, sale, re-issue or cancellation of equity shares.
(xvii) Revenue Recognition
Revenues include proceeds from sales of commodities and resources, properties, medical instruments and supplies, provisions of financial and other services, income from and fair value gains on investment property, royalty income and net gain on securities.
Revenue from the sale of goods is recognized when: (a) the Group has transferred to the buyer the significant risks and rewards of ownership of the goods (which generally coincides with the time when the goods are delivered to customers and title has passed); (b) the Group retains neither continuing managerial involvement to the degree usually associated with ownership nor effective control over the goods sold; (c) the amount of revenue can be measured reliably; (d) it is probable that the economic benefits associated with the transaction will flow to the Group; and (e) the costs incurred or to be incurred in respect of the transaction can be measured reliably.
Revenue from rendering of services is recognized when: (a) the amount of revenue can be measured reliably; (b) it is probable that the economic benefits associated with the transaction will flow to the Group; (c) the stage of completion of the transaction at the reporting date can be measured reliably; and (d) the costs incurred for the transaction and the costs to complete the transaction can be measured reliably.
Revenue is measured at the fair value of the consideration received or receivable and represents amounts receivable for goods provided in the normal course of business, net of discounts, customs duties and sales taxes. When the Group charges shipping and handling fees to customers, such fees are included in the sale revenue. Where the Group acts as an agent on behalf of a third party to procure or market goods, any associated fee income is recognized but no purchase or sale is recorded.
75
TERRA NOVA ROYALTY CORPORATION
(Formerly KHD HUMBOLDT WEDAG INTERNATIONAL LTD.)
NOTES TO CONSOLIDATED FINANCIAL STATEMENTS — (Continued)
For interest, royalty and dividend income, recognition is warranted when it is probable that economic benefits will flow to the Group and the amount of income can be measured reliably. Interest income is recognized on a time proportion basis, taking into account the effective yield on the asset. Royalty income is recognized on an accrual basis, in accordance with the terms of the underlying agreement and is reported net of royalties paid and government levy. Dividend income is recognized when the Group’s right as a shareholder to receive payment has been established.
(xviii) Costs of Sales
Costs of sales include the cost of goods (commodities and resources, properties, medical instruments and supplies) sold. The cost of goods sold includes both the direct cost of materials and indirect costs, freight charges, purchasing and receiving costs, inspection costs, distribution costs, as well as provision for warranty when applicable.
The costs of sales also include the write-downs of inventories andavailable-for-sale securities, credit losses on loans and receivables and net loss on the securities. The reversal of write-downs of inventories and allowance for debts reduce the cost of sales.
(xix) Employee Benefits
Wages, salaries, bonuses, social security contributions, paid annual leave and sick leave are accrued in the period in which the associated services are rendered by employees of the Group. The employee benefits are included in either cost of sales or selling, general and administrative expense, as applicable.
(xx) Share-Based Compensation
The cost of equity-settled transactions with employees is measured by reference to the fair value at the date at which equity instruments are granted and is recognized as an expense over the vesting period, which ends on the date on which the relevant employees become fully entitled to the award. Fair value is determined by using an appropriate valuation model. No expense is recognized for awards that do not ultimately vest. At each reporting date before vesting, the cumulative expense is calculated, representing the extent to which the vesting period has expired and management’s best estimate of the achievement or otherwise of non-market conditions and the number of equity instruments that will ultimately vest. The movement in cumulative expense since the previous reporting date is recognized in the statement of operations, with a corresponding entry in equity.
When the terms of an equity-settled award are modified or a new award is designated as replacing a cancelled or settled award, the cost based on the original award terms continues to be recognized over the original vesting period. In addition, an expense is recognized over the remainder of the new vesting period for the incremental fair value of any modification, based on the difference between the fair value of the original award and the fair value of the modified award, both as measured on the date of the modification. No reduction is recognized if this difference is negative. When an equity-settled award is cancelled, it is treated as if it had vested on the date of cancellation and any cost not yet recognized in the statement of operations for the award is expensed immediately.
The share-based compensation expenses are classified as selling, general and administrative expenses. When the options are exercised, the exercise price proceeds together with the amount initially recorded in the contributed surplus account are credited to common stock.
(xxi) Research
Research costs are expensed as incurred and included in selling, general and administrative expenses.
(xxii) Finance Costs
Finance costs directly attributable to the acquisition, construction or production of qualifying assets, which are assets that necessarily take a substantial period of time to get ready for their intended use, are added to the cost of those assets,
76
TERRA NOVA ROYALTY CORPORATION
(Formerly KHD HUMBOLDT WEDAG INTERNATIONAL LTD.)
NOTES TO CONSOLIDATED FINANCIAL STATEMENTS — (Continued)
until such time as the assets are substantially ready for their intended use. All other finance costs are recognized in the statement of operations in the period in which they are incurred.
Share capital and debt are recorded at the proceeds received, net of direct issue costs. Finance charges, including premiums payable on settlement or redemption and direct issue costs, are charged to income on an accrual basis using the effective interest method and are added to the carrying amount of the instrument to the extent that they are not settled in the period in which they arise.
(xxiii) Income Taxes
The tax expense represents the sum of the tax currently payable and deferred tax. The tax currently payable is based on the taxable profits for the period. Taxable profit differs from net profit as reported in the statement of operations because it excludes items of income or expense that are taxable or deductible in other periods and it further excludes items that are never taxable or deductible. The Group’s liability for current tax is calculated using tax rates that have been enacted or substantively enacted by the reporting date. Deferred tax is provided, using the liability method, on all temporary differences at the reporting date between the tax bases of assets and liabilities and their carrying amounts for financial reporting purposes.
Deferred tax liabilities are recognized for all taxable temporary differences:
| | |
| | • | except where the deferred tax liability arises on goodwill that is not tax deductible or the initial recognition of an asset or liability in a transaction that is not a business combination and, at the time of the transaction, affects neither the accounting profit nor taxable profit or loss. |
| |
| | • | in respect of taxable temporary differences associated with investments in subsidiaries, joint ventures and associates, except where the Group is able to control the timing of the reversal of the temporary differences and it is probable that the temporary differences will not reverse in the foreseeable future. |
Deferred tax assets are recognized for all deductible temporary differences, carry-forward of unused tax credits and unused tax losses, to the extent that it is probable that taxable profit will be available against which the deductible temporary differences and the carry-forward of unused tax credits and unused tax losses can be utilized:
| | |
| | • | except where the deferred income tax asset relating to the deductible temporary difference arises from the initial recognition of an asset or liability in a transaction that is not a business combination and, at the time of the transaction, affects neither the accounting profit nor taxable profit or loss. |
| |
| | • | in respect of deductible temporary differences associated with investments in subsidiaries, joint ventures and associates, deferred tax assets are recognized only to the extent that it is probable that the temporary differences will reverse in the foreseeable future and taxable profit will be available against which the temporary differences can be utilized. |
On the reporting date, management reviews the Group’s deferred tax assets to determine whether it is probable that the benefits associated with these assets will be realized. The Group also reassesses unrecognized deferred tax assets. This review and assessment involve evaluating both positive and negative evidence. The Group recognized a previously unrecognized deferred tax asset to the extent that it has become probable that future taxable profit will allow the deferred tax asset to be recovered.
Deferred tax assets and liabilities are measured at the tax rates that are expected to apply to the year when the asset is realized or the liability is settled, based on tax rates and tax laws that have been enacted or substantively enacted at the reporting date. Tax relating to items recognized directly in equity is recognized in equity and not in the statement of operations.
Deferred income tax assets and liabilities are offset when there is a legally enforceable right to set off current tax assets against current tax liabilities, and when they relate to income tax levied by the same taxation authority and the Group intends to settle its current tax assets and liabilities on a net basis.
77
TERRA NOVA ROYALTY CORPORATION
(Formerly KHD HUMBOLDT WEDAG INTERNATIONAL LTD.)
NOTES TO CONSOLIDATED FINANCIAL STATEMENTS — (Continued)
Resource taxes and withholding taxes are treated as income taxes when they have the characteristics of a tax. This is considered to be the case when they are imposed under government authority and the amount payable is calculated by reference to revenue derived.
The Group includes interest charges and penalties on current tax liabilities as a component of financing costs.
(xxiv) Earnings Per Share
Basic earnings per share is determined by dividing net income applicable to common shares by the weighted average number of common shares outstanding for the year, net of treasury stock.
Diluted earnings per share is determined using the same method as basic earnings per share except that the weighted average number of common shares outstanding includes the potential dilutive effect of stock options. For the purpose of calculating diluted earnings per share, the Group assumes the exercise of its dilutive options and warrants with the assumed proceeds from these instruments regarded as having been received from the issue of common shares at the average market price of common shares during the period. The difference between the number of common shares issued and the number of common shares that would have been issued at the average market price of common shares during the period is treated as an issue of common shares for no consideration. The amount of the dilution is the average market price of common shares during the period minus the issue price and the issue price includes the fair value of services to be supplied to the Group in the future under the share-based payment arrangement.
If the share-based payments were granted during the period, the shares issuable are weighted to reflect the portion of the period during which the payments were outstanding. The shares issuable are also weighted to reflect forfeitures occurring during the period. When options are exercised during the period, shares issuable are weighted to reflect the portion of the period prior to the exercise date and shares issued are included in the weighted average number of shares outstanding from the exercise date.
| |
| C. | Major Sources of Estimation Uncertainty |
The major assumptions and other sources of estimation uncertainty that have a significant risk of resulting in a material adjustment to the carrying amounts of assets and liabilities within the next financial year are discussed below. These items require management’s most difficult, subjective or complex judgments.
(i) Recoverable Value of Receivables
The Group had recognized receivables (including loans, trade and other) aggregating $30,987 at December 31, 2010. The recoverability of the trade receivables is regularly reviewed and specific provisions are recognized for balances considered to be irrecoverable. The irrecoverable amounts are estimated based on reviewing the macro-economic environment and available micro-economic information specific to each receivable.
(ii) Provison for inventories
The Group had recorded inventories of $67,102 at December 31, 2010. The provision for the inventories is regularly reviewed and general and specific provisions are recognized for balances considered to be irrecoverable. The irrecoverable amounts are estimated based on reviewing the macro-economic environment and available micro-economic information specific to the product categories.
(iii) Impairment of Property, Plant and Equipment
The Group had property, plant and equipment and interests in resource properties aggregating $235,499 at December 31, 2010. Determining whether these tangible assets are impaired requires an estimation of the recoverable amounts which in turn requires an estimation of the timing and amount of future cash flows arising from the property and a suitable discount rate in order to calculate the present value.
78
TERRA NOVA ROYALTY CORPORATION
(Formerly KHD HUMBOLDT WEDAG INTERNATIONAL LTD.)
NOTES TO CONSOLIDATED FINANCIAL STATEMENTS — (Continued)
(iv) Impairment of Equity Method Investments
The Group had investments in joint ventures and associates accounted for by the equity method aggregating $5,713 at December 31, 2010. Investments in joint ventures and associates are reviewed for impairment at the reporting date. Determining whether an investment balance is impaired requires an estimation of the value in use of the joint venture or associate. The value in use calculation requires an estimate to be made of the timing and amount of future cash flows expected to arise from the joint venture or associate and the application of a suitable discount rate in order to calculate the present value.
(v) Taxation
The Group is subject to tax in a number of jurisdictions and judgment is required in determining the worldwide provision for income taxes. Deferred tax is accounted for on temporary differences using the liability method, with deferred tax liabilities generally being provided for in full (except for taxable temporary differences associated with investments in subsidiaries, joint ventures and associates where the Group is able to control the timing of the reversal of the temporary differences and it is probable that the temporary differences will not reverse in the foreseeable future) and deferred tax assets being recognized to the extent that it is probable that future taxable profits will be available against which the temporary differences can be utilized.
The operations and organization structures of the Group are complex, and related tax interpretations, regulations and legislation are continually changing. As a result, there are usually some tax matters in question that result in uncertain tax positions. The Group only recognizes the income tax benefit of an uncertain tax position when it is probable that the ultimate determination of the tax treatment of the position will result in that benefit being realized.
The Group had deferred tax assets of $6,727 at December 31, 2010. In assessing the realizability of future tax assets, management considers whether it is probable that some portion or all of the future tax assets will be realized. The ultimate realization of future tax assets is dependent upon the generation of future taxable income during the periods in which those temporary differences become deductible or before the tax loss carry-forwards expire. Management considers the future reversals of existing taxable temporary differences, projected future taxable income, taxable income in prior years and tax planning strategies in making this assessment.
The Group provides for future liabilities in respect of uncertain tax positions where additional tax may become payable in future periods and such provisions are based on management’s assessment of exposures. The Group did not recognize the full deferred tax liability on taxable temporary differences associated with investments in subsidiaries, joint ventures and associates where the Group is able to control the timing of the reversal of the temporary differences and it is probable that the temporary differences will not reverse in the foreseeable future. The Group may change its investment decision in its normal course of business, thus resulting in additional tax liability.
| |
| D. | Recent Accounting Standards and Amendments not yet Adopted |
Certain pronouncements were issued by the IASB that are mandatory for accounting periods beginning after January 1, 2011 or later periods. The following new accounting standards and amendments are expected to have significant effects on the Group’s accounting policies, financial positionsand/or financial statement presentation.
IFRS 9,Financial Instruments,is expected to replace IAS 39,Financial Instruments: Recognition and Measurement,from 2013. New requirements for the classification and measurement of financial liabilities, derecognition of financial instruments, impairment and hedge accounting are expected to be added to IFRS 9.
Amendments, set out inDisclosures — Transfers of Financial Assets,were issued to amend IFRS 7,Financial Instruments,so as to enhance the disclosure requirements for transfers of financial assets that result in derecognition. These amendments respond, in part, to the recent financial crisis. Entities will be required to provide more extensive quantitative and qualitative disclosures about: (i) risk exposures relating to transfers of financial assets that are: (a) not derecognized in their entirety; or (b) derecognized in their entirety, but with which the entity continues to have some
79
TERRA NOVA ROYALTY CORPORATION
(Formerly KHD HUMBOLDT WEDAG INTERNATIONAL LTD.)
NOTES TO CONSOLIDATED FINANCIAL STATEMENTS — (Continued)
continuing involvement; and (ii) the effect of those risks on an entity’s financial position. The amendments are effective for annual periods beginning on or after July 1, 2011. Earlier application is permitted.
Amendments, set out inDeferred Tax: Recovery of Underlying Assets,were issued to amend IAS 12,Income Taxes. IAS 12 requires an entity to measure the deferred tax relating to an asset depending on whether the entity expects to recover the carrying amount of the asset through use or sale. It can be difficult and subjective to assess whether recovery will be through use or through sale when the asset is measured using the fair value model in IAS 40,Investment Property. The amendment provides a practical solution to the problem by introducing a presumption that recovery of the carrying amount will, normally, be through sale. The amendments are effective for annual periods beginning on or after January 1, 2012.
IAS 24,Related Party Disclosures,was revised to simplify the disclosure requirements for government-related entities and clarify the definition of a related party. The revised standard is effective for annual periods beginning on or after 1 January 2011, with earlier application permitted.
| |
| Note 2. | Capital Disclosure on the Group’s Objectives, Policies and Processes for Managing Its Capital Structure |
The Group’s objectives when managing capital are: (i) to safeguard the entity’s ability to continue as a going concern so that it can continue to provide returns for shareholders and benefits for other stakeholders, (ii) to provide an adequate return to shareholders by pricing products and services commensurately with the level of risk, and (iii) to maintain a flexible capital structure which optimizes the cost of capital at acceptable risk.
The Group sets the amount of capital in proportion to risk. The Group manages the capital structure and makes adjustments to it in the light of changes in economic conditions and the risk characteristics of the underlying assets. In order to maintain or adjust the capital structure, the Group may adjust the amount of dividends paid to shareholders, return capital to shareholders, issue new shares, or sell assets to reduce debt.
Consistently with others in the industry, the Group monitors capital on the basis of thedebt-to-adjusted capital ratio and long-termdebt-to-equity ratio. Thedebt-to-adjusted capital ratio is calculated as net debt divided by adjusted capital. Net debt is calculated as total debt less cash and cash equivalents. Adjusted capital comprises all components of equity and some forms of subordinated debt, if any. The long-termdebt-to-equity ratio is calculated as long-term debt divided by shareholders’ equity. The computations are based on continuing operations.
| | | | | | | | | |
| | | 2010 | | | 2009 | |
| |
| Total debt | | $ | 52,748 | | | $ | — | |
| Less: cash and cash equivalents | | | (397,697 | ) | | | (38,046 | ) |
| | | | | | | | | |
| Net debt (net cash and cash equivalents) | | $ | (344,949 | ) | | $ | (38,046 | ) |
| Shareholders’ equity | | $ | 547,756 | | | $ | 435,689 | |
Debt-to-adjusted capital ratio | | | Not applicable | | | | Not applicable | |
There were no amounts in accumulated other comprehensive income relating to cash flow hedges nor were there any subordinated debt instruments as at December 31, 2010 and 2009. Thedebt-to-adjusted capital ratio in 2010 and 2009 were not applicable since the Group had a net cash and cash equivalents balance.
| | | | | | | | | |
| | | 2010 | | | 2009 | |
| |
| Long-term debt | | $ | 48,604 | | | $ | — | |
| Shareholders’ equity | | $ | 547,756 | | | $ | 435,689 | |
Long-termdebt-to-equity ratio | | | 0.09 | | | | — | |
During 2010, the Group’s strategy, which was unchanged from 2009, was to maintain thedebt-to-adjusted capital ratio and the long-termdebt-to-equity ratio at a low level. The Group had a net cash and cash equivalent balance after
80
TERRA NOVA ROYALTY CORPORATION
(Formerly KHD HUMBOLDT WEDAG INTERNATIONAL LTD.)
NOTES TO CONSOLIDATED FINANCIAL STATEMENTS — (Continued)
deduction of the total debt. The Group’s long-termdebt-to-equity ratio was 0.09 and nil as at December 31, 2010 and 2009, respectively.
| |
| Note 3. | Acquisitions of Subsidiaries |
Year 2010
On September 27, 2010, Terra Nova announced that it entered into an agreement with Mass for Terra Nova to acquire all of the issued and outstanding common shares of Mass by way of a take-over bid (the “Offer”). The Offer was one common share of Terra Nova for each common share of Mass. The Offer was based upon the adjusted book value of each company on a diluted basis and valued Terra Nova’s common shares at $8.91 per share.
Mass’s business encompasses a broad spectrum of activities related to the integrated combination of commodities and resources and merchant banking, which include trading, commercial trade, proprietary investing and financial services. The board of directors of Terra Nova considered a number of factors, including, among other things, strategic growth through acquisition, adjusted book value valuation, increased scope, complementary businesses, management team, fairness opinion, meaningful cost savings and other synergies facilitating the Mass acquisition. Terra Nova received authorization from the New York Stock Exchange in October 2010 to list the shares to be issued pursuant to the Offer and over 99% of its shareholders voting at its special meeting on October 29, 2010 approved the same.
The Offer was completed and closed on November 15, 2010 and 23,317,912 common shares of Mass were submitted for exchange. As a result, 23,317,912 Terra Nova common shares were issued. In December 2010, Terra Nova acquired the common shares held by the non-controlling interests of Mass by mandatory acquisition by issuing 1,674,210 Terra Nova common shares. The aggregated fair value of shares issued was $200,139, before deducting the costs of issuing shares totalling $1,652.
Prior to the acquisition date, the Group held approximately a 4.6% equity interest in Mass with a fair value of $9,388 on the acquisition date. The Group recognized a loss of $1,806 which was included in the net gains on securities in the consolidated statement of operations.
The Offer was a part of a multi-step transaction, which included the subsequent merger of Mass and a subsidiary of Terra Nova, designed to effect a combination.
81
TERRA NOVA ROYALTY CORPORATION
(Formerly KHD HUMBOLDT WEDAG INTERNATIONAL LTD.)
NOTES TO CONSOLIDATED FINANCIAL STATEMENTS — (Continued)
The acquisition was accounted for as a business combination pursuant to IFRS 3 (Revised). The aggregated cost of the acquisition totalled $209,527. The fair value of the assets acquired and liabilities assumed at the acquisition date was allocated as follows:
| | | | | |
| Cash | | $ | 213,850 | |
| Receivables, net | | | 23,040 | |
| Other current assets | | | 131,371 | |
| Property, plant and equipment | | | 3,840 | |
| Interest in resource property | | | 51,000 | |
| Treasury stock | | | 2,626 | |
| Other non-current assets | | | 67,362 | |
| Current liabilities | | | (128,444 | ) |
| Non-current liabilities | | | (108,747 | ) |
| Non-controlling interests | | | (5,313 | ) |
| | | | | |
| Total identifiable net assets acquired | | $ | 250,585 | |
| | | | | |
| Total consideration transferred | | $ | 209,527 | |
| Negative goodwill | | | 41,058 | |
| | | | | |
| | | $ | 250,585 | |
| | | | | |
The negative goodwill arose as the share market prices of Terra Nova on the acquisition dates were less than the fair values of the net identifiable assets acquired from Mass.
At the acquisition date, the gross contractual amounts of receivables acquired was $23,591 and the best estimate of the contractual cash flows not expected to be collected was $551, resulting in a fair value of $23,040.
The amounts of revenue and net income of Mass since the acquisition date (i.e. from November 16 to December 31, 2010) included in the consolidated statement of comprehensive income for 2010 was $53,276 and $5,652, respectively.
The following illustrative summary presents the results of the Group’s continuing operations as if the businesses acquired had been acquired on 1 January 2010. The amounts include the results of the acquired businesses, depreciation, amortization and depletion of the acquired fixed assets and intangible assets recognized on acquisition. The amounts do not include any possible synergies from the acquisition. The results of acquired companies for the period before acquisition have not been adjusted to reflect the Group’s accounting policies nor to reflect the fair value adjustments made on acquisition. The information is provided for illustrative purposes only and does not necessarily reflect the actual results that would have occurred, nor is it necessarily indicative of the future results of the combined companies.
| | | | | |
| | | (Unaudited) | |
| |
| Revenues | | $ | 379,695 | |
| Net income | | | 29,307 | |
| Net income attributable to equity shareholders | | | 28,619 | |
Year 2009
There was no business combination transaction in 2009.
82
TERRA NOVA ROYALTY CORPORATION
(Formerly KHD HUMBOLDT WEDAG INTERNATIONAL LTD.)
NOTES TO CONSOLIDATED FINANCIAL STATEMENTS — (Continued)
| |
| Note 4. | Discontinued Operations |
2010 — KID
Until the end of March 2010, the Group, through its former subsidiary KID and its subsidiaries and affiliates, focused on the industrial plant technology, equipment and service business for the cement and mining industries and on maintaining leadership in supplying technologies, equipment and engineering services for the cement and mining sectors, as well as designing and building plants that produce clinker and cement and process coal and other minerals, such as copper, gold and diamonds. In the fourth quarter of 2009, the Group divested its interest in its coal and minerals customer group, such that the business of the Group was then focused on the cement industry.
On January 6, 2010, Terra Nova announced that it intended to restructure its assets and operations by dividing into two independent publicly traded companies; one company to focus on the industrial engineering business and the other company on Terra Nova’s resource-focused business. To effect this division, Terra Nova, among other things, effected a reorganization whereby substantially all of its subsidiaries engaged in the industrial engineering business were transferred to KID.
Terra Nova entered into an Arrangement Agreement with KID on February 26, 2010 to effect an arrangement (the “Arrangement”) under Section 288 of the British Columbia Business Corporations Act, which was approved by the Terra Nova shareholders on March 29, 2010 and was subsequently approved by the British Columbia Supreme Court.
Pursuant to the Arrangement, among other things, approximately 26% of the issued and outstanding common shares of KID were distributed, on a pro rata basis, one common share of KID for every three and one-half of Terra Nova common shares held, to the non-subsidiary shareholders of Terra Nova as a return of capital. The carrying amount of these common shares of KID was within the fair value range obtained from a valuation. For financial statement presentation purposes, the distribution of common shares of KID was accounted for as a dividend in kind and the carrying amount was charged against retained earnings. This was a non-cash transaction.
As a result of the Arrangement and related amendment to Terra Nova’s articles, two publicly traded companies were created. As well in connection with the Arrangement, Terra Nova entered into a shareholders agreement (the “Shareholders Agreement”) with another corporate shareholder of KID (the “Custodian”) whereby Terra Nova engaged the Custodian to direct the voting of the common shares of KID that Terra Nova continues to hold after consummation of the Arrangement. As a result of the execution of the Shareholders Agreement, Terra Nova ceased to hold its continuing power to determine the strategic operating, investing and financing policies of KID. There have been no common directors and officers between the two entities. Accordingly, Terra Nova no longer considered KID as its subsidiary since March 31, 2010. Pursuant to SIC-12,management of the Group analyzed its continuing interests in KID and concluded that KID was not a SPE of the Group because the substance of the relationship between the Group and KID did not indicate that KID was controlled by the Group. Management of the Group believed that KID’s total equity investment at risk was sufficient to permit the entity to finance its activities without additional subordinated financial support provided by any parties, including the Group, and the facts that the guarantees then provided by the Group would expire in the ordinary course pursuant to their terms and KID would get credit facilities on its own. (Pursuant to a subsequent amendment to the bonding agreement, all guarantees previously provided by the Group expired on December 31, 2010.) Accordingly, the Group ceased to consolidate KID from March 31, 2010. At March 31, 2010, the carrying amount of the Group’s investment in KID common shares approximated its fair value and there was no gain or loss recognized in connection with the cessation of the consolidation of KID. Effective March 31, 2010, the Group classified its investment in these common shares of KID as available for sale. The shares are measured at their fair value, net of income tax, with changes in fair value recorded in other comprehensive income until they are disposed of.
83
TERRA NOVA ROYALTY CORPORATION
(Formerly KHD HUMBOLDT WEDAG INTERNATIONAL LTD.)
NOTES TO CONSOLIDATED FINANCIAL STATEMENTS — (Continued)
As at March 31, 2010, assets and liabilities of the industrial engineering business ceased to be consolidated were as follows:
| | | | | |
| Cash | | $ | 285,739 | |
| Other assets | | | 237,561 | |
| Liabilities | | | (356,720 | ) |
| Non-controlling interests | | | (3,930 | ) |
| | | | | |
| Net identifiable net assets | | $ | 162,650 | |
| | | | | |
In June 2010, Terra Nova declared a special dividend whereby it distributed approximately 23% of the total issued and outstanding common shares of KID to Terra Nova’s shareholders of record on July 1, 2010, on a pro rata basis, one common share of KID for every four of Terra Nova common shares held. The special dividend was recorded at its carrying amount (which approximated its fair value) in the consolidated financial statements for the quarter ended June 30, 2010.
In September 2010, Terra Nova distributed, as a return of capital, approximately 29% of the total issued and outstanding common shares of KID to Terra Nova’s shareholders of record on September 23, 2010, on a pro rata basis, one common share of KID for every four of Terra Nova common shares held. The carrying amount of these common shares of KID was within the fair value range obtained from a valuation. For financial statement presentation purposes, the distribution of common shares of KID was accounted for as a dividend in kind and the carrying amount was charged against retained earnings. This was a non-cash transaction.
In December 2010, Terra Nova distributed, as a return of capital, approximately 19% of the total issued and outstanding common shares of KID to Terra Nova’s shareholders of record on December 31, 2010, on a pro rata basis, one common share of KID for every 10 of Terra Nova common shares held. The carrying amount of these common shares of KID was within the fair value range obtained from a valuation. This was the fourth and final distribution of KID shares. For financial statement presentation purposes, the distribution of common shares of KID was accounted for as a dividend in kind and the carrying amount was charged against retained earnings. This was a non-cash transaction.
Management is of the opinion that the KID common shares were not quoted in an active market until December 31, 2010 when the fourth distribution of KID commons shares was made and, accordingly, the KID common shares had been measured using Level 3 of the fair value hierarchy. The valuation was based on the earnings forecast of the operations of industrial plant technology, equipment and service business, as well as the expected earning multiple and discount rate. Upon the final distribution of KID common shares on December 31, 2010, the Group held approximately 2.9% of the then outstanding KID shares and reclassified its investment at its carrying amount from Level 3 to Level 1 of the fair value hierarchy. The investment in KID common shares is the only item in Level 3 of the fair value hierarchy during 2010 and no gain or loss was recognized while it stayed in Level 3. The reason for the reclassification of the investment in KID common shares from Level 3 to Level 1 is that, after four distributions of KID common shares by December 31, 2010, an active market for KID common shares has been created.
Income taxes included capital gain taxes of $5,974 on the disposition and the outside basis difference of the KID common shares and a withholding tax of $2,514 deducted at source on the cash dividend paid by KID to the Group. The capital gain taxes were offset by Terra Nova’s non-capital loss carry-forwards and, accordingly, did not involve cash payments.
2009 — Workshop and Coal and Minerals Customer Groups (part of KID)
Effective September 30, 2009, management, as duly authorized by the board of directors, committed to a plan to sell the workshop in Cologne and the Group’s coal and minerals customer group, each in their respective present conditions, to a third party. The sale was completed and executed in early October, 2009 and there were no significant changes to the sale plan prior to closing.
84
TERRA NOVA ROYALTY CORPORATION
(Formerly KHD HUMBOLDT WEDAG INTERNATIONAL LTD.)
NOTES TO CONSOLIDATED FINANCIAL STATEMENTS — (Continued)
Pursuant to the sale agreement, the Group received cash of $7,500 and might receive contingent payments based on unutilized severance payments for the workshop’s employees and certain other contingencies. The Group also agreed to grant the buyer the right to continue to manufacture the roller press for the Group for a period of three years from the closing date, provided this was done on normal commercial terms. Further, for a period of three years, the Group would offer the Cologne workshop contracts to manufacture equipment required for the Group’s cement business that had traditionally been manufactured at the workshop and the buyer had agreed to undertake such orders on a priority basis. The buyer had also agreed to assume certain liabilities, including pension obligations, from the Group. The disposal group had been reported in the industrial plant technology, equipment and service business segment.
A gain of $5,254 was recognized on the sale of the workshop and coal and minerals customer groups in the Group’s consolidated statement of operations.
For reporting purposes, the results of operations of KID, including workshop and coal and mineral customer groups, have been presented as discontinued operations. Following is the summary of operating results for the discontinued operations:
| | | | | | | | | |
| | | 2010 | | | 2009 | |
| |
| Sale revenues | | $ | 101,585 | | | $ | 576,408 | |
| Other revenues | | | 1,765 | | | | 10,895 | |
| Expenses | | | (101,435 | ) | | | (510,448 | ) |
| Gain on sale (included in income before income taxes) | | | — | | | | 5,254 | |
| | | | | | | | | |
| Income before income taxes | | | 1,915 | | | | 82,109 | |
| Income taxes | | | 17,364 | | | | 28,067 | |
| | | | | | | | | |
| Net income (loss) | | | (15,449 | ) | | | 54,042 | |
| Non-controlling interests | | | (74 | ) | | | (1,050 | ) |
| | | | | | | | | |
| Net income (loss) attributable to equity shareholders | | $ | (15,523 | ) | | $ | 52,992 | |
| | | | | | | | | |
| |
| Note 5. | Business Segment Information |
In reporting to management, the Group’s operating results are categorized into the following operating segments: commodities and resources, merchant banking and all other segments.
Until the end of March 2010, the Group, through its former subsidiary, focused on the industrial plant technology, equipment and service business for the cement and mining industries. Terra Nova started to spin off the former subsidiary on March 31, 2010, which was completed on December 31, 2010. Accordingly, the spin-off of the industrial plant technology, equipment and service business in 2010 resulted in reclassification of prior years’ financial information including segment information.
Basis of Presentation
In reporting segments, certain of the Group’s business lines have been aggregated where they have similar economic characteristics and are similar in each of the following areas: (i) the nature of the products and services; (ii) the methods of distribution, and (iii) the types or classes of customers/clients for the products and services.
Commodities and resources segment includes trading of commodities and resources, as well as the related producing, processing and extracting activities. It also includes the royalty income from the Group’s interests in resource properties.
Merchant banking segment includes proprietary investing and provision of financial services. The Group seeks investments in many industries, emphasizing those business opportunities where the perceived intrinsic value is properly
85
TERRA NOVA ROYALTY CORPORATION
(Formerly KHD HUMBOLDT WEDAG INTERNATIONAL LTD.)
NOTES TO CONSOLIDATED FINANCIAL STATEMENTS — (Continued)
recognized. The Group uses its financial and management expertise to add or unlock value within a relative short time period. The merchant banking business also provides trade finance and services.
All other segment includes the Group’s corporate and operating segments whose quantitative amounts do not exceed 10% of any of the Group’s (a) reported revenue, (b) net income or (c) combined assets. They primarily include business activities in medical equipment, instruments, supplies and services.
The accounting policies of the operating segments are the same as those described in the summary of significant accounting policies. The chief operating decision maker evaluates performance on the basis of profit or loss from operations before tax expense and does not consider acquisition accounting adjustments in assessing the performance of reporting units. The segment information presented in this Note is prepared according to the following methodologies: (a) revenues and expenses directly associated with each segment are included in determining pre-tax earnings; (b) intersegment sales and transfers are accounted for as if the sales or transfers were to third parties at current market prices; (c) certain general and administrative expenses paid by corporate, particularly incentive compensation and share-based compensation, are not re-allocated to reporting units; (d) all intercompany investments, receivables and payables are eliminated in the determination of the segment’s assets and liabilities; and (e) deferred tax assets and liabilities are not reallocated further.
Products and Services
The Group’s total revenues comprised the following for the year ended December 31, 2010 and 2009, respectively:
| | | | | | | | | |
| | | 2010 | | | 2009 | |
| |
| Commodities and resources | | $ | 74,608 | | | $ | 13,530 | |
| Fees | | | 2,602 | | | | — | |
| Gains on securities | | | 402 | | | | 324 | |
| Interest | | | 2,792 | | | | 435 | |
| Dividend | | | 467 | | | | 1 | |
| | | | 954 | | | | — | |
| Other | | | 3,605 | | | | 428 | |
| | | | | | | | | |
| Total revenues | | $ | 85,430 | | | $ | 14,718 | |
| | | | | | | | | |
The Group’s revenues for 2010 consolidated the revenues of Mass and its subsidiaries from November 16, 2010.
Segment Operating Results
| | | | | | | | | | | | | | | | | |
| | | Year ended December 31, 2010 | |
| | | Commodities
| | | Proprietary
| | | | | | | |
| | | and resources | | | Investing | | | All other | | | Total | |
| |
| Revenues from external customers | | $ | 76,478 | | | $ | 4,821 | | | $ | 4,131 | | | $ | 85,430 | |
| Intersegment sale | | | 37 | | | | 978 | | | | — | | | | 1,015 | |
| Interest expense | | | | | | | | | | | | | | | | |
| External | | | 909 | | | | 9 | | | | 56 | | | | 974 | |
| Internal | | | — | | | | — | | | | 252 | | | | 252 | |
| Income (loss) from continuing operations before income taxes | | | 23,901 | | | | 44,206 | | | | (15,951 | ) | | | 52,156 | |
86
TERRA NOVA ROYALTY CORPORATION
(Formerly KHD HUMBOLDT WEDAG INTERNATIONAL LTD.)
NOTES TO CONSOLIDATED FINANCIAL STATEMENTS — (Continued)
| | | | | | | | | | | | | | | | | |
| | | Year ended December 31, 2009 | |
| | | Commodities
| | | Proprietary
| | | | | | | |
| | | and resources | | | Investing | | | All other | | | Total | |
| |
| Revenues from external customers | | $ | 13,530 | | | $ | — | | | $ | 1,188 | | | $ | 14,718 | |
| Interest expense | | | | | | | | | | | | | | | | |
| External | �� | | — | | | | — | | | | 477 | | | | 477 | |
| Internal | | | — | | | | — | | | | 52 | | | | 52 | |
| Income (loss) from continuing operations before income taxes | | | 3,148 | | | | — | | | | (23,939 | ) | | | (20,791 | ) |
| | | | | | | | | | | | | | | | | |
| | | As at December 31, 2010 | |
| | | Commodities
| | | Proprietary
| | | | | | | |
| | | and resources | | | Investing | | | All other | | | Total | |
| |
| Segment assets | | $ | 409,146 | | | $ | 418,490 | | | $ | 26,620 | | | $ | 854,256 | |
| Equity method investments | | | — | | | | — | | | | 5,713 | | | | 5,713 | |
| | | | | | | | | | | | | | | | | |
| | | As at December 31, 2009 | |
| | | Commodities
| | | Proprietary
| | | | | | | |
| | | and resources | | | Investing | | | All other | | | Total | |
| |
| Segment assets | | $ | 196,273 | | | $ | — | | | $ | 64,852 | | | $ | 261,125 | |
| Add: assets of discontinued operations | | | | | | | | | | | | | | | 690,595 | |
| | | | | | | | | | | | | | | | | |
| Consolidated total assets | | | | | | | | | | | | | | $ | 951,720 | |
| | | | | | | | | | | | | | | | | |
| | | | | | | | | | | | | | | | | |
| | | As at December 31, 2010 | |
| | | Commodities
| | | Proprietary
| | | | | | | |
| | | and resources | | | Investing | | | All other | | | Total | |
| |
| Segment liabilities | | $ | 252,897 | | | $ | 44,082 | | | $ | 4,837 | | | $ | 301,816 | |
| | | | | | | | | | | | | | | | | |
| | | As at December 31, 2009 | |
| | | Commodities
| | | Proprietary
| | | | | | | |
| | | and resources | | | Investing | | | All other | | | Total | |
| |
| Segment liabilities | | $ | 50,196 | | | $ | — | | | $ | 4,768 | | | $ | 54,964 | |
| Add: liabilities relating to discontinued operations | | | | | | | | | | | | | | | 455,664 | |
| | | | | | | | | | | | | | | | | |
| Consolidated total liabilities | | | | | | | | | | | | | | $ | 510,628 | |
| | | | | | | | | | | | | | | | | |
Geographic Information
Due to the highly integrated nature of international commodities, resources and merchant banking activities and markets, and a significant portion of the Group’s activities require cross-border coordination in order to serve the Group’s customers and clients, the methodology for allocating the Group’s profitability to geographic regions is dependent on estimates and management judgment.
87
TERRA NOVA ROYALTY CORPORATION
(Formerly KHD HUMBOLDT WEDAG INTERNATIONAL LTD.)
NOTES TO CONSOLIDATED FINANCIAL STATEMENTS — (Continued)
Geographic results are generally allocated as follows:
| | | |
Segment | | Basis for attributing revenues |
| |
| Commodities and resources | | Locations of external customers |
| Merchant banking | | Locations of clients, assets or the reporting units, whichever is appropriate |
| All other segments | | Locations of the reporting units |
Due to the nature of cross-border business, the Group presents its geographic information by geographic regions, instead of by countries. The following table presents revenues from external customers attributed to Terra Nova’s country of domicile (i.e. Canada) and all foreign geographic regions from which the Group derives revenues:
| | | | | | | | | |
| | | 2010 | | | 2009 | |
| |
| Canada | | $ | 33,303 | | | $ | 13,567 | |
| Africa | | | 1,508 | | | | — | |
| Americas | | | 6,277 | | | | 407 | |
| Asia | | | 7,735 | | | | 617 | |
| Europe | | | 36,607 | | | | 127 | |
| | | | | | | | | |
| | | $ | 85,430 | | | $ | 14,718 | |
| | | | | | | | | |
Income from an interest in resource property is earned from a third party entity operating in Canada and amounted to $31,715 and $13,530, respectively, in 2010 and 2009.
Except for the geographic concentrations as indicated in the above table, there were no revenue concentrations in 2010 and 2009.
The following table presents non-current assets from continuing operations other than financial instruments and deferred tax assets by geographic area based upon the location of the assets.
| | | | | | | | | |
| | | 2010 | | | 2009 | |
| |
| Canada | | $ | 182,192 | | | $ | 191,640 | |
| Asia | | | 50,879 | | | | — | |
| Europe | | | 41,012 | | | | — | |
| | | | | | | | | |
| | | $ | 274,083 | | | $ | 191,640 | |
| | | | | | | | | |
The non-current assets located in Canada comprised primarily the Group’s interest in resource property.
Short-term securities
| | | | | | | | | |
| | | 2010 | | | 2009 | |
| |
| Trading securities: | | | | | | | | |
| Common shares, at fair value | | $ | 25,145 | | | $ | 11,212 | |
Available-for-sale security: | | | | | | | | |
| Common shares, at fair value (see Note 30) | | | 2,733 | | | | — | |
| Investment in a private company, at cost | | | 16 | | | | — | |
| | | | | | | | | |
| | | $ | 27,894 | | | $ | 11,212 | |
| | | | | | | | | |
88
TERRA NOVA ROYALTY CORPORATION
(Formerly KHD HUMBOLDT WEDAG INTERNATIONAL LTD.)
NOTES TO CONSOLIDATED FINANCIAL STATEMENTS — (Continued)
At December 31, 2010, investments in publicly-listed common shares trading securities comprised 12 companies (of which four companies represented 71%). Theavailable-for-sale common shares trading securities comprised one company only.
At December 31, 2009, investments in publicly-listed common shares comprised three companies (of which one company (which was a former subsidiary amounted to $11,194) represented 99.8%). The common shares in the former subsidiary were received upon the conversion of a promissory note receivable due from the former subsidiary (see Note 13).
| | | | | | | | | |
| | | 2010 | | | 2009 | |
| |
| Cash pledged with a bank in connection with sales of securities | | $ | 125 | | | $ | — | |
| Cash deposit with a bank in connection with currency derivative contracts | | | 2,822 | | | | — | |
| Bank accounts temporarily restricted pursuant to court orders | | | 431 | | | | — | |
| Other | | | 86 | | | | — | |
| | | | | | | | | |
| | | $ | 3,464 | | | $ | — | |
| | | | | | | | | |
Cash pledged with a bank in connection with sales of publicly-traded equity securities will be released whenever the securities are bought back.
| | | | | | | | | |
| | | 2010 | | | 2009 | |
| |
| Loans to an affiliate under a credit facility of $20,000, interest at London Inter-Bank Offered Rate (“LIBOR”) plus 3.5% per annum (4.38% at December 31, 2010) and payable monthly, collateralized by a charge on all the borrower’s undertaking, goodwill and other assets and property, ranking only behind the charges created in favour of the purchaser under a forward sales agreement. The credit facility is to expire in December 2011 and may be extended for one additional term of up to six months at the option of the Group | | $ | 5,792 | | | $ | — | |
| | | | | | | | | |
| Total — current | | $ | 5,792 | | | $ | — | |
| | | | | | | | | |
As at December 31, 2010, none of the loan receivable was past due or impaired.
| |
| Note 9. | Trade Receivables |
| | | | | | | | | |
| | | 2010 | | | 2009 | |
| |
| Trade receivables, gross amount | | $ | 13,789 | | | $ | — | |
| Less: Allowance for credit losses | | | (701 | ) | | | — | |
| | | | | | | | | |
| Trade receivables, net amount | | $ | 13,088 | | | $ | — | |
| | | | | | | | | |
Trade receivables primarily arise from commodity activities. The terms with affiliates in the normal course of the Group’s activities are no different from third party customers.
The Group has a non-recourse factoring arrangement with a bank for the Group’s trade receivables (see Note 20).
89
TERRA NOVA ROYALTY CORPORATION
(Formerly KHD HUMBOLDT WEDAG INTERNATIONAL LTD.)
NOTES TO CONSOLIDATED FINANCIAL STATEMENTS — (Continued)
As at December 31, 2010, trade receivables of $2,445 (2009: $nil) were past due but not impaired. The aging analysis of these trade receivables as at December 31, 2010 and 2009 is as follows:
| | | | | | | | | |
Past-Due | | 2010 | | | 2009 | |
| |
| Below 30 days | | $ | 1,170 | | | $ | — | |
| Between 31 and 60 days | | | 537 | | | | — | |
| Between 61 and 90 days | | | 354 | | | | — | |
| Between 91 and 365 days | | | 131 | | | | — | |
| Over 365 days | | | 253 | | | | — | |
| | | | | | | | | |
| | | $ | 2,445 | | | $ | — | |
| | | | | | | | | |
As at December 31, 2010, trade receivables of $1,501 (2009: $nil) were impaired and an allowance for credit losses of $701 (2009: $nil) has been provided. Not all past-due account balances are uncollectible as some of the accounts are covered by credit insurance or other collection procedures. Credit risk from trade accounts receivable is mitigated since the customers generally have high credit qualityand/or provide performance guarantees, advance payments, letters of credit, credit insurance and other credit enhancements (see Note 30). The aging analysis of these trade receivables as at December 31, 2010 and 2009 is as follows:
| | | | | | | | | |
Past-Due | | 2010 | | | 2009 | |
| |
| Below 30 days | | $ | 3 | | | $ | — | |
| Between 31 and 60 days | | | 8 | | | | — | |
| Between 61 and 90 days | | | 4 | | | | — | |
| Between 91 and 365 days | | | 48 | | | | — | |
| Over 365 days | | | 1,438 | | | | — | |
| | | | | | | | | |
| | | $ | 1,501 | | | $ | — | |
| | | | | | | | | |
The movement of the allowance for credit losses during the current period under review is as follows:
| | | | | | | | | |
| | | 2010 | | | 2009 | |
| |
| Balance, beginning of the year | | $ | — | | | $ | — | |
| Additions | | | 698 | | | | — | |
| Reversals | | | — | | | | — | |
| Write-offs | | | — | | | | — | |
| Cumulative translation adjustment | | | 3 | | | | — | |
| | | | | | | | | |
| Balance, end of the year | | $ | 701 | | | $ | — | |
| | | | | | | | | |
As at December 31, 2010 and 2009, there was no trade receivable which would otherwise be past due or impaired if the terms had not been renegotiated.
90
TERRA NOVA ROYALTY CORPORATION
(Formerly KHD HUMBOLDT WEDAG INTERNATIONAL LTD.)
NOTES TO CONSOLIDATED FINANCIAL STATEMENTS — (Continued)
| |
| Note 10. | Other Receivables |
| | | | | | | | | |
| | | 2010 | | | 2009 | |
| |
| Investment income (of which $nil and $43 were due from affiliates at December 31, 2010 and 2009, respectively) | | $ | 827 | | | $ | 43 | |
Government taxes (primarily value-added andgoods-and-services taxes) | | | 2,997 | | | | 168 | |
| Due from affiliates | | | 8 | | | | — | |
| Royalty income from an interest in resource property | | | 5,650 | | | | 4,584 | |
| Employees | | | 25 | | | | — | |
| Derivative assets | | | 12 | | | | — | |
| Other | | | 2,588 | | | | 871 | |
| | | | | | | | | |
| | | $ | 12,107 | | | $ | 5,666 | |
| | | | | | | | | |
The receivables generally arise in the normal course of business and are expected to be collected within one year from the year end.
As at December 31, 2010 and 2009, there was no other receivable which would otherwise be past due or impaired if the terms had not been renegotiated.
| | | | | | | | | |
| | | 2010 | | | 2009 | |
| |
| Raw materials | | $ | 6,467 | | | $ | — | |
| Work-in-progress | | | 10,842 | | | | — | |
| Finished goods | | | 4,968 | | | | — | |
Commodity inventories (includinggoods-in-transit of $30,603) | | | 44,825 | | | | — | |
| | | | | | | | | |
| | | $ | 67,102 | | | $ | — | |
| | | | | | | | | |
The Group entered into sale and repurchase agreements with other commodity broker-traders pursuant to which the Group sold an agreed quantity of commodities at agreed prices and undertakes to buy back the same quantity of the same commodities at the same agreed prices in the future periods. These sale and repurchase transactions are accounted for as financing arrangements. The cash received is discounted at the market interest rate and shown as deferred sale liabilities. As at December 31, 2010, the Group recognized current and long-term deferred sale liabilities of $23,133 and $39,993, respectively. The long-term deferred liability is due on various dates in 2012.
As at December 31, 2010 and 2009, there was no inventory pledged as security for liabilities.
| |
| Note 12. | Contract Deposits, Prepaid and Other |
| | | | | | | | | |
| | | 2010 | | | 2009 | |
| |
| Prepayments and deposits for inventories (of which $16,942 was prepaid to an affiliate) | | $ | 18,657 | | | $ | — | |
| Taxes on stockpile | | | 325 | | | | 201 | |
| Prepaid, deposits and other | | | 1,865 | | | | 573 | |
| | | | | | | | | |
| | | $ | 20,847 | | | $ | 774 | |
| | | | | | | | | |
91
TERRA NOVA ROYALTY CORPORATION
(Formerly KHD HUMBOLDT WEDAG INTERNATIONAL LTD.)
NOTES TO CONSOLIDATED FINANCIAL STATEMENTS — (Continued)
| | | | | | | | | |
| | | 2010 | | | 2009 | |
| |
| Note receivable from a former subsidiary (CDN$ nil and CDN$1,750 at December 31, 2010 and 2009, respectively) | | $ | — | | | $ | 1,672 | |
| | | | | | | | | |
The Company held an investment in the preferred shares of former subsidiaries which were acquired by the Company in connection with the Company’s spin-off of Mass in 2006. As at December 31, 2008, the Company held all of the Series 2 Class B preferred shares in Mass and preferred shares in one of its former subsidiaries having an aggregate face value of CDN$127,866 and a financial liability of CDN$37,000 owing to Mass. The Company and Mass had a right to set off the recognized amounts and determined to settle on a net basis or simultaneously. Accordingly, the financial asset and the financial liability were offset and the net amount was reported in the consolidated statement of financial position. As at December 31, 2008, the net amount was written down to its estimated fair value of CDN$23,420 ($19,125) using a valuation model. There was no change in fair value in terms of Canadian dollars between December 31, 2008 and the settlement date. On May 12, 2009, the Company entered into and completed an agreement with Mass for the settlement of the non-transferable preferred shares of Mass and its former subsidiary for net consideration of CDN$12,284, which represented the gross settlement amount of the preferred shares of CDN$49,284 offset by the indebtedness of CDN$37,000 owed by the Company to Mass. The payment of the CDN$12,284 was settled as follows: (a) CDN$8,284 being satisfied by Mass agreeing to transfer to the Company 788,201 of the Company’s common shares. 262,734 of the Company’s common shares, valued at CDN$2,762, were delivered to the Company on May 12, 2009 and the remainder (which was equivalent to CDN$5,522) would be delivered no later than July 20, 2009. In July 2009, Mass, as permitted in the agreement, elected to deliver the remainder in cash to the Company; (b) CDN$1,710 being satisfied by way of cash payment by Mass to the Company on May 12, 2009; (c) CDN$1,750 being satisfied by way of issuance by Mass to the Company of a promissory note having a principal amount of CDN$1,750, a term of 24 months and an interest rate of 4% per annum payable annually in cash. The note was repayable at the option of the issuer by the issuance of common shares of Mass. The promissory note could be repaid or be redeemed at any time in cash at the option of the issuer. The note was outstanding as of December 31, 2009 and was classified under non-current assets in the consolidated statement of financial position. Pursuant to an agreement in the first quarter of 2010, the Company agreed to offset its payables to Mass against the note receivable plus accrued interest thereon due from Mass.; and (d) CDN$540 being satisfied by setting-off accrued and unpaid interest on indebtedness owed by the Company to Mass pursuant to a loan agreement with Mass dated January 31, 2006. Mass also settled CDN$11,346 in respect of the accrued dividends on the preferred shares of Mass by way of the issuance of a promissory note having a principal amount of CDN$11,346, a term of 24 months and an interest rate of 4% per annum payable annually in cash. The note was repayable at the option of the issuer by the issuance of common shares of Mass. On December 31, 2009, Mass exercised the conversion option and repaid the CDN$11,346 note by issuing and delivering 1,203,627 common shares of Mass to the Company. As a result of the settlement of the preferred shares of Mass and one of its former subsidiaries, the Company recognized a loss of $9,538 in the second quarter of 2009. This investment was the only item in Level 3 of the fair value hierarchy in 2009.
| |
| Note 14. | Long-term securities |
| | | | | | | | | |
| | | 2010 | | | 2009 | |
| |
Available-for-sale securities: | | | | | | | | |
| Publicly-traded | | $ | 7,235 | | | $ | — | |
| Unlisted | | | 27 | | | | — | |
| | | | | | | | | |
| | | $ | 7,262 | | | $ | — | |
| | | | | | | | | |
At December 31, 2010,available-for-sale securities comprised six publicly-traded equity securities and investment funds (of which the largest company represented 43%). In addition, included inavailable-for-sale securities was an investment in a corporation in which the Group has approximately a 9.9% equity interest. The carrying amount of such
92
TERRA NOVA ROYALTY CORPORATION
(Formerly KHD HUMBOLDT WEDAG INTERNATIONAL LTD.)
NOTES TO CONSOLIDATED FINANCIAL STATEMENTS — (Continued)
investment was $1,233 and $nil, respectively, as at December 31, 2010 and 2009. The corporation is related to Terra Nova as a result of a common officer.
| |
| Note 15. | Equity method investments |
All of the following investees were acquired in 2010 through the business combination of Mass. Accordingly, there was no comparable data for 2009.
| | | | | |
| | | 2010 | |
| |
| Joint ventures | | $ | 5,534 | |
| Other | | | 179 | |
| | | | | |
| | | $ | 5,713 | |
| | | | | |
Joint ventures
The following table shows the indirect significant joint ventures in China as at December 31, 2010:
| | | | | |
| | | Proportion of
|
| | | Ownership
|
Joint ventures | | Interest |
| |
| Zhejiang University No. 2 Hospital Hangzhou Eye Center | | | 55 | % |
| Chongqing Lasernet Guangji Eye Hospital (incorporated) | | | 58 | % |
| Chongqing Fuling Lasernet Eye Center | | | 65 | % |
| Sichuan Suining Lasernet Eye Center | | | 40 | % |
The following table presents the book values of the assets and liabilities related to the Group’s interest in the joint ventures as of December 31, 2010:
| | | | | |
| | | 2010 | |
| |
| Current assets | | $ | 3,901 | |
| Long-term assets | | | 3,795 | |
| | | | | |
| | | | 7,696 | |
| Liabilities | | | (2,162 | ) |
| | | | | |
| Net | | $ | 5,534 | |
| | | | | |
| Income | | $ | 1,918 | |
| Expenses | | | (964 | ) |
| | | | | |
| Net | | $ | 954 | |
| | | | | |
In respect of its interests in the joint ventures in China, the Group recognized assets (primarily medical equipment) under joint ventures with an amount of $5,534 as of December 31, 2010 which were financed by its own funds. The Group did not receive any fees to manage the joint ventures in 2010.
As at December 31, 2010, the Group has not incurred any contingent liabilities or capital commitments in relation to its interests in joint ventures, by the Group itself, or through the joint venturers or the joint venture.
93
TERRA NOVA ROYALTY CORPORATION
(Formerly KHD HUMBOLDT WEDAG INTERNATIONAL LTD.)
NOTES TO CONSOLIDATED FINANCIAL STATEMENTS — (Continued)
| |
| Note 16. | Investment property |
All of the investment property was acquired in 2010 through acquisition of Mass. Accordingly, there was no comparable data for 2009.
| | | | | |
| | | 2010 | |
| |
| Balance at beginning of the year | | $ | — | |
| Acquired through business combination | | | 39,405 | |
| Additions | | | — | |
| Change of fair value during the year | | | (294 | ) |
| Cumulative translation adjustment | | | (527 | ) |
| | | | | |
| Balance at end of the year | | $ | 38,584 | |
| | | | | |
The change of fair value of the investment property was included in the revenues in the statement of operations.
The amounts recognized in the statement of operations in relation to the investment property during 2010 are as follows:
| | | | | |
| | | 2010 |
| |
| Rental income | | $ | 194 | |
| Direct operating expenses (including repairs and maintenance) from investment property that generated rental income during the period | | | 109 | |
There were no restrictions on the realizability of investment property or the remittance of income and proceeds or disposal.
As at December 31, 2010, contractual obligations to purchase, construct or develop the investment property or for repairs, maintenance or enhancements were $nil.
| |
| Note 17. | Property, Plant and Equipment |
The following changes in property, plant and equipment were recorded in 2010:
| | | | | | | | | | | | | | | | | | | | | | | | | |
| | | | | | Acquisition
| | | | | | | | | Cumulative
| | | | |
| | | Opening
| | | through
| | | | | | | | | translation
| | | Ending
| |
Historical costs | | balance | | | consolidation | | | Additions | | | Divestiture | | | adjustments | | | balance | |
| |
| Land and building | | $ | — | | | $ | 384 | | | $ | 50 | | | $ | — | | | $ | 6 | | | $ | 440 | |
| Processing plant and equipment | | | — | | | | 2,457 | | | | 164 | | | | — | | | | (66 | ) | | | 2,555 | |
| Office equipment | | | 964 | | | | 999 | | | | 303 | | | | (110 | ) | | | 38 | | | | 2,194 | |
| | | | | | | | | | | | | | | | | | | | | | | | | |
| | | $ | 964 | | | $ | 3,840 | | | $ | 517 | | | $ | (110 | ) | | $ | (22 | ) | | $ | 5,189 | |
| | | | | | | | | | | | | | | | | | | | | | | | | |
| | | | | | | | | | | | | | | | | | | | | | | | | |
| | | | | | Acquisition
| | | | | | | | | Cumulative
| | | | |
| | | Opening
| | | through
| | | | | | | | | translation
| | | Ending
| |
Accumulated depreciation | | balance | | | consolidation | | | Additions | | | Divestiture | | | adjustments | | | balance | |
| |
| Land and building | | $ | — | | | $ | — | | | $ | 17 | | | $ | — | | | $ | 2 | | | $ | 19 | |
| Processing plant and equipment | | | — | | | | — | | | | 121 | | | | — | | | | (42 | ) | | | 79 | |
| Office equipment | | | 812 | | | | — | | | | 128 | | | | (82 | ) | | | 31 | | | | 889 | |
| | | | | | | | | | | | | | | | | | | | | | | | | |
| | | $ | 812 | | | $ | — | | | $ | 266 | | | $ | (82 | ) | | $ | (9 | ) | | $ | 987 | |
| | | | | | | | | | | | | | | | | | | | | | | | | |
| Net book value | | $ | 152 | | | | | | | | | | | | | | | | | | | $ | 4,202 | |
| | | | | | | | | | | | | | | | | | | | | | | | | |
94
TERRA NOVA ROYALTY CORPORATION
(Formerly KHD HUMBOLDT WEDAG INTERNATIONAL LTD.)
NOTES TO CONSOLIDATED FINANCIAL STATEMENTS �� (Continued)
The following changes in property, plant and equipment were recorded in 2009:
| | | | | | | | | | | | | | | | | | | | | |
| | | | | | | | | | | | Cumulative
| | | | |
| | | Opening
| | | | | | | | | translation
| | | Ending
| |
Office equipment | | balance | | | Additions | | | Divestiture | | | adjustments | | | balance | |
| |
| Historical costs | | $ | 839 | | | $ | 7 | | | $ | (23 | ) | | $ | 141 | | | $ | 964 | |
| Accumulated depreciation | | | (652 | ) | | | (52 | ) | | | 9 | | | | (117 | ) | | | (812 | ) |
| | | | | | | | | | | | | | | | | | | | | |
| Net book value | | $ | 187 | | | | | | | | | | | | | | | $ | 152 | |
| | | | | | | | | | | | | | | | | | | | | |
| |
| Note 18. | Interests in Resource Properties |
The Group’s interests in resource properties comprised the following:
| | | | | | | | | |
| | | 2010 | | | 2009 | |
| |
| Interest in an iron ore mine in Newfoundland and Labrador, Canada | | $ | 181,772 | | | $ | 191,488 | |
| Interest in an iron ore extracting facility in Goa, India | | | 49,525 | | | | — | |
| | | | | | | | | |
| Total | | $ | 231,297 | | | $ | 191,488 | |
| | | | | | | | | |
Newfoundland and Labrador, Canada
The lease of the Canadian iron ore mine is to expire in 2055. The iron ore deposit is currently leased to a third party entity under certain lease agreements which will expire in 2055. The Group collects the royalty payment directly from the entity based on a pre-determined formula, with a minimum payment not to be less than CDN$3,250 per year.
Goa, India
The Group has entered into a series of contracts with a third party Lease Holder (the “LH”) to recover iron ore.
The Group has contracted with LH to extract iron ore on behalf of the LH for which the Group receives a fixed fee per ton. The LH has contracted to sell the iron ore to the Group for a price per ton based on the extraction costs (the fixed fee) plus a royalty payment to the owner dependant upon the iron content of the iron ore. A memorandum of understanding exists between the Group and the LH relating to the two contracts whereby a certain profit sharing between the LH and the Group has been fixed. The LH has granted a power of attorney to the Group granting the Group the right to extract, crush, screen and store the iron ore on the site of the LH. The Group has obtained the licences in compliance with all regulations and legal requirements on behalf of the LH, thus securing the surface rights.
The initial term for the two contracts is five years, expiring on September 4, 2011. The Group has been granted the right to renew the contracts for a further three years until September 4, 2014, then for a further three years until September 4, 2017 and then for a final term of another three years until September 4, 2020. The LH has the right to terminate the contracts in the event that no mining activities are conducted over a continuous period of six months.
The Group is a registered exporter of iron ore who contracts with the LH for the purchase of iron ore.
The following changes in interests in resource properties were recorded in 2010:
| | | | | | | | | | | | | | | | | | | | | |
| | | | | | Acquisition
| | | | | | Cumulative
| | | | |
| | | Opening
| | | through
| | | | | | translation
| | | Ending
| |
Historical costs | | balance | | | consolidation | | | Additions | | | adjustments | | | balance | |
| |
| Interest in iron ore mine in Canada | | $ | 200,000 | | | $ | — | | | $ | 303 | | | $ | — | | | $ | 200,303 | |
| Interest in iron ore extracting facility in India | | | — | | | | 51,001 | | | | — | | | | 26 | | | | 51,027 | |
| | | | | | | | | | | | | | | | | | | | | |
| | | $ | 200,000 | | | $ | 51,001 | | | $ | 303 | | | $ | 26 | | | $ | 251,330 | |
| | | | | | | | | | | | | | | | | | | | | |
95
TERRA NOVA ROYALTY CORPORATION
(Formerly KHD HUMBOLDT WEDAG INTERNATIONAL LTD.)
NOTES TO CONSOLIDATED FINANCIAL STATEMENTS — (Continued)
| | | | | | | | | | | | | | | | | | | | | |
| | | | | | Acquisition
| | | | | | Cumulative
| | | | |
| | | Opening
| | | through
| | | | | | translation
| | | Ending
| |
Accumulated depletion | | balance | | | consolidation | | | Additions | | | adjustments | | | balance | |
| |
| Interest in iron ore mine in Canada | | $ | 8,512 | | | $ | — | | | $ | 10,019 | | | $ | — | | | $ | 18,531 | |
| Interest in iron ore extracting facility in India | | | — | | | | — | | | | 1,481 | | | | 21 | | | | 1,502 | |
| | | | | | | | | | | | | | | | | | | | | |
| | | $ | 8,512 | | | $ | — | | | $ | 11,500 | | | $ | 21 | | | $ | 20,033 | |
| | | | | | | | | | | | | | | | | | | | | |
| Net book value | | $ | 191,488 | | | | | | | | | | | | | | | $ | 231,297 | |
| | | | | | | | | | | | | | | | | | | | | |
The following changes in interests in resource property were recorded in 2009:
| | | | | | | | | | | | | |
| | | Opening
| | | | | | Ending
| |
Interest in iron ore mine in Newfoundland and Labrador, Canada | | balance | | | Additions | | | balance | |
| |
| Historical costs | | $ | 200,000 | | | | — | | | $ | 200,000 | |
| Accumulated depletion | | | — | | | | (8,512 | ) | | | (8,512 | ) |
| | | | | | | | | | | | | |
| Net book value | | $ | 200,000 | | | | | | | $ | 191,488 | |
| | | | | | | | | | | | | |
| |
| Note 19. | Deferred Income Tax Assets and Liabilities |
The tax effect of temporary differences and tax loss carry-forwards that give rise to significant components of future tax assets and liabilities are as follows:
| | | | | | | | | |
| | | 2010 | | | 2009 | |
| |
| Non-capital tax loss carry-forwards | | $ | 5,639 | | | $ | 11,004 | |
| Interest in resource property | | | (62,531 | ) | | | (48,664 | ) |
| Other assets | | | 1,512 | | | | 1,160 | |
| Other liabilities | | | (2,329 | ) | | | (49 | ) |
| | | | | | | | | |
| | | $ | (57,709 | ) | | $ | (36,549 | ) |
| | | | | | | | | |
| Deferred income tax assets and liabilities are included in the consolidated statement of financial position as follows: | | | | | | | | |
| Deferred income tax assets | | $ | 6,727 | | | $ | 12,115 | |
| Deferred income tax liabilities | | | (64,436 | ) | | | (48,664 | ) |
| | | | | | | | | |
| Net future income tax liabilities | | $ | (57,709 | ) | | $ | (36,549 | ) |
| | | | | | | | | |
At December 31, 2010, the Group had estimated accumulated non-capital losses which expire in the following countries as follows. Management is of the opinion that not all of these non-capital losses are probable to be utilized in the future.
| | | | | | | |
Country | | Amount | | | Expiration dates |
| |
| Canada | | $ | 52,163 | | | 2021-2030 |
| Germany | | | 543 | | | Indefinite |
| Switzerland | | | 2,373 | | | 2014-2017 |
| China | | | 101 | | | 2014 |
| US | | | 20,662 | | | 2011-2030 |
| Austria | | | 11,946 | | | Indefinite |
| India | | | 63,573 | | | 2013-2018 |
96
TERRA NOVA ROYALTY CORPORATION
(Formerly KHD HUMBOLDT WEDAG INTERNATIONAL LTD.)
NOTES TO CONSOLIDATED FINANCIAL STATEMENTS — (Continued)
At December 31, 2010, Terra Nova had an aggregate amount of $41,326 of temporary differences associated with its investments in subsidiaries, associates and interests in joint ventures, for which deferred tax liabilities have not been recognized because the Group is in a position to control the timing of the reversal of such temporary differences and it is probable that such differences will not reverse in the foreseeable future.
| |
| Note 20. | Short-term Bank Borrowings |
Generally, short-term bank borrowings are repayable within a year.
Short-term bank borrowings
| | | | | | | | | |
| | | 2010 | | | 2009 | |
| |
| Credit facilities from banks | | $ | 69,979 | | | $ | — | |
| | | | | | | | | |
| | | $ | 69,979 | | | $ | — | |
| | | | | | | | | |
As at December 31, 2010, the Group had credit facilities aggregating $378,955 as follows: (i) the Group had unsecured revolving credit facilities aggregating $190,807 from banks. The banks generally charge an interest rate at inter-bank rate plus an interest margin; (ii) the Group also has revolving credit facilities aggregating $7,377 from banks for structured trade finance (“STF”), a special trade financing. The margin is negotiable when the facility is used; (iii) the Group had a non-recourse revolving factoring arrangement with a bank up to a credit limit of $113,819 for the Group’s commodities activities. Generally, the Group factors its trade receivable accounts upon invoicing, at inter-bank rate plus a margin; and (iv) the Group had a foreign exchange credit facility of $66,952 with a bank. All these facilities are renewable on a yearly basis.
| | | | | | | | | |
| | | 2010 | | | 2009 | |
| |
| Due to a bank, ���14,350 at December 31, 2010, interest fixed at Austria’s Oesterreichische Kontrollbank Aktiengesellschaft (“OeKB”) financing rate of 3.7% per annum and payable quarterly, secured by a guarantee of the Republic of Austria and due in January 2012 | | $ | 19,215 | | | $ | — | |
| Due to a bank, €1,172 at December 31, 2010, interest fixed at 4.05% per annum and payable quarterly, secured by a charge on land and due in quarterly payments with a balloon final payment in March 2013 | | | 1,569 | | | | — | |
| Due to a bank, €4,070 at December 31, 2010, interest at interbank rate plus an interest margin (2.7% at December 31, 2010) and payable quarterly and due in 2011 to 2012 | | | 5,450 | | | | — | |
| Due to a bank, €3,000 at December 31, 2010, interest at interbank rate plus an interest margin (2.1% at December 31, 2010) and payable monthly and due in December 2012 | | | 4,017 | | | | | |
| Due to a bank, €4,800 at December 31, 2010, interest at Austria’s OeKB financing rate plus an interest margin (2.8% at December 31, 2010) and payable quarterly, secured by a guarantee of the Republic of Austria and due in 2011 to 2014 in four equal instalments | | | 6,428 | | | | | |
| Due to a bank, €12,000 at December 31, 2010, interest fixed at OeKB’s financing rates between 4.6% and 4.9% per annum and payable quarterly, secured by a guarantee of the Republic of Austria and due in 2013 | | | 16,069 | | | | — | |
| | | | | | | | | |
| | | $ | 52,748 | | | $ | — | |
| | | | | | | | | |
| Current portion | | $ | 4,144 | | | $ | — | |
| Long-term portion | | | 48,604 | | | | — | |
| | | | | | | | | |
| | | $ | 52,748 | | | $ | — | |
| | | | | | | | | |
97
TERRA NOVA ROYALTY CORPORATION
(Formerly KHD HUMBOLDT WEDAG INTERNATIONAL LTD.)
NOTES TO CONSOLIDATED FINANCIAL STATEMENTS — (Continued)
As of December 31, 2010, the maturities of debt are as follows:
| | | | | | | | | | | | | |
Maturity | | Principal | | | Interest | | | Total | |
| |
| 2011 | | $ | 4,144 | | | $ | 1,841 | | | $ | 5,985 | |
| 2012 | | | 27,845 | | | | 1,076 | | | | 28,921 | |
| 2013 | | | 19,152 | | | | 585 | | | | 19,737 | |
| 2014 | | | 1,607 | | | | 33 | | | | 1,640 | |
| | | | | | | | | | | | | |
| | | $ | 52,748 | | | $ | 3,535 | | | $ | 56,283 | |
| | | | | | | | | | | | | |
No interest expense was capitalized in both years ended December 31, 2010 and 2009.
| |
| Note 22. | Accounts Payable and Accrued Expenses |
| | | | | | | | | |
| | | 2010 | | | 2009 | |
| |
| Trade and accounts payables | | $ | 35,536 | | | $ | 3,496 | |
Value-added,goods-and-sales and other taxes (other than income taxes) | | | 3,023 | | | | 983 | |
| Affiliates | | | 524 | | | | 1,522 | |
| Compensation | | | 2,060 | | | | — | |
| Interest | | | 42 | | | | 21 | |
| Derivative liabilities | | | 5,821 | | | | — | |
| Short-sale | | | 124 | | | | — | |
| | | | | | | | | |
| | | $ | 47,130 | | | $ | 6,022 | |
| | | | | | | | | |
The trade payables arise from the Group’sday-to-day trading activities. The terms with affiliates in the normal course of the Group’s activities are no different from third parties. The Group’s expenses for services and other operational expenses are included in other payables. Generally, these payable and accrual accounts do not bear interest and they have a maturity of less than a year.
| | | | | | | | | | | | | |
| | | Termination of
| | | | | | | |
| | | office lease | | | Warranty | | | Total | |
| |
| Acquisitions through business combination | | $ | 500 | | | $ | 144 | | | $ | 644 | |
| Additions | | | — | | | | — | | | | — | |
| Paid | | | (21 | ) | | | — | | | | (21 | ) |
| Reversal | | | — | | | | (31 | ) | | | (31 | ) |
| Cumulative translation adjustment | | | — | | | | 2 | | | | 2 | |
| | | | | | | | | | | | | |
| Balance, December 31, 2010 | | $ | 479 | | | $ | 115 | | | $ | 594 | |
| | | | | | | | | | | | | |
| | | | | | | | | | | | | |
| Current portion | | | | | | | | | | $ | 362 | |
| Long-term portion | | | | | | | | | | | 232 | |
| | | | | | | | | | | | | |
| | | | | | | | | | | $ | 594 | |
| | | | | | | | | | | | | |
There were no provisions for 2009.
98
TERRA NOVA ROYALTY CORPORATION
(Formerly KHD HUMBOLDT WEDAG INTERNATIONAL LTD.)
NOTES TO CONSOLIDATED FINANCIAL STATEMENTS — (Continued)
The authorized share capital of Terra Nova consists of an unlimited number of common shares without par value and without special rights or restrictions and an unlimited number of Class A Preference shares without par value and with special rights and restrictions.
Holders of common shares may receive dividends when, as and if declared by the board, subject to the preferential dividend rights of any other classes or series of preferred shares issued and outstanding. In no event may a dividend be declared or paid on the common shares if payment of the dividend would cause the realizable value of the assets of the Company to be less than the aggregate of its liabilities. Holders of common shares are entitled to one vote per share at any meeting of shareholders of any class of common shares, and in general and subject to applicable law, all matters will be determined by a majority of votes cast other than fundamental changes with respect to the Company. The common shareholders shall be entitled, in the event of a distribution of assets of the Company on the liquidation, dissolution orwinding-up of the Company (a “Liquidation Distribution”), to receive, before any Liquidation Distribution is made to the holders of the class A common shares or any other shares of the Company ranking junior to the common shares, but after any prior rights of any preferred shares, the stated capital with respect to each common share held by them, together with all declared and unpaid dividends (if any and if preferential) thereon, up to the date of such Liquidation Distribution, and thereafter the common shares shall rank pari passu with all other classes of common shares in connection with the Liquidation Distribution.
The Class A Preference shares may include one or more series and the directors may alter the special rights and restrictions to such series, or alter such rights or restrictions. Except as may be set out in the rights and restrictions, the holders of the Class A Preference shares are not entitled to vote at or attend shareholder meetings. Holders of Class A Preference shares are entitled to receive repayment of capital on the liquidation or dissolution of Terra Nova before distribution is made to holders of common shares.
All the treasury stock are held by the wholly-owned subsidiaries.
| |
| Note 25. | Share-Based Compensation |
Terra Nova has a 1997 Stock Option Plan and a 2008 Equity Incentive Plan.
1997 Stock Option Plan (Amended)
Terra Nova has a stock option plan which enables certain employees and directors to acquire common shares and the options may be granted under the plan exercisable over a period not exceeding ten years. Terra Nova is authorized to issue up to 5,524,000 shares under this plan.
2008 Equity Incentive Plan
Subject to the terms of the 2008 Equity Incentive Plan, a committee, as appointed by the board of directors, may grant awards under the plan, establish the terms and conditions for those awards, construe and interpret the plan and establish the rules for the plan’s administration. The committee may grant nonqualified stock options, incentive stock options, stock appreciation rights, restricted stock awards, stock unit awards, stock awards, performance stock awards and tax bonus awards under the plan. The maximum number of common shares of Terra Nova that are issuable under all awards granted under the plan is 1,500,000 common shares.
99
TERRA NOVA ROYALTY CORPORATION
(Formerly KHD HUMBOLDT WEDAG INTERNATIONAL LTD.)
NOTES TO CONSOLIDATED FINANCIAL STATEMENTS — (Continued)
Following is a summary of the status of the plans:
| | | | | | | | | | | | | | | | | |
| | | 2008 Plan | | | 2008 Plan | | | 1997 Plan | | | 1997 Plan | |
| | | | | | Weighted
| | | | | | Weighted
| |
| | | | | | Average
| | | | | | Average
| |
| | | Number of
| | | Exercise Price
| | | Number of
| | | Exercise Price
| |
| | | Awards | | | Per Share | | | Options | | | Per Share | |
| |
| Outstanding at December 31, 2008 | | | — | | | | — | | | | 1,579,720 | | | | 24.96 | |
| Cancelled by agreements | | | — | | | | — | | | | (72,500 | ) | | | 31.16 | |
| Forfeited | | | — | | | | — | | | | (1,065,556 | ) | | | 23.74 | |
| | | | | | | | | | | | | | | | | |
| Outstanding at December 31, 2009 | | | — | | | | — | | | | 441,664 | | | | 26.89 | |
| Exercised | | | — | | | | — | | | | (25,000 | ) | | | 13.06 | |
| Forfeited | | | — | | | | — | | | | (416,664 | ) | | | 27.72 | |
| | | | | | | | | | | | | | | | | |
| Outstanding at December 31, 2010 | | | — | | | | — | | | | — | | | | — | |
| | | | | | | | | | | | | | | | | |
| As at December 31, 2010 | | | — | | | | | | | | | | | | | |
| Options granted and exercised | | | — | | | | | | | | 3,791,656 | | | | | |
| | | | | | | | | | | | | | | | | |
| Options available for granting in the future periods | | | 1,500,000 | | | | | | | | 1,732,344 | | | | | |
| | | | | | | | | | | | | | | | | |
No stock options expired or were granted in 2010 and 2009.
See Note 34 on options granted in January 2011 to purchase 2,635,000 common shares of Terra Nova.
The following tables summarize the stock-based compensation expenses recognized by the Group:
| | | | | | | | | |
| | | 2010 | | | 2009 | |
| |
| Stock-based compensation recovery (expenses) arising from options granted by: | | | | | | | | |
| Terra Nova | | $ | 1,415 | | | $ | 391 | |
| A Canadian non-wholly owned subsidiary | | | (72 | ) | | | — | |
| | | | | | | | | |
| Total | | $ | 1,343 | | | $ | 391 | |
| | | | | | | | | |
| As allocated to: | | | | | | | | |
| Continuing operations | | $ | (72 | ) | | $ | 2,713 | |
| Discontinued operations | | | 1,415 | | | | (2,322 | ) |
| | | | | | | | | |
| Total | | $ | 1,343 | | | $ | 391 | |
| | | | | | | | | |
The stock-based compensation cost is not tax deductible under the Canadian income tax act and, therefore, the Group did not recognize any tax benefit from granting stock options.
| |
| Note 26. | Consolidated Statements of Operations |
Revenues
| | | | | | | | | |
| | | 2010 | | | 2009 | |
| |
| Gross revenues as reported | | $ | 85,430 | | | $ | 14,718 | |
| | | | | | | | | |
For the components of the Group’s total revenues, please see Note 5.
100
TERRA NOVA ROYALTY CORPORATION
(Formerly KHD HUMBOLDT WEDAG INTERNATIONAL LTD.)
NOTES TO CONSOLIDATED FINANCIAL STATEMENTS — (Continued)
The Group’s revenues included the following items:
| | | | | | | | | |
| | | 2010 | | | 2009 | |
| |
Realized gain onavailable-for-sale securities | | $ | 568 | | | $ | — | |
| Holding gains on advance sales of securities | | | 4 | | | | — | |
| Collection of underpayment of resource property royalty from prior years | | | 11,219 | | | | — | |
| Market value increment on commodities | | | 1,982 | | | | — | |
Expenses
The Group’s costs of sales comprised:
| | | | | | | | | |
| | | 2010 | | | 2009 | |
| |
| Commodities and resources | | $ | 35,975 | | | $ | — | |
| Depletion of Wabush resource property | | | 10,019 | | | | 8,512 | |
| Loss on dispositions of subsidiaries | | | 834 | | | | — | |
| Credit losses on loans and receivables | | | 795 | | | | — | |
| Revaluation adjustment on investment property | | | 294 | | | | — | |
| Revaluation adjustment on properties for sale | | | 241 | | | | — | |
| Other | | | 1,194 | | | | 13 | |
| | | | | | | | | |
| Total costs of sales | | $ | 49,352 | | | $ | 8,525 | |
| | | | | | | | | |
The Group included the following items in its costs of sales:
| | | | | | | | | |
| | | 2010 | | | 2009 | |
| |
| Inventories as costs of goods sold | | $ | 34,647 | | | $ | — | |
| Write-down of inventories | | | 88 | | | | — | |
Additional information on the nature of expenses
| | | | | | | | | |
| | | 2010 | | | 2009 | |
| |
| Depreciation, amortization and depletion | | $ | 11,766 | | | $ | 8,563 | |
| Employee benefits expenses | | | 3,758 | | | | 2,759 | |
Terra Nova’s statutory tax rate was 28.5% and 29.0% in 2010 and 2009, respectively.
101
TERRA NOVA ROYALTY CORPORATION
(Formerly KHD HUMBOLDT WEDAG INTERNATIONAL LTD.)
NOTES TO CONSOLIDATED FINANCIAL STATEMENTS — (Continued)
A reconciliation of the provision for income taxes calculated at applicable statutory rates in Canada to the provision in the consolidated statements of operations is as follows:
| | | | | | | | | |
| | | 2010 | | | 2009 | |
| |
| Income (loss) before income taxes from continuing operations | | $ | 52,156 | | | $ | (20,791 | ) |
| | | | | | | | | |
| Computed recovery of (provision for) income taxes at Terra Nova’s statutory rates | | $ | (14,865 | ) | | $ | 6,030 | |
| (Increase) decrease in taxes resulting from: | | | | | | | | |
| Foreign tax rate differences | | | 374 | | | | (155 | ) |
| Non-taxable negative goodwill | | | 11,702 | | | | — | |
| Other non-taxable income | | | 926 | | | | 7 | |
| Stock-based compensation | | | (19 | ) | | | 807 | |
| Net tax reductions unrecognized in prior years | | | 1,352 | | | | 3,112 | |
| Resource property revenue taxes | | | (6,744 | ) | | | (3,039 | ) |
| Unrecognized losses in current year | | | (363 | ) | | | — | |
| Permanent differences | | | 135 | | | | 487 | |
| Reduction in future tax rate | | | 34 | | | | (330 | ) |
| Loss on investment in preferred shares of former subsidiaries | | | — | | | | (2,828 | ) |
| Other, net | | | 493 | | | | 380 | |
| | | | | | | | | |
| Recovery of (provision for) income taxes | | $ | (6,975 | ) | | $ | 4,471 | |
| | | | | | | | | |
| Consisting of: | | | | | | | | |
| Resource property revenue taxes | | $ | (6,744 | ) | | $ | (3,039 | ) |
| Other income tax expense (recovery) | | | (231 | ) | | | 7,510 | |
| | | | | | | | | |
| | | $ | (6,975 | ) | | $ | 4,471 | |
| | | | | | | | | |
In addition, the aggregate current and deferred tax relating to items that are charged to equity was $256 and $nil, respectively, in 2010 and 2009.
The Group’s tax expense above does not include any amounts for joint ventures and associates or discontinued operations whose results are included in the statement of operations net of taxes.
In general, dividend payable by Terra Nova to its shareholders is subject to customary Canadian withholding tax for non-resident shareholders. Pursuant to applicable tax treaties the withholding rate for eligible US resident shareholders is 15%. The dividend is an eligible dividend under theIncome Tax Act(Canada).
| |
| Note 28. | Earnings (Loss) Per Share |
Earnings (loss) per share data for the years ended December 31 from operations is summarized as follows:
| | | | | | | | | |
| | | 2010 | | | 2009 | |
| |
| Basic earnings (loss) from continuing operations available to holders of common shares | | $ | 45,839 | | | $ | (16,320 | ) |
| Effect of dilutive securities: | | | — | | | | — | |
| | | | | | | | | |
| Diluted earnings (loss) from continuing operations | | $ | 45,839 | | | $ | (16,320 | ) |
| | | | | | | | | |
102
TERRA NOVA ROYALTY CORPORATION
(Formerly KHD HUMBOLDT WEDAG INTERNATIONAL LTD.)
NOTES TO CONSOLIDATED FINANCIAL STATEMENTS — (Continued)
| | | | | | | | | |
| | | Number of Shares | |
| | | 2010 | | | 2009 | |
| |
| Weighted average number of common shares outstanding — basic | | | 35,857,873 | | | | 30,354,207 | |
| Effect of dilutive securities: | | | | | | | | |
| Options | | | 1,038 | | | | — | |
| | | | | | | | | |
| Weighted average number of common shares outstanding — diluted | | | 35,858,911 | | | | 30,354,207 | |
| | | | | | | | | |
As at December 31, 2009, there were 441,664 stock options, respectively, outstanding that could potentially dilute basic earnings per share in the future, but were not included in the calculation of diluted earnings per share because they were antidilutive for 2009. There were no stock options outstanding as at December 31, 2010.
See Note 34 on options granted in January 2011 to purchase 2,635,000 common shares of Terra Nova, which would have changed the number of common shares or potential common shares outstanding at the end of 2010 if those transactions had occurred before the end of 2010.
| |
| Note 29. | Commitments and Contingencies |
Leases as lessors
The Group leases out land and buildings, primarily classified under investment property, under non-cancellable operating lease agreements. The leases have varying terms, subject to the customary practices in the particular regions.
Future minimum commitments under long-term non-cancellable operating leases are as follows:
| | | | | |
Year | | Amount | |
| |
| 2011 | | $ | 2,098 | |
| 2012 | | | 960 | |
| 2013 | | | 247 | |
| 2014 | | | 35 | |
| 2015 | | | 21 | |
| Thereafter | | | — | |
| | | | | |
| | | $ | 3,361 | |
| | | | | |
The leases have varying terms, subject to the customary practices in the local regions. The Group recognized rental income of $330 and $nil for the years ended December 31, 2010 and 2009, respectively.
Leases as lessees
Future minimum commitments under long-term non-cancellable operating leases are as follows:
| | | | | |
Year | | Amount | |
| |
| 2011 | | $ | 2,077 | |
| 2012 | | | 1,570 | |
| 2013 | | | 1,011 | |
| 2014 | | | 763 | |
| 2015 | | | 708 | |
| Thereafter | | | 12 | |
| | | | | |
| | | $ | 6,141 | |
| | | | | |
103
TERRA NOVA ROYALTY CORPORATION
(Formerly KHD HUMBOLDT WEDAG INTERNATIONAL LTD.)
NOTES TO CONSOLIDATED FINANCIAL STATEMENTS — (Continued)
The leases have varying terms, subject to the customary practices in the local regions. Minimum lease payments recognized as expenses were $800 and $281 for the years ended December 31, 2010 and 2009, respectively.
Litigation
The Group is subject to litigation in the normal course of business. Management considers the aggregate liability which may result from such litigation not material at December 31, 2010.
Guarantees
Guarantees are treated as contingent liabilities unless it becomes probable that the Group will be required to make payment under the guarantee.
The Group has issued a guarantee to a former subsidiary for its unsecured bonds up to an amount of $869. This guarantee expires in 2016.
As at December 31, 2010, the Group had issued guarantees up to a maximum of $44,965 to its trading and financing partners in the normal course of its commodities activities, of which $24,812 has been used and outstanding and has not been recorded as liabilities in the consolidated statement of financial position. There has been no claim against the guarantees.
Loan Commitment
The Group has granted a credit facility up to $20,000 to an affiliate, of which $5,792 had been drawn and outstanding as at December 31, 2010 (see Note 8). The credit facility is to expire in December 2011 and may be extended for one additional term of up to six months at the option of the Group.
Purchase Obligations
As at December 31, 2010, the Group had open purchase contracts aggregating $32,748 with respect to its commodities activities.
104
TERRA NOVA ROYALTY CORPORATION
(Formerly KHD HUMBOLDT WEDAG INTERNATIONAL LTD.)
NOTES TO CONSOLIDATED FINANCIAL STATEMENTS — (Continued)
| |
| Note 30. | Financial Instruments |
The fair value of financial instruments at December 31 is summarized as follows:
| | | | | | | | | | | | | | | | | |
| | | 2010 | | | 2009 | |
| | | Carrying
| | | Fair
| | | Carrying
| | | Fair
| |
| | | Amount | | | Value | | | Amount | | | Value | |
| |
Financial Assets: | | | | | | | | | | | | | | | | |
Fair value through profit or loss: | | | | | | | | | | | | | | | | |
| Cash and cash equivalents (including short-term cash deposits and restricted cash) | | $ | 401,161 | | | $ | 401,161 | | | $ | 38,046 | | | $ | 38,046 | |
| Short-term securities | | | 25,145 | | | | 25,145 | | | | 11,212 | | | | 11,212 | |
| Derivative assets | | | 12 | | | | 12 | | | | — | | | | — | |
Loans and receivables: | | | | | | | | | | | | | | | | |
| Receivables* | | | 27,978 | | | | 27,978 | | | | 5,498 | | | | 5,498 | |
Available-for-sale instruments: | | | | | | | | | | | | | | | | |
| Securities, at market value | | | 9,968 | | | | 9,968 | | | | — | | | | — | |
Available-for-sale instruments that do no have a quoted market price in an active market: | | | | | | | | | | | | | | | | |
| Securities, unlisted | | | 43 | | | | 43 | | | | — | | | | — | |
| | | | | | | | | | | | | | | | | |
| Total | | $ | 464,307 | | | $ | 464,307 | | | $ | 54,756 | | | $ | 54,756 | |
| | | | | | | | | | | | | | | | | |
| | | | | | | | | | | | | | | | | |
Financial Liabilities: | | | | | | | | | | | | | | | | |
Other financial liabilities: | | | | | | | | | | | | | | | | |
| Short-term borrowings | | $ | 69,979 | | | $ | 69,979 | | | $ | — | | | $ | — | |
| Accounts payable and accrued expenses and provisions* | | | 38,765 | | | | 38,765 | | | | 5,039 | | | | 5,039 | |
| Debt | | | 52,748 | | | | 53,399 | | | | — | | | | — | |
Held for trading: | | | | | | | | | | | | | | | | |
| Derivative liabilities | | | 5,821 | | | | 5,821 | | | | — | | | | — | |
| | | | | | | | | | | | | | | | | |
| Total | | $ | 167,313 | | | $ | 167,964 | | | $ | 5,039 | | | $ | 5,039 | |
| | | | | | | | | | | | | | | | | |
| | |
| * | | not including derivative financial instruments |
Fair value of a financial instrument can be characterized as the amount at which a financial instrument could be bought or sold in a current transaction between willing parties under no compulsion to act (that is, other than in a forced transaction, involuntary liquidation or distressed sale). The best evidence of fair value is published price quotations in an active market. When the market for a financial asset or financial liability is not active, an entity establishes fair value by using a valuation technique. The chosen valuation technique makes maximum use of inputs observed from markets, and relies as little as possible on inputs generated by the entity. Entity-generated inputs take into account factors that market participants would consider when pricing the financial instruments, such as liquidity and credit risks. Use of judgment is significantly involved in estimating fair value of financial instruments in inactive markets and actual results could materially differ from the estimates.
The fair value of cash and cash equivalents, restricted cash and term deposits is based on reported market value. The fair value of short-term trading securities is based on quoted market prices (Level 1 fair value hierarchy). The fair value of unlisted securities is based on their estimated net realizable values. The fair value ofavailable-for-sale securities is based on quoted market prices; except for those which are not quoted in an active market, they will be measured by an appropriate valuation method (Level 3 fair value hierarchy). The fair values of short-term receivables, short-term
105
TERRA NOVA ROYALTY CORPORATION
(Formerly KHD HUMBOLDT WEDAG INTERNATIONAL LTD.)
NOTES TO CONSOLIDATED FINANCIAL STATEMENTS — (Continued)
borrowings and accounts payable and accrued expenses, due to their short-term nature and normal trade credit terms, approximate their carrying value. The fair values of non-current receivables, long-term debt and other long-term liabilities were determined using discounted cash flows at prevailing market rates of interest for a similar instrument with a similar credit rating. The fair values of the foreign currency derivative financial instruments are based on the quotes from foreign exchange dealersand/or brokers and reviewed and confirmed by management of the Group using readily observable market input, such as forward exchange rates (Level 2 fair value hierarchy). Generally, the Group gets quotes from two or three foreign exchange dealers/brokers for comparison and such quotes are binding if the Group chooses to accept.
The following table presents the financial instruments measured at fair value classified by the fair value hierarchy as at December 31, 2010 and 2009:
| | | | | | | | | | | | | | | | | |
As at December 31, 2010 | | Level 1 | | | Level 2 | | | Level 3 | | | Total | |
| |
Financial Assets: | | | | | | | | | | | | | | | | |
Held for trading: | | | | | | | | | | | | | | | | |
| Short-term securities | | $ | 25,145 | | | $ | — | | | $ | — | | | $ | 25,145 | |
| Derivative assets | | | — | | | | 12 | | | | — | | | | 12 | |
Available-for-sale securities | | | 9,968 | | | | — | | | | — | | | | 9,968 | |
| | | | | | | | | | | | | | | | | |
| Total | | $ | 35,113 | | | $ | 12 | | | $ | — | | | $ | 35,125 | |
| | | | | | | | | | | | | | | | | |
Financial Liabilities: | | | | | | | | | | | | | | | | |
Held for trading: | | | | | | | | | | | | | | | | |
| Derivative liabilities | | $ | — | | | $ | 5,821 | | | $ | — | | | $ | 5,821 | |
| | | | | | | | | | | | | | | | | |
| | | | | | | | | | | | | | | | | |
As at December 31, 2009 | | Level 1 | | | Level 2 | | | Level 3 | | | Total | |
| |
Financial Assets: | | | | | | | | | | | | | | | | |
Held for trading: | | | | | | | | | | | | | | | | |
| Short-term securities | | $ | 11,212 | | | $ | — | | | | — | | | $ | 11,212 | |
| | | | | | | | | | | | | | | | | |
| Total | | $ | 11,212 | | | $ | — | | | $ | — | | | $ | 11,212 | |
| | | | | | | | | | | | | | | | | |
Financial Liabilities: | | | | | | | | | | | | | | | | |
Held for trading: | | | | | | | | | | | | | | | | |
| Derivative liabilities | | $ | — | | | $ | — | | | $ | — | | | $ | — | |
| | | | | | | | | | | | | | | | | |
| | | | | | | | | |
Movement of Level 3 of fair value hierarchy: | | 2010 | | | 2009 | |
| |
| Opening balance | | $ | — | | | $ | 19,125 | |
| Settlement (see Note 13) | | | — | | | | (19,125 | ) |
| Additions (see Note 4) | | | 162,958 | | | | — | |
| Distributions to shareholders (see Note 4) | | | (161,348 | ) | | | — | |
| Reclassification to Level 1 of fair value hierarchy (see Notes 4 and 6) | | | (1,610 | ) | | | — | |
| | | | | | | | | |
| Ending balance | | $ | — | | | $ | — | |
| | | | | | | | | |
Generally, management of the Group believes that the current financial assets and financial liabilities, due to their short-term nature, do not pose significant financial risks. The Group uses various financial instruments to manage its exposure to various financial risks. The policies for controlling the risks associated with financial instruments include, but are not limited to, standardized company procedures and policies on matters such as hedging of risk exposures, avoidance of undue concentration of risk and requirements for collateral (including letters of credit) to mitigate credit risk. The
106
TERRA NOVA ROYALTY CORPORATION
(Formerly KHD HUMBOLDT WEDAG INTERNATIONAL LTD.)
NOTES TO CONSOLIDATED FINANCIAL STATEMENTS — (Continued)
Group has risk managers and other personnel to perform checking functions and risk assessments to ensure that Group’s procedures and policies are complied with.
Many of the Group’s strategies, including the use of derivative instruments and the types of derivative instruments selected by the Group, are based on historical trading patterns and correlations and the Group’s management’s expectations of future events. However, these strategies may not be fully effective in all market environments or against all types of risks. Unexpected market developments may affect the Group’s risk management strategies during the period, and unanticipated developments could impact the Group’s risk management strategies in the future. If any of the variety of instruments and strategies the Group utilizes is not effective, the Group may incur losses.
The Group does not trade in financial instruments, including derivative financial instruments, for speculative purposes.
The nature of the risk that the Group’s financial instruments are subject to is set out in the following table:
| | | | | | | | | | | | | | | | | | | | | |
| | | Risks |
| | | | | | | Market Risks |
Financial Instrument | | Credit | | Liquidity | | Currency | | Interest Rate | | Other Price |
| |
| Cash and cash equivalents, short-term cash deposits and restricted cash | | | X | | | | | | | | X | | | | X | | | | | |
| Short-term securities | | | | | | | | | | | X | | | | | | | | X | |
| Long-term securities | | | | | | | X | | | | X | | | | | | | | X | |
| Derivative assets and liabilities | | | X | | | | X | | | | X | | | | | | | | X | |
| Receivables | | | X | | | | | | | | X | | | | | | | | | |
| Short-term bank borrowings | | | | | | | X | | | | X | | | | X | | | | | |
| Accounts payable and accrued expenses | | | | | | | X | | | | X | | | | | | | | | |
| Provisions | | | | | | | | | | | | | | | X | | | | | |
| Long-term debt | | | | | | | X | | | | | | | | X | | | | | |
A sensitivity analysis for each type of market risk to which the Group is exposed at the end of the reporting period is provided, showing how profit or loss and equity would have been affected by changes in the relevant risk variable that were reasonably possible at that date. These ranges of parameters are estimated by management, which are based on the facts and circumstances available at the time estimates are made, and an assumption of stable socio-economic and geopolitical states. No unusual and exceptional events, for example, natural disasters or human-made crises and calamities, are taken into consideration when the sensitivity analysis is prepared. Actual occurrence could differ from these assumptions and such differences could be material.
Interest rate risk
Interest rate risk is the risk that the fair value or future cash flows of a financial instrument will fluctuate due to changes in market interest rates. Short-term financial assets and financial liabilities are generally not exposed to interest rate risk, because of their short-term nature. The Group’s long-term debt is not exposed to significant interest rate cash flow risk as the interest rates have been fixed for two-thirds of the Group’s long-term debt.
Sensitivity analysis:
At December 31, 2010, if benchmark interest rates (such as LIBOR or prime rates) at that date had been 100 basis points (1.00%) per annum lower with all other variables held constant, income from continuing operations for the year 2010 would have been $110 higher, arising mainly as a result of lower net interest expense. Conversely, if benchmark interest rates at that date had been 100 basis points (1.00%) per annum higher with all other variables held constant, income from continuing operations for the year 2010 would have been $109 lower, arising mainly as a result of higher net interest expense. There would have been no impact on the Group’s other comprehensive loss.
107
TERRA NOVA ROYALTY CORPORATION
(Formerly KHD HUMBOLDT WEDAG INTERNATIONAL LTD.)
NOTES TO CONSOLIDATED FINANCIAL STATEMENTS — (Continued)
Credit risk
Credit risk is the risk that one party to a financial instrument will fail to discharge an obligation and cause the other party to incur a financial loss. Financial instruments which potentially subject the Group to concentrations of credit risk consist of cash and cash equivalents, restricted cash, term deposits and derivative and credit exposures to customers, including outstanding receivables and committed transactions. The Group has deposited the cash and cash equivalents, restricted cash, term deposits and derivative financial instruments with reputable financial institutions with high credit ratings, from which management believes the risk of loss to be remote. The Group has receivables from various entities including customers, governmental agencies and affiliates. Management does not believe that any single customer or geographic region represents significant credit risk. Credit risk concentration with respect to trade receivables is limited due to the Group’s large and diversified customer base. Credit risk from trade accounts receivable is mitigated since the customers generally have high credit qualityand/or provide performance guarantees, advance payments, letters of credit, credit insurance and other credit enhancements. The performance guarantees, advance payments and letters of credit are generally issued by the bankers of the customers. The credit analysis is performed by the Group internally. The Group also uses non-recourse factoring and credit insurances to manage the credit risk.
The average contractual credit period for trade receivables is about60-90 days. However, due to the use of the non-recourse factoring facilities, the average life time of trade receivables are reduced to about 10 days.
The maximum credit risk exposure as at December 31, 2010 is as follows:
| | | | | |
Amounts recognized on the consolidated statement of financial position: | | | |
| |
| Cash and cash equivalents and restricted cash | | $ | 401,161 | |
| Derivative assets | | | 12 | |
| Loans and receivables | | | 27,978 | |
| | | | | |
| | | | 429,151 | |
| Amount of credit facility committed but not drawn (see Note 29) | | | 14,208 | |
| Guarantee (see Note 29) | | | 44,965 | |
| | | | | |
| Maximum credit risk exposure | | $ | 488,324 | |
| | | | | |
As at December 31, 2010, the Group had issued guarantees up to a maximum of $44,965 to its trading and financing partners in the normal course of its commodities activities. As of December 31, 2010, $24,812 has been used and outstanding and has not been recorded as liabilities in the consolidated statement of financial position. There has been no claim against the guarantees. In the past five years, no claim has been made against the guarantees issued by the Group. Typically, these guarantees are issued on behalf of the Group’s trading and financing partners and, in case of non-performance by a trading or financing partner and a claim is made against the Group, the Group can make the claim against the defaulting trading or financing partner to recover the loss.
Currency risk
Currency risk is the risk that the value of a financial instrument will fluctuate due to changes in foreign exchange rates. Currency risk does not arise from financial instruments that are non-monetary items or from financial instruments denominated in the functional currency. The Group operates internationally and is exposed to risks from changes in foreign currency rates, particularly Euros and the United States dollars. Currency risk arises principally from future trading transactions, and recognized assets and liabilities. In order to reduce the Group’s exposure to foreign currency risk on material contracts denominated in foreign currencies (other than the functional currencies of the subsidiaries), the Group may use foreign currency forward contracts and options to protect its financial positions. As at December 31, 2010 and 2009, the Group had derivative financial instruments (foreign currency forward contracts and options) with aggregate notional amounts of $236,015 and $nil, respectively, and a net unrealized fair value loss of $5,078 and $nil, respectively. As at December 31, 2010, the Group did not adopted hedge accounting.
108
TERRA NOVA ROYALTY CORPORATION
(Formerly KHD HUMBOLDT WEDAG INTERNATIONAL LTD.)
NOTES TO CONSOLIDATED FINANCIAL STATEMENTS — (Continued)
Sensitivity analysis:
At December 31, 2010, if the US dollar had weakened 10% against the local functional currencies with all other variables held constant, income from continuing operations for the year 2010 would have been $11,610 lower. Conversely, if the US dollar had strengthened 10% against the local functional currencies with all other variables held constant, income from continuing operations would have been $11,610 higher. The reason for such change is mainly due to certain US dollar-denominated financial assets (net of liabilities) held by entities whose functional currency is not the US dollar. There would have been no material impact on other comprehensive income in either case.
At December 31, 2010, if the Euro had weakened 10% against the local functional currencies with all other variables held constant, income from continuing operations for the year 2010 would have been $13,376 lower. Conversely, if the Euro had strengthened 10% against the local functional currencies with all other variables held constant, income from continuing operations would have been $16,093 higher. The reason for such change is primarily due to the foreign currency forward contracts and options outstanding at the year end. There would have been no impact on other comprehensive income in either case.
Other price risk
Other price risk is the risk that the value of a financial instrument will fluctuate as a result of changes in market prices, whether those changes are caused by factors specific to the individual instrument or its issuer or factors affecting all instruments traded in the market. The Group’s other price risk includes equity price risk whereby the Group’s investments in equities in other entities held for trading oravailable-for-sale securities are subject to market price fluctuation. The Group did not hold any asset-backed securities.
Sensitivity analysis:
At December 31, 2010, if the equity price in general had weakened 10% with all other variables held constant, income and comprehensive income from continuing operations for the year 2010 would have been $2,327 and $950, respectively, lower. Conversely, if the equity price in general had strengthened 10% with all other variables held constant, income and comprehensive income from continuing operations would have been $2,327 and $950, respectively, higher.
The Group buys and sells commodities future contracts on the London Metal Exchange. Management uses the future contracts to manage the price fluctuation for its own account or for customers. As at December 31, 2010, the Group had outstanding commodity derivative financial instruments with aggregate notional amounts of $8,803 and a net unrealized fair value loss of $731.
The Group executes contracts with third parties for the sale and physical delivery of commodities so as to intend to achieve a targeted price. Contracts for such are not typically financial instruments and therefore excluded from the fair value and sensitivity analysis below.
Sensitivity analysis:
At December 31, 2010, if the commodity price in the financial instrument contracts in general had weakened 10% with all other variables held constant, income from continuing operations for the year 2010 would have been $360 lower. Conversely, if the commodity price in the financial instrument contracts in general had strengthened 10% with all other variables held constant, income from continuing operations would have been $360 higher. There would have been no impact on other comprehensive income in either case.
Liquidity risk
Liquidity risk is the risk that an entity will encounter difficulty in raising funds to meet commitments associated with financial instruments. The Group’s approach to managing liquidity is to ensure, as far as possible, that it always has sufficient liquidity to meet its liabilities when they fall due, under normal and stress conditions, without incurring
109
TERRA NOVA ROYALTY CORPORATION
(Formerly KHD HUMBOLDT WEDAG INTERNATIONAL LTD.)
NOTES TO CONSOLIDATED FINANCIAL STATEMENTS — (Continued)
unacceptable losses. The Group is not subject to material liquidity risk because of its strong cash position. The Group also maintains adequate banking facilities, including the factoring arrangements. It is the Group’s policy to invest cash in highly liquid, diversified money market funds or bank deposits for a period of less than three months. The Group may also invest in cash deposits with an original maturity date of more than three months so as to earn a higher interest income.
The Group also maintains an acid test ratio greater than one, which indicates that the Group has strong short-term assets to cover its immediate liabilities without selling inventory.
Generally, trade payables are due within 90 days and other payables and accrued expenses are due within one year. All derivative financial liabilities are to be settled within one year. Please also refer to Note 21 for debt maturity schedule.
Cash flow risk
Cash flow risk is the risk that future cash flows associated with a monetary financial instrument will fluctuate in amount. Although the Group is subject to cash flow risk for its short-term bank borrowings, such risk does not impact adversely on the Group’s going concern as the Group has a strong cash position. The Group is not exposed to material cash flow risk as the Group does not have significant long-term floating interest rate financial assets and financial liabilities.
Concentration risk
Management determines the concentration risk threshold amount as any single financial asset (or liability) exceeding 10% of the aggregate financial assets (or liabilities) in the Group’s consolidated statement of financial position.
The Group regularly maintains cash balances in financial institutions in excess of insured limits. The Group has deposited the cash and cash equivalents, restricted cash and term deposits with reputable financial institutions with high credit rating, and management believes the risk of loss to be remote. As at December 31, 2010, the Group had cash and cash equivalents aggregating $291,584 with and an investment of $275 in a banking group in Austria. The Group also owed $54,688 in aggregate short-term banking borrowings and debt to the Austria banking group.
Additional disclosure
In addition to information disclosed elsewhere in these financial statements, the Group had significant items of income, expense, and gains and losses resulting from financial assets and financial liabilities which were included in the statement of operations in 2010 and 2009 as follows:
| | | | | | | | | |
| | | 2010 | | | 2009 | |
| |
| Interest income on financial assets not at fair value through profit and loss | | $ | 2,044 | | | $ | 309 | |
| Interest income on financial assets classified at fair value through profit and loss | | | 748 | | | | 126 | |
| | | | | | | | | |
| Total interest income | | $ | 2,792 | | | $ | 435 | |
| | | | | | | | | |
| Interest expense on financial liabilities not at fair value through profit and loss | | $ | (397 | ) | | $ | (473 | ) |
| Interest expense on financial liabilities classified at fair value through profit and loss | | | (577 | ) | | | (4 | ) |
| | | | | | | | | |
| Total interest expense | | $ | (974 | ) | | $ | (477 | ) |
| | | | | | | | | |
| Dividend income on financial assets at fair value through profit and loss | | $ | 467 | | | $ | 1 | |
| Dividend income on financial assets classified as available for sale* | | | 193 | | | | 280 | |
| Net gain (loss) on financial assets at fair value through profit and loss | | | (170 | ) | | | 324 | |
| — including change in fair value of the trading securities | | | 3,346 | | | | 324 | |
| Credit losses | | | 795 | | | | — | |
| | |
| * | | included in income from interest in resource property |
110
TERRA NOVA ROYALTY CORPORATION
(Formerly KHD HUMBOLDT WEDAG INTERNATIONAL LTD.)
NOTES TO CONSOLIDATED FINANCIAL STATEMENTS — (Continued)
| |
| Note 31. | Related Party Transactions |
In the normal course of operations, the Group enters into transactions with related parties which include affiliates which the Group has a significant equity interest (10% or more) in the affiliates or has the ability to influence the affiliates’ or the Group’s operating and financing policies through significant shareholding, representation on the board of directors, corporate charterand/or bylaws. The affiliates also include Terra Nova’s directors, President, Chief Executive Officer, Chief Financial Officer, Chief Operating Officer and their close family members. These related party transactions are measured at the exchange value, which represents the amount of consideration established and agreed to by the parties. In addition to transactions disclosed elsewhere in these financial statements, the Group had the following transactions with affiliates.
Continuing operations
| | | | | | | | | |
| | | 2010 | | | 2009 | |
| |
| Dividend income on common shares* | | $ | 193 | | | $ | 280 | |
| Royalty expense paid and payable* | | | (800 | ) | | | (614 | ) |
| Fee income | | | 3 | | | | — | |
| Purchases of goods | | | (1,856 | ) | | | — | |
| Fee expense for managing resource property | | | (1,575 | ) | | | (839 | ) |
| Fee expense for management services, including expense reimbursements | | | (333 | ) | | | (3,069 | ) |
| Interest income | | | 44 | | | | 309 | |
| Interest expense | | | — | | | | (447 | ) |
| | |
| * | | included in income from interest in resource property |
Discontinued Operations
| | | | | | | | | |
| | | 2010 | | 2009 |
| |
| Fee income | | $ | — | | | $ | 494 | |
| Fee expense for management services, including expense reimbursements | | | (127 | ) | | | (990 | ) |
Transactions with related parties are made in arm’s length transactions at normal market prices and on normal commercial terms.
In addition to transactions in the above two tables, in 2010, the Group entered into an agreement with its former wholly-owned subsidiary whereby the Group agreed to offset its payables to the former subsidiary against its note receivable (CAD$1,750) from the former subsidiary plus accrued interest thereon (see Note 13). Furthermore, the Group obtained bridge financing of $8,000 from the affiliate for three days. The Company did not pay any interest and fees to this affiliate in relation to such bridge financing.
Key management personnel
The remuneration of key management personnel of the Group was as follows:
| | | | | | | | | |
Year Ended December 31 | | 2010 | | | 2009 | |
| |
| Short-term employee benefits | | $ | 1,277 | | | $ | 2,247 | |
| Post-employment benefits | | | — | | | | 44 | |
| Other long term benefits | | | — | | | | — | |
| Termination benefits | | | 784 | | | | — | |
| Share-based payments | | | — | | | | — | |
| Directors’ fees | | | 203 | | | | 451 | |
111
TERRA NOVA ROYALTY CORPORATION
(Formerly KHD HUMBOLDT WEDAG INTERNATIONAL LTD.)
NOTES TO CONSOLIDATED FINANCIAL STATEMENTS — (Continued)
Key management personnel comprises the members of the Board of Directors, President, Chief Executive Officer, Chief Financial Officer and Chief Operating Officer. The short-term employee benefits include management fee expenses paid to a corporation which was associated with a former Chief Executive Officer.
The termination benefits in 2010 represented amounts paid to the former Chief Operating Officer.
In addition, in 2010, the Group paid $1,026 (comprising $998 in cash and $28 (net book value at the time of settlement) in a used vehicle) in aggregate to its former chief executive officer as a termination benefit which was not included in the above remuneration table. The termination occurred in 2009 and the termination benefit was not recorded in 2009 until settled in 2010. It was included in the discontinued operations.
| |
| Note 32. | Consolidated Statements of Cash Flows — Supplemental Disclosure |
Income and expenses paid on a cash basis during 2010 and 2009 are as follows:
| | | | | | | | | |
| | | 2010 | | | 2009 | |
| |
| Interest income | | $ | 2,277 | | | $ | 126 | |
| Dividend income | | | 466 | | | | 281 | |
| Interest expense | | | (463 | ) | | | (478 | ) |
| Income taxes | | | (9,647 | ) | | | (3,039 | ) |
The Group had the following nonmonetary transactions.
Nonmonetary transactions in 2010: (1) the offsetting of a promissory note of CDN$1,750 plus accrued interest thereon against payable due to the affiliate (see Note 13); (2) the Company acquired all of the issued and outstanding common shares of Mass by issuing its own shares (see Note 3); (3) the Company acquired shares in a former special purpose entity by issuing 41,400 common shares of Terra Nova, valued at $303; and (4) the Group exchanged a publicly-traded security with a carrying value of $152 for another publicly-traded security with a fair value of $217, resulting in a gain of $65.
Nonmonetary transactions in 2009: (1) the settlement of the investment in the preferred shares of former subsidiaries and accrued dividend thereon for promissory notes; and (2) the conversion of a promissory note of CDN$11,346 into common shares of the former subsidiary (see Note 13).
| |
| Note 33. | Terra Nova and its Significant Subsidiaries |
Terra Nova has its principal executive office at Suite 1620 — 400 Burrard Street, Vancouver, British Columbia, Canada.
112
TERRA NOVA ROYALTY CORPORATION
(Formerly KHD HUMBOLDT WEDAG INTERNATIONAL LTD.)
NOTES TO CONSOLIDATED FINANCIAL STATEMENTS — (Continued)
The following table shows the direct and indirect significant subsidiaries as at December 31, 2010. The table excludes subsidiaries which only hold intercompany assets and liabilities and do not have an active business.
| | | | | | | |
| | | | | Proportion of
|
Subsidiaries | | Country of Incorporation | | Ownership Interest |
| |
| TTT Acquisition Corp. | | Barbados | | | 100 | % |
| MFC Commodities GmbH | | Austria | | | 100 | % |
| MFC Trade & Financial Service GmbH | | Austria | | | 100 | % |
| IC Management Service GmbH | | Austria | | | 100 | % |
| Global Bulk Transport GmbH | | Austria | | | 100 | % |
| International Trade Service GmbH | | Austria | | | 100 | % |
| Magnum Minerals Private Limited | | India | | | 100 | % |
| AFM Aluminiumfolie Merseberg GmbH | | Germany | | | 55 | % |
| MAW Mansfelder Alumiumwerk GmbH | | Germany | | | 55 | % |
| MFC(A) Ltd. | | Marshall Islands | | | 100 | % |
| MFC(D) Ltd. | | Marshall Islands | | | 100 | % |
| Brock Metals s.r.o. | | Slovakia | | | 100 | % |
| MFC Corporate Services AG | | Switzerland | | | 100 | % |
| Mednet (Shanghai) Medical Technical Developing Co., Ltd. | | China | | | 90 | % |
| Chongqing Lasernet Guangji Eye Hospital (a limited company) | | China | | | 52 | % |
| Hangzhou Zhe-er Optical Co. Ltd. | | China | | | 46 | % |
| MFC Metal Trading GmbH | | Austria | | | 100 | % |
| MEG International Services Ltd. | | Canada | | | 100 | % |
Explanatory notes:
| | |
| (a) | | The proportion of ownership interest is the same as the proportion of voting power held; |
| |
| (b) | | Subsidiaries whose results did not, in the opinion of the Directors, materially affect the results or net assets of the Group are not shown. |
| |
| Note 34. | Subsequent Events |
Stock Options
In January 2011, options to purchase 2,635,000 common shares of Terra Nova were granted to directors and certain employees of the Group. The exercise price per share is $7.81 and the options vested immediately upon granting. The Group used the Black-Scholes-Merton formula to compute the share-based compensation for the stock options and determined that the fair value of the options was $2.767 per unit.
Dividend
On January 10, 2011, Terra Nova announced it has declared an annual cash dividend and established an annual dividend policy as follows:
| | |
| | • | The annual dividend will be based on the annual dividend yield of the New York Stock Exchange Composite Index (the “NYSE Composite Index”) for the preceding year plus 25 basis points. |
| |
| | • | For 2011, an aggregate cash dividend will be $0.20 per common share, representing a dividend yield of 2.58 percent. |
| |
| | • | The 2011 annual cash dividend will be paid in quarterly installments. |
113
TERRA NOVA ROYALTY CORPORATION
(Formerly KHD HUMBOLDT WEDAG INTERNATIONAL LTD.)
NOTES TO CONSOLIDATED FINANCIAL STATEMENTS — (Continued)
| | |
| | • | The first payment of $0.05 per common share would be paid on January 31, 2011 to shareholders of record on January 20, 2011. |
| |
| | • | The remaining quarterly dividend payments will be made in each of March, June and September, 2011. |
| |
| | • | In the future, Terra Nova will announce and declare the cash dividend during the first full week of each year. |
| |
| Note 35. | Approval of Consolidated Financial Statements |
These consolidated financial statements were approved by the Board of Directors and authorized for issue on March 30, 2011.
| |
| Note 36. | Reconciliation of Prior Periods’ Consolidated Financial Statements |
Terra Nova’s consolidated financial statements for the year ended December 31, 2010 are the first annual financial statements that comply with IFRS, including the application of IFRS 1. Pursuant to IFRS 1, Terra Nova has made an explicit and unreserved statement in these financial statements of compliance with IFRS.
IFRS 1 also requires that comparative financial information be provided. As a result, the first date at which the Company has applied IFRS is January 1, 2009 (the “Transition Date”). IFRS requires first-time adopters to retrospectively apply all effective IFRS standards as of the reporting date, which for the Company is December 31, 2010. However, it also provides for certain optional exemptions and certain mandatory exceptions for first time IFRS adopters.
Initial Elections upon Adoption
Set forth below are the IFRS 1 applicable exemptions and exceptions applied in the conversion from Canadian GAAP to IFRS.
IFRS Exemption Options
(i) Business combinations — IFRS 1 provides the option to apply IFRS 3 (Revised),Business Combinations,retrospectively or prospectively from the Transition Date. The Company elected not to retrospectively apply IFRS 3 (Revised) to business combinations that occurred prior to its Transition Date and such business combinations have not been restated.
(ii) Cumulative translation differences — IFRS 1 allows first time adopters to use the exemption to reset the cumulative transaction differences for all foreign options to zero at the Transition Date. The Company elected to reset all cumulative translation adjustments to zero in opening retained earnings at its Transition Date.
(iii) Deemed cost — A first time adopter may elect to measure an item of property, plant and equipment at the Transition Date at its fair value and use that fair value as its deemed cost at that date. The Company elected to measure its interest in the Wabush mine resource property at its fair value and use that fair value as its deemed cost at January 1, 2009.
IFRS Mandatory Exceptions
Set forth below is the applicable IFRS 1 exception applied in the conversion from Canadian GAAP to IFRS.
Estimates — Hindsight is not used to create or revise estimates. The estimates previously made by the Company under Canadian GAAP were not revised for application of IFRS except where necessary to reflect any difference in accounting policies.
Reconciliations of Canadian GAAP to IFRS
IFRS 1 requires an entity to reconcile equity, comprehensive income and cash flows for prior periods. The Company’s first time adoption of IFRS did not have an impact on the total operating, investing or financing cash flows.
114
TERRA NOVA ROYALTY CORPORATION
(Formerly KHD HUMBOLDT WEDAG INTERNATIONAL LTD.)
NOTES TO CONSOLIDATED FINANCIAL STATEMENTS — (Continued)
Reconciliations of equity at the Transition Date (i.e. January 1, 2009) and at the end of the latest period presented in the Company’s most recent annual financial statements in accordance with Canadian GAAP (i.e. December 31, 2009) are as follows:
| | | | | | | | | |
| | | January 1, 2009 | | | December 31, 2009 | |
| |
| Equity in accordance with Canadian GAAP | | | | | | | | |
| Shareholders’ equity | | $ | 261,914 | | | $ | 319,788 | |
| Minority interests | | | 3,709 | | | | 5,403 | |
| | | | | | | | | |
| | | | 265,623 | | | | 325,191 | |
| Revaluation of interest in resource property, gross | | | 175,139 | | | | 168,404 | |
| Deferred tax liability, revaluation of interest in resource property | | | (51,133 | ) | | | (48,664 | ) |
| Reversal of impairment | | | — | | | | 227 | |
| Translation loss on interest in resource property | | | — | | | | (4,066 | ) |
| | | | | | | | | |
| Equity in accordance with IFRS | | $ | 389,629 | | | $ | 441,092 | |
| | | | | | | | | |
Reconciliation of total comprehensive income for the latest period in the Company’s most recent annual financial statements is as follows:
| | | | | |
For the year ended December 31, 2009 | | | |
| |
| Total comprehensive income in accordance with Canadian GAAP | | $ | 60,630 | |
| Additional amortization on interest in resource property, net of income taxes | | | (4,266 | ) |
| Comprehensive income attributable to non-controlling interest | | | 2,113 | |
| Reversal of impairment | | | 227 | |
| Translation loss on interest in resource property | | | (4,066 | ) |
| | | | | |
| Total comprehensive income in accordance with IFRS | | $ | 54,638 | |
| | | | | |
During the year ended December 31, 2009, the Company recognized an impairment charge of $227 in accordance with Canadian GAAP, which was reversed in accordance with IFRS. The impairment charge was included in the restructuring costs in the consolidated statement of operations.
Change in Accounting Policies
(i) Amortization method for interest in resource property
Pursuant to IFRS 1, the Company elected to measure its interest in the Wabush mine resource property at its fair value and use that fair value as its deemed cost at January 1, 2009. In connection with the use of the fair value measurement for its interest in the resource property, the Company changed its amortization to the unit of production method from the straight-line method, effective from January 1, 2009. Management is of the opinion that it is appropriate to change to theunit-of-production method as the shipment of iron pellets involves seasonal and cyclical fluctuations. Such change resulted in an increase in gross depletion charge by $6,735 in the fiscal year 2009.
(ii) Business combinations
As stated in the section entitled “IFRS Exemption Options”, the Company applied the exemption in IFRS 1 for business combinations. Consequently, business combinations concluded prior to January 1, 2009 have not been restated. The Company did not have any business combinations in 2009 and, accordingly, the adoption of IFRS 3 (Revised) did not have an impact on the Company’s 2009 consolidated financial statements.
115
TERRA NOVA ROYALTY CORPORATION
(Formerly KHD HUMBOLDT WEDAG INTERNATIONAL LTD.)
NOTES TO CONSOLIDATED FINANCIAL STATEMENTS — (Continued)
(iii) Income taxes
Canadian GAAP — In acquisitions that are not business combinations, an excess of the value of income tax assets, which management believes is more likely than not to be realized, over the consideration paid for such assets is recorded as a deferred credit and recognized in the statement of operations in the same period that the related tax asset is realized.
IFRS — There is no such requirement under IFRS.
(iv) Foreign currency translation adjustment
As noted in the section entitled “IFRS Exemption Options”, the Company has applied the one-time exemption to set the foreign currency cumulative translation adjustment (“CTA”) to zero as of January 1, 2009. The CTA balance as of January 1, 2009 of $48,577 was recognized as an adjustment to retained earnings. The application of the exemption had no impact on net equity.
(v) Reversal of impairments
Canadian GAAP — Reversal of impairment losses in not permitted.
IFRS — Reversal of impairment losses is required for assets other than goodwill if certain criteria are met. As a result, the Company reversed an impairment recognized under IFRS.
Presentation Reclassifications
(i) Deferred taxes
Canadian GAAP — Deferred taxes are split between current and non-current components on the basis of either (1) the underlying asset or liability or (2) the expected reversal of items not related to an asset or liability.
IFRS — All deferred tax assets and liabilities are classified as non-current.
(ii) Non-controlling interests
Canadian GAAP — Minority interests in the equity of consolidated subsidiaries are classified as a separate component between liabilities and shareholders’ equity in the consolidated balance sheet and are excluded from the determination of consolidated net income or loss. As part of the adoption of IFRS, the term “minority interests” has been replaced with “non-controlling interests” in accordance with IAS 1.
IFRS — Non-controlling interests are classified as a component of equity in the consolidated statement of financial position and are included in the determination of consolidated net income or loss.
Amended Terra Nova’s Consolidated Financial Statements
The following are reconciliations of the financial statements previously presented under Canadian GAAP to the amended financial statements prepared under IFRS.
116
TERRA NOVA ROYALTY CORPORATION
(Formerly KHD HUMBOLDT WEDAG INTERNATIONAL LTD.)
NOTES TO CONSOLIDATED FINANCIAL STATEMENTS — (Continued)
Reconciliation of Consolidated Statement of Operations for the Year Ended December 31, 2009
| | | | | | | | | | | | | | | | | | | | | | | |
| | | Canadian
| | | | | | | | | | | | | | | |
| | | GAAP
| | | Discontinued
| | | IFRS
| | | IFRS
| | | IFRS
| | | |
Canadian GAAP accounts | | balance | | | Operations | | | adjustments | | | reclassifications | | | balance | | | IFRS accounts |
| |
| Revenues | | $ | 576,408 | | | $ | (576,408 | ) | | $ | — | | | $ | — | | | | | | | |
| Cost of revenues | | | (457,847 | ) | | | 457,847 | | | | — | | | | — | | | | | | | |
| Reduction in loss on terminated customer contracts | | | 17,829 | | | | (17,829 | ) | | | — | | | | — | | | | | | | |
| | | | | | | | | | | | | | | | | | | | | | | |
| Gross profit | | | 136,390 | | | | (136,390 | ) | | | — | | | | — | | | | | | | |
| Income from interest in resource property | | | 13,530 | | | | — | | | | — | | | | — | | | $ | 13,530 | | | Income from interest in resource property |
| | | | | | | | — | | | | (6,735 | ) | | | (1,777 | ) | | | (8,512 | ) | | Amortization, resource property |
| Selling, general and administrative expense | | | (74,796 | ) | | | 56,545 | | | | — | | | | 1,777 | | | | (16,474 | ) | | Selling, general and administrative expense |
| Stock-based compensation — general and administrative | | | 391 | | | | 2,322 | | | | — | | | | — | | | | 2,713 | | | Share-based compensation — general and administrative |
| Restructuring costs | | | (9,220 | ) | | | 9,220 | | | | — | | | | — | | | | | | | |
| Gain on sale of workshop and related assets | | | 5,254 | | | | (5,254 | ) | | | — | | | | — | | | | | | | |
| | | | | | | | | | | | | | | | | | | | | | | |
| Operating income | | | 71,549 | | | | (73,557 | ) | | | (6,735 | ) | | | — | | | | (8,743 | ) | | Operating loss |
| | | | | | | | | | | | | | | | | | | | | | | |
| Interest income | | | 7,043 | | | | (6,608 | ) | | | — | | | | — | | | | 435 | | | Interest income |
| Interest expense | | | (2,793 | ) | | | 2,316 | | | | — | | | | — | | | | (477 | ) | | Interest expense |
| Foreign currency transaction losses, net | | | (2,006 | ) | | | (1,202 | ) | | | — | | | | — | | | | (3,208 | ) | | Foreign currency transaction losses, net |
| Share of loss of equity method investee | | | (254 | ) | | | 254 | | | | — | | | | — | | | | | | | |
| Loss on settlement of investment in preferred shares of former subsidiaries | | | (9,538 | ) | | | — | | | | — | | | | — | | | | (9,538 | ) | | Loss on settlement of investment in preferred shares of former subsidiaries |
| Other income, net | | | 3,825 | | | | (3,085 | ) | | | — | | | | — | | | | 740 | | | Other income, net |
| | | | | | | | | | | | | | | | | | | | | | | |
| Income before income taxes and minority interests from continuing operations | | | 67,826 | | | | (81,882 | ) | | | (6,735 | ) | | | — | | | | (20,791 | ) | | Loss before income taxes from continuing operations |
| Provision for income taxes: | | | | | | | | | | | | | | | | | | | | | | Income tax recovery: |
| Income taxes | | | (23,026 | ) | | | 28,067 | | | | 2,469 | | | | — | | | | 7,510 | | | Income taxes recovery |
| Resource property revenue taxes | | | (3,039 | ) | | | — | | | | — | | | | — | | | | (3,039 | ) | | Resource property revenue taxes |
| | | | | | | | | | | | | | | | | | | | | | | |
| | | | (26,065 | ) | | | 28,067 | | | | 2,469 | | | | — | | | | 4,471 | | | |
| | | | | | | | | | | | | | | | | | | | | | | |
| Income before minority interests from continuing operations | | | 41,761 | | | | (53,815 | ) | | | (4,266 | ) | | | — | | | | (16,320 | ) | | Loss from continuing operations |
| | | | | | | | 53,815 | | | | 227 | | | | — | | | | 54,042 | | | Income from discontinued operations |
| | | | | | | | | | | | | | | | | | | | | | | |
| | | | | | | | — | | | | (4,039 | ) | | | — | | | | 37,722 | | | Net income |
| Minority interests | | | (1,050 | ) | | | — | | | | — | | | | — | | | | (1,050 | ) | | Less: net income attributable to non-controlling interests |
| | | | | | | | | | | | | | | | | | | | | | | |
| Net income | | $ | 40,711 | | | $ | — | | | $ | (4,039 | ) | | $ | — | | | $ | 36,672 | | | Net income attributable to equity shareholders |
| | | | | | | | | | | | | | | | | | | | | | | |
| Basic earnings per share | | $ | 1.34 | | | | | | | | | | | | | | | $ | 1.21 | | | Basic earnings per share |
| | | | | | | | | | | | | | | | | | | | | | | |
| Diluted earnings per share | | $ | 1.34 | | | | | | | | | | | | | | | $ | 1.21 | | | Diluted earnings per share |
| | | | | | | | | | | | | | | | | | | | | | | |
| Weighted average number of common shares outstanding | | | | | | | | | | | | | | | | | | | | | | Weighted average number of common shares outstanding |
| Basic | | | 30,354,207 | | | | | | | | | | | | | | | | 30,354,207 | | | Basic |
| | | | | | | | | | | | | | | | | | | | | | | |
| Diluted | | | 30,354,207 | | | | | | | | | | | | | | | | 30,354,207 | | | Diluted |
| | | | | | | | | | | | | | | | | | | | | | | |
117
TERRA NOVA ROYALTY CORPORATION
(Formerly KHD HUMBOLDT WEDAG INTERNATIONAL LTD.)
NOTES TO CONSOLIDATED FINANCIAL STATEMENTS — (Continued)
Reformat of Consolidated Statement of Operations for the Year Ended December 31, 2009
The following table reconciles the consolidated statement of operations for the year ended December 31, 2009 under IFRS to the current year’s presentation.
| | | | | | | | | | | | | | | | | | | |
| | | IFRS
| | | Reclassification adjustments | | | Final
| | | |
IFRS accounts | | balance | | | Revenues | | | Expenses | | | balance | | | IFRS accounts |
| |
| | | $ | — | | | $ | 14,718 | | | $ | — | | | $ | 14,718 | | | Revenues |
| | | | | | | | | | | | | | | | | | | Costs and expenses |
| Income from interest in resource property | | | 13,530 | | | | (13,530 | ) | | | — | | | | | | | |
| Amortization, resource property | | | (8,512 | ) | | | — | | | | 8,512 | | | | | | | |
| | | | — | | | | — | | | | (8,525 | ) | | | (8,525 | ) | | Costs of sales |
| Selling, general and administrative expense | | | (16,474 | ) | | | — | | | | — | | | | (16,474 | ) | | Selling, general and administrative expense |
| Share-based compensation recovery — selling, general and administrative expense | | | 2,713 | | | | — | | | | — | | | | 2,713 | | | Share-based compensation recovery — selling, general and administrative expense |
| | | | — | | | | — | | | | (477 | ) | | | (477 | ) | | Interest |
| | | | | | | | | | | | | | | | | | | |
| Operating loss | | | (8,743 | ) | | | 1,188 | | | | (490 | ) | | | | | | |
| | | | | | | | | | | | | | | | | | | |
| | | | | | | | | | | | | | | | (22,763 | ) | | |
| | | | | | | | | | | | | | | | | | | |
| | | | | | | | | | | | | | | | (8,045 | ) | | |
| Interest income | | | 435 | | | | (435 | ) | | | — | | | | | | | |
| Interest expense | | | (477 | ) | | | — | | | | 477 | | | | | | | |
| Foreign currency transaction losses, net | | | (3,208 | ) | | | — | | | | — | | | | (3,208 | ) | | Currency transaction loss, net |
| Loss on settlement of investment in preferred shares of former subsidiaries | | | (9,538 | ) | | | — | | | | — | | | | (9,538 | ) | | Loss on settlement of investment in preferred shares of former subsidiaries |
| Other income, net | | | 740 | | | | (753 | ) | | | 13 | | | | — | | | |
| | | | | | | | | | | | | | | | | | | |
| Loss before income taxes from continuing operations | | | (20,791 | ) | | | — | | | | — | | | | (20,791 | ) | | Loss before income taxes from continuing operations |
| Income tax recovery: | | | | | | | | | | | | | | | | | | Income tax recovery: |
| Income taxes | | | 7,510 | | | | — | | | | — | | | | 7,510 | | | Income taxes |
| Resource property revenue taxes | | | (3,039 | ) | | | — | | | | — | | | | (3,039 | ) | | Resource property revenue taxes |
| | | | | | | | | | | | | | | | | | | |
| | | | 4,471 | | | | — | | | | — | | | | 4,471 | | | |
| | | | | | | | | | | | | | | | | | | |
| Loss from continuing operations | | | (16,320 | ) | | | — | | | | — | | | | (16,320 | ) | | Loss from continuing operations |
| Income from discontinued operations | | | 54,042 | | | | — | | | | — | | | | 54,042 | | | Income from discontinued operations |
| | | | | | | | | | | | | | | | | | | |
| Net income | | | 37,722 | | | | — | | | | — | | | | 37,722 | | | Net income |
| Less: net income attributable to non-controlling interests | | | (1,050 | ) | | | — | | | | — | | | | (1,050 | ) | | Less: net income attributable to non — controlling interests |
| | | | | | | | | | | | | | | | | | | |
| Net income attributable to equity shareholders | | $ | 36,672 | | | $ | — | | | $ | — | | | $ | 36,672 | | | Net income attributable to equity shareholders |
| | | | | | | | | | | | | | | | | | | |
118
TERRA NOVA ROYALTY CORPORATION
(Formerly KHD HUMBOLDT WEDAG INTERNATIONAL LTD.)
NOTES TO CONSOLIDATED FINANCIAL STATEMENTS — (Continued)
Reconciliation of Consolidated Statement of Comprehensive Income for the Year Ended December 31, 2009
| | | | | | | | | | | | | | | | | | | |
| | | Canadian
| | | | | | | | | | | | |
| | | GAAP
| | | IFRS
| | | IFRS
| | | IFRS
| | | |
Canadian GAAP accounts | | balance | | | adjustments | | | reclassifications | | | balance | | | IFRS accounts |
| |
| Net income for the period | | $ | 40,711 | | | $ | (4,039 | ) | | $ | 1,050 | | | $ | 37,722 | | | Net income for the period |
Other comprehensive income, net of tax
Unrealized gains and losses on translating financial statements of self-sustaining foreign operations | | | 19,919 | | | | (4,066 | ) | | | 1,063 | | | | 16,916 | | | Other comprehensive income, net of tax
Unrealized gains and losses on self- sustaining foreign operations |
| | | | | | | | | | | | | | | | | | | |
| Other comprehensive income | | | 19,919 | | | | (4,066 | ) | | | 1,063 | | | | 16,916 | | | Other comprehensive income |
| | | | | | | | | | | | | | | | | | | |
| Comprehensive income for the period | | $ | 60,630 | | | $ | (8,105 | ) | | $ | 2,113 | | | $ | 54,638 | | | Comprehensive income for the period |
| | | | | | | | | | | | | | | | | | | |
| | | | | | | | | | | | | | | | | | | Attributable to: |
| Comprehensive income for the period | | $ | 60,630 | | | $ | (8,105 | ) | | $ | — | | | $ | 52,525 | | | Shareholders of common shares of
Terra Nova Royalty Corporation |
| | | | | | | | | | | | 2,113 | | | | 2,113 | | | Non-controlling interests |
| | | | | | | | | | | | | | | | | | | |
| | | $ | 60,630 | | | $ | (8,105 | ) | | $ | 2,113 | | | $ | 54,638 | | | |
| | | | | | | | | | | | | | | | | | | |
Reconciliation of Consolidated Statement of Financial Position as of December 31, 2009
| | | | | | | | | | | | | | | | | | | | | | | |
| | | Canadian
| | | | | | | | | | | | | | | |
| | | GAAP
| | | Discontinued
| | | IFRS
| | | IFRS
| | | IFRS
| | | |
Canadian GAAP accounts | | balance | | | operations | | | adjustments | | | reclassifications | | | balance | | | IFRS accounts |
| |
ASSETS | | | | | | | | | | | | | | | | | | | | | | ASSETS |
| Current Assets | | | | | | | | | | | | | | | | | | | | | | Current Assets |
| Cash and cash equivalents | | $ | 420,551 | | | $ | (382,505 | ) | | $ | — | | | $ | — | | | $ | 38,046 | | | Cash and cash equivalents |
| Short-term deposits | | | 6,916 | | | | (6,916 | ) | | | — | | | | — | | | | | | | |
| Securities | | | 16,432 | | | | (5,220 | ) | | | — | | | | — | | | | 11,212 | | | Securities |
| Restricted cash | | | 24,979 | | | | (24,979 | ) | | | — | | | | — | | | | | | | |
| Accounts receivable, trade | | | 96,982 | | | | (96,982 | ) | | | — | | | | — | | | | | | | |
| Other receivables | | | 36,179 | | | | (30,513 | ) | | | — | | | | — | | | | 5,666 | | | Other receivables |
| Inventories | | | 80,815 | | | | (80,815 | ) | | | — | | | | — | | | | | | | |
| Contract deposits, prepaid and other | | | 53,893 | | | | (53,119 | ) | | | — | | | | — | | | | 774 | | | Contract deposits, prepaid and other |
| Future income tax assets | | | 1,748 | | | | — | | | | (1,748 | ) | | | — | | | | | | | |
| | | | | | | | 681,049 | | | | — | | | | — | | | | 681,049 | | | Current assets of discontinued operations |
| | | | | | | | | | | | | | | | | | | | | | | |
| Total current assets | | | 738,495 | | | | — | | | | (1,748 | ) | | | — | | | | 736,747 | | | Total current assets |
| Non-current Assets | | | | | | | | | | | | | | | | | | | | | | Non-current Assets |
| Note receivable | | | 1,672 | | | | — | | | | — | | | | — | | | | 1,672 | | | Note receivable |
| Accounts receivable, trade | | | 4,660 | | | | (4,660 | ) | | | — | | | | — | | | | | | | |
| Property, plant and equipment | | | 2,257 | | | | (2,105 | ) | | | — | | | | — | | | | 152 | | | Property, plant and equipment |
| Interest in resource property | | | 27,150 | | | | — | | | | 164,338 | | | | — | | | | 191,488 | | | Interest in resource property |
| Equity method investments | | | 73 | | | | (73 | ) | | | — | | | | — | | | | | | | |
| Future income tax assets | | | 13,405 | | | | (1,290 | ) | | | — | | | | — | | | | 12,115 | | | Deferred tax assets |
| Other non-current assets | | | 1,191 | | | | (1,191 | ) | | | — | | | | — | | | | | | | |
| | | | | | | | 9,319 | | | | 227 | | | | — | | | | 9,546 | | | Non-current assets of discontinued operations |
| | | | | | | | | | | | | | | | | | | | | | | |
| Total non-current assets | | | 50,408 | | | | — | | | | 164,565 | | | | — | | | | 214,973 | | | Total non-current assets |
| | | | | | | | | | | | | | | | | | | | | | | |
| | | $ | 788,903 | | | $ | — | | | $ | 162,817 | | | $ | — | | | $ | 951,720 | | | |
| | | | | | | | | | | | | | | | | | | | | | | |
119
TERRA NOVA ROYALTY CORPORATION
(Formerly KHD HUMBOLDT WEDAG INTERNATIONAL LTD.)
NOTES TO CONSOLIDATED FINANCIAL STATEMENTS — (Continued)
| | | | | | | | | | | | | | | | | | | | | | | |
| | | Canadian
| | | | | | | | | | | | | | | |
| | | GAAP
| | | Discontinued
| | | IFRS
| | | IFRS
| | | IFRS
| | | |
Canadian GAAP accounts | | balance | | | operations | | | adjustments | | | reclassifications | | | balance | | | IFRS accounts |
| |
LIABILITIES AND SHAREHOLDERS’ EQUITY | | | | | | | | | | | | | | | | | | | | | | LIABILITIES AND EQUITY |
| Current Liabilities | | | | | | | | | | | | | | | | | | | | | | Current Liabilities |
| Accounts payable and accrued expenses | | $ | 191,746 | | | $ | (185,724 | ) | | $ | — | | | $ | — | | | $ | 6,022 | | | Accounts payable and accrued expenses |
| Progress billings above costs and estimated earnings on uncompleted contracts | | | 77,841 | | | | (77,841 | ) | | | — | | | | — | | | | | | | |
| Advance payments received from customers | | | 26,927 | | | | (26,927 | ) | | | — | | | | — | | | | | | | |
| Income tax liabilities | | | 18,092 | | | | (17,814 | ) | | | — | | | | — | | | | 278 | | | Income tax liabilities |
| Deferred credit, future income tax assets | | | 1,748 | | | | — | | | | (1,748 | ) | | | — | | | | | | | |
| Accrued pension liabilities, current portion | | | 2,070 | | | | (2,070 | ) | | | — | | | | — | | | | | | | |
| Provision for warranty costs, current portion | | | 28,282 | | | | (28,282 | ) | | | — | | | | — | | | | | | | |
| Provision for supplier commitments on terminated customer contracts | | | 12,943 | | | | (12,943 | ) | | | — | | | | — | | | | | | | |
| Provision for restructuring costs | | | 8,025 | | | | (8,025 | ) | | | — | | | | — | | | | | | | |
| | | | | | | | 359,626 | | | | — | | | | — | | | | 359,626 | | | Current liabilities relating to discontinued operations |
| | | | | | | | | | | | | | | | | | | | | | | |
| Total current liabilities | | | 367,674 | | | | — | | | | (1,748 | ) | | | — | | | | 365,926 | | | Total current liabilities |
| Long-term Liabilities | | | | | | | | | | | | | | | | | | | | | | Long-term Liabilities |
| Long-term debt, less current portion | | | 11,649 | | | | (11,649 | ) | | | — | | | | — | | | | | | | |
| Accrued pension liabilities, less current portion | | | 28,861 | | | | (28,861 | ) | | | — | | | | — | | | | | | | |
| Provision for warranty costs, less current portion | | | 25,711 | | | | (25,711 | ) | | | — | | | | — | | | | | | | |
| Future income tax liability | | | 14,210 | | | | (14,210 | ) | | | 48,664 | | | | — | | | | 48,664 | | | Deferred tax liability |
| Other long-term liabilities | | | 15,607 | | | | (15,607 | ) | | | — | | | | — | | | | | | | |
| | | | | | | | 96,038 | | | | — | | | | — | | | | 96,038 | | | Long-term liabilities relating to discontinued operations |
| | | | | | | | | | | | | | | | | | | | | | | |
| Total long-term liabilities | | | 96,038 | | | | — | | | | 48,664 | | | | — | | | | 144,702 | | | Total long-term liabilities |
| | | | | | | | | | | | | | | | | | | | | | | |
| Total liabilities | | | 463,712 | | | | | | | | 46,916 | | | | — | | | | 510,628 | | | Total liabilities |
| Minority interests | | | 5,403 | | | | — | | | | — | | | | (5,403 | ) | | | | | | |
| | | | | | | | | | | | | | | | | | | | | | | Equity |
| Shareholders’ Equity | | | | | | | | | | | | | | | | | | | | | | Shareholders’ equity |
| Common stock | | | 141,604 | | | | — | | | | — | | | | — | | | | 141,604 | | | Common stock |
| Treasury stock | | | (83,334 | ) | | | — | | | | — | | | | — | | | | (83,334 | ) | | Treasury stock |
| Contributed surplus | | | 7,232 | | | | — | | | | — | | | | — | | | | 7,232 | | | Contributed surplus |
| Retained earnings | | | 185,790 | | | | — | | | | 168,544 | | | | — | | | | 354,334 | | | Retained earnings |
| Accumulated other comprehensive income | | | 68,496 | | | | — | | | | (52,643 | ) | | | — | | | | 15,853 | | | Accumulated other comprehensive income |
| | | | | | | | | | | | | | | | | | | | | | | |
| Total shareholders’ equity | | | 319,788 | | | | — | | | | 115,901 | | | | — | | | | 435,689 | | | |
| | | | | | | | — | | | | — | | | | 5,403 | | | | 5,403 | | | Non-controlling interests |
| | | | | | | | | | | | | | | | | | | | | | | |
| | | | | | | | — | | | | 115,901 | | | | 5,403 | | | | 441,092 | | | Total equity |
| | | | | | | | | | | | | | | | | | | | | | | |
| | | $ | 788,903 | | | $ | — | | | $ | 162,817 | | | $ | — | | | $ | 951,720 | | | |
| | | | | | | | | | | | | | | | | | | | | | | |
120
TERRA NOVA ROYALTY CORPORATION
(Formerly KHD HUMBOLDT WEDAG INTERNATIONAL LTD.)
NOTES TO CONSOLIDATED FINANCIAL STATEMENTS — (Continued)
Reconciliation of Consolidated Statement of Financial Position as of January 1, 2009
| | | | | | | | | | | | | | | | | | | | | | | |
| | | Canadian
| | | | | | | | | | | | | | | |
| | | GAAP
| | | | | | | | | | | | IFRS
| | | |
| | | balance
| | | Discontinued
| | | IFRS
| | | IFRS
| | | balance
| | | |
Canadian GAAP accounts | | Dec 31, 2008 | | | operations | | | adjustments | | | reclassifications | | | Jan 1, 2009 | | | IFRS accounts |
| |
ASSETS | | | | | | | | | | | | | | | | | | | | | | ASSETS |
| Current Assets | | | | | | | | | | | | | | | | | | | | | | Current Assets |
| Cash and cash equivalents | | $ | 409,087 | | | $ | (366,976 | ) | | $ | — | | | $ | — | | | $ | 42,111 | | | Cash and cash equivalents |
| Securities | | | 2,987 | | | | (2,933 | ) | | | — | | | | — | | | | 54 | | | Securities |
| Restricted cash | | | 32,008 | | | | (32,008 | ) | | | — | | | | — | | | | | | | |
| Accounts receivable, trade | | | 62,760 | | | | (62,760 | ) | | | — | | | | — | | | | | | | |
| Other receivables | | | 28,313 | | | | (15,070 | ) | | | — | | | | — | | | | 13,243 | | | Other receivables |
| Inventories | | | 110,161 | | | | (110,161 | ) | | | — | | | | — | | | | | | | |
| Contract deposits, prepaid and other | | | 58,694 | | | | (57,686 | ) | | | — | | | | — | | | | 1,008 | | | Contract deposits, prepaid and other |
| Future income tax assets | | | 7,679 | | | | (3,467 | ) | | | (4,212 | ) | | | — | | | | | | | |
| | | | | | | | 651,061 | | | | (3,467 | ) | | | — | | | | 647,594 | | | Current assets of discontinued operations |
| | | | | | | | | | | | | | | | | | | | | | | |
| Total current assets | | | 711,689 | | | | — | | | | (7,679 | ) | | | — | | | | 704,010 | | | Total current assets |
| Non-current Assets | | | | | | | | | | | | | | | | | | | | | | Non-current Assets |
| Property, plant and equipment | | | 2,489 | | | | (2,303 | ) | | | — | | | | — | | | | 186 | | | Property, plant and equipment |
| Interest in resource property | | | 24,861 | | | | — | | | | 175,139 | | | | — | | | | 200,000 | | | Interest in resource property |
| Equity method investments | | | 325 | | | | (325 | ) | | | — | | | | — | | | | | | | |
| Future income tax assets | | | 6,339 | | | | (768 | ) | | | — | | | | — | | | | 5,571 | | | Deferred tax assets |
| Investment in preferred shares of former subsidiaries | | | 19,125 | | | | — | | | | — | | | | — | | | | 19,125 | | | Investment in preferred shares of former subsidiaries |
| Other non-current assets | | | 830 | | | | (830 | ) | | | — | | | | — | | | | | | | |
| | | | | | | | 4,226 | | | | 3,467 | | | | — | | | | 7,693 | | | Non-current assets of discontinued operations |
| | | | | | | | | | | | | | | | | | | | | | | |
| Total non-current assets | | | 53,969 | | | | — | | | | 178,606 | | | | — | | | | 232,575 | | | Total non-current assets |
| | | | | | | | | | | | | | | | | | | | | | | |
| | | $ | 765,658 | | | $ | — | | | $ | 170,927 | | | $ | — | | | $ | 936,585 | | | |
| | | | | | | | | | | | | | | | | | | | | | | |
121
TERRA NOVA ROYALTY CORPORATION
(Formerly KHD HUMBOLDT WEDAG INTERNATIONAL LTD.)
NOTES TO CONSOLIDATED FINANCIAL STATEMENTS — (Continued)
Reconciliation of Consolidated Statement of Financial Position as of January 1, 2009 (Continued)
| | | | | | | | | | | | | | | | | | | | | | | |
| | | Canadian
| | | | | | | | | | | | | | | |
| | | GAAP
| | | | | | | | | | | | IFRS
| | | |
| | | balance
| | | Discontinued
| | | IFRS
| | | IFRS
| | | balance
| | | IFRS
|
Canadian GAAP accounts | | Dec 31, 2008 | | | operations | | | adjustments | | | reclassifications | | | Jan 1, 2009 | | | accounts |
| |
LIABILITIES AND SHAREHOLDERS’ EQUITY | | | | | | | | | | | | | | | | | | | | | | LIABILITIES AND EQUITY |
| Current Liabilities | | | | | | | | | | | | | | | | | | | | | | Current Liabilities |
| Accounts payable and accrued expenses | | $ | 178,582 | | | $ | (170,679 | ) | | $ | — | | | $ | — | | | $ | 7,903 | | | Accounts payable and accrued expenses |
| Progress billings above costs and estimated earnings on uncompleted contracts | | | 171,843 | | | | (171,843 | ) | | | — | | | | — | | | | | | | |
| Advance payments received from customers | | | 11,331 | | | | (11,331 | ) | | | — | | | | — | | | | | | | |
| Income tax liabilities | | | 9,112 | | | | (8,987 | ) | | | — | | | | — | | | | 125 | | | Income tax liabilities |
| Deferred credit, future income tax assets | | | 4,212 | | | | — | | | | (4,212 | ) | | | — | | | | | | | |
| Accrued pension liabilities, current portion | | | 2,158 | | | | (2,158 | ) | | | — | | | | — | | | | | | | |
| Provision for warranty costs, current portion | | | 30,856 | | | | (30,856 | ) | | | — | | | | — | | | | | | | |
| Provision for supplier commitments on terminated customer contracts | | | 23,729 | | | | (23,729 | ) | | | — | | | | — | | | | | | | |
| | | | | | | | 419,583 | | | | — | | | | — | | | | 419,583 | | | Current liabilities relating to discontinued operations |
| | | | | | | | | | | | | | | | | | | | | | | |
| Total current liabilities | | | 431,823 | | | | — | | | | (4,212 | ) | | | — | | | | 427,611 | | | Total current liabilities |
| Long-term Liabilities | | | | | | | | | | | | | | | | | | | | | | |
| Long-term debt, less current portion | | | 11,313 | | | | (11,313 | ) | | | — | | | | — | | | | | | | |
| Accrued pension liabilities, less current portion | | | 29,209 | | | | (29,209 | ) | | | — | | | | — | | | | | | | |
| Provision for warranty costs, less current portion | | | 7,524 | | | | (7,524 | ) | | | — | | | | — | | | | | | | |
| Deferred credit, future income tax assets | | | 4,176 | | | | (4,176 | ) | | | — | | | | — | | | | | | | |
| Future income tax liability | | | 7,646 | | | | (7,646 | ) | | | 51,133 | | | | — | | | | 51,133 | | | Deferred tax liability |
| Other long-term liabilities | | | 8,344 | | | | (8,344 | ) | | | — | | | | — | | | | | | | |
| | | | | | | | 68,212 | | | | — | | | | — | | | | 68,212 | | | Long-term liabilities relating to discontinued operations |
| | | | | | | | | | | | | | | | | | | | | | | |
| Total long-term liabilities | | | 68,212 | | | | — | | | | 51,133 | | | | — | | | | 119,345 | | | Total long-term liabilities |
| | | | | | | | | | | | | | | | | | | | | | | |
| Total liabilities | | | 500,035 | | | | — | | | | 46,921 | | | | — | | | | 546,956 | | | Total liabilities |
| Minority interests | | | 3,709 | | | | — | | | | — | | | | (3,709 | ) | | | | | | |
| | | | | | | | | | | | | | | | | | | | | | | Equity |
| Shareholders’ Equity | | | | | | | | | | | | | | | | | | | | | | Shareholders’ equity |
| Common stock | | | 143,826 | | | | — | | | | — | | | | — | | | | 143,826 | | | Common stock |
| Treasury stock | | | (93,793 | ) | | | — | | | | — | | | | — | | | | (93,793 | ) | | Treasury stock |
| Contributed surplus | | | 7,623 | | | | — | | | | — | | | | — | | | | 7,623 | | | Contributed surplus |
| Retained earnings | | | 155,681 | | | | — | | | | 172,583 | | | | — | | | | 328,264 | | | Retained earnings |
| Accumulated other comprehensive income | | | 48,577 | | | | — | | | | (48,577 | ) | | | — | | | | | | | |
| | | | | | | | | | | | | | | | | | | | | | | |
| Total shareholders’ equity | | | 261,914 | | | | — | | | | 124,006 | | | | — | | | | 385,920 | | | |
| | | | | | | | — | | | | — | | | | 3,709 | | | | 3,709 | | | Non-controlling interests |
| | | | | | | | | | | | | | | | | | | | | | | |
| | | | | | | | — | | | | 124,006 | | | | 3,709 | | | | 389,629 | | | Total equity |
| | | | | | | | | | | | | | | | | | | | | | | |
| | | $ | 765,658 | | | $ | — | | | $ | 170,927 | | | $ | — | | | $ | 936,585 | | | |
| | | | | | | | | | | | | | | | | | | | | | | |
122
Exhibits Required byForm 20-F
| | | | | |
Exhibit
| | |
Number | | Description |
| |
| | 1 | .1 | | Articles of Terra Nova Royalty Corporation. Incorporated by reference from ourForm F-4 dated October 7, 2010. |
| | 4 | .1 | | Amendment to Mining Lease Agreement dated January 1, 1987 between Terra Nova Royalty Corporation and Wabush Iron Co. Limited, Stelco Inc. and Dofasco Inc. Incorporated by reference from ourForm 10-K for the year ended December 31, 1989. |
| | 4 | .2 | | Memorandum of Agreement dated November 24, 1987 between Terra Nova Royalty Corporation and Wabush Iron Co. Limited, Stelco Inc. and Dofasco Inc. Incorporated by reference from ourForm 10-K for the year ended December 31, 1989. |
| | 4 | .3 | | First Amendment to the Memorandum of Agreement between Terra Nova Royalty Corporation and Wabush Iron Co. Limited, Stelco Inc. and Dofasco Inc. Incorporated by reference from ourForm 10-K for the year ended December 31, 1989. |
| | 4 | .4 | | Amended 1997 Stock Option Plan. Incorporated by reference from ourForm S-8 dated May 23, 2007. |
| | 4 | .5 | | Arrangement Agreement dated February 26, 2010 between Terra Nova Royalty Corporation and KHD Humboldt International (Deutschland) AG. Incorporated by reference from ourForm 6-K dated March 3, 2010. |
| | 4 | .6 | | Agreement dated September 24, 2010 between Terra Nova Royalty Corporation and Mass Financial Corp. Incorporated by reference from ourForm 6-K dated September 30, 2010. |
| | 4 | .7 | | 2008 Equity Incentive Plan. Incorporated by reference from ourForm F-4 dated October 7, 2010. |
| | 8 | .1 | | List of significant subsidiaries of our company as at March 31, 2011. |
| | 11 | .1 | | Code of Ethics. Incorporated by reference from ourForm 6-K dated October 5, 2009. |
| | 12 | .1 | | Certification of Chief Executive Officer pursuant to Section 302 of the Sarbanes-Oxley Act of 2002. |
| | 12 | .2 | | Certification of Chief Financial Officer pursuant to Section 302 of the Sarbanes-Oxley Act of 2002. |
| | 13 | .1 | | Certification of Chief Executive Officer pursuant to 18 U.S.C. section 1350, as adopted pursuant to Section 906 of the Sarbanes-Oxley Act of 2002. |
| | 13 | .2 | | Certification of Chief Financial Officer pursuant to 18 U.S.C. section 1350, as adopted pursuant to Section 906 of the Sarbanes-Oxley Act of 2002. |
| | 15 | .1 | | Letter dated March 31, 2011 of Deloitte & Touche LLP as required by Item 16F ofForm 20-F. |
| | 15 | .2 | | Consent dated March 31, 2011 of a member of NEXIA International, Davidson & Company LLP. |
| | 15 | .3 | | Consent dated March 31, 2011 of Deloitte & Touche LLP. |
123
SIGNATURES
The registrant hereby certifies that it meets all of the requirements for filing onForm 20-F and that it has duly caused and authorized the undersigned to sign this annual report on its behalf.
TERRA NOVA ROYALTY CORPORATION
Michael J. Smith
Chairman, Chief Executive Officer and President
Date: March 31, 2011
124