U.S. SECURITIES AND EXCHANGE COMMISSION
Washington D.C. 20549
Washington D.C. 20549
FORM 6-K
REPORT OF FOREIGN PRIVATE ISSUER PURSUANT TO RULE 13a-16 OR 15d-16
UNDER THE SECURITIES EXCHANGE ACT OF 1934
For the month of May 2013
Commission File No.:001-04192
![]()
MFC Industrial Ltd.
(Translation of Registrant’s name into English)
Suite #1620 - 400 Burrard Street, Vancouver, British Columbia, Canada V6C 3A6
(Address of principal executive office)
Indicate by check mark whether the registrant files or will file annual reports under cover of Form 20-F or Form 40-F.
| x Form 20-F | o Form 40-F |
Indicate by check mark whether the registrant is submitting the Form 6-K in paper as permitted by Regulation S-T Rule 101(b)(1):o
Note: Regulation S-T Rule 101(b)(1) only permits the submission in paper of a Form 6-K if submitted solely to provide an attached annual report to security holders.
Indicate by check mark whether the registrant is submitting the Form 6-K in paper as permitted by Regulation S-T Rule 101(b)(7):o
Note: Regulation S-T Rule 101(b)(7) only permits the submission in paper of a Form 6-K if submitted to furnish a report or other document that the registrant foreign private issuer must furnish and make public under the laws of the jurisdiction in which the registrant is incorporated, domiciled or legally organized (the registrant’s “home country”), or under the rules of the home country exchange on which the registrant’s securities are traded, as long as the report or other document is not a press release, is not required to be and has not been distributed to the registrant’s security holders, and, if discussing a material event, has already been the subject of a Form 6-K submission or other Commission filing on EDGAR.
Indicate by check mark whether by furnishing the information contained in this Form, the registrant is also thereby furnishing the information to the Commission pursuant to Rule 12g3-2(b) under the Securities Exchange Act of 1934.
| o Yes | x No |
If “Yes” is marked, indicate below the file number assigned to the Registrant in connection with Rule 12g3-2(b):o

Quarterly Report for the Three Months Ended March 31, 2013
(May 15, 2013)
The following report and the discussion and analysis of our financial condition and results of operations for the three-month period ended March 31, 2013 should be read in conjunction with our unaudited interim financial statements and notes for the three months ended March 31, 2013, our 2012 annual audited financial statements and the notes thereto and 2012 annual report on Form 20-F filed with the United States Securities and Exchange Commission (the “SEC”) and Canadian securities regulators. Our financial statements for the three months ended March 31, 2013 have been prepared in accordance with International Financial Reporting Standards (“IFRS”), as issued by the International Accounting Standards Board (“IASB”), and may not be comparable to financial statements prepared in accordance with United States generally accepted accounting principles.
Unless otherwise stated, all references to dollar amounts herein are to United States dollars and all references to “C$” herein are to Canadian dollars. As used in this document, the terms “we”, “us” and “our” mean MFC Industrial Ltd. and our subsidiaries, unless otherwise indicated. Due to rounding, numbers presented throughout this document may not add up precisely to totals we provide and percentages may not precisely reflect the absolute figures.
Disclaimer for Forward-Looking Information
Certain statements in this document are forward-looking statements, which reflect our expectations regarding our future growth, results of operations, performance and business prospects and opportunities. Forward-looking statements consist of statements that are not purely historical, including any statements regarding beliefs, plans, expectations or intentions regarding the future. While these forward-looking statements, and any assumptions upon which they are based, are made in good faith and reflect our current judgment regarding the direction of our business, actual results will almost always vary, sometimes materially, from any estimates, predictions, projections, assumptions or other future performance suggested herein. No assurance can be given that any of the events anticipated by the forward-looking statements will occur or, if they do occur, what benefits we will obtain from them. These forward-looking statements reflect our current views and are based on certain assumptions and speak only as of the date hereof. These assumptions, which include our current expectations, estimates and assumptions about our business and the markets we operate in, the global economic environment, interest rates, commodities prices, exchange rates, our ability to identify, complete and finance additional acquisitions and sources of supply for our global commodity supply chain business and our ability to manage our assets and operating costs, may prove to be incorrect. No forward-looking statement is a guarantee of future results. A number of risks and uncertainties could cause our actual results to differ materially from those expressed or implied by the forward-looking statements, including those described herein and in our 2012 annual report on Form 20-F. Such forward-looking statements should therefore be construed in light of such factors. Investors are cautioned not to place undue reliance on these forward-looking statements. Other than in accordance with our legal or regulatory obligations, we are not under any obligation and we expressly disclaim any intention or obligation to update or revise any forward-looking statements, whether as a result of new information, future events or otherwise. Additional information about these and other assumptions, risks and uncertainties are set out in the “Risk Factors” section of this report and in our annual report on Form 20-F for the year ended December 31, 2012 filed with the SEC and Canadian securities regulators.
Note Regarding Mineral and Natural Gas Disclosure
As a reporting issuer in Canada, we are required by Canadian law to provide disclosure respecting our mineral interests in accordance with National Instrument 43-101 (“NI 43-101”). Accordingly, investors are cautioned that the information contained in this quarterly report may not be comparable to similar information made public by U.S. companies under the United States federal securities laws and the rules and regulations thereunder. In particular, the terms “measured resource”, “indicated resource” and “inferred resource” as may be used herein are not defined in SEC Industry Guide 7 and are normally not permitted to be used in reports and registration statements filed with the SEC. Investors are cautioned not to assume that any part or all of mineral deposits in these categories will ever be converted into mineral reserves with demonstrated economic viability. In addition, the estimation of inferred resources involves
far greater uncertainty as to their existence and economic viability than the estimation of other categories of resources. Under Canadian rules, estimates of inferred mineral resources may not form the basis of feasibility or pre-feasibility studies, except in rare cases. U.S. investors are cautioned not to assume that part or all of an inferred resource exists, or is economically or legally minable.
Where applicable, barrels of oil equivalent, referred to as “boe”, amounts have been calculated using a conversion ratio of six thousand cubic feet of natural gas to one barrel of oil which is based on an energy equivalency conversion method primarily applicable at the burner tip and does not represent a value equivalency at the wellhead. BOEs may be misleading, particularly if used in isolation.
The following industry specific terms and abbreviations are utilized in this document:
- bbl/d– Barrels per day.
- boe/d– Barrels of oil equivalent per day.
- mbbl– Thousand barrels.
- mboe– Thousand barrels of oil equivalent.
- mcf– Thousand cubic feet.
- mcf/d– Thousand cubic feet per day.
- mmcf– Million cubic feet.
- mmcf/d– Million cubic feet per day.
- Natural gasorgas –The lighter hydrocarbons and associated non-hydrocarbon substances occurring naturally in an underground reservoir, which under atmospheric conditions are essentially gases, but which may contain natural gas liquids. Natural gas can exist in a reservoir either dissolved in crude oil (solution gas) or in a gaseous phase (associated gas or non-associated gas). Non-hydrocarbon substances may include hydrogen sulphide, carbon dioxide, and nitrogen.
- Net acres– The sum of the fractional working interests owned by us in gross acres.
- NGLorNGLs– Natural gas liquid or natural gas liquids, which are naturally occurring substances found in natural gas, including ethane, butane, isobutane, propane and natural gasoline, that can be collectively removed from produced natural gas, separated into these substances and sold.
- Working interest– The interest in a property which gives the owner that share of production from the property. A working interest owner bears that share of the costs of exploration, development and production in return for a share of production. Working interests are typically burdened by overriding royalty interest or other interests.
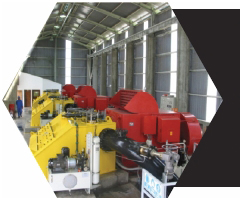
Our primary business is our commodity supply chain business, which is globally focused. We finance, assess risk, produce, source, process, transport and warehouse these commodities for producers and consumers around the world.
![]()
Our integrated operations, which include a wide range of commodities from metals, ceramics, minerals, natural gas, chemicals, plastics, refractories, additives for food and beverages, animal feed and wood products, are supported by our captive commodities through strategic direct and indirect investments and other sources secured by us from third parties.
DEAR FELLOW SHAREHOLDERS
We are pleased to present the results of MFC Industrial Ltd. (“MFC”) for the quarter ended March 31, 2013 and to provide you with an update on our recent corporate developments.(All references to dollar amounts are in United States dollars unless otherwise stated.)
In the first quarter of 2013, we saw marginal improvements in the pricing of certain of our commodities. Natural gas prices increased slightly, but such gains were offset by weaker than expected pricing for iron ore and other products. Our revenues grew by over 40% in the first quarter, compared to the same period in 2012. This was good, but we know we can do better. Earnings were quite disappointing as a result of various factors including timing issues on commodities shipments and higher expenses relating to the integration of our recent acquisitions.
Integrating our newly acquired businesses has been both a challenge and an opportunity. The opportunities have allowed us to enlarge our commodities footprint, enter new markets and expand our supply chain platform,offering potential further growth. We still have a way to go to fully integrate these new businesses. However, we believe that we have a good business platform and a very sound financial foundation.
| HIGHLIGHTS | ||||
| FOR THE THREE MONTHS ENDED MARCH 31, 2013 | ||||
| ► | Revenues increased by over 40% to $207.3 million in the first quarter of 2013. Our net income for the quarter ended March 31, 2013 decreased to a disappointing $5.0 million, or $0.08 per share on a diluted basis. | |||
| ► | Profits were down in the quarter ended March 31, 2013, primarily due to one-off expenses, increased SG&A expenses and the slower than expected integration of our newly acquired commodity businesses. | |||
| ► | Our goal with these and other acquisitions is not to dilute our shareholders by issuing new shares and to maintain our balance sheet and financial ratios. | |||
| ► | We entered into a preliminary letter agreement for a joint venture for the expansion of our natural gas midstream facilities. | |||
| ► | We declared an annual cash dividend for 2013 of $0.24 per common share. The dividend is 9% higher than that paid in 2012 and represents a yield of approximately 2.81% compared to an annual dividend yield of approximately 2.5% for the NYSE Composite Index in 2012. The 2013 cash dividend will be paid in equal quarterly installments of $0.06 per common share. To date we have distributed two dividend payments totaling $0.12 per share to our shareholders in February and April 2013. | |||
II
LETTER TO SHAREHOLDERS
We have completed the initial stages of the integration of Compton Petroleum Corporation’s (“CPC”) production of natural gas and natural gas liquids into our company. This reflected our strategy to increase our captive commodities sources and met our stated investment objectives. We are in the process of expanding our gas processing facility at Mazzeppa, consisting of the development of midstream projects that will help reduce our exposure to the volatility of natural gas prices, and also have the potential to create long-term stable processing income as well as a value-added component for our natural gas.
We are also in negotiations with interested parties to obtain the greatest value for our Niton property. The Niton area includes multi-zone, liquids-rich, tight gas plays, as well as other productive zones that provide the opportunities to expand our development base by moving into other geological horizons. Niton also includes our McLeod River gas processing plant.
ACC Resources Inc. (“ACCR”) and Possehl Mexico S.A. de C.V. (“Possehl”), which are commodity supply chain companies, specializing in industrial raw materials, chemicals and various other products are being integrated into our group and we will complete this process shortly.
MFC will continue to focus on increasing its efforts to acquire undervalued captive commodities assets and operating businesses, as well as streamlining its existing operations. Our strong financial foundation will allow us to expand and diversify our commodities business as long as we are disciplined and patient.
RESULTS FOR THE THREE MONTHS ENDED MARCH 31, 2013
Total revenues for the three months ended March 31, 2013 increased 40% to $207.3 million compared to $147.6 million in 2012. Our net income for the first three months of 2013 decreased to $5.0 million, or $0.08 per share on a diluted basis, from $16.9 million, or $0.27 per share on a diluted basis for the same period last year.
The income statement for the three months ended March 31, 2013 includes non-cash depletion and depreciation expenses of approximately $7.7 million and other non-cash related expenses of approximately $2.7 million primarily related to our natural gas operations.
Depletion and depreciation are non-cash expenses and represent the amortization of the historic cost of our natural gas assets and other fixed assets over their economical productive life.
Revenues were up for the three months ended March 31, 2013 because of several factors, including the integration of our new acquisitions and increases in volumes and pricing for some of our commodities. As well, we realized additional revenue from the introduction of new products. Our revenue numbers were a positive move, however we still need to complete the integration of our new acquisitions into our operations.
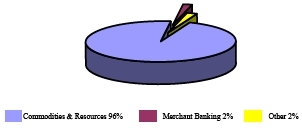
Revenues for our commodities and resources business were $199.3 million for the three months ended March 31, 2013, compared to $138.5 million for the same period in 2012. Included are the gross revenues generated by our royalty interest, which for the three months ended March 31, 2013 were approximately $3.7 million, compared to $4.6 million in 2012. A total of 392,735 tons of iron ore pellets and concentrate were shipped during the first three months of 2013, compared to 482,189 tons shipped during the same period in 2012.
Revenues for our merchant banking business were $3.6 million for the three months ended March 31, 2013 compared to $4.6 million for the same period in 2012.
Other revenues, which encompass our corporate and other investments, were $4.4 million for the three months ended March 31, 2013, compared to $4.6 million for the same period in 2012.
Costs of sales increased to $180.4 million during the three months ended March 31, 2013 from $121.6 million for the same period in 2012.Selling, general and administrative expenses increased to $15.9 million for the three months ended March 31, 2013 from $9.4 million for the same period in 2012.
III
LETTER TO SHAREHOLDERS
 |  INTERNATIONAL JUST-IN-TIME DELIVERIES n STRATEGIC INVESTMENTS IN RESOURCE ASSETS n OFFTAKE AGREEMENTS |
OVERVIEW OF OUR RESULTS FOR THE THREE MONTHS ENDED MARCH 31, 2013
The table below shows our revenues by operating segments for each of the three months ended March 31, 2013 and 2012.
| REVENUES | |||||||||
| All amounts in thousands | |||||||||
| March 31, 2013 | March 31, 2012 | ||||||||
| three months | three months | ||||||||
| Commodities and resources | $ | 199,288 | $ | 138,485 | |||||
| Merchant banking | 3,564 | 4,558 | |||||||
| Other | 4,402 | 4,590 | |||||||
| Total revenues | $ | 207,254 | $ | 147,633 | |||||
The table below shows our income from operations for each of the three months ended March 31, 2013 and 2012.
| INCOME FROM OPERATIONS | |||||||||
| All amounts in thousands, except per share amounts | |||||||||
| March 31, 2013 | March 31, 2012 | ||||||||
| three months | three months | ||||||||
| Commodities and resources* | $ | 2,857 | $ | 10,620 | |||||
| Merchant banking* | 7,138 | 7,844 | |||||||
| Other* | (3,201 | ) | (586 | ) | |||||
| Income before income taxes* | 6,794 | 17,878 | |||||||
| Income tax recovery (expenses) | (874 | ) | 280 | ||||||
Resource property revenue tax | (711 | ) | (901 | ) | |||||
| Net income attributable to non-controlling interests | (186 | ) | (313 | ) | |||||
| Net income attributable to shareholders | $ | 5,023 | $ | 16,944 | |||||
| Earning per share | $ | 0.08 | $ | 0.27 | |||||
Note: * Includes intercompany income which is eliminated in income before income taxes.
IV
LETTER TO SHAREHOLDERS
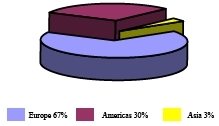
REVENUE BREAKDOWN BY REGION
The following pie chart shows our revenue by region for the three months ended March 31, 2013.
| REVENUE BY REGION |
![]()
FINANCIAL
The following table highlights certain selected key financial numbers and ratios as at March 31, 2013.
| FINANCIAL HIGHLIGHTS | ||||||
| All amounts in thousands, except per share amount and ratios | ||||||
| March 31, 2013 | ||||||
| Cash and cash equivalents | $ | 341,786 | ||||
| Trade receivables | 72,308 | |||||
| Current assets | 707,474 | |||||
| Total assets | 1,385,696 | |||||
| Current liabilities | 313,870 | |||||
| Working capital | 393,604 | |||||
| Current ratio* | 2.25 | |||||
| Acid test ratio* | 1.45 | |||||
| Total liabilities | 625,135 | |||||
| Shareholders’ equity | 754,187 | |||||
| Equity per common share | 12.06 | |||||
| Note: * | The current ratio is calculated as current assets divided by current liabilities. The acid test ratio is calculated as cash and cash equivalents plus short-term cash deposits, short-term securities and receivables divided by total current liabilities and excluding restricted and cash, inventories, prepaid expenses and assets held for resale and related liabilities. |
V
LETTER TO SHAREHOLDERS
LIQUIDITY
Liquidity is of great importance to companies in our business. As at March 31, 2013, we had cash and cash equivalents of $341.8 million. Our objectives when managing capital are: to safeguard our ability to do business so that we can continue to provide returns to shareholders; and to provide an adequate return by pricing products and services commensurately with the level of risk. We also maintain a flexible capital structure which optimizes the cost of capital at acceptable risk. We set the amount allocated proportionate to risk. We manage our capital structure and make adjustments to it in light of changes in economic conditions and the risk characteristics of the underlying assets.
| LIQUIDITY | |||||||||||
| All amounts in thousands | |||||||||||
| March 31, 2013 | December 31, 2012 | ||||||||||
| Total debt | $ | 201,956 | $ | 162,993 | |||||||
| Less: cash and cash equivalents | (341,786 | ) | (273,790 | ) | |||||||
| Net debt (net cash & cash equivalents) | (139,830 | ) | (110,797 | ) | |||||||
| Shareholders’ equity | 754,187 | 757,197 | |||||||||
LONG-TERM DEBT
The following table sets forth our long-term debt and long-term debt-to-equity ratio as of March 31, 2013 and December 31, 2012.
| LONG-TERM DEBT | |||||||||
| All amounts in thousands, except ratio | |||||||||
| March 31, 2013 | December 31, 2012 | ||||||||
| Long-term debt, less current portion | $ | 155,392 | $ | 118,824 | |||||
| Shareholders’ equity | 754,187 | 757,197 | |||||||
| Long-term debt-to-equity ratio(1) | 0.21 | 0.16 | |||||||
| Note:(1) | The long-term debt-to-equity ratio is calculated as long-term debt divided by shareholders’ equity. |
As at March 31, 2013, the majority of our long-term debt, less current portion in the amount of $155.4 million, consists of borrowing from banks. All-in costs for these unsecured loans are 2.53% annually.
 |  KEY LOCATION WAREHOUSING, PROCESSING, PACKAGING AND DELIVERING n USING OUR FINANCIAL RESOURCES AS LEVERAGE TO HELP FINANCE ONE OR BOTH SIDES OF A COMMODITY TRANSACTION |
VI
LETTER TO SHAREHOLDERS
CREDIT FACILITIES
We maintain various types of credit lines and facilities with various banks, and most of these are short-term. These facilities are used for day-to-day business, structured solutions and various other activities in both the commodities and finance areas.
As at March 31, 2013, we had credit facilities aggregating $405.2 million as follows: (i) revolving credit facilities aggregating $177.3 million from banks; (ii) revolving credit facilities aggregating $51.8 million from banks for structured solutions. The related margin is negotiable when the facility is used; (iii) a structured factoring arrangement with a bank for up to $119.4 million for our commodities activities. Generally, we can factor our commodity receivables upon invoicing at the inter-bank rate plus a margin; and (iv) a foreign exchange credit facility of $56.6 million with a bank. All of these bank lines and facilities are renewable on a yearly basis.
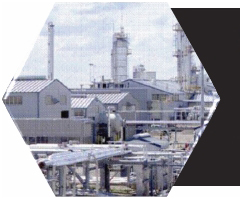
UPDATE ON OUR NATURAL GAS & MIDSTREAM FACILITIES
We have expanded our commodities platform into natural gas and midstream facilities. This is will be a major factor in our future growth, for, among other things:
it significantly expanded our global commodities platform into the energy sector; and
our operations include significant under-utilized midstream facilities, which present an opportunity for growth through value-added projects and the consolidation of regional gas production.
Developing midstream operations
We are completing plans for our gas processing facility at Mazzeppa,which include development of midstream projects that will help reduce our exposure to the volatility of natural gas prices and have the potential to create long-term stable processing income as well as a value-added component to our natural gas.
Using our facility as the main base, our strategy involves pursuing bolt-on or value-added projects. These may involve potential aggregate investments of over $360 million, including the following endeavours:
| DEVELOPING MIDSTREAM OPERATIONS | |
| Co-generation plant (17 to 60 MW) providing electricity for our own use with the surplus power being sold to the electrical grid. | |
| Consolidation of regional sour gas production by investing in gathering infrastructure to complement our facility and connect stranded sour gas suppliers. | |
| Design and build a deep-cut straddle plant at our facility for the recovery of ethane, propane and butane. | |
| A 10,000 barrel per day natural gas liquid fractionation facility utilizing our existing rail terminal for shipments. |
Partner
We have entered into a preliminary letter agreement respecting the joint development of properties surrounding our midstream operations with a group who has an excellent track record in this area. This would involve equal ownership of the project. A definitive agreement has not been finalized or completed and would be subject to certain conditions being satisfied. When these various conditions are satisfied, we will be able disclose such agreement in detail. We are now proceeding with the initial planning, design and contracting phases and the current timing for execution is expected to be approximately 24 to 36 months.
VII
LETTER TO SHAREHOLDERS
Wells and other processing facilities
The following table sets forth our average sales prices, operating costs, royalty amounts and transportation costs for the first three months of 2013:
| NATURAL GAS WELLS (COSTS AND PRODUCTION) | |||||||||||||
| All amounts in Canadian dollars, except production numbers | |||||||||||||
| For the three months ended March 31, 2013 | |||||||||||||
| Natural Gas | NGLs | Crude Oil | Total | ||||||||||
| (C$/mcf) | (C$/bbl)(1) | (C$/bbl) | (C$/boe) | ||||||||||
| Price(2) | C$ 3.41 | C$ 91.19 | C$ 82.14 | C$ 31.83 | |||||||||
| Royalties | 0.56 | 29.30 | 19.41 | 6.80 | |||||||||
| Operating costs(3) | 1.60 | 11.02 | 12.19 | 9.86 | |||||||||
| Transportation costs | 0.14 | 4.02 | 4.02 | 1.31 | |||||||||
| Production(4) | 4,901 mmcf | 105.5 mboe | 36.5 mbbl | 958.7 mboe | |||||||||
| Notes: | (1) | Includes sulphur. |
| (2) | Includes third party processing fees. | |
| (3) | A portion of our natural gas production is associated with crude oil production. As a result, per unit operating costs (lifting cost) for each product reflect the allocation of certain common costs. | |
| (4) | Net of working interest. |
Undeveloped land bank
At March 31, 2013, we had 292,077 net undeveloped acres on which, due to the current pricing environment in natural gas, we do not intend to carry out any drilling at this time.
 |  CASH DIVIDEND POLICY n CREATING ADDITIONAL VALUE THROUGH SPIN-OUTS n BUILDING VALUE THROUGH ACQUISITIONS AND RESTRUCTURING |
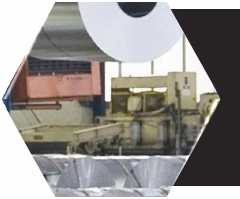
ENTERED NEW MARKETS AND EXPANDED OUR COMMODITIES PLATFORM
We are integrating our two new businesses Park Ridge, NJ-based ACCR and its affiliated company, Mexico City-based, Possehl into MFC.
MFC’s financial strength and our substantial global reach will be resources that will enable growth and agility for the combined companies. It is ACCR, Possehl and MFC’s belief that China will be an excellent sourcing market for us. As the Chinese slowdown continues, their commodities prices should start to come down and they will appreciate relationships with reliable counterparties from international supply chain organizations with ready financing.
VIII
LETTER TO SHAREHOLDERS
UPDATE ON THE ROYALTY INTEREST AT THE WABUSH MINE
In March, Cliffs Natural Resources Inc. (“Cliffs”) announced that, due to high production costs and lower pellet premium pricing, which is expected to persist in certain markets during the year, it will idle production at its Pointe Noire Quebec iron ore pellet plant. They will continue to produce an iron ore concentrate from its Scully Mine in Wabush located in the Province of Newfoundland and Labrador.
We do not expect that this will affect the royalty payment that we receive from Cliffs, as our royalties are paid on all iron ore products (i.e. pellets, concentrate and chips) shipped from the Wabush Mine.
Cliffs also disclosed that, for 2013, it is maintaining its full-year sales and production volume expectations of 9 to 10 million tons out of its Eastern Canada business segment. This includes approximately 3 million tons of iron ore pellets and/or concentrate products from its Wabush operation. We believe it is a positive development that Cliffs has maintained its 2013 guidance at the same production levels as 2012. On the other hand, we were disappointed with the lower than expected shipment volumes from Wabush during the period.
UPDATE ON OUR CAPTIVE SOURCES OF FERROUS METALS AT PEA RIDGE
MFC currently holds an indirect 50% interest in the Pea Ridge Iron Ore project (“Project”), a past-producing iron ore mine located in Sullivan, Missouri. The Project is a 50/50 joint venture between MFC and Alberici Group Inc. who joined forces with the goal to re-open and further develop the former Pea Ridge Iron Ore Mine. Our total investment in the Project to date is approximately $18.3 million.
Together with our consultants, we are continuing to conduct additional analysis and investigation regarding the re-opening of the mine, including commencing confirmatory work in connection with the large tonnage of tailings materials present at the Project site. If we determine to move forward with the Project, significant additional investment would be required. We currently expect that development activities would take place in two main phases:
- The first phase will focus on the tailings materials. This would likely require construction of a beneficiationplant to process the tailings at the project.
- The second phase would center on re-opening of the historic underground mine. This will involvedewatering the mine, substantial new development work, installing new equipment and, in part, willrequire construction of additional beneficiating facilities.
The Project is currently at a preliminary stage and, any decision on proceeding, including development activities, is dependent on the completion of further analysis, including feasibility studies. Activities at the Project are proceeding in an orderly fashion. It is currently anticipated that substantial additional expenditures will be incurred in order to determine the feasibility of the Project.
CORPORATE TAXATION
We are a company that strives to be fiscally responsible. The corporate income tax paid in cash was approximately $0.6 million for the quarter ended March 31, 2013.
 |  BROAD SPECTRUM OF COMMODITIES n PRODUCT SOURCING AND DEVELOPMENT n PROVEN RELIABILITY AND CONSISTENT QUALITY |
IX
LETTER TO SHAREHOLDERS
ANNUAL CASH DIVIDEND
In January, our Board of Directors declared an annual cash dividend for 2013 of US$0.24 per common share. The dividend is 9% higher than the dividend paid in 2012 and represents a yield of approximately 2.81% compared to an annual dividend yield of approximately 2.5% for the NYSE Composite Index in 2012. Details of the dividend are as follows:
- The 2013 cash dividend will be paid in equal quarterly installments of $0.06 per common share.
- The first payment of $0.06 per common share was paid on February 8, 2013 to shareholders of record on January 25, 2013.
- The second payment of $0.06 per common share was paid on April 22, 2013 to shareholders of record on April 12, 2013.
- The remaining quarterly dividend payments of $0.06 per common share in 2013 are expected to be made to shareholders of record in June and September.
Respectfully Submitted, |
 |
Michael J. Smith |
X
LETTER TO SHAREHOLDERS
| CORPORATE INFORMATION |
BOARD OF DIRECTORS | OFFICES AND SUBSIDIARIES | |||
Michael J. Smith Dr. Shuming Zhao* Robert Ian Rigg* Indrajit Chatterjee* Ravindra Prakash * Member of the Audit Committee AUDITORS Deloitte LLP STOCK LISTING New York Stock Exchange Trading Symbol: MIL WEBSITE www.mfcindustrial.com | AUSTRIA Millennium Tower, 21st Floor HONG KONG 8th Floor, Dina House CANADA 400 Burrard Street CANADA 1035 7th Ave S.W. UNITED STATES One Maynard Drive CHINA Room 2409, Shanghai Mart Tower | CHINA Room 1807, The Exchange Beijing ARGENTINA Avenida Alicia Moreau Justo 1750 MEXICO Bosques de Alisos No. 47B CORPORATE CONTACT R. Randall INVESTOR RELATIONS Cameron Associates Inc. TRANSFER AGENT Computershare |
XI
LETTER TO SHAREHOLDERS

Nature of Business
We are a global commodities supply chain company, which sources and delivers commodities and materials to clients, with an expertise on the financing and risk management aspects of their businesses. Our business is divided into three reportable segments: (i) commodities and resources, which includes our commodities activities and mineral and energy resources; (ii) merchant banking, which includes structured solutions, financial services and proprietary investing activities; and (iii) other, which encompasses our corporate and other investments and business interests, including our medical supplies and servicing business and corporate.
Commodities and Resources
Our commodity supply chain business is globally focused and includes our integrated commodities operations and our mineral interests. We conduct such operations primarily through our subsidiaries based in Vienna, Austria and our recently acquired subsidiaries in the United States, Latin America and Canada, and supply various commodities, including minerals and metals, chemicals, refractory and ceramic materials and wood products, to our customers. As a result of our acquisition of Compton Petroleum Corporation (“Compton”) in the third quarter of 2012, we are now active in the energy sector of the commodities business through our natural gas and other hydrocarbon production and processing activities in Alberta, Canada. Our commodities originate either from our directly or indirectly held interests in resource projects or are secured by us from third parties. We also derive production royalty revenue from a mining sub-lease.
Through our global commodity supply chain business, we also provide logistics, supply chain management and other services to producers and consumers of commodities. These activities are supported by strategic direct or indirect investments in natural resource assets operating in our core commodities.
Our commodities operations include sourcing and supplying commodities. To a lesser extent, we also act as an agent for our clients. Our commodities operations often utilize innovative trading strategies and structures. We currently engage in purchases and sales with commodity and other producers who are unable to effectively realize sales due to their specific circumstances.
We often purchase or produce the underlying commodity and sell it to an end buyer or transfer it for another commodity, which will subsequently be sold. Further, commodity producers and end customers often work with us to better manage their internal supply chain, distribution risk and currency and capital requirements. In such commodities operations, we try to capture various commodities, financing and currency spreads. Through our operations, we have been able to develop ongoing relationships with commodity producers, end customers and financiers and integrate them into our financial activities.
We generally source commodities from Asia, Africa, Europe, North America and the Middle East. Our commodities are sold in global markets.
Our commodities operations are supported by our logistics and finance activities in order to provide cost effective and efficient transportation, as well as the granting of payment terms for working capital requirements for our customers and partners.
Our commodities and resources business employs personnel worldwide. Our main marketing office is located in Vienna, Austria. In addition, we establish relationships with and seek to further market our products through agents located worldwide. Our marketing and investment activities in the commodities and resource sector are supported by a global network of agents and relationships. This network provides us with worldwide sourcing and distribution capabilities.
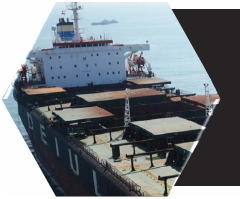
We indirectly derive production royalty revenue from a mining sub-lease of the lands upon which the Wabush iron ore mine is situated in Newfoundland and Labrador, Canada. This sub-lease commenced in 1956 and expires in 2055. The lessor is Knoll Lake Minerals Ltd. (“Knoll Lake Minerals”), which holds a direct mining lease from the Province. The mine is owned by Cliffs Natural Resources Inc. (“Cliffs”). In August 2011, we reorganized our royalty asset to hold an indirect 99.44% economic interest therein.
In 2012, 2011 and 2010, 3.2 million, 3.5 million and 3.8 million tons of iron products, respectively, were shipped. In the first quarter of 2013, Cliffs announced that it expects to idle the Wabush Pointe Noire pellet plant by the end of the second quarter 2013 and transition to producing an iron ore concentrate only product from the mine due to high production costs and lower pellet premium pricing. A total of 392,735 tons and 482,189 tons of iron ore products were shipped during the three months ended March 31, 2013 and 2012, respectively.
1
Iron ore shipments from the Wabush iron ore mine are subject to seasonal and cyclical fluctuations. The royalty is paid quarterly and is based on the tonnage of iron ore products shipped. One of the major components in the calculation of the royalty rate payable is based on the most recently published price of a particular iron ore pellet. Pursuant to the terms of the mining sub-lease, the royalty payment is not to be less than C$3.25 million per annum until its expiry. In 1988, the royalty rate was amended to require a base royalty rate of C$1.685 per ton with escalations as defined in the sub-lease. We are obligated to make royalty payments of C$0.22 per ton on shipments of iron ore products to Knoll Lake Minerals, which holds the direct lease over the mine property. Cliffs applies a portion of the royalty payments under the sub-lease to make such royalty payments to Knoll Lake Minerals.
Historically, iron-ore benchmark prices were determined in the first quarter of the calendar year through negotiations between the major producers and their most significant customers. These prices were then generally adopted by the other suppliers when published.
A shift in the marketplace has, among other things, made obsolete certain of the world iron ore pellet pricing methodology for calculating the royalty rate due to us contained in our sub-lease for the Wabush iron mine. As a result of these market changes, and as the sub-lease permits us to renegotiate an increase in the royalty rates when the mine achieves certain profitability thresholds, which we believe have been obtained, we served the mine operator with notice of arbitration respecting our entitlement to a new base rate for the royalty and a determination for the calculation of future royalty pricing. We have also provided the mine operator with a notice of arbitration seeking recovery for royalty underpayments in 2010. The outcome of such proceedings cannot be determined at this time.
Iron ore is typically sold either as a concentrate, whereby the iron ore is in granular form, or as a pellet, whereby iron ore concentrate has been mixed with a binding agent, formed into a pellet and then fired in a furnace. Iron ore pellets can be charged directly into blast furnaces without further processing and are primarily used to produce pig iron, which is subsequently transformed into steel. The ore resources at the Wabush mine contain manganese in quantities that make the resulting iron ore concentrates unattractive to some steel plant customers. The operator of the mine has announced that it is addressing this by installing mill components that reduce manganese content, with the final plant reconfiguration requiring four to six independent manganese reduction circuits, two of which were installed in 2011. The operator of the mine has indicated that this manganese reduction program would extend the mine life by six years.
The following table sets forth historical total iron ore shipments (which include pellets, chips and concentrates) and royalty payments to us based upon the amounts reported to us by the Wabush mine operator:
| Gross | ||||||||||||||||||||||||
| Average | ||||||||||||||||||||||||
| Total | Gross | Royalty | ||||||||||||||||||||||
| Tonnage Shipped | Tonnage | Royalties | Rate/Ton | |||||||||||||||||||||
| Year | Q1 | Q2 | Q3 | Q4 | Shipped | Received(1) | Received | |||||||||||||||||
| (In thousands, other than the Royalty Rate) (All monetary amounts in Canadian dollars) | ||||||||||||||||||||||||
| 2008 | 694 | 1,437 | 1,117 | 705 | 3,953 | $ | 31,288 | $ | 7.91 | |||||||||||||||
| 2009 | 402 | 386 | 1,202 | 1,198 | 3,188 | 17,350 | 5.44 | |||||||||||||||||
| 2010 | 874 | 941 | 832 | 1,105 | 3,752 | 22,915 | (2) | 6.11 | ||||||||||||||||
| 2011 | 719 | 796 | 1,311 | 646 | 3,472 | 31,607 | 9.10 | |||||||||||||||||
| 2012 | 482 | 911 | 945 | 851 | 3,189 | 31,191 | 9.78 | |||||||||||||||||
Notes: | ||
| (1) | Subject to a 20% resource property revenue tax. | |
| (2) | Does not include the amount of arbitration award. | |
We hold a 50% interest in the Pea Ridge Iron Ore Mine located in Sullivan, Missouri, USA, approximately 70 miles southwest of St. Louis, Missouri, USA. The Pea Ridge Mine operated as an underground mine between 1963 and 2001 and was originally developed as a partnership between Bethlehem Steel Corporation and St. Joe Minerals Corp., operating as the Meramec Mining Company. From 1981 to 1987, the mine was operated by Fluor Corporation and was subsequently acquired by Woodridge Resources Corporation until its closure in 2001. From 2001 until we acquired our interest in the Pea Ridge Mine, operations at the mine had been limited to reclamation of resource settlement ponds located below the historical production facilities. Historic data and records indicate that approximately 58.5 million short tons of iron ore were removed from the mine between 1963 and 2001.
2
The Pea Ridge Mine project includes the historic mine deposit along with a large tonnage of tailings material. Prior infrastructure remains in place, including access to underground workings, two vertical mine shafts with hoists and headframes, a plant building and tailings and settling ponds. The Pea Ridge Mine’s location is served by highways connecting to the U.S. interstate highway system and has a presently unused rail spur line connecting to the Union Pacific railway system.
During the three months ended March 31, 2013, we and our partner Alberici Group, Inc. continued to study the re-opening of the Pea Ridge Mine. During the second quarter of 2012, we completed an updated independent NI 43-101 compliant technical report (the “Technical Report”), upgrading previously disclosed historic resources estimates to current resource estimates. Behre Dolbear and Company (USA), Inc. (“Behre Dolbear”), our independent technical consultants authored the Technical Report. The estimates include anin situ (originally present) measured and indicated resource of 248.7 million short tons at 52.87% magnetic iron and 57.82% total iron and an inferred resource of 15.8 million short tons at 53.67% magnetic iron and 57.64% total iron based on a cut-off grade of 40% magnetic iron.
In completing the Technical Report, Behre Dolbear conducted, among other things, an audit of historic drill hole data, a confirmatory re-sampling and analysis program on the extensive library of drill core maintained at the Pea Ridge Mine site.
Readers should refer to the full text of the Technical Report, titled “Technical Report on the PRR Mining Pea Ridge Property” dated August 13, 2012, for further information regarding the Pea Ridge Mine, a copy of which is available under our profile at www.sedar.com.
In addition to completion of the Technical Report, as part of the work necessary to evaluate the Pea Ridge Mine for re-opening, we engaged the consulting firm Geotechnology, Inc. to investigate the depth and shape of the top and bottom of the subsidence cave zone which is present above the Pea Ridge Mine deposit. This work included direct measurements of the size and extent of the cave zone within existing vertical drill holes above a portion of the Pea Ridge Mine deposit. Having received the results of such investigation, we are, together with our consultants, considering additional steps in the evaluation of the cave zone, including re-drilling several existing holes above the mineralized zone, and conducting a three-dimensional detailed seismic survey over the Pea Ridge Mine site. We believe that the results of this work will be useful in determining the best way to develop and mine the iron deposit. Additionally, in 2012 we commenced exploration and development work in connection with the large tonnage of tailings materials of the Pea Ridge Mine site. Such work continued into the first quarter of 2013 and is ongoing.
A necessary step in completing further analysis, including feasibility studies is de-watering the existing underground mine workings. We intend to complete additional preliminary analysis and investigations regarding the re-opening of the mine.
As a result of our acquisition of Compton on September 6, 2012, our commodities activities have expanded to the energy sector through the development, production and processing of natural gas and NGLs in Western Canada. The majority of such operations are located in the central fairway of the Western Canada Sedimentary Basin, primarily situated in the Province of Alberta. As at December 31, 2012, Compton had an interest in 945producing natural gas wells, 17non-producing natural gas wells, 116producing oil wells, 7 non-producing oil wells and a land position that included 309,782net working interest undeveloped acres. Our assets are situated in the following areas of the Western Canada Sedimentary Basin: (i) the Rock Creek sands and other Cretaceous sands in the Niton area of central Alberta; (ii) the Cretaceous and Tertiary sands in Okotoks and Southern Alberta; (iii) the Mannville sands in the High River area of southern Alberta; and (iv) the deeper, Belly River sands in the Callum area of southern Alberta.
The Niton area includes multi-zone, liquids-rich, tight gas plays with production to date primarily coming from Rock Creek and Ellerslie sandstones. We have a large number of mineral agreements that cover specific zonal rights in this area. We have an average 72% working interest in 86,460 gross acres of land to the base of the Rock Creek Member of the Fernie Group. The Niton area has other productive zones that provide opportunities to expand our development base by moving into other geological horizons. These zones lie above the Rock Creek and include the Wilrich and Notikewin sandstones of the Upper Mannville and Spirit River Group.
The Southern Plains is comprised primarily of multi Belly River sands along with upper Edmonton Group coal bed methane formations. As well, in select areas of Southern Alberta there are productive Mannville sands. With control of 413,960 gross acres of land at an average 87% working interest, this land base provides a significant multi-year, low risk natural gas drilling inventory. Infrastructure is in place in the area for future production increases.
3
Our High River asset is primarily a low to medium permeability Basal Quartz channel sandstone pool, which is the southern Alberta extension of the Lower Cretaceous Deep Basin gas trend.
We also have interests in substantial established infrastructure, which allows flexibility to effectively manage area development and adjust operations accordingly. Overall, we operate over 50,000 horsepower of compression totaling 200 mmcf/d, of available field compression capacity, having over 85 mmcf/d of operated processing capacity and over 2,000 km of pipeline infrastructure in place. Key facilities are as follows:
- Mazeppa Gas Processing Plant– Through Compton, we provide the management team and corporate guidance for the Mazeppa Processing Partnership (“MPP”), which has 100% ownership of the Mazeppa gas processing plant and the Mazeppa gas gathering system. The Mazeppa sour gas processing plant is located in the High River area and currently has production capacity of 90 mmcf/d (licensed plant capacity) of sour natural gas and 45 mmcf/d of sweet natural gas.
- High River– In the High River area there is 9,150 horsepower installed with a gas compression capacity of 42.5 mmcf/d and 270 km of pipeline infrastructure in place. Volumes are all produced through the Mazeppa gas gathering system and sour gas processing plant.
- Southern Alberta Foothills– The Callum and Cowley Gas Processing Plants with 100% plant ownership are currently capable of compressing 19 mmcf/d and ultimately processing 50 mmcf/d through the two existing facilities with the addition of field and/or plant compression. There is currently over 60 km of pipeline infrastructure in the operating area with minimal third party infrastructure in place.
- Edson, Niton, and McLeod– This foothills area property has compression capacity of 23 mmcf/d utilizing over 6,400 horsepower, including the Compton McLeod River Gas Processing Plant with 23 mmcf/d of capacity with 100% plant ownership. Additionally, there is over 185 km of pipeline infrastructure in the area.
- Shallow Gas Properties– Our shallow gas infrastructure consists of over 110 mmcf/d of compression capacity utilizing 30,000 horsepower with over 1,200 km of pipeline infrastructure in place. Final processing gas volumes are linked into the Nova/TransCanada pipeline systems at multiple sales locations.
During the first three months of 2013, we produced 4,901 mmcf of natural gas, 105.5 mboe of natural gas liquids (including sulphur) and 36.5 mbbl of crude oil, for total production of natural gas, natural gas liquids and crude oil of 958.7 mboe on a net working interest basis. Our average daily production was approximately 10,653 boe/d, including 54,452 mcf/d of natural gas, 1,172 bbl/d of natural gas liquids and 405 bbl/d of crude oil.
The following table sets our average sales prices, operating costs, royalty amounts and transportation costs for the first three months of 2013:
| Natural Gas (C$/mcf) | NGLs (C$/bbl)(1) | Crude Oil (C$/bbl) | Total (C$/boe) | |||||||||||||
| Price(2) | C$3.41 | C$91.19 | C$82.14 | C$31.83 | ||||||||||||
| Royalties | 0.56 | 29.30 | 19.41 | 6.80 | ||||||||||||
| Operating costs(3) | 1.60 | 11.02 | 12.19 | 9.86 | ||||||||||||
| Transportation costs | 0.14 | 4.02 | 4.02 | 1.31 | ||||||||||||
Notes: |
| (1) | Includes sulphur. | |
| (2) | Includes third party processing fees. | |
| (3) | A portion of our natural gas production is associated with crude oil production. As a result, per unit operating costs for each product reflect the allocation of certain common costs. Additionally, excludes the impact of hedging on prices. | |
Merchant Banking
Our merchant banking operations include merchant banking and financial services, third-party financing and other services, proprietary investing and our real property. We seek to invest in many industries, emphasizing those business opportunities where the perceived intrinsic value is not properly recognized.
We use our financial and management expertise to add or unlock value within a relatively short time period. Our merchant banking activity is generally not passive and we seek investments where our financial expertise and management can add or unlock value. Proprietary investments are generated and made as part of our overall
4
merchant banking activities and are realized upon over time, sometimes taking more than one year. In addition, we often seek to acquire interests or establish relationships with commodity producers to realize upon potential synergies. Such interests can be acquired through purchases of, or investments in, commodity producers, or through contractual arrangements with them, including off-take agreements. The investments we make in commodity producers are part of our merchant banking strategy. To a degree, our merchant banking and commodities and resources businesses supplement each other, which results in synergies in our overall business activities.
Our activities include making proprietary investments through investing our own capital and utilizing our expertise to capture investment opportunities. We seek to invest in businesses or assets whose intrinsic value is not properly reflected in their share or other price. Often such investments are in companies or assets that are under financial, legal or regulatory distress and our services include resolving such distress. Our investing takes many forms and can include acquiring entire businesses or portions thereof, investing in equity, investing in the existing indebtedness (secured and unsecured) of a business or in new equity or debt issues. Our investing is generally not passive and we invest where we believe our expertise in financial restructuring and management and complementary trading and corporate finance capabilities can add or unlock value. Our investing in distressed businesses and/or assets can result in complex and intricate legal issues relating to priorities, claims and other rights of stakeholders. Such issues can result in our being involved in legal and other claims as a result of our overall proprietary investment strategy. Our proprietary investments are often made as a part of, or complementary to, our commodities and resources activities.
We consider investment opportunities where: (i) our existing participation in the marketing and production of commodities provides expert insight; (ii) we can obtain a satisfactory return of future capital investment; and (iii) such investment integrates with our business. Our philosophy is to utilize our financial strength to realize the commercial potential of assets in markets where we have a comprehensive understanding of the drivers of value.
In addition, we utilize our established relationships with international financial institutions, credit insurers and factoring companies to provide flexible customized financial tools, extensive credit and risk management and structured solutions for our customers. Working closely with our customers, our professional staff arrange support of hedging and trading of materials, financing and risk management solutions.
Our merchant banking activities also include leveraging our trading and financial experience and relationships to provide trading services and trade finance services to our customers.
Our merchant banking business generates revenues in the form of corporate and trade finance service fees and interest income. We also realize gains from time to time on our proprietary investments, upon their sale, the execution of an equity or debt restructuring, or the completion of other forms of divestment.
Other
Our other segment includes our corporate and other operating segments and investments, which include financing joint ventures through our China-based subsidiaries which provides medical services, equipment and supplies.
Acquisition of Compton Petroleum Corporation
In the third quarter of 2012, our indirect wholly-owned subsidiary acquired all of the issued and outstanding common shares of Compton, by way of a take-over bid and subsequent compulsory acquisition. Total consideration paid to holders of its common shares under the take-over bid and compulsory acquisition was approximately C$32.9 million. As a result of the acquisition, we have consolidated Compton’s operations since September 7, 2012.
Acquisition of ACCR and Possehl
In November 2012, we acquired a controlling interest in each of ACC Resources Inc. (formerly, ACCR Resources Co., L.P.) (“ACCR”) and Possehl Mexico S.A. de C.V. (“Possehl”), which are based in New Jersey, U.S.A and Mexico City, Mexico, respectively and are fully integrated commodity supply chain companies, specializing in industrial raw materials, chemicals and various other products. The aggregate purchase price for an 80% interest in ACCR and a 60% interest in Possehl was approximately $23.2 million. We paid $14.7 million of the purchase price in 2012 and $6.2 million in January 2013 for a 70% interest in ACCR and 60% interest in Possehl. An additional $2.3 million is payable by us in November 2013, at which time we will acquire an additional 10% interest in ACCR. The purchase price is subject to adjustment based on pending valuations of real property and occurrence of certain adjustment events. In addition, the underlying agreements provide for, among other things, the future acquisition of additional interests in ACCR and Possehl in certain circumstances.
5
These acquisitions expanded our existing global supply chain network, reaching further into North and Latin American markets. Additionally, as their product base included various products that were not previously in our commodities platform, the acquisitions have resulted in an expansion of our commodities operations into new products, including refractory and ceramic materials, such as bauxite, flint clay, magnesium oxide, alumina cements and chrome ore, talcs and plastics, industrial chemicals and other products.
Acquisition of Kasese Cobalt Company Limited
Pursuant to an asset purchase agreement with a vendor, in March 2012, we acquired a shareholder loan held by the vendor and a 75% equity interest in Kasese Cobalt Company Limited (“KCCL”) for cash consideration of approximately $28.0 million. As a result of the acquisition, we hold a mineral refinery plant and power plant in Uganda. KCCL’s operations comprised the recovery of cobalt metal from pyrite tailings located near its refinery. KCCL has approximately less than a nine-month supply of tailings.
Cash Dividend
On January 10, 2011, we announced that our board of directors had adopted an annual dividend policy, providing for an annual dividend based on the annual dividend yield of the New York Stock Exchange (the “NYSE”) Composite Index (the “NYSE Composite Index”) for the preceding year plus 25 basis points. In 2011 and 2012, we declared and paid cash dividends of $0.20 and $0.22 per common share, respectively, which were paid in four quarterly installments. On January 13, 2013, we announced that our board of directors had declared an annual cash dividend for 2013 of $0.24 per common share. The 2013 dividend is 9% higher than the dividend paid in 2012, and, based on the closing price of $8.55 for our common shares on December 31, 2012, represents a dividend yield of approximately 2.81%, compared to an annual dividend yield of approximately 2.5% for the NYSE Composite Index in 2012.
To date, we have made the following dividend payments to our shareholders: (i) $0.06 per share on February 8, 2013 to shareholders of record on January 25, 2013; and (ii) $0.06 per share on April 22, 2013 to shareholders of record on April 12, 2013.
Discussion of Operations
The following discussion and analysis of our financial condition and results of operations for the three months ended March 31, 2013 and 2012 should be read in conjunction with our unaudited condensed consolidated financial statements and related notes.
General
We are a global commodities supply-chain company, which sources and delivers commodities and materials to clients internationally, with a special expertise on the financing and risk management aspects of the business. We also commit our own capital to promising enterprises and invest and otherwise capture investment opportunities for our own account. We seek to invest in businesses or assets whose intrinsic value is not properly reflected in their share price or value. Our investing is generally not passive. We actively seek investments where our financial expertise and management can add or unlock value.
During the third quarter of 2012, we completed the acquisition of Compton and we commenced consolidating its operations since September 7, 2012.
Our results of operations have been and may continue to be affected by many factors of a global nature, including economic and market conditions, the availability of capital, the level and volatility of equity prices and interest rates, currency values, commodity prices and other market indices, technological changes, the availability of credit, inflation and legislative and regulatory developments. Our results of operations may also be materially affected by competitive factors. Our competitors include natural resource companies, commodities trading companies and firms traditionally engaged in merchant banking and financial services such as merchant and investment banks, along with other capital sources such as hedge funds, private equity firms and insurance companies.
Our results of operations for any particular period may also be materially affected by our realization on proprietary investments. These investments are made to maximize total return through long-term appreciation and recognized gains on divestment. We realize on our proprietary investments through a variety of methods including sales, capital restructuring or other forms of divestment.
6
A majority of our revenues is derived from our global commodity and resource operations. The remaining portions are generally derived from merchant banking, financial services, sales of properties and gains on securities.
Our net book value as at March 31, 2013 and December 31, 2012 is set forth below:
| March 31, 2013 | December 31, 2012 | |||||||||
| (United States dollars in thousands, except per share amounts) | ||||||||||
| Net book value | $ | 754,187 | $ | 757,197 | ||||||
| Net book value per share | 12.06 | 12.11 | ||||||||
Business Environment
Our financial performance is, and our consolidated results in any period can be, materially affected by global economic conditions and financial markets generally.
Our favourable business environment is characterized by many factors, including a stable geopolitical climate, transparent financial markets, low inflation, low interest rates, availability of credit, low unemployment, strong business profitability and high business and investor confidence. Unfavourable or uncertain economic and market conditions can be caused by declines in economic growth, business activity or investor or business confidence, limitations on the availability or increase in the cost of credit and capital, increases in inflation, interest rates, exchange rate volatility, outbreaks of hostilities or other geopolitical instability, corporate, political or other scandals that reduce investor confidence in the capital markets, or a combination of these or other factors.
Ongoing global economic conditions, including fears of sovereign debt default and a European banking crisis continued to impact the liquidity in financial and capital markets, restricting access to financing and causing significant volatility in commodity prices in the first quarter of 2013. There can be no assurance as to the stabilization and recovery of economic conditions in the near term.
Results of Operations
Summary of Quarterly Results
The following tables provide selected unaudited financial information for the most recent eight quarters:
| March 31, 2013 | December 31, 2012 | September 30, 2012(1) | June 30, 2012 | ||||||||||||||||
| (United States dollars in thousands, except per share amounts) | |||||||||||||||||||
| Net sales | $ | 205,732 | $ | 110,416 | $ | 118,597 | $ | 104,445 | |||||||||||
| Equity income | 1,522 | 1,347 | 1,515 | 1,706 | |||||||||||||||
| Total revenues | 207,254 | 111,763 | 120,112 | 106,151 | |||||||||||||||
| Net income (loss)(2) | 5,023 | (47,011) | (3) | 245,760 | (4) | 11,061 | |||||||||||||
| Basic earnings (loss), per share | 0.08 | (0.75) | (3) | 3.93 | (4) | 0.18 | |||||||||||||
| Diluted earnings (loss), per share | 0.08 | (0.75) | (3) | 3.93 | (4) | 0.18 | |||||||||||||
Notes: |
| (1) | We completed our acquisition of Compton on September 6, 2012. As a result of the successful acquisition, we commenced consolidating its operations from September 7, 2012. | |
| (2) | Net income attributable to our shareholders. | |
| (3) | Includes total impairment and write-down of $48.2 million, or $0.77 per share, net of income tax recovery, on a subsidiary in India, which was subsequently sold in 2013. | |
| (4) | Includes a bargain purchase of $244.6 million, or $3.91 per share on a basic and diluted basis in connection with the acquisition of Compton. The bargain purchase arose as the consideration under the transaction was less than the fair value of the net identifiable assets acquired. | |
7
| March 31, | December 31, | September 30, | June 30, | ||||||||||||||||||
| 2012 | 2011 | 2011 | 2011 | ||||||||||||||||||
| (United States dollars in thousands, | |||||||||||||||||||||
| except per share amounts) | |||||||||||||||||||||
| Net sales | $ | 146,049 | $ | 128,076 | $ | 112,107 | $ | 142,032 | |||||||||||||
| Equity income | 1,584 | 1,383 | 1,621 | 1,653 | |||||||||||||||||
| Total revenues | 147,633 | 129,459 | 113,728 | 143,685 | |||||||||||||||||
| Net income from continuing operations(1) | 16,944 | (2) | (9,410 | ) | 6,686 | 11,997 | |||||||||||||||
| Basic earnings from continuing | |||||||||||||||||||||
| operations, per share | 0.27 | (2) | (0.15 | ) | 0.11 | 0.19 | |||||||||||||||
| Diluted earnings from continuing | |||||||||||||||||||||
| operations, per share | 0.27 | (2) | (0.15 | ) | 0.11 | 0.19 | |||||||||||||||
| Net income (loss)(1) | 16,944 | (2) | (9,410 | ) | 6,686 | 11,997 | |||||||||||||||
| Basic earnings (loss), per share | 0.27 | (2) | (0.15 | ) | 0.11 | 0.19 | |||||||||||||||
| Diluted earnings (loss), per share | 0.27 | (2) | (0.15 | ) | 0.11 | 0.19 | |||||||||||||||
Note: | ||
(1) | Net income attributable to our shareholders. | |
(2) | Includes a bargain purchase of $2.4 million, or $0.04 per common share, on a basic and diluted basis in connection with the acquisition of a subsidiary. The bargain purchase arose as the consideration under the transaction was less than the fair value of the net identifiable assets acquired. This was recognized during the measurement period after fair values of the assets were finalized in December 2012. | |
Three Months Ended March 31, 2013 Compared to the Three Months Ended March 31, 2012
The following table sets forth our selected operating results and other financial information for the periods indicated:
| Three Months Ended March 31 | ||||||||||
| 2013(1) | 2012 | |||||||||
| (United States dollars in thousands, | ||||||||||
| except per share amounts) | ||||||||||
| Net sales | $ | 205,732 | $ | 146,049 | ||||||
| Gross revenues | 207,254 | 147,633 | ||||||||
| Costs and expenses | 200,630 | 132,886 | ||||||||
| Costs of sales | 180,398 | 121,625 | ||||||||
| Selling, general and administrative expense | 15,856 | 9,426 | ||||||||
| Finance costs | 4,376 | 1,826 | ||||||||
| Income from operations | 6,624 | 14,747 | ||||||||
| Net income(3) | 5,023 | 16,944 | (2) | |||||||
| Earnings per share: | ||||||||||
| Basic | 0.08 | 0.27 | (2) | |||||||
| Diluted | 0.08 | 0.27 | (2) | |||||||
Notes: | ||
(1) | We consolidated the operations of Compton from September 7, 2012. | |
(2) | Includes a bargain purchase of $2.4 million, or $0.04 per common share, on a basic and diluted basis in connection with the acquisition of a subsidiary. The bargain purchase arose as the consideration under the transaction was less than the fair value of the net identifiable assets acquired. This was recognized during the measurement period after fair values of the assets were finalized in December 2012. | |
(3) | Net income attributable to our shareholders. | |
8
The following is a breakdown of our total revenues by activity for each of the periods indicated:
| Three Months Ended March 31 | |||||||||
| 2013 | 2012 | ||||||||
| (United States dollars in thousands) | |||||||||
| Gross Revenues | |||||||||
| Commodities and resources | $ | 199,288 | $ | 138,485 | |||||
| Merchant banking | 3,564 | 4,558 | |||||||
| Other | 4,402 | 4,590 | |||||||
| $ | 207,254 | $ | 147,633 | ||||||
The following charts illustrate our revenues by business segment and geographic distribution in the three months ended March 31, 2013:
| Revenues by Business Segment | Revenues by Region |
 |  |
Based upon the average exchange rates for the three months ended March 31, 2013, the United States dollar decreased by approximately 0.7% in value against the Euro and increased approximately 0.8% in value against the Canadian dollar, compared to the average exchange rates for the same period in 2012. As at March 31, 2013, the United States dollar had increased by approximately 2.7% against the Euro and 2.1% against the Canadian dollar since December 31, 2012.
Revenues for the three months ended March 31, 2013 increased by 40.4% to $207.3 million (consisting of net sales of $205.7 million and equity income of $1.5 million) from $147.6 million (consisting of net sales of $146.0 million and equity income of $1.6 million) in the same period of 2012, primarily as a result of increased commodities sales during the three months ended March 31, 2013 and the consolidation of Compton, ACCR and Possehl in the current period. As the Euro was relatively stable during the first quarter of 2013, currency fluctuations had no material impact on our revenues when Euro-denominated revenues were translated into U.S. dollars.
Revenues for our commodities and resources business increased to $199.3 million for the three months ended March 31, 2013, from $138.5 million for the same period in 2012, primarily as a result of increased sales of commodities due to increases in both volumes and prices on some commodities during the three months ended March 31, 2013 and the consolidation of Compton, ACCR and Possehl in the current period. A relatively stable Euro had no impact on our reported commodities revenues when Euro-denominated revenues were translated into U.S. dollars. During the three months ended March 31, 2013, gross revenues generated by the royalty decreased to approximately $3.5 million from approximately $4.4 million in the same period of 2012. This decrease in gross royalty revenue was attributable to a lower tonnage of shipments and prices for iron ore pellets. A total of 392,735 tons and 482,189 tons of iron ore products were shipped during the three months ended March 31, 2013 and 2012, respectively.
Revenues for our merchant banking business were $3.6 million for the three months ended March 31, 2013, compared to $4.6 million for the same period in 2012.
Revenues for our other segment were $4.4 million for the three months ended March 31, 2013, compared to $4.6 million for the same period in 2012.
9
Costs of sales increased to $180.4 million during the three months ended March 31, 2013, from $121.6 million for the same period in 2012, primarily as a result of increased commodities and resource activities, including as a result of the consolidation of Compton, ACCR and Possehl in the current period. The following is a breakdown of our costs of sales for each of the three-month periods ended March 31, 2013 and 2012:
| Three Months Ended March 31, | |||||||||||
| 2013 | 2012 | ||||||||||
| (United States dollars in thousands) | |||||||||||
| Costs of Sales: | |||||||||||
| Commodities and resources | $ | 180,184 | $ | 119,345 | |||||||
| Expiry of exploration and evaluation assets | 2,721 | — | |||||||||
| Recovery of credit losses on loans and receivables | (62 | ) | (9 | ) | |||||||
| Gain (loss) on derivative instruments | (482 | ) | 369 | ||||||||
| Market value increase on commodities, net | (3,770 | ) | — | ||||||||
| Other | 1,807 | 1,920 | |||||||||
| $ | 180,398 | $ | 121,625 | ||||||||
Selling, general and administrative expenses increased to $15.9 million for the three months ended March 31, 2013 from $9.4 million for the same period of 2012, primarily as a result of the consolidation of Compton, ACCR and Possehl in the current period.
During the three months ended March 31, 2013, we incurred finance costs of $4.4 million primarily related to our commodities business, compared to $1.8 million for the three months ended March 31, 2012. The increase in finance costs was a result of borrowings relating to the acquisition of Compton, ACCR and Possehl.
For the three months ended March 31, 2013, we incurred a net foreign currency transaction exchange gain of $0.4 million, compared to $0.8 million in the three months ended March 31, 2012.
During the three months ended March 31, 2012, we also incurred a bargain purchase gain of $2.4 million in connection with the acquisition of KCCL. This was recognized during the measurement period after fair values of the assets were finalized in December 2012. Please refer to Note 14 of our financial statements for the three months ended March 31, 2013 for further information.
We recognized a provision for income taxes (other than resource property revenue taxes) of $0.9 million during the three months ended March 31, 2013, compared to a recovery of income taxes (other than resource property revenue taxes) of $0.3 million during the same period of 2012. Our statutory tax rate was 25.0% during the three months ended March 31, 2013, compared to 25.0% for the same period in 2012. The income tax paid in cash during the three months ended March 31, 2013 was $0.6 million.
We incurred resource property revenue taxes of $0.7 million during the three months ended March 31, 2013, compared to $0.9 million during the same period of 2012. The resource property revenues tax rate was 20% on the gross royalty revenue from our royalty interest, deducted at source, which is reduced by 20% of deductible expenses. The decrease in resource property taxes was primarily as a result of a decrease in gross royalty revenues in the current quarter.
Overall, we recognized an income tax expense of $1.6 million (provision for income taxes of $0.9 million and provision for resource property revenue taxes of $0.7 million) during the three months ended March 31, 2013, compared to $0.6 million (recovery of income taxes of $0.3 million and provision for resource property revenue taxes of $0.9 million) during the same period of 2012.
For the three months ended March 31, 2013, our net income attributable to shareholders was $5.0 million, or $0.08 per share on a basic and diluted basis, compared to $16.9 million, or $0.27 per share on a basic and diluted basis, for the same period in 2012.
Liquidity and Capital Resources
General
Liquidity is of importance to companies in our businesses. Insufficient liquidity often results in underperformance.
10
Our objectives when managing capital are: (i) to safeguard our ability to continue as a going concern so that we can continue to provide returns for shareholders and benefits for other stakeholders, (ii) to provide an adequate return to our shareholders by pricing products and services commensurately with the level of risk, and (iii) to maintain a flexible capital structure which optimizes the cost of capital at acceptable risk. We set the amount of capital in proportion to risk. We manage our capital structure and make adjustments to it in the light of changes in economic conditions and the risk characteristics of the underlying assets. In order to maintain or adjust this capital structure, we may adjust the amount of dividends paid to shareholders, return capital to shareholders, issue new shares or sell assets to reduce debt.
Consistent with others in our industry, we monitor capital on the basis of our debt-to-adjusted capital ratio and long-term debt-to-equity ratio. The debt-to-adjusted capital ratio is calculated as net debt divided by adjusted capital. Net debt is calculated as total debt less cash and cash equivalents. Adjusted capital comprises all components of equity and some forms of subordinated debt, if any. The long-term debt-to-equity ratio is calculated as long-term debt divided by shareholders’ equity. The computations are based on continuing operations. The following table sets forth the calculation of our debt-to-adjusted capital ratio as at each of the periods indicated:
| March 31, | December 31, | ||||||
| 2013 | 2012 | ||||||
| (United States dollars in thousands) | |||||||
| Total debt(1) | $ | 201,956 | $ | 162,993 | |||
| Less: cash and cash equivalents | 341,786 | (273,790 | ) | ||||
| Net debt (net cash and cash equivalents) | (139,830 | ) | (110,797 | ) | |||
| Shareholders’ equity | 754,187 | 757,197 | |||||
| Debt-to-adjusted capital ratio | Not applicable | Not applicable | |||||
| Note: | ||
| (1) | This table does not include the MPP term financing as it involves a purchase option and future processing fees. See “MPP Term Financing”. | |
There were no amounts in accumulated other comprehensive income relating to cash flow hedges, nor were there any subordinated debt instruments as at March 31, 2013 and December 31, 2012. The debt-to-adjusted capital ratio as at March 31, 2013 and December 31, 2012 were not applicable as we had a net cash and cash equivalents balance.
The following table sets forth the calculation of our long-term debt-to-equity ratio as at each of the periods indicated:
| March 31, | December 31, | ||||||||
| 2013 | 2012 | ||||||||
| (United States dollars in thousands) | |||||||||
| Long-term debt(1) | $ | 155,392 | $ | 118,824 | |||||
| Shareholders’ equity | 754,187 | 757,197 | |||||||
| Long-term debt-to-equity ratio | 0.21 | 0.16 | |||||||
| Note: | ||
| (1) | This table does not include the MPP term financing as it involves a purchase option and future processing fees. See “MPP Term Financing”. | |
During the three months ended March 31, 2013, our strategy, which was unchanged from 2012, was to maintain the debt-to-adjusted capital ratio and the long-term debt-to-equity ratio at a low level. We had a net cash and cash equivalent balance after deduction of the total debt. Our long-term debt-to-equity ratio was 0.21 and 0.16 as at March 31, 2013 and December 31, 2012, respectively.
11
Financial Position
The following table sets out our selected financial information as at the dates indicated:
| March 31, | December 31, | ||||||||
| 2013 | 2012 | ||||||||
| (United States dollars in thousands) | |||||||||
| Cash and cash equivalents | $ | 341,786 | $ | 273,790 | |||||
| Short-term securities | 7,402 | 6,658 | |||||||
| Trade receivables | 72,308 | 72,820 | |||||||
| Other receivables | 9,758 | 18,314 | |||||||
| Inventories | 126,178 | 142,925 | |||||||
| Assets held for sale | 112,700 | 128,657 | |||||||
| Total assets | 1,385,696 | 1,381,489 | |||||||
| Working capital | 393,604 | 345,348 | |||||||
| Short-term bank borrowings | 181,536 | 150,396 | |||||||
| Long-term debt(1) | 155,392 | 118,824 | |||||||
| Shareholders’ equity | 754,187 | 757,197 | |||||||
| Note: | ||
| (1) | This amount does not include the MPP term financing as it involves a purchase option and future processing fees. See “MPP Term Financing”. | |
We maintain an adequate level of liquidity, with a portion of our assets held in cash and cash equivalents and securities. The liquid nature of these assets provides us with flexibility in managing and financing our business and the ability to realize upon investment or business opportunities as they arise. We also use this liquidity in client-related services by acting as a financial intermediary for third parties (e.g., by acquiring a position or assets and reselling such position or assets) and for our own proprietary trading and investing activities.
As at March 31, 2013, cash and cash equivalents were $341.8 million, compared to $273.8 million as at December 31, 2012. The increase in cash was primarily a result of cash flows from operating and financing activities. We had assets held for sale of $112.7 million as at March 31, 2013, representing certain non-core assets held by Compton, compared to $128.7 million as at December 31, 2012. As at March 31, 2013, short-term securities increased to $7.4 million from $6.7 million as at December 31, 2012. Trade receivables were $72.3 million and $72.8 million, respectively, as at March 31, 2013 and December 31, 2012. We had other receivables of $9.8 million as at March 31, 2013, compared to $18.3 million as at December 31, 2012. The decrease in other receivables was primarily a result of collections. The value of our inventories decreased to $126.2 million as at March 31, 2013, compared to $142.9 million as at December 31, 2012. The decrease in inventories were primarily due to unwinding sales and repurchase arrangements. The value of real estate held for sale was $11.9 million as at March 31, 2013, compared to $12.2 million as at December 31, 2012. The value of deposits, prepaid and other assets was $25.0 million as at March 31, 2013, compared to $27.8 million as at December 31, 2012.
Short-Term Bank Loans and Facilities
As part of our operations, we establish, utilize and maintain various kinds of credit lines and facilities with banks and insurers. Most of these facilities are short-term. These facilities are used for day-to-day business and structured financing activities in commodities. The amounts drawn under such facilities fluctuate with the kind and level of transactions being undertaken.
As at March 31, 2013, we had credit facilities aggregating $405.2 million as follows: (i) we had unsecured revolving credit facilities aggregating $177.3 million from banks; (ii) we had revolving credit facilities aggregating $51.8 million from banks for structured solutions, a special trade financing. The margin is negotiable when the facility is used; (iii) we had a non-recourse factoring arrangement with a bank for up to a credit limit of $119.4 million for our commodities activities. We may factor our commodity receivable accounts upon invoicing at the inter-bank rate plus a margin; and (iv) we had a foreign exchange credit facility of $56.6 million with a bank. All of these facilities are renewable on a yearly basis.
12
Long-Term Debt
Other than lines of credit drawn and as may be outstanding for trade financing and commodities and structured solutions activities, as of March 31, 2013, the maturities of long-term debt were as follows:
| Maturity | Principal | Interest | ||||
| (United States dollars | ||||||
| in thousands) | ||||||
| 12 months | $ | 46,564 | $ | 4,349 | ||
| 12 to 36 months | 59,719 | 5,791 | ||||
| 36 to 60 months | 56,605 | 3,109 | ||||
| After 60 months | 39,068 | 1,409 | ||||
| $ | 201,956 | $ | 14,658 | |||
During the three months ended March 31, 2013, we incurred additional borrowings, consisting of $44.4 million of new long-term debt.
We expect our maturing debt to be satisfied primarily through the settlement of underlying commodities transactions, trade financing transactions, including structured solutions transactions, cash on hand and cash flow from operations. Much of our maturing debt may either subsequently be made re-available to us by the applicable financial institution or we may replace such facilities with new facilities depending upon particular capital requirements.
MPP Term Financing
As at March 31, 2013, we had liabilities under the MPP term financing totaling $15.8 million as a result of our consolidation of Compton in the third quarter of 2012, comprised of the present value of monthly base processing fees, the outstanding purchase option and unamortized financing fees. MPP is a limited partnership organized under the laws of the Province of Alberta and owns certain midstream facilities, including natural gas plants and pipelines in southern Alberta, through which Compton processes a significant portion of its production from the surrounding area. The arrangements with MPP are governed by agreements which provide for:
| a. | Compton’s management of the midstream facility; | ||
| b. | the payment to MPP of a base processing fee and the reimbursement of MPP’s net out-of-pocket costs; | ||
| c. | the dedication through April 30, 2024 of production and reserves from the defined area through the facilities; and | ||
| d. | an option to purchase the MPP partnership at a predetermined amount on April 30, 2014. | ||
Notice of exercise of the above purchase option has been provided to the respective counterparties.
Cash Flows
Due to the type of businesses we engage in, our cash flows are not necessarily reflective of net earnings and net assets for any reporting period. As a result, instead of using a traditional cash flow analysis solely based on cash flows statements, our management believes it is more useful and meaningful to analyze our cash flows by the overall liquidity and credit availability. Please see the discussion on our financial position, short-term bank loans, facilities and long-term debt earlier in this section.
The global commodity supply chain business can be cyclical and our cash flows vary accordingly. Our principal operating cash expenditures are for financing trading of securities, commodities financing and general and administrative expenses.
Working capital levels fluctuate throughout the year and are affected by the level of our commodities operations, the markets and prices for commodities and the timing of receivables and the payment of payables and expenses. Changes in the volume of commodities transactions can affect the level of receivables and influence overall working capital levels. We have a sufficient level of cash on hand and credit facility amounts. We believe that we have sufficient cash flows from operations, cash on hand and credit availability to meet our working capital and other requirements and to meet unexpected cash demands.
13
Cash Flows from Operating Activities
Operating activities provided cash of $28.4 million for the three months ended March 31, 2013, compared to using cash of $24.9 million for the same period in 2012. An increase in short-term borrowing provided cash of $36.0 million in the three months ended March 31, 2013, compared to a decrease in such borrowing using cash of $6.6 million in the same period of 2012. A decrease in accounts payable and accrued expenses used cash of $18.4 million in the three months ended March 31, 2013, compared to an increase in accounts payable and accrued expenses providing cash of $8.7 million in the same period of 2012. An increase of inventories used cash of $10.9 million in the three months ended March 31, 2013, compared to $4.5 million in the same period of 2012. A decrease in receivables provided cash of $6.9 million in the three months ended March 31, 2013, compared to an increase in receivables using cash of $34.6 million in the same period of 2012. A decrease in deposits, prepaid and other, primarily as a result of decreases in the prepayment and deposits for inventories, provided cash of $3.1 million in the three months ended March 31, 2013, compared to an increase in contract deposits, prepaid and other using cash of $1.1 million for the same period in 2012. Changes in short-term securities provided cash of $42,000 during the three months ended March 31, 2013, compared to $1.6 million for the same period in 2012. A decrease in decommissioning obligations used cash of $0.6 million in the three months ended March 31, 2013, compared to $nil in the same period of 2012. A decrease in restricted cash provided $0.6 million in the three months ended March 31, 2013, compared to an increase in restricted cash using $28,000 in the same period of 2012. A decrease in accrued pension liabilities used cash of $0.1 million in the three months ended March 31, 2013, compared to $nil in the same period of 2012. An increase in income tax liabilities provided cash of $0.2 million in the three months ended March 31, 2013, compared to a decrease in income tax liabilities using cash of $1.7 million in the same period of 2012. Deferred sale liabilities used $nil in the three months ended March 31, 2013, compared to a decrease in deferred sales liabilities in the normal course of business using cash of $9.6 million in the same period of 2012.
Cash Flows from Investing Activities
Investing activities provided cash of $3.3 million in the three months ended March 31, 2013, compared to using $8.6 million in the same period of 2012, primarily from net dispositions of long-term investments, partially offset by purchases of property, plant and equipment and hydrocarbon assets. The acquisition of subsidiaries, net of cash acquired, used cash of $nil in the three months ended March 31, 2013, compared to $28.0 million in the same period of 2012. Purchases of property, plant and equipment (net) used cash of $1.1 million in the three months ended March 31, 2013, compared to $78,000 in the same period of 2012. The increase in purchases of property, plant and equipment (net) was primarily a result of our relocation of Compton’s office in Calgary, Alberta. Purchases of long-term securities (including equity method investments) used cash of $1.1 million in the three months ended March 31, 2013, compared to $2.6 million in the same period in 2012. Proceeds from sales of long-term investments provided cash of $3.4 million in the three months ended March 31, 2013, compared to $0.4 million in the same period of 2012. During the three months ended March 31, 2013, a decrease in a loan receivable provided cash of $nil, compared to $19.9 million in the same period of 2012. Other items provided cash of $1.9 million (primarily consisting of net distributions of $1.9 million from our joint ventures) in the three months ended March 31, 2013, compared to $1.8 million in the same period of 2012.
Cash Flows from Financing Activities
Net cash provided by financing activities was $38.1 million for the three months ended March 31, 2013, compared to using $28.6 million for the same period in 2012. During the three months ended March 31, 2013, we borrowed $44.4 million and reduced the amount of the MPP term financing by $2.6 million. Debt repayments used cash of $25.5 million in the three months ended March 31, 2012. Dividends paid to shareholders in the three months ended March 31, 2013 and 2012 used cash of $3.8 million and $3.1 million, respectively.
Future Liquidity
We had no material commitments to acquire assets or operating businesses as at March 31, 2013. We expect that there will be acquisitions of businesses or commitments to projects in the future. To achieve the long-term goals of expanding our assets and earnings, including through acquisitions, capital resources will be required. Depending on the size of a transaction, the capital resources that will be required can be substantial. The necessary resources will be generated from cash flows from operations, cash on hand, borrowings against our assets, sales of proprietary investments or the issuance of securities.
14
Foreign Currency
Substantially all of our operations are conducted in international markets and our consolidated financial results are subject to foreign currency exchange rate fluctuations.
Our reporting currency is the United States dollar. We translate foreign subsidiaries’ assets and liabilities into United States dollars at the rate of exchange on the balance sheet date. Revenues and expenses are translated at exchange rates approximating those at the date of the transactions. As a substantial amount of revenues are received in Euros, Chinese yuans and Canadian dollars, the financial position for any given period, when reported in United States dollars, can be significantly affected by the exchange rates for Euros, Chinese yuans and Canadian dollars prevailing during that period.
In the three months ended March 31, 2013, we reported approximately a net $4.5 million currency translation adjustment loss under other comprehensive income within equity, compared to a gain of $1.5 million in the same period of 2012.
Contractual Obligations
The following table sets out our contractual obligations and commitments as at December 31, 2012 in connection with our long-term liabilities.
| Payments Due by Period(1) | |||||||||||||||||||||||||||
| (United States dollars in thousands) | |||||||||||||||||||||||||||
| Less than | More than | ||||||||||||||||||||||||||
| Contractual Obligations(2)(3) | 1 Year | 1 – 3 Years | 3 – 5 Years | 5 Years | Total | ||||||||||||||||||||||
| Long-term debt obligations | $ | 48,408 | $ | 52,280 | $ | 46,784 | $ | 29,798 | $ | 177,270 | |||||||||||||||||
| Operating lease obligations | 2,910 | 4,566 | 2,674 | — | 10,150 | ||||||||||||||||||||||
| Purchase obligations | 25,294 | — | — | — | 25,294 | ||||||||||||||||||||||
| Puttable Instruments | — | 7,761 | — | — | 7,761 | ||||||||||||||||||||||
| Total | $ | 76,612 | $ | 64,607 | $ | 49,458 | $ | 29,798 | $ | 220,475 | |||||||||||||||||
Notes: | ||
(1) | Undiscounted. | |
(2) | The table does not include non-financial instrument liabilities and guarantees. | |
(3) | The table does not include provisions for warranty and decommissioning obligations as such obligations may involve performance of physical activities and work. | |
There have been no significant changes to the foregoing since December 31, 2012, with the exception of $44.4 million of additional borrowings during the current quarter. Please see “Long-Term Debt”.
Risk Management
Risk is an inherent part of our business and operating activities. The extent to which we properly and effectively identify, assess, monitor and manage each of the various types of risk involved in our activities is critical to our financial soundness and profitability. We seek to identify, assess, monitor and manage the following principal risks involved in our business activities: market, credit, liquidity, operational, legal and compliance, new business, reputational and other. Risk management is a multi-faceted process that requires communication, judgment and knowledge of financial products and markets. Our management takes an active role in the risk management process and requires specific administrative and business functions to assist in the identification, assessment and control of various risks. Our risk management policies, procedures and methodologies are fluid in nature and are subject to ongoing review and modification.
Inflation
We do not believe that inflation has had a material impact on our revenues or income over the past two fiscal years. However, increases in inflation could result in increases in our expenses, which may not be readily recoverable in the price of services provided to our clients. To the extent that inflation results in rising interest rates and has other adverse effects on capital markets, it could adversely affect our financial position and profitability.
15
Application of Critical Accounting Policies
The preparation of financial statements in conformity with IFRS requires our management to make estimates and assumptions that affect the reported amounts of assets and liabilities and disclosure of contingent assets and liabilities at the date of the financial statements and the reported amounts of revenues and expenses during the reporting periods.
Our management routinely makes judgments and estimates about the effects of matters that are inherently uncertain. As the number of variables and assumptions affecting the probable future resolution of the uncertainties increase, these judgments become even more subjective and complex. We have identified certain accounting policies that are the most important to the portrayal of our current financial condition and results of operations. Please refer to Note 1 of our audited financial statements for the year ended December 31, 2012 for a discussion of significant accounting policies.
The following accounting policies are the most important to our ongoing financial condition and results of operations:
Inventories
Our inventories consist of raw materials, work-in-progress and finished goods.
In general, inventories are recorded at the lower of cost or estimated net realizable value. Commodities acquired in commodity broker-trader activities with the purpose of selling them in the near future and generating a profit from fluctuations in price or margin are measured at fair value less costs to sell. Accordingly, our management must make estimates about their pricing when establishing the appropriate provisions for inventories. For the finished goods and commodity inventories, the estimated net selling price is the most important determining factor. However, our management also considers whether there are any alternatives to enhance the value of the finished goods by various marketing strategies and channels. Actual selling price could differ from the estimated selling price, and such differences could be material.
Receivables
Receivables are financial instruments that are not classified as held for trading or available for sale. They are net of an allowance for credit losses, if any. We perform ongoing credit evaluations of customers and adjust our allowance accounts for specific customer risks and credit factors. Receivables are considered past due on an individual basis based on the terms of the contracts. Our allowance for credit losses is maintained at an amount considered adequate to absorb estimated credit-related losses. Such allowance reflects our management’s best estimate of the losses in our receivables and judgments about economic conditions. As at March 31, 2013, we had recognized receivables (including trade and other) aggregating $82.1 million.
Valuation of Securities
Securities held for trading are carried at current market value. Any unrealized gains or losses on securities held for trading are included in our results of operations.
Available-for-sale securities are also carried at current market value when current market value is available. Any unrealized gains or losses are included in other comprehensive income. When there is any objective evidence that an available-for-sale security is other than a temporary decline, the security will be written down to recognize the loss in the determination of income. In determining whether the decline in value is other than temporary, quoted market price is not the only deciding factor, particularly for thinly traded securities, large block holdings and restricted shares. We consider, but such consideration is not limited to, the following factors: (i) the trend of the quoted market price and trading volume; (ii) the investee’s financial position and results for a period of years; (iii) any liquidity or going concern problems of the investee; (iv) changes in or reorganization of the investee and/or its future business plan; (v) the outlook of the investee’s industry; (vi) the current fair value of the investment (based upon an appraisal thereof) relative to its carrying value; (vii) our business plan and strategy to divest the security or to restructure the investee; and (viii) the extent and/or duration of the decline in market value.
Recent market volatility has made it extremely difficult to value certain securities. Subsequent valuations, in light of factors prevailing at such time, may result in significant changes in the values of these securities in future periods. Any of these factors could require us to recognize further impairments in the value of our securities portfolio, which may have an adverse effect on our results of operations in future periods.
16
Impairment of Non-Financial Assets
We assess at the end of each reporting period whether there is any indication that an asset may be impaired. If any such indication exists, we shall estimate the recoverable amount of the asset. In assessing whether there is any indication that an asset may be impaired, we consider, as a minimum, the following indications:
External sources of information
| (a) | during the period, an asset’s market value has declined significantly more than would be expected as a result of the passage of time or normal use; | ||
| (b) | significant changes with an adverse effect on the entity have taken place during the period, or will take place in the near future, in the technological, market, economic or legal environment in which the entity operates or in the market to which an asset is dedicated; | ||
| (c) | market interest rates or other market rates of return on investments have increased during the period, and those increases are likely to affect the discount rate used in calculating an asset’s value in use and decrease the asset’s recoverable amount materially; | ||
| (d) | the carrying amount of the net assets of the entity is more than its market capitalization; | ||
Internal sources of information
| (e) | evidence is available of obsolescence or physical damage of an asset; | ||
| (f) | significant changes with an adverse effect on the entity have taken place during the period, or are expected to take place in the near future, in the extent to which, or manner in which, an asset is used or is expected to be used. These changes include the asset becoming idle, plans to discontinue or restructure the operation to which an asset belongs, plans to dispose of an asset before the previously expected date, and reassessing the useful life of an asset as finite rather than indefinite; and | ||
| (g) | evidence is available from internal reporting that indicates that the economic performance of an asset is, or will be, worse than expected. | ||
Provisions for Decommissioning Obligations
Our provisions for decommissioning obligations represent management’s best estimate of the present value of the future cash outflows required to settle the liability which reflects estimates of future costs, inflation, movements in foreign exchange rates and assumptions of risks associated with the future cash outflows, and the applicable risk-free interest rates for discounting the future cash outflows. Changes in the above factors can result in a change to the provision recognized by us.
Changes to decommissioning obligations are recorded with a corresponding change to the carrying amounts of related properties. Adjustments to the carrying amounts of related properties can result in a change to future depletion expense.
Income Taxes
Management believes that it has adequately provided for income taxes based on all of the information that is currently available. The calculation of income taxes in many cases, however, requires significant judgment in interpreting tax rules and regulations, which are constantly changing.
Our tax filings are also subject to audits, which could materially change the amount of current and future income tax assets and liabilities. Any change would be recorded as a charge or a credit to income tax expense. Any cash payment or receipt would be included in cash from operating activities.
We currently have deferred tax assets which are comprised primarily of tax loss carry-forwards and deductible temporary differences, both of which will reduce taxable income in the future. The amounts recorded for deferred tax are based upon various judgments, assumptions and estimates. We assess the realization of these deferred tax assets on a periodic basis to determine to what extent that is probable that taxable profit will be available against which the deductible temporary differences and the carry-forward of unused tax credits and unused tax losses can be utilized. We determine whether it is probable that all or a portion of the deferred tax assets will be realized, based on currently available information, including, but not limited to, the following:
- the history of the tax loss carry-forwards and their expiry dates;
- future reversals of temporary differences;
17
- our projected earnings; and
- tax planning opportunities.
On the reporting date, we also reassess unrecognized deferred tax assets. We recognize a previously unrecognized deferred tax asset to the extent that it has become probable that future taxable profit will allow the deferred tax asset to be recovered.
We provide for future liabilities in respect of uncertain tax positions where additional tax may become payable in future periods and such provisions are based on our management’s assessment of exposures. We did not recognize the full deferred tax liability on taxable temporary differences associated with investments in subsidiaries, joint ventures and associates where we are able to control the timing of the reversal of the temporary differences and it is probable that the temporary differences will not reverse in the foreseeable future. We may change our investment decision in the normal course of our business, thus resulting in additional tax liability.
New Standards and Interpretations Not Yet Adopted
The following new accounting standards and amendments are expected to have significant effects on the Group’s accounting policies, financial position and/or financial statement presentation for periods after 2013.
IFRS 9,Financial Instruments, replaces IAS, 39,Financial Instruments: Recognition and Measurement. IFRS 9 uses a single approach to determine whether a financial asset is measured at amortized cost or fair value. The approach in IFRS 9 is based on how an entity manages its financial instruments (its business model) and the contractual cash flow characteristics of the financial assets. The new standard also requires a single impairment method to be used, replacing the many different impairment methods in IAS 39. Pursuant to IFRS 9, an entity choosing to measure a liability at fair value will present the portion of the change in its fair value due to changes in the entity’s own credit risk in other comprehensive income, rather than in the profit or loss. New requirements for the derecognition of financial instruments, impairment and hedge accounting are expected to be added to IFRS 9. In December 2011, the IASB issued amendments to IFRS 9 that defer the mandatory effective date from January 1, 2013 to January 1, 2015. The deferral will make it possible for all phases of the project to have the same mandatory effective date. The amendments also provide relief from the requirement to restate comparative financial statements for the effect of applying IFRS 9. Additional transition disclosures will be required to help investors understand the effect that the initial application of IFRS 9 has on the classification and measurement of financial instruments. Early application of IFRS 9 is still permitted.
The following new standards and amendments were issued by the IASB that are mandatory for our 2013 accounting year:
IFRS 10,Consolidated Financial Statements(“IFRS 10”),establishes principles for the presentation and preparation of consolidated financial statements when an entity controls one or more other entities. IFRS 10 supersedes IAS 27 (Revised),Consolidated and Separate Financial Statements,and SIC-12,Consolidation – Special Purpose Entities.
IFRS 11,Joint Arrangements(“IFRS 11”),establishes principles for financial reporting by entities that have an interest in arrangements that are controlled jointly (i.e. joint arrangements). IFRS 11 supersedes IAS 31,Interests in Joint Ventures,and SIC-13,Jointly Controlled Entities - Non-Monetary Contributions by Venturers.
IFRS 12,Disclosure of Interests in Other Entities(“IFRS 12”),applies to entities that have an interest in a subsidiary, a joint arrangement, an associate or an unconsolidated structured entity. The objective of this IFRS is to require an entity to disclose information that enables users of its financial statements to evaluate: (a) the nature of, and risks associated with, its interests in other entities; and (b) the effects of those interests on its financial position, financial performance and cash flows.
IAS 27,Separate Financial Statements(“IAS 27”), has been amended for the issuance of IFRS 10 but retains the current guidance for separate financial statements. IAS 28,Investments in Associates and Joint Ventures(“IAS 28”), has been amended for conforming changes based on the issuance of IFRS 10 and IFRS 11.
IFRS 13,Fair Value Measurement(“IFRS 13”),(a) defines fair value; (b) sets out in a single IFRS a framework for measuring fair value; and (c) requires disclosures about fair value measurements.
Amendments, set out inPresentation of Items of Other Comprehensive Income¸ were issued to amend IAS 1,Presentation of Financial Statements.The amendments require the grouping of items of other comprehensive income into items that might be reclassified to profit or loss in subsequent periods and items that will not be reclassified to profit or loss in subsequent periods.
18
The adoption of these new standards and amendments did not have any recognition or measurement impacts on our consolidated financial statements, except for additional disclosures. Please refer to Note 3 of our financial statements for the three months ended March 31, 2013 for further information regarding the above new standards and amendments and their impact on our accounting policies.
Off-Balance Sheet Arrangements
We do not have any off-balance sheet arrangements that have or are reasonably likely to have a current or future effect on our financial condition, changes in financial condition, revenues or expenses, results of operations, liquidity, capital expenditures or capital resources that are material to investors.
We have outstanding issued guarantees held by our trading and financial partners in connection with our commodities and resources activities. As of March 31, 2013, we had issued guarantees of up to a maximum of $18.2 million, of which $9.6 million were outstanding and have not been recorded as liabilities in the consolidated statement of financial position. There has been no claim against the guarantees.
Transactions with Related Parties
Other than as disclosed herein, to the best of our knowledge, there have been no material transactions or loans, between December 31, 2012 and March 31, 2013, between our company and: (a) enterprises that directly or indirectly through one or more intermediaries, control or are controlled by, or are under common control with, our company; (b) associates; (c) individuals owning, directly or indirectly, an interest in the voting power of our company that gives them significant influence over our company, and close members of any such individual’s family; (d) key management personnel of our company, including directors and senior management of our company and close members of such individuals’ families; and (e) enterprises in which a substantial interest in the voting power is owned, directly or indirectly, by any person described in (c) or (d) or over which such a person is able to exercise significant influence.
In the normal course of operations, we may enter into transactions with related parties which include, among others, affiliates whereby we have a significant equity interest (10% or more) in the affiliates or have the ability to influence the affiliates’ or our operating and financing policies through significant shareholding, representation on the board of directors, corporate charter and/or bylaws. The affiliates also include certain of our directors, our President, Chief Executive Officer, Chief Financial Officer, Chief Operating Officer and their close family members. These related party transactions are made in arm’s length transactions at normal market prices and on normal commercial terms.
In addition to transactions disclosed elsewhere in our unaudited financial statements for the three months ended March 31, 2013 and in this interim report, we had the following transactions with affiliates during the three months ended March 31, 2013:
| (United States | ||||||
| dollars in thousands) | ||||||
| Net sales | $ | 358 | ||||
| Dividend income | 131 | |||||
| Royalty expense paid and payable | (86 | ) | ||||
Financial and Other Instruments
We are exposed to various market risks from changes in interest rates, foreign currency exchange rates and equity prices, which may affect our results of operations and financial condition and, consequently, our fair value. Generally, our management believes that our current financial assets and financial liabilities, due to their short-term nature, do not pose significant financial risks. We use various financial instruments to manage our exposure to various financial risks. The policies for controlling the risks associated with financial instruments include, but are not limited to, standardized company procedures and policies on matters such as hedging of risk exposures, avoidance of undue concentration of risk and requirements for collateral (including letters of credit) to mitigate credit risk. We have risk managers to perform audits and checking functions to ensure that company procedures and policies are complied with.
We use derivative instruments to manage certain exposures to currency exchange rate risks. The use of derivative instruments depends on our management’s perception of future economic events and developments. These types of derivative instruments are generally highly speculative in nature. They are also very volatile as they are highly leveraged given that margin requirements are relatively low in proportion to notional amounts.
19
Many of our strategies, including the use of derivative instruments and the types of derivative instruments selected by us, are based on historical trading patterns and correlations and our management’s expectations of future events. However, these strategies may not be fully effective in all market environments or against all types of risks. Unexpected market developments may affect our risk management strategies during this time and unanticipated developments could impact our risk management strategies in the future. If any of the variety of instruments and strategies we utilize is not effective, we may incur losses.
Please refer to Note 39 of our annual consolidated financial statements for the year ended December 31, 2012 for a qualitative and quantitative discussion of our exposure to market risks.
Outstanding Share Data
Our share capital consists of an unlimited number of common shares, class A common shares, and class A preference shares, issuable in series. Our common shares are listed on the New York Stock Exchange under the symbol “MIL”. As of the date hereof, we have 62,552,126 common shares outstanding.
Acquired Businesses
As described herein, in 2012, we acquired 100% of Compton and controlling interests in each of ACCR, Possehl and KCCL. The businesses acquired pursuant to such acquisitions have been excluded from management’s report on internal control over financial reporting as there was not sufficient time to complete an assessment of the internal controls of such businesses between the date of the acquisition and the date of management’s assessment of internal controls. The combined financial statements of these entities represent 50% of our total assets, 42% of our net assets, 11% of our net revenues and 3% of our net income as of and for the year ended December 31, 2012. See “Results of Operations” and “Liquidity and Capital Resources” for further information.
Disclosure Controls and Procedures
We maintain a set of disclosure controls and procedures designed to ensure that information required to be disclosed is recorded, processed, summarized and reported within the time periods specified in provincial securities legislation. We evaluated our disclosure controls and procedures as defined under National Instrument 52-109 as at March 31, 2013. This evaluation was performed by our Chief Executive Officer and Chief Financial Officer. Based on this evaluation, our Chief Executive Officer and Chief Financial Officer concluded that the design and operation of these disclosure controls and procedures were effective.
Changes in Internal Controls over Financial Reporting
We maintain internal controls over financial reporting which have been designed to provide reasonable assurance of the reliability of external financial reporting in accordance with IFRS as required by National Instrument 52-109.
There were no changes in our internal control over financial reporting that occurred during the three months ended March 31, 2013 that have materially affected, or are reasonably likely to materially affect, our internal control over financial reporting.
Cautionary Statement Regarding Forward-Looking Information and Risk Factors and Uncertainties
Statements in this report that are not reported financial results or other historical information are “forward-looking statements” within the meaning of applicable securities legislation including thePrivate Securities Litigation Reform Act of1995, as amended. These statements appear in a number of different places in this report and can be identified by words such as “anticipate”, “could”, “project”, “should”, “expect”, “seek”, “may”, “intend”, “likely”, “will”, “plan”, “estimate”, “believe” and similar expressions suggesting future outcomes or statements regarding an outlook or their negative or other comparable words. Also discussions of strategy that involve risks and uncertainties share this “forward-looking” character.
Forward-looking statements include statements regarding:
- future growth;
- futures results of operations, performance, business prospects and opportunities;
- our markets;
- production, demand and prices for products and services, including iron ore, hydrocarbons and othercommodities;
20
- capital expenditures;
- the economy;
- foreign exchange rates; and
- derivatives.
You are cautioned that any forward-looking statements are not guarantees and may involve risks and uncertainties. Our actual results may differ materially from those in the forward-looking statements due to risks facing us or due to actual facts differing from the assumptions underlying our estimates. Some of these risks and assumptions include those set forth in reports and other documents we have filed or furnished with the SEC and Canadian securities regulators including in our annual report on Form 20-F for the year ended December 31, 2012. We advise you that these cautionary remarks expressly qualify in their entirety all forward-looking statements attributable to us or persons acting on our behalf. Unless required by law, we do not assume any obligations to update forward-looking statements based on unanticipated events or changes to expectations. However, you should carefully review the reports and other documents we file from time to time with the SEC and Canadian securities regulators.
In addition to the risks and uncertainties set forth in our annual report on Form 20-F for the year ended December 31, 2012 filed with the SEC and Canadian securities regulators, you should also carefully consider the following risks and uncertainties in evaluating our company and our business before making any investment decisions. Our business, operating and financial condition could be harmed due to any of the following risks.
Risk Factors Relating to Our Business
Our financial results may fluctuate substantially from period to period.
We expect our business to experience significant periodic variations in its revenues and results of operations in the future. These variations may be attributed in part to the fact that our merchant banking revenues are often earned upon the successful completion of a transaction, the timing of which is uncertain and beyond our control. In many cases, we may receive little or no payment for engagements that do not result in the successful completion of a transaction. Additionally, through our merchant banking business, we seek to acquire undervalued assets where we can use our experience and management to realize upon the value. Often we will hold or build upon these assets over time and we cannot predict the timing of when these assets’ values may be realized. As a result, we are unlikely to achieve steady and predictable earnings, which could in turn adversely affect our financial condition and results of operations.
Our earnings and, therefore, our profitability, may be affected by commodities price volatility.
The majority of our revenue from our global commodity supply chain business is derived from the sale of commodities, including metals, hydrocarbons and other materials. As a result, our earnings are directly related to the prices of these commodities. In addition, our revenues from our iron ore and natural gas interests are directly connected to the prices of such commodities. There are many factors influencing the price of metals, hydrocarbons and other commodities, including: expectations for inflation; global and regional demand and production; political and economic conditions; and production costs in major producing regions. These factors are beyond our control and are impossible for us to predict. Changes in the prices of iron ore, hydrocarbons, metals and other commodities may adversely affect our operating results.
A weak global economy can adversely affect our business and financial results and have a material adverse effect on our liquidity and capital resources.
Our business, by its nature, does not produce predictable earnings, and it may be materially affected by conditions in the global financial markets and economic conditions generally.
Global prices for our commodities are influenced strongly by international demand and global economic conditions. Uncertainties or weaknesses in global economic conditions, including the ongoing sovereign debt crisis in Europe, could adversely affect our business and negatively impact our financial results. In addition, the current level of international demand for certain of our commodities, including iron ore, used in steel production is driven largely by industrial growth in China. If the economic growth rate in China slows for an extended period of time, or if another global economic downturn were to occur, we would likely see decreased demand for
21
such products and decreased prices, resulting in lower revenue levels and decreasing margins. We are not able to predict whether the global economic conditions will continue or worsen and the impact it may have on our operations and the industry in general going forward.
Market deterioration and weakness can result in a material decline in the number and size of the transactions that we execute for our own account and for our clients and to a corresponding decline in our revenues. Any market weakness can further result in losses to the extent that we own assets in such market.
The global commodity supply chain and merchant banking businesses are highly competitive.
All aspects of the global commodity supply chain and merchant banking businesses are highly competitive, and we expect them to remain so.
Our competitors include merchant and investment banks, brokerage firms, commercial banks, private equity firms, hedge funds, financial advisory firms and natural resource and mineral royalty companies. Many of our competitors have substantially greater capital and resources, including access to commodities supply, than we do. We believe that the principal factors affecting competition in our business include transaction execution, our products and services, client relationships, reputation, innovations, credit worthiness and price. We have experienced price competition in some of our trading business.
The scale of our competitors has increased in recent years as a result of substantial consolidation. These firms have the ability to offer a wider range of products than we do, which may enhance their competitive position. They also have the ability to support their business with other financial services such as commercial lending in an effort to gain market share, which has resulted, and could further result, in pricing pressure in our businesses.
If we are unable to compete effectively with our competitors, our business and results of operations will be adversely affected.
The operation of the iron ore mine underlying our royalty interest is generally determined by a third party operator and we have no decision making power as to how the property is operated. In addition, we have no or very limited access to technical or geological data respecting the mine including as to reserves. The operator’s failure to perform or other operating decisions made by the operator, including scaling back or ceasing operations, could have a material adverse effect on our revenue, results of operations and financial condition.
The commodities and resources segment of our business includes our indirect royalty interest in the iron ore mine. The revenue derived from the interest is based on production generated by the mine’s third party operator. The operator generally has the power to determine the manner in which the iron ore is exploited, including decisions to expand, continue or reduce production from the mine, and decisions about the marketing of products extracted from the mine. The interests of the third party operator and our interests may not always be aligned. As an example, it will, in almost all cases, be in our interest to advance production as rapidly as possible in order to maximize near-term cash flow, while the third party operator may, in many cases, take a more cautious approach to development, as it is at risk with respect to the cost of development and operations. Our inability to control the operations of the mine can adversely affect our profitability, results of operations and financial condition. Similar adverse effects may result from any other interests we may acquire that are primarily operated by a third party operator.
To the extent that we retain our current indirect royalty interest, we will be dependent to a large extent upon the financial viability and operational effectiveness of owners and operators of our interests. Payments from production generally flow through the operator and there is a risk of delay and additional expense in receiving such revenues. Payments may be delayed by restrictions imposed by lenders, delays in the sale or delivery of products, accidents, the recovery by operators of expenses incurred in the operation of any royalty properties, the establishment by operators of reserves for such expenses or the insolvency of an operator. Our rights to payment under the royalties will likely have to be enforced by contract. This may inhibit our ability to collect outstanding royalties upon a default. Failure to receive any payments from the owners and operators of mines in which we have or may acquire a royalty interest may result in a material and adverse effect on our profitability, results of operations and financial condition.
To the extent grantors of royalties and other interests do not abide by their contractual obligations, we may be forced to take legal action to enforce our contractual rights. Such litigation may be time consuming and costly, and, as with all litigation, there is no guarantee of success. Should any such decision be determined adversely to us, such decision may have a material and adverse effect on our profitability, results of operations and financial condition.
22
In addition, we have no or very limited access to technical, geological data relating to the mine, including data as to reserves, nor have we received a NI 43-101 compliant technical report in respect of the mine. As such, we cannot independently determine reserve amounts or the estimated life of the mine and are instead wholly dependent on the determination of the reserves by the operator of the mine. We can provide no assurances as to the level of reserves at the mine. If the operator of the mine determines there are insufficient reserves to economically operate the mine, it may scale back or cease operations, which could have a material adverse effect on our profitability, results of operations and financial condition.
The profitability of our global commodity supply chain operations depends, in part, on the availability of adequate sources of supply.
Our global commodity supply chain business relies on, among other things, numerous outside sources of supply for our operations. These suppliers generally are not bound by long-term contracts and will have no obligation to provide commodities to us in the future. In periods of low industry prices, suppliers may elect to hold commodities to wait for higher prices or intentionally slow their activities. If a substantial number of suppliers cease selling commodities to us, we will be unable to source and/or execute commodities transactions at desired levels and our results of operations and financial condition could be materially adversely affected.
We may face a lack of suitable acquisition or merger or other proprietary investment candidates, which may limit our growth.
In order to grow our business, we may seek to acquire, merge with or invest in new companies or opportunities. Our failure to make acquisitions or investments may limit our growth. In pursuing acquisition and investment opportunities, we face competition from other companies having similar growth and investment strategies, many of which may have substantially greater resources than us. Competition for these acquisitions or investment targets could result in increased acquisition or investment prices, higher risks and a diminished pool of businesses, services or products available for acquisition or investment.
Strategic investments or acquisitions and joint ventures, or our entry into new business areas, may result in additional risks and uncertainties in our business.
We have grown and intend to continue to grow our business both through internal expansion and through strategic investments, acquisitions or joint ventures. When we make strategic investments or acquisitions or enter into joint ventures, we expect to face numerous risks and uncertainties in combining or integrating the relevant businesses and systems, including the need to combine accounting and data processing systems and management controls and to integrate relationships with customers and business partners.
Acquisitions also frequently result in recording of goodwill and other intangible assets, which are subject to potential impairments in the future that could have a material adverse effect on our operating results. Furthermore, the costs of integrating acquired businesses (including restructuring charges associated with the acquisitions, as well as other acquisition costs, such as accounting fees, legal fees and investment banking fees) could significantly impact our operating results.
Although we perform due diligence on the businesses we purchase, in light of the circumstances of each transaction, an unavoidable level of risk remains regarding the actual condition of these businesses. We may not be able to ascertain the value or understand the potential liabilities of the acquired businesses and their operations until we assume operating control of the assets and operations of these businesses.
Furthermore, any acquisitions of businesses or facilities, including our recent acquisition of Compton, could entail a number of risks, including:
- problems with the effective integration of operations;
- inability to maintain key pre-acquisition business relationships;
- increased operating costs;
- exposure to substantial unanticipated liabilities;
- difficulties in realizing projected efficiencies, synergies and cost savings;
- the risks of entering markets in which we have limited or no prior experience; and
- the possibility that we may be unable to recruit additional managers with the necessary skills to supplementthe management of the acquired businesses.
23
In addition, geographic and other expansions, acquisitions or joint ventures may require significant managerial attention, which may be diverted from our other operations. If we are unsuccessful in overcoming these risks, our business, financial condition or results of operations could be materially and adversely affected.
The industries in which we operate may be affected by disruptions beyond our control.
Our global commodity supply chain operations include direct or indirect investments in assets, such as smelting, refining, mining, processing and hydrocarbon operations. Transport disruption, weather and natural disasters such as hurricanes and flooding, unexpected maintenance problems, collapse or damage to mines or wells, unexpected geological variations, labour disruptions and changes in laws and regulations relating to occupational safety, health and environmental matters are some of the factors that may adversely affect our financial condition and results of operations. These factors can affect costs at particular assets for varying periods. In addition, smelting, refining, mining, processing and hydrocarbon operations also rely on key inputs, such as labour, spare parts, fuel and electricity. Disruption to the supply of key inputs, or changes in their pricing, may have a significant adverse impact on our future results.
Our commodities activities are subject to counterparty risks associated with performance of obligations by our counterparties and suppliers.
Our business is subject to commercial risks, which include counterparty risk, such as failure of performance by commodities suppliers and failure of payment by our trading customers. We seek to reduce the risk of supplier non-performance by requiring credit support from creditworthy financial institutions where appropriate. We attempt to reduce the risk of non-payment by purchasers of commodities by imposing limits on open accounts extended to creditworthy customers and imposing credit support requirements for other customers. Nevertheless, we are exposed to the risk that parties owing us or our clients and other financial intermediaries may default on their obligations to us due to bankruptcy, lack of liquidity, operational failure or other reasons. These counterparty obligations may arise, for example, from placing deposits, the extension of credit in trading and investment activities and participation in payment, securities and commodity trading transactions on our behalf and as an agent on behalf of our clients. If any of these parties default on their obligations, our business, results of operations, financial condition and cash flow could be adversely affected.
Larger and more frequent capital commitments in our global commodity supply chain business increase the potential for significant losses.
We may enter into large transactions in which we commit our own capital as part of our global commodity supply chain business to facilitate client trading activities. The number and size of these large transactions may materially affect our results of operations in a given period. Market fluctuations may also cause us to incur significant losses from our trading activities. To the extent that we own assets (i.e., have long positions), a downturn in the value of those assets or in the markets in which those assets are traded could result in losses. Conversely, to the extent that we have sold assets we do not own (i.e., have short positions) in any of those markets, an upturn in those markets could expose us to potentially large losses as we attempt to cover our short positions by acquiring assets in a rising market.
We are subject to transaction risks that may have a material adverse effect on our business, results of operations, financial condition and cash flow.
We manage transaction risks through allocating and monitoring our capital investments in circumstances where the risk to our capital is minimal, carefully screening clients and transactions, and engaging qualified personnel to manage transactions. Nevertheless, transaction risks can arise from, among other things, our trading and merchant banking activities. These risks include market and credit risks associated with our merchant banking operations. We intend to make investments in highly unstructured situations and in companies undergoing severe financial distress. Such investments often involve severe time constraints. These investments may expose us to significant transaction risks. An unsuccessful investment may result in the total loss of such an investment and may have a material adverse effect on our business, results of operations, financial condition and cash flow.
24
Our risk management strategies leave us exposed to unidentified or unanticipated risks that could impact our risk management strategies in the future and could negatively affect our results of operations and financial condition.
We use a variety of instruments and strategies to manage exposure to various types of risks. For example, we use derivative foreign exchange contracts to manage our exposure and our clients’ exposure to foreign currency exchange rate risks. If any of the variety of instruments and strategies we utilize to manage our exposure to various types of risk are not effective, we may incur losses. Many of our strategies are based on historical trading patterns and correlations. However, these strategies may not be fully effective in mitigating our risk exposure in all market environments or against all types of risk. Unexpected market developments may affect our risk management strategies during this time and unanticipated developments could impact our risk management strategies in the future.
Derivative transactions may expose us to unexpected risk and potential losses.
We, from time to time, enter into derivative transactions that require us to deliver to the counterparty the underlying security, loan or other obligation in order to receive payment. In a number of cases, we may not hold the underlying security, loan or other obligation and may have difficulty obtaining, or be unable to obtain, the underlying security, loan or other obligation through the physical settlement of other transactions. As a result, we are subject to the risk that we may not be able to obtain the security, loan or other obligation within the required contractual time frame for delivery. This could cause us to forfeit the payments due to us under these contracts or result in settlement delays with the attendant credit and operational risk as well as increased costs to us.
Fluctuations in interest rates and foreign currency exchange rates may affect our results of operations and financial condition.
Fluctuation in interest rates may affect the fair value of our financial instruments sensitive to interest rates. An increase or decrease in market interest rates may result in changes to the fair value of our fixed interest rate financial instrument liabilities, thereby resulting in a reduction in the fair value of our equity. Similarly, fluctuations in foreign currency exchange rates may affect the fair value of our financial instruments sensitive to foreign currency exchange rates.
Our operations and infrastructure may malfunction or fail.
Our business is highly dependent on our ability to process, on a daily basis, a number of transactions across diverse markets, and the transactions we process have become increasingly complex. The inability of our systems to accommodate an increasing volume of transactions could also constrain our ability to expand our businesses. If any of these systems do not operate properly or are disabled, or if there are other shortcomings or failures in our internal processes, people or systems, we could suffer impairments, financial loss, a disruption of our businesses, liability to clients, regulatory intervention or reputational damage.
The exploration and development of mining and resource properties is inherently dangerous and subject to risks beyond our control.
Companies engaged in resource activities are subject to all of the hazards and risks inherent in exploring for and developing natural resource projects. These risks and uncertainties include, but are not limited to, environmental hazards, industrial accidents, labour disputes, increases in the cost of labour, social unrest, fires, changes in the regulatory environment, impact of non-compliance with laws and regulations, explosions, encountering unusual or unexpected geological formations or other geological or grade problems, unanticipated metallurgical characteristics or less than expected mineral recovery, encountering unanticipated ground or water conditions, cave-ins, pit wall failures, flooding, rock bursts, periodic interruptions due to inclement or hazardous weather conditions, earthquakes, seismic activity, other natural disasters or unfavourable operating conditions and losses. Should any of these risks or hazards affect a company’s exploration or development activities, it may: (i) cause the cost of development or production to increase to a point where it would no longer be economic to produce the metal or other resource from the company’s resources or expected reserves; (ii) result in a write down or write-off of the carrying value of one or more projects; (iii) cause delays or stoppage of mining or processing; (iv) result in the destruction of properties, processing facilities or third party facilities necessary for operations; (v) cause personal injury or death and related legal liability; or (vi) result in the loss of insurance coverage. The occurrence of any of above mentioned risks or hazards could result in an interruption or suspension of operation of the properties in which we hold an interest or any other properties we acquire in the future and have a material and adverse effect on our results of operations and financial condition.
25
Our natural gas and oil related operations are subject to inherent risks and hazards.
There are many operating risks and hazards inherent in exploring for, producing, processing, and transporting natural gas and oil. Drilling operations may encounter unexpected formations or pressures that could cause damage to equipment or personal injury and fires, explosions, blowouts, spills, or other accidents may occur. Additionally, we could experience interruptions to, or the termination of, drilling, production, processing, and transportation activities due to bad weather, natural disasters, delays in obtaining governmental approvals or consents, insufficient storage or transportation capacity, or other geological and mechanical conditions. Any of these events that result in a shutdown or slowdown of operations will adversely affect our business. While close well supervision and effective maintenance operations can contribute to maximizing production rates over time, production delays and declines from normal field operating conditions cannot be eliminated and can be expected to adversely affect revenue and cash flow levels to varying degrees.
Drilling activities, including completions, are subject to the risk that no commercially productive reservoirs will be encountered and we will not recover all or any portion of our investment. The cost of drilling, completing, and operating wells is often uncertain due to drilling in unknown formations, the costs associated with encountering various drilling conditions, such as over pressured zones, and changes in drilling plans and locations as a result of prior exploratory wells or additional seismic data and interpretations thereof.
Mineral Resource calculations are only estimates.
Any figures presented for mineral resources in this document are only estimates. There are numerous uncertainties inherent in estimating mineral resources. Such estimates are subjective, and the accuracy of mineral resource estimation is a function of the quantity and quality of available data and of the assumptions made and judgments used in engineering and geological interpretation. These amounts are estimates only and the actual level of recovery of minerals from such deposits may be different. Differences between our assumptions, including economic assumptions such as mineral prices, market conditions and actual events, could have a material adverse effect on our mineral reserve and mineral resource estimates, financial position and results of operation. No assurance can be given that any mineral resource estimates will be ultimately reclassified as reserves.
Estimates of natural gas and oil reserves involve uncertainty.
Estimates of natural gas and oil reserves, involve a great deal of uncertainty because they depend upon the reliability of available geologic and engineering data, which is inherently imprecise. Geologic and engineering data are used to determine the probability that an oil and gas reservoir exists at a particular location and whether hydrocarbons are recoverable from the reservoir. The probability of the existence and recoverability of reserves is less than 100% and actual recoveries may be materially different from estimates.
Such estimates require numerous assumptions relating to operating conditions and economic factors, including the prices of such commodities, availability of investment capital, recovery costs, the availability of enhanced recovery techniques, the ability to market production, and governmental and other regulatory factors, such as taxes, royalty rates, and environmental laws. A change in one or more of these factors could result in known quantities of natural gas and oil previously estimated becoming unrecoverable. Each of these factors also impacts recovery costs and production rates. In addition, estimates of reserves that are prepared by different independent engineers, or by the same engineers at different times, may vary substantially.
If we are unsuccessful in acquiring or finding additional reserves, our future natural gas, natural gas liquid and oil production would decline, thereby reducing our cash flows and results of operations and impairing our financial condition.
The rate of production from our natural gas and oil properties generally declines as reserves are depleted. Except to the extent we acquire interests in additional properties containing proved reserves, conduct successful exploration and development activities or, through engineering studies, optimize production performance or identify additional reserves, our proved reserves will decline materially as natural gas, natural gas liquids and oil are produced. Accordingly, to the extent we are not successful in replacing such production, our future revenues may decline.
Creating and maintaining an inventory of prospects for future production depends on many factors, including:
- obtaining rights to explore for, develop and produce hydrocarbons in promising areas;
- drilling success;
- the ability to complete long lead-time, capital-intensive projects timely and on budget;
26
- the ability to find or acquire additional proved reserves at acceptable costs; and
- the ability to fund such activity.
Our global commodity supply chain operations are subject to environmental laws and regulations that may increase the costs of doing business and may restrict such operations.
All phases of a resource business present environmental risks and hazards and are subject to environmental regulation pursuant to a variety of government laws and regulations. These regulations mandate, among other things, the maintenance of air and water quality standards and land reclamation. They also set forth limitations on the generation, transportation, storage and disposal of solid and hazardous waste. Compliance with such laws and regulations can require significant expenditures, and a breach may result in the imposition of fines and penalties, which may be material. Environmental legislation is evolving in a manner expected to result in stricter standards and enforcement, larger fines and liability and potentially increased capital expenditures and operating costs. Any breach of environmental legislation by the operator of properties underlying our interests or by us, as an owner or operator of a property, could have a material impact on the viability of the relevant property and impair the revenue derived from the owned property or applicable royalty or other interest, which could have a material adverse effect on our results of operations and financial condition. Further, environmental hazards may exist on the properties on which we hold interests, which are unknown to us at present and have been caused by previous or existing owners or operators of the properties.
Failure to comply with applicable laws, regulations and permitting requirements may result in enforcement actions thereunder, including orders issued by regulatory or judicial authorities causing operations to cease or be curtailed and may include corrective measures requiring capital expenditures, installation of additional equipment or remedial actions. Parties engaged in resource operations or in the exploration or development of resource properties may also be required to compensate those suffering loss or damage by reason of the mining activities and may have civil or criminal fines or penalties imposed for violations of applicable laws or regulations.
We are not fully insured against certain environmental risks, either because such insurance is not available or because of high premium costs. In particular, insurance against risks from environmental pollution occurring over time, as opposed to sudden and catastrophic damages, is not available on economically reasonable terms. Accordingly, our properties may be subject to liability due to hazards that cannot be insured against or that have not been insured against due to prohibitive premium costs or for other reasons.
Future environmental and reclamation obligations respecting our resource properties and interests may be material.
We have not established a separate reclamation fund for the purpose of funding estimated future environmental and reclamation obligations. Any site reclamation or abandonment costs incurred in the ordinary course in a specific period will be funded out of cash flow from operations. It is not possible for us to predict our ability to fully fund the cost of all of our future environmental, abandonment and reclamation obligations. We expect to incur site restoration costs over a prolonged period as wells reach the end of their economic life. There are significant uncertainties related to decommissioning obligations and the impact on the financial statements could be material. The eventual timing of and costs for these asset retirement obligations could differ from current estimates. The main factors that can cause expected cash flows to change are:
- changes to laws and legislation;
- construction of new facilities;
- change in the reserve estimate and the resulting amendment to the life of the reserves for our hydrocarbonoperations; and
- changes in technology.
We or the operators of our current and any future resource interests may not be able to secure required permits and licenses.
Operations underlying our resource interests may require licenses and permits from various governmental authorities. There can be no assurance that we or the operator of any given project will be able to obtain all necessary licenses and permits that may be required to carry out exploration, development or other resource operations.
27
There can be no assurance that we will be able to obtain adequate financing in the future or that the terms of such financing will be favourable and, as a result, we may have to raise additional capital through the issuance of additional equity, which will result in dilution to our shareholders.
There can be no assurance that we will be able to obtain adequate financing in the future or that the terms of such financing will be favourable. Failure to obtain such additional financing could result in delay or indefinite postponement of further business activities. We may require new capital to grow our business and there are no assurances that capital will be available when needed, if at all. It is likely such additional capital will be raised through the issuance of additional equity, which would result in dilution to our shareholders.
Limitations on our access to capital could impair our liquidity and our ability to conduct our businesses.
Liquidity, or ready access to funds, is essential to companies engaged in commodities trading and financing and merchant banking. Failures of financial firms have often been attributable in large part to insufficient liquidity. Liquidity is of particular importance to our commodities and resources business, and perceived liquidity issues may affect our clients’ and counterparties’ willingness to engage in transactions with us. Our liquidity could be impaired due to circumstances that we may be unable to control, such as a general market disruption or an operational problem that affects our clients, counterparties, our lenders or us. Further, our ability to sell assets may be impaired if other market participants are seeking to sell similar assets at the same time.
We may substantially increase our debt in the future.
We expect that it may be necessary for us to obtain financing with a bank or financial institution to provide funds for working capital, capital purchases, potential acquisitions and business development. However, because of our cash flow position, we do not expect that we will have any immediate need to obtain additional financing. Interest costs associated with any debt financing may adversely affect our profitability. Further, the terms on which amounts may be borrowed – including standard financial covenants regarding the maintenance of financial ratios, the prohibition against engaging in major corporate transactions or reorganizations and the payment of dividends – may impose additional constraints on our business operations and our financial strength.
As a result of our global operations, we are exposed to political, economic, legal, operational and other risks that could adversely affect our business, our results of operations, financial condition and cash flow.
In conducting our business in major markets around the world, we are subject to political, economic, legal, operational and other risks that are inherent in operating in other countries. These risks range from difficulties in settling transactions in emerging markets to possible nationalization, expropriation, price controls and other restrictive governmental actions, and terrorism. We also face the risk that exchange controls or similar restrictions imposed by foreign governmental authorities may restrict our ability to convert local currency received or held by us in their countries into Swiss francs, Canadian dollars, Euros or other hard currencies, or to take those other currencies out of those countries. If any of these risks become a reality, our business, results of operations, financial condition and cash flow could be negatively impacted.
We are exposed to litigation risks in our business that are often difficult to assess or quantify. We anticipate that we will incur significant legal expenses every year in defending against litigation.
We are exposed to legal risks in our business and the volume and amount of damages claimed in litigation against financial intermediaries are increasing. These risks include potential liability under securities or other laws for materially false or misleading statements made in connection with securities and other transactions, potential liability for advice we provide to participants in corporate transactions and disputes over the terms and conditions of complex trading arrangements. We also face the possibility that counterparties in complex or risky trading transactions will claim that we improperly failed to tell them of the risks involved or that they were not authorized or permitted to enter into such transactions with us and that their obligations to us are not enforceable. During a prolonged market downturn, we expect these types of claims to increase. We are also exposed to legal risks in our merchant banking activities.
We seek to invest in undervalued businesses or assets often as a result of financial, legal, regulatory or other distress affecting them. Investing in distressed businesses and assets can involve us in complex legal issues relating to priorities, claims and other rights of stakeholders. These risks are often difficult to assess or quantify, and their existence and magnitude often remains unknown for substantial periods of time. We may incur significant legal and other expenses in defending against litigation involved with any of these risks and may be required to pay substantial damages for settlements and/or adverse judgments. Substantial legal liability or significant regulatory action against us could have a material adverse effect on our financial condition and results of operations.
28
We rely significantly on the skills and experience of our executives, and the loss of any of these individuals may harm our business.
Our future success depends to a significant degree on the skills, experience and efforts of our executives, and the loss of their services may compromise our ability to effectively conduct our business. We do not maintain “key person” insurance in relation to any of our employees.
We may experience difficulty attracting and retaining qualified management and technical personnel to efficiently operate our business, and the failure to operate our business effectively could have a material and adverse effect on our profitability, financial condition and results of operations.
We are dependent upon the continued availability and commitment of our management, whose contributions to immediate and future operations are of significant importance. The loss of any such management could negatively affect our business operations. From time to time, we will also need to identify and retain additional skilled management and specialized technical personnel to efficiently operate our business. The number of persons skilled in the acquisition, exploration and development of royalties and interests in natural resource properties is limited and competition for such persons is intense. Recruiting and retaining qualified personnel is critical to our success and there can be no assurance of our ability to attract and retain such personnel. If we are not successful in attracting and retaining qualified personnel, our ability to execute our business model and growth strategy could be affected, which could have a material and adverse impact on our profitability, results of operations and financial condition.
Certain of our directors and officers may, from time to time, serve in similar positions with other public companies, which may put them in a conflict position with us from time to time.
Certain of our directors and officers may, from time to time, serve as directors or officers of other companies involved in similar businesses to us, and, to the extent that such other companies may participate in the same ventures in which we may seek to participate, such directors and officers may have a conflict of interest in negotiating and concluding terms respecting the extent of such participation. In all cases where our directors and officers have an interest in other companies, such other companies may also compete with us in commodities trading, financing and merchant banking and for the acquisition of royalties, similar interests or resources properties or projects. Such conflicts of our directors and officers may result in a material and adverse effect on our results of operations and financial condition.
We conduct business in countries with a history of corruption and transactions with foreign governments, and doing so increases the risks associated with our international activities.
As we operate internationally, we are subject to the United StatesForeign Corrupt Practices Act, and other laws that prohibit improper payments or offers of payments to foreign governments and their officials and political parties by United States and other business entities that have securities registered in the United States for the purpose of obtaining or retaining business. We have operations and agreements with third parties in countries known to experience corruption. Further international expansion may involve more exposure to such practices. Our activities in these countries create the risk of unauthorized payments or offers of payments by one of our employees or consultants that could be in violation of various laws including theForeign Corrupt Practices Act, even though these parties are not always subject to our control. It is our policy to implement safeguards to discourage these practices by employees. However, our existing safeguards and any future improvements may prove to be less than effective, and our employees or consultants may engage in conduct for which we might be held responsible. Violations of theForeign Corrupt Practices Act may result in criminal or civil sanctions, and we may be subject to other liabilities, which could negatively affect our business, operating results and financial condition.
Employee misconduct could harm us and is difficult to detect and deter.
It is not always possible to detect and deter employee misconduct. The precautions we take to detect and prevent employee misconduct may not be effective in all cases, and we could suffer significant reputational and economic harm for any misconduct by our employees. The potential harm to our reputation and to our business caused by such misconduct is impossible to quantify.
29
We may incur losses as a result of unforeseen or catastrophic events, including the emergence of a pandemic, terrorist attacks or natural disasters.
The occurrence of unforeseen or catastrophic events, including the emergence of a pandemic or other widespread health emergency (or concerns over the possibility of such an emergency), terrorist attacks or natural disasters, could create economic and financial disruptions, could lead to operational difficulties (including travel limitations) that could impair our ability to manage our business and could expose our insurance subsidiaries to significant losses.
General Risks Faced by Us
Investors’ interests may be diluted and investors may suffer dilution in their net book value per share if we issue additional shares or raise funds through the sale of equity securities.
Our constating documents authorize the issuance of our common shares, class A common shares and class A preference shares, issuable in series. In the event that we are required to issue any additional shares or enter into private placements to raise financing through the sale of equity securities, investors’ interests in us will be diluted and investors may suffer dilution in their net book value per share depending on the price at which such securities are sold. If we issue any such additional shares, such issuances will also cause a reduction in the proportionate ownership of all other shareholders. Further, any such issuance may result in a change of control of our company.
Certain factors may inhibit, delay or prevent a takeover of our company, which may adversely affect the price of our common shares.
Certain provisions of our charter documents and the corporate legislation which govern us may discourage, delay or prevent a change of control or changes in our management that shareholders may consider favourable. Such provisions include authorizing the issuance by our board of directors of preferred stock in series, providing for a classified board of directors with staggered, three-year terms and limiting the persons who may call special meetings of shareholders. In addition, theInvestment Canada Actimposes certain limitations on the rights of non-Canadians to acquire our common shares, although it is highly unlikely that this will apply. If a change of control or change in management is delayed or prevented, the market price of our common shares could decline.
Additional Information
We file annual and other reports, proxy statements and other information with certain Canadian securities regulatory authorities and with the SEC in the United States. The documents filed with the SEC are available to the public from the SEC’s website at http://www.sec.gov. The documents filed with the Canadian securities regulatory authorities are available athttp://www.sedar.com.
30

UNAUDITED INTERIM CONDENSED FINANCIAL STATEMENTS
March 31, 2013
31
UNAUDITED INTERIM CONDENSED FINANCIAL STATEMENTS
In accordance with National Instrument 51-102 released by the Canadian Securities Administrators, MFC Industrial Ltd. discloses that its auditors have not reviewed the unaudited financial statements for the period ended March 31, 2013.
NOTICE TO READER OF THE INTERIM CONDENSED CONSOLIDATED
FINANCIAL STATEMENTS
The accompanying interim condensed consolidated statements of financial position of MFC Industrial Ltd. as at March 31, 2013 and the related condensed consolidated statements of operations, comprehensive income, cash flows and changes in equity for the three-month period then ended are the responsibility of management. These condensed consolidated financial statements have not been reviewed on behalf of the shareholders by the independent external auditors of MFC Industrial Ltd.
The interim condensed consolidated financial statements have been prepared by management and include the selection of appropriate accounting principles, judgments and estimates necessary to prepare these financial statements in accordance with IFRS.
32
MFC INDUSTRIAL LTD.
CONDENSED CONSOLIDATED STATEMENTS OF FINANCIAL POSITION
(Unaudited)
(United States Dollars in Thousands)
| March 31, | December 31, | |||||||
| 2013 | 2012 | |||||||
| ASSETS | ||||||||
| Current Assets | ||||||||
| Cash and cash equivalents | $ | 341,786 | $ | 273,790 | ||||
| Short-term deposits | 178 | 182 | ||||||
| Securities | 7,402 | 6,658 | ||||||
| Restricted cash | 324 | 889 | ||||||
| Trade receivables | 72,308 | 72,820 | ||||||
| Other receivables | 9,758 | 18,314 | ||||||
| Inventories | 126,178 | 142,925 | ||||||
| Real estate held for sale | 11,892 | 12,210 | ||||||
| Deposits, prepaid and other | 24,948 | 27,833 | ||||||
| Assets held for sale | 112,700 | 128,657 | ||||||
| Total current assets | 707,474 | 684,278 | ||||||
| Non-current Assets | ||||||||
| Securities | 6,552 | 9,637 | ||||||
| Equity method investments | 23,159 | 22,382 | ||||||
| Investment property | 33,261 | 34,152 | ||||||
| Property, plant and equipment | 78,314 | 80,139 | ||||||
| Interests in resource properties | 371,084 | 383,745 | ||||||
| Hydrocarbon probable reserves | 97,121 | 99,142 | ||||||
| Hydrocarbon unproved land | 45,755 | 48,728 | ||||||
| Deferred income tax assets | 22,216 | 18,510 | ||||||
| Other | 760 | 776 | ||||||
| Total non-current assets | 678,222 | 697,211 | ||||||
| $ | 1,385,696 | $ | 1,381,489 | |||||
| LIABILITIES AND EQUITY | ||||||||
| Current Liabilities | ||||||||
| Short-term bank borrowings | $ | 181,536 | $ | 150,396 | ||||
| Debt, current portion | 46,564 | 44,169 | ||||||
| Account payables and accrued expenses | 58,769 | 77,586 | ||||||
| Facility term financing | 7,871 | 7,390 | ||||||
| Provisions | 60 | 80 | ||||||
| Income tax liabilities | 2,937 | 2,866 | ||||||
| Deferred sale liabilities | — | 26,637 | ||||||
| Liabilities relating to assets held for sale | 16,133 | 29,806 | ||||||
| Total current liabilities | 313,870 | 338,930 | ||||||
| Long-term Liabilities | ||||||||
| Debt, less current portion | 155,392 | 118,824 | ||||||
| Facility term financing | 7,908 | 11,328 | ||||||
| Deferred income tax liabilities | 7,878 | 3,391 | ||||||
| Decommissioning obligations | 131,064 | 136,642 | ||||||
| Accrued pension obligations, net | 1,033 | 1,228 | ||||||
| Puttable instrument financial liabilities | 7,990 | 7,761 | ||||||
| Total long-term liabilities | 311,265 | 279,174 | ||||||
| Total liabilities | 625,135 | 618,104 | ||||||
| Equity | ||||||||
| Capital stock | 383,116 | 382,746 | ||||||
| Treasury stock | (68,980 | ) | (68,610 | ) | ||||
| Contributed surplus | 13,037 | 13,037 | ||||||
| Retained earnings | 427,454 | 426,184 | ||||||
| Accumulated other comprehensive income (loss) | (440 | ) | 3,840 | |||||
| Total shareholders’ equity | 754,187 | 757,197 | ||||||
| Non-controlling interests | 6,374 | 6,188 | ||||||
| Total equity | 760,561 | 763,385 | ||||||
| $ | 1,385,696 | $ | 1,381,489 | |||||
The accompanying notes are an integral part of these condensed consolidated financial statements.
33
MFC INDUSTRIAL LTD.
CONDENSED CONSOLIDATED STATEMENTS OF OPERATIONS
For the Three Months Ended March 31, 2013 and 2012
(Unaudited)
(United States Dollars in Thousands, Except Per Share Amounts)
| 2013 | 2012 | |||||||
| Net sales | $ | 205,732 | $ | 146,049 | ||||
| Equity income | 1,522 | 1,584 | ||||||
| Gross revenues | 207,254 | 147,633 | ||||||
| Costs and Expenses: | ||||||||
| Costs of sales | 180,398 | 121,625 | ||||||
| Selling, general and administrative | 15,856 | 9,426 | ||||||
| Share-based compensation — selling, general and administrative | — | 9 | ||||||
| Finance costs | 4,376 | 1,826 | ||||||
| 200,630 | 132,886 | |||||||
| Income from operations | 6,624 | 14,747 | ||||||
| Other items: | ||||||||
| Exchange differences on foreign currency transactions | 399 | 772 | ||||||
| Change in fair value of puttable instrument financial liabilities | (229 | ) | — | |||||
| Bargain purchase | — | 2,359 | ||||||
| Income before income taxes | 6,794 | 17,878 | ||||||
| Income tax (expense) recovery: | ||||||||
| Income taxes | (874 | ) | 280 | |||||
| Resource property revenue taxes | (711 | ) | (901 | ) | ||||
| (1,585 | ) | (621 | ) | |||||
| Net income for the period | 5,209 | 17,257 | ||||||
| Net income attributable to non-controlling interests | (186 | ) | (313 | ) | ||||
| Net income attributable to owners of the parent company | $ | 5,023 | $ | 16,944 | ||||
| Basic earnings per share | $ | 0.08 | $ | 0.27 | ||||
| Diluted earnings per share | $ | 0.08 | $ | 0.27 | ||||
| Weighted average number of common shares outstanding | ||||||||
| — basic | 62,552,126 | 62,560,990 | ||||||
| — diluted | 63,038,071 | 62,560,990 | ||||||
The accompanying notes are an integral part of these condensed consolidated financial statements.
34
MFC INDUSTRIAL LTD.
CONDENSED CONSOLIDATED STATEMENTS OF COMPREHENSIVE INCOME
For the Three Months Ended March 31, 2013 and 2012
(Unaudited)
(United States Dollars in Thousands)
| 2013 | 2012 | |||||||
| Net income for the period | $ | 5,209 | $ | 17,257 | ||||
| Other comprehensive income (loss), net of income taxes: | ||||||||
| Net exchange differences arising from translating financial statements of | ||||||||
| foreign operations and U.S. dollar reporting | (4,473 | ) | 1,539 | |||||
| Net fair value gain on available-for-sale securities | 177 | 1,537 | ||||||
| Remeasurement of net defined benefit liabilities | 16 | — | ||||||
| (4,280 | ) | 3,076 | ||||||
| Total comprehensive income for the period | 929 | 20,333 | ||||||
| Comprehensive income attributable to non-controlling interests | (186 | ) | (347 | ) | ||||
| Comprehensive income attributable to owners of the parent company | $ | 743 | $ | 19,986 | ||||
| Other comprehensive income (loss), net of income taxes, comprised amounts: | ||||||||
| will not be reclassified subsequently to profit or loss | $ | 2,575 | $ | (827 | ) | |||
| will be reclassified subsequently to profit or loss when specific conditions are met | (6,855 | ) | 3,903 | |||||
| $ | (4,280 | ) | $ | 3,076 | ||||
The accompanying notes are an integral part of these condensed consolidated financial statements.
35
MFC INDUSTRIAL LTD.
CONDENSED CONSOLIDATED STATEMENTS OF CHANGES IN EQUITY
For the Three Months Ended March 31, 2013 and 2012
(Unaudited)
(United States Dollars in Thousands)
| Capital Stock | Treasury Stock | Accumulated Other Comprehensive Income | ||||||||||||||||||||||||||||||||||||||||||||||||||
| Number of Shares | Amount | Number of Shares | Amount | Contributed Surplus, Share-based Compensation | Retained Earnings | Available- for-sale Securities | Defined Benefit Obligations | Currency Translation Adjustment | Share- holders’ Equity | Non- Controlling Interests | Total Equity | |||||||||||||||||||||||||||||||||||||||||
| Balance at December 31, 2012 | 67,132,106 | $ | 382,746 | (4,579,980 | ) | $ | (68,610 | ) | $ | 13,037 | $ | 426,184 | $ | (119 | ) | $ | 961 | $ | 2,998 | $ | 757,197 | $ | 6,188 | $ | 763,385 | |||||||||||||||||||||||||||
| Net income | — | — | — | — | — | 5,023 | — | — | — | 5,023 | 186 | 5,209 | ||||||||||||||||||||||||||||||||||||||||
| Dividends paid | — | — | — | — | — | (3,753 | ) | — | — | — | (3,753 | ) | — | (3,753 | ) | |||||||||||||||||||||||||||||||||||||
| Issuance of preferred shares | 369,830 | 370 | (369,830 | ) | (370 | ) | — | — | — | — | — | — | — | — | ||||||||||||||||||||||||||||||||||||||
| Net fair value gain | — | — | — | — | — | — | 177 | — | — | 177 | — | 177 | ||||||||||||||||||||||||||||||||||||||||
| Net gain on remeasurements | — | — | — | — | — | — | — | 16 | — | 16 | — | 16 | ||||||||||||||||||||||||||||||||||||||||
| Net exchange differences | — | — | — | — | — | — | — | — | (4,473 | ) | (4,473 | ) | — | (4,473 | ) | |||||||||||||||||||||||||||||||||||||
| Balance at March 31, 2013 | 67,501,936 | $ | 383,116 | (4,949,810 | ) | $ | (68,980 | ) | $ | 13,037 | $ | 427,454 | $ | 58 | $ | 977 | $ | (1,475 | ) | $ | 754,187 | $ | 6,374 | $ | 760,561 | |||||||||||||||||||||||||||
| Balance at December 31, 2011 | 66,648,296 | $ | 382,289 | (4,086,875 | ) | $ | (68,117 | ) | $ | 13,028 | $ | 213,200 | $ | (4,759 | ) | $ | — | $ | 10,982 | $ | 546,623 | $ | 2,524 | $ | 549,147 | |||||||||||||||||||||||||||
| Net income | — | — | — | — | — | 16,944 | — | — | — | 16,944 | 313 | 17,257 | ||||||||||||||||||||||||||||||||||||||||
| Cancellation of fractional shares | (3,267 | ) | — | — | — | — | — | — | — | — | — | — | — | |||||||||||||||||||||||||||||||||||||||
| Dividends paid and payable | — | — | — | — | — | (6,256 | ) | — | — | — | (6,256 | ) | — | (6,256 | ) | |||||||||||||||||||||||||||||||||||||
| Share-based compensation | — | — | — | — | 9 | — | — | — | — | 9 | — | 9 | ||||||||||||||||||||||||||||||||||||||||
| Issuance of preferred shares | 154,095 | 154 | (154,095 | ) | (154 | ) | — | — | — | — | — | — | — | — | ||||||||||||||||||||||||||||||||||||||
| Net fair value gain | — | — | — | — | — | — | 1,534 | — | — | 1,534 | 3 | 1,537 | ||||||||||||||||||||||||||||||||||||||||
| Net exchange differences | — | — | — | — | — | — | — | — | 1,508 | 1,508 | 31 | 1,539 | ||||||||||||||||||||||||||||||||||||||||
| Balance at March 31, 2012 | 66,799,124 | $ | 382,443 | (4,240,970 | ) | $ | (68,271 | ) | $ | 13,037 | $ | 223,888 | $ | (3,225 | ) | $ | — | $ | 12,490 | $ | 560,362 | $ | 2,871 | $ | 563,233 | |||||||||||||||||||||||||||
| Owners | ||||||||||||
| Total Comprehensive | of the | Non- | ||||||||||
| Income for the | Parent | Controlling | ||||||||||
| Three Months Ended March 31: | Company | Interests | Total | |||||||||
| 2013 | $ | 743 | $186 | $ | 929 | |||||||
| 2012 | $ | 19,986 | $347 | $ | 20,333 | |||||||
The accompanying notes are an integral part of these condensed consolidated financial statements.
36
MFC INDUSTRIAL LTD.
CONDENSED CONSOLIDATED STATEMENTS OF CASH FLOWS
For the Three Months Ended March 31, 2013 and 2012
(Unaudited)
(United States Dollars in Thousands)
| 2013 | 2012 | |||||||
| Cash flows from operating activities: | ||||||||
| Net income | $ | 5,209 | $ | 17,257 | ||||
| Adjustments for: | ||||||||
| Amortization, depreciation and depletion | 7,718 | 3,046 | ||||||
| Expiry of hydrocarbon undeveloped lands | 2,721 | — | ||||||
| Exchange differences on foreign currency transactions | (399 | ) | (773 | ) | ||||
| Gain on trading securities, net | (796 | ) | (1,897 | ) | ||||
| Gain on available-for-sale and other securities, net | (177 | ) | (159 | ) | ||||
| Share-based compensation | — | 9 | ||||||
| Deferred income taxes | 386 | (681 | ) | |||||
| Equity income | (1,522 | ) | (1,584 | ) | ||||
| Market value increment on commodity inventories | (3,770 | ) | (548 | ) | ||||
| Change in fair value of puttable instrument financial liabilities | 229 | — | ||||||
| Bargain purchase | — | (2,359 | ) | |||||
| Changes in operating assets and liabilities, net of effects of acquisitions and dispositions: | ||||||||
| Short-term securities | 42 | 1,591 | ||||||
| Restricted cash | 564 | (28 | ) | |||||
| Bills of exchange | — | 10,545 | ||||||
| Receivables | 6,934 | (34,631 | ) | |||||
| Inventories | (10,853 | ) | (4,474 | ) | ||||
| Deposits, prepaid and other | 3,078 | (1,085 | ) | |||||
| Assets held for sale | 110 | — | ||||||
| Short-term bank borrowings | 36,042 | (6,557 | ) | |||||
| Account payables and accrued expenses | (18,410 | ) | 8,678 | |||||
| Deferred sale liabilities | — | (9,627 | ) | |||||
| Income tax liabilities | 160 | (1,671 | ) | |||||
| Provisions | (18 | ) | (1 | ) | ||||
| Decommissioning obligations | (604 | ) | — | |||||
| Accrued pension obligations | (135 | ) | — | |||||
| Other | 1,866 | 67 | ||||||
| Cash flows provided by (used in) continuing operating activities | 28,375 | (24,882 | ) | |||||
| Cash flows from continuing investing activities: | ||||||||
| Purchases of property, plant and equipment, net | (1,077 | ) | (78 | ) | ||||
| Proceeds from disposition of hydrocarbon assets, net | 171 | — | ||||||
| Purchases of long-term investments | (1,100 | ) | (2,600 | ) | ||||
| Proceeds from sales of long-term investments | 3,431 | 383 | ||||||
| Acquisition of a subsidiary, net of cash acquired | — | (27,971 | ) | |||||
| Increase in loan receivable | — | (81 | ) | |||||
| Decrease in loan receivable | — | 19,869 | ||||||
| Other | 1,857 | 1,830 | ||||||
| Cash flows provided by (used in) continuing investing activities | 3,282 | (8,648 | ) | |||||
| Cash flows from continuing financing activities: | ||||||||
| Debt repayment | — | (25,489 | ) | |||||
| Debt borrowing | 44,423 | — | ||||||
| Reduction in facility term financing | (2,574 | ) | — | |||||
| Dividends paid to shareholders | (3,753 | ) | (3,128 | ) | ||||
| Cash flows provided by (used in) continuing financing activities | 38,096 | (28,617 | ) | |||||
| Exchange rate effect on cash and cash equivalents | (1,757 | ) | 4,474 | |||||
| Increase (decrease) in cash and cash equivalents | 67,996 | (57,673 | ) | |||||
| Cash and cash equivalents, beginning of period | 273,790 | 387,052 | ||||||
| Cash and cash equivalents, end of period | $ | 341,786 | $ | 329,379 | ||||
| Cash and cash equivalents at end of period consisted of: | ||||||||
| Cash | $ | 280,975 | $ | 327,510 | ||||
| Money market and highly liquid funds | 60,811 | 1,869 | ||||||
| $ | 341,786 | $ | 329,379 | |||||
The accompanying notes are an integral part of these condensed consolidated financial statements.
37
MFC INDUSTRIAL LTD.
SELECTED EXPLANATORY NOTES TO CONDENSED
CONSOLIDATED FINANCIAL STATEMENTS
MARCH 31, 2013
(Unaudited)
Note 1. Nature of Business
MFC Industrial Ltd. (“MFC Industrial” or the “Company”) is incorporated under the laws of British Columbia, Canada. MFC Industrial is a global commodities supply chain company.
In September 2012, MFC Industrial, through its Austrian subsidiary, acquired all of the issued and outstanding shares of Compton Petroleum Corporation (“CPC”). CPC, its subsidiary, joint operations and structured entity (collectively “CPC Group”) are in the hydrocarbon business. The Group consolidated the results of the operations of CPC Group since September 7, 2012.
Note 2. Basis of Presentation and Significant Accounting Policies
These condensed consolidated financial statements contained herein include the accounts of MFC Industrial and entities it controls (collectively, the “Group”). The presentation currency of these consolidated financial statements is the United States of America (the “U.S.”) dollar ($), as rounded to the nearest thousand (except per share amounts and amounts indicated in specific monetary units).
The interim financial report has been prepared by MFC Industrial in accordance with the English language version of International Financial Reporting Standards (“IFRS”) which include International Accounting Standards (“IAS”) and Interpretations (“IFRIC” and “SIC”) as issued by the International Accounting Standards Board (the “IASB”). The Group’s interim financial statements for the three months ended March 31, 2013 are in compliance with IAS 34,Interim Financial Reporting. The same accounting policies and methods of computation are followed in the interim financial statements as in the most recent annual financial statements, except for accounting policy changes made after the date of the most recent annual financial statements which are disclosed in Note 3 to this interim financial report. In accordance with IAS 34, certain information and footnote disclosure normally included in annual financial statements have been omitted or condensed.
The measurement procedures to be followed in an interim financial report are designed to ensure that the resulting information is reliable and that all material financial information that is relevant to an understanding of the financial position or performance of the Group is appropriately disclosed. While measurements in both annual and interim financial reports are often based on reasonable estimates, the preparation of the interim financial report generally requires a greater use of estimation methods than the annual financial report.
In the opinion of MFC Industrial, its unaudited interim condensed consolidated financial statements contain all normal recurring adjustments necessary in order to present a fair statement of the results of the interim periods presented. These interim period statements should be read together with the audited consolidated financial statements and the accompanying notes included in MFC Industrial’s latest annual report on Form 20-F. The results for the periods presented herein are not indicative of the results for the entire year. The revenues from the Group’s resources activities involve seasonality and cyclicality.
Note 3. Accounting Policy Developments
The following new standards and amendments were issued by the IASB that are mandatory for the Group’s accounting year 2013:
IFRS 10,Consolidated Financial Statements(“IFRS 10”),establishes principles for the presentation and preparation of consolidated financial statements when an entity controls one or more other entities. IFRS 10 supersedes IAS 27 (Revised),Consolidated and Separate Financial Statements,and SIC-12,Consolidation – Special Purpose Entities.
IFRS 11,Joint Arrangements(“IFRS 11”),establishes principles for financial reporting by entities that have an interest in arrangements that are controlled jointly (i.e. joint arrangements). IFRS 11 supersedes IAS 31,Interests in Joint Ventures,and SIC-13,Jointly Controlled Entities - Non-Monetary Contributions by Venturers.
38
MFC INDUSTRIAL LTD.
SELECTED EXPLANATORY NOTES TO CONDENSED
CONSOLIDATED FINANCIAL STATEMENTS
MARCH 31, 2013
(Unaudited)
Note 3. Accounting Policy Developments (continued)
IFRS 12,Disclosure of Interests in Other Entities(“IFRS 12”),applies to entities that have an interest in a subsidiary, a joint arrangement, an associate or an unconsolidated structured entity. The objective of this IFRS is to require an entity to disclose information that enables users of its financial statements to evaluate: (a) the nature of, and risks associated with, its interests in other entities; and (b) the effects of those interests on its financial position, financial performance and cash flows.
IAS 27,Separate Financial Statements(“IAS 27”), has been amended for the issuance of IFRS 10 but retains the current guidance for separate financial statements. IAS 28,Investments in Associates and Joint Ventures(“IAS 28”), has been amended for conforming changes based on the issuance of IFRS 10 and IFRS 11.
IFRS 13,Fair Value Measurement(“IFRS 13”),(a) defines fair value; (b) sets out in a single IFRS a framework for measuring fair value; and (c) requires disclosures about fair value measurements.
Amendments, set out inPresentation of Items of Other Comprehensive Income¸ were issued to amend IAS 1,Presentation of Financial Statements.The amendments require the grouping of items of other comprehensive income into items that might be reclassified to profit or loss in subsequent periods and items that will not be reclassified to profit or loss in subsequent periods.
The adoption of these new standards and amendments did not have any recognition or measurement impacts on the Group’s consolidated financial statements, except for additional disclosures.
IFRS 10, 11, 12 and amendments to IAS 27 and 28 modify the Group’s accounting policy on consolidation as follows:
Principles of Consolidation
These consolidated financial statements include the accounts of MFC Industrial and entities it controls. The Company controls an investee if and only if the investor has all the following: (a) power over the investee; (b) exposure, or rights, to variable returns from its involvement with the investee; and (c) the ability to use its power over the investee to affect the amount of the investor’s returns.
A joint arrangement is an arrangement of which two or more parties have joint control and has the following characteristics: (a) The parties are bound by a contractual arrangement and (b) the contractual arrangement gives two or more of those parties joint control of the arrangement. A joint arrangement is either a joint operation or a joint venture.
A joint operation is a joint arrangement whereby the parties that have joint control of the arrangement have rights to the assets, and obligations for the liabilities, relating to the arrangement. A joint venture is a joint arrangement whereby the parties that have joint control of the arrangement have rights to the net assets of the arrangement.
| The Group recognizes in relation to its interest in a joint operation: | ||
| (a) | its assets, including its share of any assets held jointly; | |
| (b) | its liabilities, including its share of any liabilities incurred jointly; | |
| (c) | its revenue from the sale of its share of the output arising from the joint operation; | |
| (d) | its share of the revenue from the sale of the output by the joint operation; and | |
| (e) | its expenses, including its share of any expenses incurred jointly. | |
The Group recognizes its interest in a joint venture as an investment and accounts for that investment using the equity method in accordance with IAS 28,Investments in Associates and Joint Ventures.
39
MFC INDUSTRIAL LTD.
SELECTED EXPLANATORY NOTES TO CONDENSED
CONSOLIDATED FINANCIAL STATEMENTS
MARCH 31, 2013
(Unaudited)
Note 3. Accounting Policy Developments (continued)
Pursuant to IFRS 13, the following accounting policy on fair value measurement is adopted:
Fair Value Measurement
IFRS 13 defines fair value as the price that would be received to sell an asset or paid to transfer a liability in an orderly transaction between market participants at the measurement date. A fair value measurement is for a particular asset or liability. Therefore, when measuring fair value, the Group takes into account the characteristics of the asset or liability if market participants would take those characteristics into account when pricing the asset or liability at the measurement date.
A fair value measurement assumes that the transaction to sell the asset or transfer the liability takes place either:
| (a) | in the principal market for the asset or liability; or | |
| (b) | in the absence of a principal market, in the most advantageous market for the asset or liability. | |
The Group uses valuation techniques that are appropriate in the circumstances and for which sufficient data are available to measure fair value, maximizing the use of relevant observable inputs and minimizing the use of unobservable inputs. IFRS 13 establishes a fair value hierarchy that categorizes the inputs to valuation techniques used to measure fair value into three levels:
Level 1 inputs are quoted prices (unadjusted) in active markets for identical assets or liabilities that the entity can access at the measurement date.
Level 2 inputs are inputs other than quoted prices included within Level 1 that are observable for the asset or liability, either directly or indirectly.
Level 3 inputs are unobservable inputs for the asset or liability.
The following new accounting standard is expected to have significant effects on the Group’s accounting policies, financial positions and/or financial statement presentation in future periods.
IFRS 9,Financial Instruments(“IFRS 9”), replaces IAS 39. IFRS 9 uses a single approach to determine whether a financial asset is measured at amortized cost or fair value. The approach in IFRS 9 is based on how an entity manages its financial instruments (its business model) and the contractual cash flow characteristics of the financial assets. The new standard also requires a single impairment method to be used, replacing the many different impairment methods in IAS 39. Pursuant to IFRS 9, an entity choosing to measure a liability at fair value will present the portion of the change in its fair value due to changes in the entity’s own credit risk in other comprehensive income, rather than in the profit or loss. New requirements for the derecognition of financial instruments, impairment and hedge accounting are expected to be added to IFRS 9. In December 2011, the IASB issued amendments to IFRS 9 that defer the mandatory effective date from January 1, 2013 to January 1, 2015. The deferral will make it possible for all phases of the project to have the same mandatory effective date. The amendments also provide relief from the requirement to restate comparative financial statements for the effect of applying IFRS 9. Additional transition disclosures will be required to help investors understand the effect that the initial application of IFRS 9 has on the classification and measurement of financial instruments. Early application of IFRS 9 is still permitted. Management is currently evaluating the impacts that IFRS 9 will have on the Group’s consolidated financial statements.
Note 4. Business Segment Information
The Group is primarily in the global commodities supply chain business.
In reporting to management, the Group’s operating results are categorized into the following operating segments: commodities and resources, merchant banking and all other segments.
40
MFC INDUSTRIAL LTD.
SELECTED EXPLANATORY NOTES TO CONDENSED
CONSOLIDATED FINANCIAL STATEMENTS
MARCH 31, 2013
(Unaudited)
Note 4. Business Segment Information (continued)
Commodities and resources segment includes trading of commodities and resources, as well as the related producing, processing and extracting activities. It also includes the royalty income from the Group’s interests in resource properties.
Merchant banking segment includes proprietary investing and provision of financial services. The Group seeks investments in many industries, emphasizing those business opportunities where the perceived intrinsic value is not properly recognized. The Group uses its financial and management expertise to add or unlock value within a relative short time period. The merchant banking business also provides supply chain structured solutions.
All other segment includes the Group’s corporate and operating segments whose quantitative amounts do not exceed 10% of any of the Group’s (a) reported revenue, (b) net income or (c) combined assets. The Group’s other operating segments primarily include business activities in medical equipment, instruments, supplies and services.
Products and Services
The Group’s total revenues comprised the following for the three months ended March 31, 2013 and 2012, respectively:
| 2013 | 2012 | |||||
| Commodities and resources | $ | 195,477 | $ | 134,489 | ||
| Fees | 2,142 | 1,376 | ||||
| Gains on securities, net | 1,374 | 2,069 | ||||
| Interest | 1,674 | 3,318 | ||||
| Dividends | 23 | 29 | ||||
| Equity income | 1,522 | 1,584 | ||||
| Other | 5,042 | 4,768 | ||||
| Total revenues | $ | 207,254 | $ | 147,633 | ||
The Group’s revenues consolidated the revenues of CPC Group in the Group’s commodities and resources segment since September 7, 2012.
Segment Operating Results
| Three Months Ended March 31, 2013 | ||||||||||||||||||||
| Commodities | Merchant | |||||||||||||||||||
| and resources | banking | All other | Total | |||||||||||||||||
| Revenues from external customers | $ | 199,288 | $ | 3,564 | $ | 4,402 | $ | 207,254 | ||||||||||||
| Intersegment sale | 58 | 2,762 | 88 | 2,908 | ||||||||||||||||
| Interest expense | 4,105 | 26 | 44 | 4,175 | ||||||||||||||||
| Income (loss) before income taxes | 2,857 | 7,138 | (3,201 | ) | 6,794 | |||||||||||||||
| Three Months Ended March 31, 2013 | ||||||||||||||||||||
| Commodities | Merchant | |||||||||||||||||||
| and resources | banking | All other | Total | |||||||||||||||||
| Revenues from external customers | $ | 138,485 | $ | 4,558 | $ | 4,590 | $ | 147,633 | ||||||||||||
| Intersegment sale | — | 2,613 | 85 | 2,698 | ||||||||||||||||
| Interest expense | 1,702 | 41 | 2 | 1,745 | ||||||||||||||||
| Income (loss) before income taxes | 10,620 | 7,844 | * | (586 | ) | 17,878 | ||||||||||||||
| * | including negative goodwill of $2,359. |
41
MFC INDUSTRIAL LTD.
SELECTED EXPLANATORY NOTES TO CONDENSED
CONSOLIDATED FINANCIAL STATEMENTS
MARCH 31, 2013
(Unaudited)
Note 5. Capital Stock
Currently, MFC Industrial has two classes of capital stock: common shares (the “Common Shares”) and preferred shares (the “Preferred Shares”). As at March 31, 2013, there are 62,552,126 Common Shares issued and outstanding.
All the treasury stock are held by the Company’s wholly-owned subsidiaries.
Note 6. Condensed Consolidated Statements of Operations
Revenues
| 2013 | 2012 | ||||||
| Gross revenues as reported | $ | 207,254 | $ | 147,633 | |||
| For the components of the Group’s total revenues, please see Note 4. | |||||||
| The Group’s revenues included the following items: | |||||||
| 2013 | 2012 | ||||||
| Net gains on securities | $ | 1,374 | $ | 2,068 | |||
| Market value increment on commodities | — | 548 | |||||
| The Group’s net gains on securities comprised: | |||||||
| 2013 | 2012 | ||||||
| Trading securities | $ | 796 | $ | 1,897 | |||
| Available-for-sale securities | 177 | 159 | |||||
| Subsidiary | 415 | — | |||||
| Holding (loss) gain on advance sales of securities | (14 | ) | 12 | ||||
| Net gain on securities | $ | 1,374 | $ | 2,068 | |||
Expenses
| The Group’s costs of sales comprised: | |||||||
| 2013 | 2012 | ||||||
| Commodities and resources | $ | 180,184 | $ | 119,345 | |||
| Expiry of exploration and evaluation assets | 2,721 | — | |||||
| Credit losses recovery on loans and receivables | (62 | ) | (9 | ) | |||
| (Gain) loss on derivative instruments, net | (482 | ) | 369 | ||||
| Market value adjustment on commodities, net | (3,770 | ) | — | ||||
| Other | 1,807 | 1,920 | |||||
| Total costs of sales | $ | 180,398 | $ | 121,625 | |||
| The Group included the following items in its costs of sales: | |||||||
| 2013 | 2012 | ||||||
| Recovery of write-down of inventories, net | $ | (220 | ) | $ | (59 | ) | |
| Loss on unwinding sale and repurchase arrangements | 2,356 | — | |||||
42
MFC INDUSTRIAL LTD.
SELECTED EXPLANATORY NOTES TO CONDENSED
CONSOLIDATED FINANCIAL STATEMENTS
MARCH 31, 2013
(Unaudited)
Note 7. Earnings per Share
Earnings per share data for the three months ended March 31 from operations is summarized as follows:
| 2013 | 2012 | |||||
| Basic earnings from continuing operations available to holders of | ||||||
| common shares | $ | 5,023 | $ | 16,944 | ||
| Effect of dilutive securities: | — | — | ||||
| Diluted earnings from continuing operations | $ | 5,023 | $ | 16,944 | ||
| Number of Shares | ||||||
| 2013 | 2012 | |||||
| Weighted average number of common shares outstanding — basic | 62,552,126 | 62,560,990 | ||||
| Effect of dilutive securities: | ||||||
| Options | 485,945 | — | ||||
| Weighted average number of common shares outstanding — diluted | 63,038,071 | 62,560,990 | ||||
Note 8. Dividend Paid
On January 14, 2013, MFC Industrial announced its annual cash dividend for 2013 as follows:
- The 2013 annual cash dividend will be $0.24 per common share in total, paid in quarterly installments.
- The first payment of $0.06 per common share was paid on February 8, 2013 to shareholders of record onJanuary 25, 2013.
- The second payment of $0.06 per common share was paid on April 22, 2013 to shareholders of record onApril 12, 2013.
- The remaining quarterly dividend payments of $0.06 per common share in 2013 are expected to be madein June and September, respectively.
- The dividend is subject to customary Canadian withholding tax for non-resident shareholders. Pursuant toapplicable tax treaties the withholding rate for eligible U.S. resident shareholders is 15%. The dividend isan eligible dividend under theIncome Tax Act(Canada).
Note 9. Related Party Transactions
In the normal course of operations, the Group enters into transactions with related parties which include affiliates in which the Group has a significant equity interest (10% or more) or which have the ability to influence the affiliates’ or the Group’s operating and financing policies through significant shareholding, representation on the board of directors, corporate charter and/or bylaws. These related party transactions are measured at the exchange value which represents the amounts of consideration established and agreed to by the parties. In addition to transactions disclosed elsewhere in the financial statements, the Group had the following transactions with affiliates during the three months ended March 31, 2013:
| Net sales | $358 | |||
| Dividends income* | 131 | |||
| Royalty expense paid and payable* | (86 | ) |
| * | included in income from interest in resource property. |
43
MFC INDUSTRIAL LTD.
SELECTED EXPLANATORY NOTES TO CONDENSED
CONSOLIDATED FINANCIAL STATEMENTS
MARCH 31, 2013
(Unaudited)
Note 10. Changes in Contingent Liabilities or Contingent Assets Since the End of the Last Annual Reporting Period
Litigation
The Group is subject to litigation in the normal course of business. Management considers the aggregate liability which may result from such litigation not material at March 31, 2013.
Guarantees
As at March 31, 2013, the Group had issued guarantees up to a maximum of $18,247 to its trading and financing partners in the normal course of its commodities activities, of which $9,647 has been used and outstanding and has not been recorded as liabilities in the consolidated statement of financial position. There has been no claim against the guarantees.
Note 11. Fair Value Disclosures
Assets and Liabilities Measured at Fair Value on a Recurring Basis as of March 31, 2013:
| Fair Value Measurements at Reporting Date Using | ||||||||||||||||
| Quoted Prices | ||||||||||||||||
| in Active Markets | Significant Other | Significant | ||||||||||||||
| for Identical Assets | Observable Inputs | Unobservable Inputs | ||||||||||||||
| (Level 1) | (Level 2) | (Level 3) | ||||||||||||||
| Assets: | ||||||||||||||||
| Cash and cash equivalents, short-term | ||||||||||||||||
| cash deposits and restricted cash | $ | 342,288 | $ | — | $ | — | ||||||||||
| Trading securities | 7,402 | — | — | |||||||||||||
| Available-for-sale securities | 6,552 | — | — | |||||||||||||
| Derivatives, receivables | — | 591 | — | |||||||||||||
| Inventories held by commodity | ||||||||||||||||
| broker-traders | — | 51,577 | — | |||||||||||||
| Investment property | — | 33,261 | — | |||||||||||||
| Total | $ | 356,242 | $ | 85,429 | $ | — | ||||||||||
| Liabilities: | ||||||||||||||||
| Derivatives, payables | $ | — | $ | 575 | $ | — | ||||||||||
| Puttable instrument financial liabilities | — | — | 7,990 | |||||||||||||
| Decommissioning obligations | — | — | 131,064 | |||||||||||||
| Total | $ | — | $ | 575 | $ | 139,054 | ||||||||||
Level 1 fair value hierarchy: The fair value of cash and cash equivalents, restricted cash and short-term cash deposits is based on reported market value. The fair value of trading and available-for-sale securities is based on quoted market prices, unless it is not quoted in an active market.
Level 2 fair value hierarchy: The fair values of the derivative financial instruments are based on the quoted market prices when possible; if not available, estimates from third-party brokers. These broker estimates are corroborated with multiple sources and/or other observable market data utilizing assumptions that market participants would use when pricing the asset or liability, including assumptions about risk and market liquidity. The fair value of investment property reflects, among other things, rental income from current leases and other assumptions that market participants would use when pricing investment property under current market conditions. Inventories held by commodity broker-traders are measured at fair value less costs to sell and the fair value is based on the current selling price of the similar or identical products. Inputs generally are readily observable or market-corroborated.
44
MFC INDUSTRIAL LTD.
SELECTED EXPLANATORY NOTES TO CONDENSED
CONSOLIDATED FINANCIAL STATEMENTS
MARCH 31, 2013
(Unaudited)
Note 11. Fair Value Disclosures (continued)
Level 3 fair value hierarchy: The fair values of the puttable instruments and decommissioning obligations are determined using discounted cash flows model.
Liabilities Measured at Fair Value on a Recurring Basis Using Significant Unobservable Inputs (Level 3) as of March 31, 2013
| Puttable | ||||||||||||||||
| Instrument | ||||||||||||||||
| Financial | Decommissioning | |||||||||||||||
| Liabilities | Obligations | Total | ||||||||||||||
| Beginning balance | $ | 7,761 | $ | 136,642 | $ | 144,403 | ||||||||||
| Total realized and unrealized losses (gains) included in: | ||||||||||||||||
| - Net income | 229 | 692 | 921 | |||||||||||||
| - Other comprehensive income, | ||||||||||||||||
| exchange differences | — | (2,747 | ) | (2,747 | ) | |||||||||||
| Purchases, issuances, and settlements | — | (685 | ) | (685 | ) | |||||||||||
| Changes in estimates | — | (2,838 | ) | (2,838 | ) | |||||||||||
| Transfers in and/or out of Level 3 | — | — | — | |||||||||||||
| Ending balance | $ | 7,990 | $ | 131,064 | $ | 139,054 | ||||||||||
| The amount of total losses (gains) for the period included | ||||||||||||||||
| in earnings attributable to the change in unrealized losses | ||||||||||||||||
| (gains) relating to assets still held at the reporting date | $ | — | $ | — | $ | — | ||||||||||
Assets measured at Fair Value on Nonrecurring Basis as of March 31, 2013
| Fair Value Measurements Using | ||||||||||||||||||
| Quoted Prices | ||||||||||||||||||
| in Active Markets | Significant Other | Significant | ||||||||||||||||
| for Identical Assets | Observable Inputs | Unobservable Inputs | Total Gains | |||||||||||||||
| (Level 1) | (Level 2) | (Level 3) | (Losses) | |||||||||||||||
| Assets held for sale | $— | $— | $112,700 | $ | (2,529 | ) | ||||||||||||
| Included in: | ||||||||||||||||||
| Net income | $ | (176 | ) | |||||||||||||||
| Other comprehensive income | (2,353 | ) | ||||||||||||||||
| $ | (2,529 | ) | ||||||||||||||||
There were no transfers between Level 1 and Level 2 of the fair value hierarchy.
Liabilities measured at Fair Value on Nonrecurring Basis as of March 31, 2013
| Fair Value Measurements Using | ||||||||||||||||||
| Quoted Prices | ||||||||||||||||||
| in Active Markets | Significant Other | Significant | ||||||||||||||||
| for Identical Assets | Observable Inputs | Unobservable Inputs | Total Losses | |||||||||||||||
| (Level 1) | (Level 2) | (Level 3) | (Gain) | |||||||||||||||
| Liabilities relating to assets | ||||||||||||||||||
| held for sale | $— | $— | $16,133 | $ | (247 | ) | ||||||||||||
| Included in: | ||||||||||||||||||
| Net income | $ | 89 | ||||||||||||||||
| Other comprehensive income | (336 | ) | ||||||||||||||||
| $ | (247 | ) | ||||||||||||||||
There were no transfers between Level 1 and Level 2 of the fair value hierarchy.
45
MFC INDUSTRIAL LTD.
SELECTED EXPLANATORY NOTES TO CONDENSED
CONSOLIDATED FINANCIAL STATEMENTS
MARCH 31, 2013
(Unaudited)
Note 12. Disclosure of Interests in Subsidiaries
A subsidiary is an entity that is controlled by MFC Industrial. The following table shows the direct and indirect significant subsidiaries as at March 31, 2013. The table excludes subsidiaries which only hold intercompany assets and liabilities and do not have an active business as well as subsidiaries whose results and net assets did not materially impact the consolidated results and net assets of the Group.
| Proportion | Proportion | |||||||||||
| Country of | of Voting | of Beneficial | ||||||||||
| Subsidiaries | Incorporation | Interest | Interest | |||||||||
| MFC Commodities GmbH | Austria | 100 | % | 100 | % | |||||||
| MFC Trade & Financial Services GmbH | Austria | 100 | % | 100 | % | |||||||
| IC Managementservice GmbH | Austria | 100 | % | 100 | % | |||||||
| International Trade Services GmbH | Austria | 100 | % | 100 | % | |||||||
| MFC Metal Trading GmbH | Austria | 100 | % | 100 | % | |||||||
| Kasese Cobalt Company Limited | Uganda | 75 | % | 100 | % | |||||||
| AFM Aluminiumfolie Merseburg GmbH | Germany | 55 | % | 55 | % | |||||||
| MAW Mansfelder Aluminiumwerk GmbH | Germany | 55 | % | 55 | % | |||||||
| MFC (A) Ltd. | Marshall Islands | 100 | % | 100 | % | |||||||
| MFC (D) Ltd. | Marshall Islands | 100 | % | 100 | % | |||||||
| Brock Metals s.r.o. | Slovakia | 100 | % | 100 | % | |||||||
| M Financial Corp. | Barbados | 100 | % | 100 | % | |||||||
| Mednet (Shanghai) Medical Technical | ||||||||||||
| Developing Co., Ltd. | China | 90 | % | 90 | % | |||||||
| Hangzhou Zhe-er Optical Co. Ltd. | China | 51 | % | 46 | % | |||||||
| MFC Corporate Services AG | Switzerland | 100 | % | 100 | % | |||||||
| 0915988 B.C. Ltd. | Canada | 40 | % | 99 | %*** | |||||||
| Compton Petroleum Austria GmbH | Austria | 100 | % | 100 | % | |||||||
| Compton Petroleum Corporation | Canada | 100 | % | 100 | % | |||||||
| Win Energy (Montana), Inc. | U.S. | 100 | % | 100 | % | |||||||
| Mazeppa Processing Partnership**** | Canada | 0 | % | 100 | %*** | |||||||
| ACC Resources Co., L.P. | U.S. | 70 | % | 80 | %*/** | |||||||
| ACC Resources S.R.L. | Argentina | 70 | % | 80 | %*/** | |||||||
| Possehl Mexico S.A. de C.V. | Mexico | 60 | % | 60 | %* | |||||||
| * | The non-controlling interests are classified as puttable instrument financial liabilities on the consolidated statement of financial position. |
| ** | The beneficiary interest includes additional 10% voting interest to be acquired and paid for in November 2013. |
| *** | These are consolidated structured entities. |
| **** | The Group holds an option to purchase the partnership at a pre-determined amount on April 30, 2014. |
As at March 31, 2013, there were no significant restrictions (including protective rights of non-controlling interests) which could significantly restrict MFC Industrial’s ability to access or use the assets and settle the liabilities of the Group.
As of March 31, 2013, none of non-controlling interests are material to the Group. Also, there were no significant restrictions (statutory, contractual and regulatory restrictions, including protective rights of non-controlling interests) on MFC Industrial’s ability to access or use the assets and settle the liabilities of the Group.
During the current period, the Groups sold its interest in an entity (which held the resource properties in India) and recognized a non-cash accounting gain of $415 on its disposition. The gain was included in the net sales in the consolidated statement of operations.
46
MFC INDUSTRIAL LTD.
SELECTED EXPLANATORY NOTES TO CONDENSED
CONSOLIDATED FINANCIAL STATEMENTS
MARCH 31, 2013
(Unaudited)
Note 13. Approval of Consolidated Financial Statements
This interim financial report was approved by the Board of Directors and authorized for issue on May 14, 2013.
Note 14. Revision of Consolidated Statement of Operations for Three Months Ended March 31, 2012
| Net income for three months ended March 31, 2012, as previously reported | $ | 14,585 |
| Bargain purchase | 2,359 | |
| Net income for three months ended March 31, 2012, revised | $ | 16,944 |
On March 16, 2012, a subsidiary of MFC Industrial (the “Purchaser”) purchased a 75% equity interest and a shareholder loan interest in a corporation, for a total purchase price of $28,000 which was paid on March 19, 2012. The corporation has a mineral refinery plant and power plant. The acquisition of the 75% equity and the shareholder loan interests together effectively transferred a 100% economic interest in the corporation to the Purchaser.
This acquisition was not considered as a material business combination and no goodwill or bargain purchase was initially recognized in March 2012. During the measurement period, fair values of assets were finalized and bargain purchase of $2,359 was recognized in December 2012. Pursuant to IFR 3, Business Operations, comparative information for prior periods presented in financial statements is revised as needed.
47
NEWS RELEASE | ||||
Corporate | Investors Cameron Associates Kevin McGrath 1 (212) 245 4577 kevin@cameronassoc.com | |||
MFC INDUSTRIAL LTD. REPORTS FIRST QUARTER RESULTS FOR 2013
- Revenues up over 40 percent -
NEW YORK (May 15, 2013) . . . MFC Industrial Ltd. (“MFC” or the “Company”) (NYSE: MIL) announces its results for the three months ended March 31, 2013 and provides an update on its recent corporate developments. The Company’s financial statements are prepared in accordance with International Financial Reporting Standards.
Unless otherwise noted, all dollar amounts are in United States dollars.
| HIGHLIGHTS | ||||
| FOR THE THREE MONTHS ENDED MARCH 31, 2013 | ||||
| ► | Revenues increased by over 40% to $207.3 million in the first quarter of 2013. Our net income for the quarter ended March 31, 2013 decreased to a disappointing $5.0 million, or $0.08 per share on a diluted basis. | |||
| ► | Profits were down in the quarter ended March 31, 2013, primarily due to one-off expenses, increased SG&A expenses and the slower than expected integration of our newly acquired commodity businesses. | |||
| ► | We entered into a preliminary letter agreement for a joint venture for the expansion of our natural gas midstream facilities. | |||
| ► | We declared an annual cash dividend for 2013 of $0.24 per common share. The dividend is 9% higher than that paid in 2012 and represents a yield of approximately 2.81% compared to an annual dividend yield of approximately 2.5% for the NYSE Composite Index in 2012. The 2013 cash dividend will be paid in equal quarterly installments of $0.06 per common share. To date we have distributed two dividend payments totaling $0.12 per share to our shareholders in February and April 2013. | |||
In the first quarter of 2013, we saw marginal improvements in the pricing of certain of our commodities. Natural gas prices increased slightly, but such gains were offset by weaker than expected pricing for iron ore and other products. Our revenues grew by over 40% in the first quarter, compared to the same period in 2012. This was good, but we know we can do better. Earnings were quite disappointing as a result of various factors including timing issues on commodities shipments and higher expenses relating to the integration of our recent acquisitions.
We have completed the initial stages of the integration of Compton Petroleum Corporation’s (“CPC”) production of
PAGE 1/13
natural gas and natural gas liquids into our company. This reflected our strategy to increase our captive commodities sources and met our stated investment objectives. We are in the process of expanding our gas processing facility at Mazzeppa,consisting of thedevelopment of midstream projects that will help reduce our exposure to the volatility of natural gas prices, and also have the potential to create long-term stable processing income as well as a value-added component for our natural gas.
We are also in negotiations with interested parties to obtain the greatest value for our Niton property. The Niton area includes multi-zone, liquids-rich, tight gas plays, as well as other productive zones that provide the opportunities to expand our development base by moving into other geological horizons. Niton also includes our McLeod River gas processing plant.
ACC Resources Inc. (“ACCR”) and Possehl Mexico S.A. de C.V. (“Possehl”), which are commodity supply chain companies, specializing in industrial raw materials, chemicals and various other products are being integrated into our group and we will complete this process shortly.
RESULTS FOR THE THREE MONTHS ENDED MARCH 31, 2013
Total revenuesfor the three months ended March 31, 2013 increased 40% to $207.3 million compared to $147.6 million in 2012. Our net income for the first three months of 2013 decreased to $5.0 million, or $0.08 per share on a diluted basis, from $16.9 million, or $0.27 per share on a diluted basis for the same period last year.
The income statement for the three months ended March 31, 2013 includes non-cash depletion and depreciation expenses of approximately $7.7 million and other non-cash related expenses of approximately $2.7 million primarily related to our natural gas operations.
Depletion and depreciation are non-cash expenses and represent the amortization of the historic cost of our natural gas assets and other fixed assets over their economical productive life.
Revenues were up for the three months ended March 31, 2013 because of several factors, including the integration of our new acquisitions and increases in volumes and pricing for some of our commodities. As well, we realized additional revenue from the introduction of new products. Our revenue numbers were a positive move, however we still need to complete the integration of our new acquisitions into our operations.
Revenues for our commodities and resources business were $199.3 million for the three months ended March 31, 2013, compared to $138.5 million for the same period in 2012. Included are the gross revenues generated by our royalty interest, which for the three months ended March 31, 2013 were approximately $3.7 million, compared to $4.6 million in 2012. A total of 392,735 tons of iron ore pellets and concentrate were shipped during the first three months of 2013, compared to 482,189 tons shipped during the same period in 2012.
Revenues for our merchant banking business were $3.6 million for the three months ended March 31, 2013 compared to $4.6 million for the same period in 2012.
Other revenues, which encompass our corporate and other investments, were $4.4 million for the three months ended March 31, 2013, compared to $4.6 million for the same period in 2012.
PAGE 2/13
Costs of sales increased to $180.4 million during the three months ended March 31, 2013 from $121.6 million for the same period in 2012.Selling, general and administrativeexpenses increased to $15.9 million for the three months ended March 31, 2013 from $9.4 million for the same period in 2012.
OVERVIEW OF OUR RESULTS FOR THE THREE MONTHS ENDED MARCH 31, 2013
The table below shows our revenues by operating segments for the three months ended March 31, 2013 and 2012.
| REVENUES | |||||||||
| All amounts in thousands | |||||||||
| March 31, 2013 | March 31, 2012 | ||||||||
| three months | three months | ||||||||
| Commodities and resources | $ | 199,288 | $ | 138,485 | |||||
| Merchant banking | 3,564 | 4,558 | |||||||
| Other | 4,402 | 4,590 | |||||||
| Total revenues | $ | 207,254 | $ | 147,633 | |||||
The table below shows our income from operations for each of the three months ended March 31, 2013 and 2012.
| INCOME FROM OPERATIONS | |||||||||
| All amounts in thousands, except per share amounts | |||||||||
| March 31, 2013 | March 31, 2012 | ||||||||
| three months | three months | ||||||||
| Commodities and resources* | $ | 2,857 | $ | 10,620 | |||||
| Merchant banking* | 7,138 | 7,844 | |||||||
| Other* | (3,201 | ) | (586 | ) | |||||
| Income before income taxes* | 6,794 | 17,878 | |||||||
| Income tax recovery (expenses) | (874 | ) | 280 | ||||||
Resource property revenue tax | (711 | ) | (901 | ) | |||||
| Net income attributable to non- controlling interests | (186 | ) | (313 | ) | |||||
| Net income attributable to shareholders | $ | 5,023 | $ | 16,944 | |||||
| Earning per share | $ | 0.08 | $ | 0.27 | |||||
Note: * Includes intercompany income which is eliminated in income before income taxes.
PAGE 3/13
FINANCIAL
The following table highlights certain selected key financial numbers and ratios as at March 31, 2013.
| FINANCIAL HIGHLIGHTS | ||||||
| All amounts in thousands, except per share amount and ratios | ||||||
| March 31, 2013 | ||||||
| Cash and cash equivalents | $ | 341,786 | ||||
| Trade receivables | 72,308 | |||||
| Current assets | 707,474 | |||||
| Total assets | 1,385,696 | |||||
| Current liabilities | 313,870 | |||||
| Working capital | 393,604 | |||||
| Current ratio* | 2.25 | |||||
| Acid test ratio* | 1.45 | |||||
| Total liabilities | 625,135 | |||||
| Shareholders’ equity | 754,187 | |||||
| Equity per common share | 12.06 | |||||
| Note: * | The current ratio is calculated as current assets divided by current liabilities. The acid test ratio is calculated as cash and cash equivalents plus short-term cash deposits, short-term securities and receivables divided by total current liabilities and excluding restricted and cash, inventories, prepaid expenses and assets held for resale and related liabilities. |
LIQUIDITY
Liquidity is of great importance to companies in our business. As at March 31, 2013, we had cash and cash equivalents of $341.8 million. Our objectives when managing capital are: to safeguard our ability to do business so that we can continue to provide returns to shareholders; and to provide an adequate return by pricing products and services commensurately with the level of risk. We also maintain a flexible capital structure which optimizes the cost of capital at acceptable risk. We set the amount allocated proportionate to risk. We manage our capital structure and make adjustments to it in light of changes in economic conditions and the risk characteristics of the underlying assets.
| LIQUIDITY | |||||||||||
| All amounts in thousands | |||||||||||
| March 31, 2013 | December 31, 2012 | ||||||||||
| Total debt | $ | 201,956 | $ | 162,993 | |||||||
| Less: cash and cash equivalents | (341,786 | ) | (273,790 | ) | |||||||
| Net debt (net cash & cash equivalents) | (139,830 | ) | (110,797 | ) | |||||||
| Shareholders’ equity | 754,187 | 757,197 | |||||||||
PAGE 4/13
LONG-TERM DEBT
The following table sets forth our long-term debt and long-term debt-to-equity ratio as of March 31, 2013 and December 31, 2012.
| LONG-TERM DEBT | |||||||||
| All amounts in thousands, except ratio | |||||||||
| March 31, 2013 | December 31, 2012 | ||||||||
| Long-term debt, less current portion | $ | 155,392 | $ | 118,824 | |||||
| Shareholders’ equity | 754,187 | 757,197 | |||||||
| Long-term debt-to-equity ratio* | 0.21 | 0.16 | |||||||
| Note: * | The long-term debt-to-equity ratio is calculated as long-term debt divided by shareholders’ equity. |
As at March 31, 2013, the majority of our long-term debt, less current portion in the amount of $155.4 million, consists of borrowing from banks. All-in costs for these unsecured loans are 2.53% annually.
CREDIT FACILITIES
We maintain various types of credit lines and facilities with various banks, and most of these are short-term. These facilities are used for day-to-day business, structured solutions and various other activities in both the commodities and finance areas.
As at March 31, 2013, we had credit facilities aggregating $405.2 million as follows: (i) revolving credit facilities aggregating $177.3 million from banks; (ii) revolving credit facilities aggregating $51.8 million from banks for structured solutions. The related margin is negotiable when the facility is used; (iii) a structured factoring arrangement with a bank for up to $119.4 million for our commodities activities. Generally, we can factor our commodity receivables upon invoicing at the inter-bank rate plus a margin; and (iv) a foreign exchange credit facility of $56.6 million with a bank. All of these bank lines and facilities are renewable on a yearly basis.
UPDATE ON OUR NATURAL GAS & MIDSTREAM FACILITIES
We have expanded our commodities platform into natural gas and midstream facilities. This is will be a major factor in our future growth, for, among other things:
- it significantly expanded our global commodities platform into the energy sector; and
- our operations include significant under-utilized midstream facilities, which present an opportunity for growth through value-added projects and the consolidation of regional gas production.
Developing midstream operations
We are completing plans for our gas processing facility at Mazzeppa,which include development of midstream projects that will help reduce our exposure to the volatility of natural gas prices and have the potential to create long-term stable processing income as well as a value-added component to our natural gas.
Using our facility as the main base, our strategy involves pursuing bolt-on or value-added projects. These may involve potential aggregate investments of over $360 million, including the following endeavors:
PAGE 5/13
| DEVELOPING MIDSTREAM OPERATIONS | |
| Co-generation plant (17 to 60 MW) providing electricity for our own use with the surplus power being sold to the electrical grid. | |
| Consolidation of regional sour gas production by investing in gathering infrastructure to complement our facility and connect stranded sour gas suppliers. | |
| Design and build a deep-cut straddle plant at our facility for the recovery of ethane, propane and butane. | |
| A 10,000 barrel per day natural gas liquid fractionation facility utilizing our existing rail terminal for shipments. |
Partner
We have entered into a preliminary letter agreement respecting the joint development of properties surrounding our midstream operations with a group who has an excellent track record in this area. This would involve equal ownership of the project. A definitive agreement has not been finalized or completed and would be subject to certain conditions being satisfied. When these various conditions are satisfied, we will be able disclose such agreement in detail. We are now proceeding with the initial planning, design and contracting phases and the current timing for execution is expected to be approximately 24 to 36 months.
Wells and other processing facilities
The following table sets forth our average sales prices, operating costs, royalty amounts and transportation costs for the first three months of 2013:
| NATURAL GAS WELLS (COSTS AND PRODUCTION) | |||||||||||||
| All amounts in Canadian dollars, except production numbers | |||||||||||||
| For the three months ended March 31, 2013 | |||||||||||||
| Natural Gas | NGLs | Crude Oil | Total | ||||||||||
| (C$/mcf) | (C$/bbl)(1) | (C$/bbl) | (C$/boe) | ||||||||||
| Price(2) | C$ 3.41 | C$ 91.19 | C$ 82.14 | C$ 31.83 | |||||||||
| Royalties | 0.56 | 29.30 | 19.41 | 6.80 | |||||||||
| Operating costs(3) | 1.60 | 11.02 | 12.19 | 9.86 | |||||||||
| Transportation costs | 0.14 | 4.02 | 4.02 | 1.31 | |||||||||
| Production(4) | 4,901 mmcf | 105.5 mboe | 36.5 mbbl | 958.7 mboe | |||||||||
| Notes: | (1) | Includes sulphur. |
| (2) | Includes third party processing fees. | |
| (3) | A portion of our natural gas production is associated with crude oil production. As a result, per unit operating costs (lifting cost) for each product reflect the allocation of certain common costs. | |
| (4) | Net of working interest. |
Undeveloped land bank
At March 31, 2013, we had 292,077 net undeveloped acres on which, due to the current pricing environment in natural gas, we do not intend to carry out any drilling at this time.
PAGE 6/13
ENTERED NEW MARKETS AND EXPENDED OUR COMMODITIES PLATFORM
We are integrating our two new businesses Park Ridge, NJ-basedACCR and its affiliated company, Mexico City-based, Possehl into MFC.
MFC’s financial strength and our substantial global reach will be resources that will enable growth and agility for the combined companies. It is ACCR, Possehl and MFC’s belief that China will be an excellent sourcing market for us. As the Chinese slowdown continues, their commodities prices should start to come down and they will appreciate relationships with reliable counterparties from international supply chain organizations with ready financing.
UPDATE ON THE ROYALTY INTEREST AT THE WABUSH MINE
In March, Cliffs Natural Resources Inc. (“Cliffs”) announced that, due to high production costs and lower pellet premium pricing, which is expected to persist in certain markets during the year, it will idle production at its Pointe Noire Quebec iron ore pellet plant. They will continue to produce an iron ore concentrate from its Scully Mine in Wabush located in the Province of Newfoundland and Labrador.
We do not expect that this will affect the royalty payment that we receive from Cliffs, as our royalties are paid on all iron ore products (i.e. pellets, concentrate and chips) shipped from the Wabush Mine.
Cliffs also disclosed that, for 2013, it is maintaining its full-year sales and production volume expectations of 9 to 10 million tons out of its Eastern Canada business segment. This includes approximately 3 million tons of iron ore pellets and/or concentrate products from its Wabush operation. We believe it is a positive development that Cliffs has maintained its 2013 guidance at the same production levels as 2012. On the other hand, we were disappointed with the lower than expected shipment volumes from Wabush during the period.
UPDATE ON OUR CAPTIVE SOURCES OF FERROUS METALS AT PEA RIDGE
MFC currently holds an indirect 50% interest in the Pea Ridge Iron Ore project (“Project”), a past-producing iron ore mine located in Sullivan, Missouri. The Project is a 50/50 joint venture between MFC and Alberici Group Inc. who joined forces with the goal to re-open and further develop the former Pea Ridge Iron Ore Mine. Our total investment in the Project to date is approximately $18.3 million.
Together with our consultants, we are continuing to conduct additional analysis and investigation regarding the reopening of the mine, including commencing confirmatory work in connection with the large tonnage of tailings materials present at the Project site. If we determine to move forward with the Project, significant additional investment would be required. We currently expect that development activities would take place in two main phases:
- The first phase will focus on the tailings materials. This would likely require construction of a beneficiation plant to process the tailings at the project.
- The second phase would center on re-opening of the historic underground mine. This will involve dewatering the mine, substantial new development work, installing new equipment and, in part, will require construction of additional beneficiating facilities.
The Project is currently at a preliminary stage and, any decision on proceeding, including development activities, is dependent on the completion of further analysis, including feasibility studies. Activities at the Project are proceeding in an orderly fashion. It is currently anticipated that substantial additional expenditures will be incurred in order to determine the feasibility of the Project.
PAGE 7/13
CORPORATE TAXATION
We are a company that strives to be fiscally responsible. The corporate income tax paid in cash was approximately $0.6 million for the quarter ended March 31, 2013.
ANNUAL CASH DIVIDEND
In January, we declared an annual cash dividend for 2013 of $0.24 per common share. The dividend is 9% higher than the dividend paid in 2012 and represents a yield of approximately 2.81% compared to an annual dividend yield of approximately 2.5% for the NYSE Composite Index in 2012. Details of the dividend are as follows:
- The 2013 cash dividend will be paid in equal quarterly installments of $0.06 per common share.
- The first payment of $0.06 per common share was paid on February 8, 2013 to shareholders of record on January 25, 2013.
- The second payment of $0.06 per common share was paid on April 22, 2013 to shareholders of record on April 12, 2013.
- The remaining quarterly dividend payments of $0.06 per common share in 2013 are expected to be made to shareholders of record in June and September.
COMMENTS
Chairman Michael Smith commented: “Integrating our newly acquired businesses has been both a challenge and an opportunity. The opportunities have allowed us to enlarge our commodities footprint, enter new markets and expand our supply chain platform,offering further potential growth. We still have a way to go to fully integrate these new businesses. However, we believe that we have a good business platform and a very sound financial foundation.”
Mr. Smith concluded: “MFC will continue to focus on increasing its efforts to acquire undervalued captive commodities assets and operating businesses, as well as streamlining its existing operations. Our strong financial foundation will allow us to expand and diversify our commodities business, as long as we are disciplined and patient. Our goal with these and other acquisitions is not to dilute our shareholders by issuing new shares and we must maintain our balance sheet and financial ratios.”
Shareholders are encouraged to read the entire Form 6-K, which includes our unaudited financial statements and management’s discussion and analysis for the three months ended March 31, 2013 and was filed with the Securities and Exchange Commission (“SEC”) and Canadian securities regulators today, for a greater understanding of the Company.
Today at 10:00 a.m. EDT (7:00 a.m. PDT), a conference call will be held to review MFC’s announcement and results. This call will be broadcast live over the Internet at www.mfcindustrial.com. An online archive will be available immediately following the call and will continue for seven days. You may also to listen to the audio replay by phone by dialing: 1 (888) 286 8010, using conference number 32984531. International callers dial: 1 (617) 801 6888.
About MFC Industrial Ltd.
MFC is a global commodity supply chain company and is active in a broad spectrum of activities related to the integrated combination of commodities and resources interests. We also provide logistics, financial and risk management services to producers and consumers of commodities. To obtain further information on the Company, please visit our website at: http://www.mfcindustrial.com.
PAGE 8/13
Disclaimer for Forward-Looking Information
This document contains statements which are, or may be deemed to be, "forward-looking statements" which are prospective in nature, including, without limitation, statements regarding our future plans, including in respect of CPC, partnerships and joint ventures respecting our processing facilities and related expansion projects, implementation of current strategies and our plans for our projects and the outcome of proceedings. Forward-looking statements are not based on historical facts, but rather on current expectations and projections about future events, and are therefore subject to risks and uncertainties which could cause actual results to differ materially from the future results expressed or implied by the forward-looking statements. Often, but not always, forward-looking statements can be identified by the use of forward-looking words such as "plans", "expects" or "does not expect", "is expected", "scheduled", "estimates", "forecasts", "projects", "intends", "anticipates" or "does not anticipate", or "believes", or variations of such words and phrases or statements that certain actions, events or results "may", "could", "should", "would", "might" or "will" be taken, occur or be achieved. Such statements are qualified in their entirety by the inherent risks and uncertainties surrounding future expectations. Such forward-looking statements involve known and unknown risks, uncertainties and other factors which may cause our actual results, revenues, performance or achievements to be materially different from any future results, performance or achievements expressed or implied by the forward-looking statements. Important factors that could cause our actual results, revenues, performance or achievements to differ materially from our expectations include, among other things:(i) periodic fluctuations in financial results as a result of the nature of our business; (ii) commodities price volatility; (iii) economic and market conditions; (iv) competition in our business segments; (v) decisions and activities of operators of our resource interests; (vi) the availability of commodities for our commodities and resources operations; (vii) the availability of suitable acquisition or merger or other proprietary investment candidates and the availability of financing necessary to complete such acquisitions or development plans; (viii) our ability to realize the anticipated benefits of our acquisitions; (ix) additional risks and uncertainties resulting from strategic investments, acquisitions or joint ventures; (x) counterparty risks related to our trading activities; (xi) unanticipated grade, geological, metallurgical, processing or other problems experienced by the operators of our resource interests (xii) delays in obtaining requisite environmental and other permits or project approvals; (xiii) potential title and litigation risks inherent with the acquisition of distressed assets; (xiv) risks related to exploration, development and construction of a previously shut-down mine project, including the suitability and integrity of historic mine structures; (xv) the availability of services and supplies; (xvi) operating hazards; (xvii) our ability to enter into definitive agreements on acceptable terms respecting joint ventures and partnerships relating to our processing facilities; and (xviii) other factors beyond our control. Such forward-looking statements should therefore be construed in light of such factors. Other than in accordance with its legal or regulatory obligations, the Company is not under any obligation and the Company expressly disclaims any intention or obligation to update or revise any forward-looking statements, whether as a result of new information, future events or otherwise. Additional information about these and other assumptions, risks and uncertainties are set out in our Annual Report on Form 20-F and our Management’s Discussion and Analysis for the year ended December 31, 2012, filed with the Canadian securities regulators.
UNAUDITED FINANCIAL TABLES FOLLOW –
PAGE 9/13
MFC INDUSTRIAL LTD.
CONSOLIDATED STATEMENTS OF FINANCIAL POSITION
March 31, 2013 and December 31, 2012
(Unaudited)
(United States Dollars in Thousands)
| ASSETS | ||||||
| March 31, | December 31, | |||||
| 2013 | 2012 | |||||
| Current Assets | ||||||
| Cash and cash equivalents | $ | 341,786 | $ | 273,790 | ||
| Short-term cash deposits | 178 | 182 | ||||
| Securities | 7,402 | 6,658 | ||||
| Restricted cash | 324 | 889 | ||||
| Trade receivables | 72,308 | 72,820 | ||||
| Other receivables | 9,758 | 18,314 | ||||
| Inventories | 126,178 | 142,925 | ||||
| Real estate held for sale | 11,892 | 12,210 | ||||
| Deposits, prepaid and other | 24,948 | 27,833 | ||||
| Assets held for sale | 112,700 | 128,657 | ||||
| Total current assets | 707,474 | 684,278 | ||||
| Non-current Assets | ||||||
| Securities | 6,552 | 9,637 | ||||
| Equity method investments | 23,159 | 22,382 | ||||
| Investment property | 33,261 | 34,152 | ||||
| Property, plant and equipment | 78,314 | 80,139 | ||||
| Interests in resource properties | 371,084 | 383,745 | ||||
| Hydrocarbon probable reserves | 97,121 | 99,142 | ||||
| Hydrocarbon unproved lands | 45,755 | 48,728 | ||||
| Deferred income tax assets | 22,216 | 18,510 | ||||
| Other | 760 | 776 | ||||
| Total non-current assets | 678,222 | 697,211 | ||||
| Total assets | $ | 1,385,696 | $ | 1,381,489 | ||
PAGE 10/13
MFC INDUSTRIAL LTD.
CONSOLIDATED STATEMENTS OF FINANCIAL POSITION (cont’d)
March 31, 2013 and December 31, 2012
(Unaudited)
(United States Dollars in Thousands)
| LIABILITIES AND EQUITY | ||||||||
| March 31, | December 31, | |||||||
| 2013 | 2012 | |||||||
| Current Liabilities | ||||||||
| Short-term bank borrowings | $ | 181,536 | $ | 150,396 | ||||
| Debt, current portion | 46,564 | 44,169 | ||||||
| Account payables and accrued expenses | 58,769 | 77,586 | ||||||
| Facility term financing | 7,871 | 7,390 | ||||||
| Provisions | 60 | 80 | ||||||
| Income tax liabilities | 2,937 | 2,866 | ||||||
| Deferred sale liabilities | – | 26,637 | ||||||
| Liabilities relating to assets held for sale | 16,133 | 29,806 | ||||||
| Total current liabilities | 313,870 | 338,930 | ||||||
| Long-term Liabilities | ||||||||
| Debt, less current portion | 155,392 | 118,824 | ||||||
| Facility term financing | 7,908 | 11,328 | ||||||
| Deferred income tax liabilities | 7,878 | 3,391 | ||||||
| Decommissioning obligations | 131,064 | 136,642 | ||||||
| Accrued pension obligation, net | 1,033 | 1,228 | ||||||
| Puttable instrument financial liabilities | 7,990 | 7,761 | ||||||
| Total long-term liabilities | 311,265 | 279,174 | ||||||
| Total liabilities | 625,135 | 618,104 | ||||||
| EQUITY | ||||||||
| Capital stock | 383,116 | 382,746 | ||||||
| Treasury stock | (68,980 | ) | (68,610 | ) | ||||
| Contributed surplus | 13,037 | 13,037 | ||||||
| Retained earnings | 427,454 | 426,184 | ||||||
| Accumulated other comprehensive income (loss) | (440 | ) | 3,840 | |||||
| Shareholders’ equity | 754,187 | 757,197 | ||||||
| Non-controlling interests | 6,374 | 6,188 | ||||||
| Total equity | 760,561 | 763,385 | ||||||
| $ | 1,385,696 | $ | 1,381,489 | |||||
PAGE 11/13
MFC INDUSTRIAL LTD.
CONSOLIDATED STATEMENTS OF OPERATIONS
For the Three Months Ended March 31, 2013 and 2012
(Unaudited)
(United States Dollars in Thousands, Except Per Share Amounts)
| 2013 | 2012 | |||||||
| Net Sales | $ | 205,732 | $ | 146,049 | ||||
| Equity income | 1,522 | 1,584 | ||||||
| Gross revenues | 207,254 | 147,633 | ||||||
| Costs and Expenses: | ||||||||
| Costs of sales | 180,398 | 121,625 | ||||||
| Selling, general and administrative | 15,856 | 9,426 | ||||||
| Share-based compensation – selling, general and | ||||||||
| administrative | – | 9 | ||||||
| Finance costs | 4,376 | 1,826 | ||||||
| 200,630 | 132,886 | |||||||
| Income from operations | 6,624 | 14,747 | ||||||
| Other items: | ||||||||
| Exchange differences on foreign currency transactions | 399 | 772 | ||||||
| Change in fair value of puttable instrument financial | ||||||||
| liabilities | (229 | ) | – | |||||
| Bargain purchase | – | 2,359 | * | |||||
| Income before income taxes | 6,794 | 17,878 | ||||||
| Income tax (expense) recovery: | ||||||||
| Income taxes | (874 | ) | 280 | |||||
| Resource property revenue taxes | (711 | ) | (901 | ) | ||||
| (1,585 | ) | (621 | ) | |||||
| Net income for the period | 5,209 | 17,257 | ||||||
| Net income attributable to non-controlling interests | (186 | ) | (313 | ) | ||||
| Net income attributable to owners of the parent company | $ | 5,023 | $ | 16,944 | ||||
| Basic earnings per share: | $ | 0.08 | $ | 0.27 | ||||
| Diluted earnings per share: | $ | 0.08 | $ | 0.27 | ||||
| Weighted average number of common shares | ||||||||
| outstanding | ||||||||
| - basic | 62,552,126 | 62,560,990 | ||||||
| - diluted | 63,038,071 | 62,560,990 | ||||||
Note: * Recognized during the measurement period as required by IFRS 3,Business Combinations.
PAGE 12/13
MFC INDUSTRIAL LTD.
FINANCIAL HIGHLIGHTS
As of March 31, 2013
(Unaudited)
(United States Dollars in Thousands, Except Per Share Amount and Ratios)
| Cash and cash equivalents | $ | 341,786 | |
| Short-term securities | 7,402 | ||
| Trade receivables | 72,308 | ||
| Current assets | 707,474 | ||
| Total assets | 1,385,696 | ||
| Current liabilities | 313,870 | ||
| Working capital | 393,604 | ||
| Current ratio | 2.25 | ||
| Acid test ratio | 1.45 | ||
| Long term debt, less current portion | 155,392 | ||
| Long-term debt-to-shareholders’ equity | 0.21 | ||
| Total Liabilities | 625,135 | ||
| Shareholders’ equity | 754,187 | ||
| Equity per common share | 12.06 |
PAGE 13/13
SIGNATURES
Pursuant to the requirements of theSecurities Exchange Act of 1934, the registrant has duly caused this report to be signed on its behalf by the undersigned, thereunto duly authorized.
MFC INDUSTRIAL LTD.
| By: | /s/ Michael Smith |
| Michael Smith | |
| Chairman, President and | |
| Chief Executive Officer |
Date: May 15, 2013