Exhibit 99.1

JANUARY 16, 2018 ANALYST AND INVESTOR DAY REV GROUP, INC. NYSE:REVG
Cautionary Statements & Non GAAP Measures FORWARD - LOOKING STATEMENTS This presentation contains statements that REV Group believes to be “forward - looking statements” within the meaning of the Priva te Securities Litigation Reform Act of 1995. These forward - looking statements can generally be identified by the use of forward - looking terminology, including the terms “believes,” “estimates,” “anticipates,” “expects,” “strives,” “goal, ” “seeks,” “projects,” “intends,” “forecasts,” “plans,” “may,” “will” or “should” or, in each case, their negative or other variations or comparable terminology. They appear in a number of places throughout this presentation and include statem ent s regarding REV Group’s intentions, beliefs, goals or current expectations concerning, among other things, its results of operations, financial condition, liquidity, prospects, growth, strategies and the industries in which we opera te, including REV Group’s outlook for first quarter of fiscal 2018 and full - year fiscal 2018. REV Group’s forward - looking statements are subject to risks and uncertainties, including those highlighted under “Risk Factors” and “Cautionary Note Rega rdi ng on Forward - Looking Statements” in REV Group’s public filings with the SEC and the other risk factors described from time to time in subsequent quarterly or annual reports on Forms 10 - Q or 10 - K, which may cause actual results to d iffer materially from those projected or implied by the forward - looking statement. Forward - looking statements are based on current expectations and assumptions and currently available data and are neither predictions nor gua ran tees of future events or performance. You should not place undue reliance on forward - looking statements, which only speak as of the date of this presentation. REV Group does not undertake to update or revise any forward - looking state ments after they are made, whether as a result of new information, future events, or otherwise, expect as required by applicable law. NOTE REGARDING NON - GAAP MEASURES REV Group reports its financial results in accordance with U.S. generally accepted accounting principles (“GAAP”). However, m ana gement believes that the evaluation of REV Group’s ongoing operating results may be enhanced by a presentation of Adjusted EBITDA and Adjusted Net Income, which are non - GAAP financial measures. Adjusted EBITDA represents net i ncome before interest expense, income taxes, depreciation and amortization as adjusted for certain non - recurring, one - time and other adjustments which REV Group believes are not indicative of its underlying operating performance. Adjusted Net Income represents net income, as adjusted for certain items described below that we believe are not indicative of our ongoing operating performance. REV Group believes that the use of Adjusted EBITDA and Adjusted Net Inc ome provides additional meaningful methods of evaluating certain aspects of its operating performance from period to period on a basis that may not be otherwise apparent under GAAP when used in addition to, and not in lieu of, GAA P measures. See the Appendix to this presentation (and our other filings with the SEC) for reconciliations of Adjusted EBITDA and Adjusted Net Income to the most closely comparable financial measures calculated in accordance with GAAP. 2

REV 2017 Overview
• Highly Successful IPO and Follow - on Equity Offering • Grew Adj. EBITDA 32% on Revenue increase of 18% • Introduced 17 new products • Completed 4 Acquisitions • Signed new strategic alliances with Ford Motor Company and Ryder Continue this Trajectory into Fiscal 2018 Recap of Fiscal Year 2017 4
REV’s Unique Business Model in Specialty Vehicles • One of the Specialty Vehicle industry’s most active acquirers in the past decade • Unique platform to continue to drive growth and redefining the industry • Broadest and most diverse product portfolio of specialty vehicles with strong brands • Unique size and scale creates a competitive advantage • Ancillary parts, service and finance offerings provide market advantage 5
REV’s Growth Drivers • Diverse and growing end markets • Macro economic and demographic tailwinds • Aftermarket parts opportunity is significant with >$800 million parts consumed annually • Large installed base over $36 billion and 240,000 vehicles • New Product Innovations • Mergers and Acquisitions • Additional service and financing capabilities 6
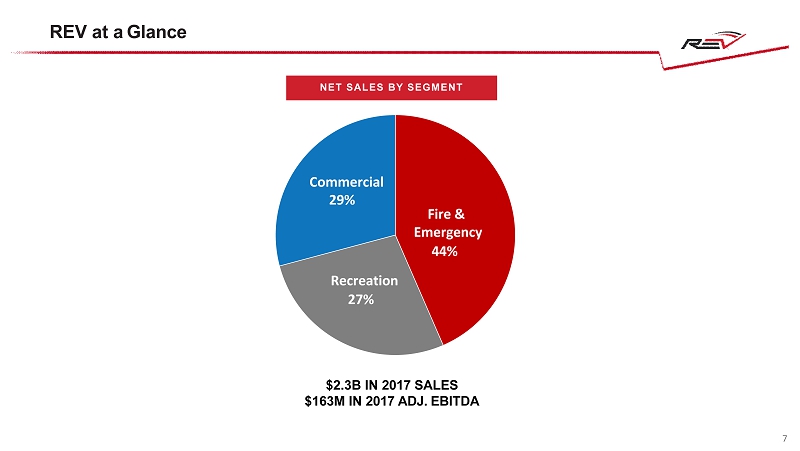
$2.3B IN 2017 SALES $163M IN 2017 ADJ. EBITDA REV at a Glance 44% 27% 29% Fire & Emergency Commercial Recreation NET SALES BY SEGMENT 7
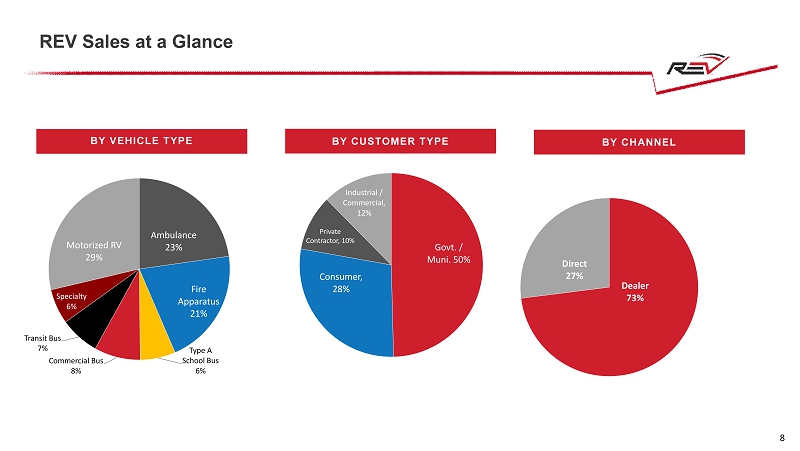
REV Sales at a Glance Ambulance 23% Fire Apparatus 21% Type A School Bus 6% Commercial Bus 8% Transit Bus 7% Specialty 6% Motorized RV 29% Govt. / Muni. 50% Consumer, 28% Private Contractor, 10% Industrial / Commercial, 12% Dealer 73% Direct 27% BY VEHICLE TYPE BY CUSTOMER TYPE BY CHANNEL 8
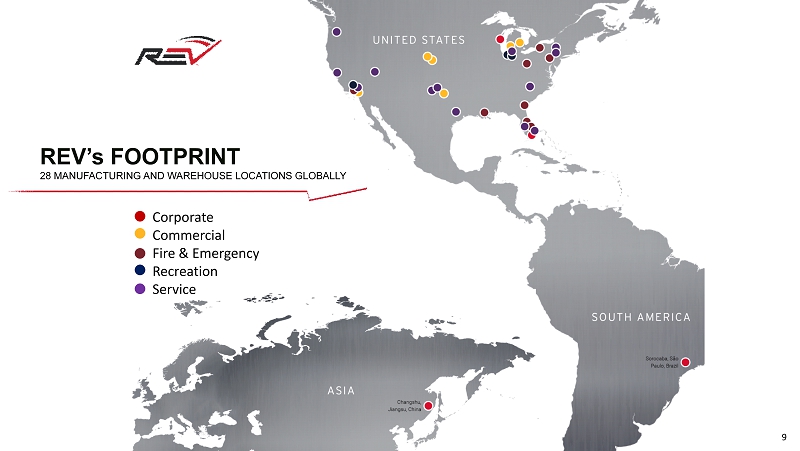
Corporate Commercial Fire & Emergency Recreation Service REV’s FOOTPRINT 28 MANUFACTURING AND WAREHOUSE LOCATIONS GLOBALLY 9

Fiscal 2017 Accomplishments
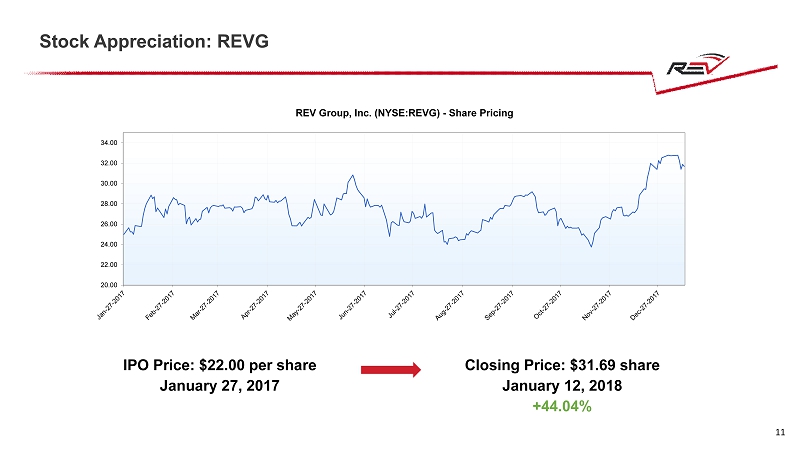
Stock Appreciation: REVG 20.00 22.00 24.00 26.00 28.00 30.00 32.00 34.00 REV Group, Inc. (NYSE:REVG) - Share Pricing IPO Price: $22.00 per share January 27, 2017 Closing Price: $31.69 share January 12, 2018 +44.04% 11
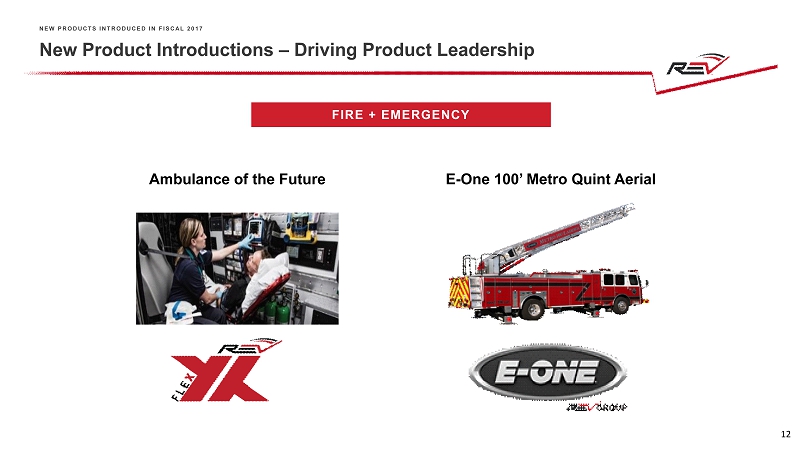
New Product Introductions – Driving Product Leadership Ambulance of the Future NEW PRODUCTS INTRODUCED IN FISCAL 2017 FIRE + EMERGENCY E - One 100’ Metro Quint Aerial 12
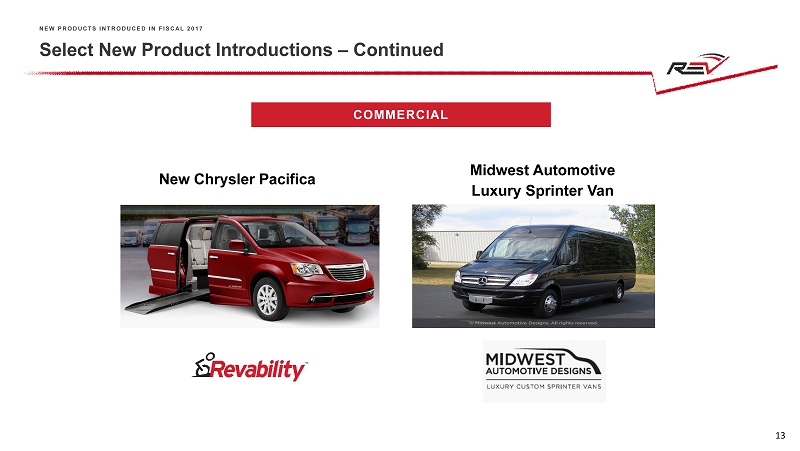
Select New Product Introductions – Continued New Chrysler Pacifica COMMERCIAL Midwest Automotive Luxury Sprinter Van NEW PRODUCTS INTRODUCED IN FISCAL 2017 13

Select New Product Introductions – Continued Ford Transit Hotel Van COMMERCIAL C ollins Low Floor Bus NEW PRODUCTS INTRODUCED IN FISCAL 2017 14
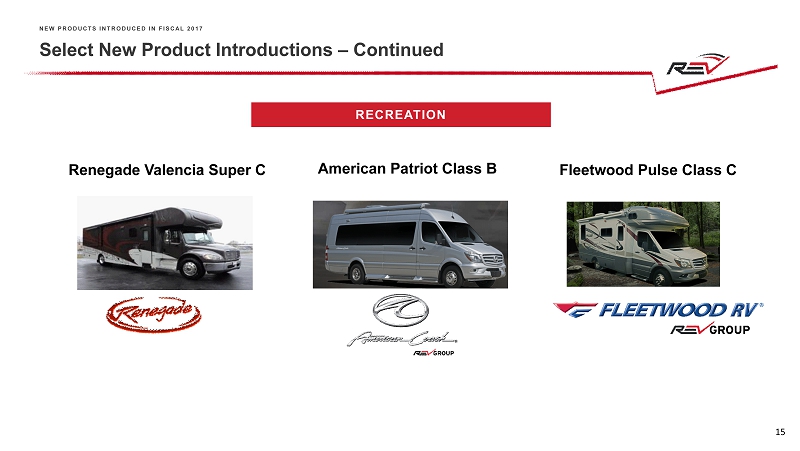
Select New Product Introductions – Continued American Patriot Class B RECREATION Renegade Valencia Super C Fleetwood Pulse Class C NEW PRODUCTS INTRODUCED IN FISCAL 2017 15

FY2017 Completed Acquisitions – Renegade RV RECREATION 16
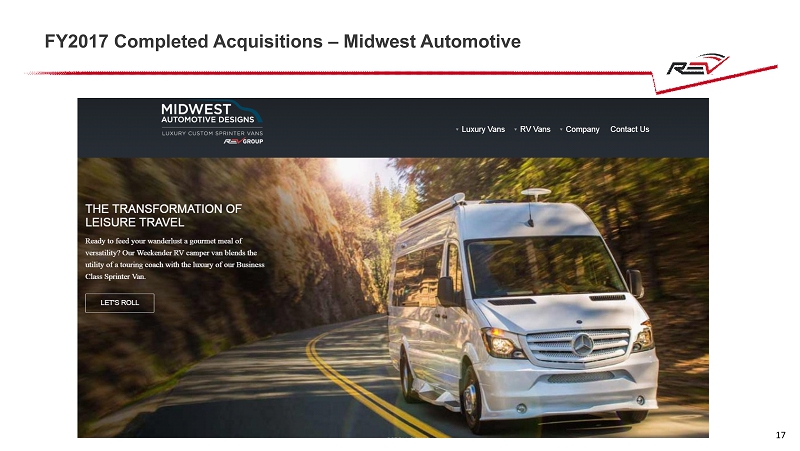
FY2017 Completed Acquisitions – Midwest Automotive RECREATION 17

FY2017 Completed Acquisitions – Ferrara RECREATION 18
FY2017 Completed Acquisitions – AutoAbility 19 RECREATION
Segment Market Updates
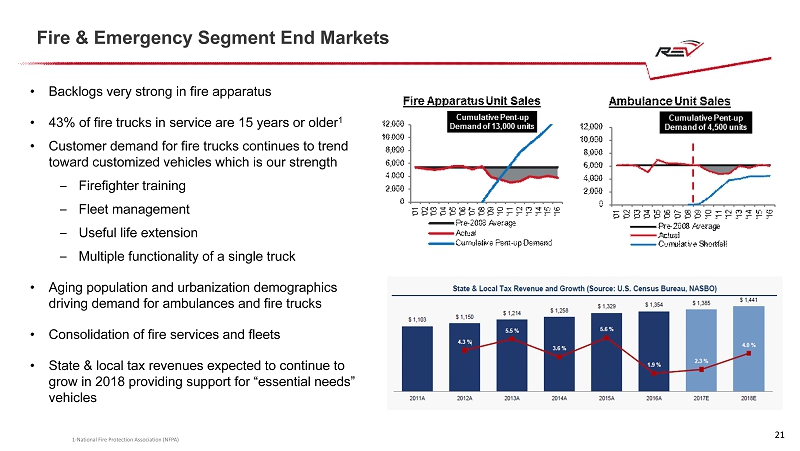
SYNERGY OPPORTUNITIES: SYNERGY OPPORTUNITIES • Backlogs very strong in fire apparatus • 43% of fire trucks in service are 15 years or older 1 • Customer demand for fire trucks continues to trend toward customized vehicles which is our strength – Firefighter training – Fleet management – Useful life extension – Multiple functionality of a single truck • Aging population and urbanization demographics driving demand for ambulances and fire trucks • Consolidation of fire services and fleets • State & local tax revenues expected to continue to grow in 2018 providing support for “essential needs” vehicles 1 - National Fire Protection Association (NFPA) Fire & Emergency Segment End Markets 21
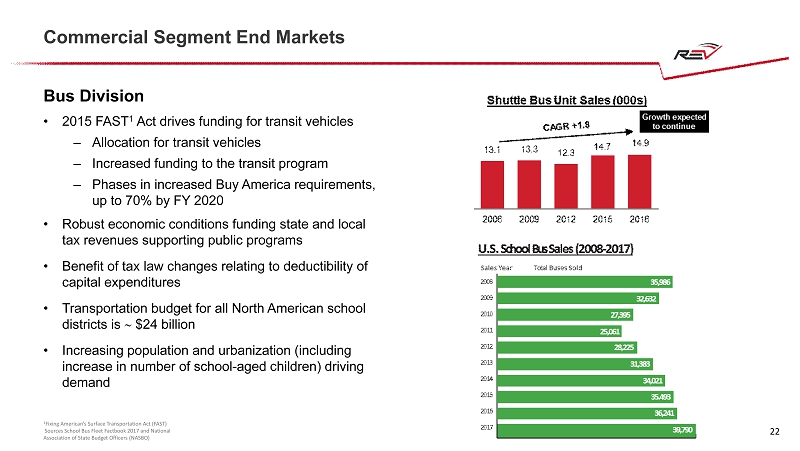
SYNERGY OPPORTUNITIES: SYNERGY OPPORTUNITIES Bus Division • 2015 FAST 1 Act drives funding for transit vehicles – Allocation for transit vehicles – Increased funding to the transit program – Phases in increased Buy America requirements, up to 70% by FY 2020 • Robust economic conditions funding state and local tax revenues supporting public programs • Benefit of tax law changes relating to deductibility of capital expenditures • Transportation budget for all North American school districts is $24 billion • Increasing population and urbanization (including increase in number of school - aged children) driving demand 1 Fixing American’s Surface Transportation Act (FAST) Sources School Bus Fleet Factbook 2017 and National Association of State Budget Officers (NASBO) Commercial Segment End Markets 22

SYNERGY OPPORTUNITIES: SYNERGY OPPORTUNITIES Specialty Division (Terminal Trucks, Sweepers & Mobility Vans) • U.S. rental equipment revenue estimated $49 billion in 2017 • Rental equipment revenue forecast to increase ~ 5% per year through 2021 to $60 billion • Global container market demand continues to increase • “Last Mile” delivery, increasing global trade and expansion of customer distribution footprints drive demand for specialty vehicles • Aging population and urbanization create demand for access vehicles • Government funding and requirements for access vehicles drives growing demand 1 - Drewry Maritime Research Commercial Segment End Markets 23

Recreation Segment End Markets • Improving consumer confidence supports increased demand for RVs • Interest rates and gas prices continue to be at levels that support customer demand • Stronger dealer base than prior to Great Recession • Growth in participation in outdoor activities by Americans, including newer generations • RV retail shipments continue to grow at a strong pace Source: All data points are from RVIA 24

Year - to - Date Fiscal 2018 Accomplishments
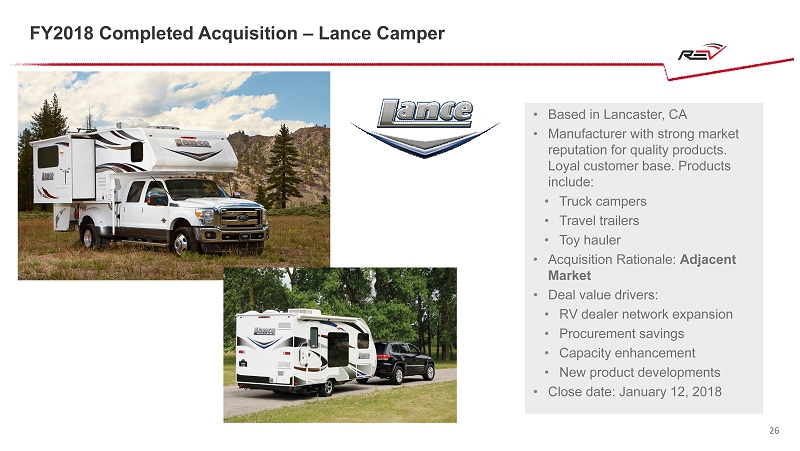
FY2018 Completed Acquisition – Lance Camper • Based in Lancaster, CA • Manufacturer with strong market reputation for quality products. Loyal customer base. Products include: • Truck campers • Travel trailers • Toy hauler • Acquisition Rationale: Adjacent Market • Deal value drivers: • RV dealer network expansion • Procurement savings • Capacity enhancement • New product developments • Close date: January 12, 2018 26
Lance Acquisition Strategic Logic • REV enters largest market segment of the RV industry – 500,000 units per year – >$ 10 billion annually • Lance is a leading, unique and high quality manufacturer of towable RVs – Geographic location opportunity – Won RVIA quality award 16 years straight – Led by outstanding entrepreneurs • Significant synergy opportunities – goal to double the business over time – Procurement – Dealers/distribution channels – Product line expansion – China opportunity (Chery JV) 27

Lance Camper 28
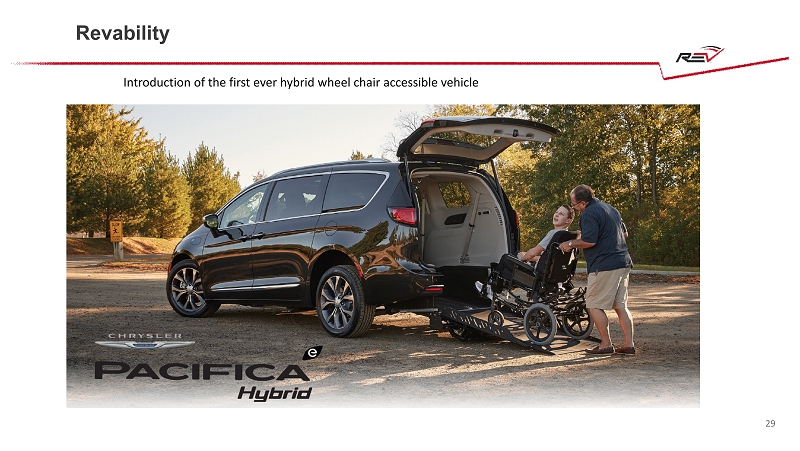
Revability SYNERGY OPPORTUNITIES: SYNERGY OPPORTUNITIES Introduction of the first ever hybrid wheel chair accessible vehicle 29
China JV SYNERGY OPPORTUNITIES: SYNERGY OPPORTUNITIES • Joint venture to manufacture RVs, ambulances and other specialty vehicles for distribution within China and select international markets • The RV industry in China will be fueled by an increased level of spending on travel and leisure, with support from the Chinese government • The ambulance industry in China is poised for strong growth, with replacement demand, more stringent regulatory requirement, an aging population and increase in healthcare budget • Partnership commenced in December 2017 30
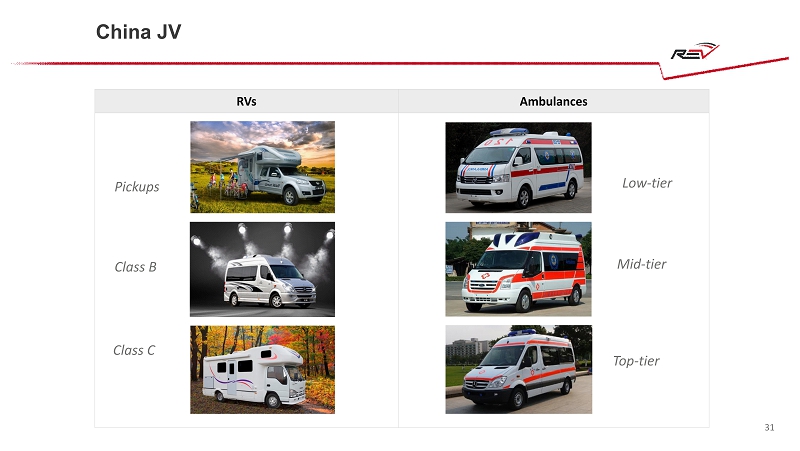
China JV RVs Ambulances Low - tier Mid - tier Top - tier Pickups Class B Class C 31
Daimler Strategic Alliance SYNERGY OPPORTUNITIES: SYNERGY OPPORTUNITIES • Strategic partnership with Daimler in which REV will become the exclusive general distributor for Setra motorcoaches in North America. As the general distributor, REV will represent the Setra brand in: • New and used sales • Aftermarket parts and service • REV will support current Setra operators and leverage existing relationships with motorcoach charter companies to enhance Setra’s market share position • Broader strategic opportunities actively being discussed to further enhance long - term market presence • Partnership commenced in January 2018 32
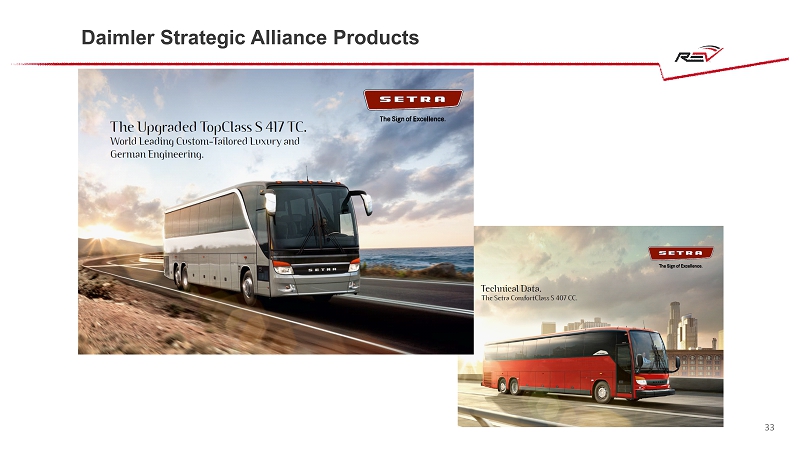
Daimler Strategic Alliance Products 33
REV M&A and International Strategy
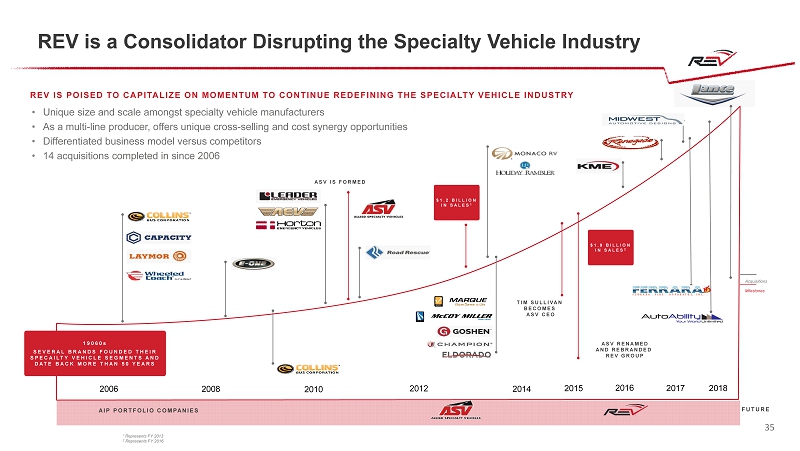
¹ Represents FY 2013 2 Represents FY 2016 REV is a Consolidator Disrupting the Specialty Vehicle Industry 2006 2008 2010 2012 2014 2016 2015 2017 AIP PORTFOLIO COMPANIES FUTURE ASV IS FORMED TIM SULLIVAN BECOMES ASV CEO ASV RENAMED AND REBRANDED REV GROUP $1.2 BILLION IN SALES 1 $1.9 BILLION IN SALES 2 2018 REV IS POISED TO CAPITALIZE ON MOMENTUM TO CONTINUE REDEFINING THE SPECIALTY VEHICLE INDUSTRY • Unique size and scale amongst specialty vehicle manufacturers • As a multi - line producer, offers unique cross - selling and cost synergy opportunities • Differentiated business model versus competitors • 14 acquisitions completed in since 2006 Acquisitions Milestones 19060s SEVERAL BRANDS FOUNDED THEIR SPECAILTY VEHICLE SEGMENTS AND DATE BACK MORE THAN 50 YEARS 35
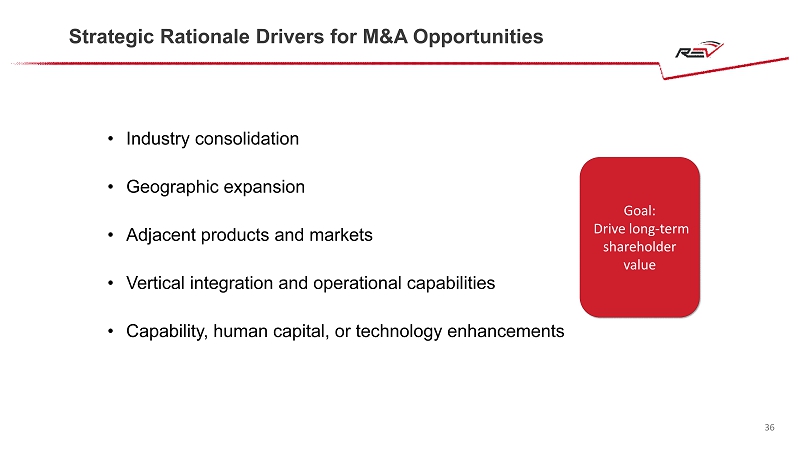
Strategic Rationale Drivers for M&A Opportunities SYNERGY OPPORTUNITIES: SYNERGY OPPORTUNITIES SYNERGY OPPORTUNITIES: SYNERGY OPPORTUNITIES • Industry consolidation • Geographic expansion • Adjacent products and markets • Vertical integration and operational capabilities • Capability, human capital, or technology enhancements Goal: Drive long - term shareholder value 36

Asia Middle East Latin America Overview of International End Market Opportunities 37

REV Finance

REV Finance Wholesale & Retail Programs SYNERGY OPPORTUNITIES: SYNERGY OPPORTUNITIES REV Finance will offer dealers and end - user customers a menu of industry - leading financial solutions, including: ▪ Vehicle Leasing ▪ Vehicle Rentals ▪ Retail Financing ▪ Inventory Financing ▪ Insurance ▪ Used Equipment Sales For All REV Products 39

REV Parts

REV Aftermarket Opportunity & Capabilities SYNERGY OPPORTUNITIES ~$800 MILLION TOTAL ANNUAL VALUE OF REV AFTERMARKET PARTS OPPORTUNITY 12 RTC FACILITIES ~240,000 UNIT INSTALLED BASE ~$27 MILLION INVESTMENT IN WAREHOUSES & RTC’s ONLINE TECHNOLOGY PLATFORM 41

Why REV Parts? SYNERGY OPPORTUNITIES: SYNERGY OPPORTUNITIES • Dedicated management team to oversee aftermarket business • Investing in building out capabilities including four dedicated warehouses • Centralizing aftermarket parts and services business to broaden market coverage • Establishing a web - based platform to provide customers with real time data on parts availability • Establishing new partnerships to enhance capabilities and availability of parts in efficient manner REV 9% Competition 91% 42

Accomplishments to Date FORD PARTNERSHIP RYDER RELATIONSHIP 43

Current REV Parts Distribution Centers 44

Parts Catalog Feature Comparisons 45

Sample Catalog Page Screenshot with Hot Spots 46

Future State Parts Catalog • Fully Integrated Product Support System • Complete 3D Model (Visual Catalo) • Fully Integrated System • Hot Spots (Hover over parts to get part number) Buttons for: Warranty info, Images, 2D, 3D, Audio, Video and PDF 47

REV Parts Portal Progress 2017 • $20 Million in orders in calendar 2017 • 18 of 29 Brands currently live • ~340,000 Vehicle VIN/Serial Numbers • ~5,000 unique visitors with average of 41 times visited • >560,000 Searched 48

REV Solutions

REV Solutions 50

Financial Overview

Impressive Growth and Significant Upside Opportunity REV’s Growth $1,721 $1,735 $1,926 $2,268 $2,400 $2,700 2014 2015 2016 2017 2018 Outlook Revenue Upper end Lower end ($ millions) 52

Impressive Growth and Significant Upside Opportunity 1 See appendix of this presentation for a reconciliation of Adj. EBITDA to Net Income . Note: Refer to the company‘s form S - 1 dated January 17, 2017 for reconciliations of GAAP to Non - GAAP metrics for fiscal years 2 014 - 2016. Refer to the company’s form 8 - K filed on December 19, 2017 for reconciliations of GAAP to Non - GAAP metrics for fiscal year 2017. REV’s Growth $62 $90 $123 $163 $200 2014 2015 2016 2017 2018 Outlook Adjusted EBITDA 1 Upper end Lower end $220 6.4% 3.6% 5.2% 7.2% Margin (%) 53

Impressive Growth and Continued Growth Opportunities ROIC – Return on Invested Capital defined as after - tax Adj. EBITDA divided by total debt, less current maturities, plus total shareholders’ equity; assumes 36.5% effective tax rate for all years presented. $14 $34 $53 $76 2014 2015 2016 2017 2.9% Margin (%) 0.8% ($ millions) 2.0% 3.3% 9.1% 13.1% 15.8% 16.3% 2014 2015 2016 2017 ADJUSTED NET INCOME RETURN ON INVESTED CAPITAL 54

Balance Sheet Strength & Liquidity • Significant progress made in converting working capital to cash • Existing debt reduced with excess cash • Earnings growth drives increased liquidity • Capacity to pursue opportunistic acquisitions Net Debt Net Working Capital % Sales Total Leverage $225 $213 $256 $230 2014 2015 2016 2017 3.4x 2.3x 2.0x 1.3x 2014 2015 2016 2017 16.2% 16.7% 18.8% 20.0% 2014 2015 2016 2017 Note: Net Debt equals total debt less cash and cash equivalents; Net working capital equals A/R + Inventory – A/P; Total leverage is calculated against Adjusted EBITDA $ in millions 55

Full Year Fiscal 2018 Outlook ($ in millions, except shares) Low High Net Sales $2,400 $2 ,700 Net Income $91 $113 Adjusted EBITDA $200 $220 Adjusted Net Income $105 $126 Depreciation & Amortization $48 $47 Interest Expense $23 $21 Effective Tax Rate 20% - 23% 1 Capital Expenditures $50 million Weighted Ave. Diluted Shares 65 million – 66 million See Reconciliations of GAAP to non - GAAP metrics in the Appendix to this presentation 1 – Includes one - time tax benefit of deferred tax revaluation in First Quarter FY2018 of $8 million - $ 9 million 56

Tax Reform Creates Significant Benefits for REV SIGNIFICANT LONG - TERM VALUE CREATION BENEFITS FOR REV FROM TAX REFORM • Including a one - time tax reform benefit related to revaluation of deferred taxes in the first quarter, we expect a fiscal 2018 effective tax rate of 20 - 22% • The first quarter one - time benefit of $8M - $9M relates to revaluation of net deferred tax liability • For fiscal 2018, other than the impact of the Q1 benefit, we expect a normalized tax rate of 27 - 29 % • Fiscal 2019 cash tax decrease estimated at $15 - 20M as a result of U.S. tax reform due to timing of payments • Fiscal 2019 – beyond anticipated effective tax rate of 25 % - 28 % 57

6.4% Adj. EBITDA Margin $123 >8.0% Adj. EBITDA Margin $200 - $220 2016 Adj. EBITDA 2017 Adj. EBITDA Volume & Pricing Cost & Efficiency New Products & Share Aftermarket Parts Impact of Acquisitions 2018 Adj. EBITDA 7.3% Adj. EBITDA Margin $163 Adjusted EBITDA Bridge FY2016 - FY2018 $ in millions 58

First Quarter Fiscal 2018 Guidance See Reconciliations of GAAP to non - GAAP metrics in the Appendix to this presentation 1 – Includes one - time tax benefit of deferred tax revaluation in First Quarter FY2018 of $8 million - $ 9 million ($ in millions, except shares) Low High Net Sales $510 $520 Net Income $5.8 $8.2 Adjusted EBITDA $21.0 $22.0 Adjusted Net Income $5.9 $7.8 Depreciation & Amortization $12.0 $11.5 Interest Expense $5.4 $5.2 Income Tax Benefit $9.3 - $9.6 1 Weighted Avg. Diluted Shares 65 million – 66 million 59

Lance Transaction Summary • Lance annual revenues approximate $100 million over the prior twelve months • Lance profitability is immediately accretive to the overall Recreation segment • Purchase of 100% equity of Lance Campers Mfg. Corp • Treated as an asset acquisition from a tax perspective - tax shield estimated $8 - $10 million • Transaction funded via REV’s upsized $450 million ABL revolving credit facility • Paid reasonable market multiple based on trailing results of Lance • Synergized acquisition multiple in line with prior REV acquisitions 60

Wrap - Up

Q&A

Appendix

Reconciliation of Net Income to Adjusted EBITDA Fiscal Year 2018 Low High Net income 90,900$ 112,900$ Depreciation and Amortization 48,000 47,000 Interest Expense, net 23,000 21,000 Income Tax Expense 25,000 28,000 EBITDA 186,900 208,900 Sponsor Expenses 900 700 Transaction Expenses 800 600 Restructuring Costs 3,600 3,300 Non-Cash Purchase Acct Adj 1,300 1,000 Stock-based Compensation Expense 6,500 5,500 Adjusted EBITDA 200,000$ 220,000$ REV Group, Inc. Adjusted EBITDA Guidance Reconciliation (In thousands) 64 First Quarter FY2018 Low High Net Income 5,800$ 8,200$ Depreciation and Amortization 12,000 11,500 Interest Expense, net 5,400 5,200 Income Tax Benefit (9,600) (9,300) EBITDA 13,600 15,600 Sponsor Expenses 300 200 Transaction Expenses 800 600 Restructuring Costs 3,600 3,300 Non-Cash Purchase Acct Adj 700 600 Stock-Based Compensation Expense 2,000 1,700 Adjusted EBITDA 21,000$ 22,000$ REV Group, Inc. Adjusted EBITDA Guidance Reconciliation (In thousands)

Reconciliation of Net Income to Adjusted Net Income First Quarter FY2018 Low High Net income 5,800$ 8,200$ Amortization of Intangible Assets 5,000 4,000 Sponsor Expenses 300 200 Transaction Expenses 800 600 Restructuring Costs 3,600 3,300 Non-Cash Purchase Acct Adj 700 600 Stock-Based Comp Expense 2,000 1,700 One-Time Tax Benefit (9,000) (8,000) Income Tax Effect of Adjustments (3,300) (2,800) Adjusted Net Income 5,900$ 7,800$ Adjusted Net Income Reconciliation (In thousands) REV Group, Inc. Fiscal Year 2018 Low High Net income 90,900$ 112,900$ Amortization of Intangible Assets 18,500 17,500 Sponsor Expenses 900 700 Transaction Expenses 800 600 Restructuring Costs 3,600 3,300 Non-Cash Purchase Acct Exp 1,300 1,000 Stock-Based Comp Expense 6,500 5,500 One-Time Tax Benefit (9,000) (8,000) Income Tax Effect of Adjustments (8,500) (7,500) Adjusted Net Income 105,000$ 126,000$ (In thousands) REV Group, Inc. Adjusted Net Income Reconciliation 65