August 10, 2017 Merger of Equals Unparalleled Single-Family Rental Portfolio Exhibit 99.2
Forward-Looking Statements This presentation may include forward looking statements within the meaning of the Private Securities Litigation Reform Act of 1995. These forward looking statements, which are based on current expectations, estimates and projections about the industry and markets in which Invitation Homes Inc. (“INVH”) and Starwood Waypoint Homes (“SFR”) operate and beliefs of and assumptions made by INVH management and SFR management, involve significant risks and uncertainties, which are difficult to predict and are not guarantees of future performances, that could significantly affect the financial results of INVH or SFR or the combined company. Words such as “projects,” “will,” “could,” “continue,” “expects,” “anticipates,” “intends,” “plans,” “believes,” “seeks,” “estimates,” “forecast,” “guidance,” “outlook,” “may,” and “might” and variations of such words and similar expressions are intended to identify such forward looking statements, which generally are not historical in nature. Such forward-looking statements may include, but are not limited to, statements about the anticipated benefits of the proposed merger between SFR and INVH, including future financial and operating results, the attractiveness of the value to be received by SFR shareholders, the attractiveness of the value to be received by INVH, the combined company's plans, objectives, expectations and intentions, the timing of future events, anticipated administrative and operating synergies, the anticipated impact of the merger on net debt ratios, cost of capital, future dividend payment rates, forecasts of accretion in Core Funds from Operations (“FFO”), Adjusted Funds from Operations (“AFFO”) or other earnings or performance measures, projected capital improvements, expected sources of financing, and descriptions relating to these expectations. All statements that address operating performance, events or developments that we expect or anticipate will occur in the future — including statements relating to expected synergies, improved liquidity and balance sheet strength — are forward looking statements. Pro forma, projected and estimated numbers are used for illustrative purposes only, are not forecasts and may not reflect actual results. These statements are not guarantees of future performance and involve certain risks, uncertainties and assumptions that are difficult to predict. Our ability to predict results or the actual effect of future events, actions, plans or strategies is inherently uncertain. Although we believe the expectations reflected in any forward-looking statements are based on reasonable assumptions, we can give no assurance that our expectations will be attained and therefore, actual outcomes and results may differ materially from what is expressed or forecasted in such forward looking statements. Some of the factors that may materially and adversely affect our business, financial condition, liquidity, results of operations and prospects, as well as our ability to make distributions to our shareholders, include, but are not limited to: (i) national, regional and local economic climates; (ii) changes in the real estate and single family rental industry, financial markets and interest rates, or to the business or financial condition of either company or business; (iii) increased or unanticipated competition for the companies' properties; (iv) competition in the leasing market for quality residents; (v) increasing property taxes, homeowners’ association fees and insurance costs, (vi) each company’s dependence on third parties for key services; (vii) risks related to evaluation of properties, poor resident selection and defaults and non-renewals by either company’s residents; (viii) risks associated with acquisitions, including the integration of the combined companies' businesses; (ix) the potential liability for the failure to meet regulatory requirements, including the maintenance of real estate investment trust (“REIT”) status; (x) availability of financing and capital; (xi) risks associated with achieving expected revenue synergies or cost savings; (xii) risks associated with the companies' ability to consummate the merger and the timing of the closing of the merger; (xiii) the outcome of claims and litigation involving or affecting either company; (xiv) applicable regulatory changes; and (xv) those additional risks and factors discussed in reports filed with the Securities and Exchange Commission (“SEC”) by INVH and SFR from time to time, including those discussed under the heading “Risk Factors” in their respective most recently filed reports on Forms 10-K and 10-Q. Neither INVH nor SFR, except as required by law, undertakes any duty to update any forward looking statements appearing in this presentation, whether as a result of new information, future events or otherwise. Readers are cautioned not to place undue reliance on these forward-looking statements, which speak only as of the date hereof.
Uniquely Strategic and Beneficial Combination Combining Two Industry Pioneers, Creating a World-Class Residential REIT The premier portfolio in the single-family rental sector Unparalleled scale and focus on high-growth markets Substantial cost synergies to come from portfolio overlap and platform optimization Enhanced leasing and customer experience for residents Led by industry innovators with highly complementary capabilities Poised to capitalize on strong industry fundamentals Positioned to drive superior long-term growth and shareholder value
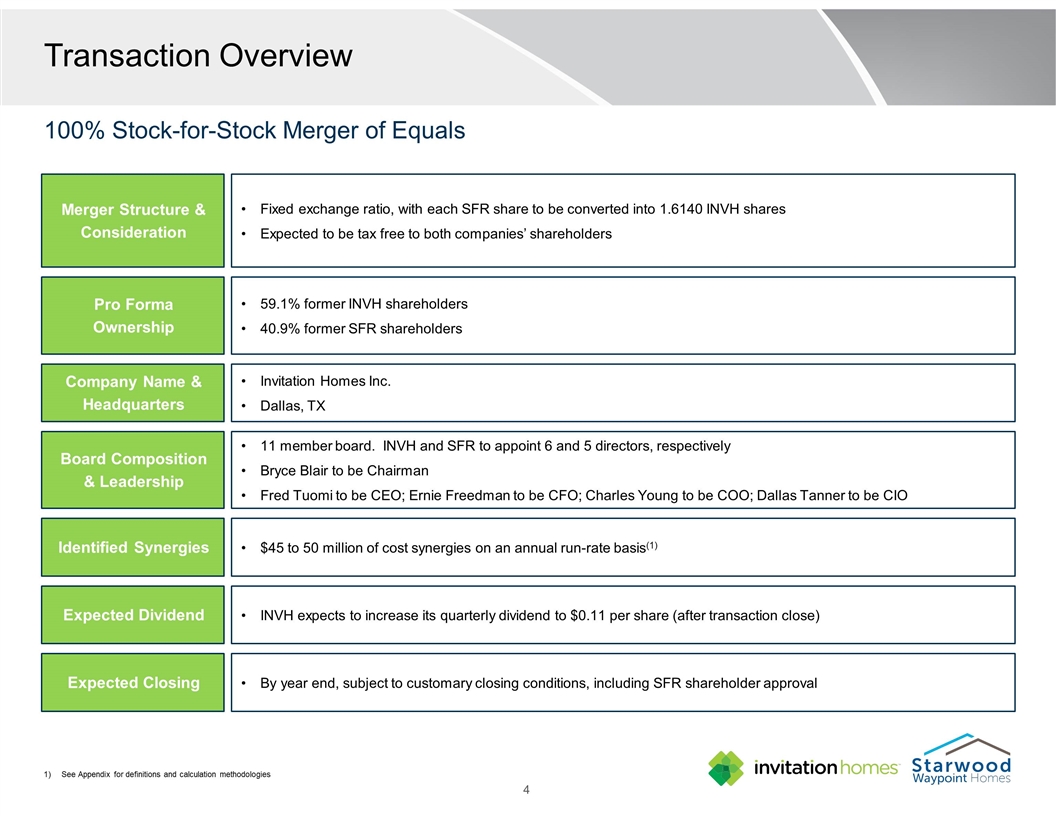
Transaction Overview Invitation Homes Inc. Dallas, TX Company Name & Headquarters 11 member board. INVH and SFR to appoint 6 and 5 directors, respectively Bryce Blair to be Chairman Fred Tuomi to be CEO; Ernie Freedman to be CFO; Charles Young to be COO; Dallas Tanner to be CIO Board Composition & Leadership By year end, subject to customary closing conditions, including SFR shareholder approval Expected Closing Fixed exchange ratio, with each SFR share to be converted into 1.6140 INVH shares Expected to be tax free to both companies’ shareholders Merger Structure & Consideration $45 to 50 million of cost synergies on an annual run-rate basis(1) Identified Synergies 59.1% former INVH shareholders 40.9% former SFR shareholders Pro Forma Ownership Expected Dividend INVH expects to increase its quarterly dividend to $0.11 per share (after transaction close) 100% Stock-for-Stock Merger of Equals See Appendix for definitions and calculation methodologies
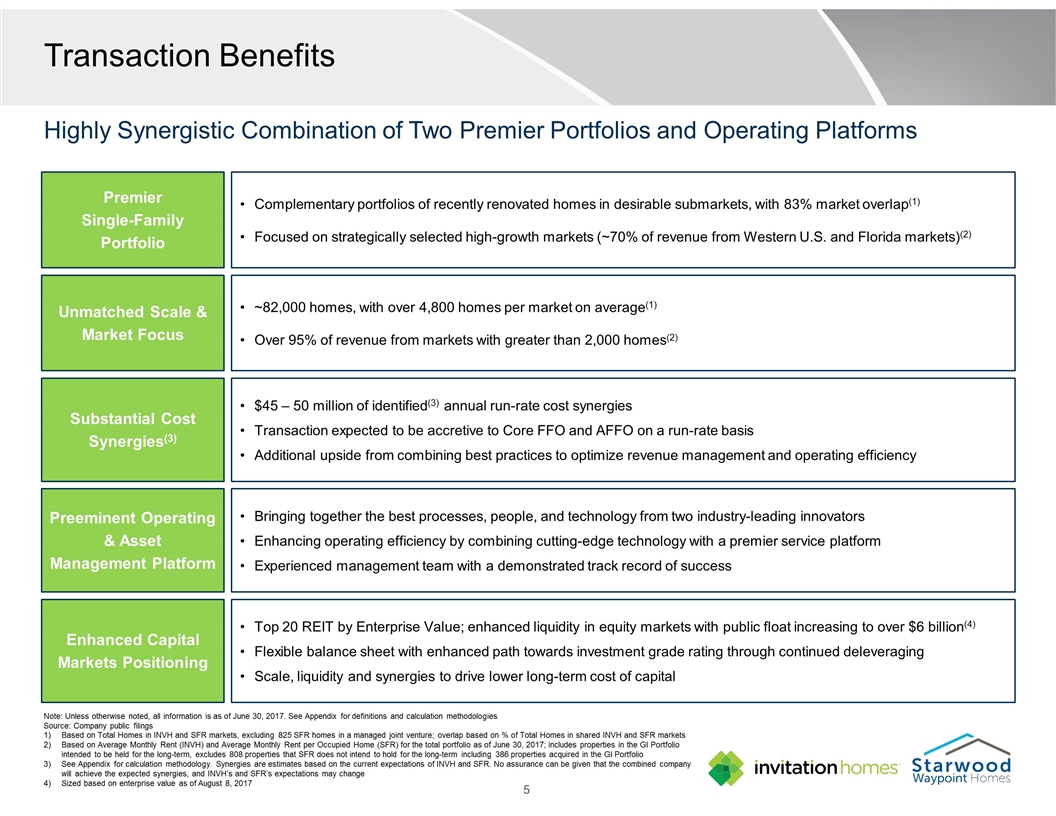
Transaction Benefits Bringing together the best processes, people, and technology from two industry-leading innovators Enhancing operating efficiency by combining cutting-edge technology with a premier service platform Experienced management team with a demonstrated track record of success Preeminent Operating & Asset Management Platform $45 – 50 million of identified(3) annual run-rate cost synergies Transaction expected to be accretive to Core FFO and AFFO on a run-rate basis Additional upside from combining best practices to optimize revenue management and operating efficiency Substantial Cost Synergies(3) Complementary portfolios of recently renovated homes in desirable submarkets, with 83% market overlap(1) Focused on strategically selected high-growth markets (~70% of revenue from Western U.S. and Florida markets)(2) Premier Single-Family Portfolio Top 20 REIT by Enterprise Value; enhanced liquidity in equity markets with public float increasing to over $6 billion(4) Flexible balance sheet with enhanced path towards investment grade rating through continued deleveraging Scale, liquidity and synergies to drive lower long-term cost of capital Enhanced Capital Markets Positioning ~82,000 homes, with over 4,800 homes per market on average(1) Over 95% of revenue from markets with greater than 2,000 homes(2) Unmatched Scale & Market Focus Highly Synergistic Combination of Two Premier Portfolios and Operating Platforms Note: Unless otherwise noted, all information is as of June 30, 2017. See Appendix for definitions and calculation methodologies Source: Company public filings Based on Total Homes in INVH and SFR markets, excluding 825 SFR homes in a managed joint venture; overlap based on % of Total Homes in shared INVH and SFR markets Based on Average Monthly Rent (INVH) and Average Monthly Rent per Occupied Home (SFR) for the total portfolio as of June 30, 2017; includes properties in the GI Portfolio intended to be held for the long-term, excludes 808 properties that SFR does not intend to hold for the long-term including 386 properties acquired in the GI Portfolio See Appendix for calculation methodology. Synergies are estimates based on the current expectations of INVH and SFR. No assurance can be given that the combined company will achieve the expected synergies, and INVH’s and SFR’s expectations may change Sized based on enterprise value as of August 8, 2017

True Merger of Equals – Compelling Strategic Logic Portfolios are Nearly Identical on Major Metrics Note: Unless otherwise noted, all information is as of June 30, 2017. See Appendix for definitions and calculation methodologies Source: Company public filings Based on Average Monthly Rent (INVH) and Average Monthly Rent per Occupied Home (SFR) for the total portfolio as of June 30, 2017; includes properties in the GI Portfolio intended to be held for the long-term, excludes 808 properties that SFR does not intend to hold for the long-term including 386 properties acquired in the GI Portfolio Reflects average new and renewal rent growth for YTD 2Q 2017 Reflects Same Store average occupancy in 2Q 2017 for INVH and Same Store occupancy as of June 30, 2017 for SFR Average Rent PSF Blended Same Store Rent Growth(2) Same Store Occupancy(3) % of Revenue Generated in Western U.S. and Florida Markets(1) Average Monthly Rent(1) $0.89 +4.8% 95.1% 64% $1,629 $0.90 +4.8% 95.9% 72% $1,683
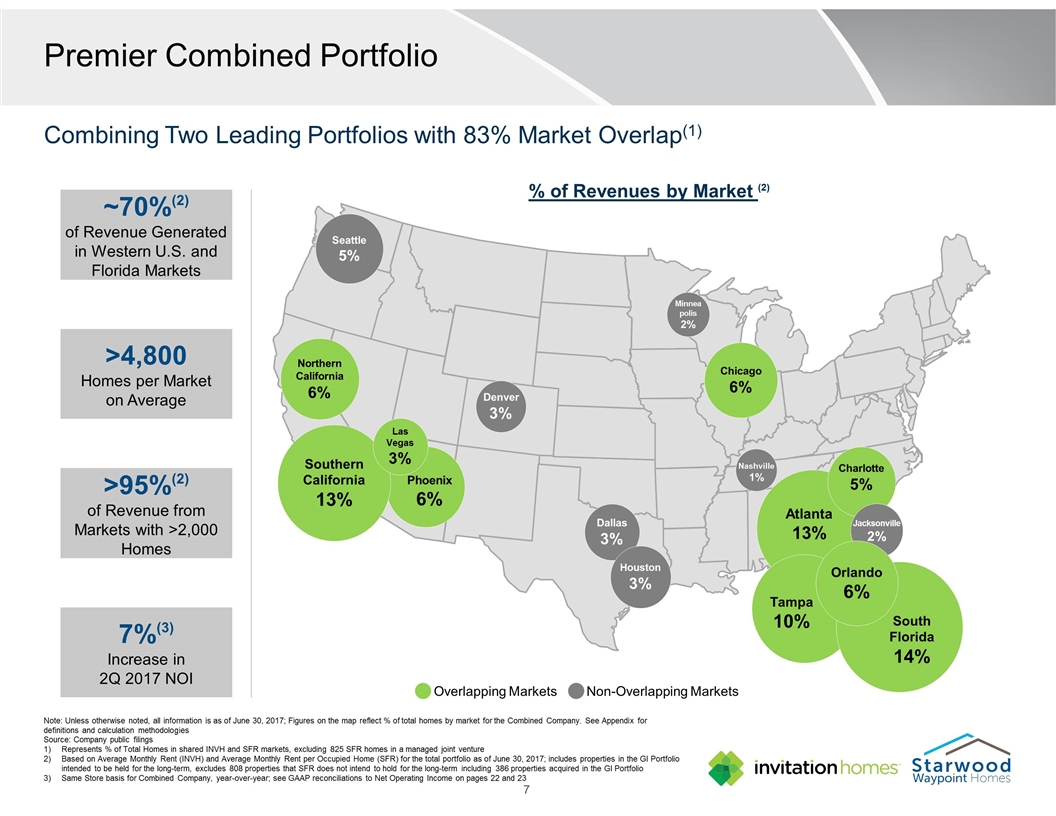
Premier Combined Portfolio Note: Unless otherwise noted, all information is as of June 30, 2017; Figures on the map reflect % of total homes by market for the Combined Company. See Appendix for definitions and calculation methodologies Source: Company public filings Represents % of Total Homes in shared INVH and SFR markets, excluding 825 SFR homes in a managed joint venture Based on Average Monthly Rent (INVH) and Average Monthly Rent per Occupied Home (SFR) for the total portfolio as of June 30, 2017; includes properties in the GI Portfolio intended to be held for the long-term, excludes 808 properties that SFR does not intend to hold for the long-term including 386 properties acquired in the GI Portfolio Same Store basis for Combined Company, year-over-year; see GAAP reconciliations to Net Operating Income on pages 22 and 23 Overlapping Markets Combining Two Leading Portfolios with 83% Market Overlap(1) Seattle 5% Minneapolis 2% Denver 3% Dallas 3% Houston 3% ~70%(2) of Revenue Generated in Western U.S. and Florida Markets >4,800 Homes per Market on Average Phoenix 6% Atlanta 13% Chicago 6% Tampa 10% Southern California 13% Las Vegas 3% South Florida 14% Non-Overlapping Markets Northern California 6% Charlotte 5% Nashville 1% Jacksonville 2% Orlando 6% >95%(2) of Revenue from Markets with >2,000 Homes % of Revenues by Market (2) 7%(3) Increase in 2Q 2017 NOI
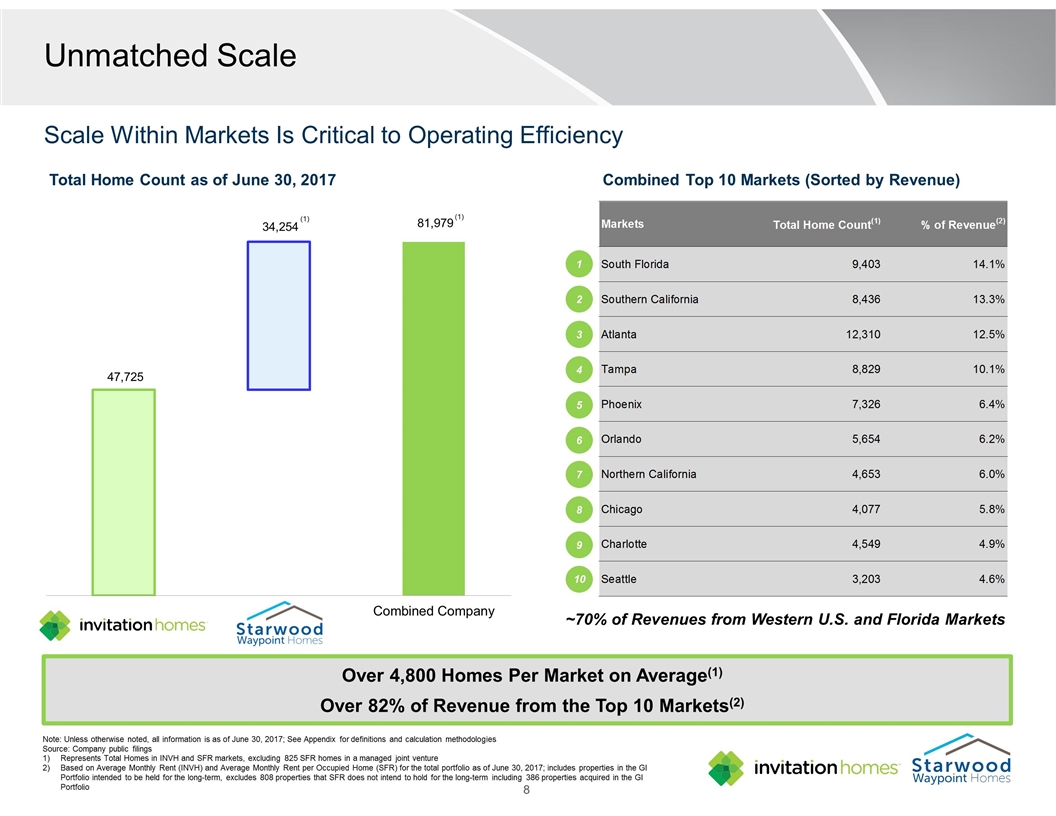
Unmatched Scale Scale Within Markets Is Critical to Operating Efficiency Total Home Count as of June 30, 2017 Combined Top 10 Markets (Sorted by Revenue) Over 4,800 Homes Per Market on Average(1) Over 82% of Revenue from the Top 10 Markets(2) ~70% of Revenues from Western U.S. and Florida Markets (1) Note: Unless otherwise noted, all information is as of June 30, 2017; See Appendix for definitions and calculation methodologies Source: Company public filings Represents Total Homes in INVH and SFR markets, excluding 825 SFR homes in a managed joint venture Based on Average Monthly Rent (INVH) and Average Monthly Rent per Occupied Home (SFR) for the total portfolio as of June 30, 2017; includes properties in the GI Portfolio intended to be held for the long-term, excludes 808 properties that SFR does not intend to hold for the long-term including 386 properties acquired in the GI Portfolio (1) 1 2 3 4 5 6 7 8 9 10
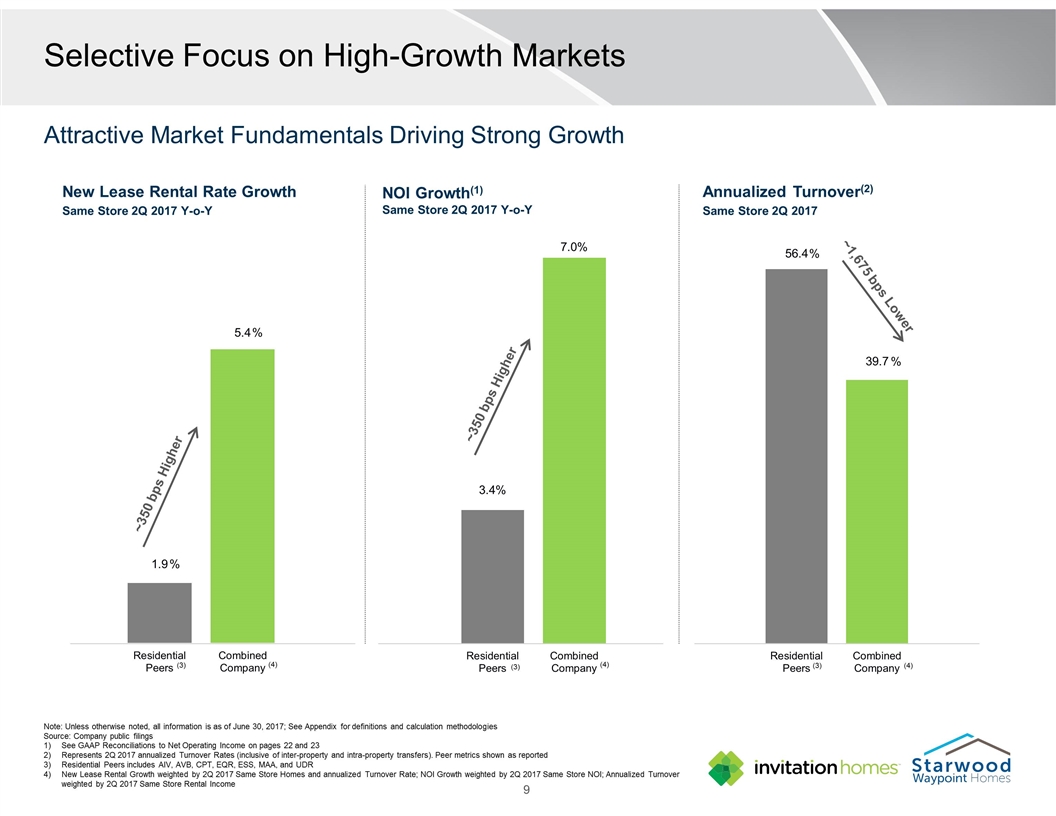
Note: Unless otherwise noted, all information is as of June 30, 2017; See Appendix for definitions and calculation methodologies Source: Company public filings See GAAP Reconciliations to Net Operating Income on pages 22 and 23 Represents 2Q 2017 annualized Turnover Rates (inclusive of inter-property and intra-property transfers). Peer metrics shown as reported Residential Peers includes AIV, AVB, CPT, EQR, ESS, MAA, and UDR New Lease Rental Growth weighted by 2Q 2017 Same Store Homes and annualized Turnover Rate; NOI Growth weighted by 2Q 2017 Same Store NOI; Annualized Turnover weighted by 2Q 2017 Same Store Rental Income Selective Focus on High-Growth Markets Attractive Market Fundamentals Driving Strong Growth NOI Growth(1) Same Store 2Q 2017 Y-o-Y (3) (4) ~350 bps Higher Annualized Turnover(2) Same Store 2Q 2017 (3) (4) ~1,675 bps Lower New Lease Rental Rate Growth Same Store 2Q 2017 Y-o-Y ~350 bps Higher (3) (4) % % % %
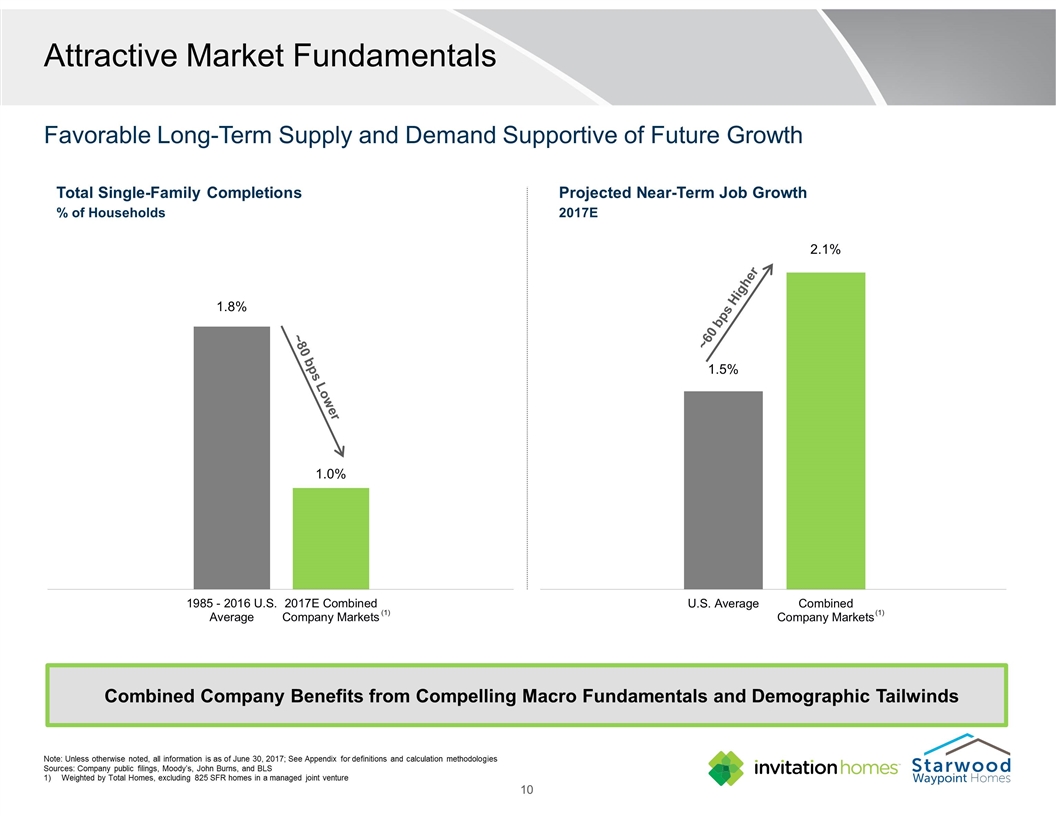
Note: Unless otherwise noted, all information is as of June 30, 2017; See Appendix for definitions and calculation methodologies Sources: Company public filings, Moody’s, John Burns, and BLS Weighted by Total Homes, excluding 825 SFR homes in a managed joint venture Total Single-Family Completions % of Households Attractive Market Fundamentals Favorable Long-Term Supply and Demand Supportive of Future Growth ~80 bps Lower (4) (3) Projected Near-Term Job Growth 2017E ~60 bps Higher Combined Company Benefits from Compelling Macro Fundamentals and Demographic Tailwinds (1) (1)
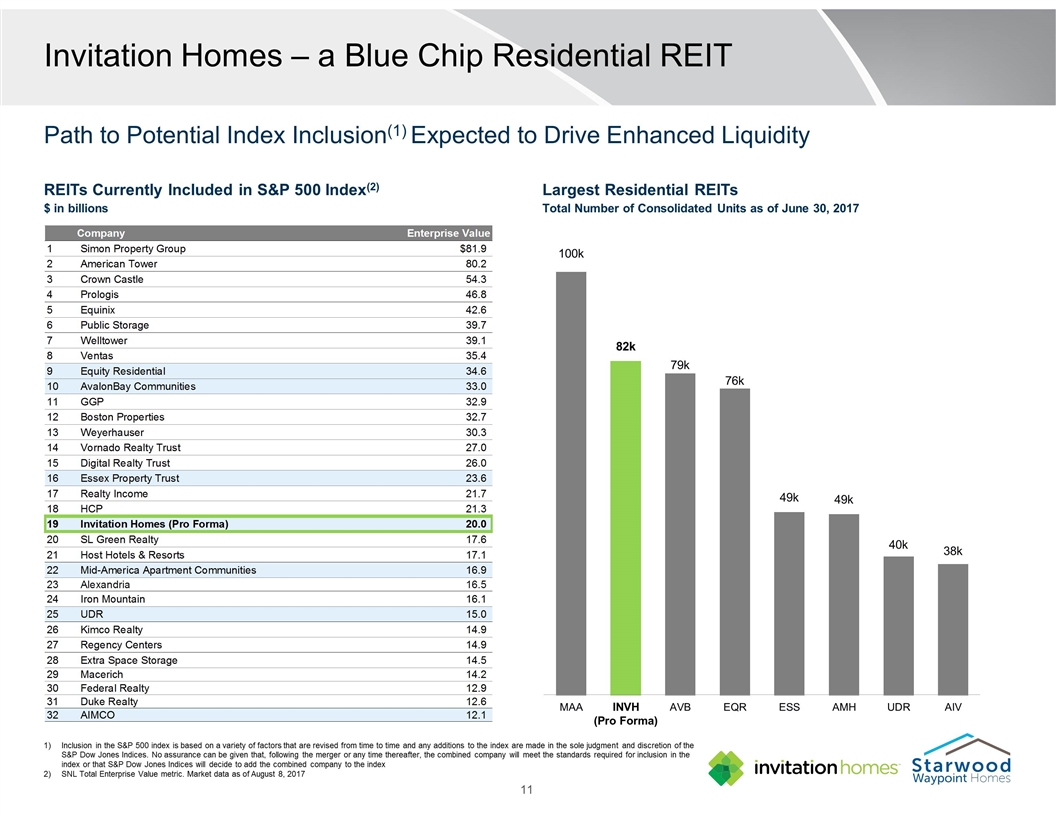
REITs Currently Included in S&P 500 Index(2) $ in billions Invitation Homes – a Blue Chip Residential REIT Path to Potential Index Inclusion(1) Expected to Drive Enhanced Liquidity Inclusion in the S&P 500 index is based on a variety of factors that are revised from time to time and any additions to the index are made in the sole judgment and discretion of the S&P Dow Jones Indices. No assurance can be given that, following the merger or any time thereafter, the combined company will meet the standards required for inclusion in the index or that S&P Dow Jones Indices will decide to add the combined company to the index SNL Total Enterprise Value metric. Market data as of August 8, 2017 Largest Residential REITs Total Number of Consolidated Units as of June 30, 2017 INVH (Pro Forma)
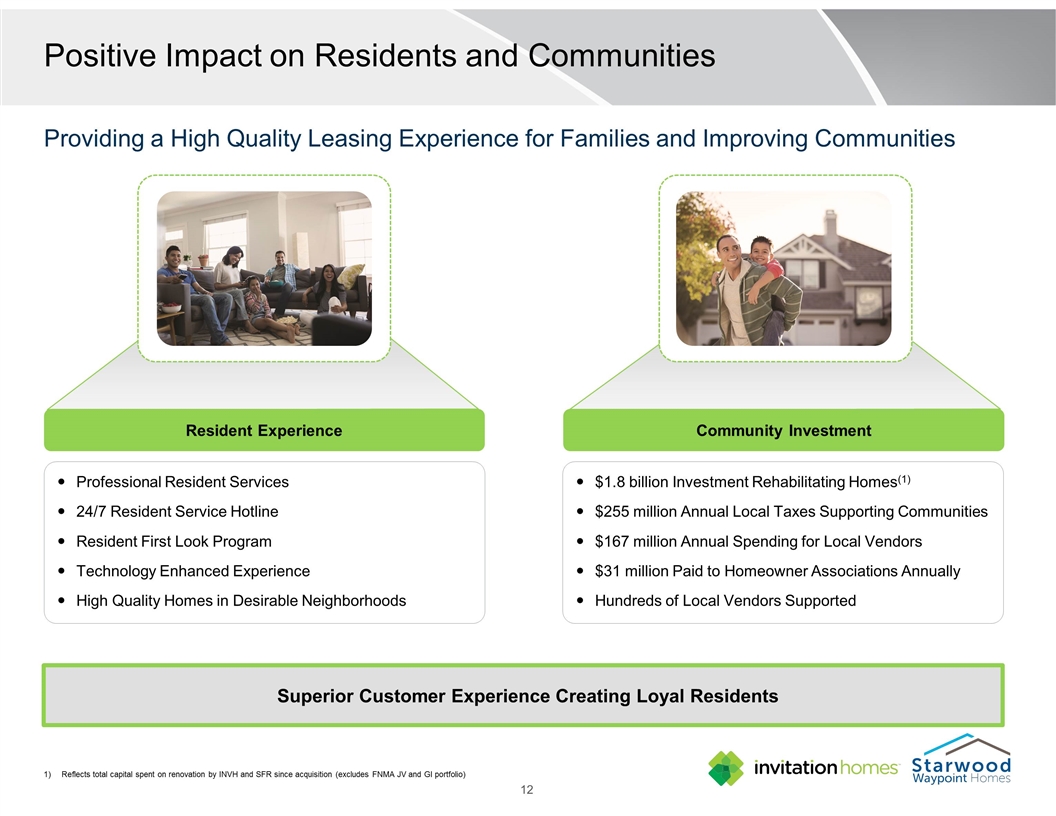
Superior Customer Experience Creating Loyal Residents Positive Impact on Residents and Communities Providing a High Quality Leasing Experience for Families and Improving Communities $1.8 billion Investment Rehabilitating Homes(1) $255 million Annual Local Taxes Supporting Communities $167 million Annual Spending for Local Vendors $31 million Paid to Homeowner Associations Annually Hundreds of Local Vendors Supported Professional Resident Services 24/7 Resident Service Hotline Resident First Look Program Technology Enhanced Experience High Quality Homes in Desirable Neighborhoods Community Investment Resident Experience Reflects total capital spent on renovation by INVH and SFR since acquisition (excludes FNMA JV and GI portfolio)
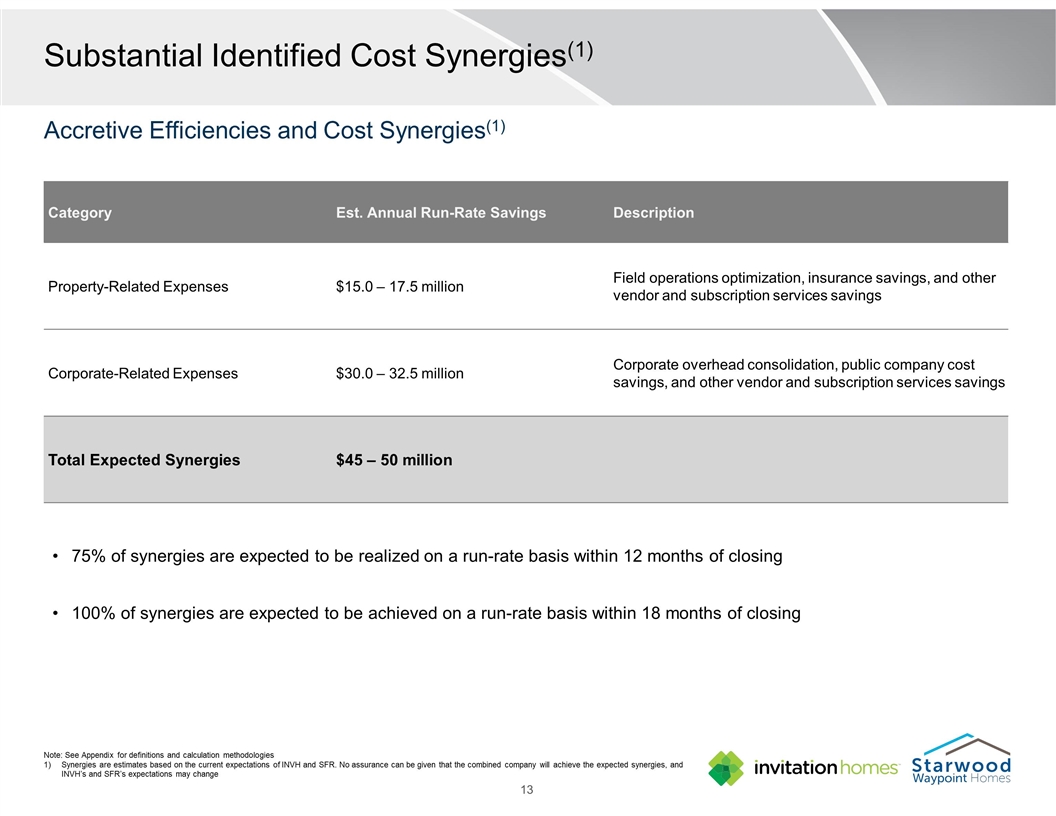
Category Est. Annual Run-Rate Savings Description Property-Related Expenses $15.0 – 17.5 million Field operations optimization, insurance savings, and other vendor and subscription services savings Corporate-Related Expenses $30.0 – 32.5 million Corporate overhead consolidation, public company cost savings, and other vendor and subscription services savings Total Expected Synergies $45 – 50 million Substantial Identified Cost Synergies(1) Accretive Efficiencies and Cost Synergies(1) 75% of synergies are expected to be realized on a run-rate basis within 12 months of closing 100% of synergies are expected to be achieved on a run-rate basis within 18 months of closing Note: See Appendix for definitions and calculation methodologies Synergies are estimates based on the current expectations of INVH and SFR. No assurance can be given that the combined company will achieve the expected synergies, and INVH’s and SFR’s expectations may change
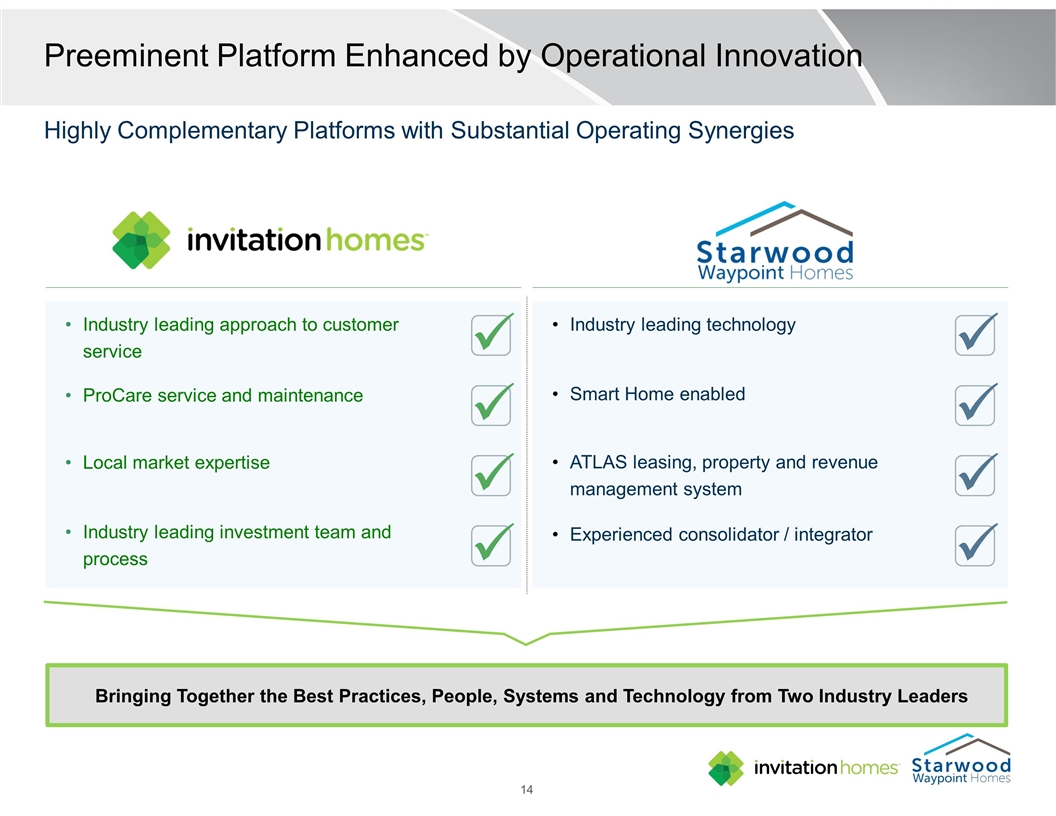
Preeminent Platform Enhanced by Operational Innovation (1) Highly Complementary Platforms with Substantial Operating Synergies ü ü ü ü ü ü ü ü Industry leading approach to customer service ProCare service and maintenance Local market expertise Industry leading investment team and process Industry leading technology Smart Home enabled ATLAS leasing, property and revenue management system Experienced consolidator / integrator Bringing Together the Best Practices, People, Systems and Technology from Two Industry Leaders
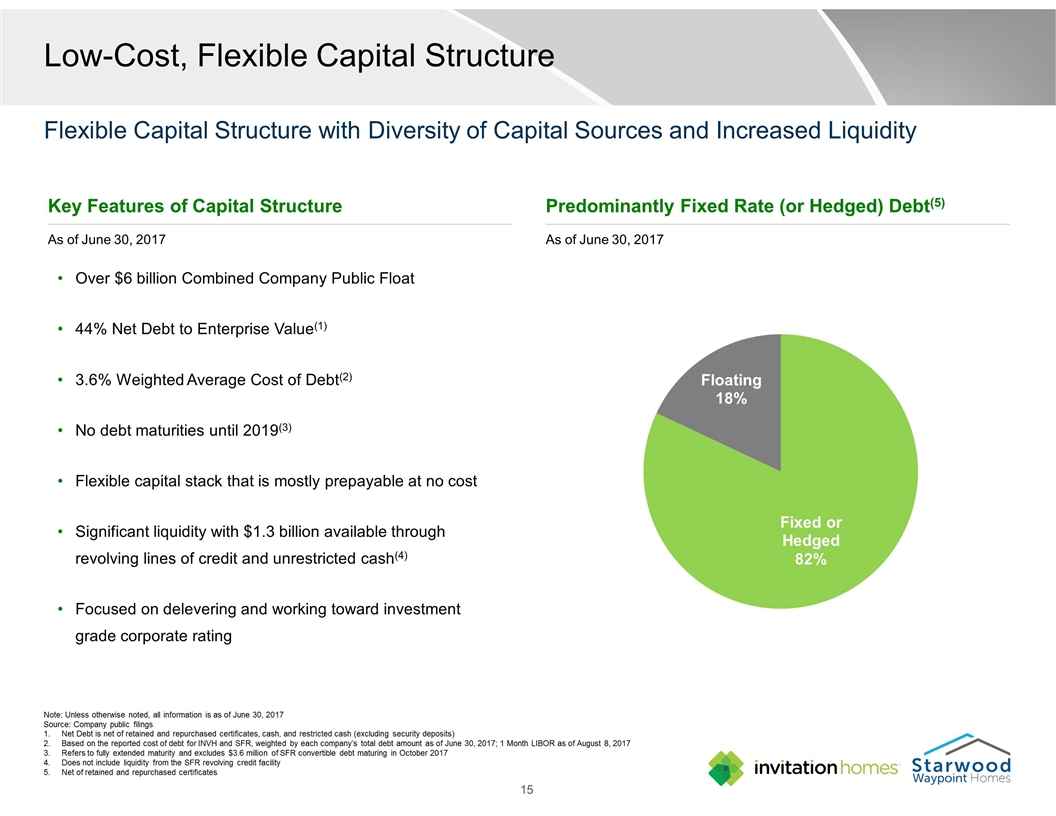
Predominantly Fixed Rate (or Hedged) Debt(5) As of June 30, 2017 Key Features of Capital Structure As of June 30, 2017 Low-Cost, Flexible Capital Structure Flexible Capital Structure with Diversity of Capital Sources and Increased Liquidity Note: Unless otherwise noted, all information is as of June 30, 2017 Source: Company public filings Net Debt is net of retained and repurchased certificates, cash, and restricted cash (excluding security deposits) Based on the reported cost of debt for INVH and SFR, weighted by each company’s total debt amount as of June 30, 2017; 1 Month LIBOR as of August 8, 2017 Refers to fully extended maturity and excludes $3.6 million of SFR convertible debt maturing in October 2017 Does not include liquidity from the SFR revolving credit facility Net of retained and repurchased certificates Over $6 billion Combined Company Public Float 44% Net Debt to Enterprise Value(1) 3.6% Weighted Average Cost of Debt(2) No debt maturities until 2019(3) Flexible capital stack that is mostly prepayable at no cost Significant liquidity with $1.3 billion available through revolving lines of credit and unrestricted cash(4) Focused on delevering and working toward investment grade corporate rating

Premier Leadership Team Bringing Together the Best of Two Accomplished Leadership Teams Legacy INVH Legacy SFR Experience Current Executive Chairman, Invitation Homes AvalonBay Communities (NYSE: AVB) Trammell Crow Residential Current Board Positions: PulteGroup and Regency Centers Bryce Blair Chairman, Board of Directors Experience Current CFO, Invitation Homes AIMCO (NYSE: AIV) HEI Hotels & Resorts GE Real Estate Ernst & Young Ernest M. Freedman Chief Financial Officer Experience Current CIO, Invitation Homes Invitation Homes Founder Treehouse Group Dallas B. Tanner Chief Investment Officer Experience Current CEO, Starwood Waypoint Homes Colony American Homes Equity Residential (NYSE: EQR) Residential Asset Management Group National Rental Home Council National Multi-Housing Council California Housing Council USC Lusk Center for Real Estate Frederick C. Tuomi President and Chief Executive Officer Experience Current COO, Starwood Waypoint Homes Waypoint Manager Mesa Development Goldman Sachs & Co. The Kaleidoscope Group Stanford Real Estate Council Charles D. Young Chief Operations Officer
Uniquely Strategic and Beneficial Combination The premier portfolio in the single-family rental sector Unparalleled scale and focus on high-growth markets Substantial cost synergies to come from portfolio overlap and platform optimization Enhanced leasing and customer experience for residents Led by industry innovators with highly complementary capabilities Poised to capitalize on strong industry fundamentals Positioned to drive superior long-term growth and shareholder value Combining Two Industry Pioneers, Creating a World-Class Residential REIT
Additional Information About this Transaction Additional Information about the Proposed Merger and Where to Find It This communication relates to the proposed merger transaction pursuant to the terms of the Agreement and Plan of Merger, dated as of August 9, 2017, by and among INVH, Invitation Homes Operating Partnership LP, IH Merger Sub, LLC, SFR and Starwood Waypoint Homes Partnership, L.P. In connection with the proposed merger, INVH expects to file with the SEC a registration statement on Form S-4 that will include a joint proxy statement of SFR and information statement of INVH that also constitutes a prospectus (the “joint proxy/information statement/prospectus”) which joint proxy/information statement/prospectus will be mailed or otherwise disseminated to INVH stockholders and SFR shareholders when it becomes available. INVH and SFR also plan to file other relevant documents with the SEC regarding the proposed transaction. INVESTORS ARE URGED TO READ THE JOINT PROXY/ INFORMATION STATEMENT/PROSPECTUS AND OTHER RELEVANT DOCUMENTS FILED WITH THE SEC IF AND WHEN THEY BECOME AVAILABLE BECAUSE THEY WILL CONTAIN IMPORTANT INFORMATION. You may obtain a free copy of the joint proxy/information statement/prospectus and other relevant documents (if and when they become available) filed by INVH and SFR with the SEC at the SEC's website at www.sec.gov. Copies of the documents filed by INVH with the SEC will be available free of charge on INVH's website at www.invitiationhomes.com or by emailing INVH Investor Relations at ir@invitationhomes.com or at 844-456-4684. Copies of the documents filed by SFR with the SEC will be available free of charge on SFR's website at www.starwoodwaypoint.com or by contacting SFR Investor Relations at ir@colonystarwood.com or at 480-800-3490. Certain Information Regarding Participants INVH and SFR and certain of their respective trustees, directors and executive officers and other members of management and employees may be deemed to be participants in the solicitation of proxies in respect of the proposed merger. You can find information about INVH’s executive officers and directors in INVH's Annual Report on Form 10-K for the year ended December 31, 2016 and its Current Reports of Form 8-K filed with the SEC on February 6, 2017, March 20, 2017 and June 29, 2017. You can find information about SFR’s executive officers and trustees in SFR’s Annual Report on Form 10-K for the year ended December 31, 2016, its Quarterly Report on Form 10-Q for the quarterly period ended March 31, 2017, and its Definitive Proxy Statement on Schedule 14A filed with the SEC on March 31, 2017 in connection with its 2017 annual meeting of shareholders. Additional information regarding the interests of such potential participants will be included in the joint proxy/information statement/prospectus and other relevant documents filed with the SEC if and when they become available. You may obtain free copies of these documents from INVH or SFR using the sources indicated above. No Offer of Solicitation This presentation shall not constitute an offer to sell or the solicitation of an offer to buy any securities, nor shall there be any sale of securities in any jurisdiction in which such offer, solicitation or sale would be unlawful prior to registration or qualification under the securities laws of any such jurisdiction. No offering of securities shall be made except by means of a prospectus meeting the requirements of Section 10 of the U.S. Securities Act of 1933, as amended.
Appendix A Average Monthly Rent. As defined by INVH, represents the average of the contracted monthly rent for occupied properties in an identified population of homes for the relevant period and reflects rent concessions amortized over the life of the related lease. Average Monthly Rent per Occupied Home. As defined by SFR, calculated by dividing a) the aggregate monthly contractual cash rent (excluding rent concessions and incentives) for an identified population of occupied rental units by b) the number of rental units in the identified population. To date, rent concessions and incentives have been utilized on a limited basis and have not had a significant impact on the SFR portfolio’s average monthly rent. Adjusted Funds from Operations (“AFFO”). As defined by INVH, AFFO is Core FFO less recurring capital expenditures that are necessary to help preserve the value of and maintain functionality of INVH’s homes. Core Adjusted Funds from Operations (“Core AFFO”). As defined by SFR, Core AFFO, or Core Adjusted FFO, is a non-GAAP financial measure that SFR believes assists investors in assessing the results of SFR’s single-family rental business as it allows investors to compare its operating performance to prior reporting periods without the effect of certain items that, by nature, are not comparable from period to period. Core AFFO adjusts Core FFO (defined below) to eliminate the impact of recurring capital expenditures and capitalized leasing costs incurred during the period. Core AFFO and Core AFFO per share are not a substitute for net income (loss) per share or net cash flow provided by operating activities, as determined in accordance with GAAP, as a measure of SFR’s operating performance, liquidity or ability to pay dividends as they exclude certain items that require cash settlements in the periods presented. These metrics also are not necessarily indicative of cash available to fund future cash needs. Because other REITs may not compute these measures in the same manner, they may not be comparable among REITs. Core Funds from Operations (“Core FFO”). As defined by INVH, Core FFO is net income or loss (computed in accordance with GAAP) excluding net gains or losses from sales of previously depreciated real estate assets, plus depreciation, amortization and impairment of real estate assets, and adjustments for unconsolidated partnerships and joint ventures. Core Funds from Operations (“Core FFO”). As defined by SFR, Core FFO is a non-GAAP financial measure of operating performance that SFR believes assists investors in assessing the results of SFR’s single-family rental business, which is its core operating business as it allows investors to compare our operating performance to prior reporting periods without the effect of certain items that, by nature, are not comparable from period to period. Core FFO adjusts NAREIT FFO to eliminate the impact of certain items that SFR believes are not indicative of its core operating performance. SFR’s Core FFO begins with NAREIT FFO and is adjusted for amortization of deferred financing costs, debt premium discounts, share-based compensation, loss on derivative financial instruments, amortization of derivative financial instruments, non-cash interest expense and loss on extinguishment of debt. Core FFO and Core FFO per share does not represent cash generated from operating activities determined in accordance with GAAP, and is not necessarily indicative of cash available to fund cash needs and should not be considered as an alternative to net income (determined in accordance with GAAP) as a performance measure. Because other REITs may not compute these measures in the same manner, they may not be comparable among REITs. Cost Synergies. Expected synergies of $45-50MM exclude one-time integration costs, such as severance, office lease termination, among others as well as any potential Prop.13 tax impact.
Appendix A (Cont’d) NAREIT FFO. FFO is defined by the National Association of Real Estate Investment Trusts (“NAREIT”) as net income or loss (computed in accordance with GAAP) excluding net gains or losses from sales of previously depreciated real estate assets, plus depreciation, amortization and impairment of real estate assets, and adjustments for unconsolidated partnerships and joint ventures. Net Operating Income (“NOI”). As defined by INVH, NOI is a non-GAAP measure often used to evaluate the performance of real estate companies. INVH defines NOI for an identified population of homes as rental revenues and other property income less property operating and maintenance expense (which consists primarily of property taxes, insurance, HOA fees (when applicable), market-level personnel expenses, repairs and maintenance, leasing costs and marketing). NOI excludes: interest expense; depreciation and amortization; general and administrative expense; property management expense; impairment and other; acquisition costs; (gain) loss on sale of property, net of tax; and interest income and other miscellaneous income and expenses. The GAAP measure most directly comparable to NOI is net income or loss. NOI is not used as a measure of liquidity and should not be considered as an alternative to net income or loss or any other measure of financial performance presented in accordance with GAAP. INVH’s NOI may not be comparable to the NOI of other companies due to the fact that not all companies use the same definition of NOI. Accordingly, there can be no assurance that INVH’s basis for computing this non-GAAP measure is comparable with that of other companies. Net Operating Income (“NOI”). SFR defines NOI as rental and other property revenues less property operating expenses. SFR has presented NOI as SFR believes this NOI measure to be an appropriate supplemental measure of operating performance to net income attributable to common shareholders because it reflects the operating performance of SFR’s homes without allocation of corporate level overhead or general and administrative costs and reflects the operations of SFR’s business. Refer to the table on the next page for a reconciliation of net loss attributable to common shareholders to NOI. The NOI measures included in this presentation should not be considered alternatives to net loss or net cash flows from operating activities, determined in accordance with GAAP, as indications of SFR’s performance or as measures of liquidity. Although SFR uses these non-GAAP measures for comparability in assessing their performance against other REITs, not all REITs compute the same non-GAAP measures. Accordingly, there can be no assurance that SFR’s basis for computing these non-GAAP measures is comparable with that of other REITs. New Lease Rental Growth Rate. For INVH, shown in filings as “Net Effective Rental Rate Growth” for new leases, and represents the difference between the monthly rent from an expiring lease and the monthly rent from the next lease, in each case, net of any amortized concessions. Refers to new leases only, where a previous resident moves out and a new resident signs a lease to occupy the same home. For SFR, shown in filings as “Replacement Rent Growth.” Represents the percentage change in monthly contractual rent resulting from new leases on properties previously leased to different residents during a measurement period for an identified population of rental units and is calculated by dividing a) the aggregate contractual first month rent (excluding rent concessions and incentives) on new leases signed during the applicable measurement period for an identified population of occupied rental units by b) the aggregate contractual last month rent for such identified population of rental units under the prior lease on such properties. To date, rent concessions and incentives have been used on a limited basis and have not had a significant impact on contractual rent.
Appendix A (Cont’d) Northern California. Includes Modesto, CA, Napa, CA, Oakland-Fremont-Hayward, CA, Sacramento-Arden-Arcade-Roseville, CA, San Jose-Sunnyvale-Santa Clara, CA, Stockton-Lodi, CA, Vallejo-Fairfield, CA and Yuba City, CA. Same Stores or Same Homes. As defined by SFR, represents homes which have been stabilized for at least fifteen (15) months prior to the start of the current measurement period, excluding any homes that have been disposed of, removed from service or returned to the development period for significant renovation. Same Store or Same Store Portfolio. As defined by INVH, Same Store or Same Store Portfolio includes, for a given reporting period, homes that have been stabilized (defined as homes that have (i) completed an upfront renovation and (ii) entered into at least one post-renovation INVH lease) for at least 90 days prior to the first day of the prior-year measurement period and excludes homes that have been sold and homes that have been designated for sale but have not yet entered into a written sale agreement during such reporting period. Same Store portfolios are established as of January 1st of each calendar year. Therefore, any home included in the Same Store portfolio will have satisfied the conditions described in clauses (i) and (ii) above prior to October 3rd of the year prior to the first year of the comparison period. INVH believes presenting information about the portion of our portfolio that has been fully operational for the entirety of a given reporting period and its prior year comparison period provides investors with meaningful information about the performance of INVH’s comparable homes across periods and about trends in our organic business. South Florida. Includes Fort Lauderdale-Pompano Beach-Deerfield Beach, Key West, Miami-Miami Beach-Kendall, and West Palm Beach-Boca Raton-Delray Beach, FL. Southern California. Includes Anaheim-Santa Ana-Irvine, CA, Los Angeles-Long Beach-Glendale, CA, Oxnard-Thousand Oaks-Ventura, CA, Riverside-San Bernardino-Ontario, CA and San Diego-Carlsbad-San Marcos, CA. Total Homes or Total Portfolio. For SFR, represents all homes SFR manages. Includes both owned homes and non-owned, managed homes. For INVH, refers to the total number of homes that INVH owns, whether or not stabilized, and excludes any properties previously acquired in purchases that have been subsequently rescinded or vacated. Turnover Rate. As defined by INVH, turnover rate represents the number of instances that homes in an identified population become unoccupied in a given period, divided by the number of homes in such population. To the extent the measurement period shown is less than 12 months, the turnover rate will be reflected on an annualized basis. As defined by SFR, calculated by dividing a) the number of homes that become unoccupied during a period of time by b) the number of homes that had completed initial renovation/rehabilitation and were leasable during the specified period, expressed as an annualized percentage by multiplying the period of measurement to reach a 12-month period (e.g., multiplying a three month turnover measurement by four). SFR believes this operational measure is useful in understanding resident satisfaction, pricing effectiveness and assessing associated property repairs and maintenance expenses.
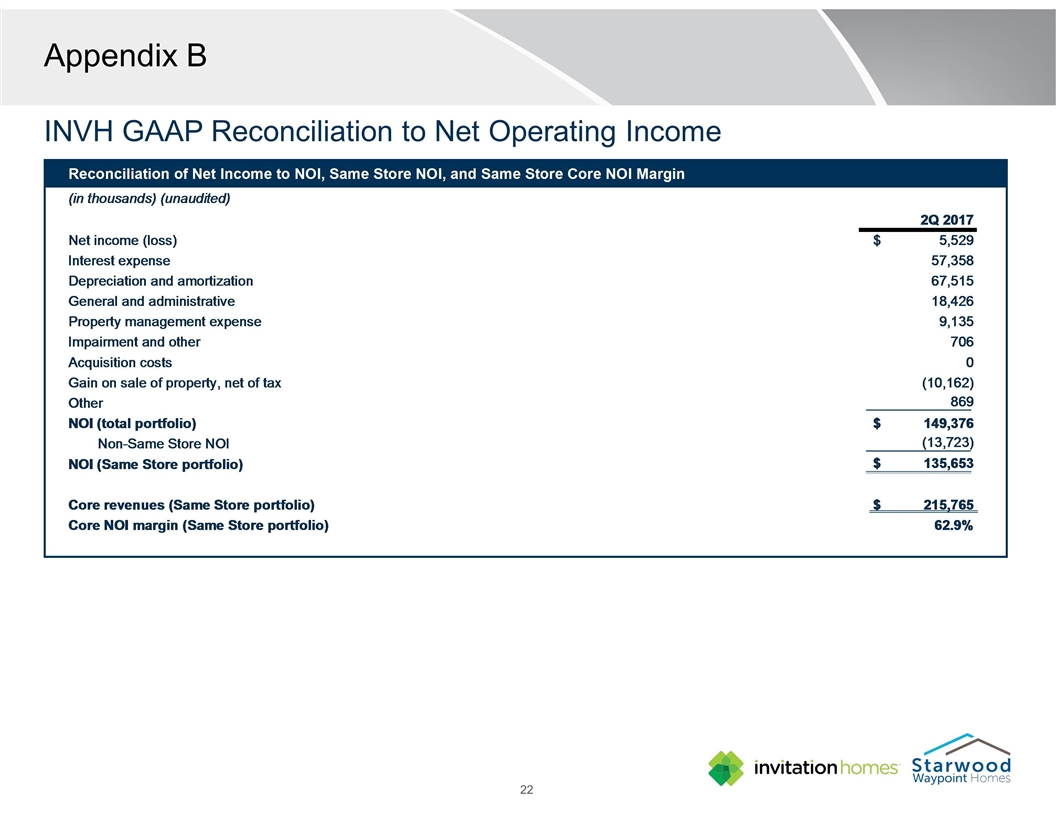
Appendix B INVH GAAP Reconciliation to Net Operating Income
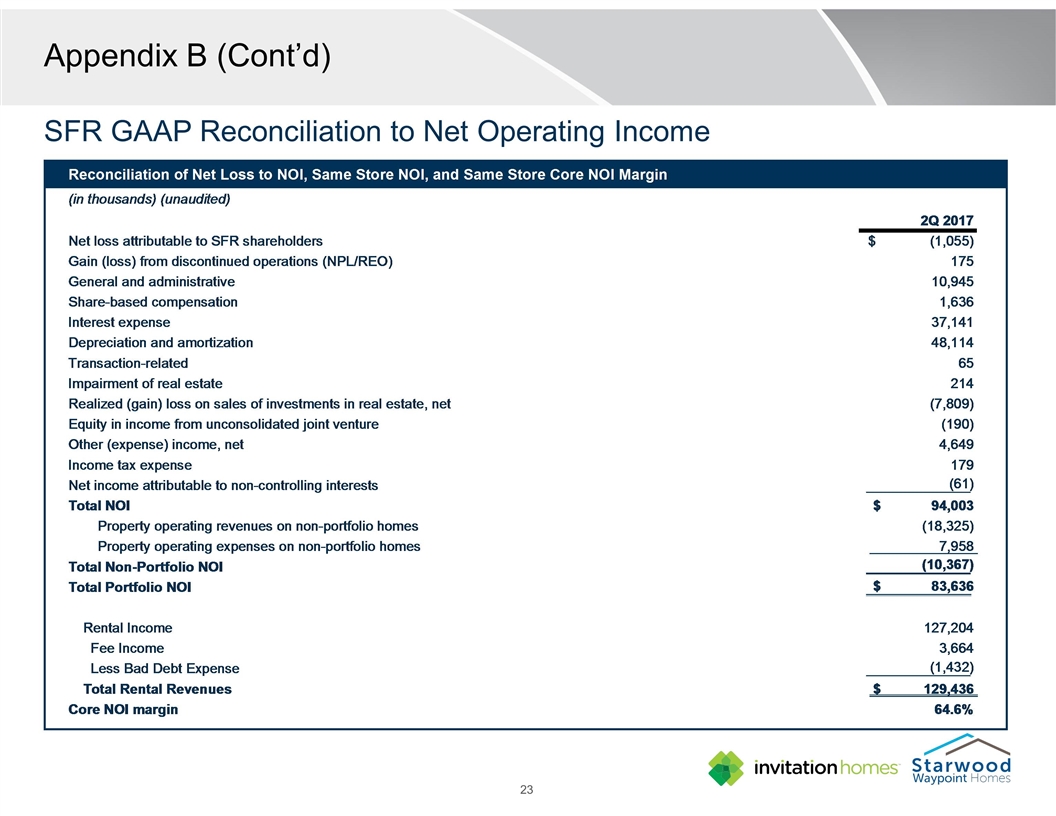
Appendix B (Cont’d) SFR GAAP Reconciliation to Net Operating Income