
Confidential Citi Conference March 7-8, 2022 Exhibit 99.1
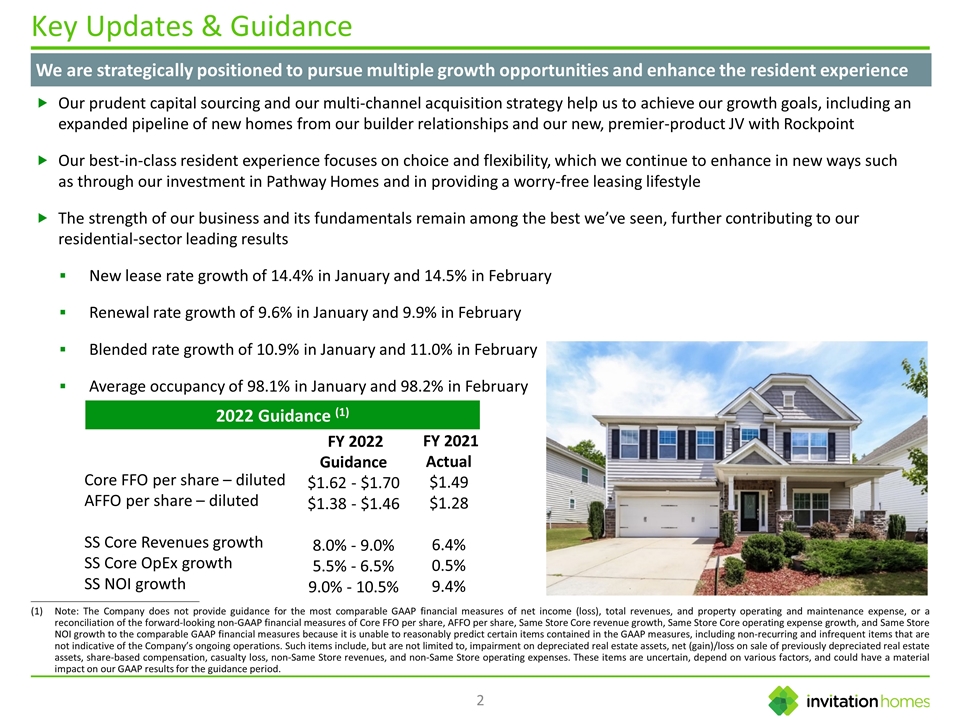
We are strategically positioned to pursue multiple growth opportunities and enhance the resident experience Key Updates & Guidance Core FFO per share – diluted AFFO per share – diluted SS Core Revenues growth SS Core OpEx growth SS NOI growth FY 2022 Guidance $1.62 - $1.70 $1.38 - $1.46 8.0% - 9.0% 5.5% - 6.5% 9.0% - 10.5% FY 2021 Actual $1.49 $1.28 6.4% 0.5% 9.4% Our prudent capital sourcing and our multi-channel acquisition strategy help us to achieve our growth goals, including an expanded pipeline of new homes from our builder relationships and our new, premier-product JV with Rockpoint Our best-in-class resident experience focuses on choice and flexibility, which we continue to enhance in new ways such as through our investment in Pathway Homes and in providing a worry-free leasing lifestyle The strength of our business and its fundamentals remain among the best we’ve seen, further contributing to our residential-sector leading results New lease rate growth of 14.4% in January and 14.5% in February Renewal rate growth of 9.6% in January and 9.9% in February Blended rate growth of 10.9% in January and 11.0% in February Average occupancy of 98.1% in January and 98.2% in February 2022 Guidance (1) ________________________________________________ Note: The Company does not provide guidance for the most comparable GAAP financial measures of net income (loss), total revenues, and property operating and maintenance expense, or a reconciliation of the forward-looking non-GAAP financial measures of Core FFO per share, AFFO per share, Same Store Core revenue growth, Same Store Core operating expense growth, and Same Store NOI growth to the comparable GAAP financial measures because it is unable to reasonably predict certain items contained in the GAAP measures, including non-recurring and infrequent items that are not indicative of the Company’s ongoing operations. Such items include, but are not limited to, impairment on depreciated real estate assets, net (gain)/loss on sale of previously depreciated real estate assets, share-based compensation, casualty loss, non-Same Store revenues, and non-Same Store operating expenses. These items are uncertain, depend on various factors, and could have a material impact on our GAAP results for the guidance period.
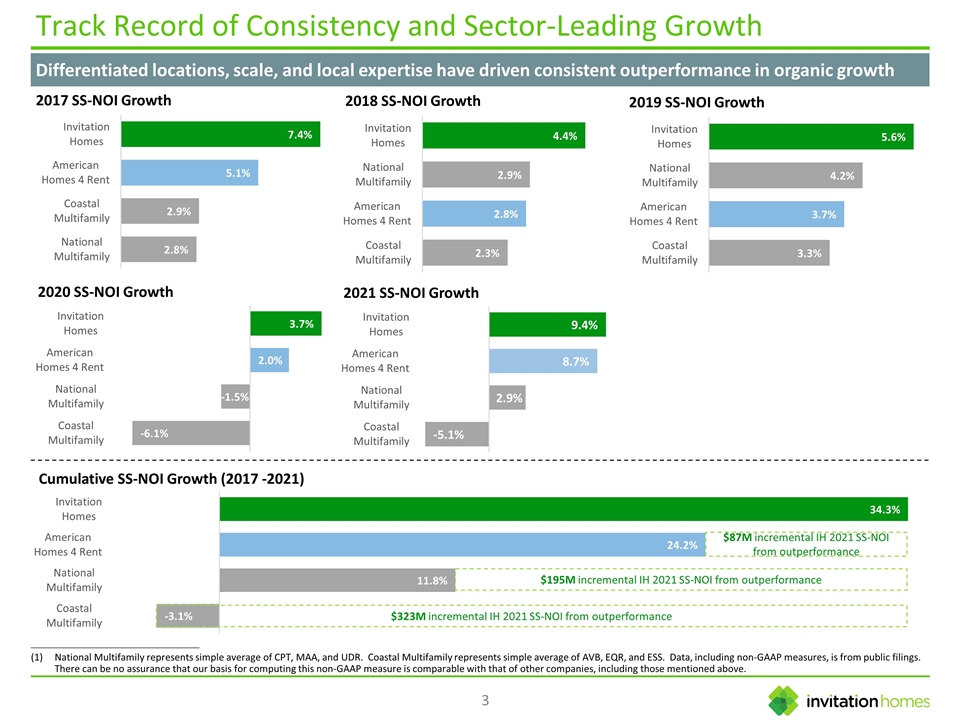
Track Record of Consistency and Sector-Leading Growth Differentiated locations, scale, and local expertise have driven consistent outperformance in organic growth ________________________________________________ National Multifamily represents simple average of CPT, MAA, and UDR. Coastal Multifamily represents simple average of AVB, EQR, and ESS. Data, including non-GAAP measures, is from public filings. There can be no assurance that our basis for computing this non-GAAP measure is comparable with that of other companies, including those mentioned above. $87M incremental IH 2021 SS-NOI from outperformance $195M incremental IH 2021 SS-NOI from outperformance $323M incremental IH 2021 SS-NOI from outperformance
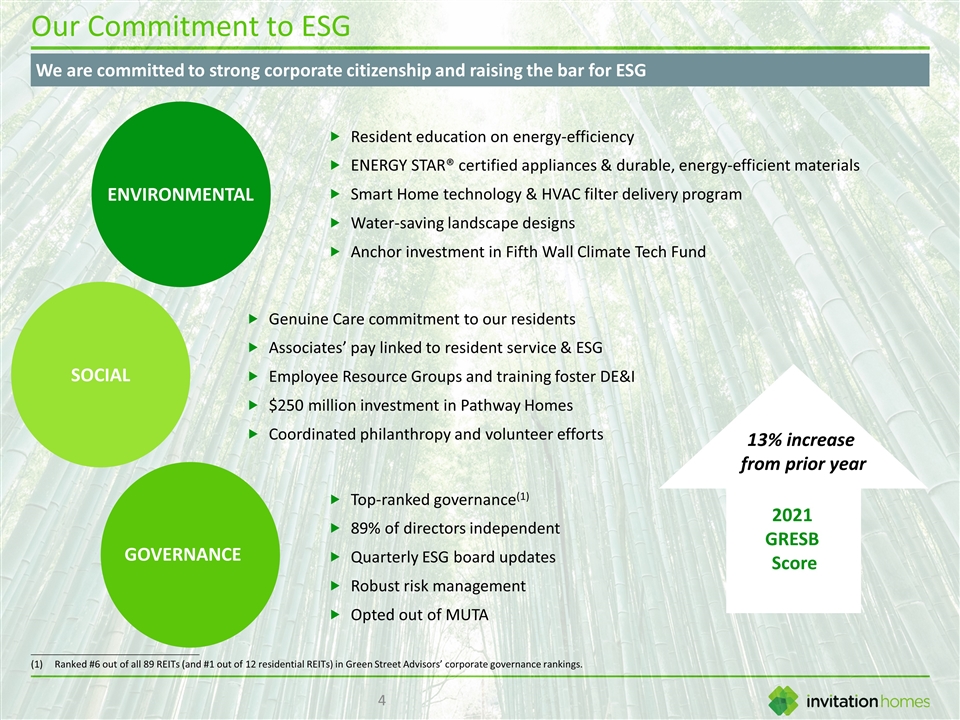
Our Commitment to ESG SOCIAL Top-ranked governance(1) 89% of directors independent Quarterly ESG board updates Robust risk management Opted out of MUTA Genuine Care commitment to our residents Associates’ pay linked to resident service & ESG Employee Resource Groups and training foster DE&I $250 million investment in Pathway Homes Coordinated philanthropy and volunteer efforts ENVIRONMENTAL We are committed to strong corporate citizenship and raising the bar for ESG 2021 GRESB Score ________________________________________________ Ranked #6 out of all 89 REITs (and #1 out of 12 residential REITs) in Green Street Advisors’ corporate governance rankings. GOVERNANCE 13% increase from prior year Resident education on energy-efficiency ENERGY STAR® certified appliances & durable, energy-efficient materials Smart Home technology & HVAC filter delivery program Water-saving landscape designs Anchor investment in Fifth Wall Climate Tech Fund
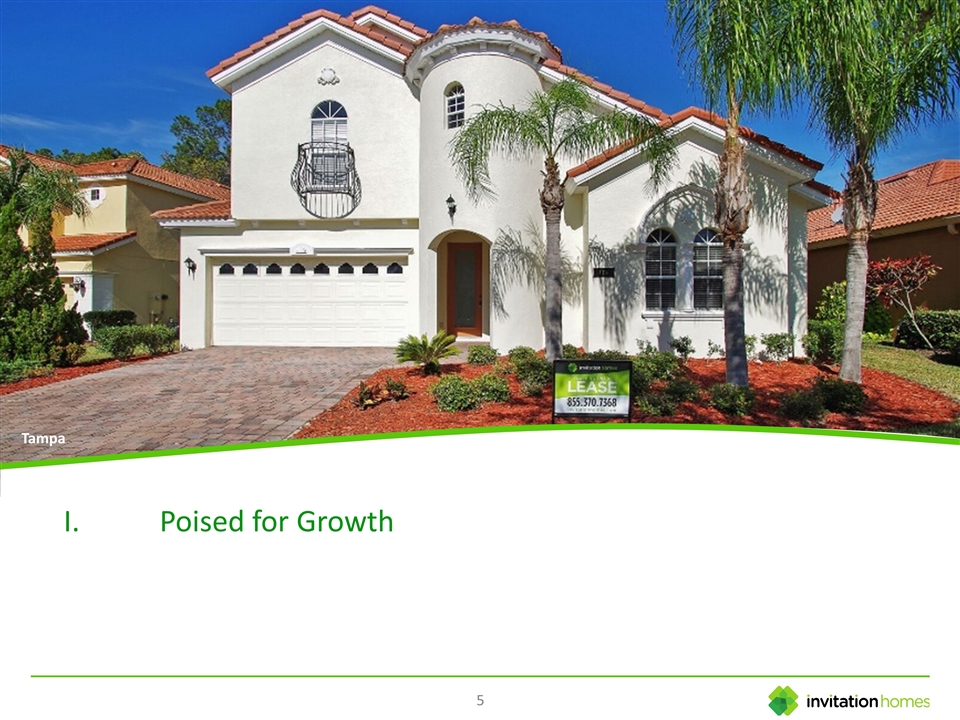
I.Poised for Growth
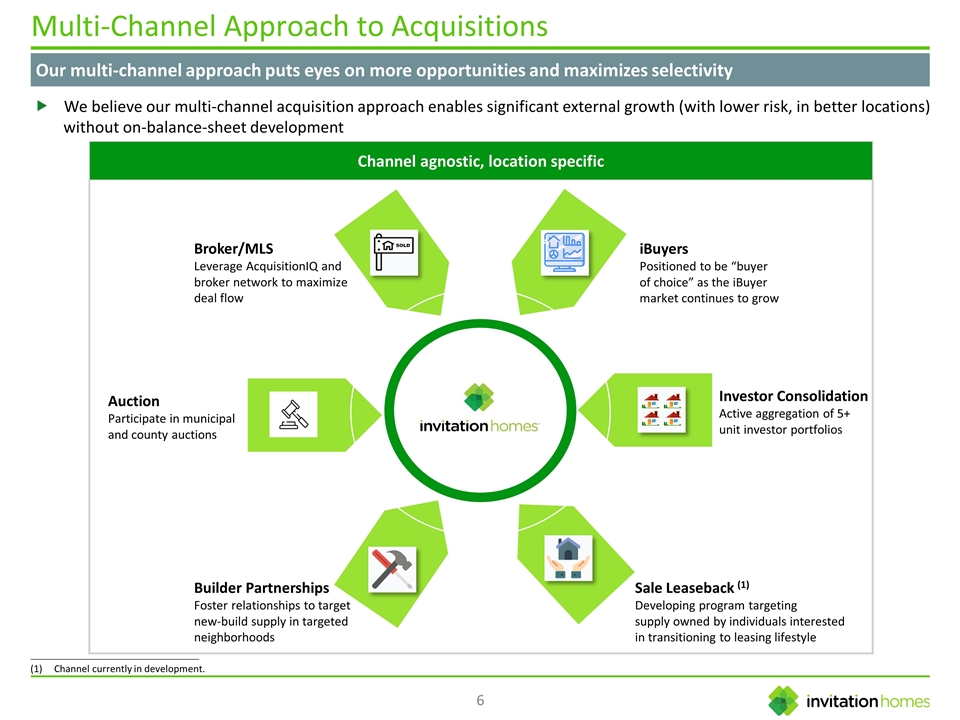
Channel agnostic, location specific Multi-Channel Approach to Acquisitions Our multi-channel approach puts eyes on more opportunities and maximizes selectivity Broker/MLS Leverage AcquisitionIQ and broker network to maximize deal flow Builder Partnerships Foster relationships to target new-build supply in targeted neighborhoods Sale Leaseback (1) Developing program targeting supply owned by individuals interested in transitioning to leasing lifestyle Investor Consolidation Active aggregation of 5+ unit investor portfolios iBuyers Positioned to be “buyer of choice” as the iBuyer market continues to grow Auction Participate in municipal and county auctions We believe our multi-channel acquisition approach enables significant external growth (with lower risk, in better locations) without on-balance-sheet development ________________________________________________ Channel currently in development.
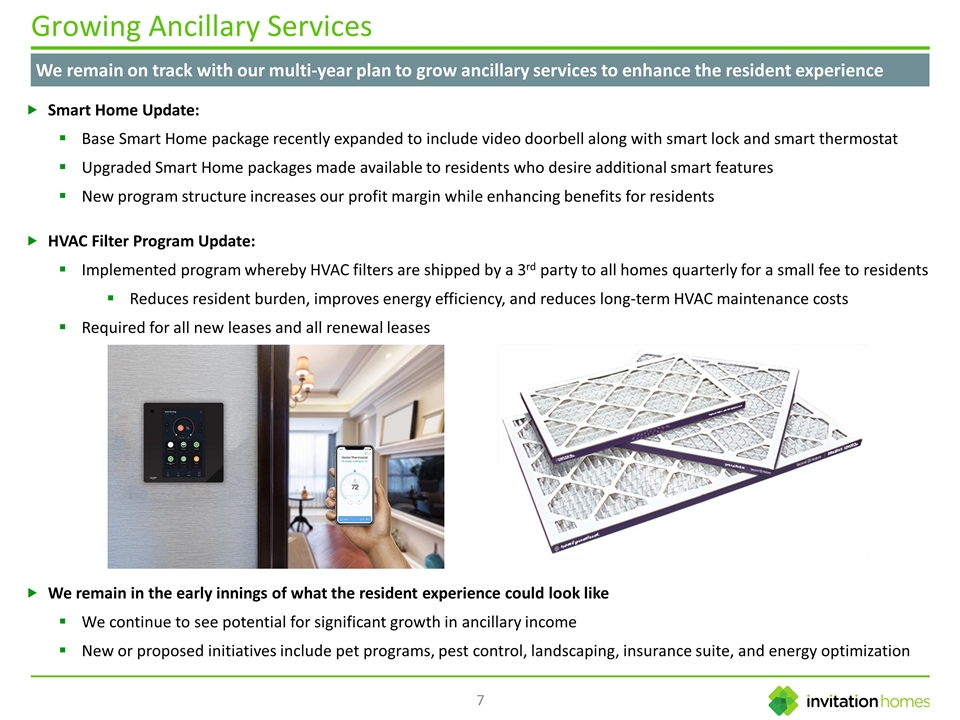
Growing Ancillary Services We remain on track with our multi-year plan to grow ancillary services to enhance the resident experience Smart Home Update: Base Smart Home package recently expanded to include video doorbell along with smart lock and smart thermostat Upgraded Smart Home packages made available to residents who desire additional smart features New program structure increases our profit margin while enhancing benefits for residents HVAC Filter Program Update: Implemented program whereby HVAC filters are shipped by a 3rd party to all homes quarterly for a small fee to residents Reduces resident burden, improves energy efficiency, and reduces long-term HVAC maintenance costs Required for all new leases and all renewal leases We remain in the early innings of what the resident experience could look like We continue to see potential for significant growth in ancillary income New or proposed initiatives include pet programs, pest control, landscaping, insurance suite, and energy optimization
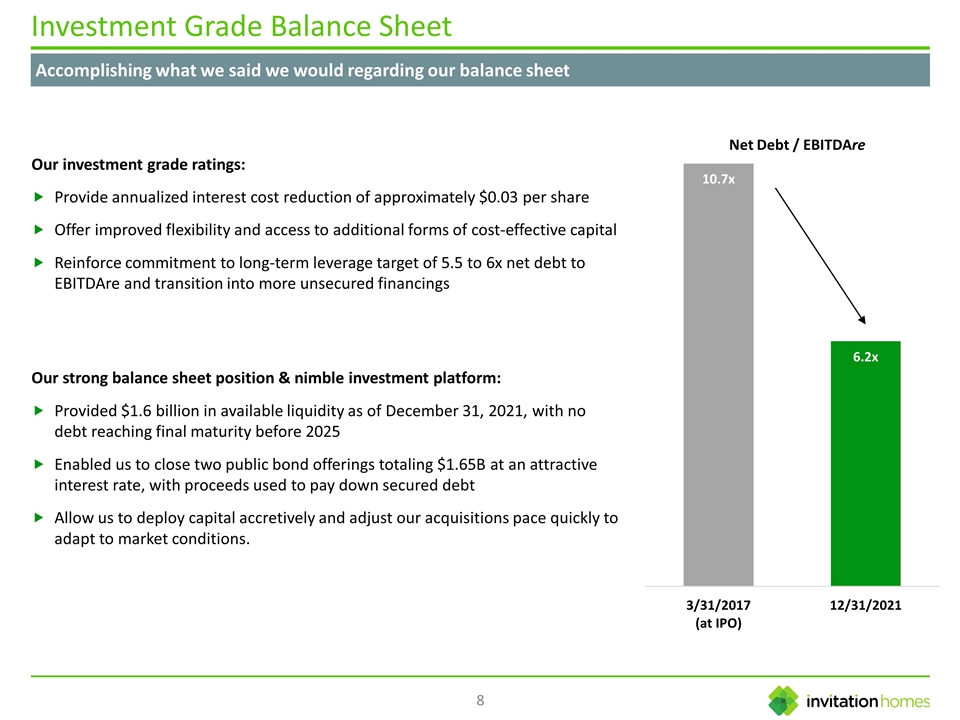
Investment Grade Balance Sheet Accomplishing what we said we would regarding our balance sheet Our investment grade ratings: Provide annualized interest cost reduction of approximately $0.03 per share Offer improved flexibility and access to additional forms of cost-effective capital Reinforce commitment to long-term leverage target of 5.5 to 6x net debt to EBITDAre and transition into more unsecured financings Our strong balance sheet position & nimble investment platform: Provided $1.6 billion in available liquidity as of December 31, 2021, with no debt reaching final maturity before 2025 Enabled us to close two public bond offerings totaling $1.65B at an attractive interest rate, with proceeds used to pay down secured debt Allow us to deploy capital accretively and adjust our acquisitions pace quickly to adapt to market conditions. Net Debt / EBITDAre
II.Highly compelling long-term industry fundamentals
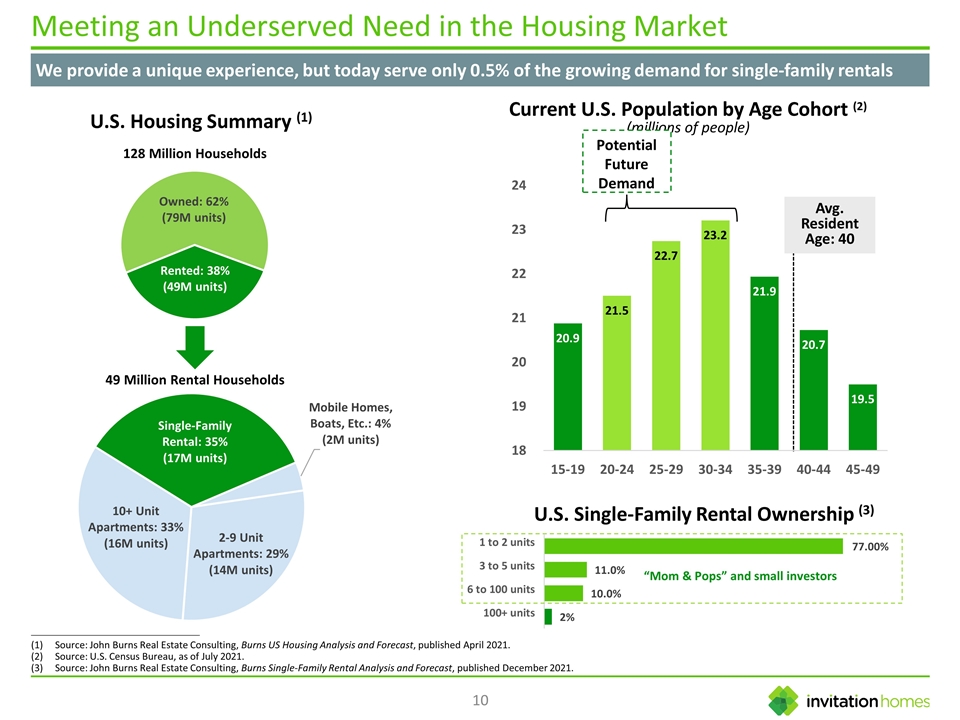
Meeting an Underserved Need in the Housing Market We provide a unique experience, but today serve only 0.5% of the growing demand for single-family rentals U.S. Single-Family Rental Ownership (3) ________________________________________________ Source: John Burns Real Estate Consulting, Burns US Housing Analysis and Forecast, published April 2021. Source: U.S. Census Bureau, as of July 2021. Source: John Burns Real Estate Consulting, Burns Single-Family Rental Analysis and Forecast, published December 2021. “Mom & Pops” and small investors Current U.S. Population by Age Cohort (2) (millions of people) Avg. Resident Age: 40 Potential Future Demand U.S. Housing Summary (1) 128 Million Households 49 Million Rental Households
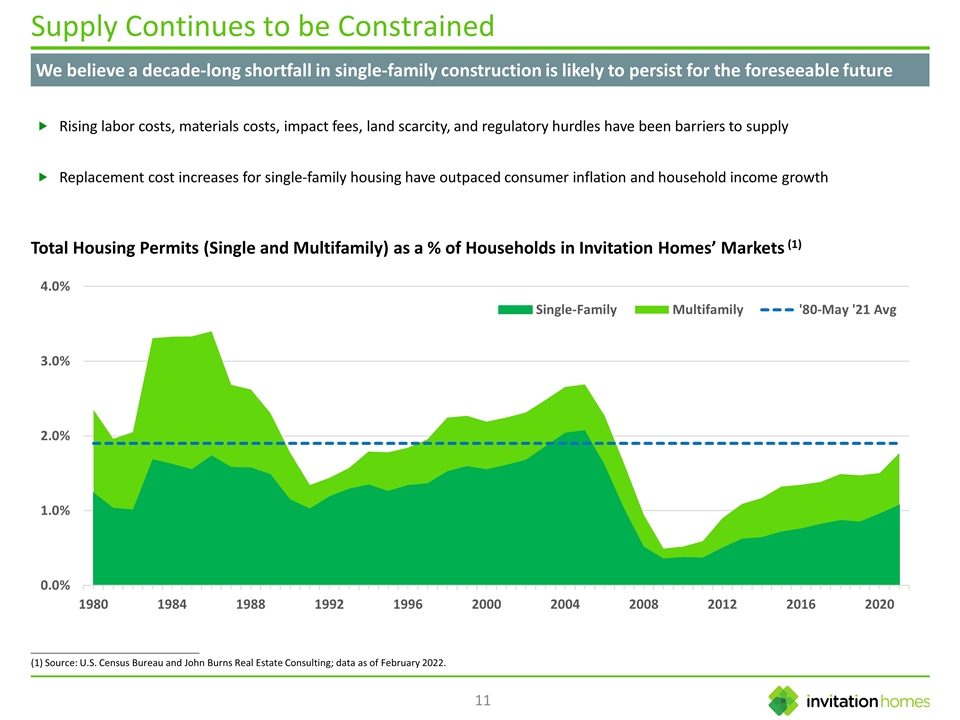
Supply Continues to be Constrained We believe a decade-long shortfall in single-family construction is likely to persist for the foreseeable future Total Housing Permits (Single and Multifamily) as a % of Households in Invitation Homes’ Markets (1) Rising labor costs, materials costs, impact fees, land scarcity, and regulatory hurdles have been barriers to supply Replacement cost increases for single-family housing have outpaced consumer inflation and household income growth ________________________________________________ (1) Source: U.S. Census Bureau and John Burns Real Estate Consulting; data as of February 2022.

III. Our Unique Competitive Advantages
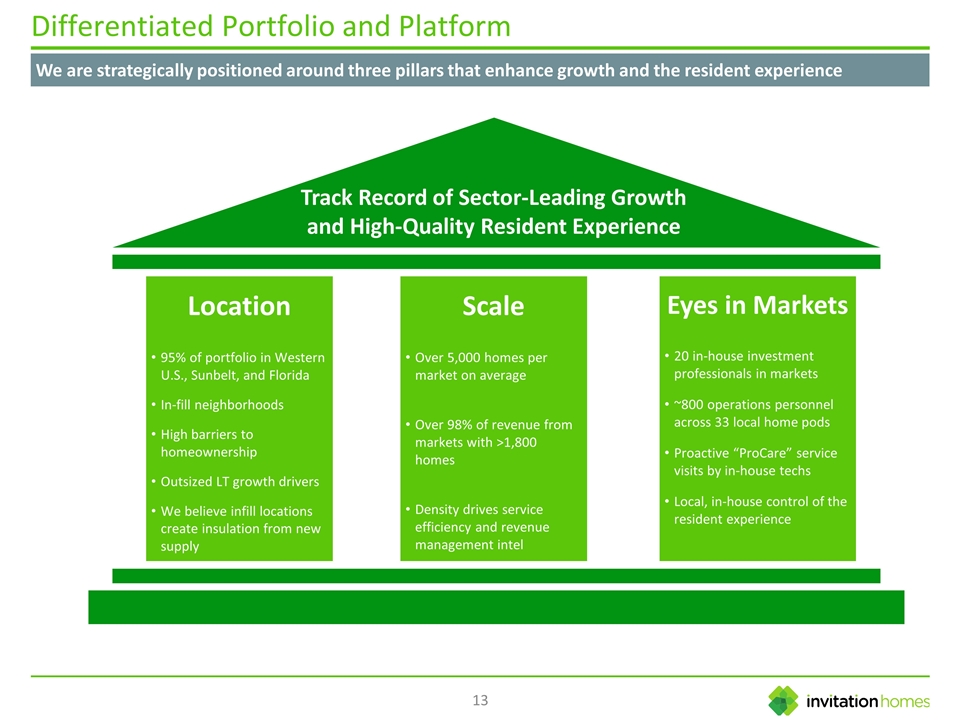
Differentiated Portfolio and Platform We are strategically positioned around three pillars that enhance growth and the resident experience Location 95% of portfolio in Western U.S., Sunbelt, and Florida In-fill neighborhoods High barriers to homeownership Outsized LT growth drivers We believe infill locations create insulation from new supply Track Record of Sector-Leading Growth and High-Quality Resident Experience Eyes in Markets 20 in-house investment professionals in markets ~800 operations personnel across 33 local home pods Proactive “ProCare” service visits by in-house techs Local, in-house control of the resident experience Scale Over 5,000 homes per market on average Over 98% of revenue from markets with >1,800 homes Density drives service efficiency and revenue management intel
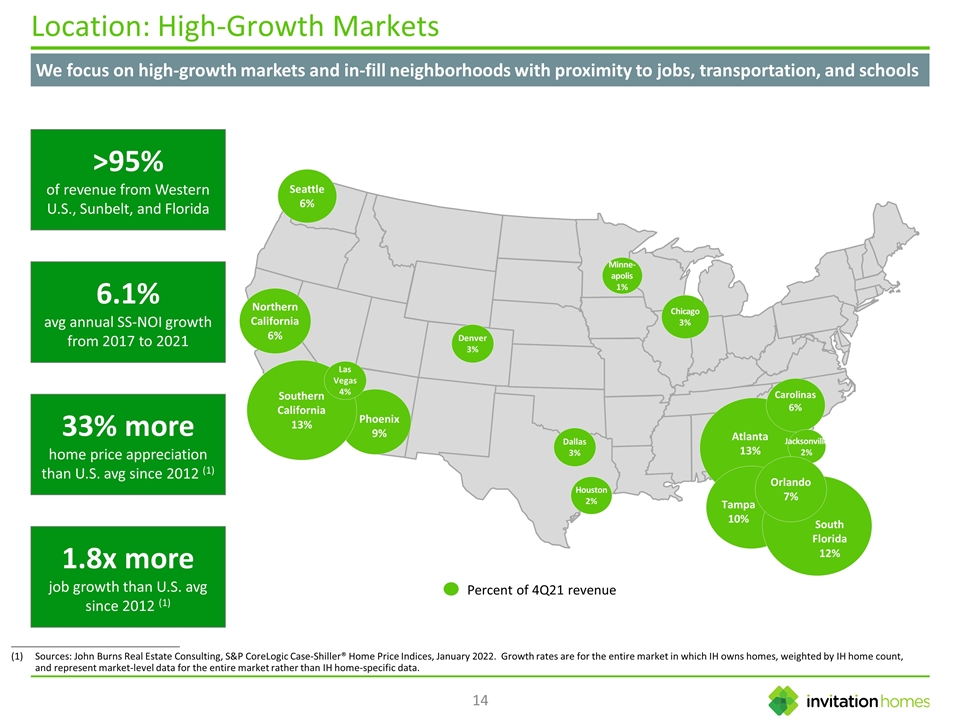
Location: High-Growth Markets We focus on high-growth markets and in-fill neighborhoods with proximity to jobs, transportation, and schools >95% of revenue from Western U.S., Sunbelt, and Florida 6.1% avg annual SS-NOI growth from 2017 to 2021 33% more home price appreciation than U.S. avg since 2012 (1) 1.8x more job growth than U.S. avg since 2012 (1) Percent of 4Q21 revenue Seattle 6% Minne-apolis 1% Denver 3% Dallas 3% Phoenix 9% Atlanta 13% Tampa 10% Southern California 13% Las Vegas 4% South Florida 12% Northern California 6% Carolinas 6% Jacksonville 2% Orlando 7% Houston 2% Chicago 3% ________________________________________________ Sources: John Burns Real Estate Consulting, S&P CoreLogic Case-Shiller® Home Price Indices, January 2022. Growth rates are for the entire market in which IH owns homes, weighted by IH home count, and represent market-level data for the entire market rather than IH home-specific data.
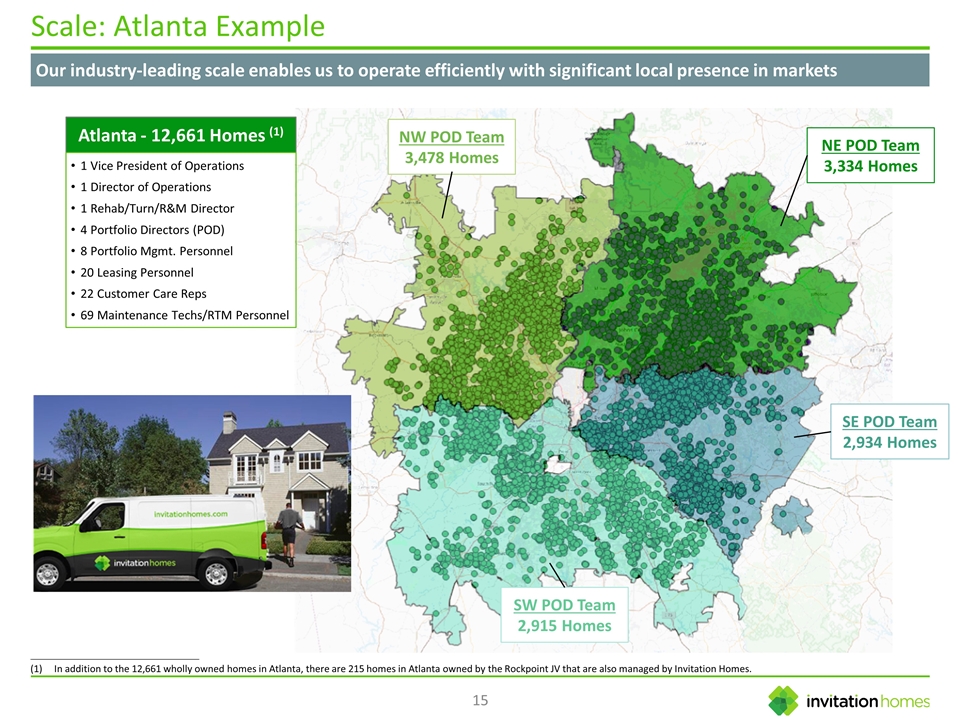
Scale: Atlanta Example Our industry-leading scale enables us to operate efficiently with significant local presence in markets NW POD Team 3,478 Homes NE POD Team 3,334 Homes SE POD Team 2,934 Homes SW POD Team 2,915 Homes Atlanta - 12,661 Homes (1) ________________________________________________ In addition to the 12,661 wholly owned homes in Atlanta, there are 215 homes in Atlanta owned by the Rockpoint JV that are also managed by Invitation Homes. 1 Vice President of Operations 1 Director of Operations 1 Rehab/Turn/R&M Director 4 Portfolio Directors (POD) 8 Portfolio Mgmt. Personnel 20 Leasing Personnel 22 Customer Care Reps 69 Maintenance Techs/RTM Personnel
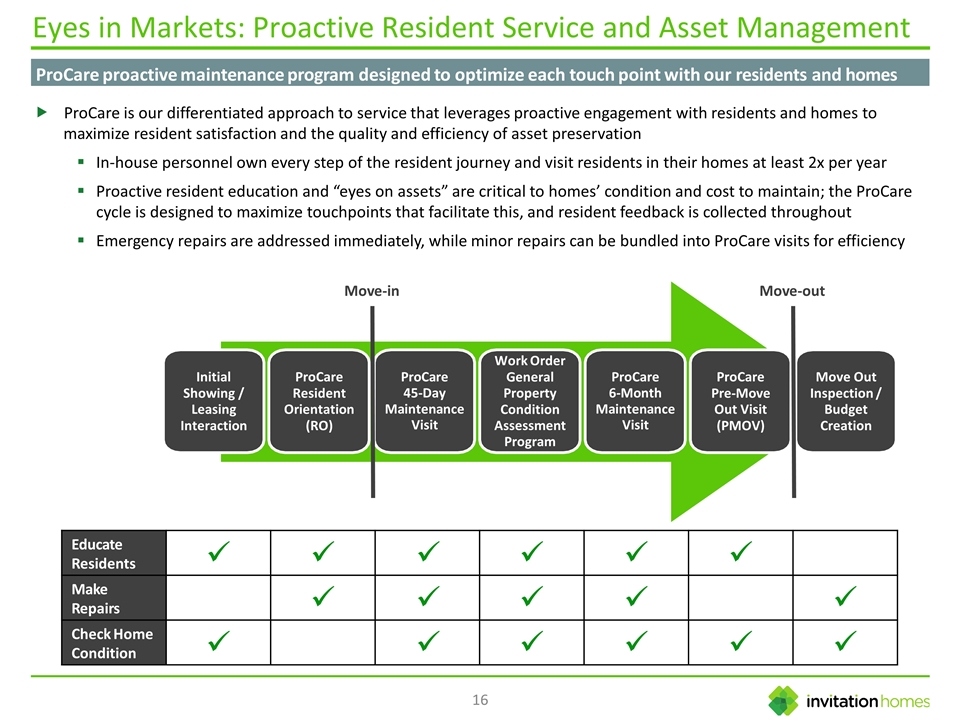
Eyes in Markets: Proactive Resident Service and Asset Management ProCare proactive maintenance program designed to optimize each touch point with our residents and homes Initial Showing / Leasing Interaction ProCare Resident Orientation (RO) ProCare 45-Day Maintenance Visit Work Order General Property Condition Assessment Program ProCare 6-Month Maintenance Visit ProCare Pre-Move Out Visit (PMOV) Move Out Inspection / Budget Creation Move-in Move-out Educate Residents ü ü ü ü ü ü Make Repairs ü ü ü ü ü Check Home Condition ü ü ü ü ü ü ProCare is our differentiated approach to service that leverages proactive engagement with residents and homes to maximize resident satisfaction and the quality and efficiency of asset preservation In-house personnel own every step of the resident journey and visit residents in their homes at least 2x per year Proactive resident education and “eyes on assets” are critical to homes’ condition and cost to maintain; the ProCare cycle is designed to maximize touchpoints that facilitate this, and resident feedback is collected throughout Emergency repairs are addressed immediately, while minor repairs can be bundled into ProCare visits for efficiency

Disclaimer This presentation contains forward-looking statements within the meaning of Section 27A of the Securities Act of 1933, as amended, and Section 21E of the Securities Exchange Act of 1934, as amended, which include, but are not limited to, statements related to the Company’s expectations regarding the performance of the Company’s business, its financial results, its liquidity and capital resources and the use of the net proceeds from the offering, and other non-historical statements. In some cases, you can identify these forward-looking statements by the use of words such as “outlook,” “believes,” “expects,” “potential,” “continues,” “may,” “will,” “should,” “could,” “seeks,” “projects,” “predicts,” “intends,” “plans,” “estimates,” “anticipates,” or the negative version of these words or other comparable words. Such forward-looking statements are subject to various risks and uncertainties, including, among others, risks inherent to the single-family rental industry and the Company’s business model, macroeconomic factors beyond the Company’s control, competition in identifying and acquiring properties, competition in the leasing market for quality residents, increasing property taxes, homeowners’ association fees and insurance costs, the Company’s dependence on third parties for key services, risks related to the evaluation of properties, poor resident selection and defaults and non-renewals by the Company’s residents, performance of the Company’s information technology systems, risks related to the Company’s indebtedness, and risks related to the potential negative impact of the ongoing COVID-19 pandemic on the Company’s financial condition, results of operations, cash flows, business, associates, and residents. Accordingly, there are or will be important factors that could cause actual outcomes or results to differ materially from those indicated in these statements. Moreover, many of these factors have been heightened as a result of the ongoing and numerous adverse impacts of COVID-19. The Company believes these factors include, but are not limited to, those described under Part I. Item 1A. “Risk Factors” of the Company’s Annual Report on Form 10-K for the year ended December 31, 2021, as such factors may be updated from time to time in the Company’s periodic filings with the SEC, which are accessible on the SEC’s website at www.sec.gov. These factors should not be construed as exhaustive and should be read in conjunction with the other cautionary statements that are included in this release and in the Company’s other periodic filings. The forward-looking statements speak only as of the date of this presentation, and the Company expressly disclaims any obligation or undertaking to publicly update or review any forward-looking statement, whether as a result of new information, future developments or otherwise, except to the extent otherwise required by law. IR@InvitationHomes.com www.INVH.com


