Table of Contents
UNITED STATES
SECURITIES AND EXCHANGE COMMISSION
Washington, D.C. 20549
FORM
10-K/A
AMENDMENT NO. 1
| ☒ | ANNUAL REPORT PURSUANT TO SECTION 13 OR 15(d) OF THE SECURITIES EXCHANGE ACT OF 1934 |
For the fiscal year ended December 31, 2019
OR
| ☐ | TRANSITION REPORT PURSUANT TO SECTION 13 OR 15(d) OF THE SECURITIES EXCHANGE ACT OF 1934 |
For the transition period from to .
Commission File Number
001-01342
Canadian Pacific Railway Limited
(Exact name of registrant as specified in its charter)
Canada | 98-0355078 | |
(State or Other Jurisdiction of Incorporation or Organization) | (IRS Employer Identification No.) | |
7550 Ogden Dale Road S.E. , Calgary , Alberta , Canada | T2C 4X9 | |
| (Address of Principal Executive Offices) | (Zip Code) | |
Registrant’s Telephone Number, Including Area Code: (403)
319-7000
Securities registered pursuant to Section 12(b) of the Act:
Title of Each Class | Trading Symbol(s) | Name of Each Exchange on which Registered | ||
| Common Shares, without par value, of Canadian Pacific Railway Limited | CP | New York Stock Exchange | ||
| Toronto Stock Exchange | ||||
| Perpetual 4% Consolidated Debenture Stock of Canadian Pacific Railway Company | CP/40 | New York Stock Exchange | ||
| BC87 | London Stock Exchange |
Securities registered pursuant to Section 12(g) of the Act: None
Securities for which there is a reporting obligation pursuant to Section 15(d) of the Act:
Debt securities of Canadian Pacific Railway Company
Indicate by check mark if the registrant is a well-known seasoned issuer, as defined in Rule 405 of the Securities Act. Yes ☒ No ☐
Indicate by check mark if the registrant is not required to file reports pursuant to Section 13 or Section 15(d) of the Exchange Act. Yes ☐ No ☒
Indicate by check mark whether the registrant (1) has filed all reports required to be filed by Section 13 or 15(d) of the Securities Exchange Act of 1934 during the preceding 12 months (or for such shorter period that the registrant was required to file such reports), and (2) has been subject to such filing requirements for the past 90 days. Yes ☒ No ☐
Indicate by check mark whether the registrant has submitted electronically every Interactive Data File required to be submitted pursuant to Rule 405 of Regulation
S-T
(§232.405 of this chapter) during the preceding 12 months (or for such shorter period that the registrant was required to submit such files). Yes ☒ No ☐Indicate by check mark whether the registrant is a large accelerated filer, an accelerated filer, a
non-accelerated
filer, a smaller reporting company or an emerging growth company. See the definitions of “large accelerated filer,” “accelerated filer,” “smaller reporting company” and “emerging growth company” in Rule12b-2
of the Exchange Act. (Check one):| Large accelerated filer | ☒ | Accelerated filer | ☐ | |||
Non-accelerated filer | ☐ (Do not check if a smaller reporting company) | Smaller reporting company | ☐ | |||
| Emerging growth company | ☐ | |||||
If an emerging growth company, indicate by check mark if the registrant has elected not to use the extended transition period for complying with any new or revised financial accounting standards provided pursuant to Section 13(a) of the Exchange Act. ☐
Indicate by check mark whether the registrant is a shell company (as defined in Rule
12b-2
of the Exchange Act). Yes ☐ No ☒As of June 30, 2019, the last business day of the registrant’s most recently completed second fiscal quarter, the aggregate market value of the voting stock held by
non-affiliates
of the registrant, in U.S. dollars, was $32,712,064,612, based on the closing sales price per share as reported by the New York Stock Exchange on such date.As of the close of business on April
20
, 2020, there were 135,631,754 shares of the registrant’s Common Stock outstanding.EXPLANATORY NOTE
Canadian Pacific Railway Limited, a corporation incorporated under the Canada Business Corporations Act (the “Company”), qualifies as a foreign private issuer in the U.S. for purposes of the Securities Exchange Act of 1934, as amended (the “Exchange Act”). Although as a foreign private issuer the Company is not required to do so, the Company currently continues to file annual reports on Form
10-K,
quarterly reports on Form10-Q,
and current reports on Form8-K
with the Securities and Exchange Commission (“SEC”) instead of filing the reports available to foreign private issuers. The Company prepares and files a management proxy circular and related material under Canadian requirements. As the Company’s management proxy circular is not filed pursuant to Regulation 14A, the Company may not incorporate by reference information required by Part III of its Form10-K
from its management proxy circular.The Company filed its Annual Report on Form
10-K
for the fiscal year ended December 31, 2019 (“2019 Form10-K”)
on February 20, 2020. In reliance upon and as permitted by Instruction G(3) to Form10-K,
the Company is filing this Amendment No. 1 on Form10-K/A
in order to include in the 2019 Form10-K
the Part III information not previously included in the 2019 Form10-K.
No attempt has been made in this Amendment No. 1 on Form
10-K/A
to modify or update the other disclosures presented in the 2019 Form10-K.
This Amendment No. 1 on Form10-K/A
does not reflect events occurring after the filing of the 2019 Form10-K.
Accordingly, this Amendment No. 1 on Form10-K/A
should be read in conjunction with the 2019 Form10-K
and the Company’s other filings with the SEC.In this Amendment No. 1 on Form
10-K/A,
we also refer to Canadian Pacific Railway Limited as “Canadian Pacific,” “we,” “us,” “our,” “our corporation,” or “the corporation.” References to “GAAP” mean generally accepted accounting principles in the United States.All references to our websites and to our Canadian management proxy circular filed with the SEC on March 19, 2020 as Exhibit 99.1 to our Current Report on Form
8-K
(the “Circular”) contained herein do not constitute incorporation by reference of information contained on such websites and the Circular and such information should not be considered part of this document.CANADIAN PACIFIC RAILWAY LIMITED
FORM
10-K/A
PART III | ||||||
Item 10 | 1 | |||||
Item 11 | 7 | |||||
Item 12 | 58 | |||||
Item 13 | 59 | |||||
Item 14 | 59 | |||||
PART IV | ||||||
Item 15 | 61 | |||||
Item 16 | 61 | |||||
| 62 | ||||||
PART III
Directors
Director profiles All 11 nominated directors are qualified and experienced, and have agreed to serve on our Board. All directors are CP shareholders and must meet our director share ownership requirements within five years of joining the Board. Share ownership listed here is as at February 28, 2020, and includes shares that directors beneficially own or control, or hold directly or indirectly. Share ownership includes holdings under the Directors’ Deferred Share Unit (“DDSU”) plan. |
Isabelle Courville Chair | ||
 | Independent Age: 57Director since: May 1, 2013 Residence: Rosemère, Québec, Canada2019 voting results: 99.26% for | |
DIRECTOR SKILLS AND QUALIFICATIONS Brings expertise in the following areas: senior executive leadership, accounting & financial literacy, accounting & financial expertise, environment, health & safety, executive compensation/human resources, transportation industry knowledge, governance, government/regulatory affairs and legal, risk management, sales & marketing, and strategic oversight. |
OVERALL 2019 ATTENDANCE | 100% | |||||
| Meeting Attendance | ||||||
| Board | 7 of 7 | 100% | ||||
| Audit and Finance | 4 of 4 | 100% | ||||
| Governance | 5 of 5 | 100% | ||||
| Compensation | 5 of 5 | 100% | ||||
| Risk and Sustainability | 2 of 2 | 100% | ||||
BUSINESS EXPERIENCE
| • | President of Hydro-Québec Distribution andHydro-Québec TransÉnergie (2007 to 2013) |
| • | 20 years of experience in the Canadian telecommunications industry, including President of Bell Canada’s Enterprise Group (2003 to 2006) and President and Chief Executive Officer of Bell Nordiq Group (2002 to 2003) |
PUBLIC COMPANY BOARD EXPERIENCE
| • | SNC-Lavalin Group Inc. (2017 to present) (Chair of Human Resources Committee and member of Governance and Ethics Committee) |
| • | Veolia Environment S.A. (2015 to present) (member of Accounts and Audit Committee, Nominating Committee and the Research, Innovation and Sustainable Development Committee) |
| • | Laurentian Bank of Canada (2007 to 2019) (Chair of the Board and member of Human Resources and Corporate Governance Committee) |
| • | Gecina S.A. (2016 to April 2017) (member of Audit Committee) |
| • | TVA Group (2013 to 2016) (member of Human Resources Committee) |
OTHER EXPERIENCE
Other Boards
| • | Institute for Governance of Private and Public Organizations (IGOPP) (2016 to present) (member of Human Resources Committee) |
| • | Institute of Corporate Directors (ICD) (2013 to 2017) |
EDUCATION
| • | Bachelor’s degree in Engineering Physics, École Polytechnique de Montréal |
| • | Bachelor’s degree in Civil Law, McGill University Doctorate Honoris Causa, University of Montréal |
SHARE OWNERSHIP
Shares: 900
DDSUs: 8,575
Options: 0
Meets share ownership requirements
The Hon. John Baird, P.C. | ||
 | Independent 50Age: Director since: May 14, 2015 Residence: Toronto,Ontario, Canada . 2019 voting results: 99.43% for | |
DIRECTOR SKILLS AND QUALIFICATIONS Brings expertise in the following areas: senior executive leadership, accounting & financial literacy, environment, health & safety, transportation industry knowledge, governance, government & regulatory affairs and legal, risk management and strategic oversight. |
OVERALL 2019 ATTENDANCE | 100% | |||||
| Meeting Attendance | ||||||
| Board | 7 of 7 | 100% | ||||
| Governance | 5 of 5 | 100% | ||||
| Compensation | 2 of 2 | 100% | ||||
| Risk and Sustainability | 2 of 2 | 100% | ||||
��
BUSINESS EXPERIENCE
| • | Senior Advisor at the law firm of Bennett Jones LLP, Hatch Ltd. (an engineering firm) and Eurasia Group (a geopolitical risk consultancy) (2015 to present) |
| • | Member of the International Advisory Board, Barrick Gold Corporation (2015 to present) |
| • | President of Grantham Finchley Consulting Inc. (2015 to present) |
PUBLIC COMPANY BOARD EXPERIENCE
| • | Canfor / Canfor Pulp (CPPI) (2016 to present) (member of Environmental, Health and Safety Committee; Capital Expenditure Committee and Corporate Governance Committee) |
OTHER EXPERIENCE
Other Boards
| • | FWD Group Ltd./FWD Ltd. (2015 to present) (member of Audit Committee and Risk Management and Actuarial Committee) |
| • | PineBridge Investments (2015 to present) |
| • | Friends of Israel Initiative (2015 to present) (member of the Board) |
Other experience
| • | Served as Canadian Foreign Minister, Minister of Transport and Infrastructure, Minister of the Environment, and President of the Treasury Board during his three terms as a Member of the Canadian Parliament (2006 to 2015) |
| • | Appointed to the Privy Council in 2006 |
| • | Former Minister of Community and Social Services and Minister of Energy in Ontario provincial legislature |
| • | Senior Advisor to Community Living Ontario, an organization that supports individuals with developmental disabilities |
| • | Advisory Board member to Prince’s Charities Canada, the charitable office of His Royal Highness The Prince of Wales |
EDUCATION
| • | Honours Bachelor of Arts (Political Studies), Queen’s University |
SHARE OWNERSHIP
Shares: 0
DDSUs: 5,302
Options: 0
Meets share ownership requirements
1
Keith E. Creel | ||
 | Not Independent Age: 51Director since: May 14, 2015 Residence: Wellington,Florida, U.S.A. 2019 voting results: 99.82% for | |
DIRECTOR SKILLS AND QUALIFICATIONS President and Chief Executive Officer of CP since January 31, 2017. Brings expertise in the following areas: senior executive leadership, accounting & financial literacy, environment, health & safety, executive compensation/human resources, transportation industry knowledge, governance, government/regulatory affairs and legal, risk management, sales & marketing and strategic oversight. |
OVERALL 2019 ATTENDANCE | 100% | |||||
| Meeting Attendance | ||||||
| Board | 7 of 7 | 100% | ||||
BUSINESS EXPERIENCE
| • | President and Chief Executive Officer of CP (2017 to present) |
| • | President and Chief Operating Officer of CP (February 2013 to January 2017) |
| • | Named “Railroad Innovator” for 2014 by Progressive Railroading in recognition of his leadership at CP |
| • | Executive Vice-President and Chief Operating Officer of Canadian National Railway Company (CN) (2010 to 2013) |
| • | Other positions at CN included Executive Vice- President, Operations, Senior Vice-President Eastern Region, Senior Vice-President Western Region, and Vice-President of CN’s Prairie division (2002 to 2010) |
| • | Trainmaster and director of corridor operations at Illinois Central Railway prior to its merger with CN in 1999 |
| • | Superintendent and general manager at Grand Trunk Western Railroad (1999 to 2002) |
| • | Began his railroad career in 1992 as an intermodal ramp manager at Burlington Northern Railway in Birmingham, Alabama |
OTHER EXPERIENCE
Other Boards
| • | Member of the Board of TTX Company (a private company) (2014 to present) |
| • | Representative on American Association of Railroads |
Other experience
| • | Commissioned officer in the U.S. Army and served in the Persian Gulf War in Saudi Arabia |
EDUCATION
| • | Bachelor of Science in Marketing, Jacksonville State University |
| • | Advanced Management Program, Harvard Business School |
SHARE OWNERSHIP
Shares: 3,490
DSUs: 31,928
Options: 561,653
Meets executive share ownership requirements (see page 31)
Gillian (Jill) H. Denham | ||
 | Independent Age: 59Director since: September 6, 2016 Residence: Toronto, Ontario, Canada2019 voting results: 98.46% for | |
DIRECTOR SKILLS AND QUALIFICATIONS Brings expertise in the following areas: senior executive leadership, accounting & financial literacy, executive compensation/human resources, investment management, governance, government/regulatory affairs and legal, risk management, sales & marketing and strategic oversight. |
OVERALL 2019 ATTENDANCE | 100% | |||||
| Meeting Attendance | ||||||
| Board | 7 of 7 | 100% | ||||
| Audit and Finance | 4 of 4 | 100% | ||||
| Audit | 4 of 4 | 100% | ||||
| Finance | 2 of 2 | 100% | ||||
| Risk and Sustainability | 2 of 2 | 100% | ||||
BUSINESS EXPERIENCE
| • | President, Authentum Partners Ltd., a company that invests in and advises technology related businesses (2018 to present) |
| • | Vice Chair Retail Markets for Canadian Imperial Bank of Commerce (“CIBC”) (2001 to 2005) |
| • | Previously held senior positions at CIBC Wood Gundy and CIBC, including: Managing Director Head of Commercial Banking and E-Commerce |
| • | President of Merchant Banking/Private Equity and Managing Director Head responsible for CIBC’s European Operations |
PUBLIC COMPANY BOARD EXPERIENCE
| • | Morneau Shepell Inc. (2008 to present) (Chair of the Board) |
| • | National Bank of Canada (2010 to present) (member of Human Resources Committee) |
| • | Kinaxis Inc. (2016 to present) (Chair of the Compensation Committee and member of the Audit Committee and Nominating and Governance Committee) |
| • | IHS Markit Ltd. (2014 to 2016) |
| • | Penn West Petroleum Ltd. (2012 to 2016) |
| • | Calloway Real Estate Investment Trust (2011 to 2012) |
OTHER EXPERIENCE
Other Boards
| • | Munich Reinsurance Company of Canada (Chair) (2012 to present) |
| • | Temple Insurance Company (Chair) (2012 to present) |
| • | Centre for Addiction and Mental Health (CAMH) (2015 to 2019) |
EDUCATION
| • | Honours Business Administration (HBA) degree, Ivey Business School, Western University |
| • | MBA, Harvard Business School |
SHARE OWNERSHIP
Shares: 0
DDSUs: 3,513
Options: 0
Has until September 2021 to meet the share ownership requirements
Edward R. Hamberger | ||
 | Independent Age: 69Director since: July 15, 2019 Residence: Delray Beach, Florida, U.S.A. 2019 voting results: N/A | |
DIRECTOR SKILLS AND QUALIFICATIONS Brings expertise in the following areas: senior executive leadership, accounting & financial literacy, environment, health & safety, transportation industry knowledge, governance, government/regulatory affairs and legal, risk management, sales & marketing and strategic oversight. |
OVERALL 2019 ATTENDANCE | 100% | |||||
| Meeting Attendance | ||||||
| Board | 5 of 5 | 100% | ||||
| Audit and Finance | 4 of 4 | 100% | ||||
| Risk and Sustainability | 2 of 2 | 100% | ||||
BUSINESS EXPERIENCE
| • | President and Chief Executive Officer Association of American Railroads (1998 to 2019) |
| • | Served as Assistant Secretary for governmental affairs at the U.S. Department of Transportation (1987 to 1989) |
OTHER EXPERIENCE
Other Boards
| • | Transportation Institute, University of Denver (2002 to present) |
| • | Business Advisory Committee, Kellogg School of Management, Northwestern University (2000 to 2019) |
| • | TTCI (Chair of the Board) (1998 to 2019) |
| • | Railinc Corporation (1998 to 2019) |
| • | Mineta Transportation Institute, San Jose State University (2005 to 2019) |
EDUCATION
| • | Juris Doctor Georgetown University |
| • | Master of Science, Foreign Service, Georgetown University |
| • | Bachelor of Science, Foreign Service, Georgetown University |
SHARE OWNERSHIP
Shares: 0
DDSUs: 383
Options: 0
Has until July 2024 to meet the share ownership requirements
2
Rebecca MacDonald | ||
 | Independent Age: 66Director since: May 17, 2012 Residence: North York, Ontario, Canada2019 voting results: 99.35% for | |
DIRECTOR SKILLS AND QUALIFICATIONS Brings expertise in the following areas: senior executive leadership, accounting & financial literacy, executive compensation/human resources, investment management, governance, risk management, sales & marketing and strategic oversight. |
OVERALL 2019 ATTENDANCE | 100% | |||||
| Meeting Attendance | ||||||
| Board | 7 of 7 | 100% | ||||
| Audit | 4 of 4 | 100% | ||||
| Compensation | 3 of 3 | 100% | ||||
| Governance (Chair) | 5 of 5 | 100% | ||||
BUSINESS EXPERIENCE
| • | Founder and current Executive Chair of Just Energy Group Inc., a Toronto-based independent marketer of deregulated gas and electricity |
| • | President and Chief Executive Officer of Just Energy (2001 to 2007) |
| • | Founded Energy Savings Income Fund in 1997, another company which aggregated customers in the deregulation of the U.K. natural gas industry |
| • | Founded Energy Marketing Inc. in 1989 |
PUBLIC COMPANY BOARD EXPERIENCE
| • | Just Energy Group Inc. (2001 to present) (Executive Chair since 2007) |
OTHER EXPERIENCE
Other Boards
| • | Horatio Alger Association in both Canada and the United States |
Other experience
| • | Founded the Rebecca MacDonald Centre for Arthritis and Autoimmune Disease at Mount Sinai Hospital in Toronto |
| • | Previously Vice-Chair of the Board of Directors of Mount Sinai Hospital |
| • | Previously a member of the Board of Governors of the Royal Ontario Museum |
EDUCATION
| • | Honorary LLD degree, University of Victoria |
SHARE OWNERSHIP
Shares: 0
DDSUs: 11,740
Options: 0
Meets share ownership requirements
Edward L. Monser | ||
 | Independent Age: 69Director since: December 17, 2018 Residence: St. Louis, Missouri, U.S.A.2019 voting results: 99.82% for | |
DIRECTOR SKILLS AND QUALIFICATIONS Brings expertise in the following areas: senior executive leadership, accounting & financial literacy, accounting & financial expertise, environment, health & safety, executive compensation/human resources, transportation industry knowledge, governance, risk management, sales & marketing and strategic oversight. |
OVERALL 2019 ATTENDANCE | 100% | |||||
Meeting Attendance | ||||||
Board | 7 of 7 | 100% | ||||
Audit and Finance | 4 of 4 | 100% | ||||
Audit | 3 of 4 | 75% | ||||
Compensation | 5 of 5 | 100% | ||||
BUSINESS EXPERIENCE
| • | President (2010-2018) and Chief Operating Officer (2001-2015) of Emerson Electric Co. |
| • | President (1996-2001) and Executive Vice President (1991-1996) of Rosemount Inc. |
| • | Member of the Advisory Economic Development Board for China’s Guangdong Province |
| • | Member and current Vice-Chairman of the U.S.-India Strategic Partnership Forum |
PUBLIC COMPANY BOARD EXPERIENCE
| • | Air Products & Chemicals Corporation (2013 to present) (Chair of Management Development and Compensation Committee and member of Audit Committee) |
OTHER EXPERIENCE
Other Boards
| • | Seyer Industries (2019 to present) |
| • | Vertiv Company (2016 to present) |
| • | Ranken Technical College |
Other experience
| • | Past board member and past vice-chairman of the U.S.-China Business Council |
EDUCATION
| • | Bachelor’s degree, Engineering, Illinois Institute of Technology |
| • | Bachelor’s degree, Education, Eastern Michigan University |
| • | Executive MBA, Stanford University Graduate School of Business |
SHARE OWNERSHIP
Shares: 0
DDSUs: 925
Options: 0
Has until December 2023 to meet the share ownership requirements
Matthew H. Paull | ||
 | Independent Age: 68Director since: January 26, 2016 Residence: Willmette, Illinois, U.S.A.2019 voting results: 99.79% for | |
DIRECTOR SKILLS AND QUALIFICATIONS Brings expertise in the following areas: senior executive leadership, accounting & financial literacy, executive compensation/human resources, investment management, governance, government/regulatory affairs and legal, risk management and strategic oversight. |
OVERALL 2019 ATTENDANCE | 100% | |||||
Meeting Attendance | ||||||
Board | 7 of 7 | 100% | ||||
Compensation (Chair) | 5 of 5 | 100% | ||||
Finance | 2 of 2 | 100% | ||||
Risk and Sustainability | 2 of 2 | 100% | ||||
BUSINESS EXPERIENCE
| • | Senior Executive Vice-President and Chief Financial Officer of McDonald’s Corporation (2001 until his retirement in 2008) |
| • | Before joining McDonald’s in 1993, was a partner at Ernst & Young where he managed a variety of financial practices during his 18-year career and consulted with many leading multinationalcorporations |
PUBLIC COMPANY BOARD EXPERIENCE
| • | Air Products & Chemicals Corporation (2013 to present) (Chair of Audit and Finance Committee and member of Corporate Governance and Nominating Committee and Executive Committee) |
| • | Chipotle Mexican Grill Inc. (2016 to 2020) (member of Compensation Committee)* |
| • | Best Buy Co. (2003 to 2013) (lead independent director and chair of Finance Committee) |
| • | WMS Industries Inc. (2012 to 2013) |
| • | KapStone Paper and Packaging Corporation (2010 to 2018) |
OTHER EXPERIENCE
Other Boards
| • | Pershing Square Capital Management, L.P. (2008 to present) (member of Advisory Board) |
EDUCATION
| • | Master’s degree in Accounting, University of Illinois |
| • | Bachelor’s degree, University of Illinois |
SHARE OWNERSHIP
Shares: 3,000
DDSUs: 5,715
Options: 0
Meets share ownership requirements
| * | As previously announced by Chipotle Mexican Grill Inc. on March 6, 2020, Mr. Paull will not stand for re-election to the Board of Chipotle Mexican Grill Inc. at its 2020 annual meeting of shareholders. |
3
Jane L. Peverett | ||
 | Independent Age: 61Director since: December 13, 2016 Residence: West Vancouver, British Columbia, Canada2019 voting results: 99.23% for | |
DIRECTOR SKILLS AND QUALIFICATIONS Brings expertise in the following areas: senior executive leadership, accounting & financial literacy, accounting & financial expertise, environment, health & safety, executive compensation/human resources, governance, government/regulatory affairs and legal, risk management and strategic oversight. |
OVERALL 2019 ATTENDANCE | 100% | |||||
Meeting Attendance | ||||||
Board | 7 of 7 | 100% | ||||
Audit and Finance (Chair) | 4 of 4 | 100% | ||||
Audit | 4 of 4 | 100% | ||||
Finance | 2 of 2 | 100% | ||||
Governance | 3 of 3 | 100% | ||||
BUSINESS EXPERIENCE
| • | President & Chief Executive Officer of BC Transmission Corporation (electrical transmission) (2005 to 2009) |
| • | Vice-President, Corporate Services and Chief Financial Officer of BC Transmission Corporation (2003 to 2005) |
| • | President of Union Gas Limited (a natural gas storage, transmission and distribution company) (2002 to 2003) |
| • | Other positions at Union Gas Limited: President & Chief Executive Officer (2001 to 2002); Senior Vice-President Sales & Marketing (2000 to 2001) and Chief Financial Officer (1999 to 2000) |
PUBLIC COMPANY BOARD EXPERIENCE
| • | CIBC (2009 to present) (Chair of Audit Committee) |
| • | Northwest Natural Gas Company (2007 to present) (member of Organization and Executive Compensation Committee and Public Affairs and Environmental Policy Committee) |
| • | Capital Power Corporation (2019 to present) (Member of Corporate Governance, Compensation and Nominating Committee and Health, Safety and Environment Committee) |
| • | Encana Corp. (2003 to 2017) |
| • | Postmedia Network Canada Corp. (2013 to 2016) |
| • | HydroOne Limited (2015 to 2018) |
OTHER EXPERIENCE
Other Boards
| • | CSA Group (2019 to present) (Chair of the Board) |
| • | British Columbia Institute of Corporate Directors Executive Committee |
EDUCATION
| • | Bachelor of Commerce degree, McMaster University |
| • | Master of Business Administration degree, Queen’s University |
| • | Certified Management Accountant |
| • | A Fellow of the Society of Management Accountants |
| • | Holds the ICD.D designation from the Institute of Corporate Directors |
SHARE OWNERSHIP
Shares: 0
DDSUs: 3,565
Options: 0
Has until January 2021 to meet the share ownership requirements
Andrea Robertson | ||
 | Independent Age: 56Director since: July 15, 2019 Residence: Calgary, Alberta, Canada2019 voting results: N/A | |
DIRECTOR SKILLS AND QUALIFICATIONS Brings expertise in the following areas: senior executive leadership, accounting & financial literacy, environment, health & safety, executive compensation/human resources, transportation industry knowledge, governance, government/regulatory affairs and legal, risk management, and strategic oversight. |
OVERALL 2019 ATTENDANCE | 100% | |||||
Meeting Attendance | ||||||
Board | 5 of 5 | 100% | ||||
Governance | 3 of 3 | 100% | ||||
Compensation | 3 of 3 | 100% | ||||
BUSINESS EXPERIENCE
| • | President & Chief Executive Officer, Shock Trauma Air Rescue Service (STARS) (2012 to present) |
| • | President & Chief Operating Officer, Shock Trauma Air Rescue Service (STARS) (2011 to 2012) |
OTHER EXPERIENCE
Other Boards
| • | The Calgary Airport Authority (2017 to present) |
| • | Bow Valley College (2015 to 2018) |
| • | United Way (2007 to 2013) |
| • | Alberta Children’s Hospital Foundation (2008 to 2009) |
| • | Foothills Development Council (2008 to 2009) |
| • | Libin Cardiovascular Institute (2008 to 2009) |
EDUCATION
| • | Executive Leadership, Harvard University |
| • | ICD.D Rotman School of Business |
| • | Masters in Science of Health Administration, Central Michigan University |
| • | Baccalaureate of Nursing - University of Calgary |
| • | Executive Fellowship - Wharton University |
SHARE OWNERSHIP
Shares: 0
DDSUs: 381
Options: 0
Has until July 2024 to meet the share ownership requirements
Gordon T. Trafton | ||
 | Independent Age: 66Director since: January 1, 2017 Residence: Naperville, Illinois, U.S.A.2019 voting results: 99.51% for | |
DIRECTOR SKILLS AND QUALIFICATIONS Brings expertise in the following areas: senior executive leadership, accounting & financial literacy, environment, health & safety, executive compensation/human resources, transportation industry knowledge, governance, government/regulatory affairs and legal, risk management, sales & marketing and strategic oversight. |
OVERALL 2019 ATTENDANCE | 100% | |||||
Meeting Attendance | ||||||
Board | 7 of 7 | 100% | ||||
Audit | 4 of 4 | 100% | ||||
Governance | 5 of 5 | 100% | ||||
Risk and Sustainability (Chair) | 2 of 2 | 100% | ||||
BUSINESS EXPERIENCE
| • | Consultant, Brigadier Consulting (2013) |
| • | Consultant, CP (2013) |
| • | Special Advisor to the Canadian National Railway leadership team (2009 to his retirement in 2010) |
| • | Senior Vice-President Strategic Acquisitions and Integration, CN (2009 to 2010) |
| • | Senior Vice-President, Southern Region, CN (2003 to 2009) |
| • | Held a number of leadership positions with Illinois Central Railroad and Burlington Northern Railroad |
OTHER EXPERIENCE
Other Boards
| • | Leeds School of Business Advisory Board, University of Colorado Boulder (2012 to present) |
EDUCATION
| • | Bachelor of Science, Transportation Management from the Leeds School of Business, University of Colorado Boulder |
SHARE OWNERSHIP
Shares: 0
DDSUs: 3,521
Options: 0
Has until January 2022 to meet the share ownership requirements
4
Notes:
Other than as disclosed below, none of the nominated directors is, or has been in the last 10 years:
| (a) | a director, chief executive officer or chief financial officer of a company that: |
| • | was subject to a cease trade or similar order or an order that denied the issuer access to any exemptions under securities legislation for over 30 consecutive days, that was issued while the proposed director was acting in that capacity, or |
| • | was subject to a cease trade or similar order or an order that denied the issuer access to an exemption under securities legislation for over 30 consecutive days, that was issued after the proposed director ceased to be a director, chief executive officer or chief financial officer and which resulted from an event that occurred while that person was acting in that capacity |
| (b) | a director or executive officer of a company that, while that proposed director was acting in that capacity, or within a year of that person ceasing to act in that capacity, became bankrupt, made a proposal under any legislation relating to bankruptcy or insolvency or was subject to or instituted any proceedings, arrangement or compromise with creditors or had a receiver, receiver manager or trustee appointed to hold its assets, |
| (c) | become bankrupt, made a proposal under any legislation relating to bankruptcy or insolvency, or become subject to or instituted any proceedings, arrangement or compromise with creditors, or had a receiver, receiver manager or trustee appointed to hold their assets, or |
| (d) | subject to any penalties or sanctions imposed by a court relating to securities legislation or by a securities regulatory authority or has entered into a settlement agreement with a securities commission. |
Ms. Denham served as a director of Penn West Petroleum Ltd. (now Obsidian Energy Ltd.) from June 2012 to June 2016, which was subject to cease trade orders on its securities following the July 2014 announcement of the review of its accounting practices and restatement of certain of its financial statements. Those cease trade orders ended on September 23, 2014.
Ms. Peverett was a director of Postmedia Network Canada Corp. (Postmedia) from April 2013 to January 2016. On October 5, 2016, Postmedia completed a recapitalization transaction under a court-approved plan of arrangement under the CBCA. Approximately US$268.6 million of debt was exchanged for shares that represented approximately 98% of the outstanding shares of Postmedia at that time. Postmedia repaid, extended and amended the terms of its outstanding debt obligations.
5
Executive Officers
The information regarding executive officers is included in Part I of our 2019 Form
10-K
under Executive Officers of the Registrant, following Item 4. Mine Safety Disclosures.Code of Business Ethics
Our code of business ethics (the “Code”) sets out our expectations for conduct. It covers confidentiality, protecting our assets, avoiding conflicts of interest, fair dealing with third parties, compliance with the laws, rules and regulations, as well as reporting any illegal or unethical behaviour, among other things. The Code applies to everyone at CP and our subsidiaries: directors, officers, employees (unionized and non-unionized) and contractors who do work for us.Directors, officers and non-union employees must sign an acknowledgment every year that they have read, understood and agree to comply with the Code. Unionized employees are provided with a copy of the Code every three years. In 2019, unionized employees were mailed a copy of the Code. Directors must also confirm annually that they have complied with the Code. The Code is part of the terms and conditions of employmentfor non-union employees, and contractors must agree to follow principles of standards of business conduct consistent with those set out in our Code as part of the terms of engagement. | Monitoring compliance and updating the Code The Governance Committee is responsible for monitoring compliance with the Code, reviewing it periodically and recommending changes as appropriate, and promptly disclosing any aspects of the Code that have been waived. The Audit and Finance Committee ensures compliance with the Code. 100% of non-union employees have completed their annual certification of compliance with the Code. |
We also have a supplemental code of ethics for the CEO and other senior financial officers (including the EVP and CFO, the Vice-President of Financial Planning and Accounting and the Assistant Vice-President and Controller) which sets out our longstanding principles of conduct for these senior roles. We also have a business ethics reporting policy that outlines the processes CP has established for CP personnel and others to report concerns regarding conduct within CP, including questionable management and/or corporate practices, the potential violation of any law, or a potential violation of the Code.
The latest version of the Code, the supplemental code of ethics and the business ethics reporting policy is posted on our website (investor.cpr.ca/governance). Only the Board or Governance Committee (Audit and Finance Committee in the case of the CEO and senior financial officers) can waive an aspect of the Code. Any waivers are posted on our website. No waivers were requested or granted in 2019.
Corporate Governance
CP has a strong governance culture and we have adopted many leading policies and practices. As a U.S. and Canadian listed company, our corporate governance practices comply with or exceed the practices outlined by the Canadian Securities Administrators (CSA) in National Policy
58-201
Corporate Governance Guidelines and the Toronto Stock Exchange (TSX), the Securities and Exchange Commission (SEC) and New York Stock Exchange (NYSE).We regularly review our policies and practices and make changes as appropriate, so we stay at the forefront of good governance as standards and guidelines continue to evolve in Canada and the United States.
The Board and the Governance Committee are responsible for developing our approach to corporate governance. This includes annual reviews of the corporate governance principles and guidelines which were established by the Board, as well as the terms of reference for the Board and each of the four Board committees.
CP’s corporate governance principles and guidelines are available on our website (investor.cpr.ca/governance).
CP’s Audit and Finance Committee has been established in accordance with Section 3(a)(58)(A) the Exchange Act and NYSE standards and CSA National Instrument
52-110.
The current members of the Audit and Finance Committee are Jane Peverett (chair), Isabelle Courville, Jill Denham, Edward Hamberger and Edward Monser, all of whom are independent. All members of the Audit and Finance Committee are “financially literate” as required by the NYSE and CSA. Ms. Peverett, Ms. Courville and Mr. Monser have been determined to be “audit committee financial experts” as defined by the SEC.If significant corporate governance differences between CP’s corporate governance practices and Item 303A of the NYSE arise, they will be disclosed on our website (investor.cpr.ca/governance).
6
As a foreign private issuer in the United States, we are deemed to comply with this Item if we provide information required by Items 6.B and 6.E.2 of Form
20-F,
with more detailed information provided if otherwise made publicly available or required to be disclosed in Canada. We have provided information required by Items 6.B and 6.E.2 of Form20-F
in the Circular. As a foreign private issuer in the U.S., we are not required to disclose executive compensation according to the requirements of RegulationS-K
that apply to U.S. domestic issuers, and we are otherwise not required to adhere to the U.S. requirements relative to certain other proxy disclosures and requirements. Our executive compensation disclosure complies with Canadian requirements, which are, in most respects, substantially similar to the U.S. rules. We generally attempt to comply with the spirit of the U.S. proxy rules when possible and to the extent that they do not conflict, in whole or in part, with required Canadian corporate or securities requirements or disclosure.All dollar amounts included in this Item 11 are in Canadian dollars, unless otherwise expressly stated to be in U.S. dollars.
Compensation Committee Interlocks and Insider Participation
There were no reportable interlocks or insider participation affecting the Company’s Management Resources and Compensation Committee during the year ended December 31, 2019. None of our executive officers serves as a member of the board of directors or compensation committee of any entity that has one or more executive officers serving as a member of our Board or our Management Resources and Compensation Committee.
Compensation Committee Report
The Management Resources and Compensation Committee has reviewed and discussed the Compensation Discussion and Analysis contained in this annual report on Form
10-K/A
with management of the Company and, based on such review and discussion, the Management Resources and Compensation Committee recommended to the Board that the information set forth under “Compensation Discussion and Analysis” below be included in this annual report on Form10-K/A.
Respectfully submitted,
Management Resources and Compensation Committee
Matthew Paull (Chair)
Isabelle Courville
Rebecca MacDonald
Edward Monser
Andrea Robertson
7

Our executive compensation program is designed to pay for performance, and to align management’s interests with our business strategy and the interests of our shareholders.
The next section describes our compensation program and explains the 2019 compensation decisions for our NEOs:
| • | Keith E. Creel, President and Chief Executive Officer |
| • | Nadeem S. Velani, Executive Vice-President and Chief Financial Officer |
| • | John K. Brooks, Executive Vice-President and Chief Marketing Officer |
| • | Laird J. Pitz, Senior Vice-President and Chief Risk Officer |
| • | Mark A. Redd, Executive Vice-President Operations |
| • | Robert A. Johnson, Retired Executive Vice-President Operations |
The Compensation Committee has reviewed and discussed the Compensation Discussion and Analysis with management. Based on its review, the compensation committee recommended to the Board that the Compensation Discussion and Analysis be included in this proxy circular.
Where to find it
8
2019 compensation
The table below shows the total direct compensation awarded to the named executive officers (NEOs) for 2019.
At-risk pay | |||||||||||||||||||||||||||||||||||
| ($ thousands) | Long-term incentive awards | ||||||||||||||||||||||||||||||||||
| Base salary | Short-term incentive | Performance share units | Stock options | Total direct compensation | % at risk | ||||||||||||||||||||||||||||||
Keith E. Creel President and Chief Executive Officer | 1,538 | 2,979 | 5,870 | 3,642 | 14,029 | 89 | % | ||||||||||||||||||||||||||||
Nadeem S. Velani Executive Vice-President and Chief Financial Officer | 751 | 1,096 | 1,552 | 979 | 4,378 | 83 | % | ||||||||||||||||||||||||||||
John K. Brooks Executive Vice-President and Chief Marketing Officer | 670 | 829 | 1,197 | 697 | 3,393 | 81 | % | ||||||||||||||||||||||||||||
Laird J. Pitz Senior Vice-President and Chief Risk Officer | 529 | 571 | 811 | 503 | 2,414 | 78 | % | ||||||||||||||||||||||||||||
Mark A. Redd Executive Vice-President Operations | 491 | 593 | 605 | 355 | 2,044 | 76 | % | ||||||||||||||||||||||||||||
Robert A. Johnson (1) Retired Executive Vice-President Operations | 478 | 524 | 1,015 | 629 | 2,646 | 82 | % | ||||||||||||||||||||||||||||
Note(s):
| (1) | Mr. Johnson retired from the Company effective September 30, 2019. |
Compensation for the NEOs is benchmarked and set in U.S. dollars consistent with industry practice. The compensation has been converted to Canadian dollars using an average exchange rate of $1.3269 for 2019, with the exception of Mr. Velani, whose salary is set in U.S. dollars, but paid in Canadian dollars, and is subject to a foreign exchange adjustment of US$1 to CAD$1.3432.
You can read more about executive compensation in the compensation discussion and analysis.
We believe in the importance of paying for performance and aligning management’s interests with those of our shareholders.
Our executive compensation program supports our railway-focused culture, and is closely linked to the critical metrics that drive the achievement of our strategic plan without taking on undue risk, and is designed to create long-term sustainable value for our shareholders.
We have five key performance drivers designed to focus us on our goal of being the best railroad company in North America:
| 1. | Provide customers with industry-leading rail service |
| 2. | Control costs |
| 3. | Optimize our assets |
| 4. | Remain a leader in rail safety |
| 5. | Develop our people |
As disclosed in our 2018 proxy circular, we implemented several changes to our compensation program in 2017. These changes were the result of an extensive shareholder engagement program and review of executive compensation by the Compensation Committee, the Board and our human resources group. Other than the shifting of the weighting of the metrics within our short-term incentive plan (STIP) and performance share unit (PSU) plans, we did not make any further changes to the structure of our compensation plans in 2019.
9
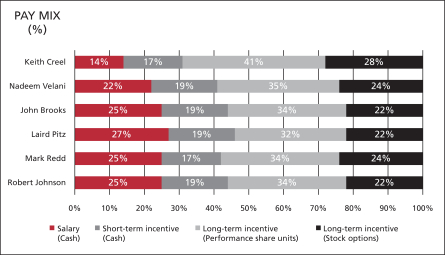
Compensation mix
Attracting and retaining high calibre executives is key to our long-term success.
We believe strong performance should yield significant rewards. Our executive compensation includes fixed and variable
(at-risk)
pay and the proportion ofat-risk
pay increases by level. Executives earn more if we perform well, and less when performance is not as strong. A significant portion of executive pay is tied to the value of our shares, aligning with shareholder interests. We require our executives to own CP equity and our share ownership guidelines increase by executive level (see page 12).Variable short-term compensation is more focused on corporate results for executives (75% of target) than for other employees (50% of target) who have more emphasis placed on individual and departmental goals.
This supports our view that the STIP should be tied to overall corporate performance and the areas of our business that each employee influences directly.
The table below shows the pay mix for our current NEOs based on their total target compensation.
Benchmarking
With input from our compensation advisors, we reviewed and updated our compensation comparator group in 2018. Other than the removal of Goldcorp Inc., which was acquired by Newmont Mining Inc., from the comparator group, we did not make any further changes to our comparator group in 2019. Our comparator group consists of six Class 1 Railroad peers as well as 11 capital-intensive Canadian companies. For certain positions within the organization, we apply a heavier weighting to Class 1 Railroad peers; however, we consistently review alignment and compensation practices against the whole group.
Our compensation peer group is as follows:
| BNSF Railway Company | BCE Inc. | |
| Canadian National Railway Company | Fortis Inc. | |
| CSX Corporation | TC Energy Corporation | |
| Kansas City Southern | TELUS Corporation | |
| Norfolk Southern Corporation | Rogers Communications Inc. | |
| Union Pacific Corporation | Barrick Gold Corporation | |
| Cenovus Energy Inc. | Kinross Gold Corporation | |
| Enbridge Inc. | Suncor Energy Inc. | |
| Imperial Oil Limited |
10
Compensation pays out over time

Variable pay includes short and long-term incentive awards to facilitate annual and longer-term performance and align with shareholder interests.
Incentive awards are cash and equity-based. Equity-based awards vest at the end of three years for PSUs and over four years for stock options. Stock options expire at the end of seven years.
The Compensation Committee ensures that the performance objectives for the incentive plans align directly with our strategic plan, which is reviewed and approved by the Board.
Executives are CP shareholders
We require executives and senior management employees to own equity in the company so they have a stake in our future success. Share ownership requirements are set as a multiple of base salary and increase by level. Executives must satisfy the requirement within five years of being appointed to their position and can meet the requirements by holding shares or deferred share units (DSUs). The CEO must maintain the ownership level of six times his base salary for one year after he retires or leaves CP. Once executives have met their initial shareholding requirements, they are required to maintain compliance, which is reported annually to the Compensation Committee.
DSUs are redeemed for cash no earlier than six months after the executive retires or leaves the company or until the end of the following calendar year for Canadian-resident executives. Payment to U.S.-resident executives who participate in the Senior Executives’ Deferred Share Unit Plan (the DSU Plan) is made after the
six-month
waiting period to be in compliance with U.S. tax regulations.11
The table below shows the ownership requirement by level, which applied to 87 executives and senior management employees in 2019.
Ownership requirement (as a multiple of base salary) | ||||
CEO | 6x | |||
Executive Vice-President | 3x | |||
Senior Vice-President | 2x | |||
Vice-President | 1.5 to 2x | |||
Senior management | 1x | |||
Mr. Creel, Mr. Velani and Mr. Pitz have met their ownership requirement. Mr. Brooks and Mr. Redd are expected to meet their requirement within the five-year period following their appointment. Mr. Johnson, who retired from the company on September 30, 2019, met his ownership requirement. You can read about each executive’s share ownership in their individual profiles beginning on page 28.
Disciplined decision-making process
Executive compensation decisions involve management, the Compensation Committee and the Board. The Compensation Committee also receives advice and support from external consultants from time to time.

DECISION-MAKING PROCESS1Management makes recommendations to the Compensation Committee Management: reviews market data reviews compensation survey data analyzes company performance proposes corporate and individual performance objectives to the Committee for the coming year2The Committee works with a consultant and makes compensation recommendations to the Board The Committee: Yrecommends the corporate performance targets and weightings for the incentive plans reviews the corporate performance results for the incentive plans Yreviews individual performance receives independent advice from its external consultant Yrecommends the annual and long-term incentive awards to the Board3The Board has final approval The Board: Yreviews corporate and individual performance decides whether to use discretion approves compensation for the CEO and other NEOs approves all grants of equity compensation awards Ysets performance objectives for the following year
The Board has final approval on all matters relating to executive compensation. It can also use its discretion to adjust pay decisions as appropriate.
Qualified and experienced Compensation Committee
The Compensation Committee is responsible for our compensation philosophy, strategy and program design. The Compensation Committee consists of five independent directors.
12
The Compensation Committee has the relevant skills, background and experience for carrying out its duties. The table below shows the key skills and experience of each member:
Human Resources/ compensation/ succession planning | CEO/senior management | Governance and policy development | Transportation industry | Risk management | Engagement (shareholders and others) | |||||||
Matthew Paull (Committee Chair) | ✓ | ✓ | ✓ | ✓ | ✓ | |||||||
Isabelle Courville (Chair of the Board) | ✓ | ✓ | ✓ | ✓ | ✓ | ✓ | ||||||
Rebecca MacDonald | ✓ | ✓ | ✓ | ✓ | ✓ | |||||||
Ed Monser | ✓ | ✓ | ✓ | ✓ | ✓ | ✓ | ||||||
Andrea Robertson | ✓ | ✓ | ✓ | ✓ | ✓ | ✓ |
Compensation Committee members also have specific human resources and compensation-related experience, including:
| • | direct responsibility for executive compensation matters |
| • | membership on other human resources committees |
| • | compensation plan design and administration, compensation decision-making and understanding the Board’s role in the oversight of these practices |
| • | understanding the principles and practices related to leadership development, talent management, succession planning and employment contracts |
| • | engagement with investors on compensation issues |
| • | oversight of financial analysis related to compensation plan design and practices |
| • | oversight of labour matters and a unionized workforce |
| • | pension benefit oversight |
| • | recruitment of senior executives |
The Compensation Committee has no interlocks or insider participation. None of the members were employed by or had any relationship with CP during 2019 requiring disclosure under Item 404 or Item 407(e)(4) of Regulation
S-K
of the Exchange Act. You can read about the background and experience of each member in the director profiles beginning on page 1.Independent advice
The Compensation Committee and management retain separate independent executive compensation advisors to avoid any conflicts of interest:
| Committee advisor | Management advisor | |
• the Compensation Committee retained Kingsdale Advisors (Kingsdale) in 2018 and 2019 to act as an independent compensation advisor • the Compensation Committee approves all compensation related fees and work performed by the independent compensation advisor | • management engages Willis Towers Watson to provide market survey data and advice relating to executive compensation |
The next table shows the fees paid to Kingsdale and Willis Towers Watson in 2018 and 2019.
| 2019 | 2018 | |||||||||||||||||||
| Kingsdale | Willis Towers Watson | Kingsdale | Willis Towers Watson | |||||||||||||||||
Executive compensation-related fees | $ 90,000 | $ 74,785 | $ 78,750 | $ 233,309 | ||||||||||||||||
Other fees | $112,821 | $2,598,193 | $111,254 | $2,150,258 | ||||||||||||||||
Total fees | $202,821 | $2,672,978 | $190,004 | $2,383,567 | ||||||||||||||||
13
Fees paid
Kingsdale was first retained by the Board to provide independent advisory services related to compensation in 2018. For 2019, the Board retained Kingsdale to provide independent advisory services related to governance trends and specific governance items, as well as CEO compensation. $90,000 was paid to Kingsdale in fees for advisory services provided to the Board. The total governance and executive compensation fees represent 44% of the $202,821 paid in total to Kingsdale for all services provided to CP, including proxy solicitation and shareholder advisory services.
In 2019, $74,785 was paid to Willis Towers Watson for executive compensation advisory fees provided to management. The total executive compensation fees represent 3% of the total fees in 2019 to Willis Towers Watson for all services provided to management, including actuarial and pension consulting, corporate risk and insurance broking services.
Compensation risk
Effective risk management is integral to achieving our business strategies and to our long-term success.
The Board believes that our executive compensation program should not increase our risk profile. The Compensation Committee is responsible for overseeing compensation risk. It reviews the executive compensation program, incentive plan design and our policies and practices to make sure they encourage the right decisions and actions to reward performance and align with shareholder interests.
Incentive plan targets are linked to our corporate objectives and our corporate risk profile. The Compensation Committee believes that our approach to goal setting, establishing performance measures and targets and evaluating performance results helps mitigate risk-taking that could reward poor judgment by executives or have a negative effect on shareholder value.
All of the Compensation Committee members other than Mr. Paull and Mr. Monser are members of the Governance Committee. In addition, Ms. Courville and Mr. Monser are also members of the Audit and Finance Committee, and Ms. Courville and Mr. Paull are members of the Risk and Sustainability Committee. This cross-membership strengthens risk oversight because it gives the directors a broader perspective of risk oversight and a deeper understanding of our enterprise risks.
Regular risk review
The Compensation Committee conducts a comprehensive compensation risk review approximately every two years to make sure that we have identified the compensation risks and have appropriate measures in place to mitigate those risks. An independent consultant assists the Compensation Committee with the review, which includes looking at:
| • | the targets for the STIP and PSU plan, anticipated payout levels and the risks associated with achieving targeted performance; |
| • | the design of the long-term incentive awards, which reward sustainable financial and operating performance; and |
| • | the compensation program, policies and practices to ensure alignment with our enterprise risk management practices. |
In 2019, Management retained Willis Towers Watson to perform a detailed risk assessment of our compensation plans, programs and practices. Willis Towers Watson concluded that there did not appear to be significant risks associated with CP’s compensation programs. The committee reviewed Willis Towers Watson’s findings and agreed that CP’s compensation policies and programs did not encourage excessive risk that could have material adverse effects on CP.
14
Managing compensation risk
We mitigate risk in three ways:
| 1. Plan design | • we use a mix of fixed and variable (at-risk) compensation and a significant proportion isat-risk pay• short and long-term incentive plans have specific performance measures that are closely aligned with the achievement of our business strategy and performance required to achieve results in accordance with guidance provided to the market • the payout curve for the STIP is designed asymmetrically to reflect the significant stretch in target performance • the payout under the STIP is capped and not guaranteed, and the compensation committee has discretion to reduce the awards • the long-term incentive plan has overlapping vesting periods to address longer-term risks and maintain executives’ exposure to the risks of their decision-making through unvested share based awards | |
| 2. Policies | • we promote an ethical culture and everyone is subject to a code of business ethics • we have share ownership requirements for executives and senior management so they have a stake in our future success • we have a disclosure and insider trading/reporting policy to protect our interests and ensure high business standards and appropriate conduct • our anti-hedging policy prohibits directors, officers and employees from hedging our shares and share-based awards • our anti-pledging policy prohibits directors and senior officers from holding our shares in a margin account or otherwise pledging them as security • we also have a policy that prohibits employees from forward selling shares that may be delivered on the future exercise of stock options, or otherwise monetizing their option awards, other than through exercising the options and subsequently selling the shares through a public venue or the company’s cashless exercise option • our clawback policy allows us to recoup incentive pay from current and former senior executives as appropriate (see page 16 for more information about clawbacks) • DSUs held by the CEO and executives are not settled for cash until at least six months after leaving the Company • our whistleblower policy applies to all employees and prohibits retaliation against anyone who makes a complaint acting in good faith | |
3. Mitigation measures | • senior executives have a significant portion of their compensation deferred • we must achieve a specific threshold of operating income, otherwise no short-term incentive awards are granted • financial performance is verified by our external auditor (completion of annual financial statement audit) before the Board makes any decisions about short-term incentives • the Compensation Committee adopted principles for adjusting payout under the STIP, and provides them to the Board as part of their review of the Compensation Committee’s recommendations and performance overall • environmental principles are fundamental to how we achieve our financial and operational objectives, and the Compensation Committee takes them into account when exercising discretion and determining the short-term incentive awards • all long-term incentive eligible employees are subject to two-year non-compete andnon-solicit covenants should they leave CP• safety is considered as part of individual performance under the short-term incentive for the President and CEO and executives in operations roles in addition to being a specific STIP measure • we regularly benchmark executive compensation against our comparator group of companies • different performance scenarios are stress-tested and back-tested to understand possible outcomes • we review and consider risks associated with retention-related compensation |
15
Key policies
In addition to CP’s code of business ethics and the business ethics reporting policy, a number of other policies act to mitigate compensation risk. You can read more about ethical behaviour at CP and our code of business ethics and other policies beginning on page 6.
Clawbacks
Our clawback policy allows the Board to recoup short and long-term incentive compensation paid to a current or former senior executive if:
| • | the incentive compensation received was calculated based on financial results that were subsequently restated or corrected, in whole or in part; and/or |
| • | the senior executive engaged in gross negligence, fraud or intentional misconduct that caused or contributed to the need for the restatement or correction, as admitted by the senior executive or as reasonably determined by the Board |
The Board has sole discretion to determine whether it is in our best interests to pursue reimbursement of all or part of the incentive compensation and these actions would be separate from any actions by law enforcement agencies, regulators or other authorities.
Anti-hedging
Our disclosure and insider trading and reporting policy prohibits directors, executive officers and employees from buying financial instruments that are designed to hedge or offset a decrease in the market value of equity awards or shares they hold directly or indirectly.
Anti-pledging
Our anti-pledging policy prohibits directors and executive officers from holding any CP securities in a margin account or otherwise pledging the securities as collateral for a loan.
16
Total direct compensation consists of salary, an annual short-term incentive and a long-term incentive award that focus executives on driving strong financial, operational and customer satisfaction results while building shareholder value. Executives also receive pension benefits and perquisites as part of their overall compensation.
| Element | Purpose | Risk mitigating features | Link to business and talent strategies | |||||
 | Salary Cash (see page 18) | • competitive level of fixed pay • reviewed annually | • external advisor benchmarks against our comparator group to ensure appropriate levels and fairness | • attract and retain talent • no automatic or guaranteed increases to promote a performance culture | ||||
 | Short-term incentive Cash bonus (see page 18) | • annual performance incentive to attract and retain highly qualified leaders • set target awards based on level of employee | • set target performance at the beginning of the year to assess actual performance at the end of the year • actual payouts are based on the achievement of pre-determined corporate and individual objectives• corporate performance has an operating income hurdle • payouts are capped • no guarantee of a minimum payout | • attract and retain highly qualified leaders • motivate high corporate and individual performance • use metrics that are based on the strategic plan and approved annually • align personal objectives with area of responsibility and role in achieving operating results | ||||
Deferred compensation Deferred share units (see page 52) | • encourages share ownership • executives can elect to receive the short-term incentive and their annual PSU grant in DSUs if they have not yet met their share ownership requirement • company provides a 25% match of the deferral amount in DSUs | • deferral limited to the amount needed to meet the executive’s share ownership guidelines • aligns management interests with growth in shareholder value • helps retain key talent • company contributions vest after three years | • sustained alignment of executive and shareholder interests because the value of DSUs is tied directly to our share price • cannot be redeemed for cash until a minimum of six months after the executive leaves CP | |||||
Long-term incentive (LTIP) (see page 21) | ||||||||
Performance share units (see page 23) | • equity-based incentive aligns with shareholder interests and focuses on three-year performance • accounts for 60% of an executive’s long-term incentive award | • use pre-defined market and financial metrics• the number of units that vest is based on a performance multiplier that is capped • no guarantee of a minimum payout | • focuses the leadership team on achieving challenging performance goals • ultimate value based on share price and company performance • attract and retain highly qualified leaders | |||||
Stock options (see page 24) | • accounts for 40% of an executive’s long-term incentive award • vests over four years, term is seven years | • focuses on appreciation in our share price, aligning with shareholder interests • only granted to executives | • focuses the leadership team on creating sustainable long-term value | |||||
 | Pension Defined contribution and defined benefit pension plans (see page 51) | • pension benefit based on pay and service and competitive with the market • supplemental plan for executives and senior managers | • balances risk management of highly performance-focused pay package | • attract and retain highly qualified leaders | ||||
Perquisites Flexible spending account (see page 45) | • competitive with the market | • restrictions for the CEO | • attract and retain highly qualified leaders | |||||
17
Salary
Salaries are set every year based on the executive’s performance, leadership abilities, responsibilities and experience as well as succession and retention considerations. The Compensation Committee also considers the economic outlook and the median salary and practices of the comparator group before making its decisions. The base salaries of all NEOs are set in U.S. dollars consistent with industry practice.
| 2019 (in USD) | % change from 2018 | 2018 (in USD) | ||||||||||
Keith Creel | 1,158,750 | 3.0% | 1,125,000 | |||||||||
Nadeem Velani | 566,500 | 3.0% | 550,000 | |||||||||
John Brooks | 525,000 | 31.3% | 400,000 | |||||||||
Laird Pitz | 400,000 | 6.7% | 375,000 | |||||||||
Mark Redd | 425,000 | 24.4% | 341,700 | |||||||||
Robert Johnson | 458,350 | 3.0% | 445,000 | |||||||||
| Notes: |
| • | Mr. Brooks was promoted to the position of Executive Vice-President & Chief Marketing Officer effective February 14, 2019, with a corresponding increase in pay. |
| • | Mr. Redd was promoted to the position of Executive Vice-President Operations effective September 1, 2019, with a corresponding increase in pay. |
Short-term incentive plan (STIP)
The short-term incentive award is an annual incentive that focuses executives on achieving strong financial, safety, operational and customer satisfaction results.
| What it is | • cash bonus for achieving pre-determined annual corporate and individual performance objectives that are tied directly to our strategy and operational requirements | |
| Payout | • corporate performance is assessed against financial, safety and operational measures • individual performance is assessed against individual performance objectives • no guarantee of a minimum payout | |
| Restrictions | • must meet minimum level of performance • must achieve corporate operating income hurdle for any payout on individual or corporate performance to occur • performance multiplier is capped for exceptional performance • actual award is capped as a percentage of base salary | |
| If the executive retires | • executive must give three months’ notice • award for the current year is pro-rated to the retirement date |
18
The table below shows the 2019 short-term incentive awarded to the NEOs. All salaries have been converted to Canadian dollars using an average exchange rate of $1.3269 for 2019, with the exception of Mr. Velani, whose salary is set in U.S. dollars, but paid in Canadian dollars, and is subject to a foreign exchange adjustment of US$1 to CAD$1.3432.
We use financial and
non-financial
measures to assess corporate performance. Individual performance is assessed against individual performance objectives for the year and otherpre-determined
goals that reflect the strategic and operational priorities critical to each executive’s role.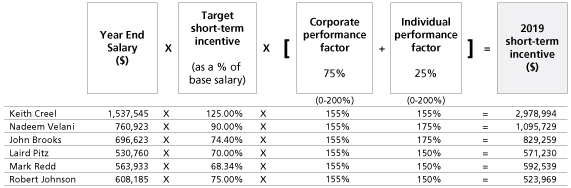
Year EndSalary$XTargetshort-termincentiveX[Corporateperformancefactor+Individualperformancefactor]=2019short-termincentive$(as a % of base salary)75%25%$1.3269(0-200%)(0-200%)Keith Creel$1,537,545X125.00%X155%155%=$2,978,994Nadeem Velani$760,923X90.00%X155%175%=1,095,729John Brooks$696,623X74.40%X155%175%=$829,259Laird Pitz$530,760X70.00%X155%150%=$571,230Mark Redd$563,933X68.34%X155%150%=$592,539Robert Johnson$608,185X75.00%X155%150%=$523,969
Notes:
| • | As both Mr. Brooks and Mr. Redd received promotions in 2019, their short-term incentive plan (STIP) targets have been prorated accordingly. |
| • | Mr. Johnson retired from the Company effective September 30, 2019. His STIP is reflective of the portion of the year which he was employed. |
Corporate and individual performance factors are capped at 200% to limit payouts and avoid excessive risk-taking.
An employee’s payout on the individual component of the STIP may be zero or range from 50% to 200%. Any award payable under the individual component is subject to a minimum level of corporate performance. No award is payable unless the minimum corporate hurdle is achieved.
Actual STIP awards are also capped as a percentage of base salary, as shown in the table to the right.
Assessing corporate performance
In 2019, we increased the weighting of our safety measure within the STIP targets to 20% from 10%. This change
| Payout as a % of base salary | ||||||||||||||||
| Level | Below hurdle | Minimum | Target | Maximum | ||||||||||||
CEO | 0 | % | 62.5 | % | 125 | % | 250 | % | ||||||||
Other named executives | 0 | % | 34.2-45 | % | 68.3-90 | % | 136.7-180 | % | ||||||||
reinforces CP’s commitment to safety and our focus on maintaining our industry leading position in safety performance. To accommodate this change we decreased our weighting by 5% on Operating Ratio and 5% on Operating Income to a total of 35% each on our financial measures from 40% each. No changes were made to actual metrics in 2019 as they are reflective of CP’s focus on sustainable, profitable growth.
New For 2020
In 2020, CP will add a second safety metric to its STIP program. In addition to the current industry standard Federal Railroad Administration (FRA) Train Accident metric, we will also be measuring FRA Personal Injury Frequency.
Our employees work in an industrial setting where the potential for injury is high. Adding this measure reinforces CP’s commitment to ensure our employees get home safe each day.
The STIP weighting for safety will continue to be 20%, with 10% each allocated to FRA Train Accident Frequency and FRA Personal Injury Frequency.
19
Corporate performance
The table below shows the 2019 scorecard and results. The targets were set with adequate stretch to motivate strong performance.
The Board sets a corporate hurdle for operating income. There is no payout if we do not achieve that corporate hurdle. If we achieve the hurdle but corporate performance is below threshold for all measures, then only the individual performance factor is used to calculate the awards. Corporate results between 50% and 200% of target are interpolated. For 2019, the operating income hurdle was set at $2 billion.
CP delivered record financial performance in 2019. Our precision scheduled railroading operating model enabled us to produce our highest-ever revenues, lowest-ever operating ratio and record operating income and adjusted earnings. The reported operating ratio came in at 59.9% and reported operating income was $3,124 million. From a safety perspective, CP’s personal injury rate improved 4% and our train accident frequency led the industry in this key safety metric.
Performance measure | Why it is important | Threshold (50%) | Target (100%) | Exceptional (200%) | 2019 Reported Result | 2019 STIP Result | Weighting | Score | ||||||||||||||||||||||
Financial measures | ||||||||||||||||||||||||||||||
STIP Operating ratio Operating expenses divided by total revenues based on an assumed fuel price and foreign exchange rate | Continues our focus on driving down costs while focusing on growth strategy | 61.3% | 60.8% | 60.3% | 59.9% | 59.9 | % | 35% | 200% | |||||||||||||||||||||
STIP Operating income ($ millions) Total revenues less total operating expenses based on an assumed foreign exchange rate | Highlights the importance of revenue growth to our corporate strategy | 3,014 | 3,054 | 3,121 | 3,124 | 3,089 | 35% | 152% | ||||||||||||||||||||||
Safety measure | ||||||||||||||||||||||||||||||
FRA Train Accident Frequency Number of FRA reportable train accidents which meet FRA reporting thresholds per million train miles | CP has long been an industry leader in rail safety and we are more focused on it than ever, committed to protecting our people, our communities, our environment and our customers’ goods. As safety is our top priority, in 2019, we increased the weighting of our safety measure within the STIP targets to 20% from 10% | 1.12 | 1.08 | 0.99 | 1.06 | 1.06 | 20% | 122% | ||||||||||||||||||||||
Operating measure | ||||||||||||||||||||||||||||||
Trip Plan Compliance Calculated as the number of shipments completed on time (less than 12 hours late vs. baseline plan), divided by the total number of shipments completed | Trip plan compliance is a detailed schedule of performance and the core of CP’s product offering. It balances between customer needs and what we are capable of delivering It is critical to the service we provide customers and to our growth strategy. Trip plan compliance, as a stand-alone measure, is a relatively new measure at CP | 75% | 80% | 85% | 77.1% | 77.1 | % | 10% | 71% | |||||||||||||||||||||
Corporate performance factor | 155% | |||||||||||||||||||||||||||||
The Compensation Committee may adjust the results for unusual or
non-recurring
items that are outside our normal business and do not accurately reflect our ongoing operating results or business trends and affect the comparability of our financial performance year over year. Results used under the STIP could therefore differ from our reported GAAP results. Significant items that were adjusted so that they do not impact, either favourably or unfavourably, the assumptions made when the STIP targets were planned include: foreign exchange rates, fuel price and land sales, all of which were adjusted to reflect the original assumptions made in our 2019 budget. Consequently, Operating Income was adjusted downwards compared to our reported results which reduced the bonus payment.20
Assessing individual performance
Executives set individual performance objectives before the start of every financial year.
The individual performance factor is based on the executive’s performance against those objectives and other
pre-defined
quantitative and qualitative goals that reflect the strategic and operational priorities critical to each executive’s role, including operational management, safety, financial and other objectives.Each objective has a minimum, target and maximum. The individual performance factor ranges from 0% to 200%.
2019 individual performance factor | The individual performance factor for the CEO has a cap, so his individual performance factor cannot exceed the corporate performance factor. This ensures the payout factor for the CEO aligns with the CEO’s overall responsibility for CP’s performance. | |||||||||||||
Keith Creel | 155 | % | ||||||||||||
Nadeem Velani | 175 | % | ||||||||||||
John Brooks | 175 | % | ||||||||||||
Laird Pitz | 150 | % | ||||||||||||
Mark Redd | | 150 | % | |||||||||||
Robert Johnson | 150 | % | ||||||||||||
The Compensation Committee sets the individual performance factor for the CEO. The CEO reviews the performance of his direct reports against their objectives, and recommends their individual performance factors to the Compensation Committee. | ||||||||||||||
See the profiles beginning on page 28 to read about each executive’s individual performance in 2019.
Compensation Committee Discretion
The Compensation Committee has developed principles for the use of discretion. Adjustments should not relieve management from the consequences of their decision making. Adjustments should also neither reward nor penalize management for decisions on discretionary transactions, events outside their control (such as foreign exchange rates and fuel prices that are beyond the assumptions used in the planning process) or transactions outside normal corporate planning and budgeting.
As a result, the Compensation Committee can reduce the corporate performance factor for any executive officer as it deems appropriate, as long as it follows the principles. The Board can also use its discretion to adjust the targets and payouts up or down, following the principles set out by the Compensation Committee. The Compensation Committee did not exercise any such discretion in 2019.
Long-term incentive plan
Long-term incentive awards focus executives on medium and longer-term performance to create sustainable shareholder value.
Target awards are set based on the competitive positioning of each executive’s compensation and the practices of companies in our peer group in order to attract and retain experienced railroad executives with highly specialized skills.
| Performance share units (60%) | Stock options (40%) | |||
| What they are | • notional share units that vest at the end of three years based on absolute and relative performance and the price of our shares | • right to buy CP shares at a specified price in the future | ||
| Payout | • cliff vest at the end of three years based on performance against three pre-defined financial and market metrics• no guarantee of a minimum payout | • vest 25% every year beginning on the anniversary of the grant date • expire at the end of seven years • only have value if our share price increases above the exercise price |
21
| Performance share units (60%) | Stock options (40%) | |||
| Dividend equivalents | • earned quarterly and compound over the three-year period | • do not earn dividend equivalents | ||
| Restrictions | • must meet minimum level of performance • performance multiplier is capped for exceptional performance | • cannot be exercised during a blackout period | ||
| If the executive retires | • must give three months’ notice • award continues to vest and executive is entitled to receive the full value as long as they have worked for six months of the performance period, otherwise the award is forfeited | • must give three months’ notice • options continue to vest, but expire five years after the retirement date or on the normal expiry date, whichever is earlier |
Stock options are usually granted in January immediately after the fourth quarter financial statement blackout period ends, while performance share units (PSUs) are awarded in February after the Compensation Committee has reviewed the
year-end
financial results in detail.Grants are also made for special situations like retention or new hires. Special grants can include PSUs, RSUs, DSUs or stock options. These grants are made on the first Tuesday of the month following approval. If we are in a blackout period, the grant is made after the blackout has been lifted.
Non-Compete andNon-Solicitation | ||
CP is mindful that the demand for experienced and talented railroaders is high, particularly those with backgrounds in precision scheduled railroading. To manage near-term retention risk, the company’s long-term incentive award agreements contain non-compete, non-solicitation and other restrictive clauses, includingnon-disclosure restrictions.Non-compete andnon-solicitation provisions will apply if a recipient fails to comply with certain commitments for atwo-year period following the end of employment. |
2019 long-term incentive awards
To determine the appropriate value of long-term incentive grants provided to the NEOs, the Compensation Committee considers the practices of our comparator group and external market data, as well as internal factors including executive retention, dilutive impact and long-term value creation.
The table below shows the 2019 long-term incentives awarded to the NEOs.
Target as a % of base salary | ||||
Keith Creel | | 500% | | |
Nadeem Velani | | 275% | | |
John Brooks | | 225% | | |
Laird Pitz | | 200% | | |
Mark Redd | | 225% | | |
Robert Johnson | | 225% | | |
Effective January 1, 2019, Mr. Creel’s long-term incentive target was increased to 600% of his base salary; however, consistent with Mr. Creel’s 2016 employment agreement, his 600% LTI target has been reduced by 100% until the end of 2021 to fund an upfront performance grant that he received in 2017. Therefore, his target was 500% of his base salary in 2019.
22
2019 long-term | ||||||||||||||||||||||||||||
| incentive | Allocation | |||||||||||||||||||||||||||
| award | Performance share units | Stock options | ||||||||||||||||||||||||||
| (grant value) ($) | ($) | (#) | ($) | (#) | ||||||||||||||||||||||||
Keith Creel | | 9,512,269 | | | 5,870,208 | | | 21,901 | | | 3,642,061 | | | 54,202 | | |||||||||||||
Nadeem Velani | | 2,531,053 | | | 1,552,110 | | | 5,788 | | | 978,943 | | | 16,313 | | |||||||||||||
John Brooks | | 1,893,801 | | | 1,196,771 | | | 4,465 | | | 697,030 | | | 10,453 | | |||||||||||||
Laird Pitz | | 1,313,416 | | | 810,534 | | | 3,024 | | | 502,882 | | | 7,484 | | |||||||||||||
Mark Redd | | 959,877 | | 604,824 | 2,167 | | 355,053 | | | 5,293 | | |||||||||||||||||
Robert Johnson | | 1,643,916 | | | 1,014,508 | | | 3,785 | | | 629,408 | | | 9,367 | | |||||||||||||
Notes:
| • | See the summary compensation table on page 43 for details about how we calculated the grant date fair values of the PSUs and stock options. Both were calculated in accordance with FASB ASC Topic 718. |
| • | The grant value of the awards based on the NYSE trading price has been converted to Canadian dollars using a 2019 average exchange rate of $1.3269. |
| • | On February 14, 2019, additional stock options were granted to Mr. Brooks as a result of his promotion to Executive Vice-President. |
| • | On September 3, 2019, additional PSUs and stock options were granted to Mr. Redd as a result of his promotion to Executive Vice-President. |
Performance share units
PSU awards focus executives on achieving medium-term goals within a three-year performance period.
The Board sets performance measures, thresholds and targets at the beginning of the performance period.
The number of units that vest is based on our performance over the three-year period. We must achieve threshold performance on a measure, otherwise the payout factor for that measure is zero and a portion of the award is forfeited. If performance is exceptional on a measure, the Board may approve a payout of up to 200%.
PSUs earn additional units as dividend equivalents at the same rate as dividends paid on our shares.
The award is paid out in cash based on the number of units that are earned and the average closing share price for the 30 trading days prior to the end of the performance period on the TSX or NYSE, as applicable. The award may be paid out in shares purchased on the open market, on the CEO’s recommendation, using the
after-tax
value.2019 PSU awards
The performance period for the 2019 PSU awards is January 1, 2019 to December 31, 2021. In 2019, CP returned to measuring total shareholder return (TSR) performance based on the Class 1 Railways and the S&P TSX 60 Index from the S&P Road and Rail Index and the S&P TSX Capped Industrial Index. The Class 1 Railways align us more closely to our industry peers. Additionally, the S&P TSX 60 Index is a more common benchmark for the broader investment community and a more widely recognized index than the S&P TSX Capped Industrial Index.
Performance will be assessed against the measures in the table below. Awards will be prorated if results fall between threshold and exceptional.
2019 PSU performance measures | Why the measure is important | Threshold (50%) | Target (100%) | Exceptional (200%) | Weighting | |||||||||||||
PSU three-year average return on invested capital (ROIC) Net operating profit after tax divided by average invested capital | Focuses executives on the effective use of capital as we grow Ensures shareholders’ capital is employed in a value-accretive manner | 15.3% | 16% | 16.4% | 70% | |||||||||||||
Total shareholder return Measured over three years. The percentile ranking of CP’s TSX Compound Annual Growth Rate (CAGR) relative to the companies that make up the S&P/TSX 60 | Compares our TSR on the TSX to the broader S&P/TSX60 to reflect our progress relative to the Canadian market Aligns long-term incentive compensation with long-term shareholder interests | 25th percentile | | 50th percentile | | 75th percentile | | 15% | ||||||||||
Total shareholder return Measured over three years. The ordinal ranking of CP’s NYSE CAGR relative to the Class 1 Railroads | Compares our TSR on the NYSE to the publicly traded Class 1 Railroads to ensure we are competitive against our primary competitors. Aligns long-term incentive compensation with long-term shareholder interests | 4th | 3rd | 1st | 15% | |||||||||||||
23
At the end of the three-year performance period, the starting point for determining relative TSR will be the
10-day
average closing share price of our shares on the appropriate index prior to January 1, 2019 and the closing point will be the10-day
average closing share price of our shares on the appropriate index prior to January 1, 2022. TSR is adjusted over the period to reflect dividends paid. The payout multiplier is interpolated if our performance falls between 50% and 200%. If results are below the threshold level for any of the performance measures, units for that specific measure will be forfeited.The table below shows the details of the 2019 annual PSU award grant.
Grant value ($) | # of PSUs | Grant price | ||||||||||
Keith Creel | | 5,870,208 | | | 21,901 | | | US$202.00 (NYSE) | | |||
Nadeem Velani | | 1,552,110 | | | 5,788 | | | $268.16 (TSX) | | |||
John Brooks | | 1,196,771 | | | 4,465 | | | US$202.00 (NYSE) | | |||
Laird Pitz | | 810,534 | | | 3,024 | | | US$202.00 (NYSE) | | |||
Mark Redd | 432,874 171,950 | 1,615 552 | US$202.00 (NYSE) US$234.76 (NYSE) | |||||||||
Robert Johnson | | 1,014,508 | | | 3,785 | | | US$202.00 (NYSE) | | |||
Notes:
On September 3, 2019, additional PSUs were granted to Mr. Redd as a result of his promotion to Executive Vice-President.
The grant value of the PSU awards based on the NYSE trading price have been converted to Canadian dollars using a 2019 average exchange rate of $1.3269. We calculated the number of PSUs to be granted to each executive by dividing the grant value by the theoretical value of a PSU (using the Willis Towers Watson binomial lattice model methodology), applied to our
30-day
average closing share price on the TSX or the NYSE prior to the day of the grant.Stock options
Stock options focus executives on longer term performance. Options have a seven-year term and vest 25% each year beginning on the anniversary date of the grant. The grant price is the last closing price of our common shares on the TSX or the NYSE on the applicable the grant date. Options only have value for the holder if our current share price increases above the grant price.
2019 stock option awards
The table below shows the details of the 2019 annual stock option award grant.
Grant value ($) | # of options | Grant price | ||||||||||
Keith Creel | | 3,642,061 | | | 54,202 | | | US$205.31 (NYSE) | | |||
Nadeem Velani | | 978,943 | | | 16,313 | | | $271.50 (TSX) | | |||
John Brooks | 502,881 194,149 | 7,484 2,969 | US$205.31 (NYSE) US$202.00 (NYSE) | |||||||||
Laird Pitz | | 502,882 | | | 7,484 | | | US$205.31 (NYSE) | | |||
Mark Redd | 268,508 86,545 | 3,996 1,297 | US$205.31 (NYSE) US$234.76 (NYSE) | |||||||||
Robert Johnson | | 629,408 | | | 9,367 | | | US$205.31 (NYSE) | | |||
Notes:
| • | On February 14, 2019, additional stock options were granted to Mr. Brooks as a result of his promotion to Executive Vice-President. |
| • | On September 3, 2019, additional options were granted to Mr. Redd as a result of his promotion to Executive Vice-President. |
The grant value of the stock option awards based on the NYSE trading price have been converted to Canadian dollars using a 2019 average exchange rate of $1.3269.
We calculated the number of options to be granted to each executive by dividing the grant value by the theoretical value of an option (using the Willis Towers Watson binomial option pricing methodology), applied to our
30-day
average closing share price on the TSX or the NYSE prior to the day of the grant.24
About the stock option plan
The management stock option incentive plan (the stock option plan) was introduced in October 2001.
Stock options awarded on or after January 1, 2017 have a seven-year term. If the expiry date falls within a blackout period, the expiry date will be extended to 10 business days after the end of the blackout period date. If a further blackout period is imposed before the end of the extension, the term will be extended another 10 days after the end of the additional blackout period.
Regular stock options granted before 2017 expire 10 years from the date of grant and generally vest 25% each year over four years, beginning on the anniversary of the grant date.
The table below sets out the limits for issuing options under the plan:
As a % of the number of shares outstanding | ||
Maximum number of shares that may be reserved for issuance to insiders as options | 10% | |
Maximum number of options that may be granted to insiders in a one-year period | 10% | |
Maximum number of options that may be granted to any insider in a one-year period | 5% | |
As a % of the number of shares outstanding at the time the shares were reserved | ||
Maximum number of options that may be granted to any person | 5% |
We measure
dilution
by determining the number of options available for issuance and the number of options outstanding as a percentage of outstanding shares. Our potential dilution at the end of 2019 was 1.8%. Notwithstanding the limits noted above, the dilution level, measured by the number of options available for issuance as a percentage of outstanding shares continues to be capped, at the discretion of the Board, at 7%.The option grant price is the last closing market price of shares on the grant date on the TSX or the NYSE (for grants after December 15, 2014 depending on the currency of the grant).
The table below shows the
burn rate
for the last three fiscal years, calculated by dividing the number of stock options granted in the fiscal year by the weighted average number of outstanding shares for the year.(as at December 31) | 2017 | 2018 | 2019 | |||||||||
Number of options granted | | 369,980 | | | 282,125 | | | 224,730 | | |||
Weighted number of shares outstanding | | 145,863,318 | | | 142,885,817 | | | 138,771,939 | | |||
Burn rate | | 0.25% | | | 0.20% | | | 0.16% | | |||
The table below shows the options outstanding and available for grant from the Stock Option Plan as at December 31, 2019.
Number of options/shares | Percentage of outstanding shares | |||||||
Options outstanding (as at December 31, 2019) | | 1,416,346 | | | 1.03 | % | ||
Options available to grant (as at December 31, 2019) | | 1,098,707 | | | 0.80 | % | ||
Shares issued on exercise of options in 2019 | | 260,267 | | | 0.19 | % | ||
Options granted in 2019 | | 224,730 | | | 0.16 | % | ||
Since the launch of the stock option plan in October 2001, a total of 18,078,642 shares have been available for issuance under the plan and 15,563,589 shares have been issued through the exercise of options.
We do not provide financial assistance to option holders to facilitate the purchase of shares under the stock option plan.
Additional information
There is a double trigger on options so that if there is a change of control and only if an option holder is terminated without cause, all of his or her stock options will vest immediately according to the change in control provisions in the stock option plan.
25
If an employee retires, the options continue to vest and expire on the original expiry date or five years from retirement, whichever is earlier.
If an employee is terminated without cause, the employee has six months to exercise any vested options. If the employee resigns, the employee has 30 days to exercise any vested options. If an employee is terminated with cause, all options are cancelled.
Options will continue to vest and expire on the scheduled expiry date if the holder’s employment ends due to permanent disability. If an option holder dies, the options will expire 12 months following his or her death and may be exercised by the holder’s estate.
Options can only be assigned to the holder’s family trust, holding corporation or retirement trust, or a legal representative of an option holder’s estate or a person who acquires the option holder’s rights by bequest or inheritance.
The CEO, the Chair of the Board and the Compensation Committee chair have authority to grant options to certain employees based on defined parameters, such as the position of the employee and the expected value of the option award. In 2019, the Compensation Committee authorized a pool of 50,000 options for allocation by the CEO, who granted 19,456 options to 13 employees to recognize performance and for retention.
Making changes to the stock option plan
The Board can make the following changes to the stock option plan without shareholder approval:
| • | changes to clarify information or to correct an error or omission |
| • | changes of an administrative or a housekeeping nature |
| • | changes to eligibility to participate in the stock option plan |
| • | terms, conditions and mechanics of granting stock option awards |
| • | changes to vesting, exercise, early expiry or cancellation |
| • | amendments that are designed to comply with the law or regulatory requirements |
The Board must receive shareholder approval to make other changes, including the following, among other things:
| • | an increase to the maximum number of shares that may be issued under the plan |
| • | a decrease in the exercise price |
| • | a grant of options in exchange for, or related to, options being cancelled or surrendered |
The Board has made two amendments to the stock option plan since it was introduced in 2001:
| • | on February 28, 2012, the stock option plan was amended so that a change of control would not trigger accelerated vesting of options held by a participant, unless the person is terminated without cause or constructively dismissed; and |
| • | on November 19, 2015, the stock option plan was amended to provide net stock settlement as a method of exercise, which allows an option holder to exercise options without the need for us to sell the securities on the open market, resulting in less dilution. |
26
Payout of 2017 PSU award
On December 31, 2019, the 2017 PSU grant for the period of January 1, 2017 to December 31, 2019 vested and was paid out on February 7, 2020. The NEOs received a payout of 193% on the award, which includes dividends earned up to the payment date. The table below shows the difference between the actual payout value and the grant value for each NEO.

2017 grant value(2017 PSU award+Dividend equivalents)x2017 PSU performance factorxMarket share price=PSU value($)(# of units)(# of units)(0-200%)($)Keith Creel4,407,78822,294680193%US$245.0114,138,889Nadeem Velani782,3953,903119193%$323.562,517,052John Brooks428,4422,16766193%US$245.011,374,360Laird Pitz394,2371,99461193%US$245.011,264,578Mark Redd367,3491,85857193%US$245.011,178,305Robert Johnson958,7054,849148193%US$245.013,075,226
Closing market share price is calculated on days when both the TSX and NYSE markets are open. For Mr. Velani, the market share price was calculated using $323.56, the average
30-day
closing price of our shares prior to December 31, 2019 on the TSX. For Mr. Creel, Mr. Brooks, Mr. Pitz, Mr. Redd and Mr. Johnson, the market share price was US$245.01, the average30-day
closing price of our shares prior to December 31, 2019 on the NYSE, and the value of these shares were converted to Canadian dollars using theyear-end
exchange rate of $1.2988. For comparability, for Mr. Creel, Mr. Brooks, Mr. Pitz, Mr. Redd and Mr. Johnson, the 2017 grant value was converted using an exchange rate of $1.2986.How we calculated the 2017 PSU performance factor
The PSU performance factor for the three-year period from January 1, 2017 to December 31, 2019 is 193%, as shown in the table below. The payout value has been calculated in accordance with the terms of the PSU plan and the 2017 award agreement.
PSU measures | Threshold (50%) | Target (100%) | Maximum (200%) | PSU result | Weighting | PSU performance factor | ||||||||||||||||||
3 Year Average Adjusted Return on Invested Capital (1) | 14.5% | 15% | 15.5% | 15.9% | 60% | 200% | ||||||||||||||||||
TSR to S&P/TSX Capped Industrial Index | | 25th percentile | | | 50th percentile | | | 75th percentile | | | 80th percentile | | | 20% | | | 200% | | ||||||
TSR to S&P 1500 Road and Rail Index | | 25th percentile | | | 50th percentile | | | 75th percentile | | | 66.7th percentile | | | 20% | | | 167% | | ||||||
PSU performance factor | | 193% | | |||||||||||||||||||||
| (1) | Adjusted Return on Invested Capital is a non-GAAP measure. Non-GAAP measures are defined and reconciled on pages 54-62 of CP’s Annual Report on Form 10-K for the year ended December 31, 2019. |
27
 | Mr. Creel was appointed as President and Chief Executive Officer (CEO) on January 31, 2017, a planned transition that had been in place since he was recruited to CP in February 2013 as President and Chief Operating Officer (COO). Prior to joining CP, Mr. Creel had a very successful operating career that began in 1992 at Burlington Northern as a management trainee in operations and eventually led to his becoming the EVP and COO at CN in 2010. Mr. Creel obtained a Bachelor of Science in marketing from Jacksonville State University and has completed the Advanced Management Program at the Harvard Business School. He served as a commissioned officer in the U.S. Army during which time he served in the Persian Gulf War. The end of 2019 marked Mr. Creel’s third year as our President and CEO. This past year, Mr. Creel was focused on developing people, driving safety improvements and pursuing continued sustainable, profitable growth. Mr. Creel was recognized by Institutional Investor as a member of the 2020All-Canada Executive Team and was ranked as the top CEO in the Capital Goods/Industrials sector. |
2019 individual performance
CP’s purpose is to deliver transportation solutions that connect North America and the world. By doing this safely and efficiently, we create long-term, sustainable value for our shareholders and the broader economy.
We remain grounded in the foundations of precision scheduled railroading. We operate safely, optimize assets, control costs, provide service and develop people. From our multi-year strategic and business plans to our daily operations and sales and marketing playbooks, everything we do is driven by, and tested against, our purpose, our values and the foundations of precision scheduled railroading.
In 2019, Mr. Creel focused on the following key areas:
Developing people
In 2019, Mr. Creel championed the roll out of CP’s three core values of accountability, diversity and pride and appointed a Chief Culture Officer to help sustain and improve its industry-best culture. He also spent considerable time across the CP network engagingwith CP employees, including joining his senior operating team for three CEO town halls.
face-to-face
This past year, he led the development and launch of an employee perspective survey to gather actionable data regarding management employee satisfaction and engagement and oversaw the seamless transition of CP’s operating team due to the retirements of Robert Johnson (Executive Vice-President Operations) and Tony Marquis (Senior Vice-President Operations East).
Developing leaders internally is essential to CP’s continued success. That commitment is evidenced by Mr. Creel’s continued leadership on CP’s Coaching Capability Program, designed for high-potential managers to expand their leadership skills and create a deep bench of talent at CP. The company also continued its executive coaching program for existing and future leaders to receivecoaching and a customized development program from a certified executive coach.
one-on-one
Mr. Creel also led CP’s first executive leadership forum. The forum focused on furthering the development of thought leadership and employee performance potential.
Under Mr. Creel’s leadership, 2019 also saw CP release its first ever diversity and inclusion report, numerous panel discussions involving senior leadership focused on the advancement of women at CP, and CP being named the fourth overall Military Friendly
®
employer in the United States.Driving safety improvements
For the 14
th
year in a row, CP had the lowestFRA-reportable
train accident frequency of any North American Class 1 railway. That said, safety is not about a destination, but a constant journey.Mr. Creel led the initiative to increase the weighting on CP’s safety measure within our STIP, reinforcing CP’s commitment to safety. Under his leadership, CP continues to highlight the Home Safe program, which empowers all employees to begin a safety conversation, regardless of seniority or position, in the workplace and at home. This program, along with a personal commitment from each of CP’s employees, has led to a 20% reduction in personal injury rate since its inception.
This past year, CP also hosted its first Safety Awards for Excellence gala, celebrating outstanding employee safety leadership.
28
Driving sustainable, profitable growth
Under Mr. Creel’s leadership, CP was able to achieve its highest-ever revenues and lowest-ever yearly operating ratio in 2019. This is a result of the company’s disciplined approach to sustainable, profitable growth - a plan rooted in the foundations of precision scheduled railroading.
Despite challenging macroeconomic conditions, revenues increased 7 percent to a record $7.79 billion. Diluted earnings per share (EPS) increased 30 percent to a record $17.69 from $13.61 and adjusted diluted EPS
(1)
rose 13 percent to a record $16.44 from $14.51.As a result of Mr. Creel’s efforts and leadership, CP led the industry in volume growth and revenue growth for a second consecutive year.
In 2019, CP realized gains in intermodal, automotive, forest products, and energy, chemicals and plastics. Across all lines of business, there were key contract wins throughout the year that set CP up well for 2020 and beyond.
Mr. Creel spearheaded CP’s efforts to extend its reach through various initiatives in 2019 including the acquisition of the Central Maine & Quebec Railway and the opening of new compounds and transload terminals across the CP network.
Additionally, this past year Mr. Creel held several meetings with a broad range of external stakeholders, including investors, Indigenous Peoples, industry associations, government, regulators, customers and policy makers. He also met regularly with current and prospective shareholders at industry conferences, at CP’s headquarters, and at shareholder offices across Canada, the United States and Europe.
With Mr. Creel at the helm, the company remains focused on safely harnessing our network capacity to provide unique solutions that leverage our network strengths and superior service.
The assessment was reviewed by the Compensation Committee and reviewed and approved by the Board.
2019 compensation
The table below shows the compensation awarded to Mr. Creel for 2019.
 | Compensation (in CAD $‘000) | 2019 | ||||
Fixed | ||||||
Base earnings | | 1,538 | | |||
Variable | ||||||
Short-term incentive | | 2,979 | | |||
Long-term incentive | ||||||
- PSUs | | 5,870 | | |||
- Stock options | | 3,642 | | |||
Total direct compensation | | 14,029 | | |||
Total target direct compensation | | 11,147 | | |||
Notes: Salary is the actual amount received in the year. Payments made in U.S. dollars have been converted to Canadian dollars using an average exchange rate for the year of $1.3269. | ||||||
Salary
Mr. Creel’s salary was increased to US$1,158,750 in 2019.
29
2019 Short-term incentive
Based on our 2019 corporate performance and the board’s assessment of his individual performance, Mr. Creel received a cash bonus of $2,978,994 for 2019, calculated as follows:

Year EndSalary ($)XTargetshort-termincentiveX[Corporateperformancefactor ($)+Individualperformancefactor ($)]=2019short-termincentive ($)(as a % ofbase salary)155%x 75%155%x 25%(0-200%)(0-200%)1,537,545125%2,234,245744,7492,978,994
His
year-end
salary and the 2019 STIP award were paid in U.S. dollars and have been converted to Canadian dollars using an average exchange rate of $1.3269 for 2019.2019 Long-term incentive
Mr. Creel received annual 2019 long-term incentive awards with a total grant value of $9,512,269, 100% of his target award. The grant was allocated as 60% PSUs and 40% stock options.
Realized and realizable pay
The value of Mr. Creel’s incentive compensation is based on our performance over the period and, for the long-term incentive, our share price when the awards vest.
The graph below shows the three-year average of Mr. Creel’s granted and realized and realizable pay from 2017 to 2019.
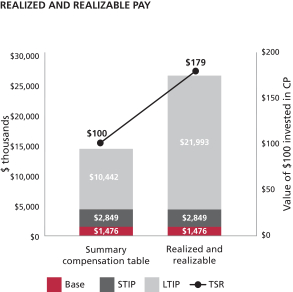
Notes:
Summary compensation table:
average of salary earned, actual cash bonus received, and long-term incentives granted (using the grant date fair value from 2017 to 2019 as disclosed in the summary compensation table on page 43). The compensation figures have been converted to Canadian dollars using the following average exchange rates: $1.3269 for 2019, $1.2957 for 2018 and $1.2986 for 2017.Realized and realizable pay:
average of salary earned, actual cash bonus received, the value of long-term incentive awards that have vested or been exercised, and the estimated current value of unvested long-term incentive awards granted from 2017 to 2019.| • | the value of vested 2017 PSUs paid in February 2020 was calculated using the 30-day average trading price of our shares prior to December 31, 2019 of US$245.01 on the NYSE with a performance multiplier of 1.93 and includes dividends earned up to the payment date. |
30
| • | the value of unvested 2018 and 2019 PSUs are based on the closing price of our shares on December 31, 2019 of US$254.95 on the NYSE with a performance multiplier of 1.0. PSUs include reinvestment of additional units received as dividend equivalents |
| • | the value of unvested/unexercised stock options is based on the closing price of our shares on December 31, 2019 of US$254.95 on the NYSE |
| • | the compensation figures for salary earned and actual bonus received have been converted to Canadian dollars using the following average exchange rates: $1.3269 for 2019, $1.2957 for 2018 and $1.2986 for 2017. |
| • | the value of any realized and realizable PSUs and Stock Options have been converted into Canadian dollars using the 2019 year-end exchange rate of $1.2988 |
| • | The up-front performance stock options grant received in 2017 is included in realizable pay |
We also compare the realized and realizable value of $100 awarded in total direct compensation to Mr. Creel in each year to the value of $100 invested in our shares on the first trading day of the period, assuming reinvestment of dividends to show a meaningful comparison of shareholder value.
Pay linked to shareholder value
The table below shows Mr. Creel’s total direct compensation in Canadian dollars in each of the last three years, compared to its realized and realizable value as at December 31, 2019. We also compare the realized and realizable value of $100 awarded in total direct compensation to Mr. Creel in each year to the value of $100 invested in CP shares on the first trading day of the period, assuming reinvestment of dividends, to show a meaningful comparison of shareholder value.
| (in CAD $‘000) | Value of $100 | |||||||||||||||||||
Compensation awarded ($) | Realized and realizable value of compensation as at December 31, 2019 ($) | Period | Keith Creel ($) | Shareholder ($) | ||||||||||||||||
2017 | 18,780,304 | 48,994,522 | Jan 1, 2017 to Dec 31, 2019 | 260.88 | 178.55 | |||||||||||||||
2018 | 11,491,066 | 14,640,604 | Jan 1, 2018 to Dec 31, 2019 | 127.41 | 147.41 | |||||||||||||||
2019 | 14,029,129 | 15,318,711 | Jan 1, 2019 to Dec 31, 2019 | 109.19 | 138.38 | |||||||||||||||
Mr. Creel’s compensation awarded is as disclosed in the summary compensation table. Mr. Creel’s realized and realizable value for salary earned and actual bonus received have been converted to Canadian dollars using the following average exchange rates: $1.2986 for 2017, $1.2957 for 2018 and for $1.3269 for 2019. The value of any realized and realizable long-term incentive is converted into Canadian dollars using the 2019
year-end
exchange rate of $1.2988.Equity ownership
(at February 28, 2020)Requirement (as a multiple of salary) | Minimum ownership value ($) | Shares ($) | Deferred share units ($) | Total ownership value ($) | Total ownership (as a multiple of salary) | |||||||||
6x | 9,616,608 | 1,166,073 | 10,666,164 | 11,832,237 | 7.38x | |||||||||
Mr. Creel has met his share ownership requirements. Values are based on US$248.77, the closing price of our shares on the NYSE on February 28, 2020 and have been converted using an exchange rate of $1.3429.
2020 Compensation
The Compensation Committee, in collaboration with Kingsdale, reviewed Mr. Creel’s compensation relative to our Class 1 Railroad peers. Through this benchmarking, it was determined that Mr. Creel’s long-term incentive target was considerably below the median. Effective January 1, 2020, Mr. Creel received a 3% increase in base salary, and his long-term incentive target became 660% of his base salary. Consistent with Mr. Creel’s 2016 employment agreement, his 660% long-term incentive target has been reduced by 100% (to a total of 560% each year) until the end of 2021 to fund an upfront performance grant that he received in 2017.
| (1) | Adjusted diluted EPS is a non-GAAP measure.Non-GAAP measures are defined and reconciled on pages 54-62 of CP’s Annual Report on Form10-K for the year ended December 31, 2019. |
31
 | Mr. Velani was appointed Vice-President and Chief Financial Officer (CFO) on October 18, 2016 and was appointed Executive Vice-President and Chief Financial Officer on October 17, 2017. Mr. Velani is a key member of the senior management team responsible for the long-term strategic direction of the Company. Other responsibilities include financial planning, reporting and accounting systems, as well as pension, treasury, investor relations and tax functions. Mr. Velani joined CP in March 2013 and most recently served as Vice-President Investor Relations. Prior to CP, Mr. Velani spent approximately 15 years at CN where he worked in a variety of positions in financial planning, sales and marketing, investor relations and the Office of the President and CEO. |
2019 individual performance
The CEO assessed Mr. Velani’s performance against his individual performance objectives. In 2019, Mr. Velani: executed the company’s strategic multi-year plan to drive sustainable profitable growth; championed company-wide leadership development including as Chair of CP’s Leadership Development Steering Committee; improved the forecasting and budgeting process to help align resources in a volatile macro-economic environment, and continued to implement CP’s pension asset management strategy. Mr. Velani also delivered on CP’s financial principles, including a capital allocation strategy to support robust, long-term shareholder returns.
Mr. Velani was recognized by
Institutional Investor
as a member of the inaugural 2020All-Canada
Executive Team. He was ranked as the top CFO in the Capital Goods/Industrials sector as voted on bybuy-side
analysts, money managers and sell-side researchers. Mr. Velani was assessed as exceeding his individual performance objectives for the year.The assessment was reviewed by the Compensation Committee and reviewed and approved by the Board.
2019 compensation
The table below is a summary of the compensation awarded to Mr. Velani for 2019.
 | Compensation (in CAD $‘000) | 2019 | ||||
Fixed | ||||||
Base earnings | | 751 | | |||
Variable | ||||||
Short-term incentive | | 1,096 | | |||
Long-term incentive | ||||||
- PSUs | | 1,552 | | |||
- Stock options | | 979 | | |||
Total direct compensation | | 4,378 | | |||
Total target direct compensation | | 3,538 | | |||
Salary
Mr. Velani’s salary was increased to US $566,500 in 2019. His salary was paid in Canadian dollars based on a foreign exchange rate of $1.3432.
2019 short-term incentive
Based on our 2019 corporate performance and the CEO’s assessment of his individual performance, Mr. Velani received a cash bonus of $1,095,729 for 2019, calculated as follows:

Year EndSalary ($)XTargetshort-termincentiveX[Corporateperformancefactor ($)+Individualperformancefactor ($)]=2019short-termincentive ($)(as a % ofbase salary)155%x 75%175%x 25%(0-200%)(0-200%)760,92390%796,116299,6131,095,729
32
2019 long-term incentive
Mr. Velani received annual 2019 long-term incentive awards with a total grant value of $2,531,053, 100% of his target award. The grant was allocated as 60% PSUs and 40% stock options.
Equity ownership
(at February 28, 2020)Requirement (as a multiple of salary) | Minimum ownership value ($) | Shares ($) | Deferred share units ($) | Total ownership value ($) | Total ownership (as a multiple of salary) | |||||||||||||||
3x | 2,363,511 | 204,541 | 2,373,218 | 2,577,759 | 3.27x | |||||||||||||||
Mr. Velani has met his share ownership requirements. Values are based on $332.67, the closing price of our common shares on the TSX on February 28, 2020.
2020 Compensation
A comprehensive market review was conducted to assess Mr. Velani’s compensation relative to our peer group median. It was determined that Mr. Velani’s total direct compensation was below the market median. Therefore, effective January 1, 2020, his long-term incentive target was increased to 300% of base salary from 275%. He also received a 6% increase in base salary effective February 1, 2020.
33
JOHN K. BROOKS
EXECUTIVE VICE-PRESIDENT AND CHIEF MARKETING OFFICER | Mr. Brooks was appointed Executive Vice-President and Chief Marketing Officer (CMO) on February 14, 2019. During the financial year ended December 31, 2018, Mr. Brooks was CP’s Senior Vice-President and Chief Marketing Officer. During Mr. Brooks’ sales and marketing career he has held senior responsibilities in all lines of business, including coal, chemicals, merchandise products, grain and intermodal. He began his railroading career with Union Pacific and later helped start I&M Rail Link, LLC, which was purchased by the Dakota, Minnesota and Eastern Railroad (DM&E) in 2002. Mr Brooks was Vice-President of Marketing at the DM&E prior to it being acquired by CP in 2007. In the role of CMO, Mr. Brooks is responsible for CP’s business units and leading a group of highly capable sales and marketing professionals across North America. In addition, Mr. Brooks is responsible for strengthening partnerships with existing customers, generating new opportunities for growth, enhancing the value of the company’s service offerings and developing strategies to optimize CP’s book of business. |
2019 individual performance
The CEO assessed Mr. Brooks’ performance in 2019 against his individual performance objectives, which included the ongoing development and organization of the sales and marketing team, revenue growth, improving the quality of revenue, customer relationships and network development by expanding our reach through new market offerings, transloads and short lines and enhancing our product offering. Throughout 2019, Mr. Brooks was also focused on proactive customer engagement which included: measuring customer experience, hosting a customer advisory council, hosting meetings of short line railroads and transload operators, recognizing customers through initiatives such as our safe shipper awards and the new grain elevator of the year award. In addition, Mr. Brooks leads his team in the development, measurement and presentation of CP’s annual and multi-year business plan. Mr. Brooks was assessed as having exceeded his overall individual performance objectives.
The assessment was reviewed by the Compensation Committee and reviewed and approved by the Board.
2019 compensation
The table below is summary of the compensation awarded to Mr. Brooks for 2019.
 | Compensation (in CAD $‘000) | 2019 | ||||
Fixed | ||||||
Base earnings | | 670 | | |||
Variable | ||||||
Short-term incentive | | 829 | | |||
Long-term incentive | ||||||
- PSUs | | 1,197 | | |||
- Stock options | | 697 | | |||
Total direct compensation | | 3,393 | | |||
Total target direct compensation | | 2,782 | | |||
Notes: Salary is the actual amount received that year. Payments made in U.S. dollars have been converted to Canadian dollars using an average exchange rate for the year of $1.3269. | ||||||
Salary
Effective February 14, 2019, Mr. Brooks was promoted to Executive Vice-President and Chief Marketing Officer. His salary was increased to US$525,000.
34
2019 short-term incentive
Mr. Brooks’ annual bonus target was prorated to 74.4% of his base salary in 2019 to reflect his time at the new target associated with his promotion. Based on our 2019 corporate performance and the CEO’s assessment of his individual performance, Mr. Brooks received a cash bonus of $829,259 for 2019, calculated as follows:

Year EndSalary ($)XTargetshort-termincentiveX[Corporateperformancefactor ($)+Individualperformancefactor ($)]=2019short-termincentive ($)(as a % ofbase salary)155%x 75%175%x 25%(0-200%)(0-200%)696,62374.40%602,509226,750829,259
His
year-end
salary and the 2019 STIP award were paid in U.S. dollars and have been converted to Canadian dollars using an average exchange rate of $1.3269 for 2019.2019 long-term incentive
Mr. Brooks’ long-term incentive target was increased to 225% of his annual salary. He received 2019 long-term incentive awards with a total grant value of $1,893,801 which included a top up stock option grant received in February 2019 with a grant value of $194,149 to bring him to the Executive Vice-President level. The grants were allocated as 60% PSUs and 40% stock options.
Equity ownership
(at February 28, 2020)Requirement (as a multiple of salary) | Minimum ownership value ($) | Shares ($) | Deferred share units ($) | Total ownership value ($) | Total ownership (as a multiple of salary) | |||||||||||||||
3x | 2,220,821 | 692,832 | 615,076 | 1,307,908 | 1.77x | |||||||||||||||
Mr. Brooks is on track to meet his share ownership requirements by February 2024. Values are based on US$248.77, the closing price of our shares on the NYSE on February 28, 2020 and have been converted using an exchange rate of $1.3429.
2020 Compensation
Mr. Brooks was promoted to Executive Vice-President and Chief Marketing Officer on February 14, 2019. Commensurate with his promotion and supplemented by a competitive market review, effective January 1, 2020, his short-term incentive target was increased to 90% of his base salary from 75% and his long-term incentive target was increased to 275% of base salary from 225%. He also received a 5% increase in base salary effective February 1, 2020.
35
LAIRD J. PITZ
SENIOR VICE-PRESIDENT AND CHIEF RISK OFFICER | Mr. Pitz was promoted to Senior Vice-President and Chief Risk Officer in October of 2017. This was part of the overall realignment of the risk and insurance functions for succession purposes, and to retain Mr. Pitz for the necessary development of the succession candidates. He is responsible for all aspects of risk-management in Canada and the U.S., including police services, casualty and general claims, environmental risk, field safety and systems, operational regulatory affairs and training, disability management and forensic audit investigations. Mr. Pitz joined CP on April 2, 2014, as Vice-President of Security and Risk Management. Mr. Pitz, a Vietnam War veteran and former FBI special agent, is a 40-year career professional who has directed strategic and operational risk-mitigation, security and crisis-management functions for companies operating in a wide range of fields including defense, logistics and transportation. |
2019 individual performance
The CEO assessed Mr. Pitz’s performance in 2019 against his individual performance objectives, which focused on the development of succession candidates in risk mitigation and safety and sustainability; and managing risk and reducing liability in several key areas: safety, environmental, insurance, police, security, casualty management, damage prevention, regulatory, operating practices, forensic and disability management. Under Mr. Pitz’s leadership, CP has made significant progress in mitigating its overall risk and liability, while supporting sustainable growth including the following results in 2019: $88 million cost control of monetary exposure; evaluating our most significant environmental, social and governance topics impacting the company; securing an independent insurance portfolio to protect the company against uncertain insurable losses; executing a resilient emergency response and crisis preparedness practice; and improving CP’s safety culture through Home Safe initiatives and technical training programs resulting in a 4% reduction in FRA Personal Injury frequency to 1.42 (lowest in CP’s history) and industry leading FRA Train Accident frequency of 1.06. Mr. Pitz was assessed as having exceeded his overall individual performance objectives.
The assessment was reviewed by the Compensation Committee and reviewed and approved by the Board.
2019 compensation
The table below is a summary of the compensation awarded to Mr. Pitz for 2019.
 | Compensation (in CAD $‘000) | 2019 | ||||
Fixed | ||||||
Base earnings | | 529 | | |||
Variable | ||||||
Short-term incentive | | 571 | | |||
Long-term incentive | ||||||
- PSUs | | 811 | | |||
- Stock options | | 503 | | |||
Total direct compensation | | 2,414 | | |||
Total target direct compensation | | 1,964 | | |||
Notes: Salary is the actual amount received that year. Payments made in U.S. dollars have been converted to Canadian dollars using an average exchange rate for the year of $1.3269. | ||||||
Salary
Mr. Pitz’s salary was increased to US$400,000 in 2019.
36
2019 short-term incentive
Based on our 2019 corporate performance and the CEO’s assessment of his individual performance, Mr. Pitz received a cash bonus of $571,230 for 2019, calculated as follows:
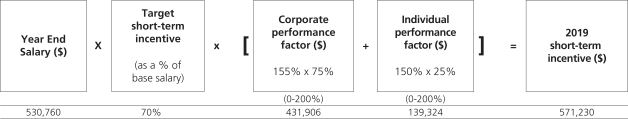
Year EndSalary ($)XTargetshort-termincentiveX[Corporateperformancefactor ($)+Individualperformancefactor ($)]=2019short-termincentive ($)(as a % ofbase salary)155%x 75%150%x 25%(0-200%)(0-200%)530,76070%431,906139,324571,230
His
year-end
salary and 2019 STIP award were made in U.S. dollars and have been converted to Canadian dollars using an average exchange rate of $1.3269 for 2019.2019
long-term
incentiveMr. Pitz also received 2019 annual long-term incentive awards with a total grant value of $1,313,416, 100% of his target award. The grant was allocated 60% PSUs and 40% stock options.
Equity ownership
(at February 28, 2020)Requirement (as a multiple of salary) | Minimum ownership value ($) | Shares ($) | Deferred share units ($) | Total ownership value ($) | Total ownership (as a multiple of salary) | |||||||||||||||
2x | 1,106,550 | 25,724 | 1,485,075 | 1,510,799 | 2.73x | |||||||||||||||
Mr. Pitz has met his share ownership requirements. Values are based on US$248.77, the closing price of our shares on the NYSE on February 28, 2020 and have been converted using an exchange rate of $1.3429.
37
MARK A. REDD
EXECUTIVE VICE-PRESIDENT OPERATIONS | Mr. Redd was appointed Executive Vice-President Operations effective September 1, 2019. Mr. Redd oversees the 24/7 operations of CP’s network including those teams responsible for network transportation, operations, mechanical, engineering, procurement and labour relations. Mr. Redd brings to his role considerable leadership experience in rail operations and safety excellence. Mr. Redd joined CP in October 2013. In April 2016, he was appointed Vice-President Operations Western Region, and was promoted to Senior Vice-President Operations Western Region in February 2017. Prior to these roles, he was General Manager Operations U.S. West and General Manager Operations Central Division. He was named CP’s 2016 Railroader of the Year. Mr. Redd began his railroading career at Midsouth Rail in Jackson, Mississippi, as a brakeman and conductor, before moving to Kansas City Southern (KCS) as an engineer. Throughout his over 20 years at KCS, Mr. Redd held a variety of leadership positions in network and field operations, including Vice-President Transportation where he oversaw key operating functions in the U.S. and Mexico. During this time, he also served as the Chairman of the operating board for the Port Terminal Railroad Association in Houston, Texas. |
2019 individual performance
The CEO assessed Mr. Redd’s performance in 2019 against his individual performance objectives. Mr. Redd focused on transitioning his leadership team which included delivering world class service to our customers by executing CP’s precision scheduled railroading model, leading CP’s safety efforts, and continuing to develop his team in the area of technical and leadership skills at all levels. Aligning his team through collaboration while maintaining healthy constructive tension within the teams has allowed the operations department to excel in supporting CP’s five foundations. Mr. Redd promoted and advanced CP’s Home Safe efforts which resulted in the lowest personal injury rates and frequency in the history of CP. Decreased cycle times for bulk trains yielded record results in several commodity groups for carload and tonnage moved. Mr. Redd’s persistent focus on precision scheduled railroading has improved operating efficiencies, proven by CP’s industry-leading third quarter results and positioning the company well in the fourth quarter and into 2020. Mr. Redd was assessed as having exceeded his overall individual performance objectives.
The assessment was reviewed by the Compensation Committee and reviewed and approved by the Board.
2019 compensation
The table below is a summary of the compensation awarded to Mr. Redd for 2019.
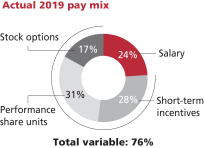 | Compensation (in CAD $‘000) | 2019 | ||||
Fixed | ||||||
Base earnings | | 491 | | |||
Variable | ||||||
Short-term incentive | | 593 | | |||
Long-term incentive | ||||||
- PSUs | | 605 | | |||
- Stock options | | 355 | | |||
Total direct compensation | | 2,044 | | |||
Total target direct compensation | | 2,218 | | |||
Notes: Salary is the actual amount received that year. Payments made in U.S. dollars have been converted to Canadian dollars using an average exchange rate for the year of $1.3269. | ||||||
Salary
Effective September 1, 2019, Mr. Redd was promoted to Executive Vice-President Operations. His salary was increased to US$425,000 effective the same date.
38
2019 short-term incentive
Mr. Redd’s annual bonus target was prorated to 68.34% of his base salary in 2019 to reflect his time at the new target associated with his promotion. Based on our 2019 corporate performance and the CEO’s assessment of his individual performance, Mr. Redd received a cash bonus of $592,539 for 2019, calculated as follows:

Year EndSalary ($)XTargetshort-termincentiveX[Corporateperformancefactor ($)+Individualperformancefactor ($)]=2019short-termincentive ($)(as a % ofbase salary)155%x 75%150%x 25%(0-200%)(0-200%)563,93368.34%448,018144,521592,539
His
year-end
salary and 2019 STIP award were made in U.S. dollars and have been converted to Canadian dollars using an average exchange rate of $1.3269 for 2019.2019
long-term
incentiveMr. Redd’s long-term incentive target was increased to 225% of his annual salary. He received 2019 annual long-term incentive awards with a total grant value of $959,877. This included a top up PSU and stock option grants received in September 2019 with a grant value of $258,495 to bring him to the Executive Vice-President level. The grant was allocated as 60% PSUs and 40% stock options.
Equity ownership
(at February 28, 2020)Requirement (as a multiple of salary) | Minimum ownership value ($) | Shares ($) | Deferred share units ($) | Total ownership value ($) | Total ownership (as a multiple of salary) | |||||||||||||||
3x | 1,797,807 | 291,791 | 721,813 | 1,013,604 | 1.69x | |||||||||||||||
Mr. Redd is on track to meet his share ownership requirements by September 2024. Values are based on US$248.77, the closing price of our shares on the NYSE on February 28, 2020 and have been converted using an exchange rate of $1.3429.
2020 Compensation
Mr. Redd was promoted to Executive Vice-President Operations on September 1, 2019. In continuing his progression towards the market median, effective January 1, 2020, his short-term incentive target will be increased to 80% of his base salary from 75% and his long-term incentive target will be increased to 250% of base salary from 225%. He also received a 5% increase in base salary effective February 1, 2020.
39
ROBERT A. JOHNSON
RETIRED EXECUTIVE VICE-PRESIDENT OPERATIONS | On September 30, 2019, Mr. Johnson retired from CP after an impressive railroading career that spanned more than three decades. Mr. Johnson was appointed as Executive Vice-President Operations in April 2016. In this role, Mr. Johnson had overall operational responsibility for CP’s rail network, including aspects of operational safety, service, engineering and mechanical services in both Canada and the U.S. with a focus on train performance and overall fluidity of the network. Prior to this appointment, Robert was CP’s Senior Vice-President Operations, Southern Region. Mr. Johnson’s railroad career spans over 37 years. He spent 32 of those years with BNSF where he held successively more responsible roles in operations, transportation, engineering and service excellence. His most recent position at BNSF was General Manager, Northwest Division, overseeing day-to-day |
2019 individual performance
The CEO assessed Mr. Johnson’s performance for the first nine months of 2019 against his individual performance objectives in the areas of people development, safety and operational efficiency. During 2019, Mr. Johnson focused on people development and succession planning which included the development of a deep operating bench as well as identifying and advancing his own successor. He led double digit improvements in retention of train & engine management staff and conductors. Throughout 2019, Mr. Johnson continued to promote and advance CP’s Home Safe efforts which resulted in a two percent improvement in personal injury rates in the first nine months of the year. In addition, Mr. Johnson drove improvements in asset utilization across the network. His persistent focus on CP’s trip plan compliance resulted in record third quarter Trip Plan compliance. Mr. Johnson was assessed as having exceeded his overall individual performance objective.
The assessment was reviewed by the Compensation Committee and reviewed and approved by the Board.
2019 compensation
The table below is summary of the compensation awarded to Mr. Johnson for 2019.
 | Compensation (in CAD $‘000) | 2019 | ||||
Fixed | ||||||
Base earnings | | 478 | | |||
Variable | ||||||
Short-term incentive | | 524 | | |||
Long-term incentive | ||||||
- PSUs | | 1,015 | | |||
- Stock options | | 629 | | |||
Total direct compensation | | 2,646 | | |||
Total target direct compensation | | 2,433 | | |||
Notes: Salary is the actual amount received that year. Payments made in U.S. dollars have been converted to Canadian dollars using an average exchange rate for the year of $1.3269. | ||||||
Salary
Mr. Johnson’s salary was increased to US$458,350 in 2019. His salary was prorated for the portion of the year in which he was employed.
40
2019 short-term incentive
Mr. Johnson retired as Executive Vice-President Operations effective September 30, 2019. His 2019 cash bonus is reflective of the portion of the year which he was employed. Based on our 2019 corporate performance and the CEO’s assessment of his individual performance, Mr. Johnson received a cash bonus of $523,969 for 2019, calculated as follows:
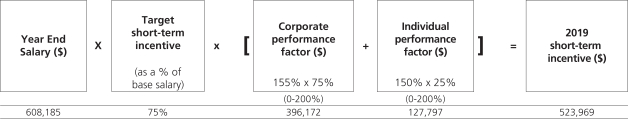
Year EndSalary ($)XTargetshort-termincentiveX[Corporateperformancefactor ($)+Individualperformancefactor ($)]=2019short-termincentive ($)(as a % ofbase salary)155%x 75%150%x 25%(0-200%)(0-200%)608,18575%396,172127,797523,969
His
year-end
salary and the 2019 STIP award were made in U.S. dollars and have been converted to Canadian dollars using an average exchange rate of $1.3269 for 2019.2019 long-term incentive
Mr. Johnson received 2019 long-term incentive awards with a total grant value of $1,643,916, 100% of his target award. The grant was allocated as 60% PSUs and 40% stock options.
Equity ownership
At the time of his retirement, Mr. Johnson had met his share ownership requirements.
41
The graph below shows the total shareholder return of $100 invested in CP shares compared to the two major market indices over the last five years ending December 31, 2019 assuming reinvestment of dividends.
CP shares have outperformed the S&P/TSX Composite Index and the S&P 500 index over the last five years. The graph shows that significant shareholder value continues to be generated as the total direct compensation paid to our NEOs has declined and stabilized with our new team. Our share price on the TSX was $176.73 at the beginning of the performance period (US$127.60 on the NYSE) compared to $331.03 at the end of 2019 (US$254.95 on the NYSE), a growth in share appreciation of 87.3%. Our total shareholder return over the same five-year period was 94.9%, assuming reinvestment of dividends.
The total compensation value for NEOs as disclosed in the summary compensation table is 0.4% of our total revenues of $7.79 billion for 2019.
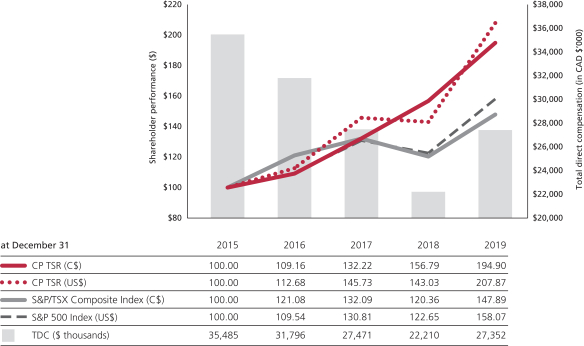
at December 3120152016201720182019CP TSR (C$)100.00109.16132.22156.79194.90CP TSR (US$)100.00112.68145.73143.03207.87S&P/TSX Composite Index (C$)100.00121.08132.09120.36147.89S&P 500 Index (US$)100.00109.54130.81122.65158.07TDC ($ thousands)35,48531,79627,47122,21027,352
Notes:
| • | Total direct compensation is the total compensation awarded to the NEOs, as reported in the summary compensation table in prior years. |
| • | In years where there weremore than five NEOs, we used the following to calculate total direct compensation in the table above: |
| • | 2019: Keith Creel, Nadeem Velani, John Brooks, Laird Pitz and Mark Redd |
| • | 2018: Keith Creel, Nadeem Velani, Robert Johnson, Laird Pitz and John Brooks |
| • | 2017: Keith Creel, Nadeem Velani, Robert Johnson, Laird Pitz and Jeffrey Ellis |
| • | 2016: Hunter Harrison, Nadeem Velani, Keith Creel, Robert Johnson and Laird Pitz |
| • | 2015: Hunter Harrison, Mark Erceg, Keith Creel, Laird Pitz and Mark Wallace |
| • | Mr. Harrison, Mr. Creel, Mr. Brooks, Mr. Pitz, Mr. Redd and Mr. Johnson, were paid in U.S. dollars and their amounts have been converted using the following average exchange rates: $1.3269 for 2019, $1.2957 for 2018, $1.2986 for 2017, $1.3248 for 2016 and $1.2787 for 2015 |
42
The table below shows compensation for our six NEOs for the three fiscal years ended December 31, 2019. Mark Redd succeeded Robert Johnson as Executive Vice-President Operations effective September 1, 2019.
All of the NEOs except Mr. Velani were paid in U.S. dollars. Their compensation has been converted to Canadian dollars using the average exchange rates for the year: $1.3269 for 2019, $1.2957 for 2018 and $1.2986 for 2017.
Non-equity Incentive plan compensation ($) | ||||||||||||||||||||||||||||||||||||
Name and principal position | Year | Salary ($) | Share-based awards ($) | Option-based awards ($) | Annual incentive plans | Long-term incentive plans | Pension values ($) | All other compensation ($) | Total compensation ($) | |||||||||||||||||||||||||||
Keith E. Creel | 2019 | 1,537,866 | 5,870,208 | 3,642,061 | 2,978,994 | - | 566,343 | 554,930 | 15,150,402 | |||||||||||||||||||||||||||
President and Chief | 2018 | 1,453,595 | 4,369,757 | 2,519,163 | 3,148,551 | - | 452,209 | 543,332 | 12,486,607 | |||||||||||||||||||||||||||
Executive Officer | | 2017 | | | 1,436,594 | | | 4,407,788 | | | 10,516,630 | | | 2,419,292 | | | - | | | 398,894 | | | 926,402 | | | 20,105,600 | | |||||||||
Nadeem S. Velani | 2019 | 751,099 | 1,623,980 | 978,943 | 1,095,729 | - | 214,043 | 59,250 | 4,723,044 | |||||||||||||||||||||||||||
Executive Vice-President | 2018 | 666,946 | 1,199,385 | 688,327 | 1,032,596 | - | 138,925 | 57,680 | 3,783,859 | |||||||||||||||||||||||||||
and Chief Financial Officer | | 2017 | | | 451,355 | | | 806,073 | | | 202,650 | | | 490,763 | | | - | | | 101,027 | | | 49,523 | | | 2,101,391 | | |||||||||
John K. Brooks | 2019 | 670,235 | 1,240,804 | 697,030 | 829,259 | - | 254,186 | 66,651 | 3,758,165 | |||||||||||||||||||||||||||
Executive Vice-President | 2018 | 499,384 | 424,798 | 244,922 | 602,177 | - | 166,898 | 61,456 | 1,999,635 | |||||||||||||||||||||||||||
and Chief Marketing Officer | | 2017 | | | 436,359 | | | 428,442 | | | 125,582 | | | 420,251 | | | - | | | 144,378 | | | 59,567 | | | 1,614,579 | | |||||||||
Laird J. Pitz | 2019 | 529,378 | 810,534 | 502,882 | 571,230 | - | 104,830 | 45,606 | 2,564,460 | |||||||||||||||||||||||||||
Senior Vice-President | 2018 | 482,486 | 444,139 | 256,132 | 560,593 | - | 87,126 | 42,346 | 1,872,822 | |||||||||||||||||||||||||||
and Chief Risk Officer | | 2017 | | | 457,901 | | | 394,237 | | | 228,694 | | | 435,601 | | | - | | | 82,361 | | | 41,137 | | | 1,639,931 | | |||||||||
Mark A. Redd | 2019 | 491,307 | 642,177 | 355,053 | 592,539 | - | 96,231 | 214,626 | 2,391,933 | |||||||||||||||||||||||||||
Executive Vice-President | 2018 | 440,209 | 832,824 | 562,059 | 510,812 | - | 78,942 | 283,124 | 2,707,970 | |||||||||||||||||||||||||||
Operations | | 2017 | | | 415,321 | | | 367,349 | | | 179,664 | | | 391,637 | | | - | | | 69,989 | | | 66,582 | | | 1,490,542 | | |||||||||
Robert A. Johnson | 2019 | 478,386 | 1,014,508 | 629,408 | 523,969 | - | 121,175 | 79,573 | 2,847,019 | |||||||||||||||||||||||||||
Retired Executive Vice- | 2018 | 572,808 | 950,363 | 547,936 | 778,392 | - | 105,825 | 63,858 | 3,019,182 | |||||||||||||||||||||||||||
President Operations | | 2017 | | | 564,891 | | | 958,705 | | | 556,073 | | | 597,372 | | | - | | | 114,037 | | | 54,819 | | | 2,845,897 | | |||||||||
Notes:
Salary
Represents salary earned during the year. Salary differs from annualized salary because annual increases generally go into effect on April 1 and both Mr. Brooks and Mr. Redd received a promotion in 2019. Mr. Velani’s salary is set in U.S. dollars and was paid in Canadian dollars based on a foreign exchange rate of $1.3432.
Share-based awards
PSUs were granted on February 14, 2019. The February 14, 2019 grant date accounting fair value of the awards shown in the Summary Compensation table is $268.16 per share, granted with reference to the TSX or US$202.00 per share granted with reference to the NYSE.
On September 3, 2019, additional PSUs and options were granted to Mr. Redd as a result of his promotion to Executive Vice-President. The grant date accounting fair value of this PSU award for Mr. Redd was $234.76 on the NYSE. The grant date accounting fair value of the awards are in accordance with FASB ASC Topic 718: Compensation – Stock Compensation. See Item 8, Financial Statements and Supplementary Data, Note 24: Stock-based compensation in our Annual Report on Form
10-K
filed with the SEC and securities regulatory authorities in Canada on February 20, 2020 for more details.We value our PSUs using the Willis Towers Watson binomial lattice model methodology. Using this methodology, the grant date expected fair value on February 14, 2019 was $217.21 on the TSX and US$163.62 on the NYSE, and, on September 3,
43
2019, the grant date expected fair value was US$190.16 on the NYSE. The Willis Towers Watson expected life binomial methodology for the PSUs are calculated based on the following assumptions:
Assumptions | Willis Towers Watson expected life binomial valuation | |
TSX / NYSE | ||
Term | 3 years | |
Vesting Schedule | 3 year cliff | |
Payout Range % (threshold-target-max) | 50-100-200 | |
Risk of Forfeiture | 5% | |
PSU Value (as a % of grant price) | 81% |
Mr. Velani’s, Mr. Brooks’ and Mr. Redd’s amounts include the value of matching DSUs granted in 2019.
Option awards
Stock options were granted on January 25, 2019. The grant date fair value of stock option awards granted to each NEO has been calculated in accordance with FASB ASC Topic 718: Compensation—Stock Compensation. We used the Black-Scholes option-pricing model (with reference to the shares underlying the options). The grant date accounting fair value of the awards shown in the Summary Compensation table shown respectively with reference to the TSX and NYSE are $60.01 or US$50.64 for the January 25, 2019 grant. Additional options were granted to Mr. Brooks on February 14, 2019 and Mr. Redd on September 3, 2019 to bring them to the Executive Vice-President level. The grant date accounting fair value on the NYSE is US$49.28 for the February 14, 2019 grant and US$50.29 for the September 3, 2019 grant, both were in reference to the NYSE.
See Incentive plan awards
on page 47 for details about the 2019 awards. See Item 8, Financial Statements and Supplementary Data, Note 24: Stock-based compensation in our Annual Report on Form10-K
filed with the SEC and securities regulatory authorities in Canada on February 20, 2020 for more details.To calculate the number of options that an executive receives, we use Willis Towers Watson’s expected life binomial methodology which is fundamentally similar to the methodology used to determine the accounting fair value; however, some of the underlying assumptions are different. For example, the binomial methodology assumes a slightly lower historical volatility, a higher risk-free rate and includes a discount to account for vesting restrictions.
The grant price on January 25, 2019 was $271.50 on the TSX with an underlying value of $54.30 and was US$205.31 on the NYSE with an underlying value of US$47.22. The grant price on February 14, 2019 was US$202.00 on the NYSE with an underlying value of US$46.46. The grant price on September 9, 2019 was US$234.76 on the NYSE with an underlying value of US$53.99. The Willis Towers Watson expected life binomial methodology for the stock options are calculated based on the following assumptions:
| Assumptions | Willis Towers Watson expected life binomial valuation | |||||||||
| NYSE | TSX | |||||||||
Option Term | 7 years | 7 years | ||||||||
Vesting Schedule | 4 year pro-rated | 4 year pro-rated | ||||||||
Expected Life | 4.75 years | 4.75 years | ||||||||
Dividend Yield (1-year historical) | 1.00% | 0.99% | ||||||||
Volatility (3-year daily) | 24.0% | 21.7% | ||||||||
Risk-free Rate (yield curve) | 2.5 - 3.1% | 2.0 - 2.5% | ||||||||
Risk of Forfeiture | 5% | 5% | ||||||||
Stock Option Value (as a % of grant price) | 23% | 20% | ||||||||
Non-equity
incentive plan compensationCash bonus earned under our short-term incentive plan for 2019 and paid in February 2020. In respect of their short-term incentive compensation, Mr. Velani, Mr. Brooks and Mr. Redd each elected to receive part of their 2019 bonus in DSUs.
Pension value
Mr. Creel and Mr. Velani participate in the Canadian defined contribution plan (DC plan) and in the defined contribution supplemental plan (DC SERP).
44
Mr. Creel, Mr. Pitz, Mr. Redd and Mr. Johnson participate in the U.S. defined contribution plan and the U.S. supplemental executive retirement plan.
Mr. Brooks participates in the CP Pension Plan for U.S. Management Employees.
See
Retirement plans
on page 51 for more details.All other compensation
The NEOs also receive certain benefits and perquisites which are competitive with our comparator group. The table below shows the breakdown of all other compensation for 2019. The values in the table have been converted to Canadian dollars using the 2019 average exchange rate of $1.3269.
| Perquisites | Other compensation | |||||||||||||||||||||||||||||||||||||||
| Name | Personal use of company aircraft ($) | Auto benefits ($) | Housing allowance ($) | Financial and tax planning ($) | Additional medical ($) | Club benefits ($) | 401K match ($) | Employer share purchase plan match ($) | Tax Assistance ($) | Total ($) | ||||||||||||||||||||||||||||||
Keith Creel | | 413,422 | | | 28,704 | | | 17,056 | | | 33,173 | | | 1,353 | | | 23,647 | | | 7,165 | | | 30,410 | | | - | | | 554,930 | | ||||||||||
Nadeem Velani | | - | | | 33,177 | | | - | | | - | | | - | | | 11,200 | | | - | | | 14,872 | | | - | | | 59,249 | | ||||||||||
John Brooks | | - | | | 26,251 | | | - | | | - | | | 2,610 | | | 14,861 | | | 9,658 | | | 13,271 | | | - | | | 66,651 | | ||||||||||
Laird Pitz | | - | | | 22,543 | | | - | | | - | | | - | | | 14,861 | | | 8,203 | | | - | | | - | | | 45,607 | | ||||||||||
Mark Redd | | - | | | 36,594 | | | - | | | - | | | 2,510 | | | 14,861 | | | 7,626 | | | 9,728 | | | 143,305 | | | 214,624 | | ||||||||||
Robert Johnson | | - | | | 53,148 | | | - | | | - | | | - | | | 14,861 | | | 9,616 | | | 1,949 | | | - | | | 79,574 | | ||||||||||
Notes:
| Use of company aircraft | The value is calculated by multiplying the variable cost per air hour by the number of hours used for travel and includes costs for fuel, maintenance, landing fees and other miscellaneous costs. As an executive of a Calgary-based company, enabling the CEO to visit his family in the United States is an important retention tool. Non-corporate use of the corporate jet has been limited to family visits and limited to the CEO only. | |
| Auto benefits | Includes a company-leased vehicle and reimbursement of related operating costs as well as taxable reimbursement of auto benefits for eligible vehicles. Upon retirement on September 30, 2019, Mr. Johnson received his vehicle as a gift from CP. His auto benefits include the value of the vehicle and the lease payments for the time he was employed in 2019. | |
Housing allowance | The incremental cost to provide reasonable accommodation for Mr. Creel in Calgary. | |
Financial and tax planning | For Mr. Creel, financial and tax planning services according to his current employment contract. | |
Additional medical | CP encourages executives to participate in the executive medical program. Under the U.S. medical benefits plan, available to all U.S. employees, the majority of the cost of a medical examination is covered by the plan. Only additional services for the executive medical are paid for by CP. In Canada, executive medicals are not covered under any general benefit plan. | |
Club memberships | Included in the perquisites program available to all senior executives. | |
| 401K plan | Mr. Creel, Mr. Brooks, Mr. Pitz, Mr. Redd and Mr. Johnson also receive matching contributions to the 401k plan. | |
| ESPP match | Includes company contributions to the employee share purchase plan (ESPP). The NEOs participate in the ESPP on the same terms and using the same formulas as other participants. See page 50 to read more about the ESPP. | |
| Tax assistance | As a U.S. employee relocating to CP’s head office in Canada, Mr. Redd was provided with tax assistance to minimize the tax implications of his cross-border employment on his base salary and any STIP payment up to target. All other income was taxed at full Canadian tax rates. Mr. Redd’s tax assistance is an estimate for 2019. Effective with his promotion to Executive Vice President, Mr. Redd is no longer eligible for tax assistance. |
45
Employment agreements
Except for Mr. Creel, employment agreements for executive officers are set out in a standard offer letter template. The letters contain the standard terms as described in the compensation discussion and analysis and include an annual salary, participation in the short and long-term incentive plans as approved annually by the Compensation Committee, participation in the benefit plans or programs generally available to management employees and modest perquisites.
As of the date of this proxy circular, all of our NEOs have a
two-year
non-compete,
non-solicitation
agreement tied to their CP employment.Mr. Creel’s employment agreement includes:
| • | reasonable living accommodation in Calgary |
| • | use of the corporate jet for business commuting and family visits within North America |
| • | non-disclosure, non-solicitation covenants |
| • | severance provisions as described on page 54 |
| • | reimbursement for club memberships of up to US$25,000 annually |
| • | reimbursement for financial services of up to US$25,000 annually |
46
Outstanding share-based awards and option-based awards
The table below shows all vested and unvested equity incentive awards that were outstanding as of December 31, 2019. See
Long-term
incentive plan
beginning on page 21 for more information about our stock option and share-based awards.| Option-based awards | Share-based awards | |||||||||||||||||||||||||||||||||
| Name | Grant date | Number of securities underlying unexercised options (#) | Option exercise price ($) | Option expiration date | Value of unexercised in-the-money options ($) | Grant type | Number of shares or units of shares that have not vested (#) | Market or payout value of share-based awards that have not vested ($) | Market or payout value of vested share-based awards not paid out or distributed ($) | |||||||||||||||||||||||||
Keith Creel | 31-Jan-2014 | 39,900 | 168.84 | 31-Jan-2024 | 6,471,381 | |||||||||||||||||||||||||||||
24-Jul-2014 | 47,940 | 210.32 | 24-Jul-2024 | 5,786,837 | ||||||||||||||||||||||||||||||
23-Jan-2015 | 33,910 | 175.92 | 23-Jan-2025 | 3,480,664 | ||||||||||||||||||||||||||||||
22-Jan-2016 | 55,250 | 116.80 | 22-Jan-2026 | 9,913,464 | ||||||||||||||||||||||||||||||
20-Jan-2017 | 33,884 | 150.99 | 20-Jan-2024 | 4,575,128 | ||||||||||||||||||||||||||||||
1-Feb-2017 | 18,762 | 151.14 | 1-Feb-2024 | 2,529,651 | ||||||||||||||||||||||||||||||
1-Feb-2017 | 177,225 | 151.14 | 1-Feb-2024 | 23,894,968 | ||||||||||||||||||||||||||||||
22-Jan-2018 | 43,148 | 185.85 | 22-Jan-2025 | 3,872,407 | ||||||||||||||||||||||||||||||
25-Jan-2019 | 54,202 | 205.31 | 25-Jan-2026 | 3,494,535 | ||||||||||||||||||||||||||||||
6-Feb-2013 | DSU | 10,546,127 | ||||||||||||||||||||||||||||||||
21-Feb-2017 | PSU | 14,138,889 | ||||||||||||||||||||||||||||||||
15-Feb-2018 | PSU | 18,621 | 6,166,051 | |||||||||||||||||||||||||||||||
14-Feb-2019 | PSU | 22,068 | 7,307,316 | |||||||||||||||||||||||||||||||
Total | 504,221 | 64,019,035 | 40,689 | 13,473,367 | 24,685,016 | |||||||||||||||||||||||||||||
Nadeem Velani | 2-Apr-2013 | 2,310 | 126.34 | 2-Apr-2023 | 472,834 | |||||||||||||||||||||||||||||
31-Jan-2014 | 1,820 | 168.84 | 31-Jan-2024 | 295,186 | ||||||||||||||||||||||||||||||
23-Jan-2015 | 1,539 | 218.78 | 23-Jan-2025 | 172,753 | ||||||||||||||||||||||||||||||
22-Jan-2016 | 2,927 | 165.74 | 22-Jan-2026 | 483,804 | ||||||||||||||||||||||||||||||
20-Jan-2017 | 4,644 | 201.49 | 20-Jan-2024 | 601,584 | ||||||||||||||||||||||||||||||
22-Jan-2018 | 13,260 | 231.66 | 22-Jan-2025 | 1,317,646 | ||||||||||||||||||||||||||||||
25-Jan-2019 | 16,313 | 271.50 | 25-Jan-2026 | 971,113 | ||||||||||||||||||||||||||||||
26-Feb-2014 | DSU | 223,781 | ||||||||||||||||||||||||||||||||
19-Feb-2015 | DSU | 113,220 | ||||||||||||||||||||||||||||||||
24-Feb-2017 | DSU | 124 | 41,083 | 164,332 | ||||||||||||||||||||||||||||||
22-Feb-2019 | DSU | 270 | 89,402 | 357,609 | ||||||||||||||||||||||||||||||
21-Feb-2017 | PSU | 2,517,052 | ||||||||||||||||||||||||||||||||
15-Feb-2018 | PSU | 5,304 | 1,755,752 | |||||||||||||||||||||||||||||||
14-Feb-2019 | PSU | 5,832 | 1,930,622 | |||||||||||||||||||||||||||||||
Total | 42,813 | 4,314,920 | 11,530 | 3,816,859 | 3,375,994 | |||||||||||||||||||||||||||||
John Brooks | 1-Apr-2012 | 2,850 | 75.71 | 1-Apr-2022 | 727,662 | |||||||||||||||||||||||||||||
7-Dec-2012 | 2,345 | 97.70 | 7-Dec-2022 | 547,159 | ||||||||||||||||||||||||||||||
22-Feb-2013 | 1,900 | 119.18 | 22-Feb-2023 | 402,515 | ||||||||||||||||||||||||||||||
31-Jan-2014 | 1,440 | 168.84 | 31-Jan-2024 | 233,554 | ||||||||||||||||||||||||||||||
23-Jan-2015 | 2,506 | 175.92 | 23-Jan-2025 | 257,226 | ||||||||||||||||||||||||||||||
22-Jan-2016 | 4,340 | 116.80 | 22-Jan-2026 | 778,723 | ||||||||||||||||||||||||||||||
20-Jan-2017 | 2,610 | 150.99 | 20-Jan-2024 | 352,411 | ||||||||||||||||||||||||||||||
22-Jan-2018 | 4,195 | 185.85 | 22-Jan-2025 | 376,489 | ||||||||||||||||||||||||||||||
25-Jan-2019 | 7,484 | 205.31 | 25-Jan-2026 | 482,512 | ||||||||||||||||||||||||||||||
14-Feb-2019 | 2,969 | 202.00 | 14-Feb-2026 | 204,182 | ||||||||||||||||||||||||||||||
6-Sep-2012 | DSU | 334,073 | ||||||||||||||||||||||||||||||||
22-Feb-2019 | DSU | 166 | 54,816 | 219,265 | ||||||||||||||||||||||||||||||
21-Feb-2017 | PSU | 1,374,360 | ||||||||||||||||||||||||||||||||
15-Feb-2018 | PSU | 1,810 | 599,421 | |||||||||||||||||||||||||||||||
14-Feb-2019 | PSU | 4,499 | 1,489,757 | |||||||||||||||||||||||||||||||
Total | 32,639 | 4,362,433 | 6,475 | 2,143,994 | 1,927,698 | |||||||||||||||||||||||||||||
Laird Pitz | 22-Jan-2016 | 1,808 | 116.80 | 22-Jan-2026 | 324,408 | |||||||||||||||||||||||||||||
20-Jan-2017 | 2,376 | 150.99 | 20-Jan-2024 | 320,815 | ||||||||||||||||||||||||||||||
22-Jan-2018 | 3,290 | 185.85 | 22-Jan-2025 | 295,268 | ||||||||||||||||||||||||||||||
25-Jan-2019 | 7,484 | 205.31 | 25-Jan-2026 | 482,512 | ||||||||||||||||||||||||||||||
19-Feb-2015 | DSU | 592,133 | ||||||||||||||||||||||||||||||||
23-Feb-2016 | DSU | 876,230 | ||||||||||||||||||||||||||||||||
21-Feb-2017 | PSU | 1,264,578 | ||||||||||||||||||||||||||||||||
15-Feb-2018 | PSU | 1,893 | 626,713 | |||||||||||||||||||||||||||||||
14-Feb-2019 | PSU | 3,047 | 1,008,964 | |||||||||||||||||||||||||||||||
Total | 14,958 | 1,423,003 | 4,940 | 1,635,677 | 2,732,941 | |||||||||||||||||||||||||||||
47
| Option-based awards | Share-based awards | |||||||||||||||||||||||||||||||||
| Name | Grant date | Number of securities underlying unexercised options (#) | Option exercise price ($) | Option expiration date | Value of unexercised in-the-money options ($) | Grant type | Number of shares or units of shares that have not vested (#) | Market or payout value of share-based awards that have not vested ($) | Market or payout value of vested share-based awards not paid out or distributed ($) | |||||||||||||||||||||||||
Mark Redd | 1-Apr-2014 | 1,380 | 166.16 | 1-Apr-2024 | 227,521 | |||||||||||||||||||||||||||||
23-Jan-2015 | 1,256 | 175.92 | 23-Jan-2025 | 128,921 | ||||||||||||||||||||||||||||||
22-Jan-2016 | 2,042 | 116.80 | 22-Jan-2026 | 366,394 | ||||||||||||||||||||||||||||||
20-Jan-2017 | 3,734 | 150.99 | 20-Jan-2024 | 504,177 | ||||||||||||||||||||||||||||||
22-Jan-2018 | 4,015 | 185.85 | 22-Jan-2025 | 360,335 | ||||||||||||||||||||||||||||||
20-Jul-2018 | 5,280 | 194.97 | 20-Jul-2025 | 411,323 | ||||||||||||||||||||||||||||||
25-Jan-2019 | 3,996 | 205.31 | 25-Jan-2026 | 257,632 | ||||||||||||||||||||||||||||||
3-Sep-2019 | 1,297 | 234.76 | 3-Sep-2026 | 34,011 | ||||||||||||||||||||||||||||||
19-Feb-2015 | DSU | 144,884 | ||||||||||||||||||||||||||||||||
22-Feb-2019 | DSU | 140 | 46,499 | 185,998 | ||||||||||||||||||||||||||||||
21-Feb-2017 | PSU | 1,178,305 | ||||||||||||||||||||||||||||||||
15-Feb-2018 | PSU | 1,733 | 573,813 | |||||||||||||||||||||||||||||||
20-Jul-2018 | PSU | 1,708 | 565,642 | |||||||||||||||||||||||||||||||
14-Feb-2019 | PSU | 1,627 | 538,848 | |||||||||||||||||||||||||||||||
3-Sep-2019 | PSU | 554 | 183,289 | |||||||||||||||||||||||||||||||
Total | 23,000 | 2,290,314 | 5,762 | 1,908,091 | 1,509,187 | |||||||||||||||||||||||||||||
Robert Johnson | 22-Jan-2016 | 2,061 | 116.80 | 22-Jan-2026 | 369,804 | |||||||||||||||||||||||||||||
20-Jan-2017 | 5,778 | 150.99 | 20-Jan-2024 | 780,164 | ||||||||||||||||||||||||||||||
22-Jan-2018 | 7,038 | 185.85 | 22-Jan-2025 | 631,640 | ||||||||||||||||||||||||||||||
25-Jan-2019 | 9,367 | 205.31 | 25-Jan-2026 | 603,913 | ||||||||||||||||||||||||||||||
24-Jun-2013 | DSU | 1,879,575 | ||||||||||||||||||||||||||||||||
27-Feb-2018 | DSU | 213,756 | ||||||||||||||||||||||||||||||||
21-Feb-2017 | PSU | 3,075,226 | ||||||||||||||||||||||||||||||||
15-Feb-2018 | PSU | 4,050 | 1,341,032 | |||||||||||||||||||||||||||||||
14-Feb-2019 | PSU | 3,814 | 1,262,873 | |||||||||||||||||||||||||||||||
Total | 24,244 | 2,385,521 | 7,864 | 2,603,905 | 5,168,557 | |||||||||||||||||||||||||||||
Notes:
Options
In general, regular options granted before 2017 vest 25% each year for four years beginning on the anniversary of the grant date and expire 10 years from the grant date. Grants made in 2017 and onwards expire 7 years from the grant date.
Mr. Redd received a performance option grant on July 20, 2018 for retention purposes. His 2018 performance option grant will become exercisable on July 20, 2021 upon the achievement of the
pre-determined
performance criteria at the end of the fiscal year ending December 31, 2020 and will expire 7 years from the grant date.All exercise prices for grants received prior to 2015 are shown in Canadian dollars. With respect to Mr. Creel, Mr. Brooks, Mr. Pitz, Mr. Redd and Mr. Johnson, exercise prices for option awards that were granted in 2015 or later are shown in U.S. dollars. All of Mr. Velani’s exercise prices are shown in Canadian dollars.
Value of unexercisedoptions at 2019
in-the-money
year-end
Based on $331.03, our closing share price on the TSX on December 31, 2019. For all the NEOs, except Mr. Velani, option awards made in 2015 or later have been valued based on US$254.95, our closing share price on the NYSE on December 31, 2019 and converted into Canadian dollars using a
year-end
exchange rate of $1.2988.Mr. Creel was awarded 177,225 performance stock options on February 1, 2017. These options will vest on February 1, 2022 provided certain performance metrics are achieved. The amount reflects the market value of these performance stock options based on US$254.95, our closing share price on the NYSE on December 31, 2019 and converted into Canadian dollars using a
year-end
exchange rate of $1.2988.For Mr. Velani, the value of unvested PSUs and DSUs is based on $331.03, our closing share price on the TSX on December 31, 2019.
For Mr. Creel, Mr. Brooks, Mr. Pitz, Mr. Redd and Mr. Johnson: the value of PSUs or DSUs is based on US$254.95, our closing share price on the NYSE on December 31, 2019, converted into Canadian dollars using a
year-end
exchange rate of $1.2988.48
PSUs assume a payout at target (100%) for the 2018 and 2019 grants. The 2017 PSU value reflects a payout at 193% on the award which includes dividends earned up to the payment date.
Vested and unvested DSU awards are deferred and cannot be redeemed until the executive leaves the company.
Incentive plan awards – value vested or earned during the year
The table below shows the amount of incentive compensation that vested or was earned in 2019.
Name | Option-based awards - value vested during the year ($) | Share-based awards - value vested during the year ($) | Non-equity incentive plan compensation - value earned during the year ($) | |||||||||
Keith Creel | | 2,679,271 | | | 14,138,889 | | | 2,978,994 | | |||
Nadeem Velani | | 256,072 | | | 2,778,742 | | | 1,095,729 | | |||
John Brooks | | 185,799 | | | 1,529,295 | | | 829,259 | | |||
Laird Pitz | | 309,653 | | | 1,353,851 | | | 571,230 | | |||
Mark Redd | | 133,500 | | | 1,309,733 | | | 592,539 | | |||
Robert Johnson | | 462,290 | | | 3,075,226 | | | 523,969 | | |||
Notes:
Option-based awards – value vested during the year
Option-based awards include the aggregate dollar value that would have been realized if the options were exercised on the date of vest. It is calculated as the difference between the closing price (on each of the stock option vest dates in 2019) and the exercise price, converted to Canadian dollars where applicable using the exchange rate on the vest date.
Share-based awards – value vested during the year
The value includes DSUs that have vested during the year and are valued as of the vest date and converted to Canadian dollars where applicable, as well as the 2017 PSU value which vested at 193% on December 31, 2019.
The 2017 PSU value realized on vesting is calculated by multiplying the number of shares acquired on vesting by $323.56, the average
30-day
trading price of our shares prior to December 31, 2019 on the TSX for Mr. Velani, and US$245.01 on the NYSE for Mr. Creel, Mr. Brooks, Mr. Pitz, Mr. Redd and Mr. Johnson, converted to Canadian dollars using theyear-end
exchange rate of $1.2988 and by multiplying that product by the achieved performance factor.Option exercises and vested stock awards
The table below shows the options exercised and sold by the NEOs in 2019.
Name | Number of options exercised and sold | Option exercise price ($) | Value realized ($) | |||||||||
Keith Creel (1) | 59,325 | 115.78 | 12,770,437 | |||||||||
| | 53,350 | | | 119.18 | | | 11,301,402 | | ||||
John Brooks (2) | 900 | 51.17 | 234,697 | |||||||||
| | 3,200 | | | 65.06 | | | 787,706 | | ||||
Laird Pitz | 4,584 | 175.92 | 393,199 | |||||||||
| 3,618 | 116.80 | 585,031 | ||||||||||
| 2,377 | 150.99 | 276,409 | ||||||||||
| | 1,097 | | | 185.85 | | | 77,370 | | ||||
Mark Redd | | 1,410 | | | 168.84 | | | 205,910 | | |||
Robert Johnson (3) | 3,640 | 129.54 | 669,053 | |||||||||
| 5,870 | 168.84 | 845,179 | ||||||||||
| 5,198 | 175.92 | 397,230 | ||||||||||
| 6,183 | 116.80 | 953,444 | ||||||||||
| 5,779 | 150.99 | 630,239 | ||||||||||
| | 2,347 | | | 185.85 | | | 147,957 | | ||||
Notes:
| (1) | Mr. Creel exercised his 2013 options that would be expiring in the next three years. |
| (2) | Mr. Brooks exercised his 2010 and 2011 options that would be expiring in 2020 and 2021 respectively. |
| (3) | Robert Johnson retired September 30, 2019 and exercised all of his vested options upon retirement. |
49
Value realized
is calculated using the actual market price of the shares acquired upon exercise of the respective options less the exercise price for those options. All values are displayed in Canadian dollars. The value for exercised options which were granted on the NYSE have been converted to Canadian dollars using the exchange rate applicable on the date of exercise.Equity compensation plan information
The table below shows the securities authorized for issuance under equity compensation plans at December 31, 2019. These include the issuance of securities upon exercise of options outstanding under the stock option plan and the director stock option plan.
The table also shows the remaining number of shares available for issuance and includes 340,000 shares under the director stock option plan. On July 21, 2003, the Board suspended any additional grants of options under the director stock option plan and there are no outstanding options under that plan.
Plan Category | Number of securities to be issued upon exercise of outstanding options, warrants and rights | Weighted-average exercise price of outstanding options, warrants and rights ($) | Number of securities remaining available for future issuance under equity compensation plans (excluding securities reflected in the first column) | |||||||||
Equity compensation plans approved by security holders | | 1,416,346 | | | 199.12 | | | 1,438,707 | | |||
Equity compensation plans not approved by security holders | | - | | | - | | | - | | |||
Total | 1,416,346 | 199.12 | 1,438,707 | |||||||||
See page 24 to read more about the stock option plan. You can also read about the two equity compensation plans in our audited consolidated financial statements for the year ended December 31, 2019, available on our website (investor.cpr.ca/financials), and on SEDAR (www.sedar.com) and EDGAR (www.sec.gov).
Employee Share Purchase Program (ESPP)
CP’s ESPP is available to all employees and provides the opportunity to purchase voting shares on the open market through payroll deductions which aligns employees’ interests with those of shareholders. Employees may contribute between 1% and 10% of their base salary to the ESPP every pay period. CP provides a 33% match on the first 6% of
non-unionized
and specified unionized employees’ contributions, which vest at the end of the four consecutive quarters. Employees must remain participants of the ESPP at the time of vesting in order to receive the CP match.As of December 31, 2019, approximately 45% of employees participated in the ESPP.
50
Canadian pension plans
Mr. Creel and Mr. Velani participated in our DC plan in 2019.
Participants contribute between 4% and 6% of their earnings depending on their age and years of service, and the company contributes between 4% and 8% of earnings. Total contributions are limited to the maximum allowed under the
Income Tax Act
(Canada) ($27,230 for 2019).Defined contribution plan
Accumulated value at start of year ($) | Compensatory ($) | Accumulated value at year end ($) | ||||||||||
Keith Creel | | 1,262,991 | | | 543,653 | | | 2,041,957 | | |||
Nadeem Velani | | 455,364 | | | 214,043 | | | 774,411 | | |||
Mr. Creel and Mr. Velani also participate in the DC SERP, a
non-registered
plan that provides benefits in excess of theIncome Tax Act
(Canada) limits for the DC Plan. Specifically, the DC SERP provides a company contribution equal to 6% of a participant’s base salary and annual bonus. Company contributions vest after two years and employees do not contribute to the DC SERP.U.S. retirement plans
Our U.S. retirement program has five elements:
| • | a qualified defined benefit pension plan which provides automatic employer contributions (closed plan); |
| • | a non-qualified defined benefit pension plan (closed plan) for certain employees whose compensation exceeds theU.S. Internal Revenue Code limits (US$225,000 for 2019); |
| • | a voluntary qualified 401(k) plan with employer match; |
| • | a qualified defined contribution plan which provides automatic employer contributions; and |
| • | a non-qualified defined contribution plan for certain employees whose compensation exceeds theU.S. Internal Revenue Code limit (US$280,000 for 2019). |
CP Pension Plan for U.S. Management Employees (closed plan)
CP sponsors a defined benefit pension plan comprised of a Basic Defined Benefit Pension Plan (Basic DB Plan) and a Supplemental Pension (Supplemental Pension Plan) for earnings in excess of the Internal Revenue Service (IRS) compensation limits in the Basic DB Plan, which provides retirement benefits in excess of the benefits payable from the Basic DB Plan. The benefit is based on age, service and a percentage of final average compensation.
The pension formula uses the final average monthly earnings and calculates a benefit of 0.5% up to the Tier 1 Railroad Retirement Board limit and 1.25% in excess of that limit, and multiplies that by the years of service to a maximum of 30 years. An unreduced pension is available for all employees under the Basic DB Plan and the Supplemental Pension Plan as early as age 62 with 30 years of service with the normal retirement benefit payable at age 65.
Mr. Brooks participated in the Basic DB Plan and Supplemental Pension Plan in 2019.
| Years of credited service | Annual benefits payable | Opening present value of defined benefit obligation ($) | Compensatory change ($) | Non-compensatory change ($) | Closing present value of defined benefit obligation ($) | |||||||||||||||||||||||||||
| Name | At December 31, 2019 | At age 65 | At year end ($) | At age 65 ($) | ||||||||||||||||||||||||||||
John Brooks | | 11.17 | | | 27.25 | | | 109,679 | | | 267,571 | | | 571,271 | | | 254,186 | | | 258,866 | | | 1,084,323 | | ||||||||
Notes:
The values in the table have been converted to Canadian dollars using the 2019 average exchange rate of $1.3269.
The closing present value of the defined benefit obligation is based on Mr. Brooks’ $109,679 accrued benefit assumed to be paid at age 65. The present value was determined using a discount rate of 3.15% and mortality adjusted actuarial assumptions.
51
401(k) plan
Individuals can make
pre-tax
orpost-tax
(Roth) contributions to the 401(k) plan subject to limitations imposed by the IRS in the U.S. The company provides a matching contribution of 50% on the first 6% of eligible earnings. All contributions vest immediately.U.S. Salaried Retirement Income Plan
The U.S. Salaried Retirement Income Plan is employer-funded with an annual contribution amount equal to 3.5% of eligible earnings, which include base salary and annual bonus. These earnings are subject to compensation limitations imposed by the IRS in the U.S. These amounts are included in the summary compensation table under
All other compensation
.Supplemental defined contribution plan (U.S. DC SERP)
The U.S. DC SERP is an unfunded,
non-qualified
defined contribution plan that provides an additional company contribution equal to 6% of eligible earnings without regard to the limitations imposed by the IRS. In the U.S., eligible earnings include base salary and annual bonus. In addition, for earnings in excess of the limitations imposed by the U.S. Internal Revenue Code, an additional 3.5% contribution is made. Company contributions cliff vest at the end of three years.Mr. Creel, Mr. Pitz, Mr. Redd and Mr. Johnson participated in the U.S. DC SERP in 2019.
The table below shows the U.S. Salaried Retirement Income Plan and U.S. DC SERP account information in 2019.
Accumulated value at start of year ($) | Compensatory ($) | Accumulated value at year end ($) | ||||||||||
Keith Creel | | 841,702 | | 22,690 | 1,045,509 | |||||||
Laird Pitz | | 267,437 | | 104,830 | 406,946 | |||||||
Mark Redd | | 126,699 | | | 96,231 | | | 246,286 | | |||
Robert Johnson | | 401,049 | | | 121,175 | | | 518,583 | | |||
Notes:
| • | The values in the table have been converted to Canadian dollars using the 2019 average exchange rate of $1.3269. |
About deferred compensation
Executive officers and members of senior management who have not met their share ownership requirement can choose to defer all or a portion of their short-term incentive by receiving it as DSUs in the year the bonus is actually paid, which they could receive a 25% match on. The deferred amount, including the match, cannot exceed the amount needed to meet the requirement. The amount is converted to bonus DSUs using the average market price of a CP common share for the 10 trading days immediately before December 31 of the applicable performance year. The matching units vest after three years.
The Board approved amendments of the Senior Executives Deferred Share Unit Plan (DSU Plan) in May 2019 to further assist senior executives in meeting their ownership requirements by allowing future PSUs to be converted into DSUs, which are subject to the same performance conditions as the corresponding PSU grant. The Performance Share Unit Plan (PSU Plan) was also amended similarly. The PSU Plan permits the eligible executives to elect in respect of their future conditional rights to PSUs prior to the start of the performance period in order to maximize their opportunity to reach ownership levels.
To defer any compensation, elections must be made by June 30th of the calendar year prior to the new fiscal year.
The table below shows the number of DSUs outstanding and their value based on our closing share price on December 31, 2019.
Unvested DSUs (#) | Vested DSUs (#) | Total Units (#) | Value as at December 31, 2019 ($) | |||||||||||||
Keith Creel | | 0 | | | 31,849 | | | 31,849 | | | 10,546,129 | | ||||
Nadeem Velani | | 394 | | | 2,595 | | | 2,989 | | | 989,449 | | ||||
John Brooks | | 166 | | | 1,671 | | | 1,837 | | | 608,284 | | ||||
Laird Pitz | | 0 | | | 4,434 | | | 4,434 | | | 1,468,226 | | ||||
Mark Redd | | 140 | | | 999 | | | 1,139 | | | 377,156 | | ||||
Robert Johnson | | 0 | | | 6,322 | | | 6,322 | | | 2,093,398 | | ||||
52
We valued the outstanding DSUs using $331.03, our closing share price on the TSX on December 31, 2019 for Mr. Velani, and US$254.95, our closing share price on the NYSE and converted to Canadian dollars using a
year-end
exchange rate of $1.2988 for Mr. Creel, Mr. Brooks, Mr. Pitz, Mr. Redd and Mr. Johnson.DSUs are redeemed for cash six months after the executive retires or leaves the company, or up until the end of the following calendar year for Canadian-resident executives. U.S.-resident executives who participate in the DSU Plan must redeem their DSUs after the
six-month
waiting period to be in compliance with U.S. tax regulations. We use the average market price of a share for the 10 trading days immediately before the payment date to calculate the amount, which the participant receives in a lump sum.53
Termination of employment
We have policies to cover different kinds of termination of employment.
Mr. Creel is covered under the terms of his employment agreement effective January 31, 2017, as amended December 18, 2018, that include
non-competition,
non-solicitation
and confidentiality restrictions. Mr. Velani, Mr. Brooks, Mr. Pitz and Mr. Redd are subject to the same terms as all other employees for voluntary termination, retirement, termination for cause and change in control. However, Mr. Velani, Mr. Brooks, Mr. Pitz and Mr. Redd signednon-competition,
non-solicitation
agreements in 2018 and 2019 that also had confidentiality restrictions.Resignation | Retirement | Termination with cause | Termination without cause | Change in control | ||||||
| Severance | None | None | None | Mr. Creel: 24 months of base salary Other NEOs: per legislative requirements | None | |||||
| Short-term incentive | Forfeited | Award for current year is pro-rated to retirement date | Forfeited | Equal to the target award for severance period for Mr. Creel Other NEOs: award for current year is pro-rated to termination date as per plan | None | |||||
| DSUs | Unvested DSUs are forfeited | Unvested DSUs are forfeited | Unvested DSUs are forfeited | Unvested DSUs are forfeited | Unvested units vest early if the holder is terminated following change in control | |||||
| Performance share units | Forfeited | Award continues to vest based on performance factors and executive is entitled to receive the full value as long as they have worked for six months of the performance period, otherwise the award is forfeited | Forfeited | Pro-rated based on active service within the performance period | Only vest if the executive is terminated following a change in control PSUs vest at target, pro-rated based on active service within the performance period | |||||
| Stock options | Vested options are exercisable for 30 days or until the expiry date, whichever comes first Unvested options are forfeited Performance stock options are forfeited | Options continue to vest Award expires five years after the retirement date or the normal expiry date, whichever is earlier Performance stock options are forfeited | Forfeited | Vested options are exercisable for six months following termination as well as any options that vest during the six-month periodPerformance stock options are forfeited | Options only vest early if the option holder is terminated following the change in control Performance stock options are forfeited | |||||
Pension | No additional value | No additional value | No additional value | No additional value | No additional value | |||||
| ESPP shares | Unvested shares are forfeited | Unvested shares vest | Unvested shares are forfeited | Unvested shares vest | Unvested shares vest | |||||
| Benefits | End on resignation | Post-retirement life insurance of $50,000 and a health spending account based on years of service (same for all employees) | End on resignation | None | None | |||||
| Perquisites | Any unused flex perquisite dollars are forfeited | Any unused flex perquisite dollars are forfeited | Any unused flex perquisite dollars are forfeited | Any unused flex perquisite dollars are forfeited | Any unused flex perquisite dollars are forfeited |
The next table shows the estimated incremental amounts that would be paid to Mr. Creel if his employment had been terminated without cause on December 31, 2019. There is no extra tax
gross-up
provision for any termination benefit.| Severance payment | ||||||||||||||||||||||||||||
Name | Severance period (# of months) | Base pay ($) | Short-term incentive ($) | Additional retirement benefits ($) | Other benefits ($) | Value of vesting of options and equity-based awards ($) | Payable on termination without cause ($) | |||||||||||||||||||||
Keith Creel | | 24 | | | 3,009,969 | | | 3,762,461 | | | - | | | 41,912 | | | 12,642,454 | | | 19,456,796 | | |||||||
Notes:
| • | Other benefits include the value of accelerated vesting of shares purchased under the ESPP |
| • | Value of vesting of options and equity-based awards is the value of stock options vesting within six months following termination in accordance with our stock option plan, and the prorated value as of the termination date of PSU awards. It is based on $331.03, our closing share price on the TSX on December 31, 2019 and US$254.95, the closing price of our shares on the NYSE, converted into Canadian dollars using ayear-end exchange rate of $1.2988. |
54
Our director compensation program shares the same objective as our executive compensation program: to attract and retain qualified directors and to align the interests of directors and shareholders. Flat fee retainer We pay directors a flat fee, which reflects the director’s ongoing oversight and responsibilities throughout the year and attendance at Board and committee meetings. | Aligning director and shareholder interests Directors receive their annual retainer in deferred share units so they have an ongoing stake in our future success, aligning their interests with those of our shareholders. About DDSUs DDSUs are granted to directors under the director deferred share unit plan. Only non-employee directors participate in the plan.A DDSU is a bookkeeping entry that has the same value as one CP common share. DDSUs earn additional units as dividend equivalents at the same rate as dividends paid on our shares. DDSUs vest immediately, and directors receive a cash amount for their DDSUs, one year after they leave the Board, based on the market value of our shares at the time of redemption, less any withholding taxes. | |||||||
Directors receive 100% of their annual retainer in DDSUs until they have met their share ownership requirements. After that they must receive at least 50% of their retainer in DDSUs, and can receive the balance in cash. Directors must make their election before the beginning of each calendar year. Directors must meet their share ownership requirements within five years of joining the Board, and must hold their DDSUs for one year after they retire from the Board. The table below shows the flat fee retainers for 2019. In 2019, Canadian directors’ fees were converted to Canadian dollars and the number of DDSUs received was based on the trading price of our shares on the TSX. U.S. directors were paid in U.S. dollars and the number of DDSUs they received was based on the trading price of our shares on the NYSE. | ||||||||
| Annual Retainer | ||||||||
Board Chair retainer | US $395,000 | |||||||
Director retainer | US $200,000 | |||||||
Committee Chair retainer | US $30,000 | |||||||
We reimburse directors for travel andexpenses related to attending their Board and committee meetings and
out-of-pocket
other business on behalf of CP.
Mr. Creel does not receive any director compensation because he is compensated in his role as President and CEO.
Benchmarking
With input from our compensation advisors, we reviewed and updated our compensation comparator group in 2018. Other than the removal of Goldcorp Inc., which was acquired by Newmont Mining Inc., from the comparator group, we did not make any further changes to our comparator group in 2019. Our comparator group consists of six Class 1 Railroad peers as well as 11 capital-intensive Canadian companies.
| BNSF Railway Company | BCE Inc. | |
| Canadian National Railway Company | Fortis Inc. | |
| CSX Corporation | TC Energy Corporation | |
| Kansas City Southern | TELUS Corporation | |
| Norfolk Southern Corporation | Rogers Communications Inc. | |
| Union Pacific Corporation | Barrick Gold Corporation | |
| Cenovus Energy Inc. | Kinross Gold Corporation | |
| Enbridge Inc. | Suncor Energy Inc. | |
| Imperial Oil Limited |
Independent advice
The Governance Committee may engage an independent consultant with respect to director compensation. The Governance Committee makes its own decisions, which may reflect factors and considerations other than the information and recommendations provided by its external consultant. The Governance Committee did not retain a compensation consultant in 2019 with respect to director compensation.
55
2019 director compensation
The Governance Committee reviews director compensation every two to three years based on the directors’ responsibilities and time commitment and the compensation provided by comparable companies. Each director is paid an annual retainer of US$200,000. Committee chairs receive an additional US$30,000 per year and the Board Chair receives an annual retainer of US$395,000. No changes were made to the director compensation program in 2019.
We paid directors a total of approximately $2,854,492 in 2019 as detailed in the table below. Directors receive a flat fee retainer to cover their ongoing oversight and responsibilities throughout the year and their attendance at Board and committee meetings.
Directors receive 100% of their annual retainer in director deferred share units (DDSUs) until they have met their share ownership requirements. After that, directors are required to receive at least 50% of their compensation in DDSUs. The total represents the approximate dollar value of DDSUs credited to each director’s DDSU account in 2019, based on the closing fair market value of our shares on the grant date plus the cash portion paid where a director elected to receive a portion of compensation in cash.
Mr. Creel does not receive director compensation because he is compensated in his role as President and CEO (see pages 28 and 31 for details).
| Name | Fees earned ($) | Share-based awards (1)(3) ($) | Option-based awards ($) | Non-equity incentive plan compensation ($) | Pension value ($) | All other compensation (2)(3) ($) | Total ($) | |||||||||||||||||||||
John Baird | - | 261,471 | - | - | - | 1,000 | 262,471 | |||||||||||||||||||||
Isabelle Courville | - | 439,366 | - | - | - | 1,000 | 440,366 | |||||||||||||||||||||
Jill Denham | - | 261,471 | - | - | - | 1,000 | 262,471 | |||||||||||||||||||||
Edward Hamberger (4) | - | 121,403 | - | - | - | 1,327 | 122,730 | |||||||||||||||||||||
Rebecca MacDonald | - | 300,691 | - | - | - | 1,000 | 301,691 | |||||||||||||||||||||
Edward Monser | - | 264,765 | - | - | - | 1,327 | 266,092 | |||||||||||||||||||||
Matthew Paull | - | 304,480 | - | - | - | 1,327 | 305,807 | |||||||||||||||||||||
Jane Peverett | - | 300,691 | - | - | - | 1,000 | 301,691 | |||||||||||||||||||||
Andrea Robertson (4) | - | 119,163 | - | - | - | 1,000 | 120,163 | |||||||||||||||||||||
Gordon Trafton | - | 284,456 | - | - | - | 1,327 | 285,783 | |||||||||||||||||||||
Andrew Reardon (5) | 92,154 | 93,073 | - | - | - | - | 185,227 | |||||||||||||||||||||
| Notes: |
| (1) | The value of the share-based awards has been calculated in accordance with Financial Accounting Standards Board Accounting Standards Codification Topic 718 (FASB ASC 718) using the grant date fair value, which is prescribed by the DDSU Plan. |
| (2) | Each director was provided with a $1,000 donation, in local currency, to the charity of their choice in December 2019 in gratitude for their year of service. This amount appears under All other compensation . |
| (3) | All directors were paid in U.S. dollars and the value of their share-based awards, and cash and other payments, as applicable, have been converted to Canadian dollars using the 2019 average exchange rate of $1.3269. |
| (4) | Mr. Hamberger and Ms. Robertson joined the Board in July 2019. Their 2019 compensation was pro-rated accordingly. |
| (5) | Mr. Reardon retired from the Board and did not stand for re-election at our annual meeting held May 7, 2019. In 2019, Mr. Reardon elected to receive 50% of his director compensation in DDSUs with the remaining 50% paid in cash. His 2019 compensation waspro-rated accordingly. |
56
Incentive plan awards
Outstanding share-based awards and option-based awards
The table below shows all vested and unvested equity incentive awards that are outstanding as of December 31, 2019.
Option-based awards (1) | Share-based awards | |||||||||||||||||||||||||||||||
| Name | Number of securities underlying unexercised options (#) | Option exercise price ($) | Option expiration date | Value of unexercised in-the-money options ($) | Grant type | Number of shares or units of shares that have not vested (#) | Market or payout value of share-based awards that have not vested ($) | Market or payout value of vested share-based awards not paid out or distributed ($) (2) | ||||||||||||||||||||||||
John Baird | - | - | - | - | - | - | - | 1,750,818 | ||||||||||||||||||||||||
Isabelle Courville | - | - | - | - | - | - | - | 2,831,962 | ||||||||||||||||||||||||
Jill Denham | - | - | - | - | - | - | - | 1,160,260 | ||||||||||||||||||||||||
Edward Hamberger | - | - | - | - | - | - | - | 126,882 | ||||||||||||||||||||||||
Rebecca MacDonald | - | - | - | - | - | - | - | 3,877,023 | ||||||||||||||||||||||||
Edward Monser | - | - | - | - | - | - | - | 305,632 | ||||||||||||||||||||||||
Matthew Paull | - | - | - | - | - | - | - | 1,888,098 | ||||||||||||||||||||||||
Jane Peverett | - | - | - | - | - | - | - | 1,177,474 | ||||||||||||||||||||||||
Andrea Robertson | - | - | - | - | - | - | - | 126,122 | ||||||||||||||||||||||||
Gordon Trafton | - | - | - | - | - | - | - | 1,163,256 | ||||||||||||||||||||||||
Andrew Reardon (3) | - | - | - | - | - | - | - | 4,016,927 | ||||||||||||||||||||||||
| (1) | On July 21, 2003, the Board suspended any additional grants of options under the director stock option plan, and there are no outstanding options under that plan. |
| (2) | Calculated based on the closing price of our shares on December 31, 2019 on the TSX ($331.03), in the case of directors resident in Canada, and on the NYSE (US$254.95) which was converted to Canadian dollars using the year-end exchange rate of $1.2988, in the case of the directors resident in the U.S. |
| (3) | Mr. Reardon retired from the Board and did not stand for re-election at our annual meeting held May 7, 2019. |
Non-employee
directors are not granted stock options under the stock option plan.57
ITEM 12. SECURITY OWNERSHIP OF CERTAIN BENEFICIAL OWNERS AND MANAGEMENT AND RELATED STOCKHOLDER MATTERS
Equity Compensation Plan Information
See Item 11 – “Executive Compensation—Equity Compensation Plan Information” for information regarding our equity compensation plans on page 50.
Beneficial Ownership Table
The table below sets forth the number and percentage of outstanding shares of our common stock beneficially owned by each person, or group of persons, known by Canadian Pacific based on publicly available information as of April 20, 2020, to own beneficially more than five percent of our common stock, each of our directors, each of our NEOs and all directors and executive officers as a group.
Name of beneficial owner 1 | Shares of common stock beneficially owned | Percent of common stock outstanding | ||||||
John Baird (a) | — | — | ||||||
Isabelle Courville (a) | 900 | * | ||||||
Jill Denham (a) | 0 | — | ||||||
Edward Hamberger (a) | 0 | — | ||||||
Rebecca MacDonald (a) | 0 | — | ||||||
Edward Monser (a) | 0 | — | ||||||
Matthew Paull (a) | 3,000 | * | ||||||
Jane Peverett (a) | 0 | — | ||||||
Andrea Robertson (a) | 0 | — | ||||||
Gordon T. Trafton (a) | 0 | — | ||||||
Keith E. Creel (b)(c) | 269,726 | * | ||||||
John K. Brooks (b)(d) | 24,142 | * | ||||||
Robert A. Johnson (b)(e) | 9,638 | * | ||||||
Laird J. Pitz (b)(f) | 6,041 | * | ||||||
Mark A. Redd (b)(g) | 6,534 | * | ||||||
Nadeem S. Velani (b)(h) | 23,419 | * | ||||||
TCI Fund Management Limited (i) | 10,978,084 | 8.09 | % | |||||
All current executive officers and directors as a group | 420,737 | * | ||||||
| * | Represents less than one percent of the outstanding common stock. |
| (a) | See Directors’ Profiles in “Item 10. Directors, Executive Officers and Corporate Governance” above for disclosure with respect to DDSUs. The address of each director is c/o Canadian Pacific, 7550 Ogden Dale Road S.E., Calgary, Alberta, T2C 4X9. |
| (b) | See “Compensation Details – Deferred Compensation Plans” in Item 11. Executive Compensation, for disclosure with respect to NEO DSUs. The address of each executive officer is c/o Canadian Pacific, 7550 Ogden Dale Road S.E., Calgary, Alberta, T2C 4X9. |
| (c) | The shares of common stock owned by Mr. Creel are comprised of (i) 251,610 shares issuable upon the exercise of stock options that have vested or will vest within the next 60 days, and (ii) 18,116 shares held by Mr. Creel directly. |
| (d) | The shares of common stock owned by Mr. Brooks are comprised of (i) 22,051 shares issuable upon the exercise of stock options that have vested or will vest within the next 60 days, and (ii) 2,091 shares held by Mr. Brooks directly. |
| (e) | The shares of common stock owned by Mr. Johnson are comprised of 9,638 shares issuable upon the exercise of stock options that have vested or will vest within the next 60 days. |
| (f) | The shares of common stock owned by Mr. Pitz are comprised of (i) 5,964 shares issuable upon the exercise of stock options that have vested or will vest within the next 60 days, and (ii) 77 shares held by Mr. Pitz directly. |
| (g) | The shares of common stock owned by Mr. Redd are comprised of (i) 5,643 shares issuable upon the exercise of stock options that have vested or will vest within the next 60 days, and (ii) 891 shares held by Mr. Redd directly. |
| (h) | The shares of common stock owned by Mr. Velani are comprised of (i) 22,788 shares issuable upon the exercise of stock options that have vested or will vest within the next 60 days, and (ii) 631 shares held by Mr. Velani directly. |
| (i) | Based upon statements in the Schedule 13G/A filed by TCI Fund Management Limited (“TCI Fund”) and Christopher Hohn on February 14, 2020, TCI Fund and Mr. Hohn have (i) shared voting power over 10,978,084 shares of CP’s common stock; and (ii) shared dispositive power of 10,978,084 shares of CP’s common stock. The Children’s Investment Master Fund (“TCIF”) is the investment manager of TCI Fund and Talos Capital DAC (“Talos”). Mr. Hohn, as managing director of TCIF, may be deemed to beneficially own the shares held by the TCI Fund and Talos. The address of each of TCI Fund and Mr. Hohn is 7 Clifford Street, London W1S 2FT, United Kingdom. |
58
Related party transactions
Directors, officers and employees are required to report any related party transactions to comply with our code of business ethics.
In 2019, there were no transactions between CP and a related person as described in Item 404 of Regulation
S-K,
which defines arelated person
as:| • | a director, nominated director or executive officer of CP, |
| • | an immediate family member of a director, nominated director or executive officer, or |
| • | someone who beneficially owns more than 5% of our shares or a member of their immediate family. |
Any director who has a material interest in a transaction or agreement involving CP must disclose the interest to the CEO and the Chair of the Board immediately, and does not participate in any discussions or votes on the matter.
The Board reviews related party transactions when it does its annual review of director independence. Our accounting and legal departments review any related party transactions reported by officers and employees.
Independence
The Board has adopted standards for director independence based on the criteria of the NYSE, SEC and CSA.
It reviews director independence continually and annually using director questionnaires as well as by reviewing updated biographical information, meeting with directors individually, and conducting a comprehensive assessment of all business and other relationships and interests of each director with respect to CP and our subsidiaries. In 2019 and 2020, the Board determined that each director, except for Mr. Creel, is independent in accordance with the standards for independence established by the NYSE and CSA. Mr. Creel is not independent because of his position as President and CEO.
The Board has also confirmed that each member of the Audit and Finance Committee meets the additional independence standards for audit committee members under Section 10A(m)(3) and Rule
10A-3(b)(1)
of the Exchange Act, and Section 1.5 of NI52-110
audit committees.The table below shows the fees we paid to Deloitte in 2019 and 2018 for audit and
non-audit
services.| For the year ended December 31 | 2019 | 2018 | ||||||
Audit fees for audit of our annual financial statements, reviews of quarterly reports and services relating to statutory and regulatory filings or engagements (including attestation services and audit or interim review of financial statements of certain subsidiaries and certain pension and benefits plans, and advice on accounting and/or disclosure matters) | $ | 3,576,300 | $ | 3,800,200 | ||||
Audit-related fees for assurance and services related to the audit but not included in the audit fees above, including securities filings | $ | 169,700 | $ | 138,800 | ||||
Tax fees for services relating to tax compliance, tax planning and tax advice | $ | 35,500 | $ | 121,000 | ||||
All other fees for services provided relating to CP’s corporate sustainability report and training programs | $ | 90,500 | $ | 54,000 | ||||
Total | $ | 3,872,000 | $ | 4,114,000 | ||||
Pre-approval
of audit services and feesThe Audit Committee has a written policy for
pre-approving
audit andnon-audit
services by the independent auditor and their fees, in accordance with the laws and requirements of stock exchanges and securities regulatory authorities.59
The policy sets out the following governance procedures:
| • | the Audit and Finance Committee pre-approves the terms of the annual engagement of the external auditor |
| • | the Board pre-approves the fees for the annual engagement and budgeted amounts for the audit and the Audit and Finance Committeepre-approves the fees fornon-audit services at least annually |
| • | the Vice-President, Financial Planning and Accounting submits reports at least quarterly to the Audit and Finance Committee listing the services that were performed or planned to be performed by the external auditor |
| • | any additional non-audit services to be provided by the external auditor that were not included in the list ofpre-approved services or exceed the budgeted amount by more than 10% must each bepre-approved by the Audit and Finance Committee or the committee chair. The committee chair must report any additionalpre-approvals at the next committee meeting |
| • | the Audit and Finance Committee reviews the policy as necessary to make sure it continues to reflect our needs |
| • | our chief internal auditor monitors compliance with the policy. |
The Audit Committee or committee chair must be satisfied that any services it
pre-approves
will not compromise the independence of the external auditor. The committeepre-approved
all services performed by the external auditor in 2019, in accordance with the policy.60
PART IV
| ITEM 15. | EXHIBITS, FINANCIAL STATEMENT SCHEDULE |
Part IV (Item 15) of the 2019 Form
10-K
is hereby amended solely to add the following exhibits required to be filed in connection with this Amendment No. 1.(b) Exhibits
Exhibits are listed in the exhibit index below.
Exhibit | Description | |
| 31.1* | CEO Rule 13a-14(a) Certifications relating to this Amendment No. 1 on Form 10-K/A | |
| 31.2* | CFO Rule 13a-14(a) Certifications relating to this Amendment No. 1 on Form 10-K/A | |
| 104* | Cover Page Interactive Data File (formatted as Inline XBRL and contained in Exhibit 101) | |
| * | Filed with this Amendment No. 1 on Form 10-K/A |
ITEM 16. | FORM 10-K SUMMARY |
Not applicable.
Pursuant to the requirements of Section 13 or 15(d) of the Securities Exchange Act of 1934, the Company has duly caused this report to be signed on its behalf by the undersigned, thereunto duly authorized.
CANADIAN PACIFIC RAILWAY LIMITED | ||
(Registrant) | ||
| By: | /s/ KEITH CREEL | |
| Keith Creel | ||
| President and Chief Executive Officer | ||
Dated: April 29, 2020
Pursuant to the requirements of the Securities Exchange Act of 1934, this report has been signed below by the following persons on behalf of the Company and in the capacities indicated on April 29, 2020.
| Signature | Title | |
* Keith Creel | President, Chief Executive Officer and Director (Principal Executive Officer) | |
/s/ NADEEM VELANI Nadeem Velani | Executive Vice-President and Chief Financial Officer (Principal Financial and Accounting Officer) | |
* Isabelle Courville | Chair of the Board of Directors | |
* John R. Baird | Director | |
* Gillian H. Denham | Director | |
* Edward R. Hamberger | Director | |
* | Director | |
| Rebecca MacDonald | ||
* Edward Monser | Director | |
* Matthew H. Paull | Director | |
* Jane L. Peverett | Director | |
* Andrea Robertson | Director | |
* Gordon T. Trafton | Director | |
| *By: | /s/ NADEEM VELANI | |
| Nadeem Velani | ||
Attorney-in-Fact | ||