Wells Fargo Commercial Mortgage Trust 2016-LC25
Filed: 10 Nov 16, 12:00am
| FREE WRITING PROSPECTUS | ||
| FILED PURSUANT TO RULE 433 | ||
| REGISTRATION FILE NO.: 333-206677-11 | ||

Free Writing Prospectus
Collateral Term Sheet
$954,965,554
(Approximate Initial Pool Balance)
Wells Fargo Commercial Mortgage Trust 2016-LC25
as Issuing Entity
Wells Fargo Commercial Mortgage Securities, Inc.
as Depositor
Ladder Capital Finance LLC
Wells Fargo Bank, National Association
Rialto Mortgage Finance, LLC
National Cooperative Bank, N.A.
as Sponsors and Mortgage Loan Sellers
Commercial Mortgage Pass-Through Certificates
Series 2016-LC25
November 9, 2016
WELLS FARGO SECURITIES | ||
Lead Manager and Sole Bookrunner | ||
Academy Securities Co-Manager | Deutsche Bank Securities Co-Manager | |
| Wells Fargo Commercial Mortgage Trust 2016-LC25 | Certain Terms and Conditions |
STATEMENT REGARDING THIS FREE WRITING PROSPECTUS
The depositor has filed a registration statement (including a prospectus) with the Securities and Exchange Commission (’’SEC’’) (SEC File No. 333-206677) for the offering to which this communication relates. Before you invest, you should read the prospectus in the registration statement and other documents the depositor has filed with the SEC for more complete information about the depositor, the issuing entity and this offering. You may get these documents for free by visiting EDGAR on the SEC Web site at www.sec.gov. Alternatively, the depositor, any underwriter, or any dealer participating in the offering will arrange to send you the prospectus after filing if you request it by calling toll free 1-800-745-2063 (8 a.m. – 5 p.m. EST) or by emailing wfs.cmbs@wellsfargo.com.
Nothing in this document constitutes an offer of securities for sale in any jurisdiction where the offer or sale is not permitted. The information contained herein is preliminary as of the date hereof, supersedes any such information previously delivered to you and will be superseded by any such information subsequently delivered and ultimately by the final prospectus relating to the securities. These materials are subject to change, completion, supplement or amendment from time to time.
STATEMENT REGARDING ASSUMPTIONS AS TO SECURITIES, PRICING ESTIMATES AND OTHER INFORMATION
This free writing prospectus contains certain forward-looking statements. If and when included in this free writing prospectus, the words “expects”, “intends”, “anticipates”, “estimates” and analogous expressions and all statements that are not historical facts, including statements about our beliefs or expectations, are intended to identify forward-looking statements. Any forward-looking statements are made subject to risks and uncertainties which could cause actual results to differ materially from those stated. Those risks and uncertainties include, among other things, declines in general economic and business conditions, increased competition, changes in demographics, changes in political and social conditions, regulatory initiatives and changes in customer preferences, many of which are beyond our control and the control of any other person or entity related to this offering. The forward-looking statements made in this free writing prospectus are made as of the date stated on the cover. We have no obligation to update or revise any forward-looking statement.
Wells Fargo Securities is the trade name for the capital markets and investment banking services of Wells Fargo & Company and its subsidiaries, including but not limited to Wells Fargo Securities, LLC, a member of NYSE, FINRA, NFA and SIPC, Wells Fargo Prime Services, LLC, a member of FINRA, NFA and SIPC, and Wells Fargo Bank, N.A. Wells Fargo Securities, LLC and Wells Fargo Prime Services, LLC are distinct entities from affiliated banks and thrifts.
IMPORTANT NOTICE REGARDING THE OFFERED CERTIFICATES
The information herein is preliminary and may be supplemented or amended prior to the time of sale.
In addition, the Offered Certificates referred to in these materials and the asset pool backing them are subject to modification or revision (including the possibility that one or more classes of certificates may be split, combined or eliminated at any time prior to issuance or availability of a final prospectus) and are offered on a “when, as and if issued” basis.
The underwriters described in these materials may from time to time perform investment banking services for, or solicit investment banking business from, any company named in these materials. The underwriters and/or their affiliates or respective employees may from time to time have a long or short position in any security or contract discussed in these materials.
The information contained herein supersedes any previous such information delivered to any prospective investor and will be superseded by information delivered to such prospective investor prior to the time of sale.
IMPORTANT NOTICE RELATING TO AUTOMATICALLY-GENERATED EMAIL DISCLAIMERS
Any legends, disclaimers or other notices that may appear at the bottom of any email communication to which this free writing prospectus is attached relating to (1) these materials not constituting an offer (or a solicitation of an offer), (2) any representation that these materials are accurate or complete and may not be updated or (3) these materials possibly being confidential, are not applicable to these materials and should be disregarded. Such legends, disclaimers or other notices have been automatically generated as a result of these materials having been sent via Bloomberg or another system.
THE INFORMATION IN THIS STRUCTURAL AND COLLATERAL TERM SHEET IS NOT COMPLETE AND MAY BE AMENDED PRIOR TO THE TIME OF SALE. THIS TERM SHEET IS NOT AN OFFER TO SELL THESE SECURITIES AND IT IS NOT A SOLICITATION OF AN OFFER TO BUY THESE SECURITIES IN ANY JURISDICTION WHERE THE OFFER OR SALE IS NOT PERMITTED.
2
| 9 WEST 57TH STREET |

THE INFORMATION IN THIS STRUCTURAL AND COLLATERAL TERM SHEET IS NOT COMPLETE AND MAY BE AMENDED PRIOR TO THE TIME OF SALE. THIS TERM SHEET IS NOT AN OFFER TO SELL THESE SECURITIES AND IT IS NOT A SOLICITATION OF AN OFFER TO BUY THESE SECURITIES IN ANY JURISDICTION WHERE THE OFFER OR SALE IS NOT PERMITTED.
3
| 9 WEST 57TH STREET |
THE INFORMATION IN THIS STRUCTURAL AND COLLATERAL TERM SHEET IS NOT COMPLETE AND MAY BE AMENDED PRIOR TO THE TIME OF SALE. THIS TERM SHEET IS NOT AN OFFER TO SELL THESE SECURITIES AND IT IS NOT A SOLICITATION OF AN OFFER TO BUY THESE SECURITIES IN ANY JURISDICTION WHERE THE OFFER OR SALE IS NOT PERMITTED.
4
| 9 WEST 57TH STREET |
THE INFORMATION IN THIS STRUCTURAL AND COLLATERAL TERM SHEET IS NOT COMPLETE AND MAY BE AMENDED PRIOR TO THE TIME OF SALE. THIS TERM SHEET IS NOT AN OFFER TO SELL THESE SECURITIES AND IT IS NOT A SOLICITATION OF AN OFFER TO BUY THESE SECURITIES IN ANY JURISDICTION WHERE THE OFFER OR SALE IS NOT PERMITTED.
5
| No. 1 – 9 West 57th Street | ||||||||
| Loan Information | Property Information | |||||||
| Mortgage Loan Seller: | Ladder Capital Finance LLC | Single Asset/Portfolio: | Single Asset | |||||
| Credit Assessment (DBRS/Fitch/Moody’s/Morningstar): | AAA/AAA/AAA(sca.pd)/A- | Property Type: | Office | |||||
| Original Principal Balance(1): | $50,000,000 | Specific Property Type: | CBD | |||||
| Cut-off Date Balance(1): | $50,000,000 | Location: | New York, NY | |||||
| % of Initial Pool Balance: | 5.2% | Size: | 1,680,218 SF | |||||
| Loan Purpose: | Refinance | Cut-off Date Balance Per SF(1): | $603.33 | |||||
| Borrower Names: | Solow Building Company II, L.L.C.; Solovieff Realty Co. II, L.L.C. | Year Built/Renovated: | 1972/NAP | |||||
| Sponsor: | Sheldon H. Solow | Title Vesting: | Fee / Leasehold | |||||
| Mortgage Rate: | 2.8595% | Property Manager: | Self-managed | |||||
| Note Date: | August 30, 2016 | 4th Most Recent Occupancy (As of)(4): | 56.9% (12/31/2012) | |||||
| Anticipated Repayment Date: | NAP | 3rd Most Recent Occupancy (As of)(4): | 50.9% (12/31/2013) | |||||
| Maturity Date: | September 1, 2026 | 2nd Most Recent Occupancy (As of)(4): | 63.5% (12/31/2014) | |||||
| IO Period: | 120 months | Most Recent Occupancy (As of)(4): | 67.3% (12/31/2015) | |||||
| Loan Term (Original): | 120 months | Current Occupancy (As of)(4): | 63.5% (6/1/2016) | |||||
| Seasoning: | 3 months | |||||||
| Amortization Term (Original): | NAP | Underwriting and Financial Information: | ||||||
| Loan Amortization Type: | Interest-only, Balloon | 4th Most Recent NOI (As of)(5): | $60,972,979 (12/31/2013) | |||||
| Interest Accrual Method: | Actual/360 | 3rd Most Recent NOI (As of)(5): | $67,687,210 (12/31/2014) | |||||
| Call Protection: | L(27),D(86),O(7) | 2nd Most Recent NOI (As of)(5): | $85,164,572 (12/31/2015) | |||||
| Lockbox Type: | Hard/Springing Cash Management | Most Recent NOI (As of)(5): | $97,014,333 (TTM 6/30/2016) | |||||
| Additional Debt(1): | Yes | |||||||
| Additional Debt Type(1)(2): | Pari Passu, Subordinate Debt and Future Mezzanine | |||||||
| U/W Revenues: | $166,714,099 | |||||||
| U/W Expenses: | $58,877,243 | |||||||
| Escrows and Reserves(3): | U/W NOI(6): | $107,836,855 | ||||||
| U/W NCF(6): | $107,098,067 | |||||||
| Type: | Initial | Monthly | Cap (If Any) | U/W NOI DSCR(1): | 3.67x | |||
| Taxes | $9,417,640 | $3,139,213 | NAP | U/W NCF DSCR(1): | 3.64x | |||
| Insurance | $264,333 | $88,111 | NAP | U/W NOI Debt Yield(1): | 10.6% | |||
| Replacement Reserve | $0 | $61,615 | $2,500,000 | U/W NCF Debt Yield(1): | 10.6% | |||
| TI/LC Reserve | $25,000,000 | Springing | $25,000,000 | As-Is Appraised Value: | $3,400,000,000 | |||
| Outstanding TI/LC Reserve | $13,061,790 | $0 | NAP | As-Is Appraisal Valuation Date: | July 28, 2016 | |||
| Free Rent Reserve | $16,462,228 | $0 | NAP | Cut-off Date LTV Ratio(1): | 29.8% | |||
| Deferred Maintenance | $287,500 | $0 | NAP | LTV Ratio at Maturity or ARD(1): | 29.8% | |||
| (1) | See “The Mortgage Loan” section. All statistical information related to balances per square foot, loan-to-value ratios, debt service coverage ratios and debt yields are based on the 9 West 57th Street Senior Notes only. The Cut-off Date LTV Ratio, U/W NCF DSCR and U/W NCF Debt Yield based on the 9 West 57th Street Whole Loan, including the 9 West 57th Street Subordinate Companion Note, are 35.3%, 3.08x and 8.9%, respectively. |
| (2) | See “Subordinate and Mezzanine Indebtedness” section. |
| (3) | See “Escrows” section. |
| (3) | See “Historical Occupancy” section. |
| (4) | See “Cash Flow Analysis” section. |
The Mortgage Loan.The mortgage loan (the “9 West 57th Street Mortgage Loan”) is part of a whole loan (the “9 West 57th Street Whole Loan”) evidenced by six seniorparipassu notes (the “9 West 57th Street Senior Notes”) and one subordinate note (the “9 West 57th Street” Subordinate Companion Note”), secured by the fee and leasehold interests in a 50-story office building located on West 57th Street in Manhattan, New York (the “9 West 57th Street Property”). The 9 West 57th Street Whole Loan was originated on August 30, 2016 by JPMorgan Chase Bank, National Association and the Note A-3-A in the original principal amount of $50,000,000 was subsequently purchased by Ladder Capital Finance LLC. The 9 West 57th Street Whole Loan had an original principal balance of $1,200,000,000 has an outstanding principal balance as of the Cut-off Date of $1,200,000,000 and accrues interest at an interest rate of 2.8595%per annum. The 9 West 57th Street Whole Loan had an initial term of 120 months, has a remaining term of 117 months as of the Cut-off Date and requires interest-only payments through the term of the 9 West 57th Street Whole Loan. The 9 West 57th Street Whole Loan matures on September 1, 2026.
Note A-3-A, which will be contributed to the WFCM 2016-LC25 Trust, had an original principal balance of $50,000,000, has an outstanding principal balance as of the Cut-off Date of $50,000,000 and represents a non-controlling interest in the 9 West 57th Street Whole Loan. The controlling Note A-1 and the 9 West 57th Street Subordinate Companion Loan (Note B-1) were contributed to the JPMCC 2016-NINE Trust. Note A-2 was contributed to the JPMCC 2016-JP3 securitization Trust; Note A-3-B is expected to be contributed to the CSAIL 2016-C7 securitization trust; Note A-4 was contributed to the JPMDB 2016-C4 securitization trust and the
THE INFORMATION IN THIS STRUCTURAL AND COLLATERAL TERM SHEET IS NOT COMPLETE AND MAY BE AMENDED PRIOR TO THE TIME OF SALE. THIS TERM SHEET IS NOT AN OFFER TO SELL THESE SECURITIES AND IT IS NOT A SOLICITATION OF AN OFFER TO BUY THESE SECURITIES IN ANY JURISDICTION WHERE THE OFFER OR SALE IS NOT PERMITTED.
6
| 9 WEST 57TH STREET |
remaining Note A-5 is currently held by JPMorgan Chase Bank, National Association and is expected to be contributed to future securitization trusts. Notes A-1, A-2, A-3-B, A-4, A-5 and B-1 collectively constitute the “9 West 57th Street Companion Notes”. The related mortgage loan seller provides no assurances that Note A-5 will not be split further. See “Description of the Mortgage Pool—The Whole Loans—The Non-Serviced Whole Loan Loans—9 West 57th Street Whole Loan” in the Preliminary Prospectus.
Note Summary
| Original Balance | Note Holder | Controlling Piece | ||
| Note A-1 | $670,724,000 | JPMCC 2016-NINE | Yes | |
| Note A-2 | $100,000,000 | JPMCC 2016-JP3 | No | |
| Note A-3-A | $50,000,000 | WFCM 2016-LC25 | No | |
| Note A-3-B | $50,000,000 | CSAIL 2016-C7 | No | |
| Note A-4 | $80,000,000 | JPMDB 2016-C4 | No | |
| Note A-5 | $63,000,000 | JPMCB | No | |
| Note B-1 | $186,276,000 | JPMCC 2016-NINE | No | |
| Total | $1,200,000,000 |
Following the lockout period, on any date before March 1, 2026 the borrower has the right to defease the 9 West 57th Street Whole Loan in whole, but not in part. In addition, the 9 West 57th Street Whole Loan is prepayable without penalty on or after March 1, 2026. The lockout period will expire on the earlier to occur of (i) two years after the closing date of the securitization that includes the last note to be securitized and (ii) the third anniversary of the origination date.
Sources and Uses
| Sources | Uses | |||||||||
| Original whole loan amount | $1,200,000,000 | 100.0% | Loan payoff(1) | $630,769,032 | 52.6 | % | ||||
| Reserves | 64,493,490 | 5.4 | ||||||||
| Closing costs | 19,764,970 | 1.6 | ||||||||
| Return of equity | 484,972,507 | 40.4 | ||||||||
| Total Sources | $1,200,000,000 | 100.0% | Total Uses | $1,200,000,000 | 100.0 | % | ||||
| (1) | The 9 West 57th Street Property was previously securitized in COMM 2012-9W57. |
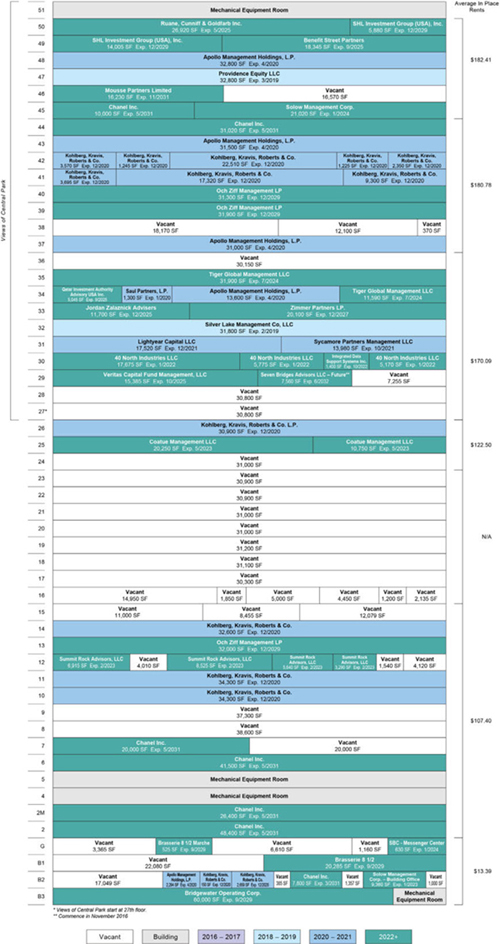
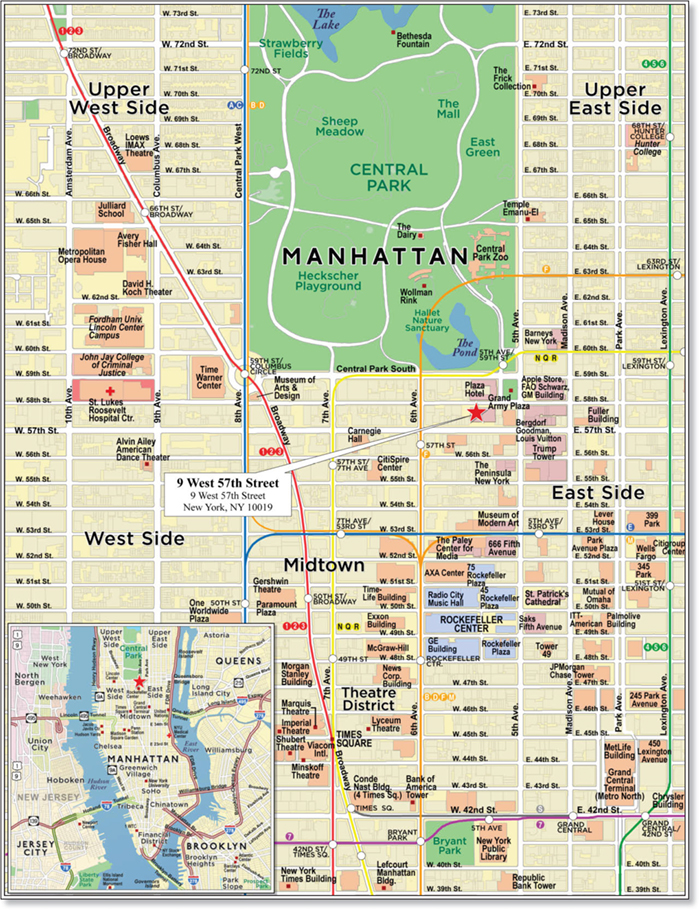
The Property.The 9 West 57th Street Property is a 50-story, 1,680,218 square foot, Class A office building located on West 57th Street in Manhattan, New York, between 5th and 6th Avenues. The 9 West 57th Street Property is located near the 5th Avenue retail corridor and across the street from the Plaza Hotel within the Plaza District Submarket. 9 West 57th Street consists of 50 stories with 47 office levels and three subterranean levels that contain a mix of retail, storage and service areas as well as a 285-space parking garage representing a parking ratio of 0.2 parking spaces per 1,000 square feet of rentable area. The full-service restaurant, Brasserie 8 ½, is located on the first subterranean level. According to the appraisal, the 9 West 57th Street Property is an iconic trophy office building and benefits from its Plaza District location, quality tenancy and unobstructed views of Central Park from the 27th floor and above. As of June 1, 2016, the 9 West 57th Street Property was leased to 26 tenants, including a number of institutional quality tenants. The 9 West 57th Street Property serves as headquarters’ locations for Kohlberg, Kravis, Roberts & Co. (“KKR”), Chanel Inc. (“Chanel”), Apollo Management Holdings, L.P. (“Apollo”), Och Ziff Management LP, Tiger Global Management LLC and Ruane, Cunniff & Goldfarb Inc. The 9 West 57th Street Property commands some of the highest per square foot office rents in Manhattan with certain higher floor in-place rents exceeding $200.00 per square foot on a gross basis. As of June 1, 2016, the 9 West 57th Street Property was 63.5% occupied, which is below the Plaza District Submarket occupancy of 89.9%. The sponsor is currently marketing the approximately 600,000 square feet of vacant space at the 9 West 57th Street Property.
THE INFORMATION IN THIS STRUCTURAL AND COLLATERAL TERM SHEET IS NOT COMPLETE AND MAY BE AMENDED PRIOR TO THE TIME OF SALE. THIS TERM SHEET IS NOT AN OFFER TO SELL THESE SECURITIES AND IT IS NOT A SOLICITATION OF AN OFFER TO BUY THESE SECURITIES IN ANY JURISDICTION WHERE THE OFFER OR SALE IS NOT PERMITTED.
7
| 9 WEST 57TH STREET |
The following table presents certain information relating to the tenancy at the 9 West 57th Street Property:
Major Tenants
| Tenant Name | Credit Rating (Fitch/Moody’s /S&P)(1) | Tenant NRSF | % of NRSF | Annual U/W Base Rent PSF(2) | Annual U/W Base Rent(2) | % of Total Annual U/W Base Rent | Lease Expiration Date | ||||||
| Major Tenants | |||||||||||||
| Kohlberg, Kravis, Roberts & Co. | A/NR/A | 196,124 | 11.7% | $121.48 | $23,825,357 | 16.1% | 12/31/2020(3) | ||||||
| Chanel Inc. | NR/NR/NR | 185,120 | 11.0% | $119.07 | $22,042,082 | 14.9% | 5/31/2031(4) | ||||||
| Apollo Management Holdings, L.P. | A-/NR/A | 111,194 | 6.6% | $167.27 | $18,599,624 | 12.6% | 4/30/2020(5) | ||||||
| Och Ziff Management LP | NR/NR/NR | 95,200 | 5.7% | $180.18 | $17,153,400 | 11.6% | 12/31/2029 | ||||||
| Providence Equity LLC | NR/NR/NR | 51,145 | 3.0% | $204.62 | $10,465,275 | 7.1% | Various(6) | ||||||
| Total Major Tenants | 638,783 | 38.0% | $144.16 | $92,085,738 | 62.2% | ||||||||
| Non-Major Tenants | 428,125 | 25.5% | $130.59 | $55,909,450 | 37.8% | ||||||||
| Occupied Collateral Total | 1,066,908 | 63.5% | $138.71 | $147,995,188 | 100.0% | ||||||||
| Vacant Space | 613,310 | 36.5% | |||||||||||
| Collateral Total | 1,680,218 | 100.0% | |||||||||||
| (1) | Certain ratings are those of the parent company whether or not the parent guarantees the lease. |
| (2) | Annual U/W Base Rent PSF and Annual U/W Base Rent include contractual rent steps through August 9, 2017, totaling $216,500. |
| (3) | Kohlberg, Kravis, Roberts & Co. has acquired an approximately 343,000 square foot condominium at Hudson Yards, an office development in West Midtown, Manhattan. There can be no assurances that KKR will not vacate the property upon lease expiration in December 2020. Excluding KKR from the in-place underwritten base rent, UW NCF DSCR would be equal to 2.30x. |
| (4) | Chanel Inc’s storage lease for 7,800 square feet expires March 31, 2031. |
| (5) | Both of Apollo Management Holdings, L.P.’s 13,600 square foot office lease and the 2,294 square foot storage lease expire on April 15, 2020. |
| (6) | The 51,145 square foot space also includes space leased to Benefit Street Partners, an affiliate of Providence Equity LLC. Providence Equity LLC’s lease for 32,800 square feet expires on March 15, 2019. Benefit Street Partners’ lease for 18,345 square feet expires on September 30, 2025. Benefit Street Partners has the right to terminate its lease as of September 1, 2022 with at least 12 months’ notice and the payment of a termination fee approximately equal to the sum of (i) an amount equal to four months of base rent and (ii) any unamortized brokerage commissions paid by the landlord on account of the lease. |
The following table presents certain information relating to the lease rollover schedule at the 9 West 57th Street Property:
Lease Expiration Schedule(1)(2)
| Year Ending December 31, | No. of Leases Expiring | Expiring NRSF | % of Total NRSF | Cumulative Expiring NRSF | Cumulative % of Total NRSF | Annual U/W Base Rent(3)(4) | % of Annual U/W Base Rent | Annual U/W Base Rent PSF(3) |
| MTM | 0 | 0 | 0.0% | 0 | 0.0% | $0 | 0.0% | $0.00 |
| 2016 | 0 | 0 | 0.0% | 0 | 0.0% | $0 | 0.0% | $0.00 |
| 2017 | 0 | 0 | 0.0% | 0 | 0.0% | $0 | 0.0% | $0.00 |
| 2018 | 0 | 0 | 0.0% | 0 | 0.0% | $0 | 0.0% | $0.00 |
| 2019 | 2 | 64,600 | 3.8% | 64,600 | 3.8% | $13,089,000 | 8.8% | $202.62 |
| 2020 | 3 | 308,618 | 18.4% | 373,218 | 22.2% | $42,632,981 | 28.8% | $138.14 |
| 2021 | 2 | 31,500 | 1.9% | 404,718 | 24.1% | $5,109,900 | 3.5% | $162.22 |
| 2022 | 2 | 30,020 | 1.8% | 434,738 | 25.9% | $5,204,730 | 3.5% | $173.38 |
| 2023 | 2 | 64,730 | 3.9% | 499,468 | 29.7% | $6,827,514 | 4.6% | $105.48 |
| 2024 | 3 | 65,140 | 3.9% | 564,608 | 33.6% | $10,046,735 | 6.8% | $154.23 |
| 2025 | 5 | 77,395 | 4.6% | 642,003 | 38.2% | $14,301,223 | 9.7% | $184.78 |
| 2026 | 0 | 0 | 0.0% | 642,003 | 38.2% | $0 | 0.0% | $0.00 |
| Thereafter | 8 | 424,905 | 25.3% | 1,066,908 | 63.5% | $50,783,105 | 34.3% | $119.52 |
| Vacant | 0 | 613,310 | 36.5% | 1,680,218 | 100.0% | $0 | 0.0% | $0.00 |
| Total/Weighted Average | 27 | 1,680,218 | 100.0% | $147,995,188 | 100.0% | $138.71 |
| (1) | Information obtained from the underwritten rent roll. |
| (2) | Certain tenants may have lease termination or contraction options that are exercisable prior to the originally stated expiration date of the subject lease and that are not considered in the Lease Expiration Schedule. |
| (3) | Weighted Average Annual U/W Base Rent PSF excludes vacant space. |
THE INFORMATION IN THIS STRUCTURAL AND COLLATERAL TERM SHEET IS NOT COMPLETE AND MAY BE AMENDED PRIOR TO THE TIME OF SALE. THIS TERM SHEET IS NOT AN OFFER TO SELL THESE SECURITIES AND IT IS NOT A SOLICITATION OF AN OFFER TO BUY THESE SECURITIES IN ANY JURISDICTION WHERE THE OFFER OR SALE IS NOT PERMITTED.
8
| 9 WEST 57TH STREET |
The following table presents historical occupancy percentages at the 9 West 57th Street Property:
Historical Occupancy
12/31/2012(1) | 12/31/2013(1)(2) | 12/31/2014(1)(2) | 12/31/2015(1)(2) | 6/1/2016(3) | ||||
| 56.9% | 50.9% | 63.5% | 67.3% | 63.5% |
| (1) | Information obtained from the borrower. |
| (2) | The increase in occupancy from 2013 to 2014 is primarily due to leases signed with SHL Investment Group (USA), Inc. and Benefit Street Partners LLC. The increase from 2014 to 2015 occupancy is primarily driven by leases signed with Tiger Global Management LLC, Qatar Investment Authority Advisory USA Inc. and Veritas Capital Fund Management, LLC. |
| (3) | Information obtained from the underwritten rent roll. |
Operating History and Underwritten Net Cash Flow. The following table presents certain information relating to the historical operating performance and the underwritten net cash flow at the 9 West 57th Street Property:
Cash Flow Analysis
| 2013(1) | 2014(1) | 2015(1) | TTM 6/30/2016(1) | U/W(2) | % of U/W Effective Gross Income | U/W $ per SF | |||||||
| Base Rent | $96,419,788 | $104,395,474 | $128,865,929 | $141,867,688 | $147,995,188(3) | 88.8% | $88.08 | ||||||
| Grossed Up Vacant Space | 0 | 0 | 0 | 0 | 82,518,645 | 49.5 | 49.11 | ||||||
| Total Reimbursables | 18,367,753 | 20,686,585 | 18,213,824 | 17,863,714 | 16,775,136 | 10.1 | 9.98 | ||||||
| Other Income | 1,960,765 | 2,011,104 | 1,649,779 | 1,754,505 | 1,943,774 | 1.2 | 1.16 | ||||||
| Less Vacancy & Credit Loss | 0 | 0 | 0 | 0 | (82,518,645)(4) | (49.5) | (49.11) | ||||||
| Effective Gross Income | $116,748,306 | $127,093,163 | $148,729,532 | $161,485,907 | 166,714,099 | 100.0% | $99.22 | ||||||
| Total Operating Expenses | $55,775,327 | $59,405,953 | $63,564,960 | $64,471,574 | $58,877,243 | 35.3% | $35.04 | ||||||
| Net Operating Income | $60,972,979 | $67,687,210 | $85,164,572 | $97,014,333 | $107,836,855 | 64.7% | $64.18 | ||||||
| TI/LC | 0 | 0 | 0 | 0 | 0 | 0.0 | 0.00 | ||||||
| Capital Expenditures | 0 | 0 | 0 | 0 | 738,788 | 0.4 | 0.44 | ||||||
| Net Cash Flow | $60,972,979 | $67,687,210 | $85,164,572 | $97,014,333 | $107,098,067 | 64.2% | $63.74 | ||||||
| NOI DSCR(5) | 2.07x | 2.30x | 2.90x | 3.30x | 3.67x | ||||||||
| NCF DSCR(5) | 2.07x | 2.30x | 2.90x | 3.30x | 3.64x | ||||||||
| NOI DY(5) | 6.0% | 6.7% | 8.4% | 9.6% | 10.6% | ||||||||
| NCF DY(5) | 6.0% | 6.7% | 8.4% | 9.6% | 10.6% |
| (1) | The increase in Net Operating Income from 2013 to 2014 is primarily due to an increase in occupancy from 50.9% to 63.5%. The increase in Net Operating Income from 2014 to 2015 is primarily due to an increase in occupancy from 63.5% to 67.3% and an increase in in-place weighted average base rent per square foot from approximately $97.86 to approximately $113.98 per square foot. The increase in Net Operating Income from 2015 to TTM 6/30/2016 is primarily due to an increase in in-place weighted average base rent from approximately $113.98 to approximately $127.16 per square foot. |
| (2) | The increase from TTM 6/30/2016 Net Operating Income to U/W Net Operating Income is primarily due to the inclusion of tenants who have signed leases, but have not begun paying rent, including Zimmer Partners LP (20,100 square feet) and Seven Bridges Advisors LLC (7,560 square feet). |
| (3) | Annual U/W Base Rent PSF and Annual U/W Base Rent include contractual rent steps through August 9, 2017, totaling $216,500. |
| (4) | The underwritten economic vacancy is 33.1%. The 9 West 57th Street Property was 63.5% leased as of June 1, 2016. |
| (5) | Debt service coverage ratios and debt yields are based on the 9 West 57th Street Senior Notes. |
Appraisal. As of the appraisal valuation date of July 28, 2016 the 9 West 57th Street Property had an “as-is” appraised value of $3,400,000,000. The appraiser of the 9 West 57th Street Property concluded an “as-stabilized” value of $3,750,000,000 as of February 1, 2020.
Environmental Matters. According to a Phase I environmental site assessment dated August 5, 2016 there was no evidence of any recognized environmental conditions at the 9 West 57th Street Property.
Market Overview and Competition.The 9 West 57th Street Property is located in the Plaza District in Midtown Manhattan and in close proximity to the Plaza Hotel, 5th Avenue, the Museum of Modern Art, Rockefeller Center, Carnegie Hall, Radio City Music Hall, Columbus Circle and Grand Central Terminal. Midtown Manhattan is home to numerous national and multinational corporations, such as The Blackstone Group, Bloomberg L.P., Estée Lauder, JPMorgan Chase and NBC. The surrounding area has a number of luxury hotels, including The Four Seasons, The Peninsula, The Plaza and The St. Regis. The property is located along “Billionaire’s Row” which includes several luxury supertall residential condominium developments such as One57, 432 Park, 220 Central Park South and 111 West 57th Street. Certain residential condominium units along “Billionaire’s Row” have sold for up to $9,000 per square foot.
As of the second quarter of 2016, the Plaza District office submarket reported an overall vacancy rate of 10.1% and overall average asking rents of $128.36 per square foot on a gross basis. The appraisal identified four comparable Class A trophy office buildings
THE INFORMATION IN THIS STRUCTURAL AND COLLATERAL TERM SHEET IS NOT COMPLETE AND MAY BE AMENDED PRIOR TO THE TIME OF SALE. THIS TERM SHEET IS NOT AN OFFER TO SELL THESE SECURITIES AND IT IS NOT A SOLICITATION OF AN OFFER TO BUY THESE SECURITIES IN ANY JURISDICTION WHERE THE OFFER OR SALE IS NOT PERMITTED.
9
| 9 WEST 57TH STREET |
including the Seagram Building (375 Park Avenue), 667 Madison Avenue, the GM Building (767 5th Avenue) and Lever House (390 Park Avenue) with current asking rents ranging from $125 per square foot to $220 per square foot, on a gross basis, which is in-line with the 9 West 57th Street Property.
The following table presents certain information relating to comparable leases to the 9 West 57th Street Property:
Comparable Leases(1)
| Property Name/Location | Year Built/ Renovated | Stories | Total GLA (SF) | Total Occupancy | Distance from Subject | Tenant Name | Lease Date/Term | Lease Area (SF) | Annual Base Rent PSF | Lease Type | ||||||||||
767 Fifth Avenue New York, NY
| 1968/NAV | 50 | 1,925,000 | 95.6% | 0.2 miles | Seven Valley LLC | June 2016 / 15 Yrs | 2,933 | $220.00 | Gross | ||||||||||
650 Madison Avenue New York, NY
| 1956/1987 | 27 | 603,666 | 85.9% | 0.3 miles | Ocean Road Advisors | April 2016 / 10 Yrs | 6,647 | $160.00 | Gross | ||||||||||
375 Park Avenue New York, NY
| 1958/NAP | 38 | 830,928 | 98.3% | 0.5 miles | Strategic Asset Services LLC | June 2016 / 10 Yrs | 17,519 | $165.00 | Gross | ||||||||||
350 Park Avenue New York, NY
| 1960/2002 | 30 | 567,000 | 100.0% | 0.5 miles | Citco Corporate Services | May 2016 / 10.7 Yrs | 8,092 | $160.00 | Gross | ||||||||||
1095 Avenue of the Americas New York, NY
| 1972/2008 | 41 | 1,484,325 | 97.3% | 1.0 miles | U.S. Bank | June 2016 / 12 Yrs | 68,636 | $95.00 | Gross |
| (1) | Information obtained from the appraisal and a third party market research report. |
The Borrower.The borrowing entities for the 9 West 57th Street Whole Loan are Solow Building Company II, L.L.C. and Solovieff Realty Co. II, L.L.C and each is a Delaware limited liability company and special purpose entity. Legal counsel to the borrower delivered a non-consolidation opinion in connection with the origination of the 9 West 57th Street Whole Loan.
The Sponsor.The loan sponsor is Sheldon H. Solow who has been an owner and developer of commercial and residential properties in New York since 1950 and has owned the 9 West 57th Street Property since developing it in 1972. Sheldon H. Solow has a real estate portfolio consisting of approximately 18 commercial and residential properties in New York City, including 265 East 66th Street, One East River Place and 419 East 60th Street.
Escrows.The loan documents provide for upfront reserves in the amount of $9,417,640 for real estate taxes, $264,333 for insurance premiums, $25,000,000 for ongoing tenant improvements and leasing commissions, $16,462,228 for outstanding free rent, $13,061,790 for outstanding tenant improvements and leasing commissions and $287,500 for deferred maintenance. The loan documents require monthly reserve deposits of one-twelfth of the estimated annual real estate taxes (currently equates to $3,139,213 per month), one-twelfth of the estimated annual insurance premiums (currently equates to $88,111 per month), $61,615 for replacement reserves. The loan documents do not require monthly escrows for replacement reserves as long as the balance of the escrow account equals $2,500,000 (“Replacement Reserve Cap”).
The loan documents do not require monthly escrows for tenant improvements and leasing commission reserves as long as the balance of the escrow account remains $25,000,000 (“TI/LC Reserve Cap”). If the balance of the tenant improvement and leasing commissions reserve account is less than the TI/LC Reserve Cap, the borrowers are required to deposit into the reserve $420,055 per month unless (i) the debt service coverage ratio is equal to or greater than 2.50x, (ii) the balance of the reserve account is equal to or greater than $15,000,000 and (iii) the 9 West 57th Street Property is occupied by tenants under leases demising no less than 65.0% of the rentable square footage.
Lockbox and Cash Management.The 9 West 57th Street Whole Loan documents require a lender-controlled lockbox account, which is already in place, and that the borrowers direct tenants to pay their rents directly into such lockbox account. All funds in the lockbox account will be swept daily into the borrowers’ operating account at the clearing bank, unless a Trigger Period (as defined below) has occurred and is continuing, in which event such funds will be swept on a daily basis into the a cash management account controlled by the lender and disbursed on each payment date in accordance with the loan documents.
A “Trigger Period” commences upon the occurrence of (i) an event of default, (ii) the bankruptcy or insolvency of the borrowers, (iii) the bankruptcy or insolvency of the property manager or (iv) the debt service coverage ratio (as calculated in the loan documents) falling below 2.50x based on a trailing three-month basis.
The borrowers will have the right two times in the aggregate in any 12-month period to cure a Trigger Period as follows: (i) if a Trigger Period exists solely by reason of an event of default, the curing and acceptance of such cure by the lender of the applicable event of default (in its sole and absolute discretion), (ii) if a Trigger Period exists solely by reason of a bankruptcy or insolvency of a property manager, the replacement of such manager with a qualified manager pursuant to a management agreement acceptable to the lender within 60 days, (iii) if a Trigger Period exists solely by reason of a the debt service coverage ratio falling below 2.50x for a trailing three-month period, the achievement of the debt service coverage ratio for two consecutive quarters of at least 2.50x on a
THE INFORMATION IN THIS STRUCTURAL AND COLLATERAL TERM SHEET IS NOT COMPLETE AND MAY BE AMENDED PRIOR TO THE TIME OF SALE. THIS TERM SHEET IS NOT AN OFFER TO SELL THESE SECURITIES AND IT IS NOT A SOLICITATION OF AN OFFER TO BUY THESE SECURITIES IN ANY JURISDICTION WHERE THE OFFER OR SALE IS NOT PERMITTED.
10
| 9 WEST 57TH STREET |
trailing three-month basis as determined by the lender. In no event will the borrowers have the right to cure a Trigger Period occurring by reason of a borrower bankruptcy.
Property Management. The 9 West 57th Street Property is managed by an affiliate of the borrower.
Assumption. The borrower has the one-time right to transfer the 9 West 57th Street Property provided that certain conditions are satisfied, including: (i) no event of default has occurred and is continuing; (ii) the proposed transferee will be controlled by a person who (a) has demonstrated expertise in owning or operating at least three similar Class A office properties in Manhattan consisting of at least 4,500,000 rentable square feet (exclusive of the 9 West 57thStreet Property), (b) as of a date no more than six months prior to the date of such transfer and assumption, and at all times while the guaranty of recourse obligations and/or environmental indemnity, as each are referred to in clause (iii) below, is outstanding, has (x) total assets of at least $2.0 billion (exclusive of the 9 West 57th Property) in the aggregate, (y) has shareholder/partner equity of at least $1.3 billion (exclusive of the 9 West 57th Street Property) in the aggregate and (z) liquidity in excess of $25.0 million in the aggregate, and (c) whose identity, experience, financial condition and creditworthiness is otherwise acceptable to Lender in all respect; (iv) execution of a recourse guaranty and an environmental indemnity by an affiliate of the transferee; and (v) the lender has received confirmation from DBRS, Fitch, Moody’s and Morningstar that such assumption will not result in a downgrade of the respective ratings assigned to the Series 2016-LC25 certificates and similar confirmations from each rating agency rating any securities backed by any of the 9 West 57th Street Companion Loans.
Partial Release. Not permitted.
Real Estate Substitution.Not permitted.
Subordinate and Mezzanine Indebtedness.The 9 West 57th Street Subordinate Companion Note had an original balance of $186,276,000, has a cut-off date balance of $186,276,000 and is coterminous with the 9 West 57th Street Senior Notes. The 9 West 57th Street subordinate companion loan requires interest-only payments through maturity. The controlling Note A-1 and the 9 West 57th Street Subordinate Companion Note were contributed to the JPMCC 2016-NINE securitization trust, pursuant to which the 9 West 57th Street Whole Loan is serviced and administered.
The sole members of the borrowers are permitted to obtain a mezzanine loan secured by the ownership interests in the related borrower upon satisfaction of certain terms and conditions which include, without limitation, (i) the mezzanine lender meets a qualified lender provision in the loan documents, (ii) the combined loan-to-value ratio on the origination date of the mezzanine loan does not exceed 35.3%, (iii) the combined debt service coverage ratio (as calculated in the loan documents and based on the 12 months immediately preceding the origination date of the mezzanine loan) is not less than 3.08x, and (iv) the mezzanine lender enters into an intercreditor agreement in form and substance reasonably satisfactory to the mortgage lender and the rating agencies.
Ground Lease.The borrowers have pledged both the fee interest in the 9 West 57th Street Property and the leasehold estate. The borrowers are permitted to terminate the ground lease upon certain terms and conditions in the loan documents which include, without limitation, delivery of a new title policy or an endorsement to the existing title policy, confirmation that all space leases will remain in full force and effect and satisfaction of any REMIC requirements.
Terrorism Insurance. The loan documents require that the “all risk” insurance policy required to be maintained by the borrowers provides coverage for terrorism in an amount equal to the full replacement cost of the 9 West 57th Street Property (provided that the borrowers are not required to pay terrorism insurance premiums in excess of two times the premiums for all risk and business interruption coverage (exclusive of terrorism coverage) if the Terrorism Risk Insurance Program Reauthorization Act is no longer in effect). The loan documents also require business interruption insurance covering no less than the 24-month period following the occurrence of a casualty event, together with a 12-month extended period of indemnity.
THE INFORMATION IN THIS STRUCTURAL AND COLLATERAL TERM SHEET IS NOT COMPLETE AND MAY BE AMENDED PRIOR TO THE TIME OF SALE. THIS TERM SHEET IS NOT AN OFFER TO SELL THESE SECURITIES AND IT IS NOT A SOLICITATION OF AN OFFER TO BUY THESE SECURITIES IN ANY JURISDICTION WHERE THE OFFER OR SALE IS NOT PERMITTED.
11
| WALMART SHADOW ANCHORED PORTFOLIO |
THE INFORMATION IN THIS STRUCTURAL AND COLLATERAL TERM SHEET IS NOT COMPLETE AND MAY BE AMENDED PRIOR TO THE TIME OF SALE. THIS TERM SHEET IS NOT AN OFFER TO SELL THESE SECURITIES AND IT IS NOT A SOLICITATION OF AN OFFER TO BUY THESE SECURITIES IN ANY JURISDICTION WHERE THE OFFER OR SALE IS NOT PERMITTED.
12
| WALMART SHADOW ANCHORED PORTFOLIO |
THE INFORMATION IN THIS STRUCTURAL AND COLLATERAL TERM SHEET IS NOT COMPLETE AND MAY BE AMENDED PRIOR TO THE TIME OF SALE. THIS TERM SHEET IS NOT AN OFFER TO SELL THESE SECURITIES AND IT IS NOT A SOLICITATION OF AN OFFER TO BUY THESE SECURITIES IN ANY JURISDICTION WHERE THE OFFER OR SALE IS NOT PERMITTED.
13
| No. 2 – Walmart Shadow Anchored Portfolio | ||||||
| Loan Information | Property Information | |||||
| Mortgage Loan Seller: | Ladder Capital Finance | Single Asset/Portfolio: | Portfolio | |||
| Credit Assessment (DBRS/Fitch/Moody’s/Morningstar): | NR/NR/NR/NR | Property Type: | Retail | |||
| Original Principal Balance(1): | $49,500,000 | Specific Property Type: | Shadow Anchored | |||
| Cut-off Date Principal Balance(1): | $49,500,000 | Location: | Various – See Table | |||
| % of Initial Pool Balance: | 5.2% | Size: | 881,524 SF | |||
| Loan Purpose: | Refinance | Cut-off Date Balance Per SF(1): | $101.00 | |||
| Borrowers(2): | Various | Year Built/Renovated: | Various – See Table | |||
| Sponsor: | David W. Schostak | Title Vesting(5): | Various | |||
| Mortgage Rate: | 5.5898% | Property Manager: | Self-managed | |||
| Note Date: | September 1, 2016 | 4th Most Recent Occupancy (As of): | 93.9% (12/31/2012) | |||
| Anticipated Repayment Date: | NAP | 3rd Most Recent Occupancy (As of): | 92.1% (12/31/2013) | |||
| Maturity Date: | September 6, 2021 | 2nd Most Recent Occupancy(As of): | 92.2% (12/31/2014) | |||
| IO Period: | 24 months | Most Recent Occupancy (As of): | 93.4% (12/31/2015) | |||
| Loan Term (Original): | 60 months | Current Occupancy (As of): | 93.1% (10/31/2016) | |||
| Seasoning: | 3 months | |||||
| Amortization Term (Original): | 360 months | Underwriting and Financial Information: | ||||
| Loan Amortization Type: | Interest-only, Amortizing Balloon | |||||
| Interest Accrual Method: | Actual/360 | 4th Most Recent NOI (As of): | $8,667,457 (12/31/2013) | |||
| Call Protection: | L(27),D(28),O(5) | 3rd Most Recent NOI (As of): | $9,035,547 (12/31/2014) | |||
| Lockbox Type: | Hard/Upfront Cash Management | 2nd Most Recent NOI (As of): | $9,045,481 (12/31/2015) | |||
| Additional Debt(1)(3): | Yes | Most Recent NOI (As of): | $9,050,388 (TTM 6/30/2016) | |||
| Additional Debt Type(1)(3): | Pari Passu; Mezzanine | |||||
| U/W Revenues: | $12,603,392 | |||||
| U/W Expenses: | $3,145,985 | |||||
| Escrows and Reserves(4): | U/W NOI: | $9,457,407 | ||||
| U/W NCF: | $8,311,424 | |||||
| Type: | Initial | Monthly | Cap (If Any) | U/W NOI DSCR(1): | 1.54x | |
| Taxes | $682,795 | $136,559 | NAP | U/W NCF DSCR(1): | 1.36x | |
| Insurance | $150,051 | $12,504 | NAP | U/W NOI Debt Yield(1): | 10.6% | |
| Replacement Reserves | $0 | $14,692 | $528,915(4) | U/W NCF Debt Yield(1): | 9.3% | |
| TI/LC Reserve | $850,000 | $80,806 | $2,909,034(4) | As-Is Appraised Value: | $118,715,000 | |
| Deferred Maintenance | $218,304 | $0 | NAP | As-Is Appraisal Valuation Date(7): | Various | |
| Tell City Engineering Reserve | $129,000 | $0 | NAP | Cut-off Date LTV Ratio(1): | 75.0% | |
| Ground Rent Reserve | $8,216 | Springing | $8,216 | LTV Ratio at Maturity or ARD(1): | 72.0% | |
(1) | See “The Mortgage Loan” section. All statistical information related to balances per square foot, loan-to-value ratios, debt service coverage ratios and debt yields are based on the Walmart Shadow Anchored Portfolio Whole Loan (as defined below). |
| (2) | See “Borrowers” section. |
| (3) | See “Subordinate and Mezzanine Indebtedness” section. The equity interest in the borrower has been pledged to secure mezzanine indebtedness with an original principal balance of $8,613,750. All statistical information related to the balances per square foot, loan-to-value ratios, debt service coverage ratios and debt yields are based solely on the Walmart Shadow Anchored Portfolio Whole Loan. As of the Cut-off Date, the Cut-off Date Balance per SF, U/W NCF DSCR, U/W NCF Debt Yield, Cut-off Date LTV Ratio and LTV Ratio at Maturity or ARD based on the Walmart Shadow Anchored Portfolio Whole Loan and the Walmart Shadow Anchored Portfolio Mezzanine Loan (as defined below) in the aggregate were $110.77, 1.17x, 8.5%, 82.3% and 79.2%, respectively. |
| (4) | See “Escrows” section. |
| (5) | The Walmart Shadow Anchored Portfolio Whole Loan is secured by the leasehold interests in two of the Walmart Shadow Anchored Portfolio Properties (as defined below) and by the fee interests in the remaining 32 Walmart Shadow Anchored Portfolio Properties. See “Ground Lease” section. |
| (6) | See “Appraisals” section. |
The Mortgage Loan.The mortgage loan (the “Walmart Shadow Anchored Portfolio Mortgage Loan”) is part of a whole loan (the “Walmart Shadow Anchored Portfolio Whole Loan”) that is evidenced by twopari passu promissory notes (Notes A-1 and A-2) and secured by a first mortgage encumbering the fee (or, in 2 cases, the leasehold) interests in 34 retail properties, each shadow anchored by Walmart, across 14 states (the “Walmart Shadow Anchored Portfolio Properties”). The Walmart Shadow Anchored Portfolio Whole Loan was originated on September 1, 2016 by Ladder Capital Finance LLC. The Walmart Shadow Anchored Portfolio Whole Loan had an original principal balance of $89,036,250, has an outstanding principal balance as of the Cut-off Date of $89,036,250 and accrues interest at an interest rate of 5.5898%per annum. The Walmart Shadow Anchored Portfolio Whole Loan had an initial term of 60 months, has a remaining term of 57 months as of the Cut-off Date and requires interest-only payments for the first 24 payments following origination and, thereafter, requires payments of principal and interest based on a 30-year amortization schedule. The Walmart Shadow Anchored Portfolio Whole Loan matures on September 6, 2021.
Note A-1, which will be contributed to the WFCM 2016-LC25 Trust, had an original principal balance of $49,500,000, has an outstanding principal balance as of the Cut-off Date of $49,500,000 and represents the controlling interest in the Walmart Shadow Anchored Portfolio Whole Loan. The non-controlling Note A-2, with an original principal balance of $39,536,250, is expected to be
THE INFORMATION IN THIS STRUCTURAL AND COLLATERAL TERM SHEET IS NOT COMPLETE AND MAY BE AMENDED PRIOR TO THE TIME OF SALE. THIS TERM SHEET IS NOT AN OFFER TO SELL THESE SECURITIES AND IT IS NOT A SOLICITATION OF AN OFFER TO BUY THESE SECURITIES IN ANY JURISDICTION WHERE THE OFFER OR SALE IS NOT PERMITTED.
14
| WALMART SHADOW ANCHORED PORTFOLIO |
contributed to one or more future trusts. The mortgage loan evidenced by Note A-2 is referred to herein as the “Walmart Shadow Anchored Companion Loan”. The lender provides no assurances that Note A-2 will not be split further. See“Description of the Mortgage Pool—The Whole Loans—The Serviced Whole Loans” in the Preliminary Prospectus.
Pari Passu Note Summary
| Original Balance | Note Holder | Controlling Piece | ||
| Note A-1 | $49,500,000 | WFCM 2016-LC25 | Yes | |
| Note A-2 | $39,536,250 | Ladder Capital Finance | No | |
| Total | $89,036,250 |
Following the lockout period, the borrower has the right to defease the Walmart Shadow Anchored Portfolio Whole Loan in whole but not in part, on any due date before May 6, 2021. In addition, the Walmart Shadow Anchored Portfolio Whole Loan is prepayable without penalty commencing on May 6, 2021.
Sources and Uses
| Sources | Uses | |||||||||
| Original Whole Loan amount | $89,036,250 | 91.2 | % | Loan payoff(1) | $89,698,349 | 91.9 | % | |||
| Mezzanine Loan | 8,613,750 | 8.8 | Reserves | 2,038,365 | 2.1 | |||||
| Closing costs | 1,464,686 | 1.5 | ||||||||
| Return of equity | 4,448,600 | 4.6 | ||||||||
| Total Sources | $97,650,000 | 100.0 | % | Total Uses | $97,650,000 | 100.0 | % |
| (1) | Seven of the Walmart Shadow Anchored Portfolio Properties were previously securitized in the CSMS 2007-C1 transaction. The remainder of the properties were securitized in the CSMC 2006-C3 and CSMC 2006-C4 transactions but were not directly paid off by the Walmart Shadow Anchored Portfolio Whole loan. |
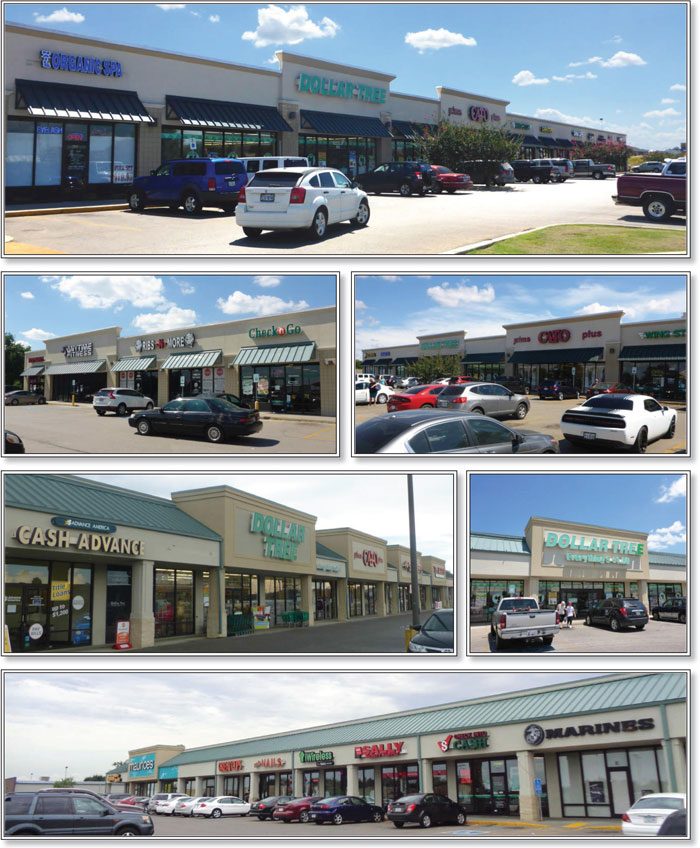
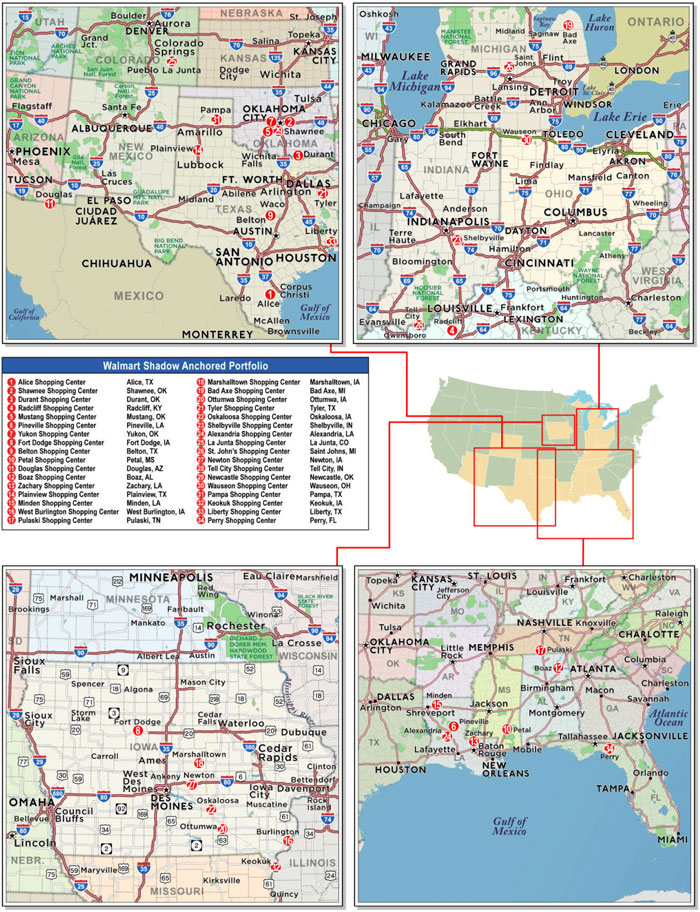
The Properties.The Walmart Shadow Anchored Portfolio Properties consist of 34 retail properties, each shadow anchored by Walmart, comprised of approximately 881,524 rentable square feet that were built between 2002 and 2006 and are located in 14 states. The related borrowers hold leasehold interests in two of the Walmart Shadow Anchored Portfolio Properties (see “Ground Lease” section) and fee interests in the remaining 32 Walmart Shadow Anchored Portfolio Properties. No property accounts for more than 5.3% of allocated Cut-off Date Principal Balance. Since 2006, the Walmart Shadow Anchored Portfolio Properties have never been below 91.0% occupied. The Walmart Shadow Anchored Portfolio Properties range in size from 10,060 square feet to 39,100 square feet and were 93.1% occupied as of October 31, 2016.
THE INFORMATION IN THIS STRUCTURAL AND COLLATERAL TERM SHEET IS NOT COMPLETE AND MAY BE AMENDED PRIOR TO THE TIME OF SALE. THIS TERM SHEET IS NOT AN OFFER TO SELL THESE SECURITIES AND IT IS NOT A SOLICITATION OF AN OFFER TO BUY THESE SECURITIES IN ANY JURISDICTION WHERE THE OFFER OR SALE IS NOT PERMITTED.
15
| WALMART SHADOW ANCHORED PORTFOLIO |
The following table presents certain information relating to the Walmart Shadow Anchored Portfolio Properties:
| Property Name | City, State | Allocated Cut-off Date Principal Balance | % of Portfolio Cut-off Date Principal Balance | Occupancy | Year Built/ Renovated | Net Rentable Area (SF) | Appraised Value | Allocated LTV |
| Alice Shopping Center | Alice, TX | $4,763,000 | 5.3% | 91.8% | 2005/NAP | 39,100 | $6,100,000 | 78.1% |
| Shawnee Shopping Center | Shawnee, OK | $4,186,000 | 4.7% | 100.0% | 2004/NAP | 35,640 | $5,360,000 | 78.1% |
| Durant Shopping Center | Durant, OK | $3,834,000 | 4.3% | 100.0% | 2003/2012 | 32,200 | $4,910,000 | 78.1% |
| Radcliff Shopping Center | Radcliff, KY | $3,819,000 | 4.3% | 84.8% | 2005/NAP | 36,900 | $4,890,000 | 78.1% |
| Mustang Shopping Center | Mustang, OK | $3,647,000 | 4.1% | 100.0% | 2004/NAP | 35,849 | $4,670,000 | 78.1% |
| Pineville Shopping Center | Pineville, LA | $3,639,000 | 4.1% | 100.0% | 2002/NAP | 32,300 | $4,660,000 | 78.1% |
| Yukon Shopping Center | Yukon, OK | $3,621,000 | 4.1% | 100.0% | 2004/NAP | 31,500 | $4,560,000 | 79.4% |
| Fort Dodge Shopping Center | Fort Dodge, IA | $3,491,000 | 3.9% | 95.3% | 2004/NAP | 33,700 | $4,470,000 | 78.1% |
| Belton Shopping Center | Belton, TX | $3,389,000 | 3.8% | 100.0% | 2005/NAP | 28,052 | $4,340,000 | 78.1% |
| Petal Shopping Center | Petal, MS | $3,183,000 | 3.6% | 84.8% | 2003/NAP | 30,180 | $4,100,000 | 77.6% |
| Douglas Shopping Center | Douglas, AZ | $3,183,000 | 3.6% | 93.8% | 2004/NAP | 32,140 | $4,100,000 | 77.6% |
| Boaz Shopping Center | Boaz, AL | $3,077,000 | 3.5% | 88.5% | 2004/NAP | 27,900 | $3,940,000 | 78.1% |
| Zachary Shopping Center | Zachary, LA | $3,065,000 | 3.4% | 100.0% | 2002/NAP | 29,600 | $3,925,000 | 78.1% |
| Plainview Shopping Center | Plainview, TX | $2,875,000 | 3.2% | 72.3% | 2005/NAP | 31,720 | $4,510,000 | 63.7% |
| Minden Shopping Center | Minden, LA | $2,796,000 | 3.1% | 95.6% | 2003/NAP | 27,300 | $3,580,000 | 78.1% |
| West Burlington Shopping Center | West Burlington, IA | $2,522,000 | 2.8% | 100.0% | 2004/NAP | 26,100 | $3,230,000 | 78.1% |
| Pulaski Shopping Center | Pulaski, TN | $2,430,000 | 2.7% | 100.0% | 2004/NAP | 28,100 | $3,600,000 | 67.5% |
| Marshalltown Shopping Center | Marshalltown, IA | $2,422,000 | 2.7% | 87.8% | 2004/NAP | 22,900 | $3,140,000 | 77.1% |
| Bad Axe Shopping Center | Bad Axe, MI | $2,382,000 | 2.7% | 100.0% | 2005/NAP | 28,353 | $3,050,000 | 78.1% |
| Ottumwa Shopping Center | Ottumwa, IA | $2,307,000 | 2.6% | 91.9% | 2004/NAP | 22,190 | $3,380,000 | 68.3% |
| Tyler Shopping Center | Tyler, TX | $2,286,250 | 2.6% | 85.9% | 2004/NAP | 35,840 | $3,580,000 | 63.9% |
| Oskaloosa Shopping Center | Oskaloosa, IA | $2,249,000 | 2.5% | 100.0% | 2004/NAP | 20,700 | $2,880,000 | 78.1% |
| Shelbyville Shopping Center | Shelbyville, IN | $2,187,000 | 2.5% | 100.0% | 2005/NAP | 14,150 | $2,800,000 | 78.1% |
| Alexandria Shopping Center | Alexandria, LA | $2,090,000 | 2.3% | 92.2% | 2003/NAP | 20,400 | $2,690,000 | 77.7% |
| La Junta Shopping Center | La Junta, CO | $2,085,000 | 2.3% | 100.0% | 2004/NAP | 20,500 | $2,670,000 | 78.1% |
| St. John’s Shopping Center | Saint Johns, MI | $2,040,000 | 2.3% | 74.0% | 2006/NAP | 29,930 | $3,400,000 | 60.0% |
| Newton Shopping Center | Newton, IA | $2,008,000 | 2.3% | 88.2% | 2004/NAP | 20,300 | $2,610,000 | 76.9% |
| Tell City Shopping Center | Tell City, IN | $1,952,000 | 2.2% | 82.2% | 2005/NAP | 27,000 | $2,740,000 | 71.2% |
| Newcastle Shopping Center | Newcastle, OK | $1,577,000 | 1.8% | 100.0% | 2004/NAP | 11,600 | $2,020,000 | 78.1% |
| Wauseon Shopping Center | Wauseon, OH | $1,406,000 | 1.6% | 100.0% | 2005/NAP | 13,100 | $1,800,000 | 78.1% |
| Pampa Shopping Center | Pampa, TX | $1,374,000 | 1.5% | 100.0% | 2005/NAP | 16,160 | $1,760,000 | 78.1% |
| Keokuk Shopping Center | Keokuk, IA | $1,203,000 | 1.4% | 100.0% | 2004/NAP | 10,160 | $1,540,000 | 78.1% |
| Liberty Shopping Center | Liberty, TX | $1,029,000 | 1.2% | 67.9% | 2006/NAP | 14,960 | $1,960,000 | 52.5% |
| Perry Shopping Center | Perry, FL | $919,000 | 1.0% | 100.0% | 2004/NAP | 15,000 | $1,750,000 | 52.5% |
| Total/Weighted Average | $89,036,250 | 100.0% | 93.1% | 881,524 | $118,715,000 | 75.0% |
The following table presents certain information relating to the tenancies at the Walmart Shadow Anchored Portfolio Properties (based on the portfolio in its entirety):
Major Tenants
| Tenant Name | Credit Rating /S&P)(1) | Tenant NRSF | % of NRSF | Annual U/W Base Rent PSF | Annual U/W Base Rent | % of Total Annual U/W Base Rent | Lease Expiration Date | |
| Major Tenants | ||||||||
| Dollar Tree | NR/Ba2/BB+ | 245,426 | 27.8% | $8.22 | $2,017,160 | 20.8% | Various(2) | |
| Cato’s | NR/NR/NR | 79,910 | 9.1% | $11.34 | $906,555 | 9.3% | Various(2) | |
| Gamestop | NR/Ba1/BB+ | 45,503 | 5.2% | $16.90 | $769,216 | 7.9% | Various(2) | |
| Shoe Show | NR/NR/NR | 41,500 | 4.7% | $10.48 | $434,775 | 4.5% | Various(2) | |
| Sally Beauty | NR/NR/NR | 26,950 | 3.1% | $13.99 | $377,128 | 3.9% | Various(2) | |
| Total Major Tenants | 439,289 | 49.8% | $10.25 | $4,504,834 | 46.4% | |||
| Non-Major Tenants | 380,990 | 43.2% | $13.66 | $5,203,573 | 53.6% | |||
| Occupied Collateral Total | 820,279 | 93.1% | $11.84 | $9,708,407 | 100.0% | |||
| Vacant Space | 61,245 | 6.9% | ||||||
| Collateral Total | 881,524 | 100.0% | ||||||
| (1) | Certain ratings are those of the parent company whether or not the parent guarantees the lease. |
| (2) | See Annex A-1 to the Preliminary Prospectus for detailed information on lease expiration of individual properties. |
THE INFORMATION IN THIS STRUCTURAL AND COLLATERAL TERM SHEET IS NOT COMPLETE AND MAY BE AMENDED PRIOR TO THE TIME OF SALE. THIS TERM SHEET IS NOT AN OFFER TO SELL THESE SECURITIES AND IT IS NOT A SOLICITATION OF AN OFFER TO BUY THESE SECURITIES IN ANY JURISDICTION WHERE THE OFFER OR SALE IS NOT PERMITTED.
16
| WALMART SHADOW ANCHORED PORTFOLIO |
Historical Sales (PSF) and Occupancy Costs(1)
| Tenant Name | 2013 | 2014 | 2015 | Current Occupancy Cost(2) |
| Dollar Tree | $102 | $105 | $109 | 7.5% |
| Cato’s | $163 | $167 | $166 | 6.8% |
| Shoe Show | $115 | $118 | $97 | 10.1% |
| Sally Beauty | $228 | $236 | $245 | 3.9% |
| (1) | Historical Sales (PSF) and Occupancy Costs were provided by the borrower. Chart includes only tenants who have reported full sales for each respective year. |
| (2) | Current Occupancy Costs are based on the Annual U/W Base Rent and reimbursements and the most recent available historical sales. |
The following table presents certain information relating to the lease rollover schedule at the Walmart Shadow Anchored Portfolio Properties:
Lease Expiration Schedule(1)(2)
Year Ending December 31, | No. of Leases Expiring | Expiring NRSF | % of Total NRSF | Cumulative Expiring NRSF | Cumulative % of Total NRSF | Annual U/W Base Rent | % of Total Annual U/W Base Rent | Annual U/W Base Rent PSF(3) |
| MTM | 7 | 12,500 | 1.4% | 12,500 | 1.4% | $155,500 | 1.6% | $12.44 |
| 2016 | 3 | 7,600 | 0.9% | 20,100 | 2.3% | $85,600 | 0.9% | $11.26 |
| 2017 | 52 | 119,310 | 13.5% | 139,410 | 15.8% | $1,602,251 | 16.5% | $13.43 |
| 2018 | 60 | 171,759 | 19.5% | 311,169 | 35.3% | $2,106,097 | 21.7% | $12.26 |
| 2019 | 55 | 188,860 | 21.4% | 500,029 | 56.7% | $2,093,540 | 21.6% | $11.09 |
| 2020 | 45 | 142,392 | 16.2% | 642,421 | 72.9% | $1,727,315 | 17.8% | $12.13 |
| 2021 | 33 | 111,170 | 12.6% | 753,591 | 85.5% | $1,254,114 | 12.9% | $11.28 |
| 2022 | 2 | 3,200 | 0.4% | 756,791 | 85.9% | $38,400 | 0.4% | $12.00 |
| 2023 | 6 | 26,888 | 3.1% | 783,679 | 88.9% | $314,380 | 3.2% | $11.69 |
| 2024 | 3 | 24,200 | 2.7% | 807,879 | 91.6% | $214,950 | 2.2% | $8.88 |
| 2025 | 0 | 0 | 0.0% | 807,879 | 91.6% | $0 | 0.0% | $0.00 |
| 2026 | 3 | 11,200 | 1.3% | 819,079 | 92.9% | $105,196 | 1.1% | $9.39 |
| Thereafter | 1 | 1,200 | 0.1% | 820,279 | 93.1% | $11,064 | 0.1% | $9.22 |
| Vacant | 0 | 61,245 | 6.9% | 881,524 | 100.0% | $0 | 0.0% | $0.00 |
| Total/Weighted Average | 270 | 881,524 | 100.0% | $9,708,407 | 100.0% | $11.84 |
| (1) | Information obtained from the underwritten rent roll. |
| (2) | Certain tenants may have lease termination options that are exercisable prior to the originally stated expiration date of the subject lease and that are not considered in the Lease Expiration Schedule. |
| (3) | Weighted Average Annual U/W Base Rent PSF excludes vacant space. |
The following table presents historical occupancy percentages at the Walmart Shadow Anchored Portfolio Properties:
Historical Occupancy
12/31/2012(1) | 12/31/2013(2) | 12/31/2014(2) | 12/31/2015(2) | 10/31/2016(3) | ||||
| 93.9% | 92.1% | 92.2% | 93.4% | 93.1% |
| (1) | Information obtained from a third party source. |
| (2) | Information obtained from the borrower. |
| (3) | Information obtained from the underwritten rent roll. |
THE INFORMATION IN THIS STRUCTURAL AND COLLATERAL TERM SHEET IS NOT COMPLETE AND MAY BE AMENDED PRIOR TO THE TIME OF SALE. THIS TERM SHEET IS NOT AN OFFER TO SELL THESE SECURITIES AND IT IS NOT A SOLICITATION OF AN OFFER TO BUY THESE SECURITIES IN ANY JURISDICTION WHERE THE OFFER OR SALE IS NOT PERMITTED.
17
| WALMART SHADOW ANCHORED PORTFOLIO |
Operating History and Underwritten Net Cash Flow. The following table presents certain information relating to the historical operating performance and underwritten net cash flow at the Walmart Shadow Anchored Portfolio Properties:
Cash Flow Analysis
| 2013 | 2014 | 2015 | TTM 6/30/2016 | U/W | % of U/W Effective Gross Income | U/W $ per SF | |||||||
| Base Rent | $8,657,624 | $9,058,380 | $9,288,461 | $9,423,033 | $9,708,407 | 77.0% | $11.01 | ||||||
| Grossed Up Vacant Space | 0 | 0 | 0 | 0 | $903,439 | 7.2 | 1.02 | ||||||
| Total Reimbursables | 2,539,364 | 2,655,932 | 2,787,371 | 2,842,337 | 2,842,337 | 22.6 | 3.22 | ||||||
| Other Income | 691,995 | 504,250 | 199,885 | 52,648 | 52,648 | 0.4 | 0.06 | ||||||
| Less Vacancy & Credit Loss | 0 | 0 | 0 | 0 | (903,439)(1) | (7.2) | (1.02) | ||||||
| Effective Gross Income | $11,888,983 | $12,218,562 | $12,275,717 | $12,318,018 | $12,603,392 | 100.0% | $14.30 | ||||||
| Total Operating Expenses | $3,221,526 | $3,183,015 | $3,230,236 | $3,267,630 | $3,145,985 | 25.0% | $3.57 | ||||||
| Net Operating Income | $8,667,457 | $9,035,547 | $9,045,481 | $9,050,388 | $9,457,407 | 75.0% | $10.73 | ||||||
| TI/LC | 0 | 0 | 0 | 0 | 969,678 | 7.7 | 1.10 | ||||||
| Capital Expenditures | 0 | 0 | 0 | 0 | 176,305 | 1.4 | 0.20 | ||||||
| Net Cash Flow | $8,667,457 | $9,035,547 | $9,045,481 | $9,050,388 | $8,311,424 | 65.9% | $9.43 | ||||||
| NOI DSCR(2) | 1.41x | 1.47x | 1.48x | 1.48x | 1.54x | ||||||||
| NCF DSCR(2) | 1.41x | 1.47x | 1.48x | 1.48x | 1.36x | ||||||||
| NOI DY(2) | 9.7% | 10.1% | 10.2% | 10.2% | 10.6% | ||||||||
| NCF DY(2) | 9.7% | 10.1% | 10.2% | 10.2% | 9.3% |
| (1) | Underwritten economic vacancy is 6.9%. The Walmart Shadow Anchored Properties were 93.1% physically occupied as of October 31, 2016. |
| (2) | The debt service coverage ratios and debt yields are based on the Walmart Shadow Anchored Portfolio Whole Loan. |
Appraisals.As of the appraisal valuation dates ranging from July 12, 2016 to July 30, 2016, the Walmart Shadow Anchored Portfolio Properties had an aggregate “as-is” appraised value of $118,715,000.
The Borrowers. The borrowers are: SFP Pool One Shopping Centers L.P.; SFP Pool Two Shopping Centers L.P.; SFP Pool Three Shopping Centers L.P.; SFP Pool Four Shopping Centers L.P.; and SFP Pool Five Shopping Centers L.P. Each of the borrowers is a Delaware limited liability company and single purpose entity with two independent directors. Legal counsel to the borrowers delivered a non-consolidation opinion in connection with the origination of the Walmart Shadow Anchored Portfolio Whole Loan. David W. Schostak is the guarantor of certain nonrecourse carveouts under the Walmart Shadow Anchored Portfolio Whole Loan.
The Sponsor. The sponsor is David W. Schostak, who is the co-CEO of Schostak Brothers & Company with his brother Robert Schostak. The Schostaks are a fourth generation real estate family that has been involved in Michigan development, acquisitions, and leasing of retail, office, industrial, residential, and mixed use projects for over 100 years. Mr. Schostak’s current activities include joint ventures, build-to-suit projects, mixed-use developments and a variety of necessity-based retail and open air centers in 24 states. The Schostak family’s portfolio now includes over 100 restaurants including Applebee’s, Del Tacos, MOD Pizzas and Olga’s Kitchens.
The sponsor was involved in three defaults, one loan modification and one discounted payoff for loans he was a sponsor. See “Description of the Mortgage Pool—Loan Purpose; Default History, Bankruptcy Issues and Other Proceedings” in the Preliminary Prospectus.
Escrows.The loan documents provide for upfront reserves in the amount of $682,795 for real estate taxes, $150,051 for insurance, $850,000 for upfront tenant improvements and leasing commissions, $218,304 for deferred maintenance, $129,000 for an engineering reserve, and $8,216 for future ground rent payments. The loan documents also require monthly deposits in an amount equal to one-twelfth of the estimated annual real estate taxes and insurance premiums, which currently equate to $136,559 and $12,504, respectively, $14,692 for replacement reserves (capped at $528,915), and $80,806 for tenant improvements and leasing commissions (capped at $2,909,034).
Lockbox and Cash Management.The Walmart Shadow Anchored Portfolio Whole Loan documents require a lender-controlled lockbox account, which is already in place, and that the borrowers direct tenants to pay their rents directly into such lockbox account. The loan documents also require that all rents received by the borrowers or the property manager will be deposited into the lockbox account within two business days of receipt. Prior to a Sweep Event Period (as defined below), all excess cash flow will be disbursed to the related borrower. Upon a Sweep Event Period, excess cash flow will be held by the lender.
A “Sweep Event Period” will commence upon the earlier of (i) an event of default occurs under the loan documents or the property management agreement, (ii) the aggregate amortizing debt service coverage ratio for the Walmart Shadow Anchored Portfolio
THE INFORMATION IN THIS STRUCTURAL AND COLLATERAL TERM SHEET IS NOT COMPLETE AND MAY BE AMENDED PRIOR TO THE TIME OF SALE. THIS TERM SHEET IS NOT AN OFFER TO SELL THESE SECURITIES AND IT IS NOT A SOLICITATION OF AN OFFER TO BUY THESE SECURITIES IN ANY JURISDICTION WHERE THE OFFER OR SALE IS NOT PERMITTED.
18
| WALMART SHADOW ANCHORED PORTFOLIO |
Properties falls below 1.05x at any time and/or (iii) any tenant occupying (physical or economic) more than 10.0% of the entire Walmart Shadow Anchored Portfolio Properties files or bankruptcy, becomes insolvent, or goes dark in the majority of its locations.
Property Management.The Walmart Shadow Anchored Portfolio Properties are managed by an affiliate of the sponsor.
Assumption.The borrower has the right to transfer the Walmart Shadow Anchored Portfolio Properties, provided that no event of default has occurred and is continuing and certain other conditions are satisfied, including (i) the lender’s reasonable determination that the proposed transferee and guarantor satisfy the lender’s credit review and underwriting standards, taking into consideration transferee experience, financial strength and general business standing; (ii) execution of a recourse guaranty and an environmental indemnity by an affiliate of the transferee; and (iii) if requested by the lender, rating agency confirmation from DBRS, Fitch, Moody’s, and Morningstar that the transfer will not result in a downgrade, withdrawal or qualification of the respective ratings assigned to the Series 2016-LC25 certificates and similar confirmations from each rating agency rating any securities backed by the Walmart Shadow Anchored Portfolio Companion Loan with respect to the ratings of such securities.
Partial Release.Not permitted.
Real Estate Substitution.Not permitted.
Subordinate and Mezzanine Indebtedness.Ladder Capital Finance LLC (the “Walmart Shadow Anchored Portfolio Mezzanine Lender”) funded an $8,613,750 mezzanine loan (the “Walmart Shadow Anchored Portfolio Mezzanine Loan”) to SFP LP Holdco L.P. and SFP GP Holdco LLC, each a Delaware limited liability company and the sole member of each borrower under the Walmart Shadow Anchored Portfolio Whole Loan (the “Walmart Shadow Anchored Portfolio Mezzanine Borrower”). The Walmart Shadow Anchored Portfolio Mezzanine Loan is secured by a pledge of the Walmart Shadow Anchored Portfolio Mezzanine Loan Borrowers’ interest in the borrowers under the Walmart Shadow Anchored Portfolio Whole Loan. The Walmart Shadow Anchored Portfolio Mezzanine Loan accrues interest at an interest rate of 11.000%per annum and requires payments of principal and interest based on a 30-year amortization schedule. The Walmart Shadow Anchored Mezzanine Loan matures on September 6, 2021. The rights of The Walmart Shadow Anchored Mezzanine Lender are further described under“Description of the Mortgage Pool–Additional Indebtedness—Mezzanine Indebtedness”in the Preliminary Prospectus.
Ground Lease. Two of the Walmart Shadow Anchored Portfolio Properties are subject to ground leases: (i) the Tyler Shopping Center property is subject to a ground lease with Jack and Peggy Waldie as ground lessor that expires on April 26, 2024 with 15 five-year ground lease extension options, each with $5,000 rent increases; and (ii) the Pulaski Shopping Center property is subject to a ground lease with Wakefield Realty, LLC as ground lessor that expires on October 31, 2023 with 15 five-year ground lease extension options, each with 5% rent increases. See “Description of the Mortgage Pool—Mortgage Pool Characteristics—Fee & Leasehold Estates; Ground Leases” in the Preliminary Prospectus.
I. Terrorism Insurance.The loan documents require that the “all risk” insurance policy required to be maintained by the borrower provide coverage for terrorism in an amount equal to the full replacement cost of the Walmart Shadow Anchored Portfolio Properties. The loan documents also require business interruption insurance provide coverage for no less than the 24-month period following the occurrence of a casualty event, together with a six-month extended period of indemnity.
II.
Windstorm Insurance.The loan documents require windstorm insurance covering the full replacement cost of the Walmart Shadow Anchored Portfolio Properties during the loan term. At the time of closing, the Walmart Shadow Anchored Portfolio Properties had windstorm insurance coverage.
THE INFORMATION IN THIS STRUCTURAL AND COLLATERAL TERM SHEET IS NOT COMPLETE AND MAY BE AMENDED PRIOR TO THE TIME OF SALE. THIS TERM SHEET IS NOT AN OFFER TO SELL THESE SECURITIES AND IT IS NOT A SOLICITATION OF AN OFFER TO BUY THESE SECURITIES IN ANY JURISDICTION WHERE THE OFFER OR SALE IS NOT PERMITTED.
19
| MARRIOTT HILTON HEAD RESORT & SPA |

THE INFORMATION IN THIS STRUCTURAL AND COLLATERAL TERM SHEET IS NOT COMPLETE AND MAY BE AMENDED PRIOR TO THE TIME OF SALE. THIS TERM SHEET IS NOT AN OFFER TO SELL THESE SECURITIES AND IT IS NOT A SOLICITATION OF AN OFFER TO BUY THESE SECURITIES IN ANY JURISDICTION WHERE THE OFFER OR SALE IS NOT PERMITTED.
20
| MARRIOTT HILTON HEAD RESORT & SPA |
THE INFORMATION IN THIS STRUCTURAL AND COLLATERAL TERM SHEET IS NOT COMPLETE AND MAY BE AMENDED PRIOR TO THE TIME OF SALE. THIS TERM SHEET IS NOT AN OFFER TO SELL THESE SECURITIES AND IT IS NOT A SOLICITATION OF AN OFFER TO BUY THESE SECURITIES IN ANY JURISDICTION WHERE THE OFFER OR SALE IS NOT PERMITTED.
21
| No. 3 – Marriott Hilton Head Resort & Spa | ||||||||
| Loan Information | Property Information | |||||||
| Mortgage Loan Seller: | Rialto Mortgage Finance, LLC | Single Asset/Portfolio: | Single Asset | |||||
| Credit Assessment (DBRS/Fitch/Moody’s/Morningstar): | NR/NR/NR/NR | Property Type: | Hospitality | |||||
| Original Principal Balance(1): | $43,000,000 | Specific Property Type: | Full Service | |||||
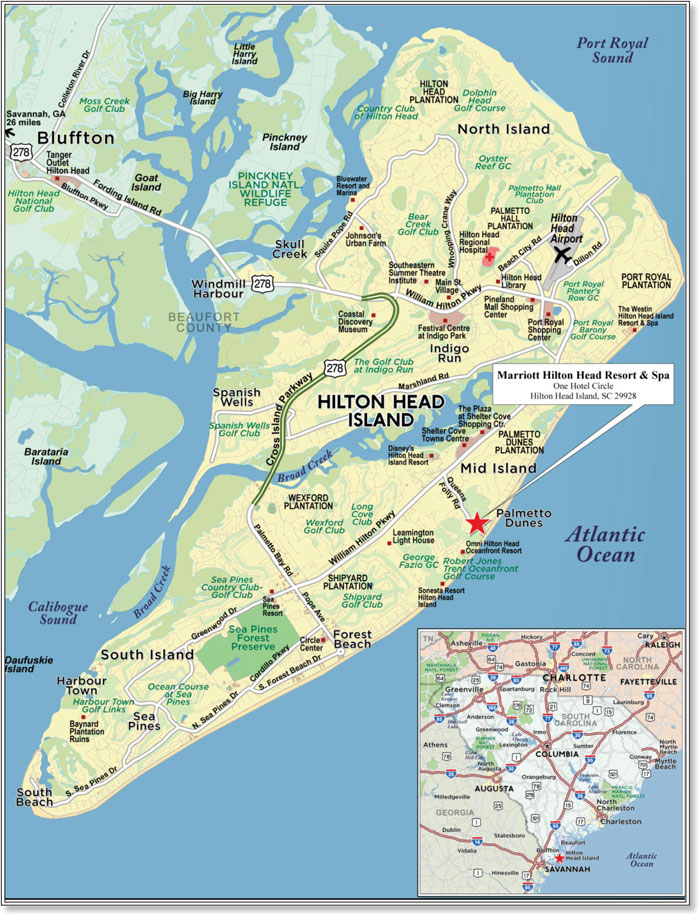
| Cut-off Date Balance(1): | $42,859,454 | Location: | Hilton Head Island, SC | |||||
| % of Initial Pool Balance: | 4.5% | Size: | 513 Rooms | |||||
| Loan Purpose: | Refinance | Cut-off Date
Balance Per Room(1):
| $190,409 | |||||
| Borrower Name: | Columbia Properties Hilton Head, LLC | Year Built/Renovated: | 1976/2015 | |||||
| Sponsors: | Columbia Sussex Corporation; CSC Holdings, LLC | Title Vesting: | Fee | |||||
| Mortgage Rate: | 4.920% | Property Manager: | Self-managed | |||||
| Note Date: | October 3, 2016 | 4thMost Recent Occupancy (As of): | 58.8% (12/31/2012) | |||||
| Anticipated Repayment Date: | NAP | 3rdMost Recent Occupancy (As of): | 58.7% (12/31/2013) | |||||
| Maturity Date: | October 6, 2026 | 2ndMost Recent Occupancy (As of): | 58.0% (12/31/2014) | |||||
| IO Period: | None | Most Recent Occupancy (As of): | 57.6% (12/31/2015) | |||||
| Loan Term (Original): | 120 months | Current Occupancy (As of): | 59.2% (8/31/2016) | |||||
| Seasoning: | 2 months | |||||||
| Amortization Term (Original): | 300 months | Underwriting and Financial Information: | ||||||
| Loan Amortization Type: | Amortizing Balloon | 4thMost Recent NOI (As of): | $10,285,001 (12/31/2013) | |||||
| Interest Accrual Method: | Actual/360 | 3rdMost Recent NOI (As of): | $9,679,146 (12/31/2014) | |||||
| Call Protection: | L(26),D(90),O(4) | 2ndMost Recent NOI (As of)(3): | $10,387,728 (12/31/2015) | |||||
| Lockbox Type: | Hard/Springing Cash Management | Most Recent NOI (As of)(3): | $11,792,589 (TTM 8/31/2016) | |||||
| Additional Debt(1): | Yes | |||||||
| Additional Debt Type(1): | Pari Passu | U/W Revenues: | $33,338,474 | |||||
| U/W Expenses: | $21,646,100 | |||||||
| U/W NOI: | $11,692,374 | |||||||
| U/W NCF: | $10,025,450 | |||||||
| U/W NOI DSCR(1): | 1.71x | |||||||
| Escrows and Reserves(2): | U/W NCF DSCR(1): | 1.47x | ||||||
| U/W NOI Debt Yield(1): | 12.0% | |||||||
| Type: | Initial | Monthly | Cap (If Any) | U/W NCF Debt Yield(1): | 10.3% | |||
| Taxes | $1,037,750 | $98,833 | NAP | As-Is Appraised Value: | $163,500,000 | |||
| Insurance | $203,170 | $32,249 | NAP | As-Is Appraisal Valuation Date: | August 30, 2016 | |||
| FF&E Reserve | $0 | $138,910 | NAP | Cut-off Date LTV Ratio(1): | 59.7% | |||
| Seasonality Reserve | $3,630,000 | Springing | $3,630,000 | LTV Ratio at Maturity or ARD(1): | 44.7% | |||
| (1) | See “The Mortgage Loan” section. All statistical financial information related to balances per room, loan-to-value ratios, debt service coverage ratios and debt yield are based on the Marriott Hilton Head Resort & Spa Whole Loan. |
| (2) | See “Escrows” section. |
| (3) | See “Cash Flow Analysis” section. |
The Mortgage Loan. The mortgage loan (the “Marriott Hilton Head Resort & Spa Mortgage Loan”) is part of a loan combination (the “Marriott Hilton Head Resort & Spa Whole Loan”) that is evidenced by sixpari passu promissory notes (A-1, A-2A, A-2B, A-3A, A-3B and A-4) that are secured by a first mortgage encumbering a full service hotel property located in Hilton Head Island, South Carolina (the “Marriott Hilton Head Resort & Spa Property”). The Marriott Hilton Head Resort & Spa Whole Loan was co-originated on October 3, 2016 by Rialto Mortgage Finance, LLC and Citigroup Global Markets Realty Corp. The Marriott Hilton Head Resort & Spa Whole Loan had an original principal balance of $98,000,000, has an outstanding principal balance as of the Cut-off Date of $97,679,686 and accrues interest at an interest rate of 4.920%per annum. The Marriott Hilton Head Resort & Spa Whole Loan had an initial term of 120 months, has a remaining term of 118 months as of the Cut-off Date and requires payments of principal and interest based on a 25-year amortization schedule. The Marriott Hilton Head Resort & Spa Whole Loan matures on October 6, 2026.
The Marriott Hilton Head Resort & Spa Mortgage Loan evidenced by Note A-1, which represents a controlling interest in the Marriott Hilton Head Resort & Spa Whole Loan and will be contributed to the WFCM 2015-LC25 Trust. The Marriott Hilton Head Resort & Spa Mortgage Loan had an original principal balance of $43,000,000 and has an outstanding principal balance as of the Cut-off Date of $42,859,454. The non-controlling Notes A-2A, A-2B, A-3A, A-3B and A-4 (the “Marriott Hilton Head Resort & Spa Companion Loans”) had an aggregate original principal balance of $55,000,000. Notes A-2B and A-4 are expected to be contributed to the CGCMT 2016-C3 Trust. Notes A-2A, A-3A and A-3B are expected to be contributed to one or more future securitizations; however, the lender provides no assurances that any non-securitizedparipassu note will not be split further. See “Description of the Mortgage Pool – The Whole Loans – The Serviced Whole Loans – The Marriott Hilton Head Resort & Spa Whole Loan” in the Preliminary Prospectus.
THE INFORMATION IN THIS STRUCTURAL AND COLLATERAL TERM SHEET IS NOT COMPLETE AND MAY BE AMENDED PRIOR TO THE TIME OF SALE. THIS TERM SHEET IS NOT AN OFFER TO SELL THESE SECURITIES AND IT IS NOT A SOLICITATION OF AN OFFER TO BUY THESE SECURITIES IN ANY JURISDICTION WHERE THE OFFER OR SALE IS NOT PERMITTED.
22
| MARRIOTT HILTON HEAD RESORT & SPA |
Pari Passu Note Summary
| Original Balance | Note Holder | Controlling Interest | ||
| Note A-1 | $43,000,000 | WFCM 2016-LC25 | Yes | |
| Notes A-2B, A-4 | $30,000,000 | CGCMT 2016-C3 | No | |
| Notes A-2A, A-3A, A-3B | $25,000,000 | Citigroup Global Markets Realty Corp. | No | |
| Total | $98,000,000 |
Following the lockout period, the borrower has the right to defease the Marriott Hilton Head Resort & Spa Whole Loan in whole, but not in part, on any date before July 6, 2026. In addition, the Marriott Hilton Head Resort & Spa Whole Loan is prepayable without penalty on or after July 6, 2026. The lockout period will expire on the earlier to occur of (i) two years after the closing date of the securitization that includes the last note to be securitized and (ii) November 6, 2019.
Sources and Uses
| Sources | Uses | |||||||
| Original whole loan amount | $98,000,000 | 87.6% | Loan Payoff(1) | $106,553,280 | 95.3% | |||
| Sponsor’s new cash contribution | 13,827,003 | 12.4 | Reserves | 4,870,920 | 4.4 | |||
| Closing costs | 402,803 | 0.4 | ||||||
| Total Sources | $111,827,003 | 100.0% | Total Uses | $111,827,003 | 100.0% |
| (1) | The Marriott Hilton Head Resort & Spa Property was previously securitized in the JPMCC 2007-CB18 transaction. |
The Property.The Marriott Hilton Head Resort & Spa Property is a 513-room full service hotel located in Hilton Head Island, South Carolina. The Marriott Hilton Head Resort & Spa Property is situated on 13.8 acres and is comprised of two buildings: a 10-story main tower that opened in 1976 and a 5-story south tower that opened in 1985. The Marriott Hilton Head Resort & Spa Property was initially branded as a Hyatt Hotel but was converted to a Marriott brand in 2001. According to the sponsors, during 2011 to mid-2016 approximately $9.2 million of capital was invested by the borrower. Upgrades and renovations included new LCD televisions in all guestrooms and the construction of nine new pool cabanas in 2012; upgrades to HVAC in 2013, and the most recent renovation was completed in 2014/2015, when all of the guestrooms were completely renovated along with public areas and meeting/banquet rooms. According to the sponsor, additional improvements are anticipated to be completed in the near-term, including corridor carpeting, which will be replaced in late 2016, while during 2017, the parking lot will be repaved and meeting rooms will be renovated. The Marriott Hilton Head Resort & Spa Property includes 568 parking spaces resulting in a parking ratio of 1.1 spaces per room. The parking operation allows for self-parking but also includes a valet service.
The Marriott Hilton Head Resort & Spa contains, 321 double queen guestrooms, 167 king guestrooms, 19 one-bedroom suites and six suites. Guestrooms offer either one king-sized bed or two queen beds with a pillow top mattress, sofa, oversized chair, desk, 32-inch flat screen television, in-room safe, coffee maker/tea service, two speaker phones with voicemail, high speed internet service (for a fee), and a mini refrigerator. The Marriott Hilton Head Resort & Spa Property features guestrooms on floors 3-10 within the main tower, and on all five floors of the south tower.
Resort amenities include three restaurants and two lounges, concierge services, full-service spa, fitness center, business center, indoor and outdoor heated pools, whirlpool, children’s pool, game room, retail shop, guest laundry room, and an outdoor patio deck. Additional services include beach rental services, including bicycles, beach umbrellas, and chairs, as well as other beach equipment. Food and beverage facilities include The Café (145 seats), which is located on the ground floor; Conroy’s Restaurant and Lounge (158 seats), which is located on the north side of the lobby level; Ocean Blu (170 seats), an outdoor restaurant by the pool; and Liquid (25 seats), an outdoor lounge by the pool. On the ground floor of the south tower, the Marriott Hilton Head Resort & Spa Property offers four meeting rooms, as well as two meeting rooms and two ballrooms on the lobby level. There is a total of 25,095 square feet of meeting space including the Leamington Grand Ballroom (17,600 square feet), which is divisible into 10 separate rooms, Sable Palm (3,960 square feet), Captain Jack Stoney (945 square feet), Bayley’s Barony (945 square feet), Lords Proprietors (459 square feet), Carolina Room (425 square feet), Palmetto Room (425 square feet) and the Dunes Room (336 square feet).
THE INFORMATION IN THIS STRUCTURAL AND COLLATERAL TERM SHEET IS NOT COMPLETE AND MAY BE AMENDED PRIOR TO THE TIME OF SALE. THIS TERM SHEET IS NOT AN OFFER TO SELL THESE SECURITIES AND IT IS NOT A SOLICITATION OF AN OFFER TO BUY THESE SECURITIES IN ANY JURISDICTION WHERE THE OFFER OR SALE IS NOT PERMITTED.
23
| MARRIOTT HILTON HEAD RESORT & SPA |
Operating History and Underwritten Net Cash Flow.The following table presents certain information relating to the historical operating performance and underwritten net cash flow at the Marriott Hilton Head Resort & Spa Property:
Cash Flow Analysis
| 2013(1) | 2014(1) | 2015(1) | TTM 8/31/2016(1) | U/W | % of U/W Total Revenue | U/W $ per Room | |
| Occupancy | 58.7% | 58.0% | 57.6% | 59.2% | 59.2% | ||
| ADR | $169.02 | $172.36 | $180.73 | $188.89 | $188.89 | ||
| RevPAR | $99.20 | $99.99 | $104.16 | $111.87 | $111.87 | ||
| Total Revenue | $29,563,995 | $29,483,856 | $31,403,350 | $33,429,812 | $33,338,474 | 100.0% | $64,987 |
| Total Department Expenses | 9,027,214 | 9,196,559 | 10,201,320 | 10,448,834 | 10,420,285 | 31.3 | 20,312 |
| Gross Operating Profit | $20,536,781 | $20,287,297 | $21,202,030 | $22,980,978 | $22,918,189 | 68.7% | $44,675 |
| Total Undistributed Expenses | 8,395,460 | 8,771,707 | 8,932,902 | 9,342,129 | 9,404,974 | 28.2 | 18,333 |
| Profit Before Fixed Charges | $12,141,321 | $11,515,590 | $12,269,128 | $13,638,849 | $13,513,214 | 40.5% | $26,342 |
| Total Fixed Charges | 1,856,320 | 1,836,444 | 1,881,400 | 1,846,261 | 1,820,840 | 5.5 | 3,549 |
| Net Operating Income | $10,285,001 | $9,679,146 | $10,387,728 | $11,792,589 | $11,692,374 | 35.1% | $22,792 |
| FF&E | 1,478,200 | 1,474,193 | 1,570,168 | 1,671,491 | 1,666,924 | 5.0 | 3,249 |
| Net Cash Flow | $8,806,802 | $8,204,953 | $8,817,561 | $10,121,098 | $10,025,450 | 30.1% | $19,543 |
| NOI DSCR | 1.51x | 1.42x | 1.52x | 1.73x | 1.71x | ||
| NCF DSCR | 1.29x | 1.20x | 1.29x | 1.48x | 1.47x | ||
| NOI DY | 10.5% | 9.9% | 10.6% | 12.1% | 12.0% | ||
| NCF DY | 9.0% | 8.4% | 9.0% | 10.4% | 10.3% | ||
| (1) | The sponsors completed approximately $7.9 million in renovations to 513 rooms in 2014 and 2015. |
Appraisal.As of the appraisal valuation date of August 30, 2016, the Marriott Hilton Head Resort & Spa Property had an “as-is” appraised value of $163,500,000.
Environmental Matters.According to a Phase I environmental assessment dated September 13, 2016, there was no evidence of any recognized environmental conditions at the Marriott Hilton Head Resort & Spa Property.
Market Overview and Competition.The Marriott Hilton Head Resort & Spa Property is located in Hilton Head Island, South Carolina, within the Hilton Head Island-Bluffton-Beaufort, South Carolina metropolitan statistical area. According to a government agency, the unemployment rate for the Hilton Head Island metropolitan statistical area was 5.1% as of June 2016. In comparison, the state of South Carolina unemployment rate was 5.6%, and the national unemployment rate was 4.9% for the same period. The Hilton Head Island metropolitan statistical area is the area consisting of the two southernmost counties in the Low country region of South Carolina, and includes the counties of Beaufort and Jasper. Hilton Head Island is located approximately 31.0 miles northeast of Savannah, Georgia, and 98.0 miles southwest of Charleston, South Carolina. The city of Beaufort is located in close proximity to the United States Naval Hospital Beaufort, the Marine Corps Air Station Beaufort and the Marine Corps Recruit Depot Parris Island. Other major demand generators for the Hilton Head Island metropolitan statistical area include Gulfstream Aerospace Corporation and the University of South Carolina Beaufort. Gulfstream headquarters are located near the grounds of the Savannah/Hilton Head International Airport and specializes in producing a variety of private aircrafts, serving a clientele base that includes corporate, government, private, and military customers. The Marriott Hilton Head Resort & Spa Property is served by the Hilton Head Airport and the Savannah/Hilton Head International Airport. Located approximately four miles from the Marriott Hilton Head Resort & Spa Property, the Hilton Head Airport is a public airport and is mostly used for general aviation but is also served by US Airways Express, which flies to Charlotte and Washington Reagan, the latter of which is a seasonal route.
Primary regional access to Hilton Head Island is provided by U.S. Highway 278, which connects with Interstate 95 to the west and has its eastern terminus on Hilton Head Island. U.S. Highway 278 forms a circle on Hilton Head Island, providing access throughout the island. Interstate 95 is another major highway, which extends north to Fayetteville, North Carolina and south to Jacksonville, Florida.
The Marriott Hilton Head Resort & Spa Property is located in the resort of Palmetto Dunes, which is comprised of numerous residential neighborhoods, four golf courses and a championship tennis facility. The area immediately surrounding the Marriott Hilton Head Resort & Spa Property is generally defined by the Harbor River to the north and west and the Atlantic Ocean to the south and east. The neighborhood is characterized by restaurants, retail shopping centers, and residential areas, as well as hotels and resorts along the oceanfront. Notable businesses and entities in the area include Robert Trent Jones Golf Course, Shelter Cove Marina, and Shelter Cove Towne Centre.
THE INFORMATION IN THIS STRUCTURAL AND COLLATERAL TERM SHEET IS NOT COMPLETE AND MAY BE AMENDED PRIOR TO THE TIME OF SALE. THIS TERM SHEET IS NOT AN OFFER TO SELL THESE SECURITIES AND IT IS NOT A SOLICITATION OF AN OFFER TO BUY THESE SECURITIES IN ANY JURISDICTION WHERE THE OFFER OR SALE IS NOT PERMITTED.
24
| MARRIOTT HILTON HEAD RESORT & SPA |
The following table presents certain information relating to the Marriott Hilton Head Resort & Spa Property’s competitive set:
Subject and Market Historical Occupancy, ADR and RevPAR(1)
Competitive Set | Marriott Hilton Head | Penetration Factor | |||||||
Year | Occupancy | ADR | RevPAR | Occupancy | ADR | RevPAR | Occupancy | ADR | RevPAR |
| 8/31/2016 TTM | 65.3% | $213.42 | $139.28 | 58.8% | $190.79 | $112.22 | 90.1% | 89.4% | 80.6% |
| 8/31/2015 TTM | 61.5% | $203.82 | $125.38 | 56.1% | $179.24 | $100.57 | 91.2% | 87.9% | 80.2% |
| 8/31/2014 TTM | 57.9% | $194.83 | $112.78 | 59.4% | $177.45 | $105.47 | 102.7% | 91.1% | 93.5% |
| (1) | Information obtained from a third party hospitality research report dated September 19, 2016. The competitive set includes: Sonesta Resort Hilton Head Island, Westin Hilton Head Island Resort & Spa and Omni Hilton Head Oceanfront Resort. |
Competitive Property Summary(1)
Demand Segmentation | 2015 Performance | ||||||||
Property Name/Location | No. of Rooms | Year Built/ Renovated | Distance from Subject | Commercial | Meeting & Group | Leisure | Occupancy | ADR | RevPAR |
Marriott Hilton Head
| 513 | 1976/2015 | -- | 15% | 30% | 55% | 57.6% | $180.73 | $104.16 |
| Omni Hilton Head Oceanfront Resort Hilton Head Island, SC | 323 | 1981/2012-2015 | 0.6 miles | 20% | 25% | 55% | 60%-65% | $210-$220 | $130-$140 |
| Sonesta Resort Hilton Head Island Hilton Head Island, SC | 340 | 1981/2012-2013 | 4.5 miles | 15% | 20% | 65% | 60%-65% | $200-$210 | $130-$140 |
| Westin Hilton Head Resort & Spa Hilton Head Island, SC | 416 | 1985/2012-2013 | 4.6 miles | 15% | 35% | 50% | 55%-60% | $200-$210 | $120-$125 |
| (1) | Information obtained from the appraisal. |
The Borrower.The borrower is Columbia Properties Hilton Head, LLC, a Delaware limited liability company and a single purpose entity with two independent directors. Legal counsel to the borrower delivered a non-consolidation opinion in connection with the origination of the Marriott Hilton Head Resort & Spa Whole Loan. Columbia Sussex Corporation and CSC Holdings, LLC are the guarantors of certain nonrecourse carveouts under the Marriott Hilton Head Resort & Spa Whole Loan on a joint and several basis.
The Sponsors.The sponsors are Columbia Sussex Corporation, (“Columbia Sussex”) and CSC Holdings, LLC, a Kentucky corporation and an Ohio limited liability company, respectively. Founded in 1972, Columbia Sussex has owned and operated hospitality properties for more than 40 years. As of July 2012, Columbia Sussex owned and managed a total of 39 hospitality assets with over 12,700 rooms, including 30 hotels with over 9,700 rooms operated under Marriott-affiliated brands. Columbia Sussex currently operates properties under the JW Marriott, Courtyard by Marriott, Renaissance, Hilton, DoubleTree by Hilton, Curio and Westin flags. Columbia Sussex has prior defaults, foreclosures and deeds in lieu of foreclosure. See “Description of the Mortgage Pool-Litigation Considerations” and “Description of the Mortgage Pool-Loan Purpose, Default History, Bankruptcy Issues and Other Proceedings” in the Preliminary Prospectus.
Escrows.The loan documents provided for upfront escrows in the amount of $1,037,750 for real estate taxes, $203,170 for insurance, and $3,630,000 for a seasonality reserve. The loan documents also provide for monthly escrows in the amount of $98,833 for real estate taxes, $32,249 for insurance premiums and $138,910 for 2016 FF&E reserves. After 2016, the monthly FF&E reserves will be an amount equal to the greater of (a) one twelfth of 5.0% of gross income and (b) the aggregate amount, if any, required to be reserved under the management agreement and the franchise agreement. The loan documents also provides for a property improvement plan escrow to occur after the occurrence of a PIP Reserve Trigger Event Date (as defined below). The monthly deposit will include all available excess cash flow available after filling the seasonality reserve up to the seasonality cap and are designated for payment of the cost of any property improvement plan requirements under a replacement franchise agreement.
Additionally, if the seasonality reserve drops below $3,630,000 the loan documents require on each payment date occurring in April, May, June, July and August of each year during the term of the Marriott Hilton Head Resort & Spa Loan Combination, (i) if a Cash Management Trigger (as defined below) has occurred and is continuing, an amount equal to the greater of (a) $726,000; and (b) all amounts remaining after payments from the cash management account; or (ii) if no Cash Management Trigger has occurred and is continuing, then $726,000 and the borrower shall be required to deposit the amount necessary to cause the balance in the seasonal working capital reserve account to equal $3,630,000.
THE INFORMATION IN THIS STRUCTURAL AND COLLATERAL TERM SHEET IS NOT COMPLETE AND MAY BE AMENDED PRIOR TO THE TIME OF SALE. THIS TERM SHEET IS NOT AN OFFER TO SELL THESE SECURITIES AND IT IS NOT A SOLICITATION OF AN OFFER TO BUY THESE SECURITIES IN ANY JURISDICTION WHERE THE OFFER OR SALE IS NOT PERMITTED.
25
| MARRIOTT HILTON HEAD RESORT & SPA |
Lockbox and Cash Management.The Marriott Hilton Head Resort & Spa Whole Loan requires a lender-controlled lockbox account, which is already in place, and requires the borrower to direct all tenants to pay their rents and all credit card companies under merchant agreements to pay receipts directly into such lockbox account. All checks and cash (to the extent such cash amounts exceed $50,000) received from hotel patrons by the borrower or the property manager are required to be deposited into the lockbox account within two business days of receipt. Prior to a Cash Management Trigger Event (as defined below), all funds on deposit in the lockbox account are disbursed to the borrower. During the occurrence and continuance of a Cash Management Trigger Event, funds in the lockbox are transferred daily into a lender controlled cash management account. All excess cash flow will be applied as follows: (i) to the seasonal working capital reserve account until the account balance is equal to the seasonal working capital reserve account cap of $3,630,000; (ii) to the property improvement plan account following the occurrence and continuance of a property improvement plan (“PIP) reserve period; (iii) to the excess cash flow subaccount during a Cash Sweep Event (as defined below) if no property improvement plan reserve period is in effect, and/or (iv) if no Cash Sweep Event period or property improvement plan reserve is continuing, funds are swept to the borrower’s account.
A “Cash Management Trigger Event” will commence upon the occurrence of (i) an event of default; (ii) any bankruptcy action of borrower, guarantor or property manager; (iii) a Cash Management DSCR Trigger Event (as defined below); or (iv) the PIP Reserve Cash Management Trigger Event Date (as defined below). A Cash Management Event will expire, with respect to clause (i) when such event of default has been cured or waived; and with respect to an involuntary proceeding under clause (ii), when such bankruptcy petition has been discharged, stayed, or dismissed within 30 days of such filing among other conditions for the borrower or guarantor and within 120 days for the property manager. Clause (ii) may also be cured when the borrower has replaced the property manager with a qualified property manager reasonably acceptable to the lender. Clause (iii) may be cured, once the trailing 12-month amortizing net operating income debt service coverage ratio is greater than 1.25x for two consecutive calendar quarters. Clause (iv) may be cured if the Cash Management Trigger Event is caused solely by the occurrence of the PIP Reserve Cash Management Trigger Event Date, once (a) the franchise agreement has been renewed or replaced with a Replacement Franchise Agreement (as defined below); and (b) any PIP work required under the Replacement Franchise Agreement has been completed in accordance with the Replacement Franchise Agreement and management agreement and free of all liens, claims and encumbrances by the required completion date.
A “Cash Management DSCR Trigger Event” occurs upon any date the amortizing net operating income debt service coverage ratio based on the trailing 12-month period immediately preceding the date of such determination, is less than 1.20x.
A “Cash Sweep Event” will commence upon the occurrence of (i) an event of default; (ii) any bankruptcy action of borrower, guarantor or property manager; (iii) a Cash Sweep DSCR Trigger Event (as defined below) or (iv) the PIP Reserve Trigger Event Date (as defined below). A Cash Sweep Event will expire, with respect to clause (i) when such event of default has been cured or waived; and with respect to an involuntary proceeding under clause (ii), when such bankruptcy petition has been discharged, stayed, or dismissed within 30 days of such filing among other conditions for the borrower or guarantor and within 120 days for the property manager. Clause (ii) may also be cured when the borrower has replaced the property manager with a qualified property manager reasonably acceptable to the lender. Clause (iii) may be cured, once the trailing 12-month amortizing net operating income debt service coverage ratio is greater than 1.15x for two consecutive calendar quarters. Clause (iv) may be cured if the Cash Management Trigger Event is caused solely by the occurrence by the definition below, once (a) the franchise agreement has been renewed or replaced with a Replacement Franchise Agreement and (b) any PIP work required under the Replacement Franchise Agreement has been completed in accordance with the Replacement Franchise Agreement and management agreement and free of all liens, claims and encumbrances by the required completion date. A cure of any Cash Sweep Event may occur no more than two times during the term of the Marriott Hilton Head Resort & Spa Whole Loan.
A “Cash Sweep DSCR Trigger Event” occurs upon any date the amortizing net operating income debt service coverage ratio based on the trailing 12-month period immediately preceding the date of such determination, is less than 1.10x.
A “PIP Reserve Cash Management Trigger Event Date” shall mean February 6, 2024.
A “PIP Reserve Trigger Event Date” shall mean April 6, 2024.
A “Replacement Franchise Agreement” collectively means (i)(a) a franchise, trademark and license agreement with a Qualified Franchisor (as defined below) substantially in the same form and substance as the franchise agreement currently in effect, (b) a renewal franchise agreement with the current franchisor in its then current form, or (c) a franchise, trademark and license agreement with a Qualified Franchisor, which franchise, trademark and license agreement shall be in form and substance reasonably acceptable to the lender (provided, that, with respect to this clause (c), the lender, at its option, may also require that borrower obtaines a rating agency confirmation from DBRS, Fitch, Moody’s and Morningstar that such Replacement Franchise Agreement will not result in a downgrade, withdrawal or qualification of the respective ratings assigned to the Series 2016-LC25 certificates and similar confirmations from each rating agency rating any securities backed by the Marriott Hilton Head Resort & Spa Companion Loans with respect to the ratings of such securities), which agreement, in the case of clause (a), clause (b) or clause (c) (as applicable) has a term expiring no earlier than five years after the term of the Marriott Hilton head Resort & Spa Loan Combination; and (ii) a “comfort letter” from the Qualified Franchisor in form reasonably acceptable to the lender.
A “Qualified Franchisor” means (i) Marriott International, Inc. or (ii) a reputable and experienced franchisor (which may be an affiliate of the borrower) which, in the reasonable judgment of the lender, possesses experience in flagging hotel properties similar in location, size, class, use, operation and value as the Marriott Hilton Head Resort & Spa Property; provided, that the borrower obtaines (a) a rating agency confirmation from DBRS, Fitch, Moody’s and Morningstar that such Replacement Franchise Agreement will not result in a downgrade, withdrawal or qualification of the respective ratings assigned to the Series 2016-LC25 certificates and similar confirmations from each rating agency rating any securities backed by the Marriott Hilton Head Resort & Spa Companion
THE INFORMATION IN THIS STRUCTURAL AND COLLATERAL TERM SHEET IS NOT COMPLETE AND MAY BE AMENDED PRIOR TO THE TIME OF SALE. THIS TERM SHEET IS NOT AN OFFER TO SELL THESE SECURITIES AND IT IS NOT A SOLICITATION OF AN OFFER TO BUY THESE SECURITIES IN ANY JURISDICTION WHERE THE OFFER OR SALE IS NOT PERMITTED.
26
| MARRIOTT HILTON HEAD RESORT & SPA |
Loans with respect to the ratings of such securities; and (b) if such person is an affiliate of the borrower, a new bankruptcy non-consolidation opinion reasonably acceptable to the lender and acceptable to the rating agencies in their sole discretion.
Property Management.The Marriott Hilton Head Resort & Spa Property is managed by an affiliate of the borrower.
Assumption.The borrower has the right to transfer the Marriott Hilton Head Resort & Spa Property, after the first anniversary of the loan closing date; provided that no event of default has occurred and is continuing and certain other conditions are satisfied, including (i) the lender’s reasonable determination that the proposed transferee and guarantor satisfy the lender’s credit review and underwriting standards; (ii) execution of a recourse guaranty and an environmental indemnity by an affiliate of the transferee; and (iii) if requested by the lender, rating agency confirmation from DBRS, Fitch, Moody’s and Morningstar that such assumption will not result in a downgrade, withdrawal or qualification of the respective ratings assigned to the Series 2016-LC25 certificates and similar confirmations from each rating agency rating any securities backed by the Marriott Hilton Head Resort & Spa Companion Loans with respect to the ratings of such securities.
Partial Release.Not permitted.
Real Estate Substitution.Not permitted.
Additional Secured Indebtedness.Not Permitted.
Subordinate and Mezzanine Indebtedness.Not permitted.
Ground Lease. None.
Terrorism Insurance.The loan documents require that the “all risk” insurance policy required to be maintained by the borrower provide coverage for terrorism equal to the full replacement cost of the Marriott Hilton Head Resort & Spa Property, as well as business interruption insurance covering no less than the 18-month period following the occurrence of a casualty event, together with an 12-month extended period of indemnity.
Windstorm Insurance. The loan documents require windstorm insurance covering the full replacement cost of the Marriott Hilton Head Resort & Spa Property during the loan term. At the time of closing, the Marriott Hilton Head Resort & Spa Property had windstorm insurance coverage.
THE INFORMATION IN THIS STRUCTURAL AND COLLATERAL TERM SHEET IS NOT COMPLETE AND MAY BE AMENDED PRIOR TO THE TIME OF SALE. THIS TERM SHEET IS NOT AN OFFER TO SELL THESE SECURITIES AND IT IS NOT A SOLICITATION OF AN OFFER TO BUY THESE SECURITIES IN ANY JURISDICTION WHERE THE OFFER OR SALE IS NOT PERMITTED.
27
| REDWOOD MHC Portfolio |
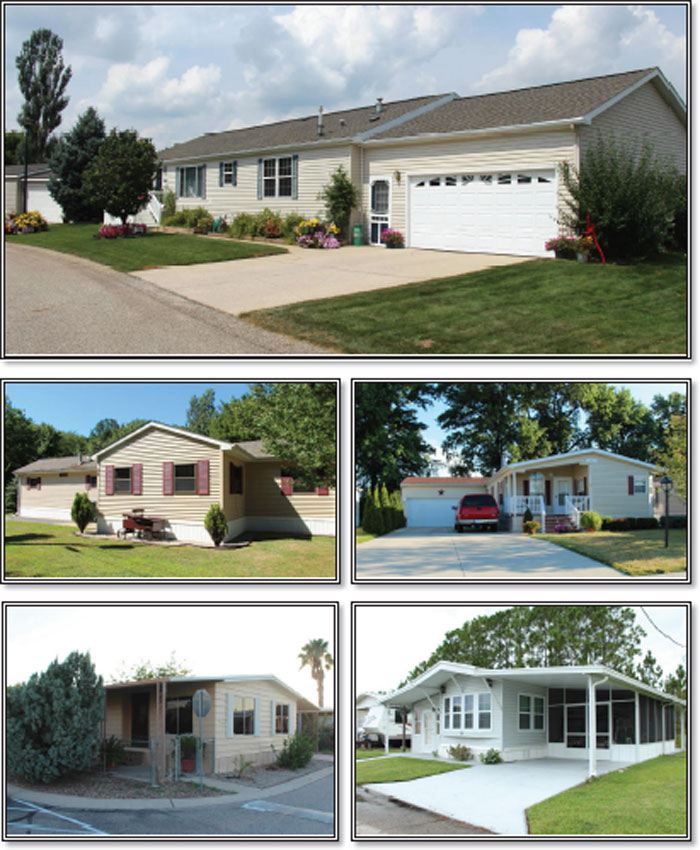
THE INFORMATION IN THIS STRUCTURAL AND COLLATERAL TERM SHEET IS NOT COMPLETE AND MAY BE AMENDED PRIOR TO THE TIME OF SALE. THIS TERM SHEET IS NOT AN OFFER TO SELL THESE SECURITIES AND IT IS NOT A SOLICITATION OF AN OFFER TO BUY THESE SECURITIES IN ANY JURISDICTION WHERE THE OFFER OR SALE IS NOT PERMITTED.
28
| REDWOOD MHC Portfolio |
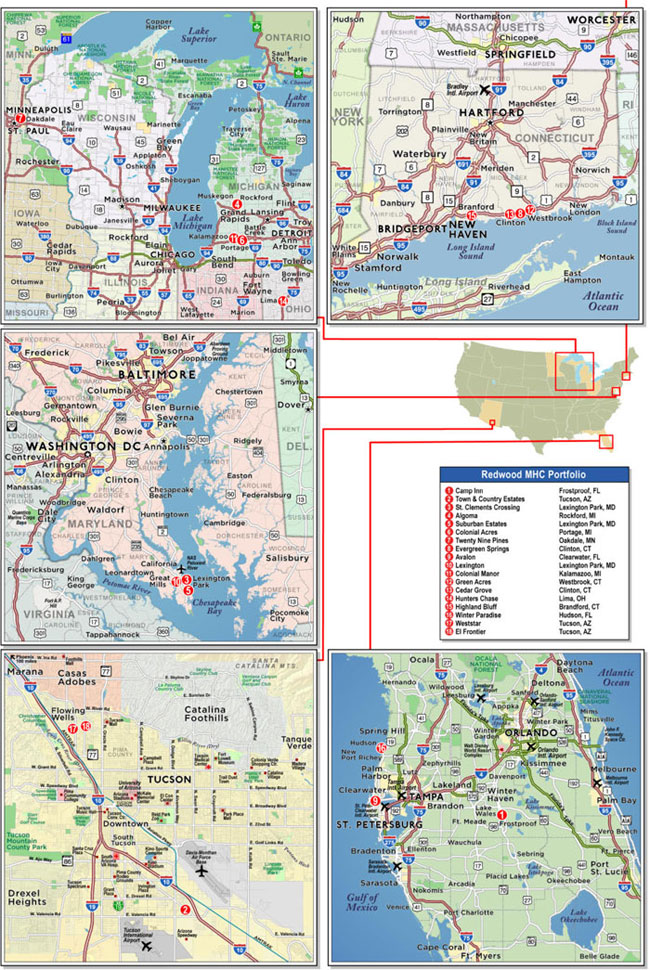
THE INFORMATION IN THIS STRUCTURAL AND COLLATERAL TERM SHEET IS NOT COMPLETE AND MAY BE AMENDED PRIOR TO THE TIME OF SALE. THIS TERM SHEET IS NOT AN OFFER TO SELL THESE SECURITIES AND IT IS NOT A SOLICITATION OF AN OFFER TO BUY THESE SECURITIES IN ANY JURISDICTION WHERE THE OFFER OR SALE IS NOT PERMITTED.
29
| No. 4 – Redwood MHC Portfolio | |||||||
| Loan Information | Property Information | ||||||
| Mortgage Loan Seller: | Ladder Capital Finance LLC | Single Asset/Portfolio: | Portfolio | ||||
| Credit Assessment (DBRS/Fitch/Moody’s/Morningstar): | NR/NR/NR/NR | Property Type: | Manufactured Housing Community | ||||
| Original Principal Balance(1): | $38,400,000 | Specific Property Type(5): | Various | ||||
| Cut-off Date Balance(1): | $38,400,000 | Location(7): | Various – See Table | ||||
| % of Initial Pool Balance: | 4.0% | Size: | 4,007 Pads | ||||
| Loan Purpose: | Refinance | Cut-off Date Balance Per Pad(1): | $23,958 | ||||
| Borrower Names(2): | Various | Year Built/Renovated: | Various – See Table | ||||
| Sponsor: | Ross H. Partrich | Title Vesting: | Fee | ||||
| Mortgage Rate: | 4.114% | Property Manager: | Self-managed | ||||
| Note Date: | September 6, 2016 | 4thMost Recent Occupancy (As of): | NAV (12/31/2012) | ||||
| Anticipated Repayment Date: | NAP | 3rdMost Recent Occupancy (As of): | 73.3% (12/31/2013) | ||||
| Maturity Date: | September 6, 2026 | 2ndMost Recent Occupancy (As of): | 74.6% (12/31/2014) | ||||
| IO Period: | 30 months | Most Recent Occupancy (As of): | 73.6% (12/31/2015) | ||||
| Loan Term (Original): | 120 months | Current Occupancy (As of) : | 70.9% (7/18/2016) | ||||
| Seasoning: | 3 months | ||||||
| Amortization Term (Original): | 360 months | Underwriting and Financial Information: | |||||
| Loan Amortization Type: | Interest-only, Amortizing Balloon | 4thMost Recent NOI (As of): | $7,767,948 (12/31/2013) | ||||
| Interest Accrual Method: | Actual/360 | 3rdMost Recent NOI (As of): | $7,597,616 (12/31/2014) | ||||
| Call Protection: | L(27),D(89),O(4) | 2ndMost Recent NOI (As of): | $7,841,666 (12/31/2015) | ||||
| Lockbox Type: | Springing | Most Recent NOI (As of): | $7,860,403 (TTM 6/30/2016) | ||||
| Additional Debt(1)(3): | Yes | ||||||
| Additional Debt Type(1)(3): | Pari Passu; Future Mezzanine | ||||||
| U/W Revenues: | $14,797,750 | ||||||
| U/W Expenses: | $6,919,649 | ||||||
| Escrows and Reserves(4): | U/W NOI: | $7,878,101 | |||||
| U/W NCF: | $7,677,751 | ||||||
| Type: | Initial | Monthly | Cap (If Any) | U/W NOI DSCR(1): | 1.41x | ||
| Taxes | $303,973 | $101,324 | NAP | U/W NCF DSCR(1): | 1.38x | ||
| Insurance | $0 | Springing | NAP | U/W NOI Debt Yield(1): | 8.2% | ||
| Replacement Reserves | $0 | $16,757 | $804,340 | U/W NCF Debt Yield(1): | 8.0% | ||
| Deferred Maintenance | $1,000,000 | $0 | NAP | As-Is Appraised Value: | $133,710,000 | ||
| Environmental Reserve | $42,000 | $0 | NAP | As-Is Appraisal Valuation Dates(6): | Various | ||
| Michigan CapEx Reserve | $900,000 | $0 | NAP | Cut-off Date LTV Ratio(1): | 71.8% | ||
| Manufactured Homes Reserve | $1,000,000 | $0 | NAP | LTV Ratio at Maturity or ARD(1): | 61.5% | ||
| (1) | All statistical information related to balances per pad, loan-to-value ratios, debt service coverage ratios and debt yields are based on the Redwood MHC Portfolio Whole Loan (as defined below). |
| (2) | See “The Borrowers” section. |
| (3) | See “Subordinate and Mezzanine Indebtedness” section. |
| (4) | See “Escrows” section. |
| (5) | See “The Properties” section. |
| (6) | See “Appraisal” section. |
| (7) | See “Property Info” table. |
The Mortgage Loan.The mortgage loan (the “Redwood MHC Portfolio Mortgage Loan”) is part of a whole loan (the “Redwood MHC Portfolio Whole Loan”) that is evidenced by threepari passu promissory notes (Notes A-1, A-2, and A-3) and secured by a first mortgage encumbering the fee interests in 18 manufactured housing community and recreational vehicle community properties located across seven states (the “Redwood MHC Portfolio Properties”). The Redwood MHC Portfolio Whole Loan was originated on September 6, 2016 by Ladder Capital Finance LLC. The Redwood MHC Portfolio Whole Loan had an original principal balance of $96,000,000, has an outstanding principal balance as of the Cut-off Date of $96,000,000 and accrues interest at an interest rate of 4.114%per annum. The Redwood MHC Portfolio Whole Loan had an initial term of 120 months, has a remaining term of 117 months as of the Cut-off Date and requires interest-only payments for the first 30 payments following origination and, thereafter, requires payments of principal and interest based on a 30-year amortization schedule. The Redwood MHC Portfolio Whole Loan matures on September 6, 2026.
The non-controlling Note A-2, which will be contributed to the WFCM 2016-LC25 Trust and evidences the Redwood MHC Portfolio Mortgage Loan, had an original principal balance of $38,400,000 and has an outstanding principal balance of $38,400,000 as of the Cut-off Date. The controlling Note A-1 and non-controlling Note A-3, with an aggregate original principal balance of $57,600,000, are each expected to be contributed to one or more future trusts. The mortgage loans evidenced by Note A-1 and Note A-3, respectively, are referred to herein as the “Redwood MHC Portfolio Companion Loans”. The lender provides no assurances that any non-securitized
THE INFORMATION IN THIS STRUCTURAL AND COLLATERAL TERM SHEET IS NOT COMPLETE AND MAY BE AMENDED PRIOR TO THE TIME OF SALE. THIS TERM SHEET IS NOT AN OFFER TO SELL THESE SECURITIES AND IT IS NOT A SOLICITATION OF AN OFFER TO BUY THESE SECURITIES IN ANY JURISDICTION WHERE THE OFFER OR SALE IS NOT PERMITTED.
30
| REDWOOD MHC Portfolio |
pari passu note will not be split further. See“Description of the Mortgage Pool—The Whole Loans—The Servicing Shift Whole Loans” in the Preliminary Prospectus.
Pari Passu Note Summary
| Original Balance | Note Holder | Controlling Piece | ||
| Note A-1 | $20,600,000 | Ladder Capital Finance | Yes | |
| Note A-2 | $38,400,000 | WFCM 2016-LC25 | No | |
| Note A-3 | $37,000,000 | Ladder Capital Finance | No | |
| Total | $96,000,000 |
Following the lockout period, the borrower has the right to defease the Redwood MHC Portfolio Whole Loan in whole or, in connection with the release of an individual property, in part (see “Partial Release” section), on any due date before June 6, 2026. In addition, the Redwood MHC Portfolio Whole Loan is prepayable without penalty commencing on June 6, 2026.
Sources and Uses
| Sources | Uses | |||||||
| Original Whole Loan amount | $96,000,000 | 100.0% | Loan payoff(1) | $73,052,958 | 76.1% | |||
| Reserves | 3,245,973 | 3.4 | ||||||
| Closing costs | 2,090,447 | 2.2 | ||||||
| Return of equity | 17,610,622 | 18.3 | ||||||
| Total Sources | $96,000,000 | 100.0% | Total Uses | $96,000,000 | 100.0% |
| (1) | The Redwood MHC Portfolio Properties were previously un-crossed and securitized in the LBUBS 2006-C6 and LBUBS 2006-C7 transactions. |
The Properties.The Redwood MHC Portfolio Properties consist of 18 manufactured housing and recreational vehicle community properties containing 4,007 pads located in Connecticut (four properties), Michigan (three properties), Arizona (three properties), Maryland (three properties), Florida (three properties), Minnesota (one property) and Ohio (one property). The Redwood MHC Portfolio Properties were built between 1935 and 1994. The Redwood MHC Portfolio Properties range in size from 49 pad sites to 797 pad sites, with monthly rents ranging from $259 to $621. As of July 18, 2016, the Redwood MHC Portfolio Properties were 70.9% occupied.
Summaries of the three largest properties by allocated Cut-off Date Balance are set forth below:
Camp Inn – Frostproof, FL (15.9% of Cut-off Date Balance)
Camp Inn is an all age recreational vehicle/manufactured housing community consisting of 797 pads on 111.0 acres (7.2 pads per acre), built in 1972 and located in Frostproof, Florida, approximately 66.6 miles south of Orlando, Florida and 76.6 miles southeast of Tampa, Florida. As of July 18, 2016, the Camp Inn property was 77.3% occupied. The Camp Inn property features 1,594 parking spaces (2.0 spaces per pad), a clubhouse, pool, spa, billiards, shuffleboard, horseshoes, library, and laundry.
Town & Country Estates – Tucson, AZ (9.3% of Cut-off Date Balance)
Town & Country Estates is an all age manufactured housing community consisting of 320 pads on 39.0 acres (8.2 pads per acre), built in 1971 and located in Tucson, Arizona, approximately 5.7 miles northeast of the Downtown Tucson Airport. As of July 18, 2016, the Town & Country Estates property was 79.4% occupied. The Town & Country Estates property features 690 parking spaces (2.2 spaces per pad), a leasing office/clubhouse, community kitchen, game room, laundry facility, two outdoor pools and spas, a playground, basketball court, shuffleboard courts and a recreational vehicle/boat storage area.
St. Clements Crossing – Lexington Park, MD (8.3% of Cut-off Date Balance)
St. Clements Crossing is an all age manufactured housing community consisting of 186 pads on 36.1 acres (5.2 pads per acre), built in 1968 and located in Lexington Park, Maryland, approximately 68.7 miles southeast of Washington, DC. As of July 18, 2016, the St. Clements Crossing property was 95.7% occupied. The St. Clements Crossing property features 401 parking spaces (2.2 spaces per pad), a clubhouse, pool, and playground.
THE INFORMATION IN THIS STRUCTURAL AND COLLATERAL TERM SHEET IS NOT COMPLETE AND MAY BE AMENDED PRIOR TO THE TIME OF SALE. THIS TERM SHEET IS NOT AN OFFER TO SELL THESE SECURITIES AND IT IS NOT A SOLICITATION OF AN OFFER TO BUY THESE SECURITIES IN ANY JURISDICTION WHERE THE OFFER OR SALE IS NOT PERMITTED.
31
| REDWOOD MHC Portfolio |
The following table presents certain information relating to the Redwood MHC Portfolio Properties:
Property Info(1)
| Property Name | City, State | Allocated Cut-off Date Balance | % of Portfolio Cut-off Date Balance | Occupancy | Year Built/ Renovated | Pads | Appraised Value | Allocated LTV | |
| Camp Inn | Frostproof, FL | $15,288,000 | 15.9% | 77.3% | 1972/NAP | 797 | $20,800,000 | 73.5% | |
| Town & Country Estates | Tucson, AZ | $8,946,000 | 9.3% | 79.4% | 1971/NAP | 320 | $13,130,000 | 68.1% | |
| St. Clements Crossing | Lexington Park, MD | $7,947,000 | 8.3% | 95.7% | 1968/2002 | 186 | $11,600,000 | 68.5% | |
| Algoma | Rockford, MI | $7,688,000 | 8.0% | 74.2% | 1980/NAP | 322 | $10,000,000 | 76.9% | |
| Suburban Estates | Lexington Park, MD | $7,561,000 | 7.9% | 97.7% | 1970/NAP | 132 | $10,240,000 | 73.8% | |
| Colonial Acres | Portage, MI | $7,169,500 | 7.5% | 45.3% | 1965/NAP | 612 | $11,070,000 | 64.8% | |
| Twenty Nine Pines | Oakdale, MN | $6,637,000 | 6.9% | 90.3% | 1975/NAP | 144 | $8,310,000 | 79.9% | |
| Evergreen Springs | Clinton, CT | $6,155,000 | 6.4% | 96.1% | 1935/NAP | 102 | $8,070,000 | 76.3% | |
| Avalon | Clearwater, FL | $5,805,000 | 6.0% | 64.5% | 1984/NAP | 256 | $7,740,000 | 75.0% | |
| Lexington | Lexington Park, MD | $3,359,000 | 3.5% | 89.5% | 1980/NAP | 76 | $4,760,000 | 70.6% | |
| Colonial Manor | Kalamazoo, MI | $3,152,500 | 3.3% | 69.2% | 1965/NAP | 195 | $5,240,000 | 60.2% | |
| Green Acres | Westbrook, CT | $3,066,000 | 3.2% | 96.9% | 1955/NAP | 64 | $4,070,000 | 75.3% | |
| Cedar Grove | Clinton, CT | $2,455,000 | 2.6% | 98.3% | 1950/NAP | 60 | $3,070,000 | 80.0% | |
| Hunters Chase | Lima, OH | $2,424,000 | 2.5% | 69.4% | 1994/NAP | 134 | $3,270,000 | 74.1% | |
| Highland Bluff | Branford, CT | $2,293,000 | 2.4% | 89.8% | 1950/NAP | 49 | $3,200,000 | 71.7% | |
| Winter Paradise | Hudson, FL | $2,287,500 | 2.4% | 48.6% | 1972/NAP | 290 | $3,090,000 | 74.0% | |
| Weststar | Tucson, AZ | $1,982,500 | 2.1% | 76.7% | 1984/NAP | 90 | $3,290,000 | 60.3% | |
| El Frontier | Tucson, AZ | $1,784,000 | 1.9% | 46.6% | 1964/NAP | 178 | $2,760,000 | 64.6% | |
| Total/Weighted | $96,000,000 | 100.0% | 70.9% | 4,007 | $133,710,000 | 71.8% | |||
| (1) | Based on the Redwood MHC Portfolio Whole Loan. |
The following table presents historical occupancy percentages at the Redwood MHC Portfolio Properties:
Historical Occupancy
12/31/2012(1) | 12/31/2013(2) | 12/31/2014(2) | 12/31/2015(2) | 7/18/2016(3) |
| NAV | 73.3% | 74.6% | 73.6% | 70.9% |
| (1) | Complete occupancy information was not provided for 2012. |
| (2) | Information obtained from the borrower. |
| (3) | Information obtained from the underwritten rent roll. |
Operating History and Underwritten Net Cash Flow.The following table presents certain information relating to the historical operating performance and underwritten net cash flow at the Redwood MHC Portfolio Properties:
Cash Flow Analysis
| 2013 | 2014 | 2015 | TTM 6/30/2016 | U/W | % of U/W Effective Gross Income | U/W $ per Pad | ||||||||
| Base Rent | $12,575,785 | $12,829,506 | $13,290,442 | $13,390,572 | $13,390,552 | 90.5% | $3,342 | |||||||
| Grossed Up Vacant Space | 0 | 0 | 0 | 0 | 5,917,724 | 40.0 | 1,477 | |||||||
| Other Income | 1,375,218 | 1,497,460 | 1,442,255 | 1,407,198 | 1,407,198 | 9.5 | 351 | |||||||
| Less Vacancy & Credit Loss | 0 | 0 | 0 | 0 | (5,917,724)(1) | (40.0) | (1,477) | |||||||
| Effective Gross Income | $13,951,003 | $14,326,966 | $14,732,697 | $14,797,750 | $14,797,750 | 100.0% | $3,693 | |||||||
| Total Operating Expenses | $6,183,055 | $6,729,350 | $6,891,031 | $6,937,347 | $6,919,649 | 46.8% | $1,727 | |||||||
| Net Operating Income | $7,767,948 | $7,597,616 | $7,841,666 | $7,860,403 | $7,878,101 | 53.2% | $1,966 | |||||||
| Capital Expenditures | 0 | 0 | 0 | 0 | 200,350 | 1.4 | 50 | |||||||
| Net Cash Flow | $7,767,948 | $7,597,616 | $7,841,666 | $7,860,403 | $7,677,751 | 51.9% | $1,916 | |||||||
| NOI DSCR(2) | 1.39x | 1.36x | 1.41x | 1.41x | 1.41x | |||||||||
| NCF DSCR(2) | 1.39x | 1.36x | 1.41x | 1.41x | 1.38x | |||||||||
| NOI DY(2) | 8.1% | 7.9% | 8.2% | 8.2% | 8.2% | |||||||||
| NCF DY(2) | 8.1% | 7.9% | 8.2% | 8.2% | 8.0% |
| (1) | The underwritten economic vacancy is 30.6%. The Redwood MHC Portfolio Properties were 70.9% physically occupied as of July 18, 2016. |
| (2) | The debt service coverage ratios and debt yields are based on the Redwood MHC Portfolio Whole Loan. |
THE INFORMATION IN THIS STRUCTURAL AND COLLATERAL TERM SHEET IS NOT COMPLETE AND MAY BE AMENDED PRIOR TO THE TIME OF SALE. THIS TERM SHEET IS NOT AN OFFER TO SELL THESE SECURITIES AND IT IS NOT A SOLICITATION OF AN OFFER TO BUY THESE SECURITIES IN ANY JURISDICTION WHERE THE OFFER OR SALE IS NOT PERMITTED.
32
| REDWOOD MHC Portfolio |
Appraisal.As of the appraisal valuation dates between August 1, 2016 and August 5, 2016, the Redwood MHC Portfolio Properties had an aggregate “as-is” appraised value of $133,710,000.
Environmental Matters.According to Phase I environmental assessments dated between August 12, 2016 and August 19, 2016, the following recognized environmental conditions (“RECs”) were identified that with respect to the Evergreen Springs property, there was a fuel oil spill in April 2016 that is still an open incident and as to which the Connecticut Department of Energy and Environmental Protection is requiring sampling to determine subsurface impact. Additionally, there is: (i) a $4,500 reserve for radon sampling on the Highland Bluff property and (ii) a $37,500 environmental radiation reserve, of which $25,000 is intended to achieve closure and removal from the open spill listing for the Evergreen Springs property and $12,500 to properly abandon two groundwater monitoring wells at the Twenty Nine Pines property.
Market Overview.The Redwood MHC Portfolio Properties are located across Connecticut (four properties), Michigan (three properties), Arizona (three properties), Maryland (three properties), Florida (three properties), Minnesota (one property) and Ohio (one property). Summaries (primarily based on the related appraisals) of the top three metropolitan statistical areas by allocated Cut-off Date Balance are set forth below:
St. Mary’s County, MD
The Lexington, St. Clements Crossing, and Suburban Estates properties (19.7% of the allocated Cut-off Date Balance combined) are located in St. Mary’s County in Lexington Park, Maryland, which is approximately 68.7 miles southeast of Washington D.C. According to the appraisal, the Lexington, St. Clements Crossing, and Suburban Estates properties are part of the St. Mary’s County metropolitan statistical area, which had an estimated 2015 population of 110,733. As of 2015, median household income in the St. Mary’s County metropolitan statistical area was $87,068 as opposed to $74,461 for Maryland. According to the appraisal, the top three employers in the area are Naval Air Station Patuxent River, MedStar St. Mary’s Hospital and DynCorp International, which employ 11,435, 1,240 and 898 people, respectively.
Lakeland-Winter Haven, FL
The Camp Inn property (15.9% of the allocated Cut-off Date Balance) is located in Frostproof, Florida, which is approximately 66.6 miles south of Orlando, Florida and 76.6 miles southeast of Tampa, Florida. According to the appraisal the Camp Inn property is part of the Lakeland-Winter Haven metropolitan statistical area, which had an estimated 2015 population of 645,001. As of 2015, median household income in the Lakeland-Winter Haven metropolitan statistical area was $43,229. According to the appraisal, the top three employers in the area are Publix Super Markets, Walmart, and Polk County School Board, which employ 10,249, 6,238 and 6,210 people, respectively.
Tucson, AZ
The El Frontier, Town & Country Estates, and Westar properties (13.3% of the allocated Cut-off Date Balance combined)are located in Pima County in Tucson, Arizona. According to the appraisal, the El Frontier, Town & Country Estates and Westar properties are part of the Tucson metropolitan statistical area, which had a 2015 population of 1,010,634. As of 2015, median household income in the Tucson metropolitan statistical area was $45,592. According to the appraisal, the top three employers in the area are Raytheon Missile Systems, The University of Arizona, and the State of Arizona, which employ 12,140, 10,363 and 8,708 people, respectively.
The Borrowers.The borrowers are: El Frontier Associates, LLC; Town & Country Associates, LLC; Weststar Associates, LLC; Cedar Grove Associates, LLC; Evergreen Associates, LLC; Green Acres Associates, LLC; Highland Associates, LLC; Avalon Associates, LLC; Camp Inn Associates, LLC; Winter Paradise Associates, LLC; Lexington MHC, LLC; St. Clement’s Crossing Associates, LLC; Suburban Associates, LLC; Algoma Associates, LLC; Colonial Acres Associates, LLC; Colonial Manor Associates, LLC; Twenty-Nine Pines Associates, LLC; and Hunter’s Chase MHC, LLC. Each of the borrowers is a Delaware limited liability company and single purpose entity with one independent director. Legal counsel to the borrower delivered a non-consolidation opinion in connection with the origination of the Redwood MHC Portfolio Whole Loan. Ross H. Partrich is the guarantor of certain nonrecourse carve-outs under the Redwood MHC Portfolio Whole Loan.
The Sponsor.The sponsor is Ross H. Partrich, who is the key principal of RHP Properties (“RHP”). Mr. Partrich owns and manages a total of 224 manufactured housing communities with over 56,349 housing units and sites spanning 23 states, with a combined value of approximately $3.4 billion. RHP employs more than 900 professionals at their Farmington Hills, Michigan corporate headquarters, regional offices, and on-site management properties across the country. RHP is the second largest private owner of manufactured home communities in the country. The sponsor is also a sponsor under the mortgage loan identified in Annex A-1 to the Preliminary Prospectus as Colonial Rivermead. The sponsor reported prior commercial mortgage loans that resulted in the delivery of deeds in lieu of foreclosure. For additional information on the sponsor, see “Description of the Mortgage Pool—Loan Purpose; Default History, Bankruptcy Issues and Other Proceedings” in the Preliminary Prospectus.
Escrows.The loan documents provide for upfront reserves in the amount of $303,973 for real estate taxes, $1,000,000 for deferred maintenance, $42,000 for an environmental reserve, $900,000 for capital expenditures on the Kalamazoo and Portage, Michigan properties and a $1,000,000 Manufactured Homes reserve for home setup fees. The loan documents also require monthly deposits in an amount equal to one-twelfth of the estimated annual real estate taxes, which currently equates to $101,324, and $16,757 for replacement reserves (capped at $804,340). The loan documents do not require monthly escrows for insurance, provided that (i) a blanket insurance policy acceptable to the lender is in place and (ii) the borrower provides the lender with evidence of payment five days prior to the due date.
Lockbox and Cash Management.Upon the occurrence and during the continuance of a Sweep Event Period (as defined below), the Redwood MHC Portfolio Whole Loan requires that the borrowers establish a lockbox account and that the borrowers or the
THE INFORMATION IN THIS STRUCTURAL AND COLLATERAL TERM SHEET IS NOT COMPLETE AND MAY BE AMENDED PRIOR TO THE TIME OF SALE. THIS TERM SHEET IS NOT AN OFFER TO SELL THESE SECURITIES AND IT IS NOT A SOLICITATION OF AN OFFER TO BUY THESE SECURITIES IN ANY JURISDICTION WHERE THE OFFER OR SALE IS NOT PERMITTED.
33
| REDWOOD MHC Portfolio |
property manager deposit all rents into such lockbox account. During a Sweep Event Period, all excess cash flow after payment of all sums due and payable under the loan documents and all operating expenses will be retained by the lender as additional collateral.
A “Sweep Event Period” will commence upon any of the following: (i) the occurrence and continuance of an event of default under the related loan documents; (ii) the amortizing debt service coverage ratio falling below 1.05x for two consecutive calendar quarters; or (iii) the borrowers defaulting under the management agreement. A Sweep Event Period will be cured: with regard to clause (i), upon the cure of such event of default; with regard to clause (ii), upon the amortizing debt service coverage ratio being greater than 1.15x for two consecutive calendar quarters; and with regard to clause (iii), upon the date the borrowers have entered into a replacement management agreement with a qualified manager or the date on which the applicable default has been cured to the lender’s satisfaction.
Property Management.The Redwood MHC Portfolio Properties are managed by an affiliate of the borrower.
Assumption. The borrowers have the right to transfer the Redwood MHC Portfolio Properties provided that certain conditions are satisfied, including: (i) no event of default has occurred and is continuing; (ii) the lender has reasonably determined that the proposed transferee and guarantor satisfy the lender’s credit review and underwriting standards, taking into consideration the transferee’s experience, financial strength, and general business standing; and (iii) if requested by the lender, rating agency confirmation from DBRS, Fitch, Moody’s and Morningstar that the transfer will not result in a downgrade, withdrawal or qualification of the respective ratings assigned to the Series 2016-LC25 certificates and similar confirmations from each rating agency rating any securities backed by the Redwood MHC Portfolio Companion Loans with respect to the ratings of such securities.
Partial Release. Following the lockout period, the borrowers are permitted to obtain the release of any of the Redwood MHC Portfolio Properties from the lien of the related mortgage instrument in connection with a partial defeasance, subject to certain conditions including: (i) no Sweep Event Period has occurred and is continuing (provided, however, that if the related property to be released is the property causing the Sweep Event Period (and after the partial defeasance, the related cause of the Sweep Event Period shall no longer exist), then subject to satisfaction of all other requirements of a Sweep Event Period cure, such property may be released provided that if such property causes the debt service coverage ratio to be below 1.05x for two consecutive quarters, upon satisfaction of all other partial defeasance requirements, such property may be released if the release results in a debt service coverage ratio of 1.05x or greater); (ii) partial defeasance of that portion of the Redwood MHC Portfolio Whole Loan equal to 115% of the allocated loan amount (except for the Colonial Manor and Colonial Acres properties, for which the release price is 100% of the related allocated loan amount) for the released property; (iii) the loan-to-value ratio with respect to the remaining Redwood MHC Portfolio Properties will be no greater than the lesser of 73.5% and the loan-to-value ratio immediately prior to the release; (iv) the amortizing debt service coverage ratio with respect to the remaining Redwood MHC Portfolio Properties will be no less than the greater of the debt service coverage ratio at the time of origination (1.38x) and the debt service coverage ratio immediately prior to the release; and (v) the lender receives rating agency confirmation from each of the applicable rating agencies that the release will not result in a downgrade, withdrawal or qualification of the respective ratings assigned to the Series 2016-LC25 certificates or any other securities evidencing an interest in a Redwood MHC Portfolio Companion Loan.
Real Estate Substitution.Not permitted.
Subordinate and Mezzanine Indebtedness.The loan documents permit mezzanine financing from an institutional lender subject to: (i) no event of default under the related loan documents has occurred and is continuing; (ii) a maximum combined loan-to-value ratio equal to the lesser of 75.0% and the loan-to-value ratio upon origination of the Redwood MHC Portfolio Whole Loan; (iii) a minimum combined amortizing debt service coverage ratio equal to the greater of 1.25x and the amortizing debt service coverage ratio upon origination of the Redwood MHC Portfolio Whole Loan; (iv) the lender’s review and approval of (a) the terms and conditions of the mezzanine loan and the mezzanine loan documents and (b) the structure of the mezzanine borrower; (v) if required under the pooling and servicing agreement, the receipt of a rating agency confirmation from each of the applicable rating agencies that the mezzanine financing will not result in a downgrade, withdrawal or qualification of the respective ratings assigned to the Series 2016-LC25 certificates or any other securities evidencing an interest in a Redwood MHC Portfolio Companion Loan; and (vi) the execution of an intercreditor agreement acceptable to the lender.
Ground Lease.None.
Terrorism Insurance.The loan documents require that the “all risk” insurance policy required to be maintained by the borrowers provide coverage for terrorism in an amount equal to the full replacement cost of the Redwood MHC Portfolio Properties. The loan documents also require business interruption insurance covering no less than the 18-month period following the occurrence of a casualty event, together with an 18-month extended period of indemnity.
Windstorm Insurance. The loan documents require windstorm insurance that covers the full replacement cost of the Redwood MHC Portfolio Properties. At origination of the Redwood MHC Portfolio Whole Loan, the Redwood MHC Portfolio Properties had insurance coverage for windstorm.
THE INFORMATION IN THIS STRUCTURAL AND COLLATERAL TERM SHEET IS NOT COMPLETE AND MAY BE AMENDED PRIOR TO THE TIME OF SALE. THIS TERM SHEET IS NOT AN OFFER TO SELL THESE SECURITIES AND IT IS NOT A SOLICITATION OF AN OFFER TO BUY THESE SECURITIES IN ANY JURISDICTION WHERE THE OFFER OR SALE IS NOT PERMITTED.
34
| CENTREPARK EAST |
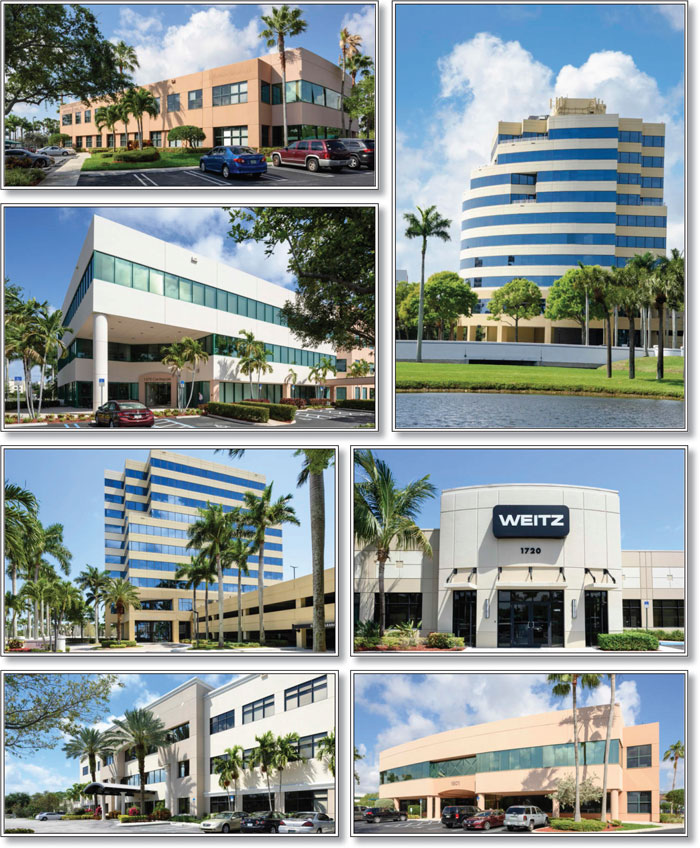
THE INFORMATION IN THIS STRUCTURAL AND COLLATERAL TERM SHEET IS NOT COMPLETE AND MAY BE AMENDED PRIOR TO THE TIME OF SALE. THIS TERM SHEET IS NOT AN OFFER TO SELL THESE SECURITIES AND IT IS NOT A SOLICITATION OF AN OFFER TO BUY THESE SECURITIES IN ANY JURISDICTION WHERE THE OFFER OR SALE IS NOT PERMITTED.
35
| CENTREPARK EAST |
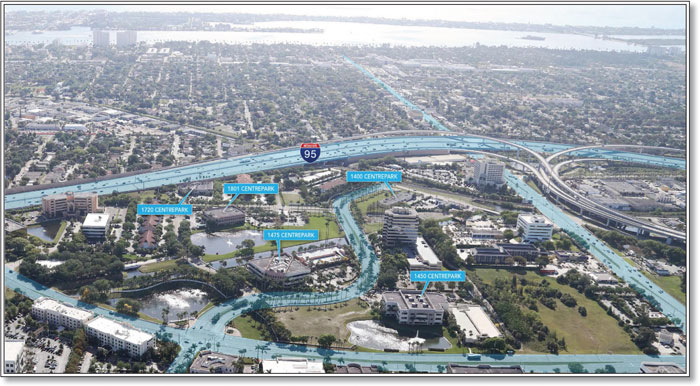
THE INFORMATION IN THIS STRUCTURAL AND COLLATERAL TERM SHEET IS NOT COMPLETE AND MAY BE AMENDED PRIOR TO THE TIME OF SALE. THIS TERM SHEET IS NOT AN OFFER TO SELL THESE SECURITIES AND IT IS NOT A SOLICITATION OF AN OFFER TO BUY THESE SECURITIES IN ANY JURISDICTION WHERE THE OFFER OR SALE IS NOT PERMITTED.
36
| CENTREPARK EAST |
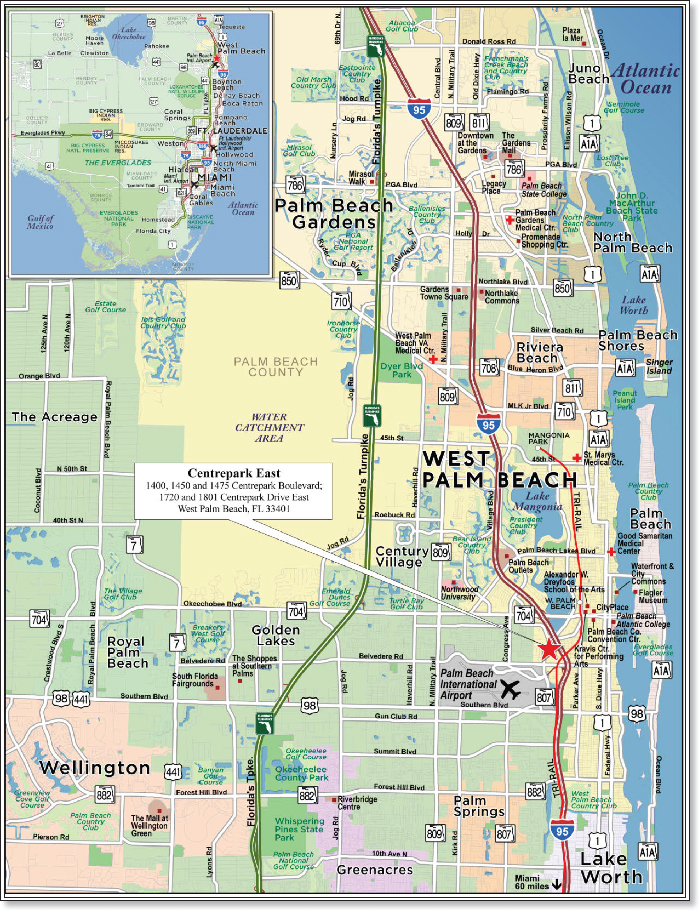
THE INFORMATION IN THIS STRUCTURAL AND COLLATERAL TERM SHEET IS NOT COMPLETE AND MAY BE AMENDED PRIOR TO THE TIME OF SALE. THIS TERM SHEET IS NOT AN OFFER TO SELL THESE SECURITIES AND IT IS NOT A SOLICITATION OF AN OFFER TO BUY THESE SECURITIES IN ANY JURISDICTION WHERE THE OFFER OR SALE IS NOT PERMITTED.
37
| No. 5 - Centrepark East | |||||||
| Loan Information | Property Information | ||||||
| Mortgage Loan Seller: | Rialto Mortgage Finance, LLC | Single Asset/Portfolio: | Single Asset | ||||
Credit Assessment (DBRS/Fitch/Moody’s/Morningstar): | NR/NR/NR/NR | Property Type: | Office | ||||
| Original Principal Balance: | $36,000,000 | Specific Property Type: | Suburban | ||||
| Cut-off Date Balance: | $36,000,000 | Location: | West Palm Beach, FL | ||||
| % of Initial Pool Balance: | 3.8% | Size: | 304,107 SF | ||||
| Loan Purpose: | Acquisition | Cut-off Date Balance Per SF: | $118.38 | ||||
| Borrower Name: | Colonnade Centrepark East LLC | Year Built/Renovated: | 1988/NAP | ||||
| Sponsor: | Joseph S. Sambuco | Title Vesting: | Fee | ||||
| Mortgage Rate: | 4.680% | Property Manager: | Self-managed | ||||
| Note Date: | November 1, 2016 | 4thMost Recent Occupancy (As of): | NAV | ||||
| Anticipated Repayment Date: | NAP | 3rdMost Recent Occupancy (As of): | 72.9% (12/31/2013) | ||||
| Maturity Date: | November 6, 2026 | 2ndMost Recent Occupancy (As of): | 74.0% (12/31/2014) | ||||
| IO Period: | 60 months | Most Recent Occupancy (As of): | 76.6% (12/31/2015) | ||||
| Loan Term (Original): | 120 months | Current Occupancy (As of): | 81.5% (9/7/2016) | ||||
| Seasoning: | 1 month | ||||||
| Amortization Term (Original): | 360 months | Underwriting and Financial Information: | |||||
| Loan Amortization Type: | Interest-only, Amortizing Balloon | 4thMost Recent NOI (As of): | $2,057,566 (12/31/2013) | ||||
| Interest Accrual Method: | Actual/360 | 3rdMost Recent NOI (As of): | $2,742,990 (12/31/2014) | ||||
| Call Protection: | L(25),D(91),O(4) | 2ndMost Recent NOI (As of): | $2,880,997 (12/31/2015) | ||||
| Lockbox Type: | Soft/Springing Cash Management | Most Recent NOI (As of)(2): | $3,259,026 (TTM 8/31/2016) | ||||
| Additional Debt: | None | ||||||
| Additional Debt Type: | NAP | U/W Revenues: | $6,580,453 | ||||
| U/W Expenses: | $3,087,045 | ||||||
| U/W NOI: | $3,493,408 | ||||||
| U/W NCF: | $3,059,045 | ||||||
| Escrows and Reserves(1): | U/W NOI DSCR: | 1.56x | |||||
| Type: | Initial | Monthly | Cap (If Any) | U/W NCF DSCR: | 1.37x | ||
| Taxes | $0 | $68,243 | NAP | U/W NOI Debt Yield: | 9.7% | ||
| Insurance | $48,880 | $23,276 | NAP | U/W NCF Debt Yield: | 8.5% | ||
| Replacement Reserves | $0 | $5,068 | NAP | As-Is Appraised Value: | $49,500,000 | ||
| TI/LC Reserve | $1,500,000 | $25,342 | NAP | As-Is Appraisal Valuation Date: | September 15, 2016 | ||
| Other Reserve | $425,369 | $0 | NAP | Cut-off Date LTV Ratio: | 72.7% | ||
| Deferred Maintenance | $2,375 | $0 | NAP | LTV Ratio at Maturity or ARD: | 66.7% | ||
| (1) | See “Escrows” section. |
| (2) | See “Cash Flow Analysis” section. |
The Mortgage Loan. The mortgage loan (the “Centrepark East Mortgage Loan”) is evidenced by a single promissory note that is secured by a first mortgage encumbering an office property located in West Palm Beach, Florida (the “Centrepark East Property”). The Centrepark East Mortgage Loan was originated on November 1, 2016 by Rialto Mortgage Finance, LLC. The Centrepark East Mortgage Loan had an original principal balance of $36,000,000, has an outstanding principal balance as of the Cut-off Date of $36,000,000 and accrues interest at an interest rate of 4.680%per annum. The Centrepark East Mortgage Loan had an initial term of 120 months, has a remaining term of 119 months as of the Cut-off Date and requires interest-only payments for the first 60 months following origination and, thereafter, requires payments of principal and interest based on a 30-year amortization schedule. The Centrepark East Mortgage Loan matures on November 6, 2026.
Following the lockout period, the borrower has the right to defease the Centrepark East Mortgage Loan in whole, but not in part, on any date on or before July 6, 2026. In addition, the Centrepark East Mortgage Loan is prepayable without penalty after July 6, 2026.
THE INFORMATION IN THIS STRUCTURAL AND COLLATERAL TERM SHEET IS NOT COMPLETE AND MAY BE AMENDED PRIOR TO THE TIME OF SALE. THIS TERM SHEET IS NOT AN OFFER TO SELL THESE SECURITIES AND IT IS NOT A SOLICITATION OF AN OFFER TO BUY THESE SECURITIES IN ANY JURISDICTION WHERE THE OFFER OR SALE IS NOT PERMITTED.
38
| CENTREPARK EAST |
Sources and Uses
| Sources | Uses | ||||||||||
| Original loan amount | $36,000,000 | 70.1 | % | Purchase price(1) | $48,700,000 | 94.9 | % | ||||
| Sponsor’s new cash contribution | 15,338,812 | 29.9 | Reserves | 1,976,624 | 3.9 | ||||||
| Closing costs | 662,188 | 1.3 | |||||||||
| Total Sources | $51,338,812 | 100.0 | % | Total Uses | $51,338,812 | 100.0 | % |
| (1) | The sponsor is purchasing nine office buildings in the larger office park for $71,500,000. The purchase price in the Sources and Uses table represents the allocated purchase price associated with the Centrepark East Property. |
The Property. The Centrepark East Property contains five Class A and Class B office buildings with approximately 304,107 square feet and located in West Palm Beach, Florida. The Centrepark East Property consists of one 10-story, two 3-story, one 2-story, and one single-story office buildings situated on a 13.6-acre parcel. The Centrepark East Property is part of a larger suburban office park which consists of nine buildings totaling 479,145 square feet, located on a 41.0-acre parcel and that were developed between 1988 and 2004. The prior owner invested approximately $2.6 million in capital improvements over the past 10 years, in addition to approximately $1.1 million towards tenant improvements during the past three years. As of September 7, 2016, the Centrepark East Property was 81.5% occupied by 49 tenants.
The following table presents certain information relating to the buildings in the Centrepark East Property:
| Address | Class | Year Built/Renovated | # of Stories | # of Tenants | Net Rentable Area (SF) | % of Total Net Rentable Area (SF) | Occupancy | |||||||
| 1400 Centrepark | A | 1988/NAP | 10 | 19 | 95,211 | 31.3% | 76.8% | |||||||
| 1450 Centrepark | A | 2001/NAP | 3 | 9 | 74,422 | 24.5% | 89.0% | |||||||
| 1475 Centrepark | A | 1999/NAP | 3 | 13 | 74,695 | 24.6% | 82.3% | |||||||
| 1720 Centrepark | B | 2004/NAP | 1 | 2 | 17,876 | 5.9% | 83.1% | |||||||
| 1801 Centrepark | B | 1998/NAP | 2 | 6 | 41,903 | 13.8% | 76.8% | |||||||
| Total/Weighted Average | 49 | 304,107 | 100.0% | 81.5% |
1400 Centrepark
The 1400 Centrepark building is a 95,211 square feet, 10-story office building that was constructed in 1988. The improvements are situated on 3.6 acres, with 312 garage and 118 surface parking spaces providing a parking ratio of 4.5 spaces per 1,000 square feet. Overall, 1400 Centrepark represents 31.3% of Centrepark East Property’s net rentable area. According to the rent roll dated September 7, 2016, 1400 Centrepark is 76.8% occupied by 19 tenants.
1450 Centrepark
The 1450 Centrepark building is a 74,422 square feet, 3-story office building that was constructed in 2001. The improvements are situated on 2.5 acres, with 169 garage and 119 surface parking spaces providing a parking ratio of 3.9 spaces per 1,000 square feet. Overall, 1450 Centrepark represents 24.5% of Centrepark East Property’s net rentable area. According to the rent roll dated September 7, 2016, 1450 Centrepark is 89.0% occupied by nine tenants.
1475 Centrepark
The 1475 Centrepark building is a 74,695 square feet, 3-story office building that was constructed in 1999. The improvements are situated on 3.5 acres, with 150 garage and 137 surface parking spaces providing a parking ratio of 3.8 spaces per 1,000 square feet. Overall, 1475 Centrepark represents 24.6% of Centrepark East Property’s net rentable area. According to the rent roll dated September 7, 2016, 1475 Centrepark is 82.3% occupied by 13 tenants.
1720 Centrepark
The 1720 Centrepark building is a 17,876 square feet, 1-story office building that was constructed in 2004. The improvements are situated on 1.4 acres, with 147 surface parking spaces providing a parking ratio of 8.2 spaces per 1,000 square feet. Overall, 1720 Centrepark represents 5.9% of Centrepark East Property’s net rentable area. According to the rent roll dated September 7, 2016, 1720 Centrepark is 83.1% occupied by two tenants.
1801 Centrepark
The 1801 Centrepark building is a 41,903 square feet, 2-story office building that was constructed in 1998. The improvements are situated on 2.7 acres, with 66 surface parking spaces providing a parking ratio of 1.6 spaces per 1,000 square feet. Overall, 1801 Centrepark represents 13.8% of Centrepark East Property’s net rentable area. According to the rent roll dated September 7, 2016, 1801 Centrepark is 76.8% occupied by six tenants.
THE INFORMATION IN THIS STRUCTURAL AND COLLATERAL TERM SHEET IS NOT COMPLETE AND MAY BE AMENDED PRIOR TO THE TIME OF SALE. THIS TERM SHEET IS NOT AN OFFER TO SELL THESE SECURITIES AND IT IS NOT A SOLICITATION OF AN OFFER TO BUY THESE SECURITIES IN ANY JURISDICTION WHERE THE OFFER OR SALE IS NOT PERMITTED.
39
| CENTREPARK EAST |
The following table presents certain information relating to the tenancy at the Centrepark East Property:
Major Tenants
| Tenant Name | Credit Rating (Fitch/Moody’s/ S&P)(1) | Tenant NRSF | % of NRSF | Annual U/W Base Rent PSF(2) | Annual U/W Base Rent(2) | % of Total Annual U/W Base Rent | Lease Expiration Date | |||||||||
| Major Tenants | ||||||||||||||||
| Platform Specialty Products Corporation | NR/Caa1/BB- | 13,698 | 4.5 | % | $18.30 | $250,673 | 6.2 | % | 3/31/2023 | |||||||
| Conroy, Simberg, & Ganon, P.A. | NR/NR/NR | 16,886 | 5.6 | % | $14.00 | $236,404 | 5.9 | % | 1/31/2022(3) | |||||||
| Earthlink Carrier, LLC | NR/B2/B | 13,543 | 4.5 | % | $16.45 | $222,782 | 5.5 | % | 11/30/2022(4) | |||||||
| Leo A. Daly Company | NR/NR/NR | 11,582 | 3.8 | % | $16.18 | $187,397 | 4.7 | % | 5/5/2022(5) | |||||||
| Sonneborn Rutter Conney & Smith | NR/NR/NR | 11,738 | 3.9 | % | $15.56 | $182,603 | 4.5 | % | 4/30/2021(6) | |||||||
| Paychex North America, Inc. | NR/NR/NR | 11,245 | 3.7 | % | $16.23 | $182,506 | 4.5 | % | 2/28/2018(7) | |||||||
| Kelly, Kronenberg, Gilmartin | NR/NR/NR | 10,718 | 3.5 | % | $16.34 | $175,132 | 4.4 | % | 5/31/2020(8) | |||||||
| Weitz Company, LLC | NR/NR/NR | 11,143 | 3.7 | % | $13.27 | $147,868 | 3.7 | % | 12/31/2019(9) | |||||||
| Total Major Tenants | 100,553 | 33.1 | % | $15.77 | $1,585,367 | 39.5 | % | |||||||||
| Non-Major Tenants | 147,395 | 48.5 | % | $16.48 | $2,429,062 | 60.5 | % | |||||||||
| Occupied Collateral Total | 247,948 | 81.5 | % | $16.19 | $4,014,428 | 100.0 | % | |||||||||
| �� | ||||||||||||||||
| Vacant Space | 56,159 | 18.5 | % | |||||||||||||
| Collateral Total | 304,107 | 100.0 | % | |||||||||||||
| (1) | Certain ratings are those of the parent company whether or not the parent guarantees the lease. |
| (2) | Annual U/W Base Rent PSF and Annual U/W Base Rent include contractual rent steps through April 2017 totalling $70,886, unless otherwise noted. |
| (3) | Conroy, Simberg & Ganon, P.A. has one, 5-year renewal option remaining. |
| (4) | Earthlink Carrier, LLC has one, 5-year renewal option remaining. Additionally, EarthLink has a one-time option to terminate 2,652 square feet (sales office space) effective November 2020, upon written notice on or before March 1, 2020. Prior to the termination date, EarthLink Carrier, LLC must pay a termination fee consisting of the unamortized portion of leasing costs. |
| (5) | Leo A. Daly Company has one, 5-year renewal option remaining. |
| (6) | Sonneborn Rutter Conney & Smith occupies two suites within the Centrepark East Property and each lease has one, 5-year renewal option remaining. |
| (7) | Paychex North America, Inc. has three, 3-year renewal options remaining. |
| (8) | Kelly, Kronenberg, Gilmartin has one, 5-year renewal option remaining. |
| (9) | Weitz Company, LLC has one, 3-year renewal option remaining. Additionally, if the Weitz Company requests in writing on or before January 1, 2018 to lease additional space to expand its operations, and the borrower is not able to accommodate the tenant’s request, Weitz Company, LLC has the right to terminate its lease effective on August 1, 2018 by giving the borrower written notice and pay a termination fee consisting of the unamortized portion of leasing costs. |
The following table presents certain information relating to the lease rollover schedule at the Centrepark East Property:
Lease Expiration Schedule(1)(2)
| Year Ending December 31, | No. of Leases Expiring | Expiring NRSF | % of Total NRSF | Cumulative Expiring NRSF | Cumulative % of Total NRSF | Annual U/W Base Rent | % of Total Annual U/W Base Rent | Annual U/W Base Rent PSF(3) | |||||||||
| MTM | 0 | 0 | 0.0% | 0 | 0.0% | $0 | 0.0% | $0.00 | |||||||||
| 2016 | 1 | 1,816 | 0.6% | 1,816 | 0.6% | $32,180 | 0.8% | $17.72 | |||||||||
| 2017 | 10 | 30,462 | 10.0% | 32,278 | 10.6% | $525,825 | 13.1% | $17.26 | |||||||||
| 2018 | 15 | 49,504 | 16.3% | 81,782 | 26.9% | $789,185 | 19.7% | $15.94 | |||||||||
| 2019 | 10 | 47,066 | 15.5% | 128,848 | 42.4% | $756,575 | 18.8% | $16.07 | |||||||||
| 2020 | 6 | 25,718 | 8.5% | 154,566 | 50.8% | $415,655 | 10.4% | $16.16 | |||||||||
| 2021 | 5 | 27,203 | 8.9% | 181,769 | 59.8% | $427,927 | 10.7% | $15.73 | |||||||||
| 2022 | 5 | 52,481 | 17.3% | 234,250 | 77.0% | $816,408 | 20.3% | $15.56 | |||||||||
| 2023 | 1 | 13,698 | 4.5% | 247,948 | 81.5% | $250,673 | 6.2% | $18.30 | |||||||||
| 2024 | 0 | 0 | 0.0% | 247,948 | 81.5% | $0 | 0.0% | $0.00 | |||||||||
| 2025 | 0 | 0 | 0.0% | 247,948 | 81.5% | $0 | 0.0% | $0.00 | |||||||||
| 2026 | 0 | 0 | 0.0% | 247,948 | 81.5% | $0 | 0.0% | $0.00 | |||||||||
| Thereafter | 0 | 0 | 0.0% | 247,948 | 81.5% | $0 | 0.0% | $0.00 | |||||||||
| Vacant | 0 | 56,159 | 18.5% | 304,107 | 100.0% | $0 | 0.0% | $0.00 | |||||||||
| Total/Weighted Average | 53 | 304,107 | 100.0% | $4,014,428 | 100.0% | $16.19 |
| (1) | Information obtained from the underwritten rent roll. |
| (2) | Certain tenants may have lease termination options that are exercisable prior to the stated expiration date of the subject lease and that are not considered in the Lease Expiration Schedule. |
| (3) | Weighted Average Annual U/W Base Rent PSF excludes vacant space. |
THE INFORMATION IN THIS STRUCTURAL AND COLLATERAL TERM SHEET IS NOT COMPLETE AND MAY BE AMENDED PRIOR TO THE TIME OF SALE. THIS TERM SHEET IS NOT AN OFFER TO SELL THESE SECURITIES AND IT IS NOT A SOLICITATION OF AN OFFER TO BUY THESE SECURITIES IN ANY JURISDICTION WHERE THE OFFER OR SALE IS NOT PERMITTED.
40
| CENTREPARK EAST |
The following table presents historical occupancy percentages at the Centrepark East Property:
Historical Occupancy
2012 | 2013(1) | 2014(1) | 2015(1) | 9/7/2016(2) | ||||
| NAV | 72.9% | 74.0% | 76.6% | 81.5% |
| (1) | Information obtained from the borrower. |
| (2) | Information obtained from the underwritten rent roll. |
Operating History and Underwritten Net Cash Flow.The following table presents certain information relating to the historical operating performance and underwritten net cash flow at the Centrepark East Property:
Cash Flow Analysis
| 2013 | 2014 | 2015(1) | TTM 8/31/2016(1) | U/W | % of U/W Effective Gross Income | U/W $ per SF | ||||||||||||||||
| Base Rent | $3,070,144 | $3,495,408 | $3,522,517 | $3,742,630 | $3,943,542 | 59.9 | % | $12.97 | ||||||||||||||
| Rent Steps | 0 | 0 | 0 | 0 | 70,886 | 1.1 | 0.23 | |||||||||||||||
| Grossed Up Vacant Space | 0 | 0 | 0 | 0 | 930,898 | 14.1 | 3.06 | |||||||||||||||
| Total Reimbursables | 1,666,202 | 1,950,910 | 2,165,769 | 2,343,424 | 3,062,795 | 46.5 | 10.07 | |||||||||||||||
| Other Income(2) | 60,362 | 65,072 | 62,653 | 81,571 | 81,571 | 1.2 | 0.27 | |||||||||||||||
| Less Vacancy & Credit Loss | 0 | 0 | 0 | 0 | (1,509,239) | (3) | (22.9 | ) | (4.96 | ) | ||||||||||||
| Effective Gross Income | $4,796,708 | $5,511,390 | $5,750,938 | $6,167,624 | $6,580,453 | 100.0 | % | $21.64 | ||||||||||||||
| Total Operating Expenses | $2,739,142 | $2,768,400 | $2,869,941 | $2,908,598 | $3,087,045 | 46.9 | 10.15 | |||||||||||||||
| Net Operating Income | $2,057,566 | $2,742,990 | $2,880,997 | $3,259,026 | $3,493,408 | 53.1 | % | $11.49 | ||||||||||||||
| TI/LC | 0 | 0 | 0 | 0 | 373,542 | 5.7 | 1.23 | |||||||||||||||
| Capital Expenditures | 0 | 0 | 0 | 0 | 60,821 | 0.9 | 0.20 | |||||||||||||||
| Net Cash Flow | $2,057,566 | $2,742,990 | $2,880,997 | $3,259,026 | $3,059,045 | 46.5 | % | $10.06 | ||||||||||||||
| NOI DSCR | 0.92 | x | 1.23 | x | 1.29 | x | 1.46 | x | 1.56 | x | ||||||||||||
| NCF DSCR | 0.92 | x | 1.23 | x | 1.29 | x | 1.46 | x | 1.37 | x | ||||||||||||
| NOI DY | 5.7 | % | 7.6 | % | 8.0 | % | 9.1 | % | 9.7 | % | ||||||||||||
| NCF DY | 5.7 | % | 7.6 | % | 8.0 | % | 9.1 | % | 8.5 | % | ||||||||||||
| (1) | The increase in Base Rent and Net Operating Income was due to new leasing and increased occupancy at the Centrepark East Property. |
| (2) | Other income includes parking income, late fees and other miscellaneous income. |
| (3) | The underwritten economic vacancy is 18.8%. The Centrepark East Property was 81.5% physically occupied as of September 7, 2016. |
Appraisal.As of the appraisal valuation date of September 15, 2016, the Centrepark East Property had an “as-is” appraised value of $49,500,000. The appraiser also concluded to an “as-stabilized” value of $52,000,000 with an “as-stabilized” valuation date of September 1, 2017.
Environmental Matters.According to the Phase I environmental assessment dated September 20, 2016, there was no evidence of any recognized environmental conditions at the Centrepark East Property.
Market Overview and Competition. The Centrepark East Property is located in West Palm Beach, Florida, within the Miami-Ft. Lauderdale-Pompano Beach metropolitan statistical area in Palm Beach County. According to a government agency, the unemployment rate for the metropolitan statistical area was 5.1% as of June 2016. In comparison, the state’s and national unemployment rate were each 4.9% for the same time period. South Florida is home to the largest concentration of international banks in the United States, and is home to numerous large domestic and international companies. Palm Beach County’s economy is largely driven by the healthcare industry, with five of the top 10 employers within the healthcare industry, including Tenet Healthcare Corp., Hospital Corporation of America, Veterans Health Administration, Bethesda Memorial Hospital, and Boca Raton Regional Hospital. Palm Beach County also benefits from professional, management services, and tourism industries. Palm Beach County is home to two of Florida’s 10 largest public companies, NextEra Energy and Office Depot, which together employ more than 60,000 workers worldwide.
The Centrepark East Property is located approximately two miles southwest of downtown West Palm Beach, immediately west of Interstate 95, and within one mile of the Palm Beach International Airport (“PBIA”). Within the immediate area, the majority of office uses are located in the Centrepark business park. The park also includes several hotels including Doubletree, Marriott Courtyard, Embassy Suites, Hilton Garden Inn, and Hampton Inn, which are supported by PBIA located less than one mile southwest of the Centrepark East Property. According to a third party market research report, the Centrepark East Property is located within the Palm Beach office market, which contains approximately 54.9 million square feet of inventory. As of the second quarter 2016, the Palm Beach office market reported a vacancy rate of 12.5%, with an average rental rate of $27.58 per square foot on a gross basis. The Centrepark East Property is further located within the West Palm Beach office submarket, which contains approximately 8.0 million square feet of inventory. As of the second quarter 2016, the West Palm Beach office submarket reported a vacancy rate of 12.9% with an average rental rate of $23.08 per square foot on a gross basis. The overall vacancy rate for the Class A and Class B sectors of the West Palm Beach office submarket are 15.4% and 12.3%, respectively. The West Palm Beach office submarket reported
THE INFORMATION IN THIS STRUCTURAL AND COLLATERAL TERM SHEET IS NOT COMPLETE AND MAY BE AMENDED PRIOR TO THE TIME OF SALE. THIS TERM SHEET IS NOT AN OFFER TO SELL THESE SECURITIES AND IT IS NOT A SOLICITATION OF AN OFFER TO BUY THESE SECURITIES IN ANY JURISDICTION WHERE THE OFFER OR SALE IS NOT PERMITTED.
41
| CENTREPARK EAST |
average rental rates of $34.02 per square foot on a gross basis for (Class A) and $21.88 per square foot (Class B) as of the second quarter 2016.
The following table presents certain information relating to comparable office properties for the Centrepark East Property:
Competitive Set(1)
| Property Name/Location | Year Built/ Renovated | Stories | Total GLA (SF) | Total Occupancy | Distance from Subject | Tenant Name | Lease Date/Term | Lease Area (SF) | Annual Base Rent PSF | NNN/ MG/ FSG | ||||||||||
Centrepark East (Subject) | 1988 - 2004/NAP | 1-10 | 304,107 | 81.5% | -- | NAV | NAV / 7 Yrs | NAV | $13.50 - $17.50 | NNN | ||||||||||
Reflections I & II | 1983/NAP | 6 | 129,253 | 78% | 1.2 miles | Song & Associates | March 2016 / 6 Yrs | 7,919 | $25.00 | MG | ||||||||||
Sabadell Building | 1980/NAP | 12 | 113,862 | 60% | 2.3 miles | Zen Offices | June 2016 / 11 Yrs | 9,875 | $16.50 | NNN | ||||||||||
Regions Financial Tower | 1986/NAP | 12 | 180,000 | 78% | 2.3 miles | NAV | June 2016 / 3 Yrs | 1,738 | $14.00 | NNN | ||||||||||
One Clearlake Center | 1986/NAP | 14 | 236,443 | 75% | 1.4 miles | NAV | December 2015 / 5 Yrs | 1,333 | $21.50 | NNN | ||||||||||
Commerce Pointe Silver | 1987/NAP | 4 | 55,755 | 70% | 0.2 miles | NAV | September 2016 / 3 Yrs | 4,522 | $13.00 | NNN | ||||||||||
Palm Beach International Center | 1983/NAP | 5 | 102,000 | 60% | 0.3 miles | NAV | October 2016 / 5 Yrs | 4,110 | $14.00 | NNN | ||||||||||
2101 Centrepark | 2001/NAP | 1 | 25,134 | 74% | 0.1 miles | La Rosa Realty | May 2016 / 3 Yrs | 1,587 | $13.50 | NNN | ||||||||||
2301 Centrepark | 2004/NAP | 1 | 24,599 | 66% | 0.1 miles | Woolems | October 2015 / 6 Yrs | 6,412 | $13.50 | NNN | ||||||||||
Plaza 1551 | 1980/NAP | 1 | 39,899 | 92% | 2.3 miles | NAV | March 2016 / /3 Yrs | 1,257 | $12.00 | NNN | ||||||||||
| (1) | Information obtained from the appraisal dated October 4, 2016. |
The Borrower.The borrower is Colonnade Centrepark East LLC, a single purpose entity with two independent directors. Legal counsel to the borrower delivered a non-consolidation opinion in connection with the origination of the Centrepark East Mortgage Loan. Joseph S. Sambuco, the indirect owner of the borrower, is the guarantor of certain nonrecourse carveouts under Centrepark East Mortgage Loan.
The Sponsor.The sponsor, Joseph S. Sambuco, is the President and CEO of Colonnade Properties LLC (“Colonnade Properties”). Colonnade Properties is a privately held real estate investment company that focuses on acquiring, managing, developing, and redeveloping commercial real estate properties throughout the U.S. Since founding Colonnade, Mr. Sambuco and other principals at Colonnade have invested approximately $580 million of capital for institutional and high net worth investors to acquire or finance real estate assets. Mr. Sambuco has been involved in the development of over $1.0 billion of commercial real estate projects, the acquisition of over $5.0 billion of commercial properties, and the operation and management of more than 15.0 million square feet of commercial real estate.
Escrows.The loan documents provided for upfront reserves in the amount of $1,500,000 for future tenant improvements and leasing commissions, $284,042 for outstanding tenant improvements, $122,000 for CTC Mortgage Company LLC capital expenditures, $48,880 for insurance, $19,327 for outstanding rent abatement and $2,375 for deferred maintenance. The rent abatement reserve may be released provided there is no event of default or a Cash Sweep Event (as defined below) occurring and continuing, among other conditions as follows: with respect to (a) Sway Management, LLC on or after December 1, 2016, January 1, 2017 and February 1, 2017 in an amount equal to $2,931 on each such month; (b) Wells Fargo on or after April 1, 2017 and May 1, 2017 in an amount equal to $5,268 on each such month.
The loan documents require monthly deposits of (i) $68,243 for real estate taxes; (ii) $23,276 for insurance premiums; (iii) $5,068 for replacement reserves; and (iv) $25,342 for tenant improvements and leasing commissions.
Lockbox and Cash Management.The borrower established a lender controlled lockbox account, prior to loan closing, into which all revenues received by the borrower and/or the property manager are required to be deposited within one business day of receipt. Upon the occurrence and continuance of a Cash Management Trigger Event (as defined below), the borrower is required to direct all tenants at the Centrepark East Property to remit all rental payments directly into the lender-controlled lockbox account. The borrower delivered tenant direction letters for this purpose to the lender in connection with loan closing and such letters are held in escrow by the lender. The loan documents also require that all revenues received by the borrower or the property manager be deposited into the lockbox account within one business day of receipt. Other than during a Cash Sweep Event (as defined below), all excess funds on deposit are disbursed to the borrower.
A “Cash Management Trigger Event” will commence upon (i) a non-monetary event of default, however, other than clauses (iii) and (iv), a non-monetary event of default shall not be deemed a Cash Management Trigger Event if the borrower cures the non-
THE INFORMATION IN THIS STRUCTURAL AND COLLATERAL TERM SHEET IS NOT COMPLETE AND MAY BE AMENDED PRIOR TO THE TIME OF SALE. THIS TERM SHEET IS NOT AN OFFER TO SELL THESE SECURITIES AND IT IS NOT A SOLICITATION OF AN OFFER TO BUY THESE SECURITIES IN ANY JURISDICTION WHERE THE OFFER OR SALE IS NOT PERMITTED.
42
| CENTREPARK EAST |
monetary default within 30 days; (ii) a monetary event of default has occurred or is continuing; (iii) the borrower’s second late debt service payment within a 12-month period; (iv) upon the occurrence of a bankruptcy action of the borrower or guarantor; (v) upon the occurrence of a bankruptcy action of the manager; however, if the bankruptcy action of the manger is cured within 60 days it shall not be deemed a Cash Management Trigger Event; or (vi) a Cash Management DSCR Trigger Event (as defined below). A Cash Management Trigger Event will end with respect to clause (i) when such non-monetary event of default has been cured; with respect to clause (ii) when such monetary event of default has been cured; with respect to clause (iii) when the debt service payments have been paid on time for 12-consecutive months; with respect to clause (iv) when such bankruptcy petition has been discharged, stayed, or dismissed within 30 days for a borrower or guarantor; with respect to clause (v) when such bankruptcy petition has been discharged, stayed, or dismissed within 120 days for the manager or the borrower replaces the manager; and with respect to clause (vi) once the amortizing debt service coverage ratio is greater than 1.10x for two consecutive quarters, among other conditions.
A “Cash Management DSCR Trigger Event” occurs upon any date the amortizing debt service coverage ratio based on the trailing 12-month period immediately preceding the date of such determination is less than 1.10x.
A “Cash Sweep Event” will commence upon (i) a non-monetary event of default, however, other than clauses (iii) and (iv), a non-monetary event of default shall not be deemed a Cash Sweep Event if the borrower cures the non-monetary default within 30 days; (ii) a monetary event of default has occurred or is continuing; (iii) upon the occurrence of a bankruptcy action of the borrower or guarantor; (iv) upon the occurrence of a bankruptcy action of the manager; however, if the bankruptcy action of the manger is cured within 60 days it shall not be deemed a Cash Sweep Event; (v) a Cash Sweep DSCR Trigger Event (as defined below). A Cash Sweep Event will end with respect to clause (i) when such non-monetary event of default has been cured; with respect to clause (ii) when such monetary event of default has been cured; with respect to clause (iii) when such bankruptcy petition has been discharged, stayed, or dismissed within 30 days for borrower and guarantor; with respect to clause (iv) when such bankruptcy petition has been discharged, stayed, or dismissed within 120 days for the manager or the borrower replaces the manager; and with respect to clause (v) once the amortizing debt service coverage ratio is greater than 1.10x for two consecutive quarters, among other conditions.
A “Cash Sweep DSCR Trigger Event” occurs upon any date the amortizing debt service coverage ratio, based on the trailing 12-month period immediately preceding the date of such determination, is less than 1.10x.
Property Management.The Centrepark East Property is managed by an affiliate of the sponsor
Assumption.The borrower has the right to transfer the Centrepark East Property provided that certain conditions are satisfied, including (i) the lender’s reasonable determination that the proposed transferee and guarantor satisfy the lender’s credit review and underwriting standards, taking into consideration transferee experience, financial strength and general business standing; (ii) execution of a recourse guaranty and an environmental indemnity by an affiliate of the transferee; and (iii) if requested by the lender, rating agency confirmation from DBRS, Fitch, Moody’s and Morningstar that the transfer will not result in a downgrade, withdrawal or qualification of the respective ratings assigned to the Series 2016-LC25 certificates.
Partial Release.Not permitted.
Real Estate Substitution.Not permitted.
Subordinate and Mezzanine Indebtedness.Not permitted.
Ground Lease.None.
Terrorism Insurance.The loan documents require that the “all risk” insurance policy required to be maintained by the borrower provide coverage for terrorism in an amount equal to the full replacement cost of the Centrepark East Property. The loan documents also require business interruption insurance covering no less than the 18-month period following the occurrence of a casualty event, together with a 12-month extended period of indemnity.
Windstorm Insurance. The loan documents require windstorm insurance covering the full replacement cost of the Centrepark East Property. At the time of closing, the Centrepark East Property had windstorm insurance coverage.
THE INFORMATION IN THIS STRUCTURAL AND COLLATERAL TERM SHEET IS NOT COMPLETE AND MAY BE AMENDED PRIOR TO THE TIME OF SALE. THIS TERM SHEET IS NOT AN OFFER TO SELL THESE SECURITIES AND IT IS NOT A SOLICITATION OF AN OFFER TO BUY THESE SECURITIES IN ANY JURISDICTION WHERE THE OFFER OR SALE IS NOT PERMITTED.
43
| MORENO VALLEY PLAZA |
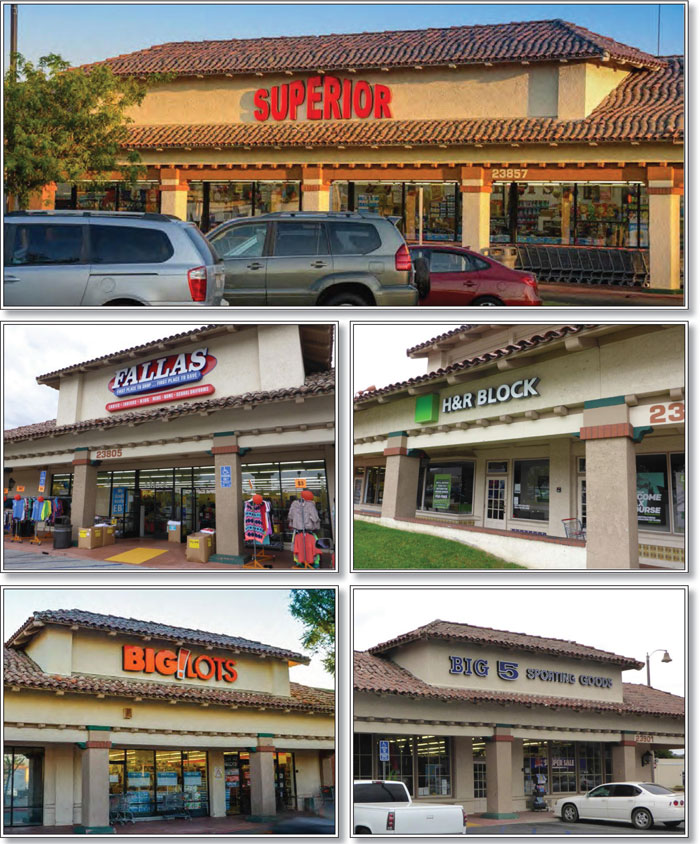
THE INFORMATION IN THIS STRUCTURAL AND COLLATERAL TERM SHEET IS NOT COMPLETE AND MAY BE AMENDED PRIOR TO THE TIME OF SALE. THIS TERM SHEET IS NOT AN OFFER TO SELL THESE SECURITIES AND IT IS NOT A SOLICITATION OF AN OFFER TO BUY THESE SECURITIES IN ANY JURISDICTION WHERE THE OFFER OR SALE IS NOT PERMITTED.
44
| MORENO VALLEY PLAZA |
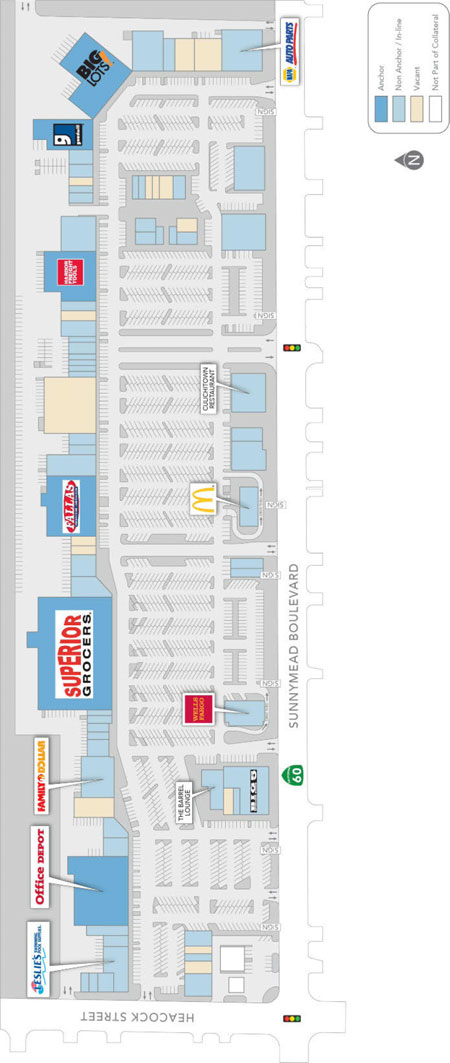
THE INFORMATION IN THIS STRUCTURAL AND COLLATERAL TERM SHEET IS NOT COMPLETE AND MAY BE AMENDED PRIOR TO THE TIME OF SALE. THIS TERM SHEET IS NOT AN OFFER TO SELL THESE SECURITIES AND IT IS NOT A SOLICITATION OF AN OFFER TO BUY THESE SECURITIES IN ANY JURISDICTION WHERE THE OFFER OR SALE IS NOT PERMITTED.
45
| MORENO VALLEY PLAZA |
THE INFORMATION IN THIS STRUCTURAL AND COLLATERAL TERM SHEET IS NOT COMPLETE AND MAY BE AMENDED PRIOR TO THE TIME OF SALE. THIS TERM SHEET IS NOT AN OFFER TO SELL THESE SECURITIES AND IT IS NOT A SOLICITATION OF AN OFFER TO BUY THESE SECURITIES IN ANY JURISDICTION WHERE THE OFFER OR SALE IS NOT PERMITTED.
46
| No. 6 – Moreno Valley Plaza | |||||||
| Loan Information | Property Information | ||||||
| Mortgage Loan Seller: | Ladder Capital Finance LLC | Single Asset/Portfolio: | Single Asset | ||||
| Credit Assessment (DBRS/Fitch/Moody’s/Morningstar): | NR/NR/NR/NR | Property Type: | Retail | ||||
| Original Principal Balance: | $31,500,000 | Specific Property Type: | Anchored | ||||
| Cut-off Date Principal Balance: | $31,500,000 | Location: | Moreno Valley, CA | ||||
| % of Initial Pool Balance: | 3.3% | Size: | 341,011 SF | ||||
| Loan Purpose: | Refinance | Cut-off Date Balance Per SF: | $92.37 | ||||
| Borrower Name: | Moreno Valley Plaza, LTD., L.P. | Year Built/Renovated: | 1987/NAP | ||||
| Sponsors: | Kamyar Mateen; Shervin Mateen | Title Vesting: | Fee | ||||
| Mortgage Rate: | 4.713% | Property Manager: | Self-managed | ||||
| Note Date: | November 3, 2016 | 4th Most Recent Occupancy (As of)(2): | 90.0% (12/31/2012) | ||||
| Anticipated Repayment Date: | NAP | 3rd Most Recent Occupancy (As of)(2): | 87.0% (12/31/2013) | ||||
| Maturity Date: | November 6, 2026 | 2ndMost Recent Occupancy (As of)(2): | 85.0% (12/31/2014) | ||||
| IO Period: | 36 months | Most Recent Occupancy (As of)(2): | 85.0% (12/31/2015) | ||||
| Loan Term (Original): | 120 months | Current Occupancy (As of)(2): | 84.4% (10/20/2016) | ||||
| Seasoning: | 1 month | ||||||
| Amortization Term (Original): | 360 months | Underwriting and Financial Information: | |||||
| Loan Amortization Type: | Interest-only, Amortizing Balloon | ||||||
| Interest Accrual Method: | Actual/360 | 4th Most Recent NOI (As of): | $2,664,011(12/31/2013) | ||||
| Call Protection: | L(25),D(92),O(3) | 3rd Most Recent NOI (As of): | $2,550,385 (12/31/2014) | ||||
| Lockbox Type: | Hard/Upfront Cash Management | 2nd Most Recent NOI (As of): | $2,450,500 (12/31/2015) | ||||
| Additional Debt: | None | Most Recent NOI (As of)(3): | $2,474,881 (TTM 7/31/2016) | ||||
| Additional Debt Type: | NAP | ||||||
| U/W Revenues: | $4,102,741 | ||||||
| U/W Expenses: | $1,305,435 | ||||||
| Escrows and Reserves(1): | U/W NOI(2): | $2,797,307 | |||||
| Type: | Initial | Monthly | Cap (If Any) | U/W NOI DSCR: | 1.42x | ||
| Taxes | $172,028 | $34,406 | NAP | U/W NCF DSCR: | 1.31x | ||
| Insurance | $40,147 | $6,691 | NAP | U/W NOI Debt Yield: | 8.9% | ||
| Replacement Reserves | $0 | $4,831 | NAP | U/W NCF Debt Yield: | 8.1% | ||
| TI/LC Reserve | $500,000 | $14,615 | NAP | As-Is Appraised Value: | $42,000,000 | ||
| Deferred Maintenance | $173,937 | $0 | NAP | As-Is Appraisal Valuation Date: | September 6, 2016 | ||
| Free Rent | $92,681 | $0 | NAP | Cut-off Date LTV Ratio: | 75.0% | ||
| Environmental Reserve | $4,689 | $0 | NAP | LTV Ratio at Maturity or ARD: | 66.0% | ||
| (1) | See “Escrows” section. |
| (2) | See “Historical Occupancy” section. |
| (3) | See “Cash Flow Analysis” section. |
The Mortgage Loan.The mortgage loan (the “Moreno Valley Plaza Mortgage Loan”) is evidenced by a single promissory note that is secured by a first mortgage encumbering the fee interest in an anchored retail center located in Moreno Valley, California (the “Moreno Valley Plaza Property”). The Moreno Valley Plaza Mortgage Loan was originated on November 3, 2016 by Ladder Capital Finance LLC. The Moreno Valley Plaza Mortgage Loan had an original principal balance of $31,500,000, has an outstanding principal balance as of the Cut-off Date of $31,500,000 and accrues interest at a rate of 4.713%per annum. The Moreno Valley Plaza Mortgage Loan had an initial term of 120 months, has a remaining term of 119 months as of the Cut-off Date and requires interest-only payments for the first 36 payments following origination and thereafter, requires payments of principal and interest based on a 30-year amortization schedule through the term of the Moreno Valley Plaza Mortgage Loan. The Moreno Valley Plaza Mortgage Loan matures on November 6, 2026.
Following the lockout period, the borrower has the right to defease the Moreno Valley Plaza Mortgage Loan in whole, but not in part, on any date before September 6, 2026. In addition, the Moreno Valley Plaza Mortgage Loan is prepayable without penalty on or after September 6, 2026.
THE INFORMATION IN THIS STRUCTURAL AND COLLATERAL TERM SHEET IS NOT COMPLETE AND MAY BE AMENDED PRIOR TO THE TIME OF SALE. THIS TERM SHEET IS NOT AN OFFER TO SELL THESE SECURITIES AND IT IS NOT A SOLICITATION OF AN OFFER TO BUY THESE SECURITIES IN ANY JURISDICTION WHERE THE OFFER OR SALE IS NOT PERMITTED.
47
| MORENO VALLEY PLAZA |
Sources and Uses
| Sources | Uses | |||||||||
| Original loan amount | $31,500,000 | 85.2 | % | Loan payoff(1) | $35,589,058 | 96.3 | % | |||
| Sponsor’s new cash contribution | $5,469,399 | 14.8 | Reserves | 983,481 | 2.7 | |||||
| Closing costs | 396,860 | 1.1 | ||||||||
| Total Sources | $36,969,399 | 100.0 | % | Total Uses | $36,969,399 | 100.0 | % |
| (1) | The Moreno Valley Plaza Property was previously securitized in the JPMCC 2007-CB18 transaction. |
The Property.The Moreno Valley Plaza Property is a grocery-anchored retail center totaling 341,011 square feet located in Moreno Valley, California and is located in the northwest portion of Riverside County. Originally built in 1987 and situated on a 32.4-acre site, the Moreno Valley Plaza Property is anchored by Superior Super Warehouse, an independent grocer with over 45 stores throughout Southern California. The other major tenants at the Moreno Valley Plaza Property include Fallas Parades, Office Depot, Big Lots and Harbor Freight Tools USA Inc. The Moreno Valley Plaza Property features 1,715 surface parking spaces resulting in a parking ratio of 5.0 spaces per 1,000 square feet of rentable area. As of October 20, 2016, the Moreno Valley Plaza Property was 84.4% occupied by 61 tenants.
The following table presents certain information relating to the tenancy at the Moreno Valley Plaza Property:
Major Tenants
| Tenant Name | Credit Rating (Fitch/ Moody’s/ S&P)(1) | Tenant NRSF | % of NRSF | Annual U/W Base Rent PSF(2) | Annual U/W Base Rent(2) | % of Total Annual U/W Base Rent | Sales PSF(3) | Occupancy Cost(3) | Lease Expiration Date |
| Anchor Tenant – Collateral | |||||||||
| Superior Super Warehouse | NR/NR/NR | 49,860 | 14.6% | $8.89 | $443,436 | 13.9% | $346 | 3.7% | 5/31/2021(4) |
| Total Anchor Tenant – Collateral | 49,860 | 14.6% | $8.89 | $443,436 | 13.9% | ||||
| Major Tenants – Collateral | |||||||||
| Big Lots | NR/NR/BBB | 19,000 | 5.6% | $9.66 | $183,540 | 5.7% | $160 | 8.4% | 6/30/2019(5) |
| Fallas Paredes | NR/B1/B- | 24,161 | 7.1% | $7.28(6) | $175,892(6) | 5.5% | $129 | 8.6% | 1/31/2022(7)(8) |
| Harbor Freight Tools USA Inc. | NR/Ba3/BB- | 15,280 | 4.5% | $9.96 | $152,189 | 4.8% | NAV | NAV | 4/15/2022(9)(10) |
| Office Depot | NR/B1/B- | 22,768 | 6.7% | $6.25 | $142,300 | 4.5% | NAV | NAV | 11/30/2019(11)(12) |
| Total Major Tenants – Collateral | 81,209 | 23.8% | $8.05 | $653,921 | 20.5% | ||||
| Non-Major Tenants – Collateral | 156,574 | 45.9% | $13.40 | $2,098,728 | 65.7% | ||||
| Occupied Collateral Total | 287,643 | 84.4% | $11.11 | $3,196,085 | 100.0% | ||||
| Vacant Space | 53,368 | 15.6% | |||||||
| Collateral Total | 341,011 | 100.0% | |||||||
| (1) | Certain ratings are those of the parent company whether or not the parent guarantees the lease. |
| (2) | Annual U/W Base Rent PSF and Annual U/W Base Rent include contractual rent steps through June 2017, totaling $141,077. |
| (3) | Sales PSF and Occupancy Costs represent the full year ending December 31, 2015. Sales PSF and Occupancy Costs are not available for tenants who have not reported a full year of sales data. |
| (4) | Superior Super Warehouse recently renewed its lease in June 2016 and has five five-year renewal options. |
| (5) | Big Lots has three five-year renewal options. |
| (6) | Fallas Paredes currently pays $3.25 per square foot. On June 30, 2017 the rent increases to $7.28 per square foot. |
| (7) | Fallas Paredes has the right to terminate its lease with 90 days’ notice if the tenant’s gross sales after December 2018 for a trailing 12-month period do not exceed $3,700,000. The termination option does not apply to the renewal option period. Gross sales were approximately $3.1 million in 2015. |
| (8) | Fallas Paredes has two five-year renewal options. |
| (9) | Harbor Freight Tools USA Inc. has the right to terminate its lease if gross sales do not exceed $3,750,000 during the 49th-60th calendar months of its lease with notice provided between March and June 2017. Harbor Freight Tools USA Inc. does not currently report sales. |
| (10) | Harbor Freight Tools USA Inc. has three five-year renewal options. |
| (11) | Office Depot has the right to terminate its lease on or after December 1, 2017 with at least 60 days’ written notice if the tenant’s gross sales do not equal or exceed $2,900,000 in the trailing 12-month period. Office Depot does not currently report sales. |
| (12) | Office Depot has two five-year renewal options. |
THE INFORMATION IN THIS STRUCTURAL AND COLLATERAL TERM SHEET IS NOT COMPLETE AND MAY BE AMENDED PRIOR TO THE TIME OF SALE. THIS TERM SHEET IS NOT AN OFFER TO SELL THESE SECURITIES AND IT IS NOT A SOLICITATION OF AN OFFER TO BUY THESE SECURITIES IN ANY JURISDICTION WHERE THE OFFER OR SALE IS NOT PERMITTED.
48
| MORENO VALLEY PLAZA |
The following table presents certain information relating to the lease rollover schedule at the Moreno Valley Plaza Property:
Lease Expiration Schedule(1)(2)
| Year Ending December 31, | No. of Leases Expiring | Expiring NRSF | % of Total NRSF | Cumulative Expiring NRSF | Cumulative % of Total NRSF | Annual U/W Base Rent | % of Total Annual U/W Base Rent | Annual U/W Base Rent PSF(3) |
| MTM | 3 | 11,830 | 3.5% | 11,830 | 3.5% | $97,833 | 3.1% | $8.27 |
| 2016 | 0 | 0 | 0.0% | 11,830 | 3.5% | $0 | 0.0% | $0.00 |
| 2017 | 10 | 11,294 | 3.3% | 23,124 | 6.8% | $163,442 | 5.1% | $14.47 |
| 2018 | 13 | 30,258 | 8.9% | 53,382 | 15.7% | $492,282 | 15.4% | $16.27 |
| 2019 | 19 | 84,741 | 24.8% | 138,123 | 40.5% | $893,900 | 28.0% | $10.55 |
| 2020 | 4 | 8,800 | 2.6% | 146,923 | 43.1% | $124,766 | 3.9% | $14.18 |
| 2021 | 6 | 71,336 | 20.9% | 218,259 | 64.0% | $714,429 | 22.4% | $10.01 |
| 2022 | 5 | 62,864 | 18.4% | 281,123 | 82.4% | $629,434 | 19.7% | $10.01 |
| 2023 | 0 | 0 | 0.0% | 281,123 | 82.4% | $0 | 0.0% | $0.00 |
| 2024 | 0 | 0 | 0.0% | 281,123 | 82.4% | $0 | 0.0% | $0.00 |
| 2025 | 0 | 0 | 0.0% | 281,123 | 82.4% | $0 | 0.0% | $0.00 |
| 2026 | 0 | 0 | 0.0% | 281,123 | 82.4% | $0 | 0.0% | $0.00 |
| Thereafter | 1 | 6,520 | 1.9% | 287,643 | 84.4% | $80,000 | 2.5% | $12.27 |
| Vacant | 0 | 53,368 | 15.6% | 341,011 | 100.0% | $0 | 0.0% | $0.00 |
| Total/Weighted Average | 61 | 341,011 | 100.0% | $3,196,085 | 100.0% | $11.11 |
| (1) | Information obtained from the underwritten rent roll. |
| (2) | Certain tenants may have lease termination options that are exercisable prior to the originally stated expiration date of the subject lease and that are not considered in the Lease Expiration Schedule. |
| (3) | Weighted Average Annual U/W Base Rent PSF excludes vacant space. |
The following table presents historical occupancy percentages at the Moreno Valley Plaza Property:
Historical Occupancy
12/31/2012(1) | 12/31/2013(2) | 12/31/2014(2) | 12/31/2015(2) | 10/20/2016(3) | ||||
| 90.0% | 87.0% | 85.0% | 85.0% | 84.4% |
| (1) | Information obtained from a third party source. |
| (2) | Information obtained from the borrower |
| (3) | Information obtained from the underwritten rent roll. |
Operating History and Underwritten Net Cash Flow.The following table presents certain information relating to the historical operating performance and underwritten net cash flow at the Moreno Valley Plaza Property:
Cash Flow Analysis
| 2013 | 2014 | 2015 | TTM 7/31/2016(1) | U/W(1) | % of U/W Effective Gross Income | U/W $ per SF | ||||||||
| Base Rent | $2,958,176 | $2,866,167 | $2,851,538 | $2,869,777 | $3,196,085(2) | 77.9% | $9.37 | |||||||
| Grossed Up Vacant Space | 0 | 0 | 0 | 0 | 527,317 | 12.9 | 1.55 | |||||||
| Total Reimbursables | 938,513 | 885,327 | 873,202 | 881,737 | 903,828 | 22.0 | 2.65 | |||||||
| Other Income | 5,125 | 6,627 | 1,800 | 2,828 | 2,828 | 0.1 | 0.01 | |||||||
| Less Vacancy & Credit Loss | 0 | 0 | 0 | 0 | (527,317)(3) | (12.9) | (1.55) | |||||||
| Effective Gross Income | $3,901,814 | $3,758,121 | $3,726,540 | $3,754,342 | $4,102,741 | 100.0% | $12.03 | |||||||
| Total Operating Expenses | $1,237,803 | $1,207,736 | $1,276,040 | $1,279,460 | $1,305,435 | 31.8% | $3.83 | |||||||
| Net Operating Income | $2,664,011 | $2,550,385 | $2,450,500 | $2,474,881 | $2,797,307 | 68.2% | $8.20 | |||||||
| TI/LC | 0 | 0 | 0 | 0 | 175,376 | 4.3 | 0.51 | |||||||
| Capital Expenditures | 0 | 0 | 0 | 0 | 57,972 | 1.4 | 0.17 | |||||||
| Net Cash Flow | $2,664,011 | $2,550,385 | $2,450,500 | $2,474,881 | $2,563,959 | 62.5% | $7.52 | |||||||
| NOI DSCR | 1.36x | 1.30x | 1.25x | 1.26x | 1.42x | |||||||||
| NCF DSCR | 1.36x | 1.30x | 1.25x | 1.26x | 1.31x | |||||||||
| NOI DY | 8.5% | 8.1% | 7.8% | 7.9% | 8.9% | |||||||||
| NCF DY | 8.5% | 8.1% | 7.8% | 7.9% | 8.1% |
(1) | Net Operating Income increased from TTM 7/31/2016 to U/W due to 25,253 square feet of new leasing since January 2016, which represents $320,370 in additional U/W Base Rent. |
| (2) | U/W Base Rent includes contractual rent steps through June 2017, totaling $141,077. |
| (3) | The underwritten economic vacancy is 11.4%. The Moreno Valley Plaza Property was 84.4% physically occupied as of October 20, 2016. |
THE INFORMATION IN THIS STRUCTURAL AND COLLATERAL TERM SHEET IS NOT COMPLETE AND MAY BE AMENDED PRIOR TO THE TIME OF SALE. THIS TERM SHEET IS NOT AN OFFER TO SELL THESE SECURITIES AND IT IS NOT A SOLICITATION OF AN OFFER TO BUY THESE SECURITIES IN ANY JURISDICTION WHERE THE OFFER OR SALE IS NOT PERMITTED.
49
| MORENO VALLEY PLAZA |
Appraisal.As of the appraisal valuation date of September 6, 2016, the Moreno Valley Plaza Property had an “as-is” appraised value of $42,000,000.
Environmental Matters.According to the Phase I environmental assessment dated September 21, 2016 a solvent dry cleaning facility has been operating at the Moreno Valley Plaza Property since 1987 and the facility reported a tetrachloroethylene release to the soil in 1997. A case closure letter was issued by the California Regional Water Quality Control Board, but a Phase II environmental assessment was recommended. In lieu of the subsurface investigation, the borrower obtained for the benefit of the lender an environmental insurance policy with a $1,000,000 limit per claim and in the aggregate, with a 10-year term and a 3-year tail.
Market Overview and Competition.The Moreno Valley Plaza Property is located in Moreno Valley, California approximately 9.7 miles southeast of downtown Riverside. The Moreno Valley Plaza Property is located in close proximity to California State Highway 60 (the “Moreno Valley Freeway”), which provides access to Interstate 215. The Moreno Valley Freeway provides access to Los Angeles County to the west and merges with Interstate 10 east of Moreno Valley. Interstate 215 is the primary north/south arterial servicing Moreno Valley. The largest employers in Moreno Valley include the March Air Reserve Base, the Moreno Valley Unified School District and the Riverside County Regional Medical Center.
The estimated 2016 population within a three- and five-mile radius of the Moreno Valley Plaza Property was 137,656 and 230,345, respectively, while the average household income within the same radii was $65,669 and $73,558, respectively. According to the appraisal, the Moreno Valley Plaza Property is located in the East End retail submarket within the Inland Empire retail market. As of the second quarter of 2016, the East End retail submarket contained a total inventory of 39.6 million square feet of retail space with a vacancy rate of 8.6%. The appraiser concluded to a blended market rent of $11.36 per square foot triple net, approximately 2.2% above the Moreno Valley Plaza Property’s weighted average occupied underwritten base rent of $11.11 per square foot.
The following table presents certain information relating to some comparable retail properties for the Moreno Valley Plaza Property:
Comparable Leases(1)
| Property Name/Location | Year Built/ Renovated | Total GLA (SF) | Total Occupancy | Distance from Subject | Tenant Name | Lease Date / Term | Lease Area (SF) | Annual Base Rent PSF | Lease Type |
Towngate Plaza Moreno Valley, CA | 1991/NAP | 49,865 | 97% | 0.9 miles | Yogurtland | December 2012 /10 Yrs | 1,451 | $24.00 | NNN |
Towngate Center Moreno Valley, CA | 1988/NAP | 377,705 | 95% | 1.0 miles | Massage Therapy | April 2016 / 5 Yrs | 825 | $20.52 | NNN |
Towngate Center Moreno Valley, CA | 1988/NAP | 377,705 | 95% | 1.0 miles | Thai Restaurant | April 2016 / 10 Yrs | 1,960 | $16.80 | NNN |
Sunnymead Plaza Moreno Valley, CA | 1970/NAP | 87,312 | 97% | 1.2 miles | T-Mobile | May 2015 / 3 Yrs | 1,300 | $16.80 | NNN |
| (1) | Information obtained from the appraisal, third party market research reports and underwritten rent roll. |
The Borrower.The borrower is Moreno Valley Plaza, LTD., L.P., a California limited partnership and a single purpose entity with two independent directors. Legal counsel to the borrower delivered a non-consolidation opinion in connection with the origination of the Moreno Valley Plaza Mortgage Loan. Kamyar Mateen and Shervin Mateen are the guarantors of certain nonrecourse carveouts under the Moreno Valley Plaza Mortgage Loan.
The Sponsors.The sponsors are Kamyar Mateen and Shervin Mateen who both have over 30-years of real estate experience and are principals of Cannon Commercial which is a privately operated real estate investment and management company based in Los Angeles, California. The sponsors own over 20 office and retail properties located primarily in California and Texas.
The sponsors were previously involved in two foreclosed loans and four discounted payoffs for loans. See “Description of the Mortgage Pool—Loan Purpose; Default History, Bankruptcy Issues and Other Proceedings” in the Preliminary Prospectus.
Escrows.The loan documents provide for upfront reserves of $172,028 for real estate taxes, $40,147 for insurance premiums, $500,000 for tenant improvements and leasing commissions, $173,937 for deferred maintenance, $92,681 for free rent and $4,689 for an environmental reserve. The loan documents also require ongoing monthly reserves in an amount equal to $34,406 for real estate taxes, $6,691 for insurance premiums, $4,831 for replacement reserves and $14,615 for tenant improvements and leasing commissions.
Lockbox and Cash Management.The Moreno Valley Plaza Mortgage Loan requires a lender-controlled lockbox account, which is already in place, and requires the borrower to direct tenants to pay their rents directly into such lockbox account. The loan documents also require that any rent received by the borrower or property manager is deposited into the lockbox account within one business day of receipt. Prior to the occurrence of a Cash Sweep Event (as defined below), all excess funds on deposit in the lockbox account are disbursed to the borrower. During a Cash Sweep Event all excess funds are required to be swept to a lender-controlled cash management account.
A “Cash Sweep Event” will commence upon the earliest of (i) the occurrence and continuance of an event of default; (ii) the amortizing debt service coverage ratio being less than 1.10x at any time; (iii) if (a) a tenant greater than 10.0% of the net rentable area or of total annual rent, or (b) Harbor Freight, or (c) Office Depot, vacates, subleases or goes dark in substantially all of its space, files for bankruptcy (other than the Office Depot lease expiring upon its terms); (iv) if (a) a tenant greater than 10.0% of the net rentable area or annual rent or (b) Harbor Freight, is downgraded below BBB- by S&P or the equivalent rating by any other rating agency; or (v) 12 months prior to lease expiration for (a) a tenant greater than 10.0% of the net rentable area or annual
THE INFORMATION IN THIS STRUCTURAL AND COLLATERAL TERM SHEET IS NOT COMPLETE AND MAY BE AMENDED PRIOR TO THE TIME OF SALE. THIS TERM SHEET IS NOT AN OFFER TO SELL THESE SECURITIES AND IT IS NOT A SOLICITATION OF AN OFFER TO BUY THESE SECURITIES IN ANY JURISDICTION WHERE THE OFFER OR SALE IS NOT PERMITTED.
50
| MORENO VALLEY PLAZA |
rents or (b) Harbor Freight. A Cash Sweep Event will expire: with regard to clause (i), upon the cure of such event of default; with regard to clause (ii), the amortizing debt service coverage ratio being equal to or greater than 1.30x for two consecutive calendar quarters; with regard to clause (iii), upon the tenant reopening and paying full rent for two consecutive quarters and providing an estoppel certificate or if the tenant is replaced by an acceptable replacement tenant; with regard to clause (iv), if the tenant’s parent company is restored to at least BBB- by S&P or the equivalent rating by any other rating agency for at least two consecutive calendar quarters; or with regard to clause (v) the tenant’s lease has been extended for at least five years past the Moreno Valley Plaza Mortgage Loan maturity date or if the tenant is replaced by an acceptable replacement tenant. With respect to a tenant trigger event caused solely by Harbor Freight, the trigger event can also be cured upon the date $152,800 of excess cash flow has been collected and deposited into the rollover reserve. With respect to a tenant trigger event caused solely by Office Depot, the trigger event can also be cured by the earlier to occur of (i) November 30, 2019, or (ii) a deposit into the Rollover Account (via excess cash flow or additional Borrower deposit) in the amount equal to the multiple of (x) the number of months (including any partial month) from the date the Office Depot trigger event occurs through and including November 30, 2019 and (y) $20,000.
Property Management. The Moreno Valley Plaza Property is managed by an affiliate of the borrower.
Assumption.The borrower has the right to transfer the Moreno Valley Plaza Property, provided that certain conditions are satisfied, including, but not limited to: (i) no mortgage loan event of default has occurred and is continuing; (ii) the lender’s reasonable determination that the proposed transferee and guarantor satisfy the lender’s credit review and underwriting standards, taking into consideration the transferee’s experience, financial strength and general business standing; (iii) execution of a recourse guaranty and an environmental indemnity by an affiliate of the transferee; and (iv) if requested by the lender, confirmation from DBRS, Fitch, Moody’s and Morningstar that the transfer will not result in a downgrade, withdrawal or qualification of the respective ratings assigned to the Series 2016-LC25 certificates.
Partial Release.None
Real Estate Substitution.Not permitted.
Subordinate and Mezzanine Indebtedness.Not permitted.
Ground Lease.None.
Terrorism Insurance.The loan documents require that the “all risk” insurance policy required to be maintained by the borrower provide coverage for terrorism in an amount equal to the full replacement cost of the Moreno Valley Plaza Property. The loan documents also require business interruption insurance covering no less than the 18-month period following the occurrence of a casualty event, together with a 12-month extended period of indemnity.
Earthquake Insurance.The loan documents do not require earthquake insurance. The seismic report indicated a probable maximum loss of 10.0%.
THE INFORMATION IN THIS STRUCTURAL AND COLLATERAL TERM SHEET IS NOT COMPLETE AND MAY BE AMENDED PRIOR TO THE TIME OF SALE. THIS TERM SHEET IS NOT AN OFFER TO SELL THESE SECURITIES AND IT IS NOT A SOLICITATION OF AN OFFER TO BUY THESE SECURITIES IN ANY JURISDICTION WHERE THE OFFER OR SALE IS NOT PERMITTED.
51
| THE SHOPS AT SOMERSET SQUARE |
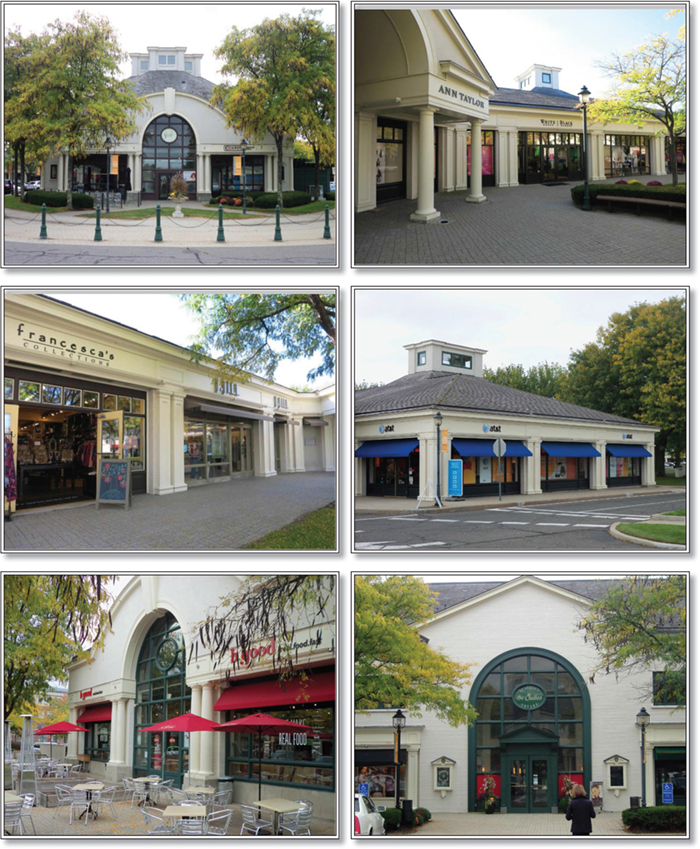
THE INFORMATION IN THIS STRUCTURAL AND COLLATERAL TERM SHEET IS NOT COMPLETE AND MAY BE AMENDED PRIOR TO THE TIME OF SALE. THIS TERM SHEET IS NOT AN OFFER TO SELL THESE SECURITIES AND IT IS NOT A SOLICITATION OF AN OFFER TO BUY THESE SECURITIES IN ANY JURISDICTION WHERE THE OFFER OR SALE IS NOT PERMITTED.
52
| THE SHOPS AT SOMERSET SQUARE |
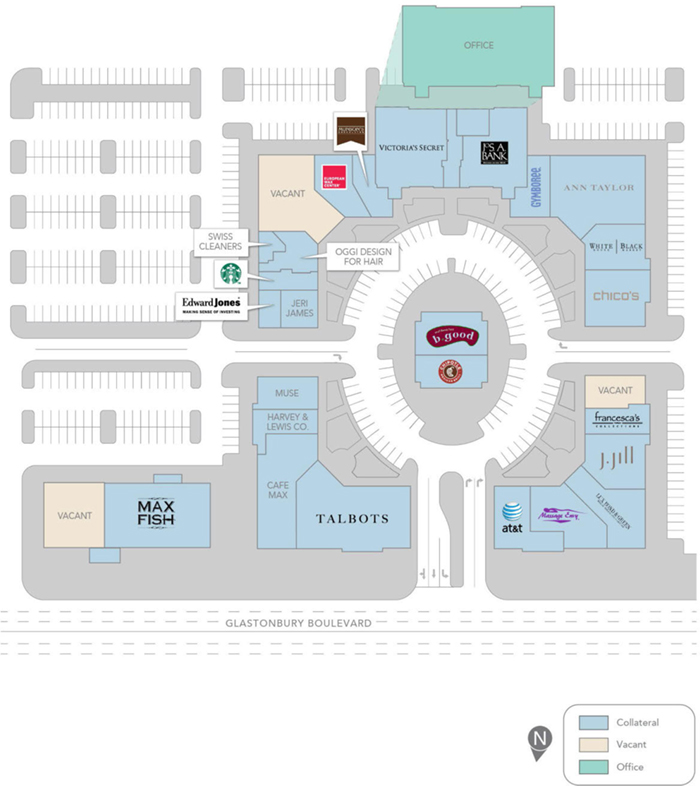
THE INFORMATION IN THIS STRUCTURAL AND COLLATERAL TERM SHEET IS NOT COMPLETE AND MAY BE AMENDED PRIOR TO THE TIME OF SALE. THIS TERM SHEET IS NOT AN OFFER TO SELL THESE SECURITIES AND IT IS NOT A SOLICITATION OF AN OFFER TO BUY THESE SECURITIES IN ANY JURISDICTION WHERE THE OFFER OR SALE IS NOT PERMITTED.
53
| THE SHOPS AT SOMERSET SQUARE |

THE INFORMATION IN THIS STRUCTURAL AND COLLATERAL TERM SHEET IS NOT COMPLETE AND MAY BE AMENDED PRIOR TO THE TIME OF SALE. THIS TERM SHEET IS NOT AN OFFER TO SELL THESE SECURITIES AND IT IS NOT A SOLICITATION OF AN OFFER TO BUY THESE SECURITIES IN ANY JURISDICTION WHERE THE OFFER OR SALE IS NOT PERMITTED.
54
| No. 7 - The Shops at Somerset Square | |||||||
| Loan Information | Property Information | ||||||
| Mortgage Loan Seller: | Wells Fargo Bank, National Association | Single Asset/Portfolio: | Single Asset | ||||
| Credit Assessment (DBRS/Fitch/Moody’s/Morningstar): | NR/NR/NR/NR | Property Type: | Retail | ||||
| Original Principal Balance: | $30,250,000 | Specific Property Type: | Unanchored | ||||
| Cut-off Date Balance: | $30,250,000 | Location: | Glastonbury, CT | ||||
| % of Initial Pool Balance: | 3.2% | Size(3): | 113,987 SF | ||||
| Loan Purpose: | Acquisition | Cut-off Date Balance Per SF: | $265.38 | ||||
| Borrower Name: | Shops at Somerset Square, LLC | Year Built/Renovated: | 1987/NAP | ||||
| Sponsor: | Rouse Properties, LP | Title Vesting: | Fee | ||||
| Mortgage Rate: | 4.030% | Property Manager: | Self-managed | ||||
| Note Date: | October 18, 2016 | 4th Most Recent Occupancy (As of): | 91.8% (12/31/2012) | ||||
| Anticipated Repayment Date: | NAP | 3rd Most Recent Occupancy (As of): | 91.3% (12/31/2013) | ||||
| Maturity Date: | November 1, 2026 | 2nd Most Recent Occupancy (As of): | 93.6% (12/31/2014) | ||||
| IO Period: | 60 months | Most Recent Occupancy (As of): | 87.7% (12/31/2015) | ||||
| Loan Term (Original): | 120 months | Current Occupancy (As of): | 89.3% (10/6/2016) | ||||
| Seasoning: | 1 month | ||||||
| Amortization Term (Original): | 360 months | Underwriting and Financial Information: | |||||
| Loan Amortization Type: | Interest-only, Amortizing Balloon | ||||||
| Interest Accrual Method: | Actual/360 | 4th Most Recent NOI (As of)(2): | NAV | ||||
| Call Protection: | L(25),D(91),O(4) | 3rd Most Recent NOI (As of): | $2,686,974 (12/31/2014) | ||||
| Lockbox Type: | Hard/Springing Cash Management | 2nd Most Recent NOI (As of): | $2,453,559 (12/31/2015) | ||||
| Additional Debt(3): | Yes | Most Recent NOI (As of): | $2,563,962 (TTM 8/31/2016) | ||||
| Additional Debt Type(3): | Other | ||||||
| U/W Revenues: | $4,214,213 | ||||||
| U/W Expenses: | $1,671,516 | ||||||
| U/W NOI: | $2,542,697 | ||||||
| U/W NCF: | $2,425,088 | ||||||
| Escrows and Reserves(1): | U/W NOI DSCR: | 1.46x | |||||
| U/W NCF DSCR: | 1.39x | ||||||
| Type: | Initial | Monthly | Cap (If Any) | U/W NOI Debt Yield: | 8.4% | ||
| Taxes | $71,596 | $71,596 | NAP | U/W NCF Debt Yield: | 8.0% | ||
| Insurance | $0 | Springing | NAP | As-Is Appraised Value: | $42,000,000 | ||
| Replacement Reserves | $0 | $2,519 | $60,444 | As-Is Appraisal Valuation Date: | September 2, 2016 | ||
| TI/LC Reserve | $0 | $12,349 | $444,549 | Cut-off Date LTV Ratio: | 72.0% | ||
| Tenant Specific TI/LC Reserve | $50,000 | $0 | NAP | LTV Ratio at Maturity or ARD: | 65.4% | ||
| (1) | See “Escrows” section. |
| (2) | See “Cash Flow Analysis” section. 2013 historical operating statements were not provided by the seller. |
| (3) | See “Additional Indebtedness” section. |
The Mortgage Loan. The mortgage loan (“The Shops at Somerset Square Mortgage Loan”) is evidenced by a single promissory note that is secured by a first mortgage encumbering the fee interest in an unanchored retail property located in Glastonbury, Connecticut (“The Shops at Somerset Square Property”). The Shops at Somerset Square Mortgage Loan was originated on October 18, 2016 by Wells Fargo Bank, National Association. The Shops at Somerset Square Mortgage Loan had an original principal balance of $30,250,000, has an outstanding principal balance as of the Cut-off Date of $30,250,000 and accrues interest at an interest rate of 4.030%per annum. The Shops at Somerset Square Mortgage Loan had an initial term of 120 months, has a remaining term of 119 months as of the Cut-off Date and requires interest-only payments for the first 60 payments following origination and, thereafter, requires payments of principal and interest based on a 30-year amortization schedule through the term of The Shops at Somerset Square Mortgage Loan. The Shops at Somerset Square Mortgage Loan matures on November 1, 2026.
Following the lockout period, the borrower has the right to defease The Shops at Somerset Square Mortgage Loan in whole, but not in part, on any date before August 1, 2026. In addition, The Shops at Somerset Square Mortgage Loan is prepayable without penalty on or after August 1, 2026.
THE INFORMATION IN THIS STRUCTURAL AND COLLATERAL TERM SHEET IS NOT COMPLETE AND MAY BE AMENDED PRIOR TO THE TIME OF SALE. THIS TERM SHEET IS NOT AN OFFER TO SELL THESE SECURITIES AND IT IS NOT A SOLICITATION OF AN OFFER TO BUY THESE SECURITIES IN ANY JURISDICTION WHERE THE OFFER OR SALE IS NOT PERMITTED.
55
| THE SHOPS AT SOMERSET SQUARE |
Sources and Uses
| Sources | Uses | |||||||||
| Original loan amount | $30,250,000 | 70.6 | % | Purchase price(1) | $42,000,000 | 98.0 | % | |||
| Sponsor’s new cash contribution | 12,625,826 | 29.4 | Reserves | 121,596 | 0.3 | |||||
| Closing costs | 754,230 | 1.8 | ||||||||
| Total Sources | $42,875,826 | 100.0 | % | Total Uses | $42,875,826 | 100.0 | % |
| (1) | The Shops at Somerset Square Property was previously securitized in the CSMC 2006-C5 transaction. |
The Property.The Shops at Somerset Square Property is an open-air lifestyle shopping center located in Glastonbury, Connecticut, approximately 5.8 miles southeast of the Hartford, Connecticut central business district. The Shops at Somerset Square Property contains 113,987 square feet, consisting of 94,819 square feet of retail space (83.2% of net rentable area) and 19,168 square feet of office space (16.8% of net rentable area). Constructed in 1987, The Shops at Somerset Square Property is situated on a 13.6-acre parcel and is comprised of fashion, beauty and dining tenants in an outdoor town square environment. Major tenants include national retailers such as Talbots, Victoria’s Secret, AnnTaylor, Chipotle Mexican Grill, Chico’s FAS and White House/Black Market, among others. According to a third party market research report, The Shops at Somerset Square Property has averaged 93.3% occupancy since 2006 and has never dropped below 87.7% occupancy. Tenant retention has been high at The Shops at Somerset Square Property, with 24 tenants comprising approximately 67.6% of the net rentable area having been in occupancy for over 10 years. Additionally, The Shops at Somerset Square Property has experienced recent leasing activity, with two new leases and 19 renewal lease executed since the beginning of 2015 for approximately 54,567 square feet (47.9% of net rentable area).
Comparable tenant sales (tenants reporting at least four periods of sales history) have been consistent, with weighted average sales levels of $442 per square foot in 2013 and 2014, $450 per square foot in 2015 and $439 per square foot based on the most recent trailing-twelve months (see “Historical Sales PSF and Occupancy Costs” section), with total sales in excess of $30.9 million and an overall occupancy cost of 10.3%. As of October 6, 2016, The Shops at Somerset Square Mortgaged Property was 89.3% occupied by 35 tenants.
The following table presents certain information relating to the tenancy at The Shops at Somerset Square Property:
Major Tenants
| Tenant Name | Credit Rating (Fitch/Moody’s/ S&P)(1) | Tenant NRSF | % of NRSF | Annual U/W Base Rent PSF(2) | Annual U/W Base Rent(2) | % of Total Annual U/W Base Rent | Sales PSF(3) | Occupancy Cost(3) | Lease Expiration Date | |||||||||
| Major Tenants | ||||||||||||||||||
| Victoria’s Secret | BB+/Ba1/BB+ | 6,241 | 5.5% | $40.00 | $249,640 | 8.1% | $333 | 12.0% | 1/31/2020 | |||||||||
| Talbots | NR/B2/B- | 8,405 | 7.4% | $26.50 | $222,732 | 7.2% | $264 | 15.5% | 1/31/2018(4) | |||||||||
| Max Fish Restaurant | NR/NR/NR | 6,749 | 5.9% | $33.00 | $222,717 | 7.2% | $807 | 6.2% | 11/30/2017(5) | |||||||||
| Cafe Max | NR/NR/NR | 5,502 | 4.8% | $33.00 | $181,566 | 5.9% | $688 | 7.3% | 11/30/2019(6) | |||||||||
| AnnTaylor | NR/Ba2/BB- | 6,800 | 6.0% | $20.29 | $138,000 | 4.5% | $131(7) | 15.5%(7) | 8/31/2017(8) | |||||||||
| Chico’s FAS | NR/NR/NR | 3,917 | 3.4% | $35.00 | $137,095 | 4.5% | $319 | 15.8% | 2/29/2020 | |||||||||
| Jos A Bank | NR/B2/B | 5,014 | 4.4% | $26.50 | $132,871 | 4.3% | $243 | 16.8% | 1/31/2021(9) | |||||||||
| White House/Black Market | NR/NR/NR | 3,315 | 2.9% | $39.00 | $129,285 | 4.2% | $445 | 12.0% | 2/28/2022 | |||||||||
| Massage Envy | NR/NR/NR | 3,499 | 3.1% | $35.00 | $122,465 | 4.0% | $355 | 13.9% | 12/31/2018 | |||||||||
| Total Major Tenants | 49,442 | 43.4% | $31.07 | $1,536,371 | 49.9% | |||||||||||||
| Non-Major Tenants | 52,404 | 46.0% | $29.47 | $1,544,250 | 50.1% | |||||||||||||
| Occupied Collateral Total | 101,846 | 89.3% | $30.25 | $3,080,621 | 100.0% | |||||||||||||
| Vacant Space | 12,141 | 10.7% | ||||||||||||||||
| Collateral Total | 113,987 | 100.0% | ||||||||||||||||
| (1) | Certain ratings are those of the parent company whether or not the parent guarantees the lease. |
| (2) | Annual U/W Base Rent PSF and Annual U/W Base Rent include contractual rent steps through October 2017 totaling $24,433. |
| (3) | Sales PSF and Occupancy Cost are for the trailing 12-month period ending June 30, 2016 or July 31, 2016. |
| (4) | Talbots has one, three-year lease extension option. |
| (5) | Max Fish Restaurant has two, five-year lease extension options. |
| (6) | Cafe Max has two, five-year lease extension options. |
| (7) | Sales PSF and Occupancy Cost are for the trailing 12-month period ending January 31, 2016. |
| (8) | AnnTaylor has the right to terminate its lease any time after December 31, 2016 with two months’ notice. |
| (9) | Jos A Bank has one, five-year lease extension option. |
THE INFORMATION IN THIS STRUCTURAL AND COLLATERAL TERM SHEET IS NOT COMPLETE AND MAY BE AMENDED PRIOR TO THE TIME OF SALE. THIS TERM SHEET IS NOT AN OFFER TO SELL THESE SECURITIES AND IT IS NOT A SOLICITATION OF AN OFFER TO BUY THESE SECURITIES IN ANY JURISDICTION WHERE THE OFFER OR SALE IS NOT PERMITTED.
56
| THE SHOPS AT SOMERSET SQUARE |
The following table presents certain information relating to the historical sales and occupancy costs at The Shops at Somerset Square Property:
Historical Sales (PSF) and Occupancy Costs(1)
| Tenant Name | 2013 | 2014 | 2015 | TTM 2016(2) | Current Occupancy Cost(3) |
| Victoria’s Secret | $342 | $329 | $334 | $333 | 12.0% |
| Talbots | $242 | $247 | $272 | $264 | 15.5% |
| Max Fish Restaurant | $715 | $753 | $779 | $807 | 6.2% |
| Cafe Max | $665 | $677 | $698 | $688 | 7.3% |
| AnnTaylor | $210 | $200 | $170 | $131 | 15.5% |
| Chico’s FAS | $387 | $364 | $320 | $319 | 15.8% |
| Jos A Bank | $311 | $309 | $247 | $243 | 16.8% |
| White House/Black Market | $528 | $481 | $461 | $445 | 12.0% |
| Massage Envy | $344 | $361 | $351 | $355 | 13.9% |
| Total Comparable Sales(4) | $442 | $442 | $450 | $439 | |
| Occupancy Costs(4) | 10.2% | 10.2% | 10.0% | 10.3% |
| (1) | Historical Sales (PSF) and Occupancy Costs were provided by the seller. Current Occupancy Cost is based on the most recent available historical sales. |
| (2) | TTM 2016 sales are based on the most recent available trailing-twelve month 2016 sales. |
| (3) | Current Occupancy Costs are based on the Annual U/W Base Rent, reimbursements and percentage rent (if applicable) and historical sales. |
| (4) | Comparable Sales and Occupancy Costs are for the 20 tenants that reported four historical periods of sales (The Harvey & Lewis Company (1.3% of net rentable area) did not report trailing-twelve sales; their year-end 2015 sales were used). |
The following table presents certain information relating to the lease rollover schedule at The Shops at Somerset Square Property:
Lease Expiration Schedule(1)(2)
| Year Ending December 31, | No. of Leases Expiring | Expiring NRSF | % of Total NRSF | Cumulative Expiring NRSF | Cumulative % of Total NRSF | Annual U/W Base Rent | % of Total Annual U/W Base Rent | Annual U/W Base Rent PSF(3) | ||||||||
| MTM | 0 | 0 | 0.0% | 0 | 0.0% | $0 | 0.0% | $0.00 | ||||||||
| 2016 | 0 | 0 | 0.0% | 0 | 0.0% | $0 | 0.0% | $0.00 | ||||||||
| 2017 | 4 | 17,026 | 14.9% | 17,026 | 14.9% | $448,544 | 14.6% | $26.34 | ||||||||
| 2018 | 6 | 16,312 | 14.3% | 33,338 | 29.2% | $469,400 | 15.2% | $28.78 | ||||||||
| 2019 | 5 | 10,710 | 9.4% | 44,048 | 38.6% | $353,530 | 11.5% | $33.01 | ||||||||
| 2020 | 8 | 23,072 | 20.2% | 67,120 | 58.9% | $825,202 | 26.8% | $35.77 | ||||||||
| 2021 | 3 | 7,609 | 6.7% | 74,729 | 65.6% | $223,636 | 7.3% | $29.39 | ||||||||
| 2022 | 3 | 8,760 | 7.7% | 83,489 | 73.2% | $280,307 | 9.1% | $32.00 | ||||||||
| 2023 | 4 | 13,787 | 12.1% | 97,276 | 85.3% | $342,581 | 11.1% | $24.85 | ||||||||
| 2024 | 0 | 0 | 0.0% | 97,276 | 85.3% | $0 | 0.0% | $0.00 | ||||||||
| 2025 | 0 | 0 | 0.0% | 97,276 | 85.3% | $0 | 0.0% | $0.00 | ||||||||
| 2026 | 2 | 4,570 | 4.0% | 101,846 | 89.3% | $137,421 | 4.5% | $30.07 | ||||||||
| Thereafter | 0 | 0 | 0.0% | 101,846 | 89.3% | $0 | 0.0% | $0.00 | ||||||||
| Vacant | 0 | 12,141 | 10.7% | 113,987 | 100.0% | $0 | 0.0% | $0.00 | ||||||||
| Total/Weighted Average | 35 | 113,987 | 100.0% | $3,080,621 | 100.0% | $30.25 |
| (1) | Information obtained from the underwritten rent roll. |
| (2) | Certain tenants may have lease termination options that are exercisable prior to the originally stated expiration date of the subject lease and that are not considered in the Lease Expiration Schedule. |
| (3) | Weighted Average Annual U/W Base Rent PSF excludes vacant space. |
The following table presents historical occupancy percentages at The Shops at Somerset Square Property:
Historical Occupancy
12/31/2012(1) | 12/31/2013(1) | 12/31/2014(1) | 12/31/2015(1) | 10/6/2016(2) | ||||
| 91.8% | 91.3% | 93.6% | 87.7% | 89.3% |
| (1) | Information obtained from a third-party market research report. |
| (2) | Information obtained from the underwritten rent roll. |
THE INFORMATION IN THIS STRUCTURAL AND COLLATERAL TERM SHEET IS NOT COMPLETE AND MAY BE AMENDED PRIOR TO THE TIME OF SALE. THIS TERM SHEET IS NOT AN OFFER TO SELL THESE SECURITIES AND IT IS NOT A SOLICITATION OF AN OFFER TO BUY THESE SECURITIES IN ANY JURISDICTION WHERE THE OFFER OR SALE IS NOT PERMITTED.
57
| THE SHOPS AT SOMERSET SQUARE |
Operating History and Underwritten Net Cash Flow. The following table presents certain information relating to the historical operating performance and the underwritten net cash flow at The Shops at Somerset Square Property:
Cash Flow Analysis(1)
| 2014 | 2015 | TTM 8/31/2016 | U/W | % of U/W Effective Gross Income | U/W $ per SF | |||||||
| Base Rent | $3,396,483 | $3,210,931 | $3,247,367 | $3,080,621(2) | 73.1% | $27.03(2) | ||||||
| Grossed Up Vacant Space | 0 | 0 | 0 | 371,151 | 8.8 | 3.26 | ||||||
| Percentage Rent | 23,431 | 19,475 | 0 | 67,029 | 1.6 | 0.59 | ||||||
| Total Reimbursables | 1,153,044 | 1,090,914 | 1,149,678 | 1,013,530 | 24.1 | 8.89 | ||||||
| Other Income | 0 | 1,430 | 53,427 | 53,032 | 1.3 | 0.47 | ||||||
| Less Vacancy & Credit Loss | 0 | 0 | 0 | (371,151)(3) | (8.8) | (3.26) |
| |||||
| Effective Gross Income | $4,572,958 | $4,322,750 | $4,450,472 | $4,214,213 | 100.0% | $36.97 | ||||||
| Total Operating Expenses | $1,885,984 | $1,869,191 | $1,886,510 | $1,671,516 | 39.7% | $14.66 | ||||||
| Net Operating Income | $2,686,974 | $2,453,559 | $2,563,962 | $2,542,697 | 60.3% | $22.31 | ||||||
| TI/LC | 0 | 0 | 0 | 87,386 | 2.1 | 0.77 | ||||||
| Capital Expenditures | 0 | 0 | 0 | 30,222 | 0.7 | 0.27 |
| |||||
| Net Cash Flow | $2,686,974 | $2,453,559 | $2,563,962 | $2,425,088 | 57.5% | $21.28 | ||||||
| NOI DSCR | 1.54x | 1.41x | 1.47x | 1.46x | ||||||||
| NCF DSCR | 1.54x | 1.41x | 1.47x | 1.39x | ||||||||
| NOI DY | 8.9% | 8.1% | 8.5% | 8.4% | ||||||||
| NCF DY | 8.9% | 8.1% | 8.5% | 8.0% | ||||||||
| (1) | 2013 historical operating statements were not provided by the seller. |
| (2) | Annual U/W Base Rent PSF and Annual U/W Base Rent include contractual rent steps through October 2017 totaling $24,433. |
| (3) | The underwritten economic vacancy is 10.8%. The Shops at Somerset Square Property is 89.3% physically occupied as of October 6, 2016. |
Appraisal.As of the appraisal valuation date of September 2, 2016, The Shops at Somerset Square Property had an “as-is” appraised value of $42,000,000.
Environmental Matters. According to a Phase I environmental site assessment dated September 13, 2016, there was no evidence of any recognized environmental conditions at The Shops at Somerset Square Property.
Market Overview and Competition.The Shops at Somerset Square Property is located in Glastonbury, Connecticut, approximately 5.8 miles southeast of the Hartford central business district. Located directly off of Route 3 on the Glastonbury Boulevard, The Shops at Somerset Square Property is easily accessible from Interstate 91, the major north-south transportation corridor for the center of Connecticut. The main entrance to The Shops at Somerset Square Property is provided via a signalized intersection at Glastonbury Boulevard and the on/off-ramp to State Route 3, providing convenient access. The surrounding retail centers are anchored by regional draws as Home Depot, TJ Maxx, Petco and Michaels and grocers as Whole Foods, ShopRite and Super Stop & Shop, creating an additional retail area in The Shops at Somerset Square’s immediate proximity. The Shops at Somerset Square also abuts and shares common parking access with approximately 248,064 square foot of Class A office buildings, which exhibit a current occupancy rate of approximately 89.9%, a five-year average historical occupancy rate of 92.8% and provide a captive daytime shopping and dining base.
According to the appraisal, The Shops at Somerset Square has a primary trade area that encompasses a five-mile radius. The 2015 population within a three- and five-mile radius were reported at approximately 51,264 and 189,304, respectively, and average household income within the same radii were reported at approximately $82,487 and $74,681, respectively. According to the appraisal, as of year-end 2015, The Shops at Somerset Square Property’s primary five-mile trade area had average retail sales per household of $68,634, which is in-line with the Hartford Core-Based Statistical Area average and well above the United States average of $54,920.
The appraiser estimated market rent for The Shops at Somerset Square Property to be $32.53 per square foot on a triple net basis, compared to the Annual U/W Base Rent PSF of $30.25 per square foot at The Shops at Somerset Square Property. According to a third party market research report, The Shops at Somerset Square Property is located in the East Hartford retail submarket cluster, which as of the second quarter 2016 had a total inventory of 12.6 million square feet and exhibits an average vacancy of 5.8%. The Shops at Somerset Square Property is also located within the Glastonbury retail micro-market, which as of the second quarter 2016 had a total inventory of 1.5 million square feet and exhibits an average vacancy of 4.2%.
THE INFORMATION IN THIS STRUCTURAL AND COLLATERAL TERM SHEET IS NOT COMPLETE AND MAY BE AMENDED PRIOR TO THE TIME OF SALE. THIS TERM SHEET IS NOT AN OFFER TO SELL THESE SECURITIES AND IT IS NOT A SOLICITATION OF AN OFFER TO BUY THESE SECURITIES IN ANY JURISDICTION WHERE THE OFFER OR SALE IS NOT PERMITTED.
58
| THE SHOPS AT SOMERSET SQUARE |
The following table presents certain information relating to comparable properties to The Shops at Somerset Square Property:
Comparable Leases(1)
| Property Name/Location | Year Built/ Renovated | Specific Property Type | Distance from Subject | Tenant Name | Lease Date/Term | Lease Area (SF) | Annual Base Rent PSF | Lease Type | ||||||||
| Blueback Square West Hartford, CT | 2006/NAP | Lifestyle Center | 8.7 miles | Available | September 2016 / NAV | 3,100 | $34.00 | NNN | ||||||||
| Blueback Square, West Hartford, CT | 2006/NAP | Lifestyle Center | 8.7 miles | GNC | January 2013 / 5 Yrs | 1,548 | $32.00 | NNN | ||||||||
| Griswold Shoppes, Glastonbury, CT | 1962/NAP | Neighborhood Center | 0.5 miles | Available | September | 2,000 | $25.00 | NNN | ||||||||
| 730 Hebron Avenue, Glastonbury, CT | 1982/NAP | Strip Center | 2.4 miles | Available | September 2016 / NAV | 800 | $25.00 | NNN | ||||||||
| Somerset Square Shopping Center Glastonbury, CT | 1995/NAP | Community Center | 0.3 miles | Empire Wine & Liquor | January 2016 / 10 Yrs. | 6,500 | $20.00 | NNN | ||||||||
| Wethersfield Shopping Center Wethersfield, CT | 1960/2000 | Community Center | 8.9 miles | Smoker’s Paradise | September 2015 / 5 Yrs | 600 | $24.65 | NNN | ||||||||
| Storrs Center Storrs, CT | NAV/2013 | Lifestyle Center | 24.8 miles | Webster Bank | May 2013 / 10 Yrs | 1,600 | $35.00 | NNN |
| (1) | Information obtained from the appraisal. |
The Borrower.The borrower is Shops at Somerset Square, LLC, a Delaware limited liability company and single purpose entity with two independent directors. Legal counsel to the borrower delivered a non-consolidation opinion in connection with the origination of The Shops at Somerset Square Mortgage Loan. Rouse Properties, LP is the guarantor of certain nonrecourse carveouts for The Shops at Somerset Square Mortgage Loan.
The Sponsor.The sponsor is Rouse Properties, LP (“Rouse”). Rouse is a publicly traded real estate investment trust headquartered in New York. As of October 19, 2016, Rouse has a portfolio of properties, which includes 36 malls and retail centers in 22 states encompassing approximately 23.8 million square feet of retail space. As of December 31, 2015, Rouse had total assets of approximately $2.5 billion and total equity of $534.5 million. Rouse was acquired by an affiliate of Brookfield Asset Management Inc. (“Brookfield”) on July 6, 2016. Brookfield owns or manages 150 premier office properties totaling more than 100 million square feet in key gateway cities in the United States, United Kingdom, Canada, Australia, Brazil and India. The indirect owner of the borrower and the sponsor (which is the carve-out guarantor) is a publically traded REIT into which certain properties (not including The Shops at Somerset) were spun off in connection with the April 2009 bankruptcy filing of General Growth Properties, Inc., which emerged from bankruptcy in November 2010. See also“Description of the Mortgage Pool—Loan Purpose; Default History, Bankruptcy Issues and Other Proceedings” in the Preliminary Prospectus. Rouse reported that it is currently named as a defendant in a class action lawsuit concerning the fairness of the sale of Rouse to an affiliate of Brookfield. See“Description of the Mortgage Pool-Litigation and Other Considerations” in the Preliminary Prospectus.
Escrows.The loan documents provide for upfront reserves in the amount of $71,596 for real estate taxes and $50,000 for outstanding TI/LC reserves for Cafe Max. The loan documents require monthly deposits of $71,596 for real estate taxes, $2,519 for replacement reserves (subject to cap of $60,444) and $12,349 for tenant improvements and leasing commissions reserve (subject to a cap of $444,549).
The loan documents do not require ongoing monthly escrows for insurance premiums as long as (i) no event of default has occurred and is continuing; (ii) The Shops at Somerset Square Property is insured via an acceptable blanket insurance policy; and (iii) the borrower provides the lender with evidence of renewal of the policies and timely proof of payment of insurance premiums.
Lockbox and Cash Management.The Shops at Somerset Mortgage Loan requires a lender-controlled hard lockbox account, which is already in place, and that the borrower and property manager direct all tenants to pay their rents directly into such lockbox account. The loan documents also require that all rents received by the borrower or property manager be deposited into the lockbox account within five business days of receipt. Prior to the occurrence of a Cash Trap Event Period (as defined below), all excess funds on deposit in the lockbox account are disbursed to the borrower. During a Cash Trap Event Period, all excess funds are required to be swept to a lender-controlled cash management account.
A “Cash Trap Event Period” will commence upon the earlier of (i) the occurrence of an event of default; or (ii) the amortizing debt service coverage ratio falling below 1.20x. A Cash Trap Event Period will expire, with regard to clause (i), upon the cure of such event of default; and with regard to clause (ii), upon the amortizing debt service coverage ratio being equal to or greater than 1.25x for two consecutive calendar quarters.
However, upon the occurrence and continuance of a Cash Trap Event Period caused solely by the amortizing debt service coverage ratio being less than 1.20x at the end of any trailing 12-month period, the borrower may (but will not be obligated to) cure such Cash Trap Event Period by posting (x) cash and/or (y) an evergreen letter of credit in form and substance reasonably acceptable to the lender, in an aggregate amount equal to the amount by which The Shops at Somerset Mortgage Loan would have to be partially prepaid in order for the amortizing debt service coverage ratio to be at least 1.25x, and such deposit of cash or provision of a letter of credit will cure such Cash Trap Event Period caused by the existence and continuance of the amortizing debt service coverage ratio being less than 1.20x, provided that when the amortizing debt service coverage ratio continues to be tested as of the end of each
THE INFORMATION IN THIS STRUCTURAL AND COLLATERAL TERM SHEET IS NOT COMPLETE AND MAY BE AMENDED PRIOR TO THE TIME OF SALE. THIS TERM SHEET IS NOT AN OFFER TO SELL THESE SECURITIES AND IT IS NOT A SOLICITATION OF AN OFFER TO BUY THESE SECURITIES IN ANY JURISDICTION WHERE THE OFFER OR SALE IS NOT PERMITTED.
59
| THE SHOPS AT SOMERSET SQUARE |
calendar quarter and with respect to such calculations, the borrower will be given credit against the outstanding balance of The Shops at Somerset Mortgage Loan for any such cash deposited or the face amount of any such letter of credit.
Property Management. The Shops at Somerset Square Property is managed by an affiliate of the borrower.
Assumption.The borrower has the two-time right to transfer The Shops at Somerset Square Property provided that certain conditions are satisfied, including (i) no event of default has occurred and is continuing; (ii) the lender reasonably determines that the proposed transferee and guarantor satisfy the lender’s credit review and underwriting standards, taking into consideration the transferee’s experience, financial strength and general business standing; and (iii) if required by the lender, the lender has received confirmation from DBRS, Fitch, Moody’s and Morningstar that such assumption will not result in a downgrade, withdrawal or qualification of the respective ratings assigned to the Series 2016-LC25 certificates.
Partial Release. Not permitted.
Additional Indebtedness. The loan documents permit the pledge of direct or indirect ownership interests in the borrower for corporate-level lines of credit or other company financing, subject to certain conditions, including (i) the pledgee is an institutional lender regularly engaged in the practice of making such loans; (ii) the debt facility for such pledge is secured by substantial collateral other than The Shops at Somerset Square Property; (iii) repayment of the debt facility is not tied specifically to The Shops at Somerset Square Property’s cash flow; and (iv) any transfer resulting from the pledge shall satisfy certain transfer requirements specified in the loan documents. See “Description of the Mortgage Pool—Subordinate and/or Other Financing” in the Preliminary Prospectus.
Real Estate Substitution.Not permitted.
Subordinate and Mezzanine Indebtedness.Not permitted.
Ground Lease. None.
Terrorism Insurance.The loan documents require that the “all risk” insurance policy to be maintained by the borrower provide coverage for terrorism in an amount equal to the full replacement cost of The Shops at Somerset Square Property (provided that the borrower is not required to pay terrorism premiums in excess of two times the premium for all risk and business interruption coverage if the Terrorism Risk Insurance Program Reauthorization Act is no longer in effect). The loan documents also require business interruption insurance covering no less than the 18-month period following the occurrence of a casualty event, together with a six-month extended period of indemnity.
Windstorm Insurance.The loan documents require windstorm insurance covering the full replacement cost of The Shops at Somerset Square Property during the loan term. At the time of closing, The Shops at Somerset Square Property has windstorm insurance coverage.
THE INFORMATION IN THIS STRUCTURAL AND COLLATERAL TERM SHEET IS NOT COMPLETE AND MAY BE AMENDED PRIOR TO THE TIME OF SALE. THIS TERM SHEET IS NOT AN OFFER TO SELL THESE SECURITIES AND IT IS NOT A SOLICITATION OF AN OFFER TO BUY THESE SECURITIES IN ANY JURISDICTION WHERE THE OFFER OR SALE IS NOT PERMITTED.
60
| CAUSEWAY PLAZA I, II & III |
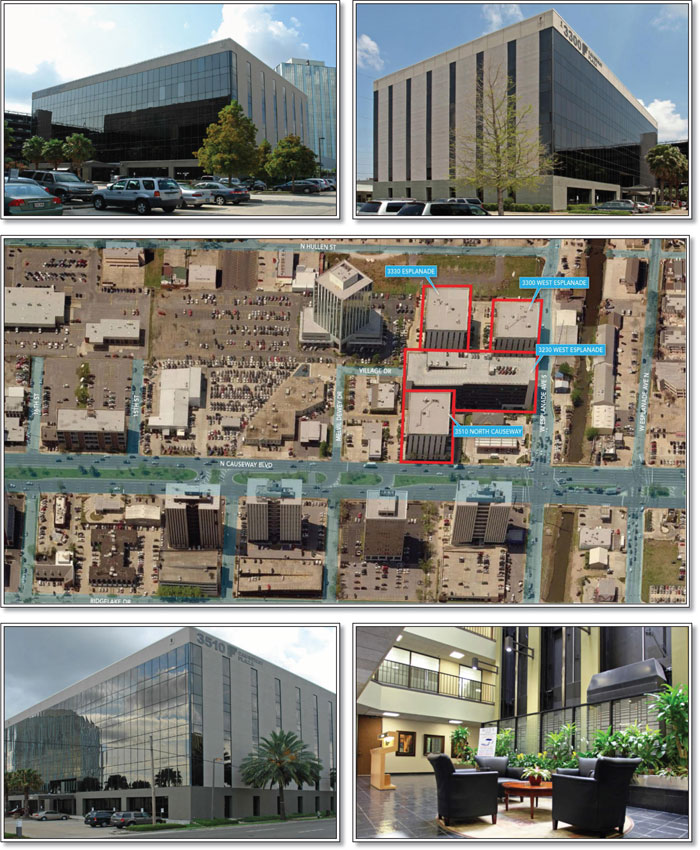
THE INFORMATION IN THIS STRUCTURAL AND COLLATERAL TERM SHEET IS NOT COMPLETE AND MAY BE AMENDED PRIOR TO THE TIME OF SALE. THIS TERM SHEET IS NOT AN OFFER TO SELL THESE SECURITIES AND IT IS NOT A SOLICITATION OF AN OFFER TO BUY THESE SECURITIES IN ANY JURISDICTION WHERE THE OFFER OR SALE IS NOT PERMITTED.
61
| CAUSEWAY PLAZA I, II & III |
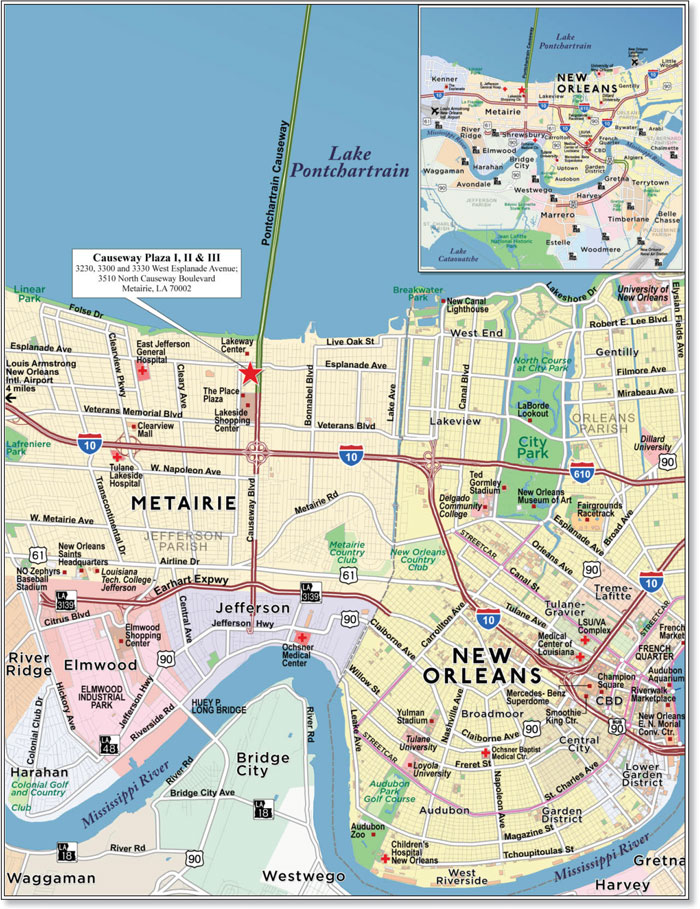
THE INFORMATION IN THIS STRUCTURAL AND COLLATERAL TERM SHEET IS NOT COMPLETE AND MAY BE AMENDED PRIOR TO THE TIME OF SALE. THIS TERM SHEET IS NOT AN OFFER TO SELL THESE SECURITIES AND IT IS NOT A SOLICITATION OF AN OFFER TO BUY THESE SECURITIES IN ANY JURISDICTION WHERE THE OFFER OR SALE IS NOT PERMITTED.
62
| No. 8 – Causeway Plaza I, II & III | |||||||
| Loan Information | Property Information | ||||||
| Mortgage Loan Seller: | Wells Fargo Bank, National Association | Single Asset/Portfolio: | Single Asset | ||||
| Credit Assessment (DBRS/Fitch/Moody’s/Morningstar): | NR/NR/NR/NR | Property Type: | Office | ||||
| Original Principal Balance: | $30,000,000 | Specific Property Type: | Suburban | ||||
| Cut-off Date Balance: | $30,000,000 | Location: | Metairie, LA | ||||
| % of Initial Pool Balance: | 3.1% | Size: | 335,566 SF | ||||
| Loan Purpose: | Refinance | Cut-off Date Balance Per SF: | $89.40 | ||||
| Borrower Name: | West Esplanade Causeway Associates LLC | Year Built/Renovated: | 1980/2012 | ||||
| Sponsor: | Jeffrey J. Feil | Title Vesting: | Fee | ||||
| Mortgage Rate: | 4.250% | Property Manager: | Self-managed | ||||
| Note Date: | October 31, 2016 | 4thMost Recent Occupancy (As of): | 88.0% (12/31/2012) | ||||
| Anticipated Repayment Date: | NAP | 3rdMost Recent Occupancy (As of): | 90.0% (12/31/2013) | ||||
| Maturity Date: | November 11, 2026 | 2ndMost Recent Occupancy (As of): | 98.0% (12/31/2014) | ||||
| IO Period: | 60 months | Most Recent Occupancy (As of): | 94.0% (12/31/2015) | ||||
| Loan Term (Original): | 120 months | Current Occupancy (As of): | 94.4% (10/1/2016) | ||||
| Seasoning: | 1 month | ||||||
| Amortization Term (Original): | 360 months | Underwriting and Financial Information: | |||||
| Loan Amortization Type: | Interest-only, Amortizing Balloon | ||||||
| Interest Accrual Method: | Actual/360 | 4thMost Recent NOI (As of)(2): | $2,387,362 (12/31/2013) | ||||
| Call Protection: | L(25),D(91),O(4) | 3rdMost Recent NOI (As of)(2): | $3,076,576 (12/31/2014) | ||||
| Lockbox Type: | Soft/Springing Cash Management | 2ndMost Recent NOI (As of): | $3,330,721 (12/31/2015) | ||||
| Additional Debt: | None | Most Recent NOI (As of): | $3,487,021 (TTM 6/30/2016) | ||||
| Additional Debt Type: | NAP | ||||||
| U/W Revenues: | $6,456,590 | ||||||
| U/W Expenses: | $3,179,030 | ||||||
| U/W NOI: | $3,277,560 | ||||||
| U/W NCF: | $2,700,366 | ||||||
| Escrows and Reserves(1): | U/W NOI DSCR: | 1.85x | |||||
| U/W NCF DSCR: | 1.52x | ||||||
| Type: | Initial | Monthly | Cap (If Any) | U/W NOI Debt Yield: | 10.9% | ||
| Taxes | $439,678 | $39,971 | NAP | U/W NCF Debt Yield: | 9.0% | ||
| Insurance | $0 | Springing | NAP | As-Is Appraised Value: | $41,150,000 | ||
| Replacement Reserves | $0 | $5,872 | NAP | As-Is Appraisal Valuation Date: | September 23, 2016 | ||
| TI/LC Reserve | $0 | $41,946 | $1,500,000 | Cut-off Date LTV Ratio: | 72.9% | ||
| Outstanding TI/LC Reserve | $508,725 | $0 | NAP | LTV Ratio at Maturity or ARD: | 66.4% | ||
| (1) | See “Escrows” section. |
| (2) | See “Cash Flow Analysis” section. |
The Mortgage Loan. The mortgage loan (the “Causeway Plaza I, II & III Mortgage Loan”) is evidenced by a single promissory note that is secured by a first mortgage encumbering the borrower’s fee interest in an office complex located in Metairie, Louisiana (the “Causeway Plaza I, II & III Property”). The Causeway Plaza I, II & III Mortgage Loan was originated on October 31, 2016 by Wells Fargo Bank, National Association. The Causeway Plaza I, II & III Mortgage Loan had an original principal balance of $30,000,000, has an outstanding principal balance as of the Cut-off Date of $30,000,000 and accrues interest at an interest rate of 4.250%per annum. The Causeway Plaza I, II & III Mortgage Loan had an initial term of 120 months, has a remaining term of 119 months as of the Cut-off Date and requires interest-only payments for the first 60 payments following origination and, thereafter, requires payments of principal and interest based on a 30-year amortization schedule. The Causeway Plaza I, II & III Mortgage Loan matures on November 11, 2026.
Following the lockout period, the borrower has the right to prepay the Causeway Plaza I, II & III Mortgage Loan in whole, but not in part, on any date before August 11, 2026. In addition, the Causeway Plaza I, II & III Mortgage Loan is prepayable without penalty on or after August 11, 2026.
THE INFORMATION IN THIS STRUCTURAL AND COLLATERAL TERM SHEET IS NOT COMPLETE AND MAY BE AMENDED PRIOR TO THE TIME OF SALE. THIS TERM SHEET IS NOT AN OFFER TO SELL THESE SECURITIES AND IT IS NOT A SOLICITATION OF AN OFFER TO BUY THESE SECURITIES IN ANY JURISDICTION WHERE THE OFFER OR SALE IS NOT PERMITTED.
63
| CAUSEWAY PLAZA I, II & III |
Sources and Uses
| Sources | Uses | |||||||
| Original whole loan amount | $30,000,000 | 100.0% | Loan payoff(1) | $26,666,945 | 88.9% | |||
| Reserves | 948,403 | 3.2 | ||||||
| Closing costs | 168,913 | 0.6 | ||||||
| Return of equity | 2,215,739 | 7.4 | ||||||
| Total Sources | $30,000,000 | 100.0% | Total Uses | $30,000,000 | 100.0% |
| (1) | The Causeway Plaza I, II & III Property was previously securitized in the BACM 2007-1 transaction. |
The Property. The Causeway Plaza I, II & III Property is a three-building, six-story, class B office building totaling approximately 335,566 square feet located in Metairie, Louisiana approximately seven miles northwest of the New Orleans central business district. The Causeway Plaza I, II & III Property includes an 8-story parking structure containing 1,193 parking spaces, which along with the 193 surface spaces, results in a parking ratio of 4.13 spaces per 1,000 feet of rentable area. The office buildings are similar in design and are each arranged around their own central atrium lobby. Built in phases from 1980 to 1985 and renovated in 2012, the Causeway Plaza I, II & III Property features a diverse tenant roster comprising 38 tenants with the three largest tenants, Jacobs Engineering Group Inc. (NYSE: JEC) (“Jacobs Engineering”), AT&T (rated A-/Baa1/BBB+ by Fitch, Moody’s and S&P, respectively) and Hub International Gulf South (“Hub International”), representing only 39.1% of the combined net rentable area and no other tenant representing more than 7.2% of underwritten annual base rent. Jacobs Engineering provides technical, professional, and construction services to various industrial, commercial, and governmental clients. Jacobs Engineering has been in occupancy since 1998 and has expanded and renewed its lease multiple times at the Causeway Plaza I, II & III Property. Both AT&T and Hub International have been in occupancy at the Causeway Plaza I, II & III Property for over 10 years and have renewed their leases at least once. Tenants comprising approximately 64.8% of net rentable area have been in occupancy for over 10 years. The Causeway Plaza I, II & III Property has averaged 93.4% occupancy since 2007, and has never dropped below 88.0%. As of October 1, 2016, the Causeway Plaza I, II & III Property was 94.4% occupied by 38 tenants subject to 49 leases.
The following table presents certain information relating to the tenancies at the Causeway Plaza I, II & III Property:
Major Tenants
| Tenant Name | Credit Rating (Fitch/Moody’s/ S&P)(1) | Tenant NRSF | % of NRSF | Annual U/W Base Rent PSF(2) | Annual U/W Base Rent(2) | % of Total Annual U/W Base Rent | Lease Expiration Date |
| Major Tenants | |||||||
| Jacobs Engineering Group Inc. | NR/NR/NR | 49,413 | 14.7% | $20.25(3) | $1,000,545(3) | 16.5% | Various(3) |
| AT&T | A-/Baa1/BBB+ | 45,339 | 13.5% | $18.75 | $850,106 | 14.1% | 3/31/2019(4) |
| Hub International Gulf South | NR/Caa2/B | 36,484 | 10.9% | $18.50(5) | $674,952(5) | 11.2% | Various(5) |
| Project Consulting Services | NR/NR/NR | 22,320 | 6.7% | $19.50 | $435,240 | 7.2% | 3/31/2022(6) |
| Cannon Cochran Management Services Inc. | NR/NR/NR | 22,147 | 6.6% | $18.50 | $409,719 | 6.8% | 8/31/2025(7) |
| Total Major Tenants | 175,703 | 52.4% | $19.18 | $3,370,562 | 55.7% | ||
| Non-Major Tenants | 141,100 | 42.0% | $18.97 | $2,677,037 | 44.3% | ||
| Occupied Collateral Total | 316,803 | 94.4% | $19.09 | $6,047,599 | 100.0% | ||
| Vacant Space | 18,763 | 5.6% | |||||
| Collateral Total | 335,566 | 100.0% | |||||
| (1) | Certain ratings are those of the parent company whether or not the parent guarantees the lease. |
| (2) | Annual U/W Base Rent PSF and Annual U/W Base Rent include contractual rent steps through September 2017 totaling $14,727. |
| (3) | Jacobs Engineering Group Inc. leases multiple suites under multiple leases: 12,422 square feet (3.7% of the net rentable area) with an Annual U/W Base Rent PSF of $19.50 expiring November 30, 2017 and 36,991 square feet (11.0% of the net rentable area) with an Annual U/W Base Rent PSF of $20.50 expiring November 30, 2022. |
| (4) | AT&T has the option to terminate 18,347 square feet (5.5% of net rentable area) of its space any time after March 31, 2017 with nine months’ required notice and payment of a termination fee equal to unamortized tenant improvements and leasing commissions and an additional payment of approximately $22,934. |
| (5) | Hub International Gulf South leases multiple suites under multiple leases with 65 square feet (0.2% of the net rentable area) leased as storage space with an Annual U/W Base Rent PSF of $18.46 leased on a month to month basis and 36,419 square feet (10.9% of the net rentable area) leased as office space with an Annual U/W Base Rent PSF of $18.50 expiring April 30, 2023. |
| (6) | Project Consulting Services has the option to terminate its lease effective March 31, 2020 with notice required by September 30, 2019 and payment of a termination fee equal to unamortized tenant improvements and leasing commissions and an additional payment of approximately $161,310. |
| (7) | Cannon Cochran Management Services Inc. has the option to terminate its lease any time after September 30, 2020 with 6 months’ required notice and payment of a termination equal to unamortized tenant improvements and leasing commissions and three months of current base rent at the time of notice. |
THE INFORMATION IN THIS STRUCTURAL AND COLLATERAL TERM SHEET IS NOT COMPLETE AND MAY BE AMENDED PRIOR TO THE TIME OF SALE. THIS TERM SHEET IS NOT AN OFFER TO SELL THESE SECURITIES AND IT IS NOT A SOLICITATION OF AN OFFER TO BUY THESE SECURITIES IN ANY JURISDICTION WHERE THE OFFER OR SALE IS NOT PERMITTED.
64
| CAUSEWAY PLAZA I, II & III |
The following table presents certain information relating to the lease rollover schedule at the Causeway Plaza I, II & III Property:
Lease Expiration Schedule(1)(2)
| Year Ending December 31, | No. of Leases Expiring | Expiring NRSF | % of Total NRSF | Cumulative Expiring NRSF | Cumulative % of Total NRSF | Annual U/W Base Rent | % of Total Annual U/W Base Rent | Annual U/W Base Rent PSF(3) |
| MTM | 7 | 1,608 | 0.5% | 1,608 | 0.5% | $30,180 | 0.5% | $18.77 |
| 2016 | 0 | 0 | 0.0% | 1,608 | 0.5% | $0 | 0.0% | $0.00 |
| 2017 | 9 | 38,675 | 11.5% | 40,283 | 12.0% | $740,170 | 12.2% | $19.14 |
| 2018 | 10 | 36,592 | 10.9% | 76,875 | 22.9% | $714,580 | 11.8% | $19.53 |
| 2019 | 7 | 79,858 | 23.8% | 156,733 | 46.7% | $1,517,967 | 25.1% | $19.01 |
| 2020 | 6 | 21,120 | 6.3% | 177,853 | 53.0% | $404,568 | 6.7% | $19.16 |
| 2021 | 3 | 11,854 | 3.5% | 189,707 | 56.5% | $213,197 | 3.5% | $17.99 |
| 2022 | 3 | 59,311 | 17.7% | 249,018 | 74.2% | $1,193,556 | 19.7% | $20.12 |
| 2023 | 2 | 44,309 | 13.2% | 293,327 | 87.4% | $823,662 | 13.6% | $18.59 |
| 2024 | 0 | 0 | 0.0% | 293,327 | 87.4% | $0 | 0.0% | $0.00 |
| 2025 | 1 | 22,147 | 6.6% | 315,474 | 94.0% | $409,719 | 6.8% | $18.50 |
| 2026 | 0 | 0 | 0.0% | 315,474 | 94.0% | $0 | 0.0% | $0.00 |
| Thereafter(4) | 1 | 1,329 | 0.4% | 316,803 | 94.4% | $0 | 0.0% | $0.00 |
| Vacant | 0 | 18,763 | 5.6% | 335,566 | 100.0% | $0 | 0.0% | $0.00 |
| Total/Weighted Average | 49 | 335,566 | 100.0% | $6,047,599 | 100.0% | $19.09 |
| (1) | Information obtained from the underwritten rent roll. |
| (2) | Certain tenants may have lease termination options that are exercisable prior to the stated expiration date of the subject lease and that are not considered in the Lease Expiration Schedule. |
| (3) | Weighted Average Annual U/W Base Rent PSF excludes vacant space. |
| (4) | Includes one suite occupied as a management office (1,329 square foot) with no attributed lease or Annual U/W Base Rent. |
The following table presents historical occupancy percentages at the Causeway Plaza I, II & III Property:
Historical Occupancy
12/31/2012(1) | 12/31/2013(1) | 12/31/2014(1) | 12/31/2015(1) | 10/1/2016(2) |
| 88.0% | 90.0% | 98.0% | 94.0% | 94.4% |
| (1) | Information obtained from the borrower. |
| (2) | Information obtained from the underwritten rent roll. |
Operating History and Underwritten Net Cash Flow.The following table presents certain information relating to the historical operating performance and the underwritten net cash flow at the Causeway Plaza I, II & III Property:
Cash Flow Analysis
| 2013(1) | 2014(1) | 2015 | TTM 6/30/2016 | U/W | % of U/W Effective Gross Income | U/W $ per SF | |||||||||
| Base Rent | $5,333,459 | $5,729,083 | $5,883,192 | $6,068,643 | $5,932,466(2) | 91.9% | $17.68 | ||||||||
| Grossed Up Vacant Space | 0 | 0 | 0 | 0 | 481,011 | 7.4 | 1.43 | ||||||||
| Total Reimbursables | 225,383 | 425,589 | 498,388 | 376,942 | 394,083 | 6.1 | 1.17 | ||||||||
| Other Income | 123,952 | 133,633 | 130,858 | 130,946 | 130,041 | 2.0 | 0.39 | ||||||||
| Less Vacancy & Credit Loss | 0 | 0 | 0 | 0 | (481,011)(3) | (7.4) | (1.43) | ||||||||
| Effective Gross Income | $5,682,794 | $6,288,305 | $6,512,438 | $6,576,531 | $6,456,590 | 100.0% | $19.24 | ||||||||
| Total Operating Expenses | $3,295,432 | $3,211,729 | $3,181,717 | $3,089,510 | $3,179,030 | 49.2% | $9.47 | ||||||||
| Net Operating Income | $2,387,362 | $3,076,576 | $3,330,721 | $3,487,021 | $3,277,560 | 50.8% | $9.77 | ||||||||
| TI/LC | 0 | 0 | 0 | 0 | 506,725 | 7.8 | 1.51 | ||||||||
| Capital Expenditures | 0 | 0 | 0 | 0 | 70,469 | 1.1 | 0.21 | ||||||||
| Net Cash Flow | $2,387,362 | $3,076,576 | $3,330,721 | $3,487,021 | $2,700,366 | 41.8% | $8.05 | ||||||||
| NOI DSCR | 1.35x | 1.74x | 1.88x | 1.97x | 1.85x | ||||||||||
| NCF DSCR | 1.35x | 1.74x | 1.88x | 1.97x | 1.52x | ||||||||||
| NOI DY | 8.0% | 10.3% | 11.1% | 11.6% | 10.9% | ||||||||||
| NCF DY | 8.0% | 10.3% | 11.1% | 11.6% | 9.0% |
| (1) | The increase in Net Operating Income from 2013 to 2014 was due to the increase in occupancy from 90.0% as of December 31, 2013 to 98.0% as of December 31, 2014. |
| (2) | U/W Base Rent includes contractual rent steps through September 2017 totaling $14,727. |
| (3) | The underwritten economic vacancy is 7.5%. The Causeway Plaza I, II & III Property was 94.4% physically occupied as of October 1, 2016. |
Appraisal.As of the appraisal valuation date of September 23, 2016, the Causeway Plaza I, II & III Property had an “as-is” appraised value of $41,150,000.
Environmental Matters. According to a Phase I environmental site assessment dated September 23, 2016, there was no evidence of any recognized environmental conditions at the Causeway Plaza I, II & III Property.
THE INFORMATION IN THIS STRUCTURAL AND COLLATERAL TERM SHEET IS NOT COMPLETE AND MAY BE AMENDED PRIOR TO THE TIME OF SALE. THIS TERM SHEET IS NOT AN OFFER TO SELL THESE SECURITIES AND IT IS NOT A SOLICITATION OF AN OFFER TO BUY THESE SECURITIES IN ANY JURISDICTION WHERE THE OFFER OR SALE IS NOT PERMITTED.
65
| CAUSEWAY PLAZA I, II & III |
Market Overview and Competition. The Causeway Plaza I, II & III Property located along N. Causeway Boulevard approximately seven miles northwest of the New Orleans central business district. According to the appraisal, land uses within the Causeway Plaza I, II & III Property’s neighborhood consist mainly of retail and commercial developments. The immediate area contains limited vacant land sites and the vast majority of the surrounding developments benefit from the high traffic counts along Causeway Boulevard (62,287 vehicles per day), Veterans Boulevard (67,205 vehicles per day), Clearview Parkway (58,806 vehicles per day) and Interstate 10 (191,358 vehicles per day). The Causeway Plaza I, II & III Property benefits from its location at the intersection of W. Esplanade Avenue and N. Causeway Boulevard, the first major commercial hub whereby the Lake Pontchartrain Causeway reaches the south shore of Lake Pontchartrain. The Lake Pontchartrain Causeway, which spans approximately 24 miles, is the longest bridge over water in the world and is the only direct route connecting Covington and New Orleans, Louisiana.
According to a third party market report, Metairie office rental rates are typically higher than central business district office rates, but when central business district parking costs are factored in the analysis, the asking rent in Metairie compared to the central business district market is significantly less. Several factors, including ample parking proximity to large North Shore residential communities (along Lake Pontchartrain) and lack of new office product development contribute to the strong office market.
According to a third party market report, the Causeway Plaza I, II & III Property is located in the Airport/Kenner/Metairie submarket of the New Orleans office market. As of the third quarter of 2016, the Airport/Kenner/Metairie submarket contained 766 buildings comprising approximately 9.5 million square feet (19.8% of the New Orleans office market) and reported a vacancy rate of 5.3%, with an average rental rate of $17.91 per square foot on a gross basis. According to the appraisal, the 2016 population within a three- and five-mile radius were reported at approximately 110,052 and 240,459, respectively, and average household income within the same radii were reported at approximately $83,885 and $77,952, respectively. The population is expected to grow 0.4% and 0.7% within the same three- and five-mile radius from 2016 to 2021.
The following table presents certain information relating to comparable office leases for the Causeway Plaza I, II & III Property:
Comparable Leases(1)
| Property Name/Location | Year Built/ Renovated | Stories | Total GLA (SF) | Total Occupancy | Distance from Subject | Tenant Name | Lease Date/Term | Lease Area (SF) | Annual Base Rent PSF | Lease Type |
Executive Tower Metairie, LA | 1972/NAP | 14 | 184,609 | 93% | 0.1 miles | C2C Resources | April 2016 / 3.0 Yrs | 1,364 | $17.00 | BYS |
| Executive Tower Metairie, LA | 1972/NAP | 14 | 184,609 | 93% | 0.1 miles | BOPCP | January 2016 / 4.0 Yrs | 4,726 | $16.00 | BYS |
| Executive Tower Metairie, LA | 1972/NAP | 14 | 184,609 | 93% | 0.1 miles | McDonough Marine Service | December 2015 / 5.0 Yrs | 12,468 | $17.00 | BYS |
| Executive Tower Metairie, LA | 1972/NAP | 14 | 184,609 | 93% | 0.1 miles | Streamline Title Company | June 2015 / 3.0 Yrs | 1,154 | $19.00 | BYS |
| 3445 N. Causeway Metairie, LA | 1979/NAP | 10 | 128,876 | 88% | 0.1 miles | R.W. Krebs | December 2014 / 3.0 Yrs | 3,474 | $17.50 | BYS |
| Metairie Tower Metairie, LA | 1973/NAP | 6 | 93,595 | 91% | 3.7 miles | Confidential | December 2015 / 3.0 Yrs | 515 | $20.00 | FSG |
Heritage Plaza Metairie, LA | 1983/NAP | 20 | 353,003 | 90% | 3.0 miles | Confidential | August 2016 / 5.0 Yrs | 2,087 | $19.00 | FSG |
Severn Place Metairie, LA | 1983/NAP | 5 | 85,674 | 100% | 0.6 miles | Confidential | April 2015 / 5.0 Yrs | 3,569 | $18.50 | FSG |
| (1) | Information obtained from the appraisal. |
The Borrower.The borrower is West Esplanade Causeway Associates LLC, a New York limited liability company and single purpose entity with two independent directors. Legal counsel to the borrower delivered a non-consolidation opinion in connection with the origination of the Causeway Plaza I, II & III Mortgage Loan. Jeffrey J. Feil is the guarantor of certain nonrecourse carveouts under the Causeway Plaza I, II & III Mortgage Loan.
The Sponsor.The sponsor is Jeffrey J. Feil, CEO of The Feil Organization, a real estate investment, development and management firm based New York City. Founded over 60 years ago, The Feil Organization developed and manages over 26.0 million square feet of retail, commercial and industrial properties, over 5,000 residential rental units, as well as hundreds of net leased properties and thousands of acres of undeveloped land across the United States. Mr. Feil is involved in ongoing litigation with various family members and shareholders. See “Description of the Mortgage Pool – Litigation and Other Considerations” in the Preliminary Prospectus.
Escrows.The loan documents provide for upfront reserves of $439,678 for real estate taxes and $508,725 for outstanding tenant improvements and leasing commissions (“TI/LCs”) related to three tenants: Jacobs Engineering Group Inc. ($311,838), Project Consulting Services ($141,596) and Jewish Family Services ($55,291). The loan documents also provide for ongoing monthly reserves of $39,971 for real estate taxes; $5,872 for replacement reserves; and $41,946 for TI/LCs (capped at $1.5 million). The loan documents do not require monthly escrows for insurance premiums as long as (i) no event of default has occurred and is continuing; (ii) the Causeway Plaza I, II & III Property is insured under an acceptable blanket insurance policy; and (iii) the borrower provides the lender with evidence of renewal of the policies and timely proof of the payment of insurance premiums.
Lockbox and Cash Management.The Causeway Plaza I, II & III Mortgage Loan documents require a lender-controlled lockbox account, which is already in place, and the borrower and property manager are required to deposit all rents directly into such lockbox account within one business days of receipt. Prior to the occurrence of a Cash Trap Event Period (as defined below), all funds on deposit in the lockbox account are required to be disbursed to the borrower. Upon the occurrence of a Cash Trap Event Period, the
THE INFORMATION IN THIS STRUCTURAL AND COLLATERAL TERM SHEET IS NOT COMPLETE AND MAY BE AMENDED PRIOR TO THE TIME OF SALE. THIS TERM SHEET IS NOT AN OFFER TO SELL THESE SECURITIES AND IT IS NOT A SOLICITATION OF AN OFFER TO BUY THESE SECURITIES IN ANY JURISDICTION WHERE THE OFFER OR SALE IS NOT PERMITTED.
66
| CAUSEWAY PLAZA I, II & III |
borrower or property manager are required to cause all rents to be deposited directly into such lockbox account and all excess funds in the lockbox account will be swept to a lender-controlled subaccount.
A “Cash Trap Event Period” will commence upon the earlier of (i) the occurrence and continuance of an event of default; (ii) the net cash flow debt yield being less than 7.5% or (iii) the earlier of (a) May 31, 2017 or (b) receipt of notice by the borrower that Jacobs Engineering Group Inc. intends to terminate its lease at the Causeway Plaza I, II & III Property. A Cash Trap Event Period will end with respect to clause (i), upon the cure of such event of default; with respect to clause (ii), upon the net cash flow debt yield being at least 7.75% for two consecutive calendar quarters; or, with respect to clause (iii), all or substantially all of the Jacobs Engineering Group Inc. space is released to an acceptable replacement tenant or tenants or Jacobs Engineering irrevocably exercises its renewal option with respect to all or substantially all of their space. A Cash Trap Event Period with respect to clause (iii) may also be cured if the borrower deposits with the lender an amount equal to $35.00 per square foot.
Property Management.The Causeway Plaza I, II & III Property is managed by an affiliate of the borrower.
Assumption.The borrower has the two-time right to transfer the Causeway Plaza I, II & III Property, provided that certain other conditions are satisfied, including, but not limited to (i) no event of default has occurred and is continuing; (ii) the lender’s reasonable determination that the proposed transferee and guarantor satisfy the lender’s credit review and underwriting standards, taking into consideration transferee experience, financial strength and general business standing; and (iii) if requested by the lender, rating agency confirmation from DBRS, Fitch, Moody’s and Morningstar that the transfer will not result in a downgrade, withdrawal or qualification of the respective ratings assigned to the Series 2016-LC25 certificates.
Partial Release.Not permitted.
Real Estate Substitution.Not permitted.
Subordinate and Mezzanine Indebtedness.Not permitted.
Ground Lease.None.
Terrorism Insurance.The loan documents require that the “all risk” insurance policy required to be maintained by the borrower provide coverage for terrorism in an amount equal to the full replacement cost of the Causeway Plaza I, II & III Property, as well as business interruption insurance covering no less than the 18-month period following the occurrence of a casualty event, together with a 12-month extended period of indemnity and subject to a cap equal to two times the premium for the casualty coverage on a stand-alone basis.
Windstorm Insurance.The loan documents require windstorm insurance covering the full replacement cost of Causeway Plaza I, II and III Property during the loan term. At the time of closing, The Causeway Plaza I, II and III Property has windstorm insurance coverage.
THE INFORMATION IN THIS STRUCTURAL AND COLLATERAL TERM SHEET IS NOT COMPLETE AND MAY BE AMENDED PRIOR TO THE TIME OF SALE. THIS TERM SHEET IS NOT AN OFFER TO SELL THESE SECURITIES AND IT IS NOT A SOLICITATION OF AN OFFER TO BUY THESE SECURITIES IN ANY JURISDICTION WHERE THE OFFER OR SALE IS NOT PERMITTED.
67
| FAIRFIELD INN & SUITES BROOKLYN |

THE INFORMATION IN THIS STRUCTURAL AND COLLATERAL TERM SHEET IS NOT COMPLETE AND MAY BE AMENDED PRIOR TO THE TIME OF SALE. THIS TERM SHEET IS NOT AN OFFER TO SELL THESE SECURITIES AND IT IS NOT A SOLICITATION OF AN OFFER TO BUY THESE SECURITIES IN ANY JURISDICTION WHERE THE OFFER OR SALE IS NOT PERMITTED.
68
| FAIRFIELD INN & SUITES BROOKLYN |
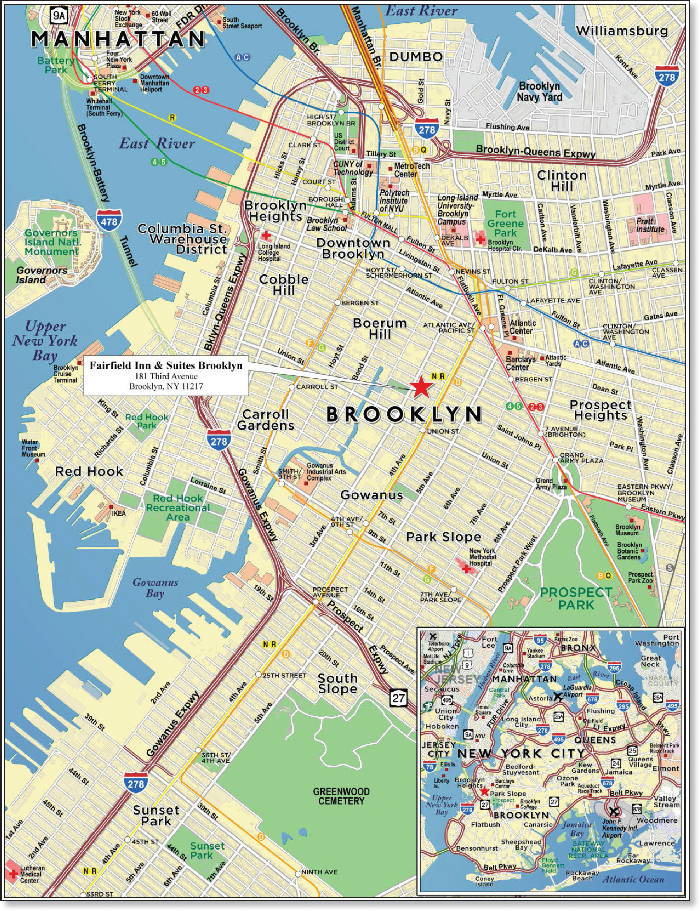
THE INFORMATION IN THIS STRUCTURAL AND COLLATERAL TERM SHEET IS NOT COMPLETE AND MAY BE AMENDED PRIOR TO THE TIME OF SALE. THIS TERM SHEET IS NOT AN OFFER TO SELL THESE SECURITIES AND IT IS NOT A SOLICITATION OF AN OFFER TO BUY THESE SECURITIES IN ANY JURISDICTION WHERE THE OFFER OR SALE IS NOT PERMITTED.
69
| No. 9 – Fairfield Inn & Suites Brooklyn | |||||||
| Loan Information | Property Information | ||||||
| Mortgage Loan Seller: | Ladder Capital Finance LLC | Single Asset/Portfolio: | Single Asset | ||||
| Credit Assessment (DBRS/Fitch/Moody’s/Morningstar): | NR/NR/NR/NR | Property Type: | Hospitality | ||||
| Original Principal Balance: | $28,500,000 | Specific Property Type: | Limited Service | ||||
| Cut-off Date Balance: | $28,429,236 | Location: | Brooklyn, NY | ||||
| % of Initial Pool Balance: | 3.0% | Size: | 133 Rooms | ||||
| Loan Purpose: | Refinance | Cut-off Date Balance Per Room: | $213,754 | ||||
| Borrower Name: | Freud Third Avenue Properties, LLC | Year Built/Renovated: | 2011/NAP | ||||
| Sponsor: | Marc Jay Freud | Title Vesting: | Fee | ||||
| Mortgage Rate: | 4.560% | Property Manager: | Gulph Creek Partners LP | ||||
| Note Date: | September 26, 2016 | 4thMost Recent Occupancy: | 78.7% (12/31/2012) | ||||
| Anticipated Repayment Date: | NAP | 3rdMost Recent Occupancy (As of): | 82.9% (12/31/2013) | ||||
| Maturity Date: | October 6, 2026 | 2ndMost Recent Occupancy (As of): | 83.2% (12/31/2014) | ||||
| IO Period: | None | Most Recent Occupancy (As of): | 86.5% (12/31/2015) | ||||
| Loan Term (Original): | 120 months | Current Occupancy (As of): | 86.0% (7/31/2016) | ||||
| Seasoning: | 2 months | ||||||
| Amortization Term (Original): | 360 months | Underwriting and Financial Information: | |||||
| Loan Amortization Type: | Amortizing Balloon | ||||||
| Interest Accrual Method: | Actual/360 | 4thMost Recent NOI (As of): | $4,043,146 (12/31/2013) | ||||
| Call Protection: | L(26),D(89),O(5) | 3rdMost Recent NOI (As of): | $3,802,377 (12/31/2014) | ||||
| Lockbox Type: | Hard/Upfront Cash Management | 2ndMost Recent NOI (As of): | $3,997,472 (12/31/2015) | ||||
| Additional Debt(1): | Yes | Most Recent NOI (As of): | $4,175,372 (TTM 7/31/2016) | ||||
| Additional Debt Type(1): | Future Mezzanine | ||||||
| U/W Revenues: | $8,480,548 | ||||||
| U/W Expenses: | $4,428,516 | ||||||
| U/W NOI: | $4,052,032 | ||||||
| Escrows and Reserves(2): | U/W NCF: | $3,628,004 | |||||
| U/W NOI DSCR: | 2.32x | ||||||
| Type: | Initial | Monthly | Cap (If Any) | U/W NCF DSCR: | 2.08x | ||
| Taxes | $29,182 | $4,864 | NAP | U/W NOI Debt Yield: | 14.3% | ||
| Insurance | $61,318 | $4,717 | NAP | U/W NCF Debt Yield: | 12.8% | ||
| FF&E Reserve | $0 | (2) | NAP | As-Is Appraised Value: | 46,900,000 | ||
| Deferred Maintenance | $16,025 | $0 | NAP | As-Is Appraised Valuation Date: | July 14, 2016 | ||
| PIP Reserve | $1,200,000 | Springing | NAP | Cut-off Date LTV Ratio: | 60.6% | ||
| Seasonality Reserve | $100,000 | Springing | $100,000 | LTV Ratio at Maturity or ARD: | 49.2% | ||
| (1) | See “Subordinate and Mezzanine Indebtedness” section. |
| (2) | See “Escrows” section. |
The Mortgage Loan. The mortgage loan (the “Fairfield Inn & Suites Brooklyn Mortgage Loan”) is evidenced by a single promissory note secured by a first mortgage encumbering the fee interest in a limited service hotel located in Brooklyn, New York (the “Fairfield Inn & Suites Brooklyn Property”). The Fairfield Inn & Suites Brooklyn Mortgage Loan was originated on September 26, 2016 by Ladder Capital Finance LLC. The Fairfield Inn & Suites Brooklyn Mortgage Loan had an original principal balance of $28,500,000, has an outstanding principal balance as of the Cut-off Date of $28,429,236 and accrues interest at an interest rate of 4.560%per annum. The Fairfield Inn & Suites Brooklyn Mortgage Loan had an initial term of 120 months, has a remaining term of 118 months as of the Cut-off Date and requires payments of principal and interest based on a 30-year amortization schedule through the term of the Fairfield Inn & Suites Brooklyn Mortgage Loan. The Fairfield Inn & Suites Brooklyn Mortgage Loan matures on October 6, 2026.
Following the lockout period, the borrower has the right to defease the Fairfield Inn & Suites Brooklyn Mortgage Loan in whole or in part (with respect to the parking lot, see “Partial Release” section), on any date before June 6, 2026. In addition, the Fairfield Inn & Suites Brooklyn Mortgage Loan is prepayable without penalty on or after June 6, 2026.
Sources and Uses
| Sources | Uses | ||||||||||
| Original loan amount | $28,500,000 | 100.0 | % | Loan payoff(1) | $23,603,554 | 82.8 | % | ||||
| Reserves | 1,406,524 | 4.9 | |||||||||
| Closing costs | 379,044 | 1.3 | |||||||||
| Return of equity | 3,110,877 | 10.9 | |||||||||
| Total Sources | $28,500,000 | 100.0 | % | Total Uses | $28,500,000 | 100.0 | % |
| (1) | The Fairfield Inn & Suites Brooklyn Property was previously securitized in the UBSBB 2012-C4 transaction and the payoff includes defeasance costs. |
THE INFORMATION IN THIS STRUCTURAL AND COLLATERAL TERM SHEET IS NOT COMPLETE AND MAY BE AMENDED PRIOR TO THE TIME OF SALE. THIS TERM SHEET IS NOT AN OFFER TO SELL THESE SECURITIES AND IT IS NOT A SOLICITATION OF AN OFFER TO BUY THESE SECURITIES IN ANY JURISDICTION WHERE THE OFFER OR SALE IS NOT PERMITTED.
70
| FAIRFIELD INN & SUITES BROOKLYN |
The Property.The Fairfield Inn & Suites Brooklyn Property consists of a limited-service hotel totaling 133 guestrooms, located in Brooklyn, New York. Situated on a 0.5-acre parcel, the Fairfield Inn & Suites Brooklyn Property was originally constructed in 2011. The Fairfield Inn & Suites Brooklyn Property is located in the Gowanus neighborhood near Park Slope and Boerum Hill.
The Fairfield Inn & Suites Brooklyn Property contains 102 king guestrooms, 28 double/double guestrooms and three one-bedroom suites. The guestrooms feature wooden accents, free internet and walk-in showers. Amenities at the Fairfield Inn & Suites Brooklyn Property include a breakfast dining area, 450 square feet of meeting space, a fitness center, a business center, a rooftop terrace and 33 on-site parking spots resulting in a parking ratio of 0.2 spaces per room. According to the appraisal, the demand segmentation for the Fairfield Inn & Suites Brooklyn Property in 2015 was 55% leisure, 35.0% commercial and 10.0% group. The franchise agreement with Marriott expires in July 2031.
Operating History and Underwritten Net Cash Flow. The following table presents certain information relating to the historical operating performance and the underwritten net cash flow at the Fairfield Inn & Suites Brooklyn Property:
Cash Flow Analysis
| 2013 | 2014 | 2015 | TTM 7/31/2016 | U/W | % of U/W Total Revenue | U/W $ per Room | |||||||||
| Occupancy | 82.9% | 83.2% | 86.5% | 86.0% | 86.0% | ||||||||||
| ADR | $185.50 | $179.42 | $187.84 | $192.37 | $192.37 | ||||||||||
| RevPAR | $153.70 | $149.32 | $162.55 | $165.36 | $165.36 | ||||||||||
| Room Revenue | $7,461,305 | $7,248,961 | $7,891,160 | $8,049,576 | $8,027,583 | 94.7% | $60,358 | ||||||||
| F&B Revenue | 0 | 0 | 0 | 14,825 | 14,784 | 0.2 | 111 | ||||||||
| Other Revenue | 358,997 | 343,819 | 434,366 | 439,381 | 438,181 | 5.2 | 3,295 | ||||||||
| Total Revenue | $7,820,302 | $7,592,780 | $8,325,526 | $8,503,782 | $8,480,548 | 100.0% | $63,764 | ||||||||
| Total Department Expenses | 1,673,659 | 1,809,425 | 1,971,676 | 2,002,647 | 1,945,927 | 22.9 | 14,631 | ||||||||
| Gross Operating Profit | $6,146,643 | $5,783,355 | $6,353,850 | $6,501,135 | $6,534,621 | 77.1% | $49,132 | ||||||||
| Total Undistributed Expenses | 2,020,804 | 1,899,608 | 2,252,931 | 2,225,823 | 2,379,366 | 28.1 | 17,890 | ||||||||
| Profit Before Fixed Charges | $4,125,839 | $3,883,747 | $4,100,919 | $4,275,312 | $4,155,255 | 49.0% | $31,243 | ||||||||
| Total Fixed Charges | 82,693 | 81,370 | 103,447 | 99,940 | 103,223(1) | 1.2 | 776 | ||||||||
| Net Operating Income | $4,043,146 | $3,802,377 | $3,997,472 | $4,175,372 | $4,052,032 | 47.8% | $30,466 | ||||||||
| FF&E | 0 | 0 | 0 | 0 | 424,027 | 5.0 | 3,188 | ||||||||
| Net Cash Flow | $4,043,146 | $3,802,377 | $3,997,472 | $4,175,372 | $3,628,004 | 42.8% | $27,278 | ||||||||
| NOI DSCR | 2.32x | 2.18x | 2.29x | 2.39x | 2.32x | ||||||||||
| NCF DSCR | 2.32x | 2.18x | 2.29x | 2.39x | 2.08x | ||||||||||
| NOI DY | 14.2% | 13.4% | 14.1% | 14.7% | 14.3% | ||||||||||
| NCF DY | 14.2% | 13.4% | 14.1% | 14.7% | 12.8% | ||||||||||
| (1) | The Fairfield Inn & Suites Brooklyn Property is subject to a 25-year tax abatement which provides for 100.0% tax relief for the first 16 years of the hotel’s operations followed by an annual 10.0% assessment escalation of the improvements through the 25th year. The tax abatement began in the 2012/2013 tax year and full taxes will not be incurred until the 2037/2038 tax year. Full taxes are estimated to be $1,124,618 for the 2016/2017 tax year. |
The Appraisal.As of the appraisal valuation date of July 14, 2016, the Fairfield Inn & Suites Brooklyn Property had an “as-is” appraised value of $46,900,000. Assuming completion of a property improvement plan (“PIP”) for which $1,200,000 was reserved at origination, the appraiser also concluded to an “as-complete” value of $50,200,000 as of August 1, 2018, which equates to an “as-complete” loan-to-value-ratio of 56.6% based off of the cut-off date balance. The appraiser also concluded to an “as-stabilized” value of $51,000,000 as of August 1, 2019, which equates to an “as-stabilized” loan-to-value-ratio of 55.7% based off of the cut-off date balance, and assumes a stabilized RevPAR of $190.11.
Environmental Matters. According to a Phase I environmental assessment dated September 1, 2016, there was evidence of a recognized environmental condition at the Fairfield Inn & Suites Brooklyn Property due to two open adjacent gas station leaking underground storage tank (“LUST”) sites and gasoline-related contamination. However, the environmental consultant concluded that no further investigation or action was required because: (i) the gasoline-related contamination (found in 2006) was determined to be attributable to an off-site source; (ii) with respect to one of the open LUST sites a responsible party has been identified and is addressing the contamination under the oversight of the New York State Department of Environmental Conservation (“NYSDEC”); (iii) the groundwater contamination associated with the second open LUST is not anticipated to impact the Fairfield Inn & Suites Brooklyn Property based on the direction of groundwater flow, a responsible party has been identified for the second LUST site and the NYSDEC is pursuing an enforcement action against that party to address the contamination; (iv) the NYSDEC does not consider the Fairfield Inn & Suites Brooklyn Property to be a source of contamination; and (v) the Fairfield Inn & Suites Brooklyn Property is serviced by public water and sewer.
• Market Overview and Competition.The Fairfield Inn & Suites Brooklyn Property is located in Brooklyn, New York in the Gowanus neighborhood adjacent to Park Slope and Boerum Hill. The Fairfield Inn & Suites Brooklyn Property is located near Interstate-278 and in close proximity to the Atlantic Avenue/Barclays Center, Atlantic Terminal, Bergen Street and Union Street
THE INFORMATION IN THIS STRUCTURAL AND COLLATERAL TERM SHEET IS NOT COMPLETE AND MAY BE AMENDED PRIOR TO THE TIME OF SALE. THIS TERM SHEET IS NOT AN OFFER TO SELL THESE SECURITIES AND IT IS NOT A SOLICITATION OF AN OFFER TO BUY THESE SECURITIES IN ANY JURISDICTION WHERE THE OFFER OR SALE IS NOT PERMITTED.
71
| FAIRFIELD INN & SUITES BROOKLYN |
Stations. Trains that service those stations include the 2, 3, 4, 5, D, N, R, B and Q New York City Subway lines as well as the Long Island Rail Road. The Barclays Center is located less than one mile from the Fairfield Inn & Suites Brooklyn Property and is home to the Brooklyn Nets and the New York Islanders. LaGuardia Airport is located seven miles to the northeast and John F. Kennedy International Airport is approximately nine miles to the east of the Fairfield Inn & Suites Brooklyn Property. Other demand generators that are within five miles include Long Island University, Brooklyn Museum, Brooklyn Botanic Garden, Metrotech Center, Brooklyn Bridge Park and the Brooklyn Navy Yard. According to the appraisal, the estimated 2016 population within a one-, three- and five-mile radius of the Fairfield Inn & Suites Brooklyn Property was 139,769, 1,129,183 and 2,695,889, respectively; the estimated 2016 average household income within the same radii was $143,528, $91,013 and $94,752, respectively.
•
The following table presents certain information relating to the Fairfield Inn & Suites Brooklyn Property’s competitive set:
Subject and Market Historical Occupancy, ADR and RevPAR(1)
| Competitive Set | Fairfield Inn & Suites Brooklyn | Penetration Factor | |||||||||||||||||
| Year | Occupancy | ADR | RevPAR | Occupancy | ADR | RevPAR | Occupancy | ADR | RevPAR | ||||||||||
| 7/31/2016 TTM | 82.3% | $180.56 | $148.58 | 85.9% | $191.50 | $164.46 | 104.4% | 106.1% | 110.7% | ||||||||||
| 7/31/2015 TTM | 88.8% | $170.25 | $151.15 | 84.6% | $181.35 | $153.40 | 95.3% | 106.5% | 101.5% | ||||||||||
| 7/31/2014 TTM | 85.5% | $177.10 | $151.43 | 81.3% | $173.29 | $140.95 | 95.1% | 97.8% | 93.1% | ||||||||||
| (1) | Information obtained from a third party hospitality research report dated August 18, 2016. The competitive set includes: Holiday Inn Express New York Brooklyn, Red Lion Inn & Suites Brooklyn, Hotel Le Bleu, Nu Hotel, aloft Hotel New York Brooklyn and the Best Western Plus Prospect Park Hotel. |
The Borrower.The borrower is Freud Third Avenue Properties, LLC, a New York limited liability company with one independent director. Legal counsel to the borrower delivered a non-consolidation opinion in connection with the origination of the Fairfield Inn & Suites Brooklyn Mortgage Loan. Marc Jay Freud is the guarantor of certain nonrecourse carveouts under the Fairfield Inn & Suites Brooklyn Mortgage Loan.
The Sponsor.The sponsor is Marc Jay Freud who is the Managing Member of Troutbrook Company Holdings, LLC, a privately held New York based developer and owner of residential, industrial, retail and hospitality properties in New York, Pennsylvania, California and Florida. Mr. Freud also owns a Hampton Inn in Allentown, Pennsylvania. Mr. Freud was the original developer of the asset and has owned it ever since completing construction in 2011.
Escrows.The loan documents provide for upfront escrows in the amount of $29,182 for real estate taxes, $61,318 for insurance, $1,200,000 for a PIP reserve; $100,000 for a seasonality reserve; and $16,025 for deferred maintenance. The loan documents also provide for ongoing reserves in the amount of $4,864 for real estate taxes, $4,717 for insurance and with respect to the FF&E reserve, the greater of (i) one-twelfth of 2.0% of gross room revenues for the first 18 monthly payments or 4.0% of gross room revenues for the remainder of the term of the Fairfield Inn & Suites Brooklyn Mortgage Loan and (ii) the amount required under the franchise agreement (which is currently calculated at 5.0%). Additionally, if the amount on deposit in the seasonality reserve is ever below $100,000 (the “Seasonality Reserve Cap”), then such reserve is to be replenished up to the Seasonality Reserve Cap through the collection of a monthly reserve amount equal to the lesser of (i) 25% of the Seasonality Reserve Cap and (ii) all available cash flow after prior waterfall distributions.
If at any time the Franchisor requires additional PIP work during the term of the Loan, Borrower must deposit 125% of the estimated costs to complete such PIP Work less the amount of FF&E funds that remain in the FF&E account that are not allocated for FF&E work and less the amount then on deposit in the PIP Reserve Account, within 30 days of receipt of the notice from Franchisor.
Lockbox and Cash Management.The Fairfield Inn & Suites Brooklyn Mortgage Loan requires a lender-controlled lockbox account, which is already in place, and that the borrower directs all credit card companies to pay all rents directly into such lockbox account. The loan documents also require that all rents received by the borrower or the property manager be deposited into the lockbox account within one business day of receipt. Prior to the occurrence of a Cash Sweep Event, the amounts on deposit in the lender-controlled lockbox account are swept daily into a borrower controlled account after payment of all in debt service, reserves and expenses. Upon the occurrence of a Cash Sweep Event, all excess funds after the waterfall distributions will be swept to a lender controlled account.
A “Cash Sweep Event” will commence upon any of the following: (i) the occurrence and continuance of an event of default under the Fairfield Inn & Suites Brooklyn Mortgage Loan or the management agreement; (ii) the debt service coverage ratio falling below 1.25x at any time; (iii) if in October of each calendar year, the seasonality reserve is less than the Seasonality Reserve Cap; (iv) the delivery of notice by the franchisor of an event of default or an event that with the passage of time and/or delivery of notice permits the franchisor to terminate the franchise agreement; and (v) the date which is twelve months prior to the expiration of the franchise agreement. A Cash Sweep Event will be cured, with regard to clause (i), upon the cure of such event of default or entering into a replacement management agreement with respect to a default under the management agreement; with regard to clause (ii), upon the debt service coverage ratio being equal to or greater than 1.30x for two consecutive calendar quarters; with regard to clause (iii) once the funds in deposit in the seasonality reserve are equal to the Seasonality Reserve Cap; and with regard to clause (iv), the date on which evidence is provided of the cure of such default or a new franchise agreement is entered into in accordance with the loan documents.
Property Management.The Fairfield Inn & Suites Brooklyn Property is managed by Gulph Creek Partners LP.
Assumption.The borrower has the right to transfer the Fairfield Inn & Suites Brooklyn Property provided that certain conditions are satisfied, including (i) no event of default has occurred and is continuing; (ii) the lender reasonably determines that the proposed
THE INFORMATION IN THIS STRUCTURAL AND COLLATERAL TERM SHEET IS NOT COMPLETE AND MAY BE AMENDED PRIOR TO THE TIME OF SALE. THIS TERM SHEET IS NOT AN OFFER TO SELL THESE SECURITIES AND IT IS NOT A SOLICITATION OF AN OFFER TO BUY THESE SECURITIES IN ANY JURISDICTION WHERE THE OFFER OR SALE IS NOT PERMITTED.
72
| FAIRFIELD INN & SUITES BROOKLYN |
transferee and guarantor satisfy the lender’s credit review and underwriting standards, taking into consideration the transferee’s experience, financial strength and general business standing; and (iii) if required by the lender, the lender has received confirmation from DBRS, Fitch, Moody’s and Morningstar that such assumption will not result in a downgrade, withdrawal or qualification of the respective ratings assigned to the Series 2016-LC25 certificates.
Partial Release.Following the lockout period, the borrower is permitted to obtain the release of the parking lot from the lien of the Fairfield Inn & Suites Brooklyn Mortgage Loan in connection with a partial defeasance, subject to certain conditions including: (i) there being no event of default under the loan agreement or franchise agreement; (ii) partial defeasance of the Fairfield Inn & Suites Brooklyn Mortgage Loan in the amount of the greater of 120% of the allocated loan amount, $2,810,000, or 100% of net sales proceeds; (iii) the debt service coverage ratio will be no less than the greater of 2.00x or the debt service coverage ratio in effect immediately prior to the release; (iv) the loan-to-value ratio will be no greater than the lesser of 61.0% and the loan-to-value ratio in effect immediately prior to the release; and (v) the borrower enters into any reciprocal easement agreements the lender requires.
Real Estate Substitution.Not permitted.
Subordinate and Mezzanine Indebtedness. The loan documents permit mezzanine financing subject to: (i) there being no event of default; (ii) a maximum combined loan-to-value ratio of 65.0%; (iii) a minimum combined debt service coverage ratio equal to 2.05x; (iv) the execution of an intercreditor agreement in form and substance acceptable to the lender; and (v) rating agency confirmation from DBRS, Fitch, Moody’s and Morningstar that the mezzanine financing will not result in a downgrade, withdrawal or qualification of the respective ratings assigned to the Series 2016-LC25 certificates.
Ground Lease.None.
Terrorism Insurance.The loan documents require that the “all risk” insurance policy required to be maintained by the borrower provide coverage for terrorism in an amount equal to the full replacement cost of the Fairfield Inn & Suites Brooklyn Property. The loan documents also require business interruption insurance covering no less than the 18-month period following the occurrence of a casualty event, together with a 360 days extended period of indemnity.
THE INFORMATION IN THIS STRUCTURAL AND COLLATERAL TERM SHEET IS NOT COMPLETE AND MAY BE AMENDED PRIOR TO THE TIME OF SALE. THIS TERM SHEET IS NOT AN OFFER TO SELL THESE SECURITIES AND IT IS NOT A SOLICITATION OF AN OFFER TO BUY THESE SECURITIES IN ANY JURISDICTION WHERE THE OFFER OR SALE IS NOT PERMITTED.
73
| GURNEE MILLS |
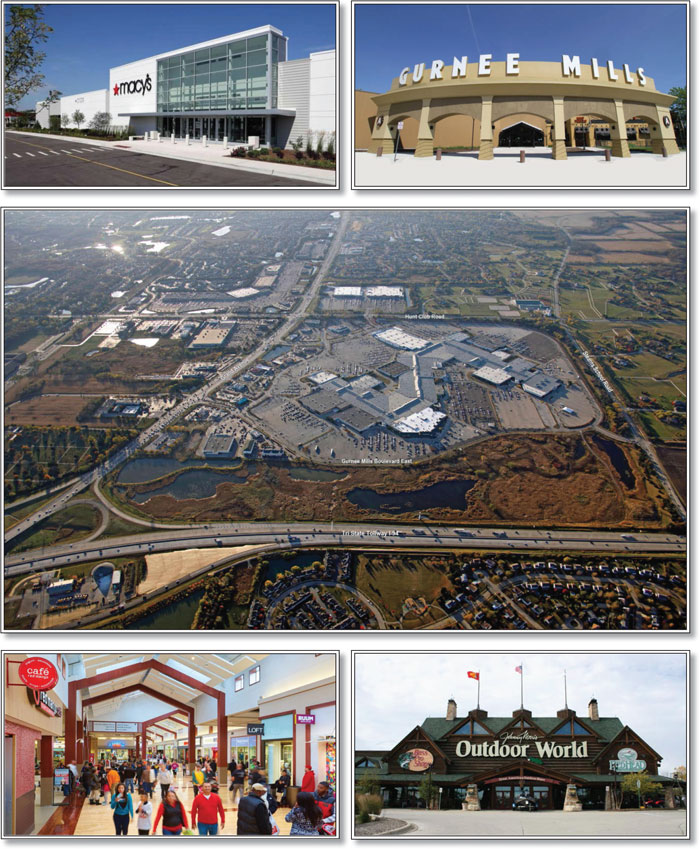
THE INFORMATION IN THIS STRUCTURAL AND COLLATERAL TERM SHEET IS NOT COMPLETE AND MAY BE AMENDED PRIOR TO THE TIME OF SALE. THIS TERM SHEET IS NOT AN OFFER TO SELL THESE SECURITIES AND IT IS NOT A SOLICITATION OF AN OFFER TO BUY THESE SECURITIES IN ANY JURISDICTION WHERE THE OFFER OR SALE IS NOT PERMITTED.
74
| GURNEE MILLS |
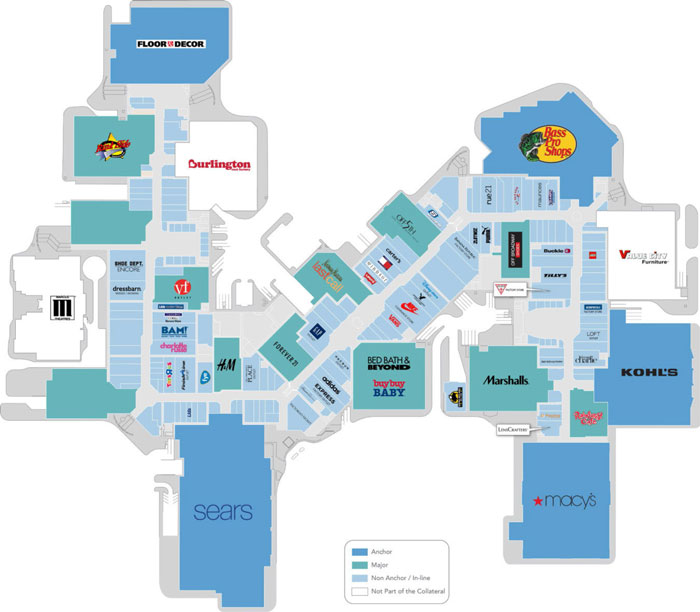
THE INFORMATION IN THIS STRUCTURAL AND COLLATERAL TERM SHEET IS NOT COMPLETE AND MAY BE AMENDED PRIOR TO THE TIME OF SALE. THIS TERM SHEET IS NOT AN OFFER TO SELL THESE SECURITIES AND IT IS NOT A SOLICITATION OF AN OFFER TO BUY THESE SECURITIES IN ANY JURISDICTION WHERE THE OFFER OR SALE IS NOT PERMITTED.
75
| GURNEE MILLS |
THE INFORMATION IN THIS STRUCTURAL AND COLLATERAL TERM SHEET IS NOT COMPLETE AND MAY BE AMENDED PRIOR TO THE TIME OF SALE. THIS TERM SHEET IS NOT AN OFFER TO SELL THESE SECURITIES AND IT IS NOT A SOLICITATION OF AN OFFER TO BUY THESE SECURITIES IN ANY JURISDICTION WHERE THE OFFER OR SALE IS NOT PERMITTED.
76
| No. 10 - Gurnee Mills | |||||||
| Loan Information | Property Information | ||||||
| Mortgage Loan Seller: | Wells Fargo Bank, National Association | Single Asset/Portfolio: | Single Asset | ||||
| Credit Assessment (DBRS/Fitch/Moody’s/Morningstar): | NR/NR/NR/NR | Property Type: | Retail | ||||
| Original Principal Balance(1): | $25,000,000 | Specific Property Type: | Super Regional Mall | ||||
| Cut-off Date Balance(1): | $24,930,491 | Location: | Gurnee, IL | ||||
| % of Initial Pool Balance: | 2.6% | Size(3): | 1,683,915 SF | ||||
| Loan Purpose: | Refinance | Cut-off Date Balance Per SF(1): | $162.86 | ||||
| Borrower Name: | Mall at Gurnee Mills, LLC | Year Built/Renovated: | 1991/2014 | ||||
| Sponsor: | Simon Property Group, L.P. | Title Vesting: | Fee | ||||
| Mortgage Rate: | 3.990% | Property Manager: | Self-managed | ||||
| Note Date: | September 27, 2016 | 4thMost Recent Occupancy (As of)(3): | 94.0% (12/31/2012) | ||||
| Anticipated Repayment Date: | NAP | 3rdMost Recent Occupancy (As of)(4): | 95.2% (12/31/2013) | ||||
| Maturity Date: | October 1, 2026 | 2ndMost Recent Occupancy (As of)(4): | 95.8% (12/31/2014) | ||||
| IO Period: | None | Most Recent Occupancy (As of)(4): | 95.1% (12/31/2015) | ||||
| Loan Term (Original): | 120 months | Current Occupancy (As of)(4): | 91.1% (9/22/2016) | ||||
| Seasoning: | 2 months | ||||||
| Amortization Term (Original): | 360 months | Underwriting and Financial Information: | |||||
| Loan Amortization Type: | Amortizing Balloon | ||||||
| Interest Accrual Method: | Actual/360 | 4thMost Recent NOI (As of): | $25,964,013 (12/31/2013) | ||||
| Call Protection: | L(26),D(87),O(7) | 3rdMost Recent NOI (As of): | $27,475,772 (12/31/2014) | ||||
| Lockbox Type: | Hard/Springing Cash Management | 2ndMost Recent NOI (As of): | $27,801,962 (12/31/2015) | ||||
| Additional Debt(1): | Yes | Most Recent NOI (As of): | $28,050,715 (TTM 7/31/2016) | ||||
| Additional Debt Type(1): | Pari Passu | ||||||
| U/W Revenues: | $40,778,955 | ||||||
| U/W Expenses: | $14,098,029 | ||||||
| U/W NOI: | $26,680,926 | ||||||
| U/W NCF: | $25,099,266 | ||||||
| U/W NOI DSCR(1): | 1.70x | ||||||
| Escrows and Reserves(2): | U/W NCF DSCR(1): | 1.60x | |||||
| U/W NOI Debt Yield(1): | 9.7% | ||||||
| Type: | Initial | Monthly | Cap (If Any) | U/W NCF Debt Yield(1): | 9.2% | ||
| Taxes | $0 | Springing | NAP | As-Is Appraised Value: | $417,000,000 | ||
| Insurance | $0 | Springing | NAP | As-Is Appraisal Valuation Date: | August 23, 2016 | ||
| Replacement Reserves | $0 | Springing | NAP | Cut-off Date LTV Ratio(1): | 65.8% | ||
| TI/LC Reserve | $0 | Springing | NAP | LTV Ratio at Maturity or ARD(1): | 52.4% | ||
| (1) | See “The Mortgage Loan” section. All statistical financial information related to balance per square foot, loan-to-value ratios, debt service coverage ratios and debt yields are based on the funded outstanding principal balance of the Gurnee Mills Whole Loan (as defined below) as of the Cut-off Date. |
| (2) | See “Escrows” section. |
| (3) | See “Historical Occupancy” section. |
| (4) | See “Cash Flow Analysis” section. As of September 22, 2016, the Gurnee Mills Mortgaged Property (as defined below) was 91.1% leased and 81.9% occupied. The leased percentage includes the Simon Master Lease (as defined below) (2.8% of net rentable area), Floor & Décor and three other tenants who have not yet taken occupancy, all totaling 9.2% of net rentable area combined. Current occupancy and leased percentages do not include any temporary tenants or non-collateral tenants. Including temporary tenants, occupancy in 2013, 2014, 2015 and as of September 22, 2016 was 98.2%, 98.9%, 97.6% and 94.8%, respectively. |
The Mortgage Loan. The mortgage loan (the “Gurnee Mills Mortgage Loan”) is part of a whole loan (the “Gurnee Mills Whole Loan”) that is evidenced by sixpari passu promissory notes (Notes A-1A, A-1B, A-2A, A-2B, A-3 and A-4) secured by a first mortgage encumbering a super-regional mall located in Gurnee, Illinois (the “Gurnee Mills Property”). The Gurnee Mills Whole Loan was co-originated on September 27, 2016 by Wells Fargo Bank, National Association, Column Financial, Inc. and Regions Bank. The Gurnee Mills Whole Loan had an original principal balance of $275,000,000, has an outstanding principal balance as of the Cut-off Date of $274,235,396 and accrues interest at an interest rate of 3.990%per annum. The Gurnee Mills Whole Loan had an initial term of 120 months, has a remaining term of 118 months as of the Cut-off Date and requires payments of principal and interest based on a 30-year amortization schedule through the term of the Gurnee Mills Whole Loan. The Gurnee Mills Whole Loan matures on October 1, 2026.
Note A-2B, which will be contributed to the WFCM 2016-LC25 Trust, had an original principal balance of $25,000,000, has an outstanding principal balance as of the Cut-off Date of $24,930,491 and represents a non-controlling interest in the Gurnee Mills Whole Loan. The controlling Note A-1A, which had an original principal balance of $75,000,000, is expected to be contributed to the CSAIL 2016-C7 securitization trust. The non-controlling Note A-2A, which had an original principal balance of $80,000,000, was contributed to the WFCM 2016-C36 securitization trust. The remaining non-controlling notes, which had an aggregate original
THE INFORMATION IN THIS STRUCTURAL AND COLLATERAL TERM SHEET IS NOT COMPLETE AND MAY BE AMENDED PRIOR TO THE TIME OF SALE. THIS TERM SHEET IS NOT AN OFFER TO SELL THESE SECURITIES AND IT IS NOT A SOLICITATION OF AN OFFER TO BUY THESE SECURITIES IN ANY JURISDICTION WHERE THE OFFER OR SALE IS NOT PERMITTED.
77
| GURNEE MILLS |
principal balance of $95,000,000, are expected to be contributed to future securitization trusts (referred to herein collectively as the “Gurnee Mills Companion Loans”). The lender provides no assurances that any non-securitizedpari passu note will not be split further. See “Description of the Mortgage Pool—The Whole Loans—The Non-Serviced Whole Loans—The Gurnee Mills Whole Loan” in the Preliminary Prospectus.
Note Summary(1)
| Notes | Original Balance | Note Holder | Controlling Interest | |
| A-1A | $75,000,000 | CSAIL 2016-C7 | Yes | |
| A-1B | $35,000,000 | Column Financial, Inc. | No | |
| A-2A | $80,000,000 | WFCM 2016-C36 | No | |
| A-2B | $25,000,000 | WFCM 2016-LC25 | No | |
| A-3 | $30,000,000 | Regions Bank | No | |
| A-4 | $30,000,000 | Regions Bank | No | |
| Total | $275,000,000 |
| (1) | The lender provides no assurances that any non-securitized pari passu note will not be split further. |
Following the lockout period, the borrower has the right to defease the Gurnee Mills Mortgage Loan in whole, but not in part, on any date before April 1, 2026. In addition, the Gurnee Mills Mortgage Loan is prepayable without penalty on or after April 1, 2026. The lockout period will expire on the earlier to occur of (i) two years after the closing date of the securitization that includes the last note to be securitized and (ii) November 1, 2019.
Sources and Uses
| Sources | Uses | |||||||
| Original whole loan amount | $275,000,000 | 85.1% | Loan payoff(1) | $322,543,428 | 99.8% | |||
| Sponsor’s new cash contribution | 48,328,282 | 14.9 | Closing costs | 784,854 | 0.2 | |||
| Total Sources | $323,328,282 | 100.0% | Total Uses | $323,328,282 | 100.0% |
| (1) | The Gurnee Mills Property was previously securitized in the JPMCC 2007-CB20 and JPMCC 2007-C1 transactions. |
The Property.The Gurnee Mills Property is a single-story, super-regional mall located at the intersection of Grand Avenue and Interstate-94 in Gurnee, Illinois, approximately 42.5 miles northwest of Chicago, Illinois. According to the appraisal, together with the adjacent Six Flag Great America (“Six Flags”) amusement park (located just across Interstate-94 approximately 2.8 miles southeast), the Gurnee Mills Property draws over 26 million visitors annually to the area. The Gurnee Mills Property contains 1,934,721 square feet of retail space, of which 1,683,915 square feet (the “Gurnee Mills Mortgaged Property”) serves as collateral for the Gurnee Mills Whole Loan. The Gurnee Mills Mortgaged Property is situated on a 233.5-acre parcel of land. Developed in 1991 by the Mills Corporation, the Gurnee Mills Property is anchored by Marcus Cinema (not part of the collateral), Burlington Coat Factory (not part of the collateral) and Value City Furniture (not part of the collateral), Bass Pro Shops Outdoor, Sears Grand, Floor & Décor, Kohl’s and Macy’s. Major tenants at the Gurnee Mills Mortgaged Property include Forever 21, Marshalls Homegoods, Rink Side, Last Call Neiman Marcus, Bed Bath & Beyond / Buy Buy Baby, Off Broadway Shoes, Rainforest Café and Saks Fifth Avenue Off 5th, among others. In 2013, the Macy’s anchor space was constructed at a reported cost to the tenant of $20.0 million and the borrower simultaneously invested $2.7 million in renovations to the Macy’s wing of the Gurnee Mills Mortgaged Property. Further, the borrower negotiated a buyout of a prior tenant and executed a lease with Floor & Décor in 2016 for 105,248 square feet (6.3% of net rentable area). Floor & Décor, which specializes in the hard surface flooring market, offering a broad in-stock selection of tile, wood, stone and flooring accessories straight from the manufacturers, began paying rent October 2016 and is expected to open in January 2017. Sports Authority previously occupied 46,892 square feet (2.8% of net rentable area) but declared bankruptcy and vacated the Gurnee Mills Mortgaged Property in 2016. Simon Property Group, Inc. (“SPG”) (rated A2/A by Moody’s and S&P) has executed a 10-year master lease for this space at a rent of $700,000 ($14.93 per square foot), which will burn off once they have a signed lease or leases and a tenant (or tenants) is in occupancy and paying full, unabated rent (the “Simon Master Lease”).
As of July 31, 2016, tenants occupying 10,000 square feet or less had trailing 12-month in-line sales of $347 per square foot, which is up 3.0% from 2014, with an average occupancy cost of 15.2%. 2015 total sales (for all tenants who reported) at the Gurnee Mills Property were $304.6 million. Further, according to servicer-reported information, the Gurnee Mills Mortgaged Property has exhibited increasing cash flow, with net operating income increasing 27.6% from approximately $22.0 million in 2007 to $28.1 million as of the trailing-twelve months July 2016 operating statement. As of September 22, 2016, the Gurnee Mills Mortgaged Property was 91.1% leased and 81.9% occupied by 159 tenants. The leased percentage includes the Simon Master Lease (2.8% of net rentable area), Floor & Décor and three other tenants who have not yet taken occupancy, all totaling 9.2% of net rentable area combined.
THE INFORMATION IN THIS STRUCTURAL AND COLLATERAL TERM SHEET IS NOT COMPLETE AND MAY BE AMENDED PRIOR TO THE TIME OF SALE. THIS TERM SHEET IS NOT AN OFFER TO SELL THESE SECURITIES AND IT IS NOT A SOLICITATION OF AN OFFER TO BUY THESE SECURITIES IN ANY JURISDICTION WHERE THE OFFER OR SALE IS NOT PERMITTED.
78
| GURNEE MILLS |
The following table presents certain information relating to the tenancy at the Gurnee Mills Property:
Major Tenants
| Tenant Name | Credit Rating (Fitch/Moody’s/ S&P)(1) | Tenant NRSF | % of NRSF | Annual U/W Base Rent PSF(2) | Annual U/W Base Rent(2) | % of Total Annual U/W Base Rent | Sales PSF(3) | Occupancy Cost(3) | Lease Expiration Date |
| Anchor Tenant – Not Part of Collateral | |||||||||
| Marcus Cinema | NR/NR/NR | 88,707 | ANCHOR OWNED – NOT PART OF THE COLLATERAL | ||||||
| Burlington Coat Factory | NR/NR/BB- | 82,320 | ANCHOR OWNED – NOT PART OF THE COLLATERAL | ||||||
| Value City Furniture | NR/NR/NR | 79,779 | ANCHOR OWNED – NOT PART OF THE COLLATERAL | ||||||
| Anchor Tenants | |||||||||
| Bass Pro Shops Outdoor | NR/Ba3/BB- | 137,201 | 8.1% | $10.15 | $1,392,590 | 6.3% | $189 | 5.4% | 8/31/2018 |
| Sears Grand | CC/Caa1/CCC+ | 201,439 | 12.0% | $5.00 | $1,007,195 | 4.6% | $71 | 8.6% | 4/30/2019(4) |
| Floor & Décor(5) | NR/NR/NR | 105,248 | 6.3% | $9.25 | $974,000 | 4.4% | NAP | NAP | 9/30/2026(6) |
| Kohl’s(7) | BBB/Baa2/BBB | 111,675 | 6.6% | $5.95(7) | $664,466 | 3.0% | $176(8) | 4.3%(8) | 9/2/2024(9) |
| Macy’s(10) | BBB/Baa2/BBB | 130,000 | 7.7% | $0(10) | $0(11) | 0.0% | $134(8) | 0.4%(8) | 1/31/2039(12) |
| Total Anchor Tenants | 685,563 | 40.7% | $7.27(13) | $4,038,251 | 18.3% | ||||
| Major Tenants | |||||||||
| Forever 21 | NR/NR/NR | 24,107 | 1.4% | $28.82 | $694,764 | 3.1% | $183 | 16.8% | 1/31/2024 |
| Marshalls Homegoods | NR/A2/A+ | 60,000 | 3.6% | $9.75 | $585,000 | 2.7% | $212 | 5.2% | 1/31/2022 |
| Rink Side | NR/NR/NR | 55,970 | 3.3% | $8.58 | $480,000 | 2.2% | NAP | NAP | 12/31/2016(14) |
| Last Call Neiman Marcus | NR/NR/NR | 30,462 | 1.8% | $15.00 | $456,930 | 2.1% | $166 | 9.1% | 1/31/2020 |
| Bed Bath & Beyond / Buy Buy Baby | NR/Baa1/BBB+ | 60,317 | 3.6% | $7.50 | $452,378 | 2.1% | $143 | 8.9% | 1/31/2023 |
| Off Broadway Shoes | NR/NR/NR | 21,000 | 1.2% | $17.00 | $357,000 | 1.6% | $110 | 20.8% | 4/30/2021 |
| Rainforest Cafe | NR/NR/NR | 20,003 | 1.2% | $14.90 | $298,000 | 1.4% | $174 | 11.6% | 12/31/2018(15) |
| Saks Fifth Avenue Off 5 | NR/B1/B+ | 28,108 | 1.7% | $9.10 | $255,783 | 1.2% | $105 | 11.0% | 6/30/2019 |
| Total Major Tenants | 299,967 | 17.8% | $11.93 | $3,579,854 | 16.2% | ||||
| Non-Major Tenants(16) | 548,621 | 32.6% | $26.32 | $14,438,249 | 65.5% | ||||
| Occupied Collateral Total | 1,534,151 | 91.1%(17) | $14.38 | $22,056,354 | 100.0% | ||||
| Vacant Space | 149,764 | 8.9% | |||||||
| Collateral Total | 1,683,915 | 100.0% | |||||||
| (1) | Certain ratings are those of the parent company whether or not the parent guarantees the lease. |
| (2) | Annual U/W Base Rent PSF and Annual U/W Base Rent include contractual rent steps through August 2017 totaling $315,690. |
| (3) | Sales PSF and Occupancy Costs are for the trailing 12-month period ending July 31, 2016. |
| (4) | Sears Grand has six, five-year lease extension options. |
| (5) | Floor & Décor is still completing its buildout and is not yet in occupancy but began paying rent on October 1, 2016. They are scheduled to open for business in January 2017. |
| (6) | Floor & Décor has three, five-year lease extension options. |
| (7) | Kohl’s owns their own improvements; Annual U/W Base Rent is reflective of ground rent. |
| (8) | Sales PSF and Occupancy cost are for the trailing 12-month period ending December 31, 2015. |
| (9) | Kohl’s has four, five-year lease extension options. |
| (10) | Macy’s owns their own improvements. |
| (11) | Macy’s pays solely reimbursements currently. They are also required to pay percentage rent, which is calculated based on a percentage of sales above $26.0 million. |
| (12) | Macy’s has ten, five-year lease extension options. |
| (13) | The Total Anchor Tenants Annual U/W Base Rent PSF excludes Macy’s square footage. Including Macy’s, the Annual U/W Base Rent PSF is $5.89. |
| (14) | Rink Side recently exercised their automatic five-year lease renewal option, extending their lease to December 2021. |
| (15) | Rainforest Café has the right to terminate its lease at any time with twelve months prior written notice and payment of a termination fee equal to the greater of one year of then current rent or $500,000. |
| (16) | Non-Major Tenants includes $700,000 attributed to the Simon Master Lease and $4,563 attributed to Marcus Cinema’s common area maintenance reimbursements. Marcus Cinema’s square footage is excluded from the calculation. |
| (17) | As of September 22, 2016, the Gurnee Mills Mortgaged Property was 81.9% occupied and 91.1% leased. The leased percentage includes the Simon Master Lease (2.8% of net rentable area), Floor & Décor and three other tenants who have not yet taken occupancy, all totaling 9.2% of net rentable area combined. |
THE INFORMATION IN THIS STRUCTURAL AND COLLATERAL TERM SHEET IS NOT COMPLETE AND MAY BE AMENDED PRIOR TO THE TIME OF SALE. THIS TERM SHEET IS NOT AN OFFER TO SELL THESE SECURITIES AND IT IS NOT A SOLICITATION OF AN OFFER TO BUY THESE SECURITIES IN ANY JURISDICTION WHERE THE OFFER OR SALE IS NOT PERMITTED.
79
| GURNEE MILLS |
The following table presents certain information relating to the historical sales and occupancy costs at the Gurnee Mills Mortgaged Property:
Historical Sales (PSF) and Occupancy Costs(1)
| Tenant Name | 2014 | 2015 | TTM 7/31/2016 | Current Occupancy Cost(2) |
| Bass Pro Shops Outdoor | $188 | $187 | $189 | 5.4% |
| Sears Grand | $86 | $76 | $71 | 8.6% |
| Kohl’s | $174 | $176 | NAV | 4.3% |
| Macy’s | $141 | $134 | NAV | 0.4%(3) |
| Forever 21 | $195 | $172 | $183 | 16.8% |
| Marshalls Homegoods | $192 | $211 | $212 | 5.2% |
| Last Call Neiman Marcus | $195 | $182 | $166 | 9.1% |
| Bed Bath & Beyond / Buy Buy Baby | $159 | $150 | $143 | 8.9% |
| Off Broadway Shoes | $115 | $114 | $110 | 20.8% |
| Rainforest Cafe | $175 | $186 | $174 | 11.6% |
| Saks Fifth Avenue Off 5 | NAV | $106 | $105 | 11.0% |
| Total Comparable In-line Sales (< 10,000 square feet) | $337 | $353 | $347 | |
| Occupancy Costs | 15.0% | 14.5% | 15.2% |
| (1) | Historical Sales (PSF) and Occupancy Costs were provided by the borrower. Current Occupancy Cost is based on the most recent available Historical Sales. |
| (2) | Current Occupancy Costs are based on the Annual U/W Base Rent and reimbursements and historical sales. |
| (3) | Macy’s pays solely reimbursements currently. They are also required to pay percentage rent, which is calculated based on a percentage of sales above $26.0 million. |
The following table presents certain information relating to the lease rollover schedule at the Gurnee Mills Mortgaged Property:
Lease Expiration Schedule(1)(2)
| Year Ending December 31, | No. of Leases Expiring | Expiring NRSF | % of Total NRSF | Cumulative Expiring NRSF | Cumulative % of Total NRSF | Annual U/W Base Rent | % of Total Annual U/W Base Rent | Annual U/W Base Rent PSF(3) |
| MTM | 3 | 11,475 | 0.7% | 11,475 | 0.7% | $311,601 | 1.4% | $27.15 |
| 2016 | 3 | 79,477 | 4.7% | 90,952 | 5.4% | $516,766 | 2.3% | $6.50 |
| 2017 | 26 | 69,784 | 4.1% | 160,736 | 9.5% | $2,515,793 | 11.4% | $36.05 |
| 2018 | 23 | 199,595 | 11.9% | 360,331 | 21.4% | $3,392,943 | 15.4% | $17.00 |
| 2019 | 16 | 278,979 | 16.6% | 639,310 | 38.0% | $2,716,434 | 12.3% | $9.74 |
| 2020 | 14 | 77,358 | 4.6% | 716,668 | 42.6% | $1,645,599 | 7.5% | $21.27 |
| 2021 | 15 | 73,185 | 4.3% | 789,853 | 46.9% | $1,957,735 | 8.9% | $26.75 |
| 2022 | 4 | 72,578 | 4.3% | 862,431 | 51.2% | $939,095 | 4.3% | $12.94 |
| 2023 | 15 | 107,168 | 6.4% | 969,599 | 57.6% | $1,853,045 | 8.4% | $17.29 |
| 2024 | 23 | 223,371 | 13.3% | 1,192,970 | 70.8% | $3,667,843 | 16.6% | $16.42 |
| 2025 | 8 | 20,126 | 1.2% | 1,213,096 | 72.0% | $522,412 | 2.4% | $25.96 |
| 2026 | 6 | 181,193 | 10.8% | 1,394,289 | 82.8% | $1,912,525 | 8.7% | $10.56 |
| Thereafter | 3 | 139,862 | 8.3% | 1,534,151 | 91.1% | $104,563 | 0.5% | $0.75 |
| Vacant | 0 | 149,764 | 8.9% | 1,683,915 | 100.0% | $0 | 0.0% | $0.00 |
| Total/Weighted Average | 159 | 1,683,915 | 100.0% | $22,056,354 | 100.0% | $14.38 |
| (1) | Information obtained from the underwritten rent roll. |
| (2) | Certain tenants may have lease termination options that are exercisable prior to the originally stated expiration date of the subject lease and that are not considered in the Lease Expiration Schedule. |
| (3) | Weighted Average Annual U/W Base Rent PSF excludes vacant space. |
The following table presents historical occupancy percentages at the Gurnee Mills Mortgaged Property:
Historical Occupancy
12/31/2012(1) | 12/31/2013(2) | 12/31/2014(2) | 12/31/2015(2) | 9/22/2016(3)(4) |
| 94.0% | 95.2% | 95.8% | 95.1% | 91.1% |
(1) | Information obtained from the servicer. |
| (2) | Information obtained from the borrower. |
| (3) | Information obtained from the underwritten rent roll. |
| (4) | As of September 22, 2016, the Gurnee Mills Mortgaged Property was 81.9% occupied and 91.1% leased. The leased percentage includes the Simon Master Lease, Floor & Décor and three other tenants who have not yet taken occupancy, all totaling 9.2% of net rentable area combined. |
THE INFORMATION IN THIS STRUCTURAL AND COLLATERAL TERM SHEET IS NOT COMPLETE AND MAY BE AMENDED PRIOR TO THE TIME OF SALE. THIS TERM SHEET IS NOT AN OFFER TO SELL THESE SECURITIES AND IT IS NOT A SOLICITATION OF AN OFFER TO BUY THESE SECURITIES IN ANY JURISDICTION WHERE THE OFFER OR SALE IS NOT PERMITTED.
80
| GURNEE MILLS |
Operating History and Underwritten Net Cash Flow. The following table presents certain information relating to the historical operating performance and the underwritten net cash flow at the Gurnee Mills Mortgaged Property:
Cash Flow Analysis
| 2013 | 2014 | 2015 | TTM 7/31/2016 | U/W | % of U/W Effective Gross Income | U/W $ per SF | |
| Base Rent | $20,520,014 | $22,641,489 | $22,716,688 | $22,207,409 | $22,056,354(1) | 54.1% | $13.10(1) |
| Grossed Up Vacant Space | 0 | 0 | 0 | 0 | 6,159,895(2) | 15.1 | 3.66 |
| Percentage Rent | 542,881 | 339,800 | 599,424 | 989,722 | 979,159 | 2.4 | 0.58 |
| Total Reimbursables | 12,522,737 | 13,642,927 | 13,955,041 | 14,065,465 | 13,088,291 | 32.1 | 7.77 |
| Specialty Leasing Income(3) | 4,339,492 | 3,638,788 | 3,421,783 | 3,392,678 | 3,523,393 | 8.6 | 2.09 |
| Other Income | 1,200,144 | 1,201,801 | 1,068,511 | 1,111,763 | 1,131,757 | 2.8 | 0.67 |
| Less Vacancy & Credit Loss | 0 | 0 | 0 | 0 | (6,159,895)(4) | (15.1) | (3.66) |
| Effective Gross Income | $39,125,268 | $41,464,805 | $41,761,447 | $41,767,037 | $40,778,955 | 100.0% | $24.22 |
| Total Operating Expenses | $13,161,255 | $13,989,033 | $13,959,485 | $13,716,322 | $14,098,029 | 34.6% | $8.37 |
| Net Operating Income | $25,964,013 | $27,475,772 | $27,801,962 | $28,050,715 | $26,680,926 | 65.4% | $15.84 |
| TI/LC | 0 | 0 | 0 | 0 | 1,160,681 | 2.8 | 0.69 |
| Capital Expenditures | 0 | 0 | 0 | 0 | 420,979 | 1.0 | 0.25 |
| Net Cash Flow | $25,964,013 | $27,475,772 | $27,801,962 | $28,050,715 | $25,099,266 | 61.5% | $14.91 |
| NOI DSCR(5) | 1.65x | 1.75x | 1.77x | 1.78x | 1.70x | ||
| NCF DSCR(5) | 1.65x | 1.75x | 1.77x | 1.78x | 1.60x | ||
| NOI DY(5) | 9.5% | 10.0% | 10.1% | 10.2% | 9.7% | ||
| NCF DY(5) | 9.5% | 10.0% | 10.1% | 10.2% | 9.2% |
| (1) | Annual U/W Base Rent PSF and Annual U/W Base Rent include contractual rent steps through August 2017 totaling $315,690. |
| (2) | Grossed up vacant space includes gross-up rent and recoveries. |
| (3) | Specialty leasing income includes income from temporary tenants, kiosks and signage at the Gurnee Mills Mortgaged Property. |
| (4) | The underwritten economic vacancy is 13.4%. The Gurnee Mills Mortgaged Property was 81.9% occupied and 91.1% leased as of September 22, 2016. The leased percentage includes the Simon Master Lease (2.8% of net rentable area), Floor & Décor and three other tenants who have not yet taken occupancy, all totaling 9.2% of net rentable area combined. Excluding the $700,000 in Simon Master Lease income results in a net cash flow debt service coverage ratio and debt yield of 1.53x and 8.7%, respectively. |
| (5) | The debt service coverage ratios and debt yields are based on the Gurnee Mills Whole Loan. |
Appraisal. As of the appraisal valuation date of August 23, 2016, the Gurnee Mills Property had an “as-is” appraised value of $417,000,000. The appraiser also concluded to an “as-stabilized” value of $430,000,000 as of September 1, 2017, which equates to an “as-stabilized” loan-to-value-ratio of 63.8%.
Environmental Matters. According to a Phase I environmental site assessment dated August 26, 2016, there was no evidence of any recognized environmental conditions at the Gurnee Mills Property.
Market Overview and Competition.The Gurnee Mills Property is located in Gurnee, Illinois, located at the intersection of Grand Avenue and Interstate-94 in Gurnee, Illinois, approximately 42.5 miles northwest of Chicago, Illinois and 48.2 miles south of Milwaukee. Located in Lake County, the Gurnee Mills Property has excellent visibility and direct access off of Interstate-94, the major north/south thoroughfare connecting Chicago and Milwaukee. Additional demand drivers in the area include Six Flags and KeyLime Cove Indoor Waterpark and Resort (“KeyLime Cove”), which are located directly southeast of the Gurnee Mills Property on the opposite side of Interstate-94. Six Flags is one of the Midwest’s largest theme and amusement/outdoor water parks, with over 100 rides and attractions that generate approximately 3.0 million visitors per year. KeyLime Cove includes a 65,000 square foot waterpark, seven restaurants, two spas and 414 resort style guestrooms and suites. KeyLime Cove was recently named among the top 10 water parks in the United States by two major news publications. The average daily traffic along Interstate-94 is 86,600 and 39,600 along Grand Avenue, which runs eight miles east to Lake Michigan and is the main access point for the Gurnee Mills Property. The area also benefits from the Naval Station Great Lakes, located eight miles southeast of the Gurnee Mills Property. The campus is home to the United States Navy’s only recruit training base, which graduates nearly 40,000 recruits annually.
According to the appraisal, the Gurnee Mills Property is located in the Lake/McHenry County submarket and has a primary trade area that encompasses a ten-mile radius. The 2015 population within a five- and 10-mile radius were reported at approximately 122,401 and 454,466, respectively, and average household income within the same radii were reported at approximately $102,298 and $94,579, respectively. The population is expected to grow 0.8% and 0.9% within the same five- and ten-mile radius from 2015 to 2020.
The appraiser estimated market rent for Gurnee Mills Property to be $15.95 per square foot on a triple net basis, compared to the Annual U/W Base Rent PSF of $14.38 per square foot at the Gurnee Mills Mortgaged Property. The appraiser concluded to a vacancy rate of 5.0% and a third party market research report indicated a second quarter 2016 retail vacancy rate within a 3-mile radius of the Gurnee Mills Mortgaged Property of 1.7% and a competitive set vacancy of 5.4%.
THE INFORMATION IN THIS STRUCTURAL AND COLLATERAL TERM SHEET IS NOT COMPLETE AND MAY BE AMENDED PRIOR TO THE TIME OF SALE. THIS TERM SHEET IS NOT AN OFFER TO SELL THESE SECURITIES AND IT IS NOT A SOLICITATION OF AN OFFER TO BUY THESE SECURITIES IN ANY JURISDICTION WHERE THE OFFER OR SALE IS NOT PERMITTED.
81
| GURNEE MILLS |
The following table presents certain information relating to comparable properties to the Gurnee Mills Property:
Competitive Set(1)
Gurnee Mills (Subject) | Fashion Outlets of Chicago | Chicago Premium Outlets | Pleasant Prairie Premium Outlets | Huntley Outlet Center | Hawthorn Center | Woodfield Mall | Old Orchard | |
| Location | Gurnee, IL | Rosemont, IL | Aurora, IL | Pleasant Prairie, WI | Huntley, IL | Vernon Hills, IL | Schaumburg, IL | Skokie, IL |
| Distance from Subject | -- | 29.0 miles | 44.0 miles | 8.7 miles | 30.3 miles | 10.0 miles | 24.0 miles | 25.0 miles |
| Property Type | Super-Regional Center/Outlet Mall | Super-Regional Center/Outlet Mall | Outlet Center | Outlet Center | Outlet Center | Super-Regional Center/Mall | Enclosed Regional Mall | Enclosed Regional Mall |
| Year Built/Renovated | 1991/2014 | 2013/NAP | 2004/2015 | 1988/2006 | 1994/2005 | 1973/2015 | 1999/2016 | 1956/1995 |
| Anchors | Sears Grand, Bass Pro Shops, Macy’s, Kohl’s, Floor & Décor | Bloomingdale’s Outlet, Forever 21, Last Call Neiman Marcus, Nike, Saks Fifth Avenue Off 5th | Nike, Polo, Ann Taylor, Adidas, Timberland, Eddie Bauer, Gap, Saks Fifth Avenue – Off 5th, J.Crew, Coach, Old Navy, Under Armour | Nike, Gap, Hilfiger, Under Armour, Coach Adidas, Timberland, Jockey, Bass, Polo, J. Crew, Banana | Eddie Bauer, Reebok, Carters, Gap, Bose, Banana, Aeropostale | Sears, Macy’s, JCPenney, Carson Pirie Scott | Nordstrom, Lord & Taylor, JCPenney, Sears, Macy’s | Nordstrom, Lord & Taylor, Macy’s, Bloomingdale’s, Cinema, Barnes & Noble |
| Total GLA | 1,683,915 SF | 528,112 SF | 690,000 SF | 776,000 SF | 279,387 SF | 1,329,555 SF | 2,208,000 SF | 1,740,000 SF |
| Total Occupancy | 91%(2) | 98% | 97% | 98% | 80% | 93% | 95% | 94% |
| (1) | Information obtained from the appraisal. |
| (2) | As of September 22, 2016, the Gurnee Mills Mortgaged Property was 81.9% occupied and 91.1% leased. See “Cash Flow Analysis” section. |
The Borrower.The borrower is Mall at Gurnee Mills, LLC, a Delaware limited liability company and single purpose entity with two independent directors. Legal counsel to the borrower delivered a non-consolidation opinion in connection with the origination of the Gurnee Mills Whole Loan. Simon Property Group, L.P. is the guarantor of certain nonrecourse carveouts under the Gurnee Mills Whole Loan. The liability of the guarantor under the non-recourse carveout and environmental indemnification provisions in the loan documents is capped at $55.0 million plus reasonable collection costs. See“Description of the Mortgage Pool—Certain Terms of the Mortgage Loans—Non-Recourse Carveout Limitations”in the Preliminary Prospectus.
The Sponsor.The sponsor is Simon Property Group, L.P. Simon Property Group, L.P. is an affiliate of SPG. SPG was founded in 1960 and is headquartered in Indianapolis, Indiana. SPG (NYSE: SPG, rated A2/A by Moody’s and S&P) is an S&P 100 company and the largest public real estate company in the world. SPG currently owns or has an interest in 231 retail real estate properties in North America, Europe and Asia comprising 191 million square feet. SPG has sponsored other real estate projects that have been the subject of mortgage loan defaults, foreclosure proceedings and deeds-in-lieu of foreclosure. See “Description of the Mortgage Pool—Default History, Bankruptcy Issues and Other Proceedings” in the Preliminary Prospectus.
Escrows.No upfront escrows were collected at origination.
Ongoing reserves for taxes are not required as long as (i) no Cash Trap Event Period (as defined below) exists; and (ii) the borrower (a) pays all taxes prior to the assessment of any late payment penalty and the date that such taxes become delinquent and (b) upon request, provides the lender with satisfactory evidence of such payment of taxes. Ongoing reserves for insurance are only required during a Cash Trap Event Period if the borrower does not provide satisfactory evidence that the Gurnee Mills Mortgaged Property is insured under an acceptable blanket policy.
Ongoing replacement reserves are not required as long as no Cash Trap Event Period exists. Following the occurrence and during the continuance of a Cash Trap Event Period, the borrower is required to deposit $29,926 per month for replacement reserves.
Ongoing reserves for tenant improvements and leasing commissions (“TI/LC”) are not required as long as no Cash Trap Event Period exists. Following the occurrence and during the continuance of a Cash Trap Event Period, the borrower is required to deposit $94,204 per month for TI/LC reserves.
Lockbox and Cash Management.The Gurnee Mills Whole Loan requires a lender-controlled lockbox account, which is already in place, and that the borrower direct tenants to pay their rents directly into such lockbox account. The loan documents also require that all rents received by the borrower or the property manager be deposited into the lockbox account within two business days of receipt. Prior to the occurrence of a Cash Trap Event Period, all cash flow is distributed to the borrower. During a Cash Trap Event Period, all cash flow is swept to a lender-controlled cash management account.
A “Cash Trap Event Period” means the occurrence of (i) an event of default; (ii) any bankruptcy or insolvency action of the borrower; (iii) any bankruptcy or insolvency action of the property manager if the property manager is affiliated with the borrower (provided that the property manager is not replaced within 60 days with a qualified manager); or (iv) a DSCR Reserve Trigger Event (as defined below).
THE INFORMATION IN THIS STRUCTURAL AND COLLATERAL TERM SHEET IS NOT COMPLETE AND MAY BE AMENDED PRIOR TO THE TIME OF SALE. THIS TERM SHEET IS NOT AN OFFER TO SELL THESE SECURITIES AND IT IS NOT A SOLICITATION OF AN OFFER TO BUY THESE SECURITIES IN ANY JURISDICTION WHERE THE OFFER OR SALE IS NOT PERMITTED.
82
| GURNEE MILLS |
A “DSCR Reserve Trigger Event” means the debt service coverage ratio for the Gurnee Mills Whole Loan based on the trailing four calendar quarter period immediately preceding the date of determination is less than 1.20x for two consecutive calendar quarters.
A Cash Trap Event Period may be cured (a) if the Cash Trap Event Period is caused solely by the occurrence of a DSCR Reserve Trigger Event, the achievement of a debt service coverage ratio of 1.20x or greater for two consecutive calendar quarters based upon the trailing four calendar quarter period immediately preceding the date of determination; (b) if the Cash Trap Event Period is caused solely by clause (i) above, by the acceptance of the lender of a cure of such event of default, provided that the lender has not accelerated the loan, moved for a receiver or commenced foreclosure proceedings; or (c) if the Cash Trap Event Period is caused solely by clause (iii) above, if the borrower replaces the property manager or such bankruptcy or insolvency action is discharged or dismissed without any adverse consequences to the property or the loan. The cures in this paragraph are also subject to the following conditions: (i) no other Cash Trap Event Period has occurred and is continuing; (ii) the borrower pays all of the lender’s reasonable out-of-pocket expenses incurred in connection with curing such Cash Trap Event Period including reasonable attorney’s fees and expenses; and (iii) the borrower may not cure a Cash Trap Event Period (x) more than a total of five times in the aggregate during the term of the loan or (y) triggered by a bankruptcy or insolvency action of the borrower.
Property Management. The Gurnee Mills Property is managed by an affiliate of the borrower.
Assumption. The borrower has the right to transfer the Gurnee Mills Mortgaged Property provided that certain conditions are satisfied, including (i) no event of default has occurred and is continuing; (ii) in the event that in connection with such transfer, the manager will not thereafter continue to manage the Gurnee Mills Mortgaged Property, then a replacement management agreement with a qualified manager must be executed acceptable to lender; (iii) the transferee must not have been a party to any bankruptcy action within the previous seven years and there is no material litigation or regulatory action pending against the transferee unreasonable to lender; and (iv) the transferee is a qualified transferee meeting the requirements set forth in the loan documents or the lender receives rating agency confirmation that the sale and assumption will not result in a downgrade, withdrawal or qualification of the respective ratings assigned to the Series 2016-LC25 certificates and similar confirmations from each rating agency rating any securities backed by any of the Gurnee Mills Companion Loans with respect to the ratings of such securities.
Partial Release. Not permitted.
Additional Indebtedness. SPG and certain affiliates are permitted to pledge their indirect ownership of the borrower subject to certain conditions, including: (i) the credit facility must be secured by a substantial portion of SPG’s or such affiliate’s assets; (ii) no such corporate loan will be secured by a pledge from a party whose sole asset is its ownership interest in the borrower or Gurnee Mills Mortgage Property; and (iii) no event of default has occurred or is continuing. See “Description of the Mortgage Pool—Additional Indebtedness” in the Preliminary Prospectus.
Real Estate Substitution.Not permitted.
Subordinate and Mezzanine Indebtedness.Not permitted.
Ground Lease. None.
Terrorism Insurance.The loan documents require that the “all risk” insurance policy required to be maintained by the borrower provide coverage for terrorism in an amount equal to the full replacement cost of Gurnee Mills Mortgaged Property. The loan documents also require business interruption insurance covering no less than the 24-month period following the occurrence of a casualty event, together with a 365-day extended period of indemnity. Should the policy contain an exclusion for acts of terrorism, the loan documents require the borrower to obtain to the extent available a stand-alone policy providing the same coverage as previously in place prior to the exclusion, with a premium cap of two times the then current annual insurance premiums for the policy insuring the Gurnee Mills Mortgaged Property only (excluding the wind, flood and earthquake components of the premiums) on a stand-alone basis, with a deductible no greater than $5,000,000.
THE INFORMATION IN THIS STRUCTURAL AND COLLATERAL TERM SHEET IS NOT COMPLETE AND MAY BE AMENDED PRIOR TO THE TIME OF SALE. THIS TERM SHEET IS NOT AN OFFER TO SELL THESE SECURITIES AND IT IS NOT A SOLICITATION OF AN OFFER TO BUY THESE SECURITIES IN ANY JURISDICTION WHERE THE OFFER OR SALE IS NOT PERMITTED.
83
| Wells Fargo Commercial Mortgage Trust 2016-LC25 | Transaction Contact Information |
III. Transaction Contact Information
Questions regarding this Structural and Collateral Term Sheet may be directed to any of the following individuals:
| Wells Fargo Securities, LLC | |
| Brigid Mattingly | Tel. (312) 269-3062 |
| A.J. Sfarra | Tel. (212) 214-5613 |
| Alex Wong | Tel. (212) 214-5615 |
THE INFORMATION IN THIS STRUCTURAL AND COLLATERAL TERM SHEET IS NOT COMPLETE AND MAY BE AMENDED PRIOR TO THE TIME OF SALE. THIS TERM SHEET IS NOT AN OFFER TO SELL THESE SECURITIES AND IT IS NOT A SOLICITATION OF AN OFFER TO BUY THESE SECURITIES IN ANY JURISDICTION WHERE THE OFFER OR SALE IS NOT PERMITTED.
84