UNITED STATES
SECURITIES AND EXCHANGE COMMISSION
Washington, D.C. 20549
FORM N-CSR
CERTIFIED SHAREHOLDER REPORT OF REGISTERED
MANAGEMENT INVESTMENT COMPANIES
Investment Company Act file number: 811-23207
Brinker Capital Destinations Trust
(Exact name of registrant as specified in charter)
1055 Westlakes Drive, Suite 250
Berwyn, PA 19312
(Address of principal executive offices) (Zip code)
The Corporation Trust Company
1209 Orange Street
Wilmington, Delaware 19801
(Name and address of agent for service)
Registrant’s telephone number, including area code: 1 (610) 407-5500
Date of fiscal year end: February 28
Date of reporting period: February 28, 2018
Form N-CSR is to be used by management investment companies to file reports with the Commission not later than 10 days after the transmission to stockholders of any report that is required to be transmitted to stockholders under Rule 30e-1 under the Investment Company Act of 1940 (17 CFR 270.30e-1). The Commission may use the information provided on Form N-CSR in its regulatory, disclosure review, inspection, and policymaking rules.
A registrant is required to disclose the information specified by Form N-CSR, and the Commission will make this information public. A registrant is not required to respond to the collection of information contained in Form N-CSR unless the Form displays a currently valid Office of Management and Budget (“OMB”) control number. Please direct comments concerning the accuracy of the information collection burden estimate and any suggestions for reducing the burden to Secretary, Securities and Exchange Commission, 450 Fifth Street, NW, Washington, DC 20549-0609. The OMB has reviewed this collection of information under clearance requirements of 44 U.S.C. § 3507.
ITEM 1. REPORTS TO STOCKHOLDERS.

Annual Report
February 28, 2018
Destinations Large Cap Equity Fund (DLCFX)
Destinations Small-Mid Cap Equity Fund (DSMFX)
Destinations International Equity Fund (DIEFX)
Destinations Equity Income Fund (DGEFX)
Destinations Real Assets Fund (DRAFX)
Destinations Core Fixed Income Fund (DCFFX)
Destinations Low Duration Fixed Income Fund (DLDFX)
Destinations Global Fixed Income Opportunities Fund (DGFFX)
Destinations Municipal Fixed Income Fund (DMFFX)
Destinations Multi Strategy Alternatives Fund (DMSFX)
|
www.destinationsfunds.com // 877.771.7979 |
Table of Contents
Shareholder Letter
Dear Shareholder,
We are pleased to provide the annual report of the Destinations Funds for the twelve-month reporting period for the fiscal year ended February 28, 2018. Please refer to the investment commentary for a detailed look at prevailing economic and market conditions during the Funds’ reporting period.
As always, we remain committed to providing you with excellent service and a full spectrum of investment choices to help you while you pursue your objectives and goals. We also remain committed to supplementing the support you receive from your financial advisor. One way we accomplish this is through our website, www.destinationsfunds.com. On our website, you can gain immediate access to Destinations Funds information, including:
| | • | | Fund prices and performance, |
| | • | | A host of fund literature and resources |
We want to thank you for your continued confidence in the Destinations Funds and we look forward to helping you meet your financial goals.
Sincerely,

Jason B. Moore
President, Brinker Capital Destinations Trust
April 30, 2018
Important Disclosure:
Mutual fund investing involves risk. The value of your investment in a Fund could go down. Multi-investment management styles may lead to overlapping securities transactions and higher transaction expenses compared to single investment management styles. Outcomes depend on the skill of the sub-advisers and adviser and the allocation of assets amongst them, as well as market fluctuations and industry/economic trends etc.
1
Investment Commentary
For twelve months fiscal year ended February 28, 2018 (the “period”), strong economic growth was evident across all major economies. The Fed made progress on interest rate normalization, implementing a total of three rate hikes with the most recent increase occurring in December. The much-anticipated reflationary fiscal policies under the Trump administration were characterized with many fits and starts but tax reform legislation was successfully passed in December, creating additional tailwinds for risk assets.
Global equities surged for the first 11 months of the period, but came to an abrupt halt in February when market volatility came roaring back and all but washed out signs of complacency that were present earlier in the year. Markets recovered quickly and ended the period well above the level they started. As we move through 2018, we expect solid fundamentals will continue to support risk assets but higher volatility than we saw previously.
The S&P 500 Index finished the period up 17.1%, with the index posting positive returns for 11 out of 12 months. Cyclicals outperformed defensive sectors by a large margin with information technology (+36.3%) largely driving returns. Consumer discretionary (+22.2%) and financials (+19.9%) also exhibited strong performance. Yield-oriented sectors, telecom (-5.0%) and utilities (-2.0%), which typically have more defensive characteristics, came under pressure as interest rates moved higher in the later part of the period. Energy (-2.8%) also experienced headwinds due in part to a rise in oil inventories adversely affecting prices. Large cap outperformed both mid cap and small cap equities, and from a style perspective growth led value.
Developed international equities, as measured by the MSCI EAFE Index, were up 20.7% for the period, outperforming domestic equities for the period. Europe, arguably behind the US in terms of recovery, experienced a significant rally during the first half of the period, benefitting from positive GDP growth and an increase in consumer confidence. Both the European Central Bank and Bank of Japan continued to maintain their dovish stance as inflation remained below their stated targets. The dispersion among global yields will likely increase as both the Eurozone and Japan central banks continue to implement easing monetary policies while the Fed is in the middle of a tightening cycle, with at least three additional rate hikes expected in 2018. Emerging markets, as measured by the MSCI Emerging Markets Index, were up 31.0% for the period. The region experienced a strong rebound, supported by strengthening fundamentals and a weaker dollar. Moving forward, the implementation of any protectionist US trade policies may heighten tensions between the US and exporting emerging markets countries, leading to more volatility in the region.
Fixed income was relatively flat over the period, with the Bloomberg Barclays US Aggregate Index gaining just 0.5%. After reaching a low in mid-September 2017, 10-year Treasury yields steadily increased ending February at a level of 2.4%. Corporate credit spreads contracted for most of the year, generating positive returns for both investment grade and high yield securities. Spreads slightly widened in February but remained at tight levels relative to historical values. Municipal bonds, as measured by the Bloomberg Barclays Municipal Bond Index, were up 2.5%, outperforming taxable counterparts.
We remain positive on risk assets over the intermediate-term, although we acknowledge we are in the later innings of the bull market and the second half of the business cycle. While this cycle has been longer in duration compared to history, the recovery we have experienced has been muted, supported by the extended recovery period. While our macro outlook is biased in favor of the positives, the risks must not be ignored.
We find a number of factors supportive of the economy and markets over the near term.
| | • | | Pro-growth policies: The Administration has delivered a new tax plan and a more benign regulatory environment. We could see additional government spending on infrastructure in 2018. |
| | • | | Synchronized global economic growth: Growth in the U.S. has started to accelerate, and growth in both developed international and emerging economies has meaningfully improved. The tax cuts could also help to boost GDP growth in 2018. |
2
| | • | | Improvement in earnings growth: Corporate earnings growth has accelerated, and global and corporate tax reform should further benefit U.S.-based companies. |
| | • | | Elevated business sentiment: Measures like CEO Confidence and NFIB Small Business Optimism are at elevated levels. This typically leads to additional project spending and hiring, which should boost growth. The corporate tax cut should also benefit business confidence and lead to increase capital spending. |
However, risks facing the economy and markets remain, including:
| | • | | Fed tightening: The Federal Reserve will continue to tighten monetary policy, with at least three interest rate hikes priced in for 2018. We may see an incremental shift to less accommodative monetary policy from other central banks as well. |
| | • | | Higher inflation: Current levels of inflation are muted but inflation expectations have ticked higher and the reflationary policies of the administration could further boost levels. Should inflation move higher, the Fed may be forced to shift to a more aggressive tightening stance. |
| | • | | Geopolitical risks: Geopolitical risks including protectionist trade policies and global challenges could cause short-term market volatility. |
Despite the volatility experienced recently, the technical backdrop of the market remains favorable, even more so as some of the complacency has been removed. Credit conditions are still supportive, global economic growth is accelerating, and business and consumer confidence are elevated. The onset of new policies under the Trump administration and actions of central banks may lead to higher volatility, but our view on risk assets remains positive over the intermediate term. Higher volatility can lead to attractive pockets of opportunities for active managers.
Thank you for your confidence and your support as shareholders of the Destinations Funds.
Sincerely,
Jason B. Moore
President, Brinker Capital Destinations Trust
April 30, 2018
3
Destinations Large Cap Equity Fund
Management’s Discussion of Fund Performance (Unaudited)
Investment Objective
The investment objective of the Destinations Large Cap Equity Fund (the “Fund”) is to provide long term capital appreciation.
Investment Strategy
The Fund will invest in the equity securities of large capitalization companies The Fund defines large cap companies as companies whose market capitalizations typically fall within the range of the Russell 1000® Index. Although most assets will typically be invested in U.S. common stocks, the Fund may invest directly in foreign stocks or indirectly through depositary receipts in keeping with the Fund’s objectives. The Fund employs a multi-manager sub-advised structure. The Adviser may also invest a portion of the Fund’s assets in shares of exchange-traded funds (ETFs), which use a passive management strategy.
Investment Commentary
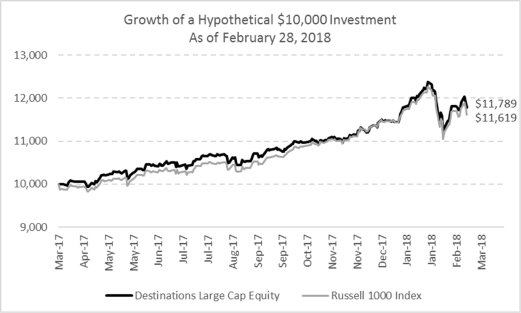
For the period from inception (March 20, 2017) through the Fund’s fiscal year-end on February 28, 2018, the Fund returned 17.89%, outperforming the Russell 1000 Index, which returned 16.17% for the period. The Fund benefited from strong stock selection within the information technology sector, as well as a modest overweight to the sector, which was the top performing sector in the Russell 1000 Index over the period. Also contributing positively to the Fund’s performance was an underweight to the consumer staples sector, strong stock selection within the consumer discretionary sector, and an underweight to utilities. Detracting from the Fund’s performance was stock selection within both the industrials and healthcare sectors.
Investment Sub-advisers
BlackRock Investment Management, LLC
Seeks to provide index exposure by replicating the total return performance of the S&P 500 Index.
Columbia Management Investment Advisers, LLC
Constructs a concentrated high growth portfolio comprised of a mix of established and emerging growth companies that are gaining market share in industries that represent a larger segment of the overall economy.
Delaware Investments Fund Advisers
Constructs a concentrated deep value portfolio that seeks to capitalize on discrepancies between intrinsic value and price.
Fort Washington Investment Advisors, Inc.
Constructs a concentrated portfolio focusing on businesses with sustainable competitive advantages or high barriers to entry that are trading below intrinsic value.
T. Rowe Price Associates, Inc.
Focuses on companies with superior growth in earnings and cash flow, ability to sustain earnings momentum even during economic slowdowns, and occupation of a lucrative niche in the economy with ability to expand even during economic slowdowns.
4
TCW Investment Management Company, LLC
Employs a relative value strategy which focuses on undervalued stocks where the company has a fundamental catalyst or competitive advantage that will ultimately be recognized by the market.
The following chart compares the value of a hypothetical $10,000 investment in the Destinations Large Cap Equity Fund from its inception (March 20, 2017) to February 28, 2018 as compared with the Russell 1000 Index.
Average Total Returns as of February 28, 2018
| | | | | | | | |
| | | YTD | | | Since Inception
(3/20/2017) | |
Destinations Large Cap Equity | | | 3.08 | % | | | 17.89 | % |
Russell 1000 Index | | | 1.62 | % | | | 16.19 | % |
Performance data quoted represents past performance; past performance does not guarantee future results. The investment return and principal value of an investment will fluctuate so that an investor’s shares, when redeemed, may be worth more or less than their original cost. Current performance of the Fund may be lower or higher than the performance quoted. As of the latest prospectus, the gross and net expense ratios of the Fund were 0.95% and 0.79%, respectively. Performance data current to the most recent month end may be obtained by calling 1.877.771.7979. The performance table does not reflect the deduction of taxes that a shareholder may pay on Fund distributions or the redemption of Fund shares. Returns shown for the Fund include the reinvestment of all dividends, if any. Total return calculations reflect the effect of the Adviser’s fee waiver agreement for the Fund. If such fee waivers had not occurred, the quoted performance would be lower.
5
Destinations Small-Mid Cap Equity Fund
Management’s Discussion of Fund Performance (Unaudited)
Investment Objective
The investment objective of the Destinations Small-Mid Cap Equity Fund (the “Fund”) is to provide long term capital appreciation.
Investment Strategy
The Fund will invest in the equity securities of small- and mid-capitalization companies. The Fund defines small-mid cap companies as companies whose market capitalizations typically fall within the range of either the Russell Midcap® Index or the Russell 2000® Index. The Fund may invest a portion of its assets in securities of micro-cap companies. The Fund invests in securities of companies operating in a broad range of industries. The Fund employs a multi-manager sub-advised structure. The Adviser may also invest a portion of the Fund’s assets in shares of exchange-traded funds (ETFs), which use a passive management strategy.
Investment Commentary
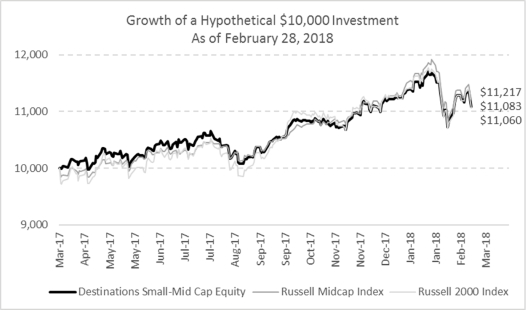
For the period from inception (March 20, 2017) through the Fund’s fiscal year-end on February 28, 2018, the Fund returned 10.83%, lagging the Russell Midcap Index return of 12.17%, but ahead of the 10.60% return of the Russell 2000 Index over the period. The fund’s higher allocation to smaller and micro cap securities resulted in a return closer to that of the small cap universe than the mid cap universe. The Fund benefited from strong stock selection within both the health care and information technology sectors. While the fund’s overweight in the energy sector was a detractor as the sector was the worst performing over that period, strong stock selection within energy helped to offset. Stock selection within the utilities and industrials sectors also weighed on the Fund’s relative performance.
Investment Sub-advisers
Ceredex Value Advisors LLC
Employs a disciplined and methodical bottom-up stock selection process with an emphasis on dividends, valuation and fundamentals.
Driehaus Capital Management LLC
Focuses on micro and small cap companies and identifies company-specific growth-inflation points to capitalize on behavioral dynamics of the market through the integration of fundamental, macro and behavioral analysis.
LMCG Investments, LLC
Employs a classic value approach with an emphasis on purchasing high quality companies at a discount to intrinsic value.
6
The following chart compares the value of a hypothetical $10,000 investment in the Destinations Small-Mid Cap Equity Fund from its inception (March 20, 2017) to February 28, 2018 as compared with both the Russell Midcap Index and Russell 2000 Index.
Average Total Returns as of February 28, 2018
| | | | | | | | |
| | | YTD | | | Since Inception
(3/20/2017) | |
Destinations Small-Mid Cap Equity | | | -1.35 | % | | | 10.83 | % |
Russell Midcap Index | | | -0.52 | % | | | 12.17 | % |
Russell 2000 Index | | | -1.36 | % | | | 10.60 | % |
Performance data quoted represents past performance; past performance does not guarantee future results. The investment return and principal value of an investment will fluctuate so that an investor’s shares, when redeemed, may be worth more or less than their original cost. Current performance of the Fund may be lower or higher than the performance quoted. As of the latest prospectus, the gross and net expense ratios of the Fund were 1.13% and 0.98%, respectively. Performance data current to the most recent month end may be obtained by calling 1.877.771.7979. The performance table does not reflect the deduction of taxes that a shareholder may pay on Fund distributions or the redemption of Fund shares. Returns shown for the Fund include the reinvestment of all dividends, if any. Total return calculations reflect the effect of the Adviser’s fee waiver agreement for the Fund. If such fee waivers had not occurred, the quoted performance would be lower.
7
Destinations International Equity Fund
Management’s Discussion of Fund Performance (Unaudited)
Investment Objective
The investment objective of the Destinations International Equity Fund (the “Fund”) is to provide long term capital appreciation.
Investment Strategy
The Fund will invest primarily in foreign equity securities, including emerging market and frontier market equity securities, of any capitalization. The Fund employs a multi-manager sub-advised structure. The Adviser may also invest a portion of the Fund’s assets in shares of exchange-traded funds (ETFs), which use a passive management strategy.
Investment Commentary
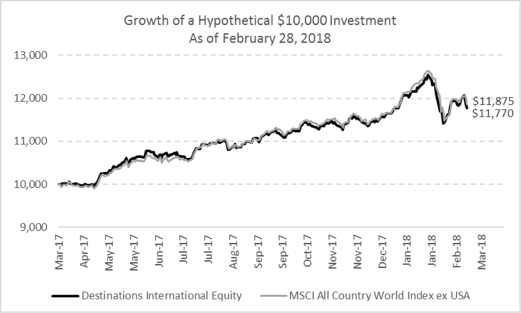
For the period from inception (March 20, 2017) through the Fund’s fiscal year-end on February 28, 2018, the Fund returned 17.70%, behind the MSCI All Country World Index ex USA which returned 18.75% over the period. From a sector perspective, the Fund benefited from very strong stock selection within the consumer staples sector. The healthcare sector was also a positive, both the underweight to the sector and strong stock selection. The information technology sector was a detractor for the Fund over the period, both an underweight position as the sector outperformed the broader index, as well as stock selection. From a geographical perspective, Europe was a solid positive contributor to the Fund’s performance due to both an underweight to the region, as well as very strong stock selection within the region. Stock selection within Japan was also a positive; however, stock selection within emerging Asia detracted.
Investment Sub-advisers
BAMCO, Inc.
Employs a long-term investment approach to emerging markets that seeks out appropriately capitalized open-ended growth opportunities, exceptional leadership, and sustainable competitive advantages.
MFS Investment Management
Employs a contrarian investment process that seeks companies that are undervalued compared to intrinsic value.
T. Rowe Price Associates, Inc.
Focuses on companies with the potential to achieve long term earnings growth that have a leading market position, technological leadership or proprietary advantage and seasoned management.
Wasatch Advisors, Inc.
Targets inefficient segments of international equity markets with a focus on high-quality companies that offer long duration earnings and revenue growth and are trading at a reasonable valuation.
8
The following chart compares the value of a hypothetical $10,000 investment in the Destinations International Equity Fund from its inception (March 20, 2017) to February 28, 2018 as compared with the MSCI All Country World Index ex USA.
Average Total Returns as of February 28, 2018
| | | | | | | | |
| | | YTD | | | Since Inception
(3/20/2017) | |
Destinations International Equity | | | 0.00 | % | | | 17.70 | % |
MSCI All Country World Index ex USA | | | 0.62 | % | | | 18.75 | % |
Performance data quoted represents past performance; past performance does not guarantee future results. The investment return and principal value of an investment will fluctuate so that an investor’s shares, when redeemed, may be worth more or less than their original cost. Current performance of the Fund may be lower or higher than the performance quoted. As of the latest prospectus, the gross and net expense ratios of the Fund were 1.27% and 1.05%, respectively. Performance data current to the most recent month end may be obtained by calling 1.877.771.7979. The performance table does not reflect the deduction of taxes that a shareholder may pay on Fund distributions or the redemption of Fund shares. Returns shown for the Fund include the reinvestment of all dividends, if any. Total return calculations reflect the effect of the Adviser’s fee waiver agreement for the Fund. If such fee waivers had not occurred, the quoted performance would be lower.
9
Destinations Equity Income Fund
Management’s Discussion of Fund Performance (Unaudited)
Investment Objective
The Destinations Equity Income Fund (the “Fund”) has a primary investment objective of current income with a secondary objective of long-term capital appreciation.
Investment Strategy
The Fund will invest in dividend-paying securities of both U.S.-based and foreign companies. The Fund invests primarily in common stock, preferred stock, interests in Real Estate Investment Trusts (REITs), foreign securities, American Depositary Receipts (ADRs), equity-linked notes and derivatives that are believed to be attractively valued and to have the potential for long-term growth. The Fund employs a multi-manager sub-advised structure. The Adviser may also invest a portion of the Fund’s assets in shares of exchange-traded funds (ETFs), which use a passive management strategy.
Investment Commentary
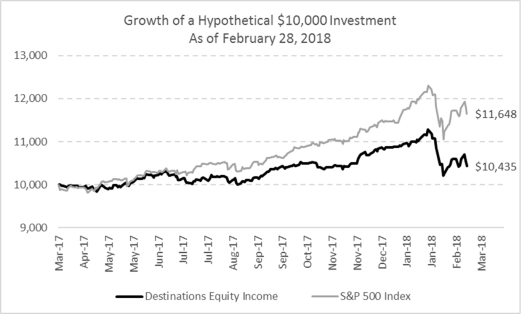
For the period from inception (March 20, 2017) through the Fund’s fiscal year-end on February 28, 2018, the Fund returned 4.35%, behind the 16.48% return for the S&P 500 Index over the period. The Fund’s emphasis on equity income producing sectors of the equity market was a significant detractor when compared to the performance of the broad-based S&P 500 Index. Equity income oriented sectors, including consumer staples, energy, telecommunication services, utilities and real estate, were the worst performing sectors of the S&P 500 Index over the period, and significant overweights in those sectors significantly weighed on relative performance over the period. However, stock selection was a positive in the energy, telecommunication services and consumer discretionary sectors.
Investment Sub-advisers
Columbia Management Investment Advisers, LLC
Employs a contrarian investment philosophy with a focus on companies that have the potential to generate strong, sustainable free cash flow from operations, leading to dividend opportunities.
Federated Equity Management Company of Pennsylvania
Employs a bottom-up, fundamental approach with an emphasis on high-yielding, dividend growing stocks.
10
The following chart compares the value of a hypothetical $10,000 investment in the Destinations Equity Income Fund from its inception (March 20, 2017) to February 28, 2018 as compared with the S&P 500 Index.
Average Total Returns as of February 28, 2018
| | | | | | | | |
| | | YTD | | | Since Inception
(3/20/2017) | |
Destinations Equity Income | | | -4.16 | % | | | 4.35 | % |
S&P 500 Index | | | 1.83 | % | | | 16.48 | % |
Performance data quoted represents past performance; past performance does not guarantee future results. The investment return and principal value of an investment will fluctuate so that an investor’s shares, when redeemed, may be worth more or less than their original cost. Current performance of the Fund may be lower or higher than the performance quoted. As of the latest prospectus, the gross and net expense ratios of the Fund were 1.04% and 0.88%, respectively. Performance data current to the most recent month end may be obtained by calling 1.877.771.7979. The performance table does not reflect the deduction of taxes that a shareholder may pay on Fund distributions or the redemption of Fund shares. Returns shown for the Fund include the reinvestment of all dividends, if any. Total return calculations reflect the effect of the Adviser’s fee waiver agreement for the Fund. If such fee waivers had not occurred, the quoted performance would be lower.
11
Destinations Real Assets Fund
Management’s Discussion of Fund Performance (Unaudited)
Investment Objective
The investment objective of the Destinations Real Assets Fund (the “Fund”) is long term capital appreciation with some inflation protection.
Investment Strategy
The Fund will invest in “real assets” and securities that derive at least 50% of their profits or revenues from, or commit at least 50% of assets to, real assets and activities related to real assets. Real assets are defined broadly but the fund and are considered to include any assets that have physical properties, such as energy and natural resources, real estate, basic materials, equipment, utilities and infrastructure, and commodities. The Fund may employ a multi-manager sub-advised structure. The Adviser may also invest a portion of the Fund’s assets in shares of exchange-traded funds (ETFs), which use a passive management strategy.
Investment Commentary
For the period from inception (March 20, 2017) through the Fund’s fiscal year-end on February 28, 2018, the Fund returned -7.95% compared to a return of 16.42% for the MSCI World Index, a proxy for the global developed equity markets. The Fund’s emphasis on oil and gas companies through its large allocation to a natural resources strategy was the largest detractor from performance as these companies significantly underperformed global equities over this period, in particular those companies focused on natural gas. The Fund’s allocation to US real estate investment trusts was also a negative as REITs lagged global equities. On the positive side, stock selection in electric utilities benefited the Fund.
Investment Sub-advisers
SailingStone Capital Partners LLC
Employs a concentrated global all cap strategy that seeks to identify natural resources companies with “advantaged assets” managed by prudent capital allocators to create values across a commodity cycle.
12
The following chart compares the value of a hypothetical $10,000 investment in the Destinations Real Assets Fund from its inception (March 20, 2017) to February 28, 2018 as compared with the MSCI World Index.

Average Total Returns as of February 28, 2018
| | | | | | | | |
| | | YTD | | | Since Inception
(3/20/2017) | |
Destinations Real Assets | | | -10.33 | % | | | -7.95 | % |
MSCI World Index | | | 0.98 | % | | | 16.42 | % |
Performance data quoted represents past performance; past performance does not guarantee future results. The investment return and principal value of an investment will fluctuate so that an investor’s shares, when redeemed, may be worth more or less than their original cost. Current performance of the Fund may be lower or higher than the performance quoted. As of the latest prospectus, the gross and net expense ratios of the Fund were 1.26% and 1.09%, respectively. Performance data current to the most recent month end may be obtained by calling 1.877.771.7979. The performance table does not reflect the deduction of taxes that a shareholder may pay on Fund distributions or the redemption of Fund shares. Returns shown for the Fund include the reinvestment of all dividends, if any. Total return calculations reflect the effect of the Adviser’s fee waiver agreement for the Fund. If such fee waivers had not occurred, the quoted performance would be lower.
13
Destinations Core Fixed Income Fund
Management’s Discussion of Fund Performance (Unaudited)
Investment Objective
The investment objective of the Destinations Core Fixed Income Fund (the “Fund”) is maximum current income and total return.
Investment Strategy
The Fund will invest in fixed income instruments. The Fund invests primarily in bonds and other fixed income instruments issued by governmental or private-sector entities, including mortgage-backed securities, asset-backed securities, investment grade corporate bonds, junk bonds, bank loans, loan participations, assignments, derivatives, credit default swaps, inverse floater securities, interest-only and principal-only securities and money market instruments. The Fund employs a multi-manager sub-advised structure. The Adviser may also invest a portion of the Fund’s assets in shares of exchange-traded funds (ETFs), which use a passive management strategy.
Investment Commentary
For the period from inception (March 20, 2017) through the Fund’s fiscal year-end on February 28, 2018, the Fund returned 0.34% compared to a return of 1.05% for the Bloomberg Barclays US Aggregate Index. The Fund’s shorter duration positioning and underweight to US Treasuries helped as interest rates moved higher over the period and US Treasuries lagged other fixed income sectors. Security selection within the securitized sectors of mortgage-backed securities, asset backed securities and commercial mortgage-backed securities contributed positively to performance. While security selection within corporate credit was a positive, an underweight to the sector in favor of an overweight in mortgage-backed securities detracted from the Fund’s performance.
Investment Sub-advisers
BlackRock Investment Managements, LLC
Provides broad fixed income market index exposure by tracking the Bloomberg Barclays US Aggregate Index.
DoubleLine Capital LP
Combines top-down factors, with bottom-up security analysis and invests across a broad range of fixed income sectors.
14
The following chart compares the value of a hypothetical $10,000 investment in the Destinations Core Fixed Income Fund from its inception (March 20, 2017) to February 28, 2018 as compared with the Bloomberg Barclays US Aggregate Index.
Average Total Returns as of February 28, 2018
| | | | | | | | |
| | | YTD | | | Since Inception
(3/20/2017) | |
Destinations Core Fixed Income | | | -1.69 | % | | | 0.34 | % |
Bloomberg Barclays US Aggregate Index | | | -2.09 | % | | | 1.05 | % |
Performance data quoted represents past performance; past performance does not guarantee future results. The investment return and principal value of an investment will fluctuate so that an investor’s shares, when redeemed, may be worth more or less than their original cost. Current performance of the Fund may be lower or higher than the performance quoted. As of the latest prospectus, the gross and net expense ratios of the Fund were 0.87% and 0.77%, respectively. Performance data current to the most recent month end may be obtained by calling 1.877.771.7979. The performance table does not reflect the deduction of taxes that a shareholder may pay on Fund distributions or the redemption of Fund shares. Returns shown for the Fund include the reinvestment of all dividends, if any. Total return calculations reflect the effect of the Adviser’s fee waiver agreement for the Fund. If such fee waivers had not occurred, the quoted performance would be lower.
15
Destinations Low Duration Fixed Income Fund
Management’s Discussion of Fund Performance (Unaudited)
Investment Objective
The investment objective of the Destinations Low Duration Fixed Income Fund (the “Fund”) is to provide current income.
Investment Strategy
The Fund will invest in fixed income instruments. The Fund invests primarily in bonds and other fixed income instruments issued by governmental or private-sector entities, including mortgage-backed securities, asset-backed securities, investment grade corporate bonds, junk bonds, bank loans and money market instruments. The Fund will normally be constructed with an average total portfolio duration of three years or less. The Fund employs a multi-manager sub-advised structure. The Adviser may also invest a portion of the Fund’s assets in shares of exchange-traded funds (ETFs), which use a passive management strategy.
Investment Commentary
For the period from inception (March 20, 2017) through the Fund’s fiscal year-end on February 28, 2018, the Fund returned 1.52%, outperforming the ICE BofAML US Treasury 1-3 Year Index which posted a return of -0.04% for the period. The Fund’s significant bias toward corporate credit, both investment grade and high yield, was a strong positive contributor to the Fund’s performance over the period. The Fund’s allocation to securities strategies also contributed positively to performance. The Fund also maintained a shorter duration than the index over that period which was a benefit as interest rates moved higher.
Investment Sub-advisers
CrossingBridge Advisors, LLC
Focuses on capital preservation by investing in underlying event driven high yield and investment grade corporate credit opportunities with an estimated holding life of several months to three years.
DoubleLine Capital LP
Combines top-down factors, with bottom-up security analysis and seeks to maximize current income through investing in a variety of fixed income sectors with an overall average effective duration of three years or less.
16
The following chart compares the value of a hypothetical $10,000 investment in the Destinations Low Duration Fixed Income Fund from its inception (March 20, 2017) to February 28, 2018 as compared with the ICE BofAML US Treasury 1-3 Year Index.
Average Total Returns as of February 28, 2018
| | | | | | | | |
| | | YTD | | | Since Inception
(3/20/2017) | |
Destinations Low Duration Fixed Income | | | 0.24 | % | | | 1.52 | % |
ICE BofAML US Treasury 1-3 Year Index | | | -0.33 | % | | | -0.04 | % |
Performance data quoted represents past performance; past performance does not guarantee future results. The investment return and principal value of an investment will fluctuate so that an investor’s shares, when redeemed, may be worth more or less than their original cost. Current performance of the Fund may be lower or higher than the performance quoted. As of the latest prospectus, the gross and net expense ratios of the Fund were 0.97% and 0.87%, respectively. Performance data current to the most recent month end may be obtained by calling 1.877.771.7979. The performance table does not reflect the deduction of taxes that a shareholder may pay on Fund distributions or the redemption of Fund shares. Returns shown for the Fund include the reinvestment of all dividends, if any. Total return calculations reflect the effect of the Adviser’s fee waiver agreement for the Fund. If such fee waivers had not occurred, the quoted performance would be lower.
17
Destinations Global Fixed Income Opportunities Fund
Management’s Discussion of Fund Performance (Unaudited)
Investment Objective
The investment objective of the Destinations Global Fixed Income Opportunities Fund (the “Fund”) is to maximize total return.
Investment Strategy
The Fund invests in fixed income securities including global investment grade and non-investment grade debt, global sovereign debt, bank loans, preferred securities and convertible securities. The Fund employs a multi-manager sub-advised structure. The Adviser may also invest a portion of the Fund’s assets in shares of exchange-traded funds (ETFs), which use a passive management strategy.
Investment Commentary
For the period from inception (March 20, 2017) through the Fund’s fiscal year-end on February 28, 2018, the Fund returned 3.34%, ahead of the Bloomberg Barclays US Universal Index return of 1.51% over the period. The Fund’s significant overweight to corporate credit, as well as strong security selection within the corporate credit sector, contributed positively to the Fund’s performance. The Fund’s allocations to preferred stock and bank loans were also positives. In addition, the Fund’s did not own any US Treasury securities, which was a positive from a relative performance perspective as US Treasuries underperformed all other fixed income sectors over the period.
Investment Sub-advisers
CrossingBridge Advisors, LLC
Employs an opportunistic approach, allocating to high yield and investment grade corporate credit securities across multiple credit opportunity types.
DoubleLine Capital LP
Employs a value-oriented, research-driven approach to identify emerging market countries and companies with the potential for improving credit fundamentals and ratings.
Nuveen Asset Management, LLC
Employs a top-down quantitative-driven process complemented by fundamental credit research analysis with a focus on relative value, resulting in a concentrated portfolio of preferred securities.
18
The following chart compares the value of a hypothetical $10,000 investment in the Destinations Global Fixed Income Opportunities Fund from its inception (March 20, 2017) to February 28, 2018 as compared with the Bloomberg Barclays US Universal Index.
Average Total Returns as of February 28, 2018
| | | | | | | | |
| | | YTD | | | Since Inception
(3/20/2017) | |
Destinations Global Fixed Income Opportunities | | | -0.22 | % | | | 3.34 | % |
Bloomberg Barclays US Universal Index | | | -1.90 | % | | | 1.51 | % |
Performance data quoted represents past performance; past performance does not guarantee future results. The investment return and principal value of an investment will fluctuate so that an investor’s shares, when redeemed, may be worth more or less than their original cost. Current performance of the Fund may be lower or higher than the performance quoted. As of the latest prospectus, the gross and net expense ratios of the Fund were 1.07% and 0.90%, respectively. Performance data current to the most recent month end may be obtained by calling 1.877.771.7979. The performance table does not reflect the deduction of taxes that a shareholder may pay on Fund distributions or the redemption of Fund shares. Returns shown for the Fund include the reinvestment of all dividends, if any. Total return calculations reflect the effect of the Adviser’s fee waiver agreement for the Fund. If such fee waivers had not occurred, the quoted performance would be lower.
19
Destinations Municipal Fixed Income Fund
Management’s Discussion of Fund Performance (Unaudited)
Investment Objective
The investment objective of the Destinations Municipal Fixed Income Fund (the “Fund”) is to provide current income that is exempt from federal income taxation.
Investment Strategy
The Fund invests in fixed income securities that pay interest that is exempt from regular federal income tax. In seeking high current income exempt from regular federal income tax, the Fund will invest in municipal instruments, which are fixed-income obligations issued by a state, territory or possession of the United States (included the District of Columbia) or a political subdivision, agency or instrumentality thereof, primarily in investment grade debt obligations. The Fund may employ a multi-manager sub-advised structure. The Adviser may also invest a portion of the Fund’s assets in shares of exchange-traded funds (ETFs), which use a passive management strategy.
Investment Commentary
For the period from inception (March 20, 2017) through the Fund’s fiscal year-end on February 28, 2018, the Fund returned -0.14% compared to a return of 1.27% for the ICE BofAML US Municipal Securities 1-10 Year Index. The Fund received a significant cash inflow in July 2017, and following the large cash flow the Fund needed time to become fully invested. The Fund’s high cash position had a negative impact on performance as during this investment period the municipal bond market delivered solid returns. The Fund’s security selection within revenue bonds contributed positively to performance over the period, as did it’s selection within the highest quality bonds.
Investment Sub-advisers
Northern Trust Investments, Inc.
Employs a relative value, high quality approach to municipal bonds that seeks to identify undervalued securities and sectors.
20
The following chart compares the value of a hypothetical $10,000 investment in the Destinations Municipal Fixed Income Fund from its inception (March 20, 2017) to February 28, 2018 as compared with the ICE BofAML US Municipal Securities 1-10 Year Index.
Average Total Returns as of February 28, 2018
| | | | | | | | |
| | | YTD | | | Since Inception
(3/20/2017) | |
Destinations Municipal Fixed Income | | | -1.35 | % | | | -0.14 | % |
ICE BofAML US Municipal Securities 1-10 Yr Index | | | -0.58 | % | | | 1.27 | % |
Performance data quoted represents past performance; past performance does not guarantee future results. The investment return and principal value of an investment will fluctuate so that an investor’s shares, when redeemed, may be worth more or less than their original cost. Current performance of the Fund may be lower or higher than the performance quoted. As of the latest prospectus, the gross and net expense ratios of the Fund were 0.87% and 0.75%, respectively. Performance data current to the most recent month end may be obtained by calling 1.877.771.7979. The performance table does not reflect the deduction of taxes that a shareholder may pay on Fund distributions or the redemption of Fund shares. Returns shown for the Fund include the reinvestment of all dividends, if any. Total return calculations reflect the effect of the Adviser’s fee waiver agreement for the Fund. If such fee waivers had not occurred, the quoted performance would be lower.
21
Destinations Multi Strategy Alternatives Fund
Management’s Discussion of Fund Performance (Unaudited)
Investment Objective
The investment objective of the Destinations Multi Strategy Alternatives Fund (the “Fund”) is long term growth of capital with reduced correlation to equity and fixed income markets.
Investment Strategy
The Fund employs a strategy intended to generate long term growth across market cycles with reduced correlation to equity and fixed income markets. The Fund may invest across multiple strategies including long/short credit, long/short equity, relative value, distressed credit, global macro, event-driven and closed-ended funds. The Fund employs a multi-manager sub-advised structure.
Investment Commentary
For the period from inception (March 20, 2017) through the Fund’s fiscal year-end on February 28, 2018, the Fund returned 3.94% compared to a return of 4.25% for the HFRX Global Hedge Fund Index. The Fund benefited from its allocation to closed-end fund, event driven and global macro strategies. The fund’s allocation to fixed income-oriented strategies contributed positively to performance on an absolute basis over the period, but were behind the more equity-oriented HFRX Global Hedge Fund Index.
Investment Sub-advisers
Avenue Capital Group II, L.P.
Employs a total return, event-driven long/short credit approach supported by in-depth, bottom-up credit research, resulting in a focused portfolio diversified across capital structure and geography.
Driehaus Capital Management LLC (Driehaus Active Income)
Seeks opportunities in credit markets by employing relative value and directional strategies, while fully hedging interest rate risk.
Driehaus Capital Management LLC (Driehaus Event Driven)
Employs a concentrated approach seeking asymmetric payoff profiles in directional long, directional short and relative value arbitrage strategies, focusing on liquid credit, equity and derivative securities.
RiverNorth Capital Management, LLC
Seeks to exploit the anomaly of closed-end fund discounts in the secondary market though investing in equity, fixed income and hybrid closed-end funds.
22
The following chart compares the value of a hypothetical $10,000 investment in the Destinations Multi Strategy Alternatives Fund from its inception (March 20, 2017) to February 28, 2018 as compared with the HFRX Global Hedge Fund Index.
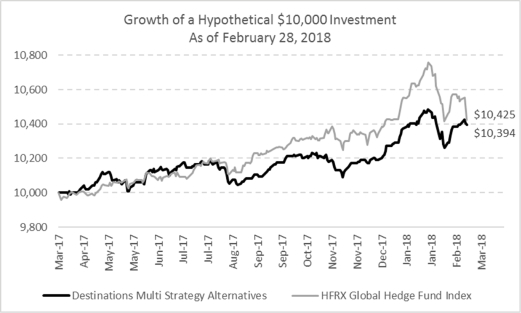
Average Total Returns as of February 28, 2018
| | | | | | | | |
| | | YTD | | | Since Inception
(3/20/2017) | |
Destinations Multi Strategy Alternatives | | | 0.99 | % | | | 3.94 | % |
HFRX Global Hedge Fund Index | | | -0.04 | % | | | 4.25 | % |
Performance data quoted represents past performance; past performance does not guarantee future results. The investment return and principal value of an investment will fluctuate so that an investor’s shares, when redeemed, may be worth more or less than their original cost. Current performance of the Fund may be lower or higher than the performance quoted. As of the latest prospectus, the gross and net expense ratios of the Fund were 1.86% and 1.32%, respectively. Performance data current to the most recent month end may be obtained by calling 1.877.771.7979. The performance table does not reflect the deduction of taxes that a shareholder may pay on Fund distributions or the redemption of Fund shares. Returns shown for the Fund include the reinvestment of all dividends, if any. Total return calculations reflect the effect of the Adviser’s fee waiver agreement for the Fund. If such fee waivers had not occurred, the quoted performance would be lower.
23
Fund Expenses
Example
All mutual funds have operating expenses. As a shareholder of a Fund, your investment is affected by these ongoing costs, which include (among others) costs for portfolio management, administrative services and shareholder reports. This example is intended to help you understand your ongoing costs (in dollars) of investing in a Fund and to compare these costs with the ongoing costs of investing in other mutual funds. This example is based on an investment of $1,000 invested on September 1, 2017 and held for the six months ended February 28, 2018.
Actual Expenses
The table below titled “Based on Actual Total Return” provides information about actual account values and actual expenses. You may use the information provided in this table, together with the amount you invested, to estimate the expenses that you paid over the period. To estimate the expenses you paid on your account during this period, divide your account value by $1,000 (for example, an $8,600 account value divided by $1,000 = 8.6), then multiply the result by the number under the heading entitled “Expenses Paid During the Period”.
Based on Actual Total Return (1)
| | | | | | | | | | | | | | | | | | | | |
Fund | | Total Return (2) | | | Beginning
Account
Value | | | Ending
Account
Value | | | Annualized
Expense
Ratios (3) | | | Expense
Paid During
the Period (4) | |
Destinations Large Cap Equity Fund | | | 10.38 | % | | $ | 1,000.00 | | | $ | 1,103.81 | | | | 0.85 | % | | $ | 4.43 | |
Destinations Small-Mid Cap Equity Fund | | | 7.49 | % | | | 1,000.00 | | | | 1,074.93 | | | | 1.04 | % | | | 5.35 | |
Destinations International Equity Fund | | | 6.52 | % | | | 1,000.00 | | | | 1,065.20 | | | | 1.15 | % | | | 5.89 | |
Destinations Equity Income Fund | | | 2.84 | % | | | 1,000.00 | | | | 1,028.44 | | | | 0.93 | % | | | 4.68 | |
Destinations Real Assets Fund | | | (8.50 | )% | | | 1,000.00 | | | | 915.02 | | | | 1.22 | % | | | 5.79 | |
Destinations Core Fixed Income Fund | | | (1.83 | )% | | | 1,000.00 | | | | 981.71 | | | | 0.83 | % | | | 4.08 | |
Destinations Low Duration Fixed Income Fund | | | 0.71 | % | | | 1,000.00 | | | | 1,007.13 | | | | 0.97 | % | | | 4.83 | |
Destinations Global Fixed Income Opportunities Fund | | | 0.42 | % | | | 1,000.00 | | | | 1,004.24 | | | | 1.00 | % | | | 4.97 | |
Destinations Municipal Fixed Income Fund | | | (1.38 | )% | | | 1,000.00 | | | | 986.24 | | | | 0.80 | % | | | 3.94 | |
Destinations Multi Strategy Alternatives Fund | | | 3.07 | % | | | 1,000.00 | | | | 1,030.70 | | | | 1.26 | % | | | 6.34 | |
| (1) | For the six months ended February 28, 2018. |
| (2) | Assumes reinvestment of all distributions, including returns of capital, if any, at net asset value. Total return is not annualized as it may not be representative of the total return for the year. Performance figure may reflect fee waivers and/or expense reimbursements. Past performance is no guarantee of future results. In the absence of fee waivers and/or expense reimbursements, the total return would have been lower. |
| (3) | Annualized Expense Ratios are based on the most recent 6 month expense ratios, which may differ from expense ratios in the Financial Highlights. |
| (4) | Expenses (net of fee waivers and/or expense reimbursements) are equal to each Fund’s respective annualized expense ratio multiplied by the average account value over the period, multiplied by the number of days (181 days) in the most recent period, then divided by 365. |
24
Fund Expenses
(continued)
Hypothetical Example for Comparison Purposes
The table below titled “Based on Hypothetical Total Return” provides information about hypothetical account values and hypothetical expenses based on each Fund’s actual expense ratio and an assumed rate of return of 5.00% per period before expenses, which is not each Fund’s actual return. The hypothetical account values and expenses may not be used to estimate the actual ending account balances or expenses you paid for the period. You may use the information provided in this table to compare the ongoing costs of investing in each Fund and other funds. To do so, compare the 5.00% hypothetical example relating to a Fund with the 5.00% hypothetical examples that appear in the shareholder reports of the other funds.
Based on Hypothetical Total Return (1)
| | | | | | | | | | | | | | | | | | | | |
Fund | | Hypothethical
Annualized
Total Return | | | Beginning
Account
Value | | | Ending
Account
Value | | | Annualized
Expense
Ratios (2) | | | Expense
Paid During
the Period (3) | |
Destinations Large Cap Equity Fund | | | 5.00 | % | | $ | 1,000.00 | | | $ | 1,020.58 | | | | 0.85 | % | | $ | 4.26 | |
Destinations Small-Mid Cap Equity Fund | | | 5.00 | % | | | 1,000.00 | | | | 1,019.64 | | | | 1.04 | % | | | 5.21 | |
Destinations International Equity Fund | | | 5.00 | % | | | 1,000.00 | | | | 1,019.09 | | | | 1.15 | % | | | 5.76 | |
Destinations Equity Income Fund | | | 5.00 | % | | | 1,000.00 | | | | 1,020.18 | | | | 0.93 | % | | | 4.66 | |
Destinations Real Assets Fund | | | 5.00 | % | | | 1,000.00 | | | | 1,018.74 | | | | 1.22 | % | | | 6.11 | |
Destinations Core Fixed Income Fund | | | 5.00 | % | | | 1,000.00 | | | | 1,020.68 | | | | 0.83 | % | | | 4.16 | |
Destinations Low Duration Fixed Income Fund | | | 5.00 | % | | | 1,000.00 | | | | 1,019.98 | | | | 0.97 | % | | | 4.86 | |
Destinations Destinations Global Fixed Income Opportunities Fund | | | 5.00 | % | | | 1,000.00 | | | | 1,019.84 | | | | 1.00 | % | | | 5.01 | |
Destinations Municipal Fixed Income Fund | | | 5.00 | % | | | 1,000.00 | | | | 1,020.83 | | | | 0.80 | % | | | 4.01 | |
Destinations Multi Strategy Alternatives Fund | | | 5.00 | % | | | 1,000.00 | | | | 1,018.55 | | | | 1.26 | % | | | 6.31 | |
| (1) | For the six months ended February 28, 2018. |
| (2) | Annualized Expense Ratios are based on the most recent 6 month expense ratios, which may differ from net expense ratios in the Financial Highlights. |
| (3) | Expenses (net of fee waivers and/or expense reimbursements) are equal to each Fund’s respective annualized expense ratio multiplied by the average account value over the period, multiplied by the number of days (181 days) in the period, then divided by 365 (to reflect the period). |
25
Schedules of Investments
February 28, 2018
Destinations Large Cap Equity Fund
| | | | | | | | |
| Face Amount | | | | Security | | Value | |
CORPORATE BOND & NOTE - 0.0% | | | | |
Consumer Cyclical - 0.0% | | | | |
$ 513,579 | | | | Caesars Entertainment Corp., Senior Unsecured Notes, 5.000% due 10/1/24 | | $ | 999,552 | |
| | | | | | | | |
| | | | TOTAL CORPORATE BOND & NOTE (Cost - $855,474) | | | 999,552 | |
| | | | | | | | |
| | | |
Shares/Units | | | | | | | |
COMMON STOCKS - 97.5% | | | | |
BASIC MATERIALS - 1.8% | | | | |
Chemicals - 1.6% | | | | | | |
7,577 | | | | Air Products & Chemicals Inc. | | | 1,218,306 | |
3,845 | | | | Albemarle Corp. | | | 386,153 | |
8,000 | | | | CF Industries Holdings Inc. | | | 329,920 | |
420,751 | | | | DowDuPont Inc. | | | 29,578,796 | |
4,998 | | | | Eastman Chemical Co. | | | 505,198 | |
4,671 | | | | FMC Corp. | | | 366,580 | |
2,751 | | | | International Flavors & Fragrances Inc. | | | 388,579 | |
11,251 | | | | LyondellBasell Industries NV, Class A Shares | | | 1,217,583 | |
15,273 | | | | Monsanto Co. | | | 1,884,230 | |
12,228 | | | | Mosaic Co. | | | 321,841 | |
72,142 | | | | Nutrien Ltd.* | | | 3,552,993 | |
8,848 | | | | PPG Industries Inc. | | | 994,869 | |
9,958 | | | | Praxair Inc. | | | 1,491,210 | |
2,862 | | | | Sherwin-Williams Co. | | | 1,149,322 | |
| | | | | | | | |
| | | | Total Chemicals | | | 43,385,580 | |
| | | | | | | | |
Forest Products & Paper - 0.1% | | | | |
14,369 | | | | International Paper Co. | | | 856,249 | |
| | | | | | | | |
Iron/Steel - 0.0% | | | | |
11,052 | | | | Nucor Corp. | | | 722,801 | |
| | | | | | | | |
Mining - 0.1% | | | | |
177,719 | | | | Freeport-McMoRan Inc.* | | | 3,305,573 | |
18,550 | | | | Newmont Mining Corp. | | | 708,610 | |
| | | | | | | | |
| | | | Total Mining | | | 4,014,183 | |
| | | | | | | | |
| | | | TOTAL BASIC MATERIALS | | | 48,978,813 | |
| | | | | | | | |
COMMUNICATIONS - 16.6% | | | | |
Advertising - 0.0% | | | | | | |
13,522 | | | | Interpublic Group of Cos., Inc. | | | 316,415 | |
8,030 | | | | Omnicom Group Inc. | | | 612,127 | |
| | | | | | | | |
| | | | Total Advertising | | | 928,542 | |
| | | | | | | | |
See Notes to Financial Statements.
26
Schedules of Investments
(continued)
Destinations Large Cap Equity Fund
| | | | | | | | |
| Shares/Units | | | | Security | | Value | |
COMMUNICATIONS - 16.6% - (continued) | |
Internet - 11.3% | | | | |
152,606 | | | | Alibaba Group Holding Ltd., ADR* | | $ | 28,406,081 | |
24,872 | | | | Alphabet Inc., Class A Shares* | | | 27,456,698 | |
28,615 | | | | Alphabet Inc., Class C Shares* | | | 31,611,849 | |
57,234 | | | | Amazon.com Inc.* | | | 86,563,563 | |
24,755 | | | | Booking Holdings Inc.* | | | 50,352,660 | |
33,797 | | | | eBay Inc.* | | | 1,448,540 | |
4,278 | | | | Expedia Inc. | | | 449,917 | |
2,176 | | | | F5 Networks Inc.* | | | 323,180 | |
312,890 | | | | Facebook Inc., Class A Shares* | | | 55,794,545 | |
22,620 | | | | MercadoLibre Inc. | | | 8,775,882 | |
36,551 | | | | Netflix Inc.* | | | 10,650,230 | |
56,300 | | | | Snap Inc., Class A Shares*(a) | | | 975,116 | |
251,353 | | | | Symantec Corp. | | | 6,608,070 | |
110,600 | | | | Tencent Holdings Ltd. | | | 6,108,092 | |
3,587 | | | | TripAdvisor Inc.* | | | 143,767 | |
2,945 | | | | VeriSign Inc.* | | | 341,679 | |
| | | | | | | | |
| | | | Total Internet | | | 316,009,869 | |
| | | | | | | | |
Media - 1.7% | | | |
12,626 | | | | CBS Corp., Class B Shares | | | 668,799 | |
17,449 | | | | Charter Communications Inc., Class A Shares* | | | 5,966,336 | |
564,972 | | | | Comcast Corp., Class A Shares | | | 20,457,636 | |
5,611 | | | | Discovery Communications Inc., Class A Shares* | | | 136,459 | |
6,863 | | | | Discovery Communications Inc., Class C Shares* | | | 157,712 | |
7,933 | | | | DISH Network Corp., Class A Shares* | | | 330,727 | |
13,633 | | | | News Corp., Class A Shares | | | 219,900 | |
3,538 | | | | News Corp., Class B Shares | | | 58,023 | |
3,229 | | | | Scripps Networks Interactive Inc., Class A Shares(a) | | | 290,158 | |
27,081 | | | | Time Warner Inc. | | | 2,517,450 | |
201,788 | | | | Twenty-First Century Fox Inc., Class A Shares, ADR | | | 7,429,834 | |
14,200 | | | | Twenty-First Century Fox Inc., Class B Shares | | | 517,164 | |
12,284 | | | | Viacom Inc., Class B Shares | | | 409,549 | |
91,238 | | | | Walt Disney Co. | | | 9,412,112 | |
| | | | | | | | |
| | | | Total Media | | | 48,571,859 | |
| | | | | | | | |
Telecommunications - 3.6% | | | | |
897,798 | | | | AT&T Inc. | | | 32,590,067 | |
33,845 | | | | CenturyLink Inc. | | | 598,041 | |
1,079,452 | | | | Cisco Systems Inc. | | | 48,337,861 | |
13,059 | | | | Juniper Networks Inc. | | | 335,094 | |
5,631 | | | | Motorola Solutions Inc. | | | 597,731 | |
369,763 | | | | Verizon Communications Inc. | | | 17,652,486 | |
| | | | | | | | |
| | | | Total Telecommunications | | | 100,111,280 | |
| | | | | | | | |
| | | | TOTAL COMMUNICATIONS | | | 465,621,550 | |
| | | | | | | | |
See Notes to Financial Statements.
27
Schedules of Investments
(continued)
Destinations Large Cap Equity Fund
| | | | | | | | |
| Shares/Units | | | | Security | | Value | |
CONSUMER CYCLICAL - 6.9% | | | | |
Airlines - 0.3% | | | | |
4,254 | | | | Alaska Air Group Inc. | | $ | 274,383 | |
117,912 | | | | American Airlines Group Inc. | | | 6,396,726 | |
22,827 | | | | Delta Air Lines Inc. | | | 1,230,375 | |
18,991 | | | | Southwest Airlines Co. | | | 1,098,439 | |
8,754 | | | | United Continental Holdings Inc.* | | | 593,434 | |
| | | | | | | | |
| | | | Total Airlines | | | 9,593,357 | |
| | | | | | | | |
Apparel - 0.7% | | | | | | |
12,503 | | | | Hanesbrands Inc.(a) | | | 242,558 | |
5,297 | | | | Michael Kors Holdings Ltd.* | | | 333,340 | |
267,955 | | | | NIKE Inc., Class B Shares | | | 17,961,024 | |
1,952 | | | | Ralph Lauren Corp., Class A Shares | | | 206,600 | |
6,619 | | | | Under Armour Inc., Class A Shares*(a) | | | 109,743 | |
6,812 | | | | Under Armour Inc., Class C Shares*(a) | | | 102,521 | |
11,436 | | | | VF Corp. | | | 852,782 | |
| | | | | | | | |
| | | | Total Apparel | | | 19,808,568 | |
| | | | | | | | |
Auto Manufacturers - 0.6% | | | | |
24,169 | | | | Ferrari NV | | | 3,002,032 | |
135,880 | | | | Ford Motor Co. | | | 1,441,687 | |
44,455 | | | | General Motors Co. | | | 1,749,304 | |
12,232 | | | | PACCAR Inc. | | | 875,689 | |
27,955 | | | | Tesla Inc.*(a) | | | 9,590,242 | |
| | | | | | | | |
| | | | Total Auto Manufacturers | | | 16,658,954 | |
| | | | | | | | |
Auto Parts & Equipment - 0.2% | | | | |
43,341 | | | | Aptiv PLC | | | 3,958,333 | |
6,887 | | | | BorgWarner Inc. | | | 338,014 | |
8,576 | | | | Goodyear Tire & Rubber Co. | | | 248,189 | |
| | | | | | | | |
| | | | Total Auto Parts & Equipment | | | 4,544,536 | |
| | | | | | | | |
Distribution/Wholesale - 0.1% | | | | |
10,007 | | | | Fastenal Co. | | | 547,583 | |
10,798 | | | | LKQ Corp.* | | | 426,305 | |
1,803 | | | | WW Grainger Inc. | | | 471,575 | |
| | | | | | | | |
| | | | Total Distribution/Wholesale | | | 1,445,463 | |
| | | | | | | | |
Home Builders - 0.4% | | | | |
11,863 | | | | DR Horton Inc. | | | 497,060 | |
148,636 | | | | Lennar Corp., Class A Shares | | | 8,409,825 | |
2,689 | | | | Lennar Corp., Class B Shares | | | 121,973 | |
450 | | | | NVR Inc.* | | | 1,279,426 | |
9,448 | | | | PulteGroup Inc. | | | 265,205 | |
| | | | | | | | |
| | | | Total Home Builders | | | 10,573,489 | |
| | | | | | | | |
See Notes to Financial Statements.
28
Schedules of Investments
(continued)
Destinations Large Cap Equity Fund
| | | | | | | | |
| Shares/Units | | | | Security | | Value | |
CONSUMER CYCLICAL - 6.9% - (continued) | |
Home Furnishings - 0.0% | | | | |
4,389 | | | | Leggett & Platt Inc. | | $ | 190,746 | |
2,504 | | | | Whirlpool Corp. | | | 406,725 | |
| | | | | | | | |
| | | | Total Home Furnishings | | | 597,471 | |
| | | | | | | | |
Housewares - 0.0% | | | | |
17,055 | | | | Newell Brands Inc. | | | 438,143 | |
| | | | | | | | |
Leisure Time - 0.3% | | | | |
95,249 | | | | Carnival Corp. | | | 6,373,111 | |
5,853 | | | | Harley-Davidson Inc.(a) | | | 265,609 | |
6,196 | | | | Norwegian Cruise Line Holdings Ltd.* | | | 352,552 | |
5,957 | | | | Royal Caribbean Cruises Ltd. | | | 754,156 | |
| | | | | | | | |
| | | | Total Leisure Time | | | 7,745,428 | |
| | | | | | | | |
Lodging - 0.3% | | | | |
216,117 | | | | Caesars Entertainment Corp.* | | | 2,744,686 | |
7,034 | | | | Hilton Worldwide Holdings Inc. | | | 568,277 | |
18,651 | | | | Marriott International Inc., Class A Shares | | | 2,633,708 | |
51,540 | | | | MGM Resorts International | | | 1,764,214 | |
3,518 | | | | Wyndham Worldwide Corp. | | | 407,314 | |
2,785 | | | | Wynn Resorts Ltd. | | | 466,488 | |
| | | | | | | | |
| | | | Total Lodging | | | 8,584,687 | |
| | | | | | | | |
Retail - 4.0% | | | | |
2,527 | | | | Advance Auto Parts Inc. | | | 288,710 | |
956 | | | | AutoZone Inc.* | | | 635,472 | |
8,850 | | | | Best Buy Co., Inc. | | | 641,094 | |
6,341 | | | | CarMax Inc.* | | | 392,635 | |
864 | | | | Chipotle Mexican Grill Inc., Class A Shares* | | | 275,106 | |
58,506 | | | | Costco Wholesale Corp. | | | 11,168,795 | |
4,305 | | | | Darden Restaurants Inc. | | | 396,878 | |
27,468 | | | | Dollar General Corp. | | | 2,598,198 | |
124,093 | | | | Dollar Tree Inc.* | | | 12,736,906 | |
16,631 | | | | Dollarama Inc. | | | 1,936,113 | |
7,903 | | | | Domino’s Pizza Inc. | | | 1,757,706 | |
4,315 | | | | Foot Locker Inc. | | | 198,102 | |
7,240 | | | | Gap Inc. | | | 228,639 | |
5,106 | | | | Genuine Parts Co. | | | 468,935 | |
45,012 | | | | Home Depot Inc. | | | 8,204,337 | |
5,874 | | | | Kohl’s Corp. | | | 388,213 | |
8,590 | | | | L Brands Inc. | | | 423,745 | |
161,569 | | | | Lowe’s Cos., Inc. | | | 14,474,967 | |
10,612 | | | | Macy’s Inc. | | | 312,099 | |
27,722 | | | | McDonald’s Corp. | | | 4,372,868 | |
See Notes to Financial Statements.
29
Schedules of Investments
(continued)
Destinations Large Cap Equity Fund
| | | | | | | | |
| Shares/Units | | | | Security | | Value | |
CONSUMER CYCLICAL - 6.9% - (continued) | |
Retail - 4.0% - (continued) | | | | |
4,167 | | | | Nordstrom Inc. | | $ | 213,809 | |
2,958 | | | | O’Reilly Automotive Inc.* | | | 722,314 | |
2,675 | | | | PVH Corp. | | | 385,949 | |
13,418 | | | | Ross Stores Inc. | | | 1,047,811 | |
2,105 | | | | Signet Jewelers Ltd. | | | 105,840 | |
113,637 | | | | Starbucks Corp. | | | 6,488,673 | |
256,697 | | | | Tapestry Inc. | | | 13,068,444 | |
52,207 | | | | Target Corp. | | | 3,936,930 | |
3,556 | | | | Tiffany & Co. | | | 359,298 | |
22,146 | | | | TJX Cos., Inc. | | | 1,831,031 | |
4,372 | | | | Tractor Supply Co. | | | 283,874 | |
43,151 | | | | Ulta Beauty Inc.* | | | 8,774,756 | |
30,192 | | | | Walgreens Boots Alliance Inc. | | | 2,079,927 | |
50,903 | | | | Walmart Inc. | | | 4,581,779 | |
78,509 | | | | Yum China Holdings Inc. | | | 3,401,010 | |
49,516 | | | | Yum! Brands Inc. | | | 4,029,612 | |
| | | | | | | | |
| | | | Total Retail | | | 113,210,575 | |
| | | | | | | | |
Textiles - 0.0% | | | | |
2,207 | | | | Mohawk Industries Inc.* | | | 529,415 | |
| | | | | | | | |
Toys/Games/Hobbies - 0.0% | | | | |
3,874 | | | | Hasbro Inc. | | | 370,238 | |
11,493 | | | | Mattel Inc. | | | 182,739 | |
| | | | | | | | |
| | | | Total Toys/Games/Hobbies | | | 552,977 | |
| | | | | | | | |
| | | | TOTAL CONSUMER CYCLICAL | | | 194,283,063 | |
| | | | | | | | |
CONSUMER NON-CYCLICAL - 21.6% | | | | |
Agriculture - 1.1% | | | | |
66,369 | | | | Altria Group Inc. | | | 4,177,928 | |
305,362 | | | | Archer-Daniels-Midland Co. | | | 12,678,630 | |
127,072 | | | | Philip Morris International Inc. | | | 13,158,306 | |
| | | | | | | | |
| | | | Total Agriculture | | | 30,014,864 | |
| | | | | | | | |
Beverages - 1.2% | | | | |
6,815 | | | | Brown-Forman Corp., Class B Shares | | | 475,619 | |
133,393 | | | | Coca-Cola Co. | | | 5,765,245 | |
5,990 | | | | Constellation Brands Inc., Class A Shares | | | 1,290,725 | |
6,274 | | | | Dr Pepper Snapple Group Inc. | | | 729,353 | |
6,423 | | | | Molson Coors Brewing Co., Class B Shares | | | 489,754 | |
168,350 | | | | Monster Beverage Corp.* | | | 10,668,340 | |
127,013 | | | | PepsiCo Inc. | | | 13,937,136 | |
| | | | | | | | |
| | | | Total Beverages | | | 33,356,172 | |
| | | | | | | | |
See Notes to Financial Statements.
30
Schedules of Investments
(continued)
Destinations Large Cap Equity Fund
| | | | | | | | |
| Shares/Units | | | | Security | | Value | |
CONSUMER NON-CYCLICAL - 21.6% - (continued) | |
Biotechnology - 3.7% | | | | |
159,427 | | | | Alexion Pharmaceuticals Inc.* | | $ | 18,724,701 | |
16,200 | | | | Alnylam Pharmaceuticals Inc.* | | | 1,946,592 | |
25,244 | | | | Amgen Inc. | | | 4,639,090 | |
33,200 | | | | Biogen Inc.* | | | 9,594,468 | |
143,845 | | | | Celgene Corp.* | | | 12,531,776 | |
226,081 | | | | Gilead Sciences Inc. | | | 17,799,357 | |
53,996 | | | | Illumina Inc.* | | | 12,312,168 | |
30,792 | | | | Incyte Corp.* | | | 2,622,247 | |
2,678 | | | | Regeneron Pharmaceuticals Inc.* | | | 858,138 | |
132,615 | | | | Vertex Pharmaceuticals Inc.* | | | 22,018,069 | |
| | | | | | | | |
| | | | Total Biotechnology | | | 103,046,606 | |
| | | | | | | | |
Commercial Services - 2.1% | | | | |
15,426 | | | | Automatic Data Processing Inc. | | | 1,778,926 | |
2,992 | | | | Cintas Corp. | | | 510,615 | |
9,043 | | | | Ecolab Inc. | | | 1,179,659 | |
31,490 | | | | Equifax Inc. | | | 3,558,370 | |
3,129 | | | | Gartner Inc.* | | | 354,860 | |
5,538 | | | | Global Payments Inc. | | | 627,954 | |
7,538 | | | | H&R Block Inc. | | | 190,937 | |
12,636 | | | | IHS Markit Ltd.* | | | 594,524 | |
5,774 | | | | Moody’s Corp. | | | 963,565 | |
113,286 | | | | New Oriental Education & Technology Group Inc., ADR | | | 10,353,208 | |
11,638 | | | | Nielsen Holdings PLC | | | 379,748 | |
318,721 | | | | PayPal Holdings Inc.* | | | 25,309,635 | |
5,483 | | | | Quanta Services Inc.* | | | 188,834 | |
4,365 | | | | Robert Half International Inc. | | | 249,111 | |
8,858 | | | | S&P Global Inc. | | | 1,698,964 | |
5,823 | | | | Total System Services Inc. | | | 512,133 | |
62,038 | | | | TransUnion* | | | 3,540,509 | |
2,938 | | | | United Rentals Inc.* | | | 514,414 | |
5,396 | | | | Verisk Analytics Inc., Class A Shares* | | | 551,417 | |
16,073 | | | | Western Union Co. | | | 318,567 | |
60,500 | | | | Worldpay Inc., Class A Shares* | | | 4,917,440 | |
| | | | | | | | |
| | | | Total Commercial Services | | | 58,293,390 | |
| | | | | | | | |
Cosmetics/Personal Care - 0.8% | | | | |
30,536 | | | | Colgate-Palmolive Co. | | | 2,106,068 | |
16,139 | | | | Coty Inc., Class A Shares | | | 311,806 | |
7,787 | | | | Estee Lauder Cos., Inc., Class A Shares | | | 1,078,032 | |
202,524 | | | | Procter & Gamble Co. | | | 15,902,184 | |
81,121 | | | | Unilever NV, Class NY Registered Shares, ADR | | | 4,242,628 | |
| | | | | | | | |
| | | | Total Cosmetics/Personal Care | | | 23,640,718 | |
| | | | | | | | |
See Notes to Financial Statements.
31
Schedules of Investments
(continued)
Destinations Large Cap Equity Fund
| | | | | | | | |
| Shares/Units | | | | Security | | Value | |
CONSUMER NON-CYCLICAL - 21.6% - (continued) | |
Food - 1.0% | | | | | | |
6,638 | | | | Campbell Soup Co. | | $ | 285,766 | |
14,237 | | | | Conagra Brands Inc. | | | 514,383 | |
19,776 | | | | General Mills Inc. | | | 999,677 | |
4,900 | | | | Hershey Co. | | | 481,474 | |
9,388 | | | | Hormel Foods Corp. | | | 304,735 | |
22,232 | | | | JM Smucker Co. | | | 2,807,902 | |
8,645 | | | | Kellogg Co. | | | 572,299 | |
20,766 | | | | Kraft Heinz Co. | | | 1,392,360 | |
30,943 | | | | Kroger Co. | | | 839,174 | |
4,167 | | | | McCormick & Co., Inc. | | | 444,952 | |
386,651 | | | | Mondelez International Inc., Class A Shares | | | 16,973,979 | |
16,675 | | | | Sysco Corp. | | | 994,664 | |
10,351 | | | | Tyson Foods Inc., Class A Shares | | | 769,907 | |
| | | | | | | | |
| | | | Total Food | | | 27,381,272 | |
| | | | | | | | |
Healthcare-Products - 3.1% | | | | |
264,834 | | | | Abbott Laboratories | | | 15,977,435 | |
2,510 | | | | Align Technology Inc.* | | | 658,925 | |
17,445 | | | | Baxter International Inc. | | | 1,182,597 | |
49,627 | | | | Becton Dickinson & Co. | | | 11,018,187 | |
47,778 | | | | Boston Scientific Corp.* | | | 1,302,428 | |
1,701 | | | | Cooper Cos., Inc. | | | 392,114 | |
43,183 | | | | Danaher Corp. | | | 4,222,434 | |
7,988 | | | | DENTSPLY SIRONA Inc. | | | 447,808 | |
89,827 | | | | Edwards Lifesciences Corp.* | | | 12,007,175 | |
5,453 | | | | Henry Schein Inc.* | | | 360,934 | |
9,593 | | | | Hologic Inc.* | | | 372,496 | |
46,931 | | | | IDEXX Laboratories Inc.* | | | 8,786,891 | |
19,958 | | | | Intuitive Surgical Inc.* | | | 8,511,089 | |
107,733 | | | | Medtronic PLC | | | 8,606,790 | |
2,947 | | | | Patterson Cos., Inc. | | | 93,066 | |
4,937 | | | | ResMed Inc. | | | 470,348 | |
54,493 | | | | Stryker Corp. | | | 8,836,585 | |
13,953 | | | | Thermo Fisher Scientific Inc. | | | 2,910,317 | |
3,184 | | | | Varian Medical Systems Inc.* | | | 379,979 | |
7,038 | | | | Zimmer Biomet Holdings Inc. | | | 818,167 | |
| | | | | | | | |
| | | | Total Healthcare-Products | | | 87,355,765 | |
| | | | | | | | |
Healthcare-Services - 2.3% | | | | |
11,337 | | | | Aetna Inc. | | | 2,007,329 | |
33,028 | | | | Anthem Inc. | | | 7,774,131 | |
25,341 | | | | Centene Corp.* | | | 2,570,084 | |
See Notes to Financial Statements.
32
Schedules of Investments
(continued)
Destinations Large Cap Equity Fund
| | | | | | | | |
| Shares/Units | | | | Security | | Value | |
CONSUMER NON-CYCLICAL - 21.6% - (continued) | |
Healthcare-Services - 2.3% - (continued) | | | | |
39,774 | | | | Cigna Corp. | | $ | 7,791,329 | |
5,262 | | | | DaVita Inc.* | | | 378,969 | |
4,299 | | | | Envision Healthcare Corp.* | | | 165,511 | |
9,842 | | | | HCA Healthcare Inc. | | | 976,819 | |
4,967 | | | | Humana Inc. | | | 1,350,130 | |
5,069 | | | | IQVIA Holdings Inc.* | | | 498,435 | |
3,538 | | | | Laboratory Corp. of America Holdings* | | | 611,012 | |
121,635 | | | | Quest Diagnostics Inc. | | | 12,534,487 | |
124,064 | | | | UnitedHealth Group Inc. | | | 28,058,314 | |
3,048 | | | | Universal Health Services Inc., Class B Shares | | | 348,082 | |
| | | | | | | | |
| | | | Total Healthcare-Services | | | 65,064,632 | |
| | | | | | | | |
Household Products/Wares - 0.1% | | | | |
3,040 | | | | Avery Dennison Corp. | | | 359,176 | |
8,712 | | | | Church & Dwight Co., Inc. | | | 428,543 | |
4,483 | | | | Clorox Co. | | | 578,666 | |
12,230 | | | | Kimberly-Clark Corp. | | | 1,356,551 | |
| | | | | | | | |
| | | | Total Household Products/Wares | | | 2,722,936 | |
| | | | | | | | |
Pharmaceuticals - 6.2% | | | | |
55,438 | | | | AbbVie Inc. | | | 6,421,384 | |
11,564 | | | | Allergan PLC | | | 1,783,400 | |
5,611 | | | | AmerisourceBergen Corp., Class A Shares | | | 533,943 | |
322,302 | | | | Bristol-Myers Squibb Co. | | | 21,336,392 | |
284,834 | | | | Cardinal Health Inc. | | | 19,713,361 | |
192,728 | | | | CVS Health Corp. | | | 13,053,467 | |
33,690 | | | | Eli Lilly & Co. | | | 2,594,804 | |
190,213 | | | | Express Scripts Holding Co.* | | | 14,351,571 | |
230,299 | | | | Johnson & Johnson | | | 29,911,234 | |
7,247 | | | | McKesson Corp. | | | 1,081,470 | |
509,572 | | | | Merck & Co., Inc. | | | 27,628,994 | |
18,646 | | | | Mylan NV* | | | 751,807 | |
150,482 | | | | Novartis AG, ADR | | | 12,542,675 | |
4,551 | | | | Perrigo Co. PLC | | | 370,724 | |
538,963 | | | | Pfizer Inc. | | | 19,569,746 | |
16,941 | | | | Zoetis Inc., Class A Shares | | | 1,369,849 | |
| | | | | | | | |
| | | | Total Pharmaceuticals | | | 173,014,821 | |
| | | | | | | | |
| | | | TOTAL CONSUMER NON-CYCLICAL | | | 603,891,176 | |
| | | | | | | | |
See Notes to Financial Statements.
33
Schedules of Investments
(continued)
Destinations Large Cap Equity Fund
| | | | | | | | |
| Shares/Units | | | | Security | | Value | |
ENERGY - 5.8% | | | | |
Oil & Gas - 4.2% | | | | |
18,991 | | | | Anadarko Petroleum Corp. | | $ | 1,083,247 | |
4,990 | | | | Andeavor | | | 447,204 | |
13,206 | | | | Apache Corp. | | | 450,985 | |
16,070 | | | | Cabot Oil & Gas Corp. | | | 388,251 | |
34,044 | | | | Chesapeake Energy Corp.*(a) | | | 96,004 | |
310,482 | | | | Chevron Corp. | | | 34,749,146 | |
3,294 | | | | Cimarex Energy Co. | | | 316,521 | |
5,153 | | | | Concho Resources Inc.* | | | 777,072 | |
273,345 | | | | ConocoPhillips | | | 14,845,367 | |
18,182 | | | | Devon Energy Corp. | | | 557,642 | |
20,069 | | | | EOG Resources Inc. | | | 2,035,398 | |
8,490 | | | | EQT Corp. | | | 427,132 | |
193,687 | | | | Exxon Mobil Corp. | | | 14,669,853 | |
3,618 | | | | Helmerich & Payne Inc. | | | 233,542 | |
9,359 | | | | Hess Corp. | | | 425,086 | |
777,206 | | | | Marathon Oil Corp. | | | 11,285,031 | |
16,977 | | | | Marathon Petroleum Corp. | | | 1,087,547 | |
7,231 | | | | Newfield Exploration Co.* | | | 168,699 | |
16,882 | | | | Noble Energy Inc. | | | 503,590 | |
197,409 | | | | Occidental Petroleum Corp. | | | 12,950,030 | |
14,934 | | | | Phillips 66 | | | 1,349,586 | |
49,166 | | | | Pioneer Natural Resources Co. | | | 8,369,528 | |
8,465 | | | | Range Resources Corp. | | | 112,500 | |
122,468 | | | | Royal Dutch Shell PLC, Class A Shares, ADR | | | 7,748,550 | |
15,220 | | | | Valero Energy Corp. | | | 1,376,192 | |
| | | | | | | | |
| | | | Total Oil & Gas | | | 116,453,703 | |
| | | | | | | | |
Oil & Gas Services - 1.6% | | | | |
253,563 | | | | Baker Hughes a GE Co. | | | 6,694,063 | |
374,309 | | | | Halliburton Co. | | | 17,375,424 | |
13,258 | | | | National Oilwell Varco Inc. | | | 465,223 | |
286,581 | | | | Schlumberger Ltd. | | | 18,811,177 | |
15,283 | | | | TechnipFMC PLC | | | 440,456 | |
| | | | | | | | |
| | | | Total Oil & Gas Services | | | 43,786,343 | |
| | | | | | | | |
Pipelines - 0.0% | | | | | | |
66,840 | | | | Kinder Morgan Inc. | | | 1,082,808 | |
13,315 | | | | ONEOK Inc. | | | 750,034 | |
28,740 | | | | Williams Cos., Inc. | | | 797,822 | |
| | | | | | | | |
| | | | Total Pipelines | | | 2,630,664 | |
| | | | | | | | |
| | | | TOTAL ENERGY | | | 162,870,710 | |
| | | | | | | | |
See Notes to Financial Statements.
34
Schedules of Investments
(continued)
Destinations Large Cap Equity Fund
| | | | | | | | |
| Shares/Units | | | | Security | | Value | |
FINANCIAL - 17.4% | | | | |
Banks - 7.0% | | | | | | |
517,104 | | | | Bank of America Corp. | | $ | 16,599,038 | |
247,628 | | | | Bank of New York Mellon Corp. | | | 14,122,225 | |
267,826 | | | | BB&T Corp. | | | 14,556,343 | |
16,843 | | | | Capital One Financial Corp. | | | 1,649,435 | |
334,202 | | | | Citigroup Inc. | | | 25,228,909 | |
17,100 | | | | Citizens Financial Group Inc. | | | 743,679 | |
6,024 | | | | Comerica Inc. | | | 585,653 | |
24,570 | | | | Fifth Third Bancorp | | | 812,038 | |
121,221 | | | | First Republic Bank | | | 11,249,309 | |
46,167 | | | | Goldman Sachs Group Inc. | | | 12,138,689 | |
37,975 | | | | Huntington Bancshares Inc. | | | 596,208 | |
345,125 | | | | JPMorgan Chase & Co. | | | 39,861,938 | |
37,481 | | | | KeyCorp | | | 791,974 | |
5,226 | | | | M&T Bank Corp. | | | 992,104 | |
149,878 | | | | Morgan Stanley | | | 8,396,166 | |
7,466 | | | | Northern Trust Corp. | | | 790,425 | |
16,525 | | | | PNC Financial Services Group Inc. | | | 2,605,332 | |
40,503 | | | | Regions Financial Corp. | | | 786,163 | |
24,824 | | | | Signature Bank* | | | 3,629,020 | |
166,373 | | | | State Street Corp. | | | 17,660,494 | |
16,536 | | | | SunTrust Banks Inc. | | | 1,154,874 | |
54,796 | | | | US Bancorp | | | 2,978,711 | |
154,089 | | | | Wells Fargo & Co. | | | 9,000,338 | |
176,293 | | | | Zions Bancorporation | | | 9,690,826 | |
| | | | | | | | |
| | | | Total Banks | | | 196,619,891 | |
| | | | | | | | |
Diversified Financial Services - 4.4% | | | | |
1,932 | | | | Affiliated Managers Group Inc. | | | 365,843 | |
1,670 | | | | Alliance Data Systems Corp. | | | 402,403 | |
25,031 | | | | American Express Co. | | | 2,440,773 | |
5,145 | | | | Ameriprise Financial Inc. | | | 804,884 | |
4,292 | | | | BlackRock Inc., Class A Shares | | | 2,358,153 | |
3,941 | | | | Cboe Global Markets Inc. | | | 441,431 | |
248,861 | | | | Charles Schwab Corp. | | | 13,194,610 | |
11,835 | | | | CME Group Inc., Class A Shares | | | 1,966,504 | |
12,628 | | | | Discover Financial Services | | | 995,465 | |
9,418 | | | | E*TRADE Financial Corp.* | | | 491,902 | |
11,360 | | | | Franklin Resources Inc. | | | 439,291 | |
355,479 | | | | Intercontinental Exchange Inc. | | | 25,978,405 | |
179,140 | | | | Invesco Ltd. | | | 5,829,216 | |
91,401 | | | | Mastercard Inc., Class A Shares | | | 16,064,640 | |
4,165 | | | | Nasdaq Inc. | | | 336,324 | |
See Notes to Financial Statements.
35
Schedules of Investments
(continued)
Destinations Large Cap Equity Fund
| | | | | | | | |
| Shares/Units | | | | Security | | Value | |
FINANCIAL - 17.4% - (continued) | |
Diversified Financial Services - 4.4% - (continued) | |
9,503 | | | | Navient Corp. | | $ | 123,159 | |
4,459 | | | | Raymond James Financial Inc. | | | 413,394 | |
291,161 | | | | Synchrony Financial | | | 10,595,349 | |
8,422 | | | | T Rowe Price Group Inc. | | | 942,422 | |
105,500 | | | | TD Ameritrade Holding Corp. | | | 6,066,250 | |
279,667 | | | | Visa Inc., Class A Shares | | | 34,382,261 | |
| | | | | | | | |
| | | | Total Diversified Financial Services | | | 124,632,679 | |
| | | | | | | | |
Equity Real Estate Investment Trusts (REITs) - 1.7% | | | | |
3,520 | | | | Alexandria Real Estate Equities Inc. | | | 427,011 | |
30,508 | | | | American Tower Corp. | | | 4,250,680 | |
5,735 | | | | Apartment Investment & Management Co., Class A Shares | | | 221,715 | |
4,799 | | | | AvalonBay Communities Inc. | | | 748,740 | |
5,356 | | | | Boston Properties Inc. | | | 636,668 | |
85,198 | | | | Crown Castle International Corp. | | | 9,376,892 | |
7,141 | | | | Digital Realty Trust Inc. | | | 718,670 | |
12,296 | | | | Duke Realty Corp. | | | 304,572 | |
2,719 | | | | Equinix Inc. | | | 1,066,120 | |
212,104 | | | | Equity Residential | | | 11,926,608 | |
2,294 | | | | Essex Property Trust Inc. | | | 513,466 | |
4,376 | | | | Extra Space Storage Inc. | | | 372,179 | |
2,520 | | | | Federal Realty Investment Trust | | | 287,129 | |
21,734 | | | | GGP Inc. | | | 460,109 | |
16,251 | | | | HCP Inc. | | | 351,672 | |
25,824 | | | | Host Hotels & Resorts Inc. | | | 479,293 | |
9,912 | | | | Iron Mountain Inc. | | | 311,831 | |
14,795 | | | | Kimco Realty Corp. | | | 221,333 | |
3,776 | | | | Macerich Co. | | | 222,557 | |
3,920 | | | | Mid-America Apartment Communities Inc. | | | 336,415 | |
18,515 | | | | Prologis Inc. | | | 1,123,490 | |
5,200 | | | | Public Storage | | | 1,011,088 | |
9,802 | | | | Realty Income Corp. | | | 482,062 | |
5,124 | | | | Regency Centers Corp. | | | 297,756 | |
4,086 | | | | SBA Communications Corp., Class A Shares* | | | 642,605 | |
47,824 | | | | Simon Property Group Inc. | | | 7,341,462 | |
3,415 | | | | SL Green Realty Corp. | | | 330,982 | |
9,223 | | | | UDR Inc. | | | 310,077 | |
12,381 | | | | Ventas Inc. | | | 598,250 | |
5,989 | | | | Vornado Realty Trust | | | 398,089 | |
12,874 | | | | Welltower Inc. | | | 675,885 | |
26,279 | | | | Weyerhaeuser Co. | | | 920,553 | |
| | | | | | | | |
| | | | Total Equity Real Estate Investment Trusts (REITs) | | | 47,365,959 | |
| | | | | | | | |
See Notes to Financial Statements.
36
Schedules of Investments
(continued)
Destinations Large Cap Equity Fund
| | | | | | | | |
| Shares/Units | | | | Security | | Value | |
FINANCIAL - 17.4% - (continued) | |
Insurance - 3.5% | | | | |
13,686 | | | | Aflac Inc. | | $ | 1,216,412 | |
135,143 | | | | Allstate Corp. | | | 12,468,293 | |
96,675 | | | | American International Group Inc. | | | 5,543,345 | |
8,688 | | | | Aon PLC | | | 1,219,100 | |
6,278 | | | | Arthur J Gallagher & Co. | | | 433,872 | |
1,746 | | | | Assurant Inc. | | | 149,231 | |
166,576 | | | | Berkshire Hathaway Inc., Class B Shares* | | | 34,514,547 | |
3,296 | | | | Brighthouse Financial Inc.* | | | 178,874 | |
45,246 | | | | Chubb Ltd. | | | 6,421,312 | |
5,198 | | | | Cincinnati Financial Corp. | | | 387,719 | |
1,429 | | | | Everest Re Group Ltd. | | | 343,303 | |
12,427 | | | | Hartford Financial Services Group Inc. | | | 656,767 | |
7,622 | | | | Lincoln National Corp. | | | 580,568 | |
9,618 | | | | Loews Corp. | | | 474,456 | |
164,545 | | | | Marsh & McLennan Cos., Inc. | | | 13,660,526 | |
272,313 | | | | MetLife Inc. | | | 12,578,137 | |
9,372 | | | | Principal Financial Group Inc. | | | 584,157 | |
20,236 | | | | Progressive Corp. | | | 1,165,189 | |
14,759 | | | | Prudential Financial Inc. | | | 1,569,177 | |
3,685 | | | | Torchmark Corp. | | | 314,588 | |
9,517 | | | | Travelers Cos., Inc. | | | 1,322,863 | |
7,841 | | | | Unum Group | | | 399,577 | |
4,591 | | | | Willis Towers Watson PLC | | | 724,919 | |
8,933 | | | | XL Group Ltd. | | | 377,955 | |
| | | | | | | | |
| | | | Total Insurance | | | 97,284,887 | |
| | | | | | | | |
Investment Companies - 0.0% | | | | |
10,924 | | | | Leucadia National Corp. | | | 262,067 | |
| | | | | | | | |
Private Equity - 0.2% | | | | |
105,187 | | | | Brookfield Asset Management Inc., Class A Shares(a) | | | 4,072,841 | |
| | | | | | | | |
Real Estate - 0.4% | | | | |
10,503 | | | | CBRE Group Inc., Class A Shares* | | | 491,015 | |
65,030 | | | | Jones Lang LaSalle Inc. | | | 10,444,469 | |
| | | | | | | | |
| | | | Total Real Estate | | | 10,935,484 | |
| | | | | | | | |
Savings & Loans - 0.2% | | | | |
458,138 | | | | New York Community Bancorp Inc. | | | 6,239,840 | |
13,016 | | | | People’s United Financial Inc. | | | 249,126 | |
| | | | | | | | |
| | | | Total Savings & Loans | | | 6,488,966 | |
| | | | | | | | |
| | | | TOTAL FINANCIAL | | | 487,662,774 | |
| | | | | | | | |
See Notes to Financial Statements.
37
Schedules of Investments
(continued)
Destinations Large Cap Equity Fund
| | | | | | | | |
| Shares/Units | | | | Security | | Value | |
INDUSTRIAL - 9.6% | | | | |
Aerospace/Defense - 2.9% | | | | |
14,734 | | | | Arconic Inc. | | $ | 359,362 | |
67,176 | | | | Boeing Co. | | | 24,331,819 | |
9,656 | | | | General Dynamics Corp. | | | 2,147,977 | |
4,149 | | | | Harris Corp. | | | 647,866 | |
2,714 | | | | L3 Technologies Inc. | | | 563,291 | |
8,671 | | | | Lockheed Martin Corp. | | | 3,056,007 | |
62,883 | | | | Northrop Grumman Corp. | | | 22,011,566 | |
71,855 | | | | Raytheon Co. | | | 15,629,181 | |
5,660 | | | | Rockwell Collins Inc. | | | 779,495 | |
1,680 | | | | TransDigm Group Inc. | | | 484,361 | |
76,229 | | | | United Technologies Corp. | | | 10,271,096 | |
| | | | | | | | |
| | | | Total Aerospace/Defense | | | 80,282,021 | |
| | | | | | | | |
Building Materials - 0.6% | | | | |
37,181 | | | | Fortune Brands Home & Security Inc. | | | 2,255,399 | |
351,568 | | | | Johnson Controls International PLC | | | 12,962,312 | |
2,186 | | | | Martin Marietta Materials Inc. | | | 445,791 | |
10,972 | | | | Masco Corp. | | | 451,169 | |
4,601 | | | | Vulcan Materials Co. | | | 541,676 | |
| | | | | | | | |
| | | | Total Building Materials | | | 16,656,347 | |
| | | | | | | | |
Electrical Components & Equipment - 0.2% | | | | |
25,027 | | | | Acuity Brands Inc. | | | 3,568,350 | |
8,048 | | | | AMETEK Inc. | | | 609,555 | |
22,332 | | | | Emerson Electric Co. | | | 1,586,912 | |
| | | | | | | | |
| | | | Total Electrical Components & Equipment | | | 5,764,817 | |
| | | | | | | | |
Electronics - 1.6% | | | | |
11,226 | | | | Agilent Technologies Inc. | | | 769,991 | |
3,163 | | | | Allegion PLC | | | 266,040 | |
10,602 | | | | Amphenol Corp., Class A Shares | | | 968,917 | |
90,804 | | | | Avnet Inc. | | | 3,877,331 | |
409,994 | | | | Corning Inc. | | | 11,922,626 | |
4,946 | | | | FLIR Systems Inc. | | | 242,849 | |
61,514 | | | | Fortive Corp. | | | 4,724,275 | |
3,888 | | | | Garmin Ltd. | | | 230,325 | |
51,904 | | | | Honeywell International Inc. | | | 7,843,213 | |
304,724 | | | | Koninklijke Philips NV, Class NY Registered Shares, ADR | | | 11,597,795 | |
890 | | | | Mettler-Toledo International Inc.* | | | 548,436 | |
3,723 | | | | PerkinElmer Inc. | | | 284,214 | |
12,218 | | | | TE Connectivity Ltd. | | | 1,259,553 | |
2,771 | | | | Waters Corp.* | | | 567,057 | |
| | | | | | | | |
| | | | Total Electronics | | | 45,102,622 | |
| | | | | | | | |
See Notes to Financial Statements.
38
Schedules of Investments
(continued)
Destinations Large Cap Equity Fund
| | | | | | | | |
| Shares/Units | | | | Security | | Value | |
INDUSTRIAL - 9.6% - (continued) | |
Engineering & Construction - 0.0% | | | | |
4,669 | | | | Fluor Corp. | | $ | 265,666 | |
4,110 | | | | Jacobs Engineering Group Inc. | | | 250,957 | |
| | | | | | | | |
| | | | Total Engineering & Construction | | | 516,623 | |
| | | | | | | | |
Environmental Control - 0.6% | | | | |
7,897 | | | | Republic Services Inc., Class A Shares | | | 530,521 | |
59,098 | | | | Stericycle Inc.* | | | 3,703,672 | |
155,191 | | | | Waste Management Inc. | | | 13,396,087 | |
| | | | | | | | |
| | | | Total Environmental Control | | | 17,630,280 | |
| | | | | | | | |
Hand/Machine Tools - 0.0% | | | | |
1,987 | | | | Snap-on Inc. | | | 316,370 | |
5,344 | | | | Stanley Black & Decker Inc. | | | 850,711 | |
| | | | | | | | |
| | | | Total Hand/Machine Tools | | | 1,167,081 | |
| | | | | | | | |
Machinery-Construction & Mining - 0.1% | | | | |
20,693 | | | | Caterpillar Inc. | | | 3,199,759 | |
| | | | | | | | |
Machinery-Diversified - 0.8% | | | | |
179,261 | | | | Cognex Corp. | | | 9,628,108 | |
5,430 | | | | Cummins Inc. | | | 913,163 | |
11,125 | | | | Deere & Co. | | | 1,789,679 | |
4,321 | | | | Flowserve Corp. | | | 182,994 | |
4,472 | | | | Rockwell Automation Inc. | | | 808,538 | |
19,891 | | | | Roper Technologies Inc. | | | 5,471,815 | |
24,427 | | | | Wabtec Corp. | | | 1,986,892 | |
6,268 | | | | Xylem Inc. | | | 467,468 | |
| | | | | | | | |
| | | | Total Machinery-Diversified | | | 21,248,657 | |
| | | | | | | | |
Miscellaneous Manufacturers - 1.8% | | | | |
20,757 | | | | 3M Co. | | | 4,888,481 | |
5,109 | | | | AO Smith Corp. | | | 327,947 | |
5,426 | | | | Dover Corp. | | | 543,143 | |
15,330 | | | | Eaton Corp. PLC | | | 1,237,131 | |
1,120,876 | | | | General Electric Co. | | | 15,815,560 | |
25,634 | | | | Illinois Tool Works Inc. | | | 4,138,353 | |
8,703 | | | | Ingersoll-Rand PLC | | | 772,826 | |
4,638 | | | | Parker-Hannifin Corp. | | | 827,744 | |
125,511 | | | | Pentair PLC | | | 8,621,351 | |
233,044 | | | | Textron Inc. | | | 13,947,683 | |
| | | | | | | | |
| | | | Total Miscellaneous Manufacturers | | | 51,120,219 | |
| | | | | | | | |
See Notes to Financial Statements.
39
Schedules of Investments
(continued)
Destinations Large Cap Equity Fund
| | | | | | | | |
| Shares/Units | | | | Security | | Value | |
INDUSTRIAL - 9.6% - (continued) | |
Packaging & Containers - 0.1% | | | | |
12,191 | | | | Ball Corp. | | $ | 487,030 | |
3,285 | | | | Packaging Corp. of America | | | 391,572 | |
6,289 | | | | Sealed Air Corp. | | | 266,465 | |
8,856 | | | | WestRock Co. | | | 582,370 | |
| | | | | | | | |
| | | | Total Packaging & Containers | | | 1,727,437 | |
| | | | | | | | |
Shipbuilding - 0.0% | | | | |
1,578 | | | | Huntington Ingalls Industries Inc. | | | 413,452 | |
| | | | | | | | |
Transportation - 0.9% | | | | |
4,850 | | | | CH Robinson Worldwide Inc. | | | 452,796 | |
31,085 | | | | CSX Corp. | | | 1,669,886 | |
6,187 | | | | Expeditors International of Washington Inc. | | | 401,908 | |
38,674 | | | | FedEx Corp. | | | 9,529,660 | |
2,949 | | | | JB Hunt Transport Services Inc. | | | 349,663 | |
3,603 | | | | Kansas City Southern | | | 371,253 | |
9,960 | | | | Norfolk Southern Corp. | | | 1,385,237 | |
63,794 | | | | Union Pacific Corp. | | | 8,309,169 | |
23,890 | | | | United Parcel Service Inc., Class B Shares | | | 2,494,355 | |
| | | | | | | | |
| | | | Total Transportation | | | 24,963,927 | |
| | | | | | | | |
| | | | TOTAL INDUSTRIAL | | | 269,793,242 | |
| | | | | | | | |
TECHNOLOGY - 16.1% | | | | |
Computers - 2.8% | | | | |
21,493 | | | | Accenture PLC, Class A Shares | | | 3,460,588 | |
295,151 | | | | Apple Inc. | | | 52,572,296 | |
20,502 | | | | Cognizant Technology Solutions Corp., Class A Shares | | | 1,681,574 | |
5,362 | | | | CSRA Inc. | | | 217,322 | |
9,922 | | | | DXC Technology Co. | | | 1,017,402 | |
55,491 | | | | Hewlett Packard Enterprise Co. | | | 1,031,578 | |
58,162 | | | | HP Inc. | | | 1,360,409 | |
58,038 | | | | International Business Machines Corp. | | | 9,044,061 | |
9,382 | | | | NetApp Inc. | | | 568,080 | |
132,487 | | | | Seagate Technology PLC | | | 7,074,806 | |
10,282 | | | | Western Digital Corp. | | | 894,945 | |
| | | | | | | | |
| | | | Total Computers | | | 78,923,061 | |
| | | | | | | | |
Office/Business Equipment - 0.0% | | | | |
7,288 | | | | Xerox Corp. | | | 220,972 | |
| | | | | | | | |
Semiconductors - 4.7% | | | | |
29,119 | | | | Advanced Micro Devices Inc.*(a) | | | 352,631 | |
12,808 | | | | Analog Devices Inc. | | | 1,154,641 | |
257,213 | | | | Applied Materials Inc. | | | 14,812,897 | |
See Notes to Financial Statements.
40
Schedules of Investments
(continued)
Destinations Large Cap Equity Fund
| | | | | | | | |
| Shares/Units | | | | Security | | Value | |
TECHNOLOGY - 16.1% - (continued) | |
Semiconductors - 4.7% - (continued) | |
12,800 | | | | ASML Holding NV, Class NY Registered Shares, ADR | | $ | 2,500,992 | |
33,437 | | | | Broadcom Ltd. | | | 8,240,883 | |
876,386 | | | | Cypress Semiconductor Corp. | | | 15,310,464 | |
666,580 | | | | Intel Corp. | | | 32,855,728 | |
5,442 | | | | KLA-Tencor Corp. | | | 616,633 | |
5,628 | | | | Lam Research Corp. | | | 1,079,788 | |
203,612 | | | | Maxim Integrated Products Inc. | | | 12,408,115 | |
8,122 | | | | Microchip Technology Inc. | | | 722,289 | |
40,100 | | | | Micron Technology Inc.* | | | 1,957,281 | |
87,039 | | | | NVIDIA Corp. | | | 21,063,438 | |
4,425 | | | | Qorvo Inc.* | | | 357,142 | |
95,563 | | | | QUALCOMM Inc. | | | 6,211,595 | |
6,382 | | | | Skyworks Solutions Inc. | | | 697,234 | |
82,900 | | | | Texas Instruments Inc. | | | 8,982,215 | |
41,392 | | | | Xilinx Inc. | | | 2,949,180 | |
| | | | | | | | |
| | | | Total Semiconductors | | | 132,273,146 | |
| | | | | | | | |
Software - 8.6% | | | | |
225,080 | | | | Activision Blizzard Inc. | | | 16,460,100 | |
79,239 | | | | Adobe Systems Inc.* | | | 16,571,252 | |
5,883 | | | | Akamai Technologies Inc.* | | | 396,867 | |
2,952 | | | | ANSYS Inc.* | | | 472,143 | |
7,622 | | | | Autodesk Inc.* | | | 895,356 | |
361,848 | | | | CA Inc. | | | 12,700,865 | |
9,835 | | | | Cadence Design Systems Inc.* | | | 381,303 | |
10,982 | | | | Cerner Corp.* | | | 704,605 | |
4,975 | | | | Citrix Systems Inc.* | | | 457,700 | |
57,107 | | | | Electronic Arts Inc.* | | | 7,064,136 | |
41,822 | | | | Fidelity National Information Services Inc. | | | 4,064,262 | |
34,354 | | | | Fiserv Inc.* | | | 4,926,020 | |
49,609 | | | | Intuit Inc. | | | 8,277,758 | |
750,965 | | | | Microsoft Corp. | | | 70,417,988 | |
486,923 | | | | Oracle Corp. | | | 24,672,388 | |
11,127 | | | | Paychex Inc. | | | 724,702 | |
24,931 | | | | Red Hat Inc.* | | | 3,674,830 | |
246,312 | | | | salesforce.com Inc.* | | | 28,633,770 | |
107,732 | | | | ServiceNow Inc.* | | | 17,345,929 | |
121,554 | | | | Splunk Inc.* | | | 11,328,833 | |
5,227 | | | | Synopsys Inc.* | | | 442,570 | |
37,769 | | | | VMware Inc., Class A Shares* | | | 4,976,066 | |
33,280 | | | | Workday Inc., Class A Shares* | | | 4,215,578 | |
| | | | | | | | |
| | | | Total Software | | | 239,805,021 | |
| | | | | | | | |
| | | | TOTAL TECHNOLOGY | | | 451,222,200 | |
| | | | | | | | |
See Notes to Financial Statements.
41
Schedules of Investments
(continued)
Destinations Large Cap Equity Fund
| | | | | | | | |
| Shares/Units | | | | Security | | Value | |
UTILITIES - 1.7% | | | | |
Electric - 1.4% | | | | |
895,349 | | | | AES Corp. | | $ | 9,732,444 | |
7,953 | | | | Alliant Energy Corp. | | | 307,383 | |
8,462 | | | | Ameren Corp. | | | 459,487 | |
17,083 | | | | American Electric Power Co., Inc. | | | 1,120,303 | |
15,017 | | | | CenterPoint Energy Inc. | | | 406,210 | |
9,805 | | | | CMS Energy Corp. | | | 416,222 | |
10,767 | | | | Consolidated Edison Inc. | | | 806,341 | |
22,365 | | | | Dominion Energy Inc. | | | 1,656,575 | |
6,203 | | | | DTE Energy Co. | | | 625,138 | |
24,292 | | | | Duke Energy Corp. | | | 1,830,159 | |
144,376 | | | | Edison International | | | 8,747,742 | |
6,240 | | | | Entergy Corp. | | | 473,117 | |
11,021 | | | | Eversource Energy | | | 628,197 | |
33,406 | | | | Exelon Corp. | | | 1,237,358 | |
15,455 | | | | FirstEnergy Corp. | | | 499,660 | |
31,957 | | | | NextEra Energy Inc. | | | 4,862,258 | |
10,461 | | | | NRG Energy Inc. | | | 270,522 | |
17,831 | | | | PG&E Corp. | | | 732,676 | |
3,879 | | | | Pinnacle West Capital Corp. | | | 298,528 | |
23,793 | | | | PPL Corp. | | | 681,669 | |
17,613 | | | | Public Service Enterprise Group Inc. | | | 852,998 | |
4,811 | | | | SCANA Corp. | | | 190,852 | |
34,915 | | | | Southern Co. | | | 1,503,440 | |
10,986 | | | | WEC Energy Group Inc. | | | 658,281 | |
17,718 | | | | Xcel Energy Inc. | | | 766,835 | |
| | | | | | | | |
| | | | Total Electric | | | 39,764,395 | |
| | | | | | | | |
Gas - 0.2% | | | | |
12,068 | | | | NiSource Inc. | | | 279,133 | |
45,720 | | | | Sempra Energy | | | 4,982,565 | |
| | | | | | | | |
| | | | Total Gas | | | 5,261,698 | |
| | | | | | | | |
Water - 0.1% | | | | | | |
34,402 | | | | American Water Works Co., Inc. | | | 2,730,143 | |
| | | | | | | | |
| | | | TOTAL UTILITIES | | | 47,756,236 | |
| | | | | | | | |
| | | | TOTAL COMMON STOCKS (Cost - $2,358,970,879) | | | 2,732,079,764 | |
| | | | | | | | |
See Notes to Financial Statements.
42
Schedules of Investments
(continued)
Destinations Large Cap Equity Fund
| | | | | | | | |
| Shares/Units | | | | Security | | Value | |
PREFERRED STOCK - 0.0% | | | | |
TECHNOLOGY - 0.0% | | | | |
Software - 0.0% | | | | |
15,057 | | | | Magic Leap Inc., Series D, Private Placement(Restricted)*(b)(c)
(Cost - $406,539) | | $ | 406,539 | |
| | | | | | | | |
| | | | TOTAL INVESTMENTS BEFORE SHORT-TERM INVESTMENTS (Cost - $2,360,232,892) | | | 2,733,485,855 | |
| | | | | | | | |
| | | |
Face Amount† | | | | | | | |
SHORT-TERM INVESTMENTS - 2.6% | | | | |
TIME DEPOSITS - 2.6% | | | | |
$ 4,175,631 | | | | Banco Santander SA - Frankfurt, 0.780% due 3/1/18 | | | 4,175,631 | |
21,298,153 | | | | BNP Paribas - Paris, 0.780% due 3/1/18 | | | 21,298,153 | |
1,219 | | CAD | | Brown Brothers Harriman - Grand Cayman, 0.550% due 3/1/18 | | | 951 | |
16,648 | | GBP | | Citibank - London, 0.230% due 3/1/18 | | | 22,924 | |
18,970,642 | | | | JPMorgan Chase & Co. - New York, 0.780% due 3/1/18 | | | 18,970,642 | |
22,240,879 | | | | Standard Chartered Bank - London, 0.780% due 3/1/18 | | | 22,240,879 | |
6,532,921 | | | | Wells Fargo - Grand Cayman, 0.780% due 3/1/18 | | | 6,532,921 | |
| | | | | | | | |
| | | | TOTAL TIME DEPOSITS (Cost - $73,242,101) | | | 73,242,101 | |
| | | | | | | | |
INVESTMENTS PURCHASED WITH CASH PROCEEDS FROM SECURITIES LENDING - 0.6% | | | | |
MONEY MARKET FUND - 0.6% | | | | |
16,521,899 | | | | Federated Government Obligations Fund, Premier Class(d) (Cost - $16,521,899) | | | 16,521,899 | |
| | | | | | | | |
| | | | TOTAL INVESTMENTS - 100.7% (Cost - $2,449,996,892#) | | | 2,823,249,855 | |
| | | | | | | | |
| | | | Liabilities in Excess of Other Assets - (0.7)% | | | (19,519,696 | ) |
| | | | | | | | |
| | | | TOTAL NET ASSETS - 100.0% | | $ | 2,803,730,159 | |
| | | | | | | | |
| † | Face amount denominated in U.S. dollars, unless otherwise noted. |
| * | Non-income producing security. |
| (a) | All or a portion of this security is on loan (See Note 5). |
| (b) | Security is valued in good faith at fair value by or under the direction of the Board of Trustees. |
| (d) | Represents investment of collateral received from securities lending transactions. |
| # | Aggregate cost for federal income tax purposes is $2,452,562,586. |
See Notes to Financial Statements.
43
Schedules of Investments
(continued)
Destinations Large Cap Equity Fund
Abbreviations used in this schedule:
| | | | |
| ADR | | — | | American Depositary Receipts |
| PLC | | — | | Public Limited Company |
| | | | | | |
Summary of Investments by Security Sector^ (unaudited) | | | |
Consumer Non-cyclical | | | 21.4 | % | |
Financial | | | 17.3 | | |
Communications | | | 16.5 | | |
Technology | | | 16.0 | | |
Industrial | | | 9.5 | | |
Consumer Cyclical | | | 6.9 | | |
Energy | | | 5.8 | | |
Basic Materials | | | 1.7 | | |
Utilities | | | 1.7 | | |
Short-Term Investments | | | 2.6 | | |
Money Market Fund | | | 0.6 | | |
| | | | | |
| | | 100.0 | % | |
| | | | | |
| ^ | As a percentage of total investments. |
At February 28, 2018, Destinations Large Cap Equity Fund had open exchange traded futures contracts as described below.
The unrealized appreciation on the open contracts reflected in the accompanying financial statements was as follows:
| | | | | | | | | | | | | | | | | | | | |
Open Futures Contracts | | Number of
Contracts | | | Expiration
Date
(Month/Year) | | | Notional
Amounts | | | Market Value | | | Unrealized
Appreciation | |
Contracts to Buy: | | | | | | | | | | | | | | | | | | | | |
S&P 500 E-mini Index March Futures | | | 78 | | | | 3/18 | | | $ | 10,448,871 | | | $ | 10,586,550 | | | $ | 137,679 | |
At February 28, 2018, Destinations Large Cap Equity Fund had deposited cash of $446,600 with a broker or brokers as margin collateral on open exchange traded futures contracts.
Currency Abbreviations used in this schedule:
| | | | |
| CAD | | — | | Canadian Dollar |
| GBP | | — | | British Pound |
See Notes to Financial Statements.
44
Schedules of Investments
(continued)
Destinations Small-Mid Cap Equity Fund
| | | | | | | | |
| Shares/Units | | | | Security | | Value | |
COMMON STOCKS - 75.5% | |
BASIC MATERIALS - 2.4% | |
Chemicals - 2.1% | | | | |
16,021 | | | | AdvanSix Inc.* | | $ | 662,468 | |
19,000 | | | | Air Products & Chemicals Inc. | | | 3,055,010 | |
39,012 | | | | Ferro Corp.* | | | 834,467 | |
22,917 | | | | HB Fuller Co. | | | 1,154,788 | |
13,573 | | | | Ingevity Corp.* | | | 1,016,753 | |
21,856 | | | | KMG Chemicals Inc. | | | 1,310,704 | |
26,902 | | | | Olin Corp. | | | 874,315 | |
18,600 | | | | PPG Industries Inc. | | | 2,091,384 | |
77,247 | | | | Valvoline Inc. | | | 1,769,729 | |
23,889 | | | | WR Grace & Co. | | | 1,580,974 | |
| | | | | | | | |
| | | | Total Chemicals | | | 14,350,592 | |
| | | | | | | | |
Iron/Steel - 0.3% | | | | |
60,950 | | | | Allegheny Technologies Inc.* | | | 1,579,215 | |
24,660 | | | | Schnitzer Steel Industries Inc., Class A Shares | | | 838,440 | |
| | | | | | | | |
| | | | Total Iron/Steel | | | 2,417,655 | |
| | | | | | | | |
| | | | TOTAL BASIC MATERIALS | | | 16,768,247 | |
| | | | | | | | |
COMMUNICATIONS - 4.2% | | | | |
Advertising - 0.7% | | | | |
194,289 | | | | Interpublic Group of Cos., Inc. | | | 4,546,363 | |
| | | | | | | | |
Internet - 1.3% | | | | |
83,138 | | | | Boingo Wireless Inc.* | | | 2,200,663 | |
86,240 | | | | Chegg Inc.* | | | 1,717,038 | |
19,482 | | | | Cogent Communications Holdings Inc. | | | 834,804 | |
66,227 | | | | Mimecast Ltd.* | | | 2,300,726 | |
19,279 | | | | Q2 Holdings Inc.* | | | 878,158 | |
108,689 | | | | QuinStreet Inc.* | | | 1,427,087 | |
| | | | | | | | |
| | | | Total Internet | | | 9,358,476 | |
| | | | | | | | |
Media - 0.3% | | | | |
29,809 | | | | Nexstar Media Group Inc., Class A Shares | | | 2,129,853 | |
| | | | | | | | |
Telecommunications - 1.9% | | | | |
26,283 | | | | CalAmp Corp.* | | | 615,022 | |
139,016 | | | | Fusion Telecommunications International Inc.* | | | 404,537 | |
53,879 | | | | GTT Communications Inc.* | | | 2,780,156 | |
56,200 | | | | Motorola Solutions Inc. | | | 5,965,630 | |
40,409 | | | | RADCOM Ltd.*(a) | | | 796,058 | |
13,798 | | | | Silicom Ltd. | | | 874,793 | |
167,912 | | | | Viavi Solutions Inc.* | | | 1,615,313 | |
| | | | | | | | |
| | | | Total Telecommunications | | | 13,051,509 | |
| | | | | | | | |
| | | | TOTAL COMMUNICATIONS | | | 29,086,201 | |
| | | | | | | | |
See Notes to Financial Statements.
45
Schedules of Investments
(continued)
Destinations Small-Mid Cap Equity Fund
| | | | | | | | |
| Shares/Units | | | | Security | | Value | |
CONSUMER CYCLICAL - 6.5% | | | | |
Airlines - 0.6% | | | | |
59,900 | | | | Alaska Air Group Inc. | | $ | 3,863,550 | |
| | | | | | | | |
Apparel - 0.5% | | | | |
124,385 | | | | Crocs Inc.* | | | 1,522,472 | |
13,670 | | | | Oxford Industries Inc. | | | 1,092,506 | |
27,294 | | | | Steven Madden Ltd.* | | | 1,198,207 | |
| | | | | | | | |
| | | | Total Apparel | | | 3,813,185 | |
| | | | | | | | |
Auto Parts & Equipment - 0.6% | |
91,704 | | | | Horizon Global Corp.* | | | 755,641 | |
71,028 | | | | Modine Manufacturing Co.* | | | 1,633,644 | |
48,037 | | | | Spartan Motors Inc. | | | 708,546 | |
17,514 | | | | Tenneco Inc. | | | 920,360 | |
| | | | | | | | |
| | | | Total Auto Parts & Equipment | | | 4,018,191 | |
| | | | | | | | |
Distribution/Wholesale - 0.3% | | | | |
30,004 | | | | G-III Apparel Group Ltd.* | | | 1,107,448 | |
15,945 | | | | H&E Equipment Services Inc. | | | 600,967 | |
10,422 | | | | SiteOne Landscape Supply Inc.* | | | 717,450 | |
| | | | | | | | |
| | | | Total Distribution/Wholesale | | | 2,425,865 | |
| | | | | | | | |
Entertainment - 0.7% | | | | |
48,200 | | | | Cinemark Holdings Inc. | | | 2,051,392 | |
53,888 | | | | Eldorado Resorts Inc.*(a) | | | 1,837,581 | |
37,235 | | | | Golden Entertainment Inc.* | | | 1,038,484 | |
| | | | | | | | |
| | | | Total Entertainment | | | 4,927,457 | |
| | | | | | | | |
Home Builders - 0.3% | | | | |
26,861 | | | | Skyline Corp.* | | | 574,557 | |
29,446 | | | | Winnebago Industries Inc. | | | 1,282,373 | |
| | | | | | | | |
| | | | Total Home Builders | | | 1,856,930 | |
| | | | | | | | |
Home Furnishings - 0.1% | | | | |
11,205 | | | | SodaStream International Ltd.* | | | 906,709 | |
| | | | | | | | |
Leisure Time - 1.4% | | | | |
52,900 | | | | Brunswick Corp. | | | 3,025,880 | |
170,237 | | | | Callaway Golf Co. | | | 2,635,269 | |
65,585 | | | | Malibu Boats Inc., Class A Shares* | | | 2,101,999 | |
61,075 | | | | MCBC Holdings Inc.* | | | 1,496,949 | |
45,506 | | | | Vista Outdoor Inc.* | | | 784,068 | |
| | | | | | | | |
| | | | Total Leisure Time | | | 10,044,165 | |
| | | | | | | | |
See Notes to Financial Statements.
46
Schedules of Investments
(continued)
Destinations Small-Mid Cap Equity Fund
| | | | | | | | |
| Shares/Units | | | | Security | | Value | |
CONSUMER CYCLICAL - 6.5% - (continued) | |
Lodging - 0.3% | | | | |
39,809 | | | | Bluegreen Vacations Corp.(a) | | $ | 769,906 | |
111,892 | | | | Century Casinos Inc.* | | | 891,779 | |
9,858 | | | | Monarch Casino & Resort Inc.* | | | 416,304 | |
| | | | | | | | |
| | | | Total Lodging | | | 2,077,989 | |
| | | | | | | | |
Retail - 1.7% | | | | |
40,224 | | | | Boot Barn Holdings Inc.* | | | 708,747 | |
23,261 | | | | Citi Trends Inc. | | | 515,464 | |
16,772 | | | | Conn’s Inc.*(a) | | | 548,444 | |
48,048 | | | | Del Frisco’s Restaurant Group Inc.* | | | 799,999 | |
25,019 | | | | Express Inc.* | | | 180,637 | |
8,384 | | | | Foundation Building Materials Inc.* | | | 114,777 | |
86,316 | | | | Freshpet Inc.* | | | 1,726,320 | |
28,600 | | | | Genuine Parts Co. | | | 2,626,624 | |
56,503 | | | | Hibbett Sports Inc.* | | | 1,454,952 | |
39,341 | | | | Michaels Cos., Inc.* | | | 905,236 | |
32,783 | | | | Movado Group Inc. | | | 1,016,273 | |
25,872 | | | | Tailored Brands Inc. | | | 605,664 | |
19,916 | | | | World Fuel Services Corp. | | | 455,081 | |
| | | | | | | | |
| | | | Total Retail | | | 11,658,218 | |
| | | | | | | | |
| | | | TOTAL CONSUMER CYCLICAL | | | 45,592,259 | |
| | | | | | | | |
CONSUMER NON-CYCLICAL - 15.9% | | | | |
Beverages - 1.0% | | | | |
43,000 | | | | Dr Pepper Snapple Group Inc. | | | 4,998,750 | |
21,880 | | | | MGP Ingredients Inc. | | | 1,836,170 | |
| | | | | | | | |
| | | | Total Beverages | | | 6,834,920 | |
| | | | | | | | |
Biotechnology - 1.6% | | | | |
104,499 | | | | Adverum Biotechnologies Inc.* | | | 723,656 | |
9,343 | | | | AnaptysBio Inc.* | | | 1,146,947 | |
12,611 | | | | Arena Pharmaceuticals Inc.* | | | 488,928 | |
15,514 | | | | Argenx SE, ADR* | | | 1,188,838 | |
20,039 | | | | Audentes Therapeutics Inc.* | | | 675,114 | |
22,663 | | | | Blueprint Medicines Corp.* | | | 1,961,709 | |
10,249 | | | | Edge Therapeutics Inc.* | | | 154,247 | |
38,877 | | | | GlycoMimetics Inc.* | | | 894,560 | |
28,387 | | | | Loxo Oncology Inc.* | | | 3,157,202 | |
42,169 | | | | Ovid Therapeutics Inc.* | | | 277,894 | |
10,174 | | | | Wave Life Sciences Ltd.*(a) | | | 518,365 | |
| | | | | | | | |
| | | | Total Biotechnology | | | 11,187,460 | |
| | | | | | | | |
See Notes to Financial Statements.
47
Schedules of Investments
(continued)
Destinations Small-Mid Cap Equity Fund
| | | | | | | | |
| Shares/Units | | | | Security | | Value | |
CONSUMER NON-CYCLICAL - 15.9% - (continued) | |
Commercial Services - 1.1% | | | | |
57,642 | | | | Career Education Corp.* | | $ | 762,604 | |
77,455 | | | | Everi Holdings Inc.* | | | 577,040 | |
33,953 | | | | Huron Consulting Group Inc.* | | | 1,188,355 | |
47,625 | | | | Korn/Ferry International | | | 1,995,964 | |
24,150 | | | | Matthews International Corp., Class A Shares | | | 1,237,687 | |
7,459 | | | | Medifast Inc. | | | 475,810 | |
107,940 | | | | Team Inc.*(a) | | | 1,764,819 | |
| | | | | | | | |
| | | | Total Commercial Services | | | 8,002,279 | |
| | | | | | | | |
Food - 2.9% | | | | | | | | |
34,644 | | | | B&G Foods Inc.(a) | | | 959,639 | |
14,430 | | | | Calavo Growers Inc. | | | 1,231,600 | |
46,344 | | | | Chefs’ Warehouse Inc.* | | | 1,045,057 | |
72,647 | | | | Conagra Brands Inc. | | | 2,624,736 | |
82,538 | | | | Darling Ingredients Inc.* | | | 1,501,366 | |
45,175 | | | | Hain Celestial Group Inc.* | | | 1,571,187 | |
138,400 | | | | Hormel Foods Corp. | | | 4,492,464 | |
113,099 | | | | Hostess Brands Inc., Class A Shares* | | | 1,384,332 | |
30,775 | | | | Performance Food Group Co.* | | | 943,254 | |
56,967 | | | | Pinnacle Foods Inc. | | | 3,073,939 | |
24,954 | | | | Smart & Final Stores Inc.* | | | 179,669 | |
29,969 | | | | TreeHouse Foods Inc.* | | | 1,139,421 | |
| | | | | | | | |
| | | | Total Food | | | 20,146,664 | |
| | | | | | | | |
Healthcare-Products - 3.5% | | | | |
90,071 | | | | AxoGen Inc.* | | | 2,630,073 | |
7,150 | | | | Cooper Cos., Inc. | | | 1,648,218 | |
13,577 | | | | Cutera Inc.* | | | 611,644 | |
18,236 | | | | Inogen Inc.* | | | 2,203,273 | |
37,842 | | | | Intersect ENT Inc.* | | | 1,394,478 | |
31,646 | | | | iRhythm Technologies Inc.* | | | 1,966,799 | |
61,523 | | | | OrthoPediatrics Corp.* | | | 1,085,881 | |
42,279 | | | | Patterson Cos., Inc. | | | 1,335,171 | |
48,213 | | | | Sientra Inc.*(a) | | | 460,434 | |
87,680 | | | | Tactile Systems Technology Inc.*(a) | | | 2,837,325 | |
68,600 | | | | Zimmer Biomet Holdings Inc. | | | 7,974,750 | |
| | | | | | | | |
| | | | Total Healthcare-Products. | | | 24,148,046 | |
| | | | | | | | |
Healthcare-Services - 2.1% | | | | |
16,245 | | | | Charles River Laboratories International Inc.* | | | 1,731,879 | |
41,572 | | | | Encompass Health Corp. | | | 2,214,125 | |
55,295 | | | | Envision Healthcare Corp.* | | | 2,128,857 | |
28,000 | | | | Humana Inc. | | | 7,610,960 | |
See Notes to Financial Statements.
48
Schedules of Investments
(continued)
Destinations Small-Mid Cap Equity Fund
| | | | | | | | |
| Shares/Units | | | | Security | | Value | |
CONSUMER NON-CYCLICAL - 15.9% - (continued) | |
Healthcare-Services - 2.1% - (continued) | | | | |
82,359 | | | | Natera Inc.* | | $ | 741,231 | |
22,840 | | | | Teladoc Inc.*(a) | | | 915,884 | |
| | | | | | | | |
| | | | Total Healthcare-Services | | | 15,342,936 | |
| | | | | | | | |
Pharmaceuticals - 3.7% | | | | |
28,524 | | | | Aclaris Therapeutics Inc.* | | | 568,769 | |
36,899 | | | | Adamas Pharmaceuticals Inc.*(a) | | | 902,180 | |
68,500 | | | | AmerisourceBergen Corp., Class A Shares | | | 6,518,460 | |
209,969 | | | | Array BioPharma Inc.* | | | 3,636,663 | |
60,286 | | | | Clementia Pharmaceuticals Inc.* | | | 960,959 | |
85,819 | | | | CTI BioPharma Corp.* | | | 344,992 | |
87,545 | | | | Foamix Pharmaceuticals Ltd.*(a)(b) | | | 520,893 | |
38,061 | | | | Global Blood Therapeutics Inc.* | | | 2,232,278 | |
25,896 | | | | MyoKardia Inc.* | | | 1,507,147 | |
34,929 | | | | Optinose Inc.*(a) | | | 618,593 | |
72,600 | | | | Perrigo Co. PLC | | | 5,913,996 | |
65,593 | | | | Prestige Brands Holdings Inc.* | | | 2,217,043 | |
| | | | | | | | |
| | | | Total Pharmaceuticals | | | 25,941,973 | |
| | | | | | | | |
| | | | TOTAL CONSUMER NON-CYCLICAL | | | 111,604,278 | |
| | | | | | | | |
ENERGY - 6.0% | | | | |
Energy-Alternate Sources - 0.3% | | | | |
35,267 | | | | SolarEdge Technologies Inc.* | | | 1,765,113 | |
| | | | | | | | |
Oil & Gas - 3.8% | | | | |
82,300 | | | | Anadarko Petroleum Corp. | | | 4,694,392 | |
46,500 | | | | Andeavor | | | 4,167,330 | |
169,400 | | | | Cabot Oil & Gas Corp. | | | 4,092,704 | |
92,251 | | | | Callon Petroleum Co.* | | | 975,093 | |
63,375 | | | | Carrizo Oil & Gas Inc.* | | | 890,419 | |
40,766 | | | | Murphy USA Inc.* | | | 3,061,934 | |
176,400 | | | | Noble Energy Inc. | | | 5,262,012 | |
133,000 | | | | Patterson-UTI Energy Inc. | | | 2,403,310 | |
131,510 | | | | SRC Energy Inc.* | | | 1,166,494 | |
| | | | | | | | |
| | | | Total Oil & Gas | | | 26,713,688 | |
| | | | | | | | |
Oil & Gas Services - 1.1% | | | | |
88,800 | | | | Baker Hughes a GE Co. | | | 2,344,320 | |
14,400 | | | | Core Laboratories NV(a) | | | 1,482,624 | |
57,640 | | | | Liberty Oilfield Services Inc., Class A Shares*(a) | | | 1,071,528 | |
22,282 | | | | Mammoth Energy Services Inc.* | | | 583,343 | |
39,421 | | | | Select Energy Services Inc., Class A Shares* | | | 566,085 | |
108,432 | | | | Solaris Oilfield Infrastructure Inc., Class A Shares* | | | 1,824,911 | |
| | | | | | | | |
| | | | Total Oil & Gas Services | | | 7,872,811 | |
| | | | | | | | |
See Notes to Financial Statements.
49
Schedules of Investments
(continued)
Destinations Small-Mid Cap Equity Fund
| | | | | | | | |
| Shares/Units | | | | Security | | Value | |
ENERGY - 6.0% - (continued) | | | | |
Pipelines - 0.8% | | | | |
198,500 | | | | Williams Cos., Inc. | | $ | 5,510,360 | |
| | | | | | | | |
| | | | TOTAL ENERGY | | | 41,861,972 | |
| | | | | | | | |
FINANCIAL - 18.7% | | | | |
Banks - 7.1% | | | | | | | | |
45,325 | | | | Bank of NT Butterfield & Son Ltd. | | | 2,067,273 | |
60,836 | | | | BankUnited Inc. | | | 2,446,824 | |
31,606 | | | | Chemical Financial Corp. | | | 1,744,335 | |
24,215 | | | | Eagle Bancorp Inc.* | | | 1,478,326 | |
105,000 | | | | First Horizon National Corp. | | | 2,000,250 | |
108,900 | | | | First Republic Bank | | | 10,105,920 | |
189,348 | | | | FNB Corp. | | | 2,654,659 | |
29,773 | | | | IBERIABANK Corp. | | | 2,405,658 | |
73,781 | | | | Live Oak Bancshares Inc. | | | 1,925,684 | |
214,986 | | | | MB Financial Inc. | | | 8,816,576 | |
103,800 | | | | Pinnacle Financial Partners Inc. | | | 6,700,290 | |
22,840 | | | | Preferred Bank | | | 1,423,617 | |
71,390 | | | | Sterling Bancorp Inc. | | | 999,460 | |
68,852 | | | | TCF Financial Corp. | | | 1,535,400 | |
27,024 | | | | TriState Capital Holdings Inc.* | | | 603,986 | |
31,326 | | | | Triumph Bancorp Inc.* | | | 1,282,800 | |
60,989 | | | | Univest Corp. of Pennsylvania | | | 1,671,099 | |
| | | | | | | | |
| | | | Total Banks | | | 49,862,157 | |
| | | | | | | | |
Diversified Financial Services - 1.2% | | | | |
19,794 | | | | Affiliated Managers Group Inc. | | | 3,748,192 | |
28,344 | | | | Blackhawk Network Holdings Inc., Class A Shares* | | | 1,268,394 | |
17,407 | | | | Federated Investors Inc., Class B Shares | | | 567,120 | |
84,808 | | | | Synchrony Financial | | | 3,086,163 | |
| | | | | | | | |
| | | | Total Diversified Financial Services | | | 8,669,869 | |
| | | | | | | | |
Equity Real Estate Investment Trusts (REITs) - 5.8% | | | | |
196,600 | | | | American Campus Communities Inc. | | | 7,171,968 | |
318,500 | | | | American Homes 4 Rent, Class A Shares | | | 6,112,015 | |
74,295 | | | | Blackstone Mortgage Trust Inc., Class A Shares | | | 2,306,860 | |
73,874 | | | | Columbia Property Trust Inc. | | | 1,538,795 | |
55,058 | | | | Corporate Office Properties Trust | | | 1,374,248 | |
454,385 | | | | Cousins Properties Inc. | | | 3,789,571 | |
61,300 | | | | CyrusOne Inc. | | | 3,058,870 | |
37,427 | | | | Education Realty Trust Inc. | | | 1,165,477 | |
91,794 | | | | Lexington Realty Trust | | | 730,680 | |
385,727 | | | | Medical Properties Trust Inc. | | | 4,729,013 | |
304,700 | | | | Retail Opportunity Investments Corp. | | | 5,228,652 | |
82,912 | | | | Weyerhaeuser Co. | | | 2,904,407 | |
| | | | | | | | |
| | | | Total Equity Real Estate Investment Trusts (REITs) | | | 40,110,556 | |
| | | | | | | | |
See Notes to Financial Statements.
50
Schedules of Investments
(continued)
Destinations Small-Mid Cap Equity Fund
| | | | | | | | |
| Shares/Units | | | | Security | | Value | |
FINANCIAL - 18.7% - (continued) | | | | |
Insurance - 3.7% | | | | |
19,079 | | | | Hanover Insurance Group Inc. | | $ | 2,058,815 | |
97,465 | | | | Hartford Financial Services Group Inc. | | | 5,151,025 | |
17,149 | | | | Kinsale Capital Group Inc. | | | 840,301 | |
98,775 | | | | National General Holdings Corp. | | | 2,269,849 | |
110,514 | | | | NMI Holdings Inc., Class A Shares* | | | 2,193,703 | |
71,600 | | | | Progressive Corp. | | | 4,122,728 | |
27,070 | | | | Validus Holdings Ltd. | | | 1,831,015 | |
26,283 | | | | Willis Towers Watson PLC | | | 4,150,086 | |
78,400 | | | | XL Group Ltd. | | | 3,317,104 | |
| | | | | | | | |
| | | | Total Insurance | | | 25,934,626 | |
| | | | | | | | |
Private Equity - 0.2% | | | | |
126,999 | | | | Hercules Capital Inc. | | | 1,530,338 | |
| | | | | | | | |
Savings & Loans - 0.7% | | | | |
28,048 | | | | Banc of California Inc.(a) | | | 559,558 | |
15,905 | | | | Meta Financial Group Inc. | | | 1,708,197 | |
120,872 | | | | Sterling Bancorp | | | 2,810,274 | |
| | | | | | | | |
| | | | Total Savings & Loans | | | 5,078,029 | |
| | | | | | | | |
| | | | TOTAL FINANCIAL | | | 131,185,575 | |
| | | | | | | | |
INDUSTRIAL - 10.8% | | | | |
Aerospace/Defense - 0.3% | | | | |
90,924 | | | | Kratos Defense & Security Solutions Inc.* | | | 1,095,634 | |
27,092 | | | | Triumph Group Inc. | | | 757,221 | |
| | | | | | | | |
| | | | Total Aerospace/Defense | | | 1,852,855 | |
| | | | | | | | |
Building Materials - 1.7% | | | | |
38,900 | | | | Martin Marietta Materials Inc. | | | 7,932,877 | |
14,195 | | | | Masonite International Corp.* | | | 866,605 | |
52,002 | | | | NCI Building Systems Inc.* | | | 847,633 | |
19,876 | | | | Patrick Industries Inc.* | | | 1,221,380 | |
49,134 | | | | PGT Innovations Inc.* | | | 859,845 | |
| | | | | | | | |
| | | | Total Building Materials | | | 11,728,340 | |
| | | | | | | | |
Electrical Components & Equipment - 1.7% | | | | |
104,634 | | | | Energizer Holdings Inc. | | | 5,700,460 | |
28,684 | | | | Generac Holdings Inc.* | | | 1,275,864 | |
37,800 | | | | Hubbell Inc., Class B Shares | | | 4,953,690 | |
| | | | | | | | |
| | | | Total Electrical Components & Equipment | | | 11,930,014 | |
| | | | | | | | |
See Notes to Financial Statements.
51
Schedules of Investments
(continued)
Destinations Small-Mid Cap Equity Fund
| | | | | | | | |
| Shares/Units | | | | Security | | Value | |
INDUSTRIAL - 10.8% - (continued) | |
Electronics - 0.2% | | | | |
18,917 | | | | Control4 Corp.* | | $ | 454,765 | |
50,966 | | | | Stoneridge Inc.* | | | 1,109,020 | |
| | | | | | | | |
| | | | Total Electronics | | | 1,563,785 | |
| | | | | | | | |
Engineering & Construction - 0.3% | | | | |
16,585 | | | | EMCOR Group Inc. | | | 1,265,601 | |
11,323 | | | | NV5 Global Inc.* | | | 489,720 | |
62,837 | | | | Sterling Construction Co., Inc.* | | | 759,071 | |
| | | | | | | | |
| | | | Total Engineering & Construction | | | 2,514,392 | |
| | | | | | | | |
Environmental Control – 0.9% | | | | |
35,072 | | | | Casella Waste Systems Inc., Class A Shares* | | | 891,530 | |
23,435 | | | | Clean Harbors Inc.* | | | 1,170,110 | |
55,275 | | | | Republic Services Inc., Class A Shares | | | 3,713,375 | |
14,525 | | | | Tetra Tech Inc. | | | 710,999 | |
| | | | | | | | |
| | | | Total Environmental Control | | | 6,486,014 | |
| | | | | | | | |
Hand/Machine Tools - 0.5% | | | | |
91,583 | | | | Milacron Holdings Corp.* | | | 1,962,624 | |
21,635 | | | | Regal Beloit Corp. | | | 1,564,210 | |
| | | | | | | | |
| | | | Total Hand/Machine Tools | | | 3,526,834 | |
| | | | | | | | |
Machinery-Diversified - 0.6% | |
21,193 | | | | Altra Industrial Motion Corp. | | | 919,776 | |
5,057 | | | | Cactus Inc., Class A Shares* | | | 124,453 | |
27,022 | | | | Columbus McKinnon Corp. | | | 959,281 | |
25,424 | | | | Ichor Holdings Ltd.*(a) | | | 656,956 | |
11,002 | | | | Kadant Inc. | | | 1,049,591 | |
7,500 | | | | Xylem Inc. | | | 559,350 | |
| | | | | | | | |
| | | | Total Machinery-Diversified | | | 4,269,407 | |
| | | | | | | | |
Metal Fabricate/Hardware - 0.2% | | | | |
55,718 | | | | TriMas Corp.* | | | 1,443,096 | |
| | | | | | | | |
Miscellaneous Manufacturers - 2.7% | | | | |
39,658 | | | | Actuant Corp., Class A Shares | | | 900,237 | |
34,863 | | | | Axon Enterprise Inc.* | | | 1,214,278 | |
30,500 | | | | Crane Co. | | | 2,815,455 | |
28,100 | | | | Dover Corp. | | | 2,812,810 | |
21,540 | | | | EnPro Industries Inc. | | | 1,560,788 | |
25,633 | | | | Hexcel Corp. | | | 1,724,588 | |
46,500 | | | | Ingersoll-Rand PLC | | | 4,129,200 | |
33,510 | | | | ITT Inc. | | | 1,681,532 | |
20,068 | | | | Standex International Corp. | | | 1,928,535 | |
| | | | | | | | |
| | | | Total Miscellaneous Manufacturers | | | 18,767,423 | |
| | | | | | | | |
See Notes to Financial Statements.
52
Schedules of Investments
(continued)
Destinations Small-Mid Cap Equity Fund
| | | | | | | | |
| Shares/Units | | | | Security | | Value | |
INDUSTRIAL - 10.8% - (continued) | |
Packaging & Containers - 0.9% | | | | |
45,189 | | | | Owens-Illinois Inc.* | | $ | 974,275 | |
82,312 | | | | Sealed Air Corp. | | | 3,487,559 | |
35,410 | | | | Silgan Holdings Inc. | | | 1,007,415 | |
18,697 | | | | Sonoco Products Co. | | | 896,895 | |
| | | | | | | | |
| | | | Total Packaging & Containers | | | 6,366,144 | |
| | | | | | | | |
Transportation - 0.8% | | | | |
45,570 | | | | Air Transport Services Group Inc.* | | | 1,206,238 | |
19,765 | | | | GasLog Ltd. | | | 326,122 | |
11,121 | | | | Saia Inc.* | | | 807,941 | |
119,575 | | | | Schneider National Inc., Class B Shares | | | 3,092,209 | |
| | | | | | | | |
| | | | Total Transportation | | | 5,432,510 | |
| | | | | | | | |
| | | | TOTAL INDUSTRIAL | | | 75,880,814 | |
| | | | | | | | |
TECHNOLOGY - 7.0% | | | | |
Computers - 2.0% | | | | |
8,666 | | | | CACI International Inc., Class A Shares* | | | 1,291,668 | |
61,193 | | | | CSRA Inc. | | | 2,480,152 | |
56,103 | | | | Diebold Nixdorf Inc. | | | 880,817 | |
17,698 | | | | ForeScout Technologies Inc.* | | | 527,046 | |
239,714 | | | | Hewlett Packard Enterprise Co. | | | 4,456,283 | |
53,144 | | | | PlayAGS Inc.* | | | 1,100,612 | |
79,533 | | | | USA Technologies Inc.* | | | 648,194 | |
17,071 | | | | Varonis Systems Inc.* | | | 958,537 | |
37,421 | | | | Virtusa Corp.* | | | 1,785,730 | |
| | | | | | | | |
| | | | Total Computers | | | 14,129,039 | |
| | | | | | | | |
Semiconductors - 3.2% | | | | |
85,665 | | | | Adesto Technologies Corp.* | | | 552,539 | |
50,200 | | | | Analog Devices Inc. | | | 4,525,530 | |
281,300 | | | | Cypress Semiconductor Corp. | | | 4,914,311 | |
150,471 | | | | MACOM Technology Solutions Holdings Inc.*(a) | | | 3,211,051 | |
30,347 | | | | Nova Measuring Instruments Ltd.* | | | 831,204 | |
23,176 | | | | Semtech Corp.* | | | 779,873 | |
93,411 | | | | SMART Global Holdings Inc.* | | | 3,243,230 | |
60,600 | | | | Xilinx Inc. | | | 4,317,750 | |
| | | | | | | | |
| | | | Total Semiconductors | | | 22,375,488 | |
| | | | | | | | |
Software - 1.8% | | | | |
81,534 | | | | Altair Engineering Inc., Class A Shares* | | | 2,145,975 | |
51,522 | | | | Alteryx Inc., Class A Shares* | | | 1,761,537 | |
75,044 | | | | Asure Software Inc.*(a) | | | 1,069,377 | |
73,116 | | | | Everbridge Inc.* | | | 2,333,132 | |
See Notes to Financial Statements.
53
Schedules of Investments
(continued)
Destinations Small-Mid Cap Equity Fund
| | | | | | | | |
| Shares/Units | | | | Security | | Value | |
TECHNOLOGY - 7.0% - (continued) | | | | |
Software - 1.8% - (continued) | | | | |
46,471 | | | | Five9 Inc.* | | $ | 1,410,860 | |
25,979 | | | | Instructure Inc.* | | | 1,127,488 | |
30,072 | | | | Talend SA, ADR* | | | 1,415,790 | |
36,705 | | | | Upland Software Inc.* | | | 875,781 | |
| | | | | | | | |
| | | | Total Software | | | 12,139,940 | |
| | | | | | | | |
| | | | TOTAL TECHNOLOGY | | | 48,644,467 | |
| | | | | | | | |
UTILITIES - 4.0% | | | | |
Electric - 4.0% | | | | |
16,409 | | | | Black Hills Corp. | | | 833,413 | |
93,500 | | | | CMS Energy Corp. | | | 3,969,075 | |
193,238 | | | | FirstEnergy Corp. | | | 6,247,385 | |
180,100 | | | | Great Plains Energy Inc. | | | 5,249,915 | |
27,812 | | | | Hawaiian Electric Industries Inc. | | | 916,683 | |
13,581 | | | | IDACORP Inc. | | | 1,100,740 | |
45,796 | | | | Portland General Electric Co. | | | 1,819,475 | |
144,900 | | | | PPL Corp. | | | 4,151,385 | |
88,200 | | | | Xcel Energy Inc. | | | 3,817,296 | |
| | | | | | | | |
| | | | Total Electric | | | 28,105,367 | |
| | | | | | | | |
| | | | TOTAL UTILITIES | | | 28,105,367 | |
| | | | | | | | |
| | | | TOTAL COMMON STOCKS (Cost - $497,116,792) | | | 528,729,180 | |
| | | | | | | | |
EXCHANGE TRADED FUNDS (ETFs) - 21.8% | | | | |
461,219 | | | | iShares Core S&P Mid-Cap | | | 85,998,895 | |
882,978 | | | | iShares Core S&P Small-Cap | | | 66,876,753 | |
| | | | | | | | |
| | | | TOTAL EXCHANGE TRADED FUNDS (ETFs)
(Cost - $140,668,681) | | | 152,875,648 | |
| | | | | | | | |
| | | | TOTAL INVESTMENTS BEFORE SHORT-TERM INVESTMENTS (Cost - $637,785,473) | | | 681,604,828 | |
| | | | | | | | |
| | | |
Face Amount | | | | | | | |
SHORT-TERM INVESTMENTS - 2.8% | | | | |
TIME DEPOSITS - 2.8% | | | | |
$ 11,479,283 | | | | ANZ National Bank - London, 0.780% due 3/1/18 | | | 11,479,283 | |
335,970 | | | | Banco Santander SA - Frankfurt, 0.780% due 3/1/18. | | | 335,970 | |
5,461,644 | | | | BNP Paribas - Paris, 0.780% due 3/1/18 | | | 5,461,644 | |
490 | | | | Brown Brothers Harriman - Grand Cayman, 0.780% due 3/1/18 | | | 490 | |
2,554,006 | | | | Wells Fargo - Grand Cayman, 0.780% due 3/1/18. | | | 2,554,006 | |
| | | | | | | | |
| | | | TOTAL TIME DEPOSITS (Cost - $19,831,393) | | | 19,831,393 | |
| | | | | | | | |
See Notes to Financial Statements.
54
Schedules of Investments
(continued)
Destinations Small-Mid Cap Equity Fund
| | | | | | | | |
| Face Amount | | | | Security | | Value | |
INVESTMENTS PURCHASED WITH CASH PROCEEDS FROM SECURITIES LENDING - 2.5% | | | | |
MONEY MARKET FUND - 2.5% | | | | |
$ 17,329,790 | | | | Federated Government Obligations Fund, Premier Class(c) (Cost - $17,329,790) | | $ | 17,329,790 | |
| | | | | | | | |
| | | | TOTAL INVESTMENTS - 102.6% (Cost - $674,946,656#) | | | 718,766,011 | |
| | | | | | | | |
| | | | Liabilities in Excess of Other Assets - (2.6)% | | | (17,921,006 | ) |
| | | | | | | | |
| | | | TOTAL NET ASSETS - 100.0% | | $ | 700,845,005 | |
| | | | | | | | |
| * | Non-income producing security. |
| (a) | All or a portion of this security is on loan (See Note 5). |
| (c) | Represents investment of collateral received from securities lending transactions. |
| # | Aggregate cost for federal income tax purposes is $676,425,510. |
Abbreviations used in this schedule:
| | | | |
| ADR | | — | | American Depositary Receipts |
| PLC | | — | | Public Limited Company |
| | | | | | |
Summary of Investments by Security Sector^ (unaudited) | | | |
Financial | | | 18.3 | % | |
Consumer Non-cyclical | | | 15.5 | | |
Industrial | | | 10.6 | | |
Technology | | | 6.8 | | |
Consumer Cyclical | | | 6.3 | | |
Energy | | | 5.8 | | |
Communications | | | 4.0 | | |
Utilities | | | 3.9 | | |
Basic Materials | | | 2.3 | | |
Exchange Traded Funds (ETFs) | | | 21.3 | | |
Short-Term Investments | | | 2.8 | | |
Money Market Fund | | | 2.4 | | |
| | | | | |
| | | 100.0 | % | |
| | | | | |
| ^ | As a percentage of total investments. |
See Notes to Financial Statements.
55
Schedules of Investments
(continued)
Destinations International Equity Fund
| | | | | | | | |
| Shares/Units | | | | Security | | Value | |
COMMON STOCKS - 75.5% | |
Argentina - 0.6% | | | | |
26,556 | | | | Banco Macro SA, ADR | | $ | 3,003,749 | |
98,712 | | | | Loma Negra Cia Industrial Argentina SA, ADR* | | | 2,148,961 | |
173,184 | | | | YPF SA, ADR | | | 4,002,282 | |
| | | | | | | | |
| | | | Total Argentina | | | 9,154,992 | |
| | | | | | | | |
Australia - 1.7% | | | | |
316,912 | | | | Amcor Ltd. | | | 3,406,365 | |
357,802 | | | | Brambles Ltd. | | | 2,657,027 | |
341,244 | | | | BWX Ltd. | | | 1,311,870 | |
347,556 | | | | DuluxGroup Ltd. | | | 2,061,552 | |
688,839 | | | | Nanosonics Ltd.* | | | 1,399,505 | |
93,078 | | | | Orica Ltd. | | | 1,341,343 | |
632,230 | | | | Pro Medicus Ltd. | | | 4,056,886 | |
1,004,350 | | | | South32 Ltd. | | | 2,568,743 | |
516,076 | | | | Webjet Ltd. | | | 4,731,143 | |
| | | | | | | | |
| | | | Total Australia | | | 23,534,434 | |
| | | | | | | | |
Austria - 0.4% | | | | |
106,383 | | | | Erste Group Bank AG* | | | 5,403,033 | |
| | | | | | | | |
Belgium - 0.2% | | | | |
27,321 | | | | Anheuser-Busch InBev SA | | | 2,900,868 | |
| | | | | | | | |
Bermuda - 0.2% | | | | |
81,244 | | | | Hiscox Ltd. | | | 1,549,597 | |
76,100 | | | | Liberty Latin America Ltd., Class C Shares* | | | 1,556,245 | |
| | | | | | | | |
| | | | Total Bermuda | | | 3,105,842 | |
| | | | | | | | |
Brazil - 1.8% | | | | | | | | |
372,550 | | | | B3 SA - Brasil Bolsa Balcao | | | 2,938,196 | |
348,543 | | | | BB Seguridade Participacoes SA | | | 3,122,242 | |
268,657 | | | | Kroton Educacional SA | | | 1,281,879 | |
220,630 | | | | Linx SA | | | 1,289,074 | |
119,829 | | | | Pagseguro Digital Ltd., Class A Shares* | | | 3,863,287 | |
266,819 | | | | Petroleo Brasileiro SA, ADR* | | | 3,746,139 | |
671,663 | | | | Rumo SA* | | | 2,944,276 | |
162,444 | | | | Smiles Fidelidade SA | | | 4,214,493 | |
175,561 | | | | TOTVS SA | | | 1,650,495 | |
| | | | | | | | |
| | | | Total Brazil | | | 25,050,081 | |
| | | | | | | | |
Canada - 1.3% | | | | |
43,174 | | | | Alimentation Couche-Tard Inc., Class B Shares | | | 2,099,638 | |
104,800 | | | | Canadian Natural Resources Ltd. | | | 3,247,174 | |
10,900 | | | | Canadian Pacific Railway Ltd. | | | 1,949,918 | |
See Notes to Financial Statements.
56
Schedules of Investments
(continued)
Destinations International Equity Fund
| | | | | | | | |
| Shares/Units | | | | Security | | Value | |
Canada - 1.3% - (continued) | | | | |
201,726 | | | | Computer Modelling Group Ltd. | | $ | 1,412,035 | |
43,111 | | | | Equitable Group Inc. | | | 2,064,314 | |
5,709 | | | | Fairfax Financial Holdings Ltd. | | | 2,790,909 | |
41,031 | | | | Magna International Inc. | | | 2,255,474 | |
141,178 | | | | Seven Generations Energy Ltd., Class A Shares* | | | 1,650,690 | |
33,800 | | | | TransCanada Corp. | | | 1,460,836 | |
| | | | | | | | |
| | | | Total Canada | | | 18,930,988 | |
| | | | | | | | |
China - 7.3% | | | | | | | | |
84,348 | | | | Alibaba Group Holding Ltd., ADR* | | | 15,700,537 | |
25,807 | | | | Baidu Inc., ADR* | | | 6,512,138 | |
54,605 | | | | Bitauto Holdings Ltd., ADR*(a) | | | 1,550,236 | |
4,909,622 | | | | China Construction Bank Corp., Class H Shares(b) | | | 5,049,286 | |
939,705 | | | | China Everbright Ltd. | | | 2,049,483 | |
1,776,418 | | | | China Mengniu Dairy Co., Ltd. | | | 5,822,437 | |
301,747 | | | | China Mobile Ltd. | | | 2,807,198 | |
853,511 | | | | CSPC Pharmaceutical Group Ltd. | | | 1,944,490 | |
43,628 | | | | Ctrip.com International Ltd., ADR* | | | 2,006,015 | |
183,600 | | | | Gree Electric Appliances Inc. of Zhuhai, Class A Shares | | | 1,480,361 | |
1,204,337 | | | | Haitong Securities Co., Ltd., Class H Shares(b) | | | 1,712,966 | |
494,023 | | | | Hangzhou Hikvision Digital Technology Co., Ltd., Class A Shares | | | 3,281,304 | |
114,998 | | | | Han’s Laser Technology Industry Group Co., Ltd., Class A Shares | | | 1,019,758 | |
2,040,000 | | | | Industrial & Commercial Bank of China Ltd., Class H Shares(b) | | | 1,741,444 | |
684,593 | | | | Kangde Xin Composite Material Group Co., Ltd., Class A Shares(c) | | | 2,138,424 | |
3,547,761 | | | | Kingdee International Software Group Co., Ltd.* | | | 2,524,391 | |
23,553 | | | | Kweichow Moutai Co., Ltd., Class A Shares | | | 2,688,628 | |
426,736 | | | | Midea Group Co., Ltd., Class A Shares | | | 3,654,201 | |
36,628 | | | | Momo Inc., ADR* | | | 1,210,555 | |
261,811 | | | | Shenzhou International Group Holdings Ltd. | | | 2,572,601 | |
510,332 | | | | Sinopharm Group Co., Ltd., Class H Shares(b) | | | 2,248,168 | |
133,112 | | | | Sunny Optical Technology Group Co., Ltd. | | | 2,210,132 | |
102,946 | | | | TAL Education Group, ADR | | | 3,887,241 | |
322,041 | | | | Tencent Holdings Ltd. | | | 17,661,941 | |
3,292,683 | | | | WH Group Ltd.(e) | | | 4,052,790 | |
1,962,000 | | | | Yihai International Holding Ltd. | | | 2,612,080 | |
164,642 | | | | Yunnan Baiyao Group Co., Ltd., Class A Shares | | | 2,407,458 | |
| | | | | | | | |
| | | | Total China | | | 102,546,263 | |
| | | | | | | | |
See Notes to Financial Statements.
57
Schedules of Investments
(continued)
Destinations International Equity Fund
| | | | | | | | |
| Shares/Units | | | | Security | | Value | |
Denmark - 0.5% | | | | |
3,587 | | | | Genmab AS* | | $ | 729,319 | |
51,746 | | | | GN Store Nord AS | | | 1,781,969 | |
13,786 | | | | Jyske Bank AS, Class Registered Shares | | | 812,142 | |
49,904 | | | | Royal Unibrew AS | | | 3,058,790 | |
18,282 | | | | Sydbank AS | | | 714,348 | |
| | | | | | | | |
| | | | Total Denmark | | | 7,096,568 | |
| | | | | | | | |
Egypt - 0.1% | | | | |
8,206,304 | | | | Cleopatra Hospital* | | | 1,930,290 | |
| | | | | | | | |
Finland - 0.3% | | | | |
63,698 | | | | Sampo OYJ, Class A Shares | | | 3,601,963 | |
9,734 | | | | Wartsila OYJ Abp | | | 683,416 | |
| | | | | | | | |
| | | | Total Finland | | | 4,285,379 | |
| | | | | | | | |
France - 3.9% | | | | |
23,478 | | | | Air Liquide SA | | | 2,934,017 | |
17,816 | | | | Airbus SE | | | 2,122,395 | |
21,966 | | | | Akka Technologies | | | 1,495,813 | |
16,110 | | | | Aubay | | | 737,950 | |
34,222 | | | | BNP Paribas SA | | | 2,705,906 | |
85,938 | | | | Danone SA | | | 6,856,498 | |
1,745 | | | | Dassault Aviation SA | | | 3,028,173 | |
27,222 | | | | Dassault Systemes SE | | | 3,522,117 | |
38,674 | | | | Esker SA | | | 2,454,389 | |
8,143 | | | | Infotel SA | | | 552,089 | |
38,711 | | | | Lectra | | | 1,090,998 | |
46,915 | | | | Legrand SA | | | 3,676,296 | |
12,446 | | | | L’Oreal SA | | | 2,682,434 | |
26,883 | | | | MGI Digital Graphic Technology* | | | 1,914,340 | |
42,000 | | | | Pernod Ricard SA | | | 6,898,294 | |
76,895 | | | | Schneider Electric SE* | | | 6,660,247 | |
41,782 | | | | Thales SA | | | 4,658,810 | |
27,694 | | | | TOTAL SA | | | 1,581,133 | |
| | | | | | | | |
| | | | Total France | | | 55,571,899 | |
| | | | | | | | |
Germany - 5.4% | | | | |
16,563 | | | | Aumann AG* | | | 1,235,317 | |
77,764 | | | | Bayer AG, Class Registered Shares | | | 9,118,913 | |
8,038 | | | | Beiersdorf AG | | | 883,091 | |
34,053 | | | | Brenntag AG | | | 2,128,862 | |
24,149 | | | | CANCOM SE | | | 2,341,058 | |
19,724 | | | | Corestate Capital Holding SA | | | 1,246,887 | |
See Notes to Financial Statements.
58
Schedules of Investments
(continued)
Destinations International Equity Fund
| | | | | | | | |
| Shares/Units | | | | Security | | Value | |
Germany - 5.4% - (continued) | | | | |
112,502 | | | | Deutsche Wohnen SE | | $ | 4,655,377 | |
56,247 | | | | Fresenius SE & Co. KGaA | | | 4,598,759 | |
63,395 | | | | GEA Group AG | | | 3,010,901 | |
47,953 | | | | Henkel AG & Co. KGaA | | | 6,388,483 | |
24,957 | | | | Hypoport AG* | | | 4,024,441 | |
198,000 | | | | Infineon Technologies AG | | | 5,383,375 | |
13,237 | | | | Isra Vision AG | | | 3,207,464 | |
16,548 | | | | LEG Immobilien AG | | | 1,724,077 | |
8,363 | | | | Linde AG* | | | 1,881,225 | |
26,356 | | | | Merck KGaA | | | 2,641,037 | |
50,497 | | | | Nexus AG | | | 1,547,518 | |
61,971 | | | | Scout24 AG(e) | | | 2,726,905 | |
44,561 | | | | Symrise AG | | | 3,622,774 | |
63,292 | | | | TAG Immobilien AG | | | 1,202,556 | |
523,788 | | | | Telefonica Deutschland Holding AG | | | 2,420,224 | |
60,178 | | | | va-Q-tec AG* | | | 1,277,112 | |
106,631 | | | | Vonovia SE | | | 4,863,980 | |
15,924 | | | | Wirecard AG | | | 1,910,922 | |
8,571 | | | | XING SE | | | 2,671,620 | |
| | | | | | | | |
| | | | Total Germany | | | 76,712,878 | |
| | | | | | | | |
Greece - 0.2% | | | | |
134,677 | | | | Sarantis SA | | | 2,459,411 | |
| | | | | | | | |
Hong Kong - 2.3% | | | | |
773,800 | | | | AIA Group Ltd. | | | 6,425,201 | |
664,000 | | | | China Overseas Land & Investment Ltd. | | | 2,304,679 | |
511,000 | | | | CK Hutchison Holdings Ltd. | | | 6,368,165 | |
716,200 | | | | Esprit Holdings Ltd.* | | | 281,005 | |
62,900 | | | | Jardine Matheson Holdings Ltd. | | | 4,099,423 | |
2,051,710 | | | | Man Wah Holdings Ltd. | | | 1,894,848 | |
2,525,423 | | | | Sino Biopharmaceutical Ltd. | | | 4,722,079 | |
406,711 | | | | Techtronic Industries Co., Ltd. | | | 2,521,210 | |
5,711,322 | | | | Tongda Group Holdings Ltd. | | | 1,370,595 | |
142,783 | | | | Tongda Hong Tai Holdings Ltd.*(c)(d) | | | — | |
1,068,000 | | | | Vitasoy International Holdings Ltd. | | | 2,776,723 | |
| | | | | | | | |
| | | | Total Hong Kong | | | 32,763,928 | |
| | | | | | | | |
India - 5.5% | | | | |
609,665 | | | | Allcargo Logistics Ltd. | | | 1,655,836 | |
117,805 | | | | Amara Raja Batteries Ltd. | | | 1,478,703 | |
395,319 | | | | Axis Bank Ltd. | | | 3,138,369 | |
474,427 | | | | Berger Paints India Ltd. | | | 1,812,150 | |
See Notes to Financial Statements.
59
Schedules of Investments
(continued)
Destinations International Equity Fund
| | | | | | | | |
| Shares/Units | | | | Security | | Value | |
India - 5.5% - (continued) | | | | |
35,298 | | | | Britannia Industries Ltd. | | $ | 2,673,764 | |
466,648 | | | | Byke Hospitality Ltd. | | | 1,216,630 | |
244,590 | | | | Can Financial Homes Ltd. | | | 2,000,585 | |
578,260 | | | | Coal India Ltd. | | | 2,744,877 | |
125,399 | | | | Divi’s Laboratories Ltd. | | | 1,955,523 | |
536,763 | | | | Edelweiss Financial Services Ltd. | | | 2,177,700 | |
531,649 | | | | Exide Industries Ltd. | | | 1,680,536 | |
200,413 | | | | Gulf Oil Lubricants India Ltd. | | | 3,051,012 | |
325,056 | | | | Housing Development Finance Corp., Ltd | | | 8,888,617 | |
29,017 | | | | Infosys Ltd. | | | 517,440 | |
956,866 | | | | JM Financial Ltd. | | | 2,147,490 | |
536,317 | | | | JSW Steel Ltd. | | | 2,540,696 | |
198,811 | | | | Kotak Mahindra Bank Ltd. | | | 3,287,638 | |
275,751 | | | | Manpasand Beverages Ltd. | | | 1,588,346 | |
28,427 | | | | Maruti Suzuki India Ltd. | | | 3,832,460 | |
192,207 | | | | MAS Financial Services Ltd. | | | 1,732,443 | |
222,654 | | | | Max Financial Services Ltd.* | | | 1,667,519 | |
452,804 | | | | Motherson Sumi Systems Ltd. | | | 2,284,245 | |
1,540,838 | | | | NTPC Ltd. | | | 3,846,009 | |
518,544 | | | | Power Grid Corp. of India Ltd. | | | 1,565,565 | |
52,485 | | | | PVR Ltd. | | | 1,066,803 | |
238,980 | | | | SBI Life Insurance Co., Ltd.*(e) | | | 2,521,207 | |
182,449 | | | | Sun TV Network Ltd. | | | 2,571,397 | |
137,648 | | | | Supreme Industries Ltd. | | | 2,499,765 | |
87,996 | | | | Tata Chemicals Ltd. | | | 946,975 | |
204,632 | | | | Tata Communications Ltd. | | | 1,992,068 | |
859,673 | | | | Tata Global Beverages Ltd. | | | 3,565,817 | |
158,987 | | | | Vakrangee Ltd. | | | 385,882 | |
9,226 | | | | V-Mart Retail Ltd. | | | 226,348 | |
280,737 | | | | Wipro Ltd. | | | 1,254,198 | |
139,386 | | | | Zee Entertainment Enterprises Ltd. | | | 1,200,980 | |
| | | | | | | | |
| | | | Total India | | | 77,715,593 | |
| | | | | | | | |
Indonesia - 1.1% | | | | |
28,509,200 | | | | Ace Hardware Indonesia Tbk PT | | | 2,759,542 | |
2,102,600 | | | | Bank Central Asia Tbk PT | | | 3,532,987 | |
3,486,243 | | | | Bank Negara Indonesia Persero Tbk PT | | | 2,453,361 | |
10,579,395 | | | | Kimia Farma Persero Tbk PT | | | 1,838,774 | |
18,123,011 | | | | Nippon Indosari Corpindo Tbk PT | | | 1,620,042 | |
7,414,710 | | | | Sarana Menara Nusantara Tbk PT, (Restricted)(d) | | | 1,924,323 | |
3,099,837 | | | | Tower Bersama Infrastructure Tbk PT | | | 1,263,511 | |
| | | | | | | | |
| | | | Total Indonesia | | | 15,392,540 | |
| | | | | | | | |
See Notes to Financial Statements.
60
Schedules of Investments
(continued)
Destinations International Equity Fund
| | | | | | | | |
| Shares/Units | | | | Security | | Value | |
Ireland - 0.3% | | | | |
32,672 | | | | Bank of Ireland Group PLC* | | $ | 306,132 | |
29,350 | | | | Kerry Group PLC, Class A Shares | | | 2,904,972 | |
8,136 | | | | Ryanair Holdings PLC, ADR* | | | 986,571 | |
| | | | | | | | |
| | | | Total Ireland | | | 4,197,675 | |
| | | | | | | | |
Isle of Man - 0.0% | | | | |
18,302 | | | | Playtech PLC | | | 196,786 | |
| | | | | | | | |
Israel - 0.3% | | | | |
13,853 | | | | Check Point Software Technologies Ltd.* | | | 1,439,188 | |
37,941 | | | | Rami Levy Chain Stores Hashikma Marketing 2006 Ltd. | | | 2,148,923 | |
| | | | | | | | |
| | | | Total Israel | | | 3,588,111 | |
| | | | | | | | |
Italy - 0.4% | | | | |
376,737 | | | | Banca Mediolanum SpA | | | 3,389,107 | |
135,985 | | | | Gruppo MutuiOnline SpA | | | 2,149,918 | |
| | | | | | | | |
| | | | Total Italy | | | 5,539,025 | |
| | | | | | | | |
Japan - 12.3% | | | | |
101,200 | | | | Arcland Service Holdings Co., Ltd. | | | 2,156,217 | |
240,300 | | | | Astellas Pharma Inc. | | | 3,544,920 | |
34,500 | | | | Bridgestone Corp. | | | 1,532,059 | |
110,000 | | | | Chiba Bank Ltd. | | | 904,881 | |
46,000 | | | | Chugai Pharmaceutical Co., Ltd. | | | 2,375,665 | |
7,300 | | | | CyberAgent Inc. | | | 313,940 | |
147,000 | | | | Daiwa Securities Group Inc. | | | 979,282 | |
45,600 | | | | Digital Arts Inc. | | | 1,644,194 | |
1,700 | | | | Disco Corp. | | | 396,663 | |
64,612 | | | | en-japan Inc. | | | 3,619,812 | |
82,485 | | | | Evolable Asia Corp.(a) | | | 1,686,498 | |
113,400 | | | | Fujitsu General Ltd. | | | 2,158,707 | |
7,100 | | | | Glory Ltd. | | | 266,847 | |
108,600 | | | | Hachijuni Bank Ltd. | | | 653,530 | |
18,200 | | | | Hirose Electric Co., Ltd. | | | 2,695,285 | |
273,865 | | | | Infomart Corp. | | | 2,388,332 | |
205,700 | | | | Inpex Corp. | | | 2,458,006 | |
64,100 | | | | Ito En Ltd. | | | 2,680,777 | |
34,400 | | | | Itokuro Inc.*(a) | | | 2,226,611 | |
214,500 | | | | Japan Material Co., Ltd. | | | 2,989,175 | |
103,060 | | | | Japan Property Management Center Co., Ltd. | | | 1,700,281 | |
213,500 | | | | Japan Tobacco Inc. | | | 6,084,218 | |
53,300 | | | | Kansai Paint Co., Ltd. | | | 1,337,498 | |
90,700 | | | | Kao Corp. | | | 6,625,573 | |
See Notes to Financial Statements.
61
Schedules of Investments
(continued)
Destinations International Equity Fund
| | | | | | | | |
| Shares/Units | | | | Security | | Value | |
Japan - 12.3% - (continued) | |
163,200 | | | | KDDI Corp. | | $ | 4,008,992 | |
43,900 | | | | Kobayashi Pharmaceutical Co., Ltd. | | | 2,846,748 | |
32,900 | | | | Koito Manufacturing Co., Ltd. | | | 2,270,394 | |
3,800 | | | | Kose Corp. | | | 710,515 | |
82,900 | | | | Kotobuki Spirits Co., Ltd. | | | 4,780,960 | |
42,300 | | | | Kusuri no Aoki Holdings Co., Ltd. | | | 2,503,058 | |
59,217 | | | | M&A Capital Partners Co., Ltd.*(a) | | | 4,634,908 | |
13,300 | | | | Mabuchi Motor Co., Ltd. | | | 682,177 | |
182,900 | | | | Mebuki Financial Group Inc. | | | 733,023 | |
44,500 | | | | MISUMI Group Inc. | | | 1,276,126 | |
280,500 | | | | Mitsubishi Electric Corp. | | | 4,726,081 | |
427,000 | | | | Morningstar Japan KK(a) | | | 1,662,276 | |
15,300 | | | | Murata Manufacturing Co., Ltd. | | | 2,131,735 | |
56,300 | | | | Nihon Kohden Corp. | | | 1,592,471 | |
101,800 | | | | Nippon Telegraph & Telephone Corp. | | | 4,714,612 | |
10,200 | | | | Nissin Foods Holdings Co., Ltd. | | | 696,199 | |
88,800 | | | | Nomura Research Institute Ltd. | | | 3,980,422 | |
162,900 | | | | North Pacific Bank Ltd. | | | 563,816 | |
34,600 | | | | Obic Co., Ltd. | | | 2,863,364 | |
15,200 | | | | Olympus Corp. | | | 608,863 | |
42,500 | | | | Omron Corp. | | | 2,499,163 | |
206,200 | | | | Open Door Inc.*(a) | | | 4,374,028 | |
288,910 | | | | Prestige International Inc. | | | 3,667,428 | |
110,449 | | | | Rakus Co., Ltd. | | | 3,371,153 | |
116,800 | | | | Renesas Electronics Corp.* | | | 1,338,080 | |
54,900 | | | | Rohto Pharmaceutical Co., Ltd. | | | 1,523,437 | |
189,500 | | | | Santen Pharmaceutical Co., Ltd. | | | 3,027,138 | |
39,100 | | | | Secom Co., Ltd. | | | 2,799,325 | |
50,800 | | | | Seria Co., Ltd. | | | 2,535,237 | |
116,500 | | | | Seven & i Holdings Co., Ltd. | | | 4,844,583 | |
129,969 | | | | SMS Co., Ltd. | | | 5,346,792 | |
19,800 | | | | Sohgo Security Services Co., Ltd. | | | 927,021 | |
197,500 | | | | Sumitomo Corp. | | | 3,469,490 | |
45,400 | | | | Sumitomo Mitsui Financial Group Inc. | | | 1,968,429 | |
32,400 | | | | Suzuki Motor Corp. | | | 1,851,876 | |
61,600 | | | | Systena Corp. | | | 2,624,833 | |
73,500 | | | | Terumo Corp. | | | 3,975,721 | |
60,300 | | | | Tokio Marine Holdings Inc. | | | 2,779,819 | |
105,300 | | | | Tokyo Base Co., Ltd.*(a) | | | 1,369,575 | |
70,000 | | | | Toyo Suisan Kaisha Ltd. | | | 2,735,306 | |
33,900 | | | | USS Co., Ltd. | | | 698,023 | |
115,700 | | | | Vector Inc.(a) | | | 2,446,480 | |
See Notes to Financial Statements.
62
Schedules of Investments
(continued)
Destinations International Equity Fund
| | | | | | | | |
| Shares/Units | | | | Security | | Value | |
Japan - 12.3% - (continued) | |
549,700 | | | | Yahoo Japan Corp.(a) | | $ | 2,539,606 | |
64,200 | | | | Yakuodo Co., Ltd. | | | 2,095,240 | |
9,700 | | | | Yamaha Corp. | | | 428,625 | |
83,500 | | | | Yamato Holdings Co., Ltd. | | | 2,081,532 | |
53,800 | | | | Yokogawa Electric Corp. | | | 1,086,978 | |
236,601 | | | | Yume No Machi Souzou Iinkai Co., Ltd.(a) | | | 3,829,006 | |
| | | | | | | | |
| | | | Total Japan | | | 173,639,635 | |
| | | | | | | | |
Malaysia - 0.8% | | | | |
10,587,947 | | | | 7-Eleven Malaysia Holdings Bhd | | | 4,097,338 | |
1,507,600 | | | | Astro Malaysia Holdings Bhd | | | 928,393 | |
326,200 | | | | Carlsberg Brewery Malaysia Bhd | | | 1,536,522 | |
123,500 | | | | Dutch Lady Milk Industries Bhd | | | 2,081,889 | |
4,623,374 | | | | My EG Services Bhd | | | 3,144,116 | |
| | | | | | | | |
| | | | Total Malaysia | | | 11,788,258 | |
| | | | | | | | |
Mexico - 1.4% | | | | |
242,875 | | | | Banco Santander Mexico SA Institucion de Banca Multiple Grupo Financiero Santand, ADR . | | | 1,717,126 | |
34,799 | | | | Fomento Economico Mexicano SAB de CV, ADR | | | 3,211,948 | |
117,056 | | | | Gruma SAB de CV, Class B Shares | | | 1,355,153 | |
632,878 | | | | Grupo Lala SAB de CV, Class B Shares | | | 925,000 | |
602,528 | | | | Infraestructura Energetica Nova SAB de CV | | | 2,844,903 | |
1,389,800 | | | | Qualitas Controladora SAB de CV | | | 3,656,340 | |
923,180 | | | | Unifin Financiera SAB de CV SOFOM ENR | | | 3,268,193 | |
982,496 | | | | Wal-Mart de Mexico SAB de CV | | | 2,299,675 | |
| | | | | | | | |
| | | | Total Mexico | | | 19,278,338 | |
| | | | | | | | |
Netherlands - 0.8% | | | | |
80,826 | | | | Altice NV, Class A Shares*(a) | | | 769,863 | |
16,106 | | | | ASML Holding NV | | | 3,146,365 | |
11,542 | | | | Core Laboratories NV(a) | | | 1,188,364 | |
44,509 | | | | Heineken NV | | | 4,628,951 | |
113,263 | | | | ING Groep NV | | | 1,985,660 | |
| | | | | | | | |
| | | | Total Netherlands | | | 11,719,203 | |
| | | | | | | | |
New Zealand - 0.3% | | | | |
234,023 | | | | Freightways Ltd. | | | 1,243,476 | |
442,293 | | | | Restaurant Brands New Zealand Ltd. | | | 2,296,436 | |
| | | | | | | | |
| | | | Total New Zealand | | | 3,539,912 | |
| | | | | | | | |
Nigeria - 0.0% | | | | |
1,551,703 | | | | Lekoil Ltd., CDI* | | | 382,886 | |
| | | | | | | | |
See Notes to Financial Statements.
63
Schedules of Investments
(continued)
Destinations International Equity Fund
| | | | | | | | |
| Shares/Units | | | | Security | | Value | |
Norway - 0.1% | | | | |
71,160 | | | | DNB ASA | | $ | 1,396,938 | |
| | | | | | | | |
Pakistan - 0.3% | | | | |
1,031,430 | | | | Hascol Petroleum Ltd. | | | 2,511,005 | |
358,700 | | | | PAK Suzuki Motor Co., Ltd. | | | 1,537,447 | |
| | | | | | | | |
| | | | Total Pakistan | | | 4,048,452 | |
| | | | | | | | |
Panama - 0.2% | | | | |
19,047 | | | | Copa Holdings SA, Class A Shares | | | 2,589,821 | |
| | | | | | | | |
Peru - 0.1% | | | | |
4,703 | | | | Credicorp Ltd. | | | 1,017,964 | |
| | | | | | | | |
Philippines - 0.8% | | | | |
2,889,435 | | | | Ayala Land Inc. | | | 2,272,907 | |
812,348 | | | | BDO Unibank Inc. | | | 2,421,894 | |
1,313,416 | | | | Concepcion Industrial Corp. | | | 1,605,195 | |
6,732,565 | | | | Metro Pacific Investments Corp. | | | 725,331 | |
168 | | | | Pepsi-Cola Products Philippines Inc. | | | 10 | |
2,195,455 | | | | Philippine Seven Corp. | | | 4,937,765 | |
| | | | | | | | |
| | | | Total Philippines | | | 11,963,102 | |
| | | | | | | | |
Poland - 0.3% | | | | |
29,772 | | | | AmRest Holdings SE* | | | 3,710,536 | |
| | | | | | | | |
Russia - 0.8% | | | | | | |
323,848 | | | | Sberbank of Russia PJSC, ADR | | | 6,561,245 | |
98,180 | | | | Yandex NV, Class A Shares* | | | 4,034,216 | |
| | | | | | | | |
| | | | Total Russia | | | 10,595,461 | |
| | | | | | | | |
Singapore - 0.3% | | | | |
1,970,800 | | | | Riverstone Holdings Ltd. | | | 1,543,399 | |
94,000 | | | | Sea Ltd., ADR* | | | 1,030,240 | |
1,734,900 | | | | Sheng Siong Group Ltd. | | | 1,221,365 | |
| | | | | | | | |
| | | | Total Singapore | | | 3,795,004 | |
| | | | | | | | |
South Africa - 1.4% | | | | |
126,737 | | | | Bid Corp., Ltd | | | 2,893,969 | |
215,834 | | | | Bidvest Group Ltd. | | | 4,073,908 | |
1,091,315 | | | | FirstRand Ltd. | | | 6,774,611 | |
2,167,323 | | | | Italtile Ltd. | | | 2,604,785 | |
846,990 | | | | Peregrine Holdings Ltd. | | | 1,625,111 | |
44,283 | | | | Sasol Ltd. | | | 1,545,044 | |
27,586 | | | | Sasol Ltd., ADR | | | 950,889 | |
| | | | | | | | |
| | | | Total South Africa | | | 20,468,317 | |
| | | | | | | | |
See Notes to Financial Statements.
64
Schedules of Investments
(continued)
Destinations International Equity Fund
| | | | | | | | |
| Shares/Units | | | | Security | | Value | |
South Korea - 2.4% | | | | |
46,972 | | | | DIO Corp.* | | $ | 1,623,067 | |
93,426 | | | | KB Financial Group Inc. | | | 5,488,781 | |
61,824 | | | | Kia Motors Corp. | | | 1,951,470 | |
1,928 | | | | LG Household & Health Care Ltd. | | | 1,950,671 | |
49,814 | | | | Minwise Co., Ltd.(a) | | | 1,023,404 | |
5,483 | | | | NAVER Corp. | | | 4,036,977 | |
4,868 | | | | Netmarble Games Corp.(e) | | | 653,023 | |
5,062 | | | | Samsung Electronics Co., Ltd. | | | 10,950,747 | |
16,775 | | | | Samsung Life Insurance Co., Ltd. | | | 1,871,781 | |
39,992 | | | | Shinhan Financial Group Co., Ltd. | | | 1,731,728 | |
51,391 | | | | TES Co., Ltd. | | | 1,576,113 | |
38,122 | | | | Vieworks Co., Ltd. | | | 1,458,501 | |
| | | | | | | | |
| | | | Total South Korea | | | 34,316,263 | |
| | | | | | | | |
Spain - 1.1% | | | | | | | | |
137,824 | | | | Amadeus IT Group SA | | | 10,115,559 | |
299,513 | | | | CaixaBank SA | | | 1,455,258 | |
177,448 | | | | Grifols SA, ADR | | | 3,868,366 | |
| | | | | | | | |
| | | | Total Spain | | | 15,439,183 | |
| | | | | | | | |
Sweden - 1.2% | | | | |
169,386 | | | | Essity AB, Class B Shares* | | | 4,635,673 | |
103,597 | | | | eWork Group AB | | | 1,232,193 | |
361,993 | | | | Fortnox AB | | | 2,106,781 | |
56,466 | | | | Hexagon AB, Class B Shares | | | 3,291,264 | |
120,801 | | | | HMS Networks AB | | | 1,739,186 | |
336,681 | | | | Svenska Handelsbanken AB, Class A Shares | | | 4,619,853 | |
| | | | | | | | |
| | | | Total Sweden | | | 17,624,950 | |
| | | | | | | | |
Switzerland - 3.7% | | | | |
22,936 | | | | Cie Financiere Richemont SA, Class Registered Shares | | | 2,019,222 | |
2,021 | | | | GAM Holding AG* | | | 36,556 | |
1,775 | | | | Geberit AG, Class Registered Shares | | | 803,689 | |
2,998 | | | | Givaudan SA, Class Registered Shares | | | 6,837,890 | |
65,775 | | | | Julius Baer Group Ltd.* | | | 4,253,606 | |
221,133 | | | | Nestle SA, Class Registered Shares | | | 17,602,220 | |
31,327 | | | | Roche Holding AG | | | 7,263,749 | |
4,953 | | | | Schindler Holding AG | | | 1,160,287 | |
1,307 | | | | SGS SA, Class Registered Shares | | | 3,325,532 | |
81 | | | | Sika AG | | | 666,030 | |
419,018 | | | | UBS Group AG, Class Registered Shares* | | | 7,944,305 | |
| | | | | | | | |
| | | | Total Switzerland | | | 51,913,086 | |
| | | | | | | | |
See Notes to Financial Statements.
65
Schedules of Investments
(continued)
Destinations International Equity Fund
| | | | | | | | |
| Shares/Units | | | | Security | | Value | |
Taiwan - 2.9% | | | | |
148,260 | | | | Advanced Ceramic X Corp. | | $ | 1,758,923 | |
303,000 | | | | Delta Electronics Inc. | | | 1,414,245 | |
104,890 | | | | Eclat Textile Co., Ltd. | | | 1,101,732 | |
853,000 | | | | Far EasTone Telecommunications Co., Ltd. | | | 2,137,228 | |
132,642 | | | | Ginko International Co., Ltd. | | | 949,039 | |
475,000 | | | | Hota Industrial Manufacturing Co., Ltd. | | | 2,066,964 | |
232,754 | | | | Hu Lane Associate Inc. | | | 1,117,935 | |
13,000 | | | | Largan Precision Co., Ltd. | | | 1,588,898 | |
250,285 | | | | Makalot Industrial Co., Ltd. | | | 1,156,335 | |
170,400 | | | | Onyx Healthcare Inc. | | | 903,569 | |
82,820 | | | | Poya International Co., Ltd. | | | 1,057,469 | |
594,000 | | | | Taiwan Mobile Co., Ltd. | | | 2,162,989 | |
666,000 | | | | Taiwan Semiconductor Manufacturing Co., Ltd. | | | 5,441,402 | |
282,474 | | | | Taiwan Semiconductor Manufacturing Co., Ltd., ADR | | | 12,245,248 | |
323,803 | | | | TCI Co., Ltd. | | | 3,554,309 | |
177,000 | | | | Voltronic Power Technology Corp. | | | 2,994,627 | |
| | | | | | | | |
| | | | Total Taiwan | | | 41,650,912 | |
| | | | | | | | |
Thailand - 0.4% | | | | |
116,198 | | | | Bangkok Bank PCL, Class F Shares | | | 845,754 | |
155,236 | | | | Bangkok Bank PCL, NVDR | | | 1,035,751 | |
810,600 | | | | CP ALL PCL, Class F Shares | | | 2,148,733 | |
6,961,100 | | | | Plan B Media PCL, Class F Shares(a) | | | 1,403,270 | |
| | | | | | | | |
| | | | Total Thailand | | | 5,433,508 | |
| | | | | | | | |
Turkey - 0.2% | | | | |
161,377 | | | | Logo Yazilim Sanayi Ve Ticaret AS* | | | 2,323,139 | |
| | | | | | | | |
United Arab Emirates - 0.2% | | | | |
56,961 | | | | DP World Ltd. | | | 1,393,730 | |
648,496 | | | | First Abu Dhabi Bank PJSC | | | 2,035,955 | |
| | | | | | | | |
| | | | Total United Arab Emirates | | | 3,429,685 | |
| | | | | | | | |
United Kingdom - 6.7% | | | | |
19,456 | | | | accesso Technology Group PLC* | | | 611,650 | |
503,602 | | | | Advanced Medical Solutions Group PLC | | | 2,248,412 | |
32,300 | | | | AstraZeneca PLC, ADR | | | 1,072,037 | |
85,583 | | | | Avon Rubber PLC(a) | | | 1,392,490 | |
156,330 | | | | BAE Systems PLC | | | 1,238,581 | |
185,140 | | | | British American Tobacco PLC | | | 10,875,849 | |
110,027 | | | | Bunzl PLC | | | 2,955,638 | |
90,194 | | | | Burberry Group PLC | | | 1,898,272 | |
81,013 | | | | Capita PLC | | | 195,319 | |
See Notes to Financial Statements.
66
Schedules of Investments
(continued)
Destinations International Equity Fund
| | | | | | | | |
| Shares/Units | | | | Security | | Value | |
United Kingdom - 6.7% - (continued) | | | | |
589,280 | | | | Clipper Logistics PLC | | $ | 3,266,528 | |
255,129 | | | | Compass Group PLC | | | 5,427,148 | |
893,320 | | | | ConvaTec Group PLC(e) | | | 2,523,050 | |
9,842 | | | | Croda International PLC | | | 623,304 | |
140,886 | | | | Diageo PLC | | | 4,775,792 | |
83,487 | | | | Experian PLC | | | 1,782,681 | |
416,458 | | | | GB Group PLC | | | 2,434,001 | |
47,752 | | | | Gear4Music Holdings PLC* | | | 426,770 | |
159,313 | | | | Halma PLC | | | 2,631,910 | |
754,788 | | | | Horizon Discovery Group PLC* | | | 1,886,451 | |
96,740 | | | | IG Group Holdings PLC | | | 1,070,355 | |
150,433 | | | | IMI PLC | | | 2,524,492 | |
28,811 | | | | Intertek Group PLC | | | 1,944,674 | |
66,440 | | | | Jardine Lloyd Thompson Group PLC | | | 1,206,846 | |
49,351 | | | | Liberty Global PLC, Class C Shares* | | | 1,482,011 | |
21,100 | | | | LivaNova PLC* | | | 1,893,514 | |
44,002 | | | | London Stock Exchange Group PLC | | | 2,435,309 | |
248,727 | | | | Patisserie Holdings PLC | | | 1,212,567 | |
118,598 | | | | Prudential PLC | | | 2,968,469 | |
217,595 | | | | Purplebricks Group PLC*(a) | | | 1,312,998 | |
110,702 | | | | Reckitt Benckiser Group PLC | | | 8,778,404 | |
90,228 | | | | RELX NV | | | 1,848,117 | |
129,621 | | | | Rentokil Initial PLC | | | 515,335 | |
268,459 | | | | Sanne Group PLC | | | 2,380,295 | |
354,738 | | | | Smart Metering Systems PLC | | | 3,474,855 | |
93,986 | | | | Smith & Nephew PLC | | | 1,632,944 | |
48,023 | | | | Spectris PLC | | | 1,794,998 | |
33,118 | | | | Spirax-Sarco Engineering PLC | | | 2,597,001 | |
826,952 | | | | Tullow Oil PLC* | | | 2,063,596 | |
1,259,463 | | | | Vodafone Group PLC | | | 3,526,896 | |
| | | | | | | | |
| | | | Total United Kingdom | | | 94,929,559 | |
| | | | | | | | |
United States - 3.0% | | | | |
28,609 | | | | Analog Devices Inc. | | | 2,579,101 | |
20,849 | | | | ANSYS Inc.* | | | 3,334,589 | |
3,095 | | | | Booking Holdings Inc.* | | | 6,295,354 | |
137,463 | | | | Cadence Design Systems Inc.* | | | 5,329,440 | |
84,509 | | | | Colgate-Palmolive Co., (Restricted) | | | 5,828,586 | |
26,561 | | | | DENTSPLY SIRONA Inc. | | | 1,489,010 | |
20,500 | | | | Mastercard Inc., Class A Shares | | | 3,603,080 | |
17,931 | | | | Nordson Corp. | | | 2,404,009 | |
3,156 | | | | NVIDIA Corp. | | | 763,752 | |
See Notes to Financial Statements.
67
Schedules of Investments
(continued)
Destinations International Equity Fund
| | | | | | | | |
| Shares/Units | | | | Security | | Value | |
United States - 3.0% - (continued) | | | | |
20,272 | | | | Philip Morris International Inc. | | $ | 2,099,165 | |
99,080 | | | | Shire PLC | | | 4,233,456 | |
36,099 | | | | Texas Instruments Inc. | | | 3,911,327 | |
| | | | | | | | |
| | | | Total United States | | | 41,870,869 | |
| | | | | | | | |
| | | | TOTAL COMMON STOCKS (Cost - $930,668,885) | | | 1,066,941,565 | |
| | | | | | | | |
EXCHANGE TRADED FUNDS (ETFs) - 21.3% | | | | |
United States - 21.3% | | | | |
2,818,702 | | | | iShares Core MSCI EAFE | | | 186,428,951 | |
1,972,117 | | | | iShares Core MSCI Emerging Markets | | | 114,244,738 | |
| | | | | | | | |
| | | | Total United States | | | 300,673,689 | |
| | | | | | | | |
| | | | TOTAL EXCHANGE TRADED FUNDS (ETFs) (Cost - $259,001,889) | | | 300,673,689 | |
| | | | | | | | |
| | | | TOTAL INVESTMENTS BEFORE SHORT-TERM INVESTMENTS (Cost - $1,189,670,774) | | | 1,367,615,254 | |
| | | | | | | | |
| | | |
Face Amount† | | | | | | | |
SHORT-TERM INVESTMENTS - 3.2% | |
TIME DEPOSITS - 2.7% | |
$ 4,618,437 | | | | ANZ National Bank - London, 0.780% due 3/1/18 | | | 4,618,437 | |
10,859,589 | | | | Banco Santander SA - Frankfurt, 0.780% due 3/1/18 | | | 10,859,589 | |
11,889,724 | | | | BNP Paribas - Paris, 0.780% due 3/1/18 | | | 11,889,724 | |
| | | | Brown Brothers Harriman - Grand Cayman: | | | | |
4,740 | | EUR | | (0.580)% due 3/1/18 | | | 5,783 | |
4 | | GBP | | 0.230% due 3/1/18 | | | 5 | |
5,336 | | HKD | | 0.340% due 3/1/18 | | | 682 | |
5 | | CAD | | 0.550% due 3/1/18 | | | 4 | |
90 | | AUD | | 0.630% due 3/1/18 | | | 70 | |
2,444 | | | | 0.780% due 3/1/18 | | | 2,444 | |
4 | | NZD | | 0.900% due 3/1/18 | | | 2 | |
3,898 | | ZAR | | 5.700% due 3/1/18 | | | 330 | |
| | | | Citibank - London: | | | | |
75,353 | | EUR | | (0.580)% due 3/1/18 | | | 91,931 | |
165,690 | | GBP | | 0.230% due 3/1/18 | | | 228,147 | |
10,277,360 | | | | JPMorgan Chase & Co. - New York, 0.780% due 3/1/18 | | | 10,277,360 | |
39,610,569 | | JPY | | Sumitomo Mitsui Banking Corp. - Tokyo, (0.310)% due 3/1/18 | | | 371,250 | |
| | | | | | | | |
| | | | TOTAL TIME DEPOSITS (Cost - $38,345,758) | | | 38,345,758 | |
| | | | | | | | |
See Notes to Financial Statements.
68
Schedules of Investments
(continued)
Destinations International Equity Fund
| | | | | | | | |
| Face Amount† | | | | Security | | Value | |
U.S. GOVERNMENT AGENCY - 0.5% | | | | |
$ 6,638,000 | | | | Federal Home Loan Bank (FHLB) Discount Notes, 0.900% due 3/1/18(f) (Cost - $6,638,000) | | $ | 6,638,000 | |
| | | | | | | | |
| | | | TOTAL SHORT-TERM INVESTMENTS (Cost - $44,983,758) | | | 44,983,758 | |
| | | | | | | | |
INVESTMENTS PURCHASED WITH CASH PROCEEDS FROM SECURITIES LENDING - 1.4% | | | | |
MONEY MARKET FUND - 1.4% | | | | |
19,777,529 | | | | Federated Government Obligations Fund, Premier Class(g) (Cost - $19,777,529) | | | 19,777,529 | |
| | | | | | | | |
| | | | TOTAL INVESTMENTS - 101.4% (Cost - $1,254,432,061#) | | | 1,432,376,541 | |
| | | | | | | | |
| | | | Liabilities in Excess of Other Assets - (1.4)% | | | (19,811,366 | ) |
| | | | | | | | |
| | | | TOTAL NET ASSETS - 100.0% | | $ | 1,412,565,175 | |
| | | | | | | | |
| † | Face amount denominated in U.S. dollars, unless otherwise noted. |
| * | Non-income producing security. |
| (a) | All or a portion of this security is on loan (See Note 5). |
| (b) | Security trades on the Hong Kong exchange. |
| (c) | Security is valued in good faith at fair value by or under the direction of the Board of Trustees. |
| (e) | Restricted security that may be sold to “qualified institutional buyers” pursuant to the conditions of Rule 144A under the Securities Act of 1933, as amended. This security has been deemed liquid pursuant to guidelines approved by the Board of Trustees, unless otherwise noted. The aggregate value of restricted 144A holdings at February 28, 2018, amounts to approximately $12,476,975 and represents 0.88% of net assets. |
| (f) | Rate shown represents yield-to-maturity. |
| (g) | Represents investment of collateral received from securities lending transactions. |
| # | Aggregate cost for federal income tax purposes is $1,255,959,221. |
Abbreviations used in this schedule:
| | | | |
| ADR | | — | | American Depositary Receipts |
| CDI | | — | | Clearing House Electronics Systems (CHESS) Depositary Interest |
| NVDR | | — | | Non Voting Depository Receipts |
| PCL | | — | | Public Company Limited |
| PLC | | — | | Public Limited Company |
See Notes to Financial Statements.
69
Schedules of Investments
(continued)
Destinations International Equity Fund
| | | | | | |
Summary of Investments by Security Sector^ (unaudited) | | | |
Consumer Non-cyclical | | | 20.9 | % | |
Financial | | | 13.6 | | |
Communications | | | 10.5 | | |
Industrial | | | 8.5 | | |
Technology | | | 8.3 | | |
Consumer Cyclical | | | 7.4 | | |
Basic Materials | | | 2.1 | | |
Energy | | | 1.9 | | |
Diversified | | | 0.7 | | |
Utilities | | | 0.6 | | |
Exchange Traded Funds (ETFs) | | | 21.0 | | |
Short-Term Investments | | | 3.1 | | |
Money Market Fund | | | 1.4 | | |
| | | | | |
| | | 100.0 | % | |
| | | | | |
| ^ | As a percentage of total investments. |
At February 28, 2018, Destinations International Equity Fund had open forward foreign currency contracts as described below.
The unrealized appreciation/(depreciation) on the open contracts reflected in the accompanying financial statements were as follows:
| | | | | | | | | | | | | | | | | | | | | | | | | | | | |
Foreign Currency | | Local
Currency | | | Counterparty | | | Market Value | | | Settlement
Date | | | Unrealized
Appreciation | | | Unrealized
(Depreciation) | | | Net
Unrealized
Appreciation/
(Depreciation) | |
Contracts to Sell: | | | | | | | | | | | | | | | | | | | | | | | | | | | | |
British Pound | | | 1,139,000 | | | | BOA | | | $ | 1,569,216 | | | | 3/15/18 | | | $ | 15,975 | | | $ | — | | | $ | 15,975 | |
Japanese Yen | | | 256,289,000 | | | | BCLY | | | | 2,404,153 | | | | 3/15/18 | | | | — | | | | (42,853 | ) | | | (42,853 | ) |
Japanese Yen | | | 205,000,000 | | | | MSC | | | | 1,945,856 | | | | 8/22/18 | | | | 7,389 | | | | — | | | | 7,389 | |
Japanese Yen | | | 955,995,000 | | | | SSB | | | | 9,074,977 | | | | 8/23/18 | | | | — | | | | (45,466 | ) | | | (45,466 | ) |
| | | | | | | | | | | | | | | | | | | | | | | | | | | | |
Net Unrealized Depreciation on Open Forward Foreign Currency Contracts | | | $ | 23,364 | | | $ | (88,319 | ) | | $ | (64,955 | ) |
| | | | | | | | | | | | | | | | | | | | | | | | | | | | |
Currency Abbreviations used in this schedule:
| | | | |
| AUD | | — | | Australian Dollar |
| CAD | | — | | Canadian Dollar |
| EUR | | — | | Euro |
| GBP | | — | | British Pound |
| HKD | | — | | Hong Kong Dollar |
| JPY | | — | | Japanese Yen |
| NZD | | — | | New Zealand Dollar |
| ZAR | | — | | South African Rand |
Counterparty Abbreviations used in this schedule:
| | | | |
| BOA | | — | | Bank of America |
| BCLY | | — | | Barclays Bank PLC |
| MSC | | — | | Morgan Stanley |
| SSB | | — | | State Street Bank and Trust Co. |
See Notes to Financial Statements.
70
Schedules of Investments
(continued)
Destinations Equity Income Fund
| | | | | | | | |
| Shares/Units | | | | Security | | Value | |
COMMON STOCKS - 76.8% | |
BASIC MATERIALS - 1.6% | |
Chemicals - 1.4% | |
47,132 | | | | DowDuPont Inc. | | $ | 3,313,380 | |
21,351 | | | | Nutrien Ltd.* | | | 1,051,537 | |
| | | | | | | | |
| | | | Total Chemicals | | | 4,364,917 | |
| | | | | | | | |
Iron/Steel - 0.2% | |
21,525 | | | | ThyssenKrupp AG | | | 586,134 | |
| | | | | | | | |
| | | | TOTAL BASIC MATERIALS | | | 4,951,051 | |
| | | | | | | | |
COMMUNICATIONS - 13.2% | |
Telecommunications - 13.2% | |
319,904 | | | | AT&T Inc. | | | 11,612,515 | |
168,472 | | | | BCE Inc. | | | 7,353,428 | |
38,790 | | | | CenturyLink Inc. | | | 685,420 | |
148,881 | | | | Cisco Systems Inc. | | | 6,666,891 | |
212,997 | | | | Nokia OYJ | | | 1,248,090 | |
54,752 | | | | Orange SA | | | 931,156 | |
146,616 | | | | Verizon Communications Inc. | | | 6,999,448 | |
1,961,489 | | | | Vodafone Group PLC | | | 5,503,027 | |
45,423 | | | | Vodafone Group PLC, ADR | | | 1,285,925 | |
| | | | | | | | |
| | | | Total Telecommunications | | | 42,285,900 | |
| | | | | | | | |
| | | | TOTAL COMMUNICATIONS | | | 42,285,900 | |
| | | | | | | | |
CONSUMER CYCLICAL - 3.4% | |
Airlines - 0.2% | |
7,843 | | | | Alaska Air Group Inc. | | | 505,873 | |
| | | | | | | | |
Auto Manufacturers - 0.4% | |
128,229 | | | | Ford Motor Co. | | | 1,360,510 | |
| | | | | | | | |
Home Furnishings - 0.5% | |
8,621 | | | | Whirlpool Corp. | | | 1,400,309 | |
| | | | | | | | |
Lodging - 0.8% | |
35,337 | | | | Las Vegas Sands Corp. | | | 2,572,887 | |
| | | | | | | | |
Retail - 1.5% | |
10,162 | | | | Kohl’s Corp. | | | 671,607 | |
16,301 | | | | Nordstrom Inc. | | | 836,404 | |
45,110 | | | | Target Corp. | | | 3,401,745 | |
| | | | | | | | |
| | | | Total Retail | | | 4,909,756 | |
| | | | | | | | |
| | | | TOTAL CONSUMER CYCLICAL | | | 10,749,335 | |
| | | | | | | | |
See Notes to Financial Statements.
71
Schedules of Investments
(continued)
Destinations Equity Income Fund
| | | | | | | | |
| Shares/Units | | | | Security | | Value | |
CONSUMER NON-CYCLICAL - 20.5% | |
Agriculture - 9.1% | |
133,218 | | | | Altria Group Inc. | | $ | 8,386,073 | |
35,500 | | | | British American Tobacco PLC | | | 2,099,715 | |
143,618 | | | | Imperial Brands PLC | | | 5,179,198 | |
130,629 | | | | Philip Morris International Inc. | | | 13,526,633 | |
| | | | | | | | |
| | | | Total Agriculture | | | 29,191,619 | |
| | | | | | | | |
Beverages - 2.1% | |
142,450 | | | | Coca-Cola Co. | | | 6,156,689 | |
4,725 | | | | PepsiCo Inc. | | | 518,474 | |
| | | | | | | | |
| | | | Total Beverages | | | 6,675,163 | |
| | | | | | | | |
Cosmetics/Personal Care - 1.0% | |
40,949 | | | | Procter & Gamble Co. | | | 3,215,315 | |
| | | | | | | | |
Food - 0.5% | |
32,550 | | | | General Mills Inc. | | | 1,645,403 | |
| | | | | | | | |
Household Products/Wares - 0.6% | |
16,325 | | | | Kimberly-Clark Corp. | | | 1,810,769 | |
| | | | | | | | |
Pharmaceuticals - 7.2% | |
41,582 | | | | AbbVie Inc. | | | 4,816,443 | |
50,525 | | | | AstraZeneca PLC | | | 3,321,987 | |
169,450 | | | | GlaxoSmithKline PLC | | | 3,050,014 | |
3,907 | | | | Johnson & Johnson | | | 507,441 | |
78,699 | | | | Merck & Co., Inc. | | | 4,267,060 | |
111,591 | | | | Pfizer Inc. | | | 4,051,869 | |
37,200 | | | | Sanofi | | | 2,951,321 | |
| | | | | | | | |
| | | | Total Pharmaceuticals | | | 22,966,135 | |
| | | | | | | | |
| | | | TOTAL CONSUMER NON-CYCLICAL | | | 65,504,404 | |
| | | | | | | | |
ENERGY - 12.1% | |
Oil & Gas - 11.9% | |
537,175 | | | | BP PLC | | | 3,514,509 | |
86,318 | | | | BP PLC, ADR | | | 3,354,318 | |
82,885 | | | | Chevron Corp. | | | 9,276,489 | |
36,850 | | | | ConocoPhillips | | | 2,001,323 | |
43,949 | | | | Eni SpA | | | 735,314 | |
68,350 | | | | Exxon Mobil Corp. | | | 5,176,829 | |
91,050 | | | | Occidental Petroleum Corp. | | | 5,972,880 | |
65,130 | | | | Royal Dutch Shell PLC, Class A Shares | | | 2,063,554 | |
92,537 | | | | TOTAL SA | | | 5,302,685 | |
8,400 | | | | Valero Energy Corp. | | | 759,528 | |
| | | | | | | | |
| | | | Total Oil & Gas | | | 38,157,429 | |
| | | | | | | | |
See Notes to Financial Statements.
72
Schedules of Investments
(continued)
Destinations Equity Income Fund
| | | | | | | | |
| Shares/Units | | | | Security | | Value | |
ENERGY - 12.1% - (continued) | |
Oil & Gas Services - 0.1% | |
7,345 | | | | Baker Hughes a GE Co. | | $ | 193,908 | |
| | | | | | | | |
Pipelines - 0.1% | |
9,795 | | | | Enbridge Inc. | | | 311,677 | |
| | | | | | | | |
| | | | TOTAL ENERGY | | | 38,663,014 | |
| | | | | | | | |
FINANCIAL - 8.7% | |
Banks - 3.4% | |
62,960 | | | | Bank of America Corp. | | | 2,021,016 | |
19,300 | | | | Canadian Imperial Bank of Commerce | | | 1,763,161 | |
12,458 | | | | Citigroup Inc. | | | 940,454 | |
23,817 | | | | JPMorgan Chase & Co. | | | 2,750,864 | |
29,134 | | | | Morgan Stanley | | | 1,632,087 | |
6,529 | | | | SunTrust Banks Inc. | | | 455,985 | |
23,477 | | | | Wells Fargo & Co. | | | 1,371,292 | |
| | | | | | | | |
| | | | Total Banks | | | 10,934,859 | |
| | | | | | | | |
Diversified Financial Services - 0.3% | |
1,358 | | | | BlackRock Inc., Class A Shares | | | 746,126 | |
| | | | | | | | |
Equity Real Estate Investment Trusts (REITs) - 3.1% | |
37,825 | | | | Crown Castle International Corp. | | | 4,163,019 | |
11,250 | | | | Digital Realty Trust Inc. | | | 1,132,200 | |
23,225 | | | | National Retail Properties Inc. | | | 864,899 | |
24,250 | | | | Omega Healthcare Investors Inc.(a) | | | 617,890 | |
7,175 | | | | Public Storage | | | 1,395,107 | |
37,050 | | | | Ventas Inc. | | | 1,790,256 | |
| | | | | | | | |
| | | | Total Equity Real Estate Investment Trusts (REITs) | | | 9,963,371 | |
| | | | | | | | |
Insurance - 1.9% | |
8,406 | | | | Arthur J Gallagher & Co. | | | 580,939 | |
13,500 | | | | Muenchener Rueckversicherungs-Gesellschaft AG in Muenchen, Class Registered Shares | | | 3,032,127 | |
23,302 | | | | Prudential Financial Inc. | | | 2,477,469 | |
| | | | | | | | |
| | | | Total Insurance | | | 6,090,535 | |
| | | | | | | | |
| | | | TOTAL FINANCIAL | | | 27,734,891 | |
| | | | | | | | |
INDUSTRIAL - 3.7% | |
Aerospace/Defense - 0.4% | |
81,639 | | | | BAE Systems PLC | | | 651,320 | |
2,101 | | | | Lockheed Martin Corp. | | | 740,476 | |
| | | | | | | | |
| | | | Total Aerospace/Defense | | | 1,391,796 | |
| | | | | | | | |
See Notes to Financial Statements.
73
Schedules of Investments
(continued)
Destinations Equity Income Fund
| | | | | | | | |
| Shares/Units | | | | Security | | Value | |
INDUSTRIAL - 3.7% - (continued) | |
Miscellaneous Manufacturers - 1.4% | |
22,742 | | | | Ingersoll-Rand PLC | | $ | 2,019,489 | |
18,813 | | | | Siemens AG, Class Registered Shares | | | 2,488,900 | |
| | | | | | | | |
| | | | Total Miscellaneous Manufacturers | | | 4,508,389 | |
| | | | | | | | |
Packaging & Containers - 0.7% | |
24,789 | | | | Graphic Packaging Holding Co. | | | 379,520 | |
27,469 | | | | WestRock Co. | | | 1,806,361 | |
| | | | | | | | |
| | | | Total Packaging & Containers | | | 2,185,881 | |
| | | | | | | | |
Transportation - 1.2% | |
9,309 | | | | CSX Corp. | | | 500,080 | |
14,625 | | | | Union Pacific Corp. | | | 1,904,906 | |
14,275 | | | | United Parcel Service Inc., Class B Shares | | | 1,490,453 | |
| | | | | | | | |
| | | | Total Transportation | | | 3,895,439 | |
| | | | | | | | |
| | | | TOTAL INDUSTRIAL | | | 11,981,505 | |
| | | | | | | | |
TECHNOLOGY - 4.2% | |
Computers - 0.4% | |
8,411 | | | | International Business Machines Corp. | | | 1,310,686 | |
| | | | | | | | |
Semiconductors - 2.2% | |
113,251 | | | | Intel Corp. | | | 5,582,142 | |
24,803 | | | | QUALCOMM Inc. | | | 1,612,195 | |
| | | | | | | | |
| | | | Total Semiconductors | | | 7,194,337 | |
| | | | | | | | |
Software - 1.6% | |
44,191 | | | | Microsoft Corp. | | | 4,143,790 | |
12,525 | | | | Paychex Inc. | | | 815,753 | |
| | | | | | | | |
| | | | Total Software | | | 4,959,543 | |
| | | | | | | | |
| | | | TOTAL TECHNOLOGY | | | 13,464,566 | |
| | | | | | | | |
UTILITIES - 9.4% | |
Electric - 8.1% | |
21,673 | | | | Ameren Corp. | | | 1,176,844 | |
36,357 | | | | American Electric Power Co., Inc. | | | 2,384,292 | |
68,775 | | | | Dominion Energy Inc. | | | 5,094,164 | |
8,645 | | | | DTE Energy Co. | | | 871,243 | |
69,044 | | | | Duke Energy Corp. | | | 5,201,775 | |
17,149 | | | | Entergy Corp. | | | 1,300,237 | |
32,476 | | | | Exelon Corp. | | | 1,202,911 | |
107,966 | | | | PPL Corp. | | | 3,093,226 | |
38,750 | | | | Public Service Enterprise Group Inc. | | | 1,876,663 | |
See Notes to Financial Statements.
74
Schedules of Investments
(continued)
Destinations Equity Income Fund
| | | | | | | | |
| Shares/Units | | | | Security | | Value | |
UTILITIES - 9.4% - (continued) | |
Electric - 8.1% - (continued) | |
59,915 | | | | Southern Co. | | $ | 2,579,940 | |
29,292 | | | | Xcel Energy Inc. | | | 1,267,758 | |
| | | | | | | | |
| | | | Total Electric | | | 26,049,053 | |
| | | | | | | | |
Gas - 0.9% | |
281,233 | | | | National Grid PLC | | | 2,866,378 | |
| | | | | | | | |
Water - 0.4% | |
51,710 | | | | Veolia Environnement SA | | | 1,259,831 | |
| | | | | | | | |
| | | | TOTAL UTILITIES | | | 30,175,262 | |
| | | | | | | | |
| | | | TOTAL COMMON STOCKS (Cost - $242,807,505) | | | 245,509,928 | |
| | | | | | | | |
EXCHANGE TRADED FUND (ETF) - 19.1% | |
711,012 | | | | iShares Core High Dividend (Cost - $60,169,800) | | | 61,239,463 | |
| | | | | | | | |
EQUITY LINKED NOTES - 0.9% | |
FINANCIAL - 0.9% | |
Banks - 0.9% | |
86,204 | | | | Barclays Bank PLC, 7.100%, due 5/4/18*(b)(c) | | | 1,327,542 | |
25,037 | | | | Credit Suisse AG, Series YD01, zero coupon, due 5/11/18*(b) | | | 673,696 | |
11,325 | | | | Credit Suisse AG, Series YD02, zero coupon, due 5/11/18*(b) | | | 736,250 | |
| | | | | | | | |
| | | | Total Banks | | | 2,737,488 | |
| | | | | | | | |
| | | | TOTAL FINANCIAL | | | 2,737,488 | |
| | | | | | | | |
| | | | TOTAL EQUITY LINKED NOTES (Cost - $2,868,508) | | | 2,737,488 | |
| | | | | | | | |
CONVERTIBLE PREFERRED STOCKS - 0.6% | |
CONSUMER NON-CYCLICAL - 0.3% | |
Healthcare-Products - 0.3% | |
17,597 | | | | Becton Dickinson & Co., 6.125% | | | 1,029,424 | |
| | | | | | | | |
UTILITIES - 0.3% | |
Electric - 0.3% | |
19,643 | | | | NextEra Energy Inc., 6.123% | | | 1,086,258 | |
| | | | | | | | |
| | | | TOTAL CONVERTIBLE PREFERRED STOCKS (Cost - $2,145,973) | | | 2,115,682 | |
| | | | | | | | |
See Notes to Financial Statements.
75
Schedules of Investments
(continued)
Destinations Equity Income Fund
| | | | | | | | |
| Shares/Units | | | | Security | | Value | |
PREFERRED STOCK - 0.4% | |
FINANCIAL - 0.4% | |
Banks - 0.4% | |
25,666 | | | | Deutsche Bank AG, zero coupon* (Cost - $1,432,163) | | $ | 1,397,283 | |
| | | | | | | | |
| | | | TOTAL INVESTMENTS BEFORE SHORT-TERM INVESTMENTS (Cost - $309,423,949) | | | 312,999,844 | |
| | | | | | | | |
| | | |
Face Amount† | | | | | | | |
SHORT-TERM INVESTMENTS - 2.1% | |
TIME DEPOSITS - 2.1% | |
$ 811,576 | | | | Banco Santander SA - Frankfurt, 0.780% due 3/1/18 | | | 811,576 | |
| | | | Brown Brothers Harriman - Grand Cayman: | | | | |
5 | | GBP | | 0.230% due 3/1/18 | | | 6 | |
1 | | CAD | | 0.550% due 3/1/18 | | | 1 | |
552 | | | | 0.780% due 3/1/18 | | | 552 | |
5,717,567 | | | | JPMorgan Chase & Co. - New York, 0.780% due 3/1/18 | | | 5,717,567 | |
| | | | | | | | |
| | | | TOTAL TIME DEPOSITS (Cost - $6,529,702) | | | 6,529,702 | |
| | | | | | | | |
INVESTMENTS PURCHASED WITH CASH PROCEEDS FROM SECURITIES LENDING - 0.2% | | | | |
MONEY MARKET FUND - 0.2% | |
628,002 | | | | Federated Government Obligations Fund, Premier Class(d) (Cost - $628,002) | | | 628,002 | |
| | | | | | | | |
| | | | TOTAL INVESTMENTS - 100.1% (Cost - $316,581,653#) | | | 320,157,548 | |
| | | | | | | | |
| | | | Liabilities in Excess of Other Assets - (0.1)% | | | (174,981 | ) |
| | | | | | | | |
| | | | TOTAL NET ASSETS - 100.0% | | $ | 319,982,567 | |
| | | | | | | | |
| † | Face amount denominated in U.S. dollars, unless otherwise noted. |
| * | Non-income producing security. |
| (a) | All or a portion of this security is on loan (See Note 5). |
| (b) | Security is valued in good faith at fair value by or under the direction of the Board of Trustees. |
| (c) | Restricted security that may be sold to “qualified institutional buyers” pursuant to the conditions of Rule 144A under the Securities Act of 1933, as amended. This security has been deemed liquid pursuant to guidelines approved by the Board of Trustees, unless otherwise noted. The aggregate value of restricted 144A holdings at February 28, 2018, amounts to approximately $1,327,542 and represents 0.41% of net assets. |
| (d) | Represents investment of collateral received from securities lending transactions. |
| # | Aggregate cost for federal income tax purposes is $316,987,898. |
See Notes to Financial Statements.
76
Schedules of Investments
(continued)
Destinations Equity Income Fund
Abbreviations used in this schedule:
| | | | |
| ADR | | — | | American Depositary Receipts |
| PLC | | — | | Public Limited Company |
Currency Abbreviations used in this schedule:
| | | | |
| CAD | | — | | Canadian Dollar |
| GBP | | — | | British Pound |
Summary of Investments by Security Sector^ (unaudited)
| | | | |
Consumer Non-cyclical | | | 20.8 | % |
Communications | | | 13.2 | |
Energy | | | 12.1 | |
Financial | | | 10.0 | |
Utilities | | | 9.8 | |
Technology | | | 4.2 | |
Industrial | | | 3.7 | |
Consumer Cyclical | | | 3.4 | |
Basic Materials | | | 1.5 | |
Exchange Traded Fund (ETF) | | | 19.1 | |
Short-Term Investments | | | 2.0 | |
Money Market Fund | | | 0.2 | |
| | | | |
| | | 100.0 | % |
| | | | |
| ^ | As a percentage of total investments. |
See Notes to Financial Statements.
77
Schedules of Investments
(continued)
Destinations Real Assets Fund
| | | | | | | | |
| Shares/Units | | | | Security | | Value | |
COMMON STOCKS - 77.5% | |
Canada - 28.9% | |
952,282 | | | | First Quantum Minerals Ltd. | | $ | 15,521,254 | |
14,308 | | | | Hudbay Minerals Inc. | | | 110,079 | |
835,697 | | | | Peyto Exploration & Development Corp.(a) | | | 6,637,892 | |
556,960 | | | | Tourmaline Oil Corp.* | | | 8,105,420 | |
8,820,352 | | | | Turquoise Hill Resources Ltd.* | | | 26,725,666 | |
1,211,991 | | | | Whitecap Resources Inc.(a) | | | 7,132,693 | |
29,444 | | | | Whitecap Resources Inc., Private Placement(b)(c) | | | 168,232 | |
| | | | | | | | |
| | | | Total Canada | | | 64,401,236 | |
| | | | | | | | |
United Kingdom - 0.4% | |
1,153,189 | | | | Ophir Energy PLC* | | | 835,227 | |
| | | | | | | | |
United States - 48.2% | |
995,560 | | | | Antero Resources Corp.* | | | 18,726,484 | |
345,942 | | | | Cabot Oil & Gas Corp. | | | 8,357,959 | |
183,497 | | | | Centennial Resource Development Inc., Class A Shares* | | | 3,501,123 | |
257,973 | | | | Centennial Resources Development Inc., Private Placement* | | | 4,922,125 | |
60,397 | | | | Concho Resources Inc.* | | | 9,107,868 | |
2,073,920 | | | | Denbury Resources Inc.* | | | 4,541,885 | |
966,336 | | | | Fairmount Santrol Holdings Inc.*(a) | | | 4,329,185 | |
1,251,576 | | | | Kosmos Energy Ltd.* | | | 6,745,995 | |
1,416,478 | | | | Laredo Petroleum Inc.* | | | 11,884,250 | |
302,430 | | | | Noble Energy Inc. | | | 9,021,487 | |
1,279,333 | | | | Range Resources Corp. | | | 17,002,335 | |
928,481 | | | | SRC Energy Inc.* | | | 8,235,626 | |
35,450 | | | | US Silica Holdings Inc. | | | 917,800 | |
| | | | | | | | |
| | | | Total United States | | | 107,294,122 | |
| | | | | | | | |
| | | | TOTAL COMMON STOCKS (Cost - $192,460,461) | | | 172,530,585 | |
| | | | | | | | |
EXCHANGE TRADED FUND (ETF) - 17.8% | |
United States - 17.8% | |
903,304 | | | | iShares Core US REIT(a) (Cost - $43,828,291) | | | 39,655,046 | |
| | | | | | | | |
| | | | TOTAL INVESTMENTS BEFORE SHORT-TERM INVESTMENTS (Cost - $236,288,752) | | | 212,185,631 | |
| | | | | | | | |
See Notes to Financial Statements.
78
Schedules of Investments
(continued)
Destinations Real Assets Fund
| | | | | | | | |
| Face Amount† | | | | Security | | Value | |
SHORT-TERM INVESTMENTS - 4.9% | |
TIME DEPOSITS - 4.9% | |
$ 10,892,126 | | | | Banco Santander SA - Frankfurt, 0.780% due 3/1/18 | | $ | 10,892,126 | |
| | | | Brown Brothers Harriman - Grand Cayman: | | | | |
12 | | CAD | | 0.550% due 3/1/18 | | | 9 | |
12 | | AUD | | 0.630% due 3/1/18 | | | 10 | |
1,034 | | | | 0.780% due 3/1/18 | | | 1,034 | |
| | | | | | | | |
| | | | TOTAL TIME DEPOSITS (Cost - $10,893,179) | | | 10,893,179 | |
| | | | | | | | |
INVESTMENTS PURCHASED WITH CASH PROCEEDS FROM SECURITIES LENDING - 8.6% | | | | |
MONEY MARKET FUND - 8.6% | |
19,121,905 | | | | Federated Government Obligations Fund, Premier Class(d) (Cost - $19,121,905) | | | 19,121,905 | |
| | | | | | | | |
| | | | TOTAL INVESTMENTS - 108.8% (Cost - $266,303,836#) | | | 242,200,715 | |
| | | | | | | | |
| | | | Liabilities in Excess of Other Assets - (8.8)% | | | (19,650,053 | ) |
| | | | | | | | |
| | | | TOTAL NET ASSETS - 100.0%. | | $ | 222,550,662 | |
| | | | | | | | |
| † | Face amount denominated in U.S. dollars, unless otherwise noted. |
| * | Non-income producing security. |
| (a) | All or a portion of this security is on loan (See Note 5). |
| (b) | Security is valued in good faith at fair value by or under the direction of the Board of Trustees. |
| (c) | Restricted security that may be sold to “qualified institutional buyers” pursuant to the conditions of Rule 144A under the Securities Act of 1933, as amended. This security has been deemed liquid pursuant to guidelines approved by the Board of Trustees, unless otherwise noted. The aggregate value of restricted 144A holdings at February 28, 2018, amounts to approximately $168,232 and represents 0.08% of net assets. |
| (d) | Represents investment of collateral received from securities lending transactions. |
| # | Aggregate cost for federal income tax purposes is $268,806,837. |
Abbreviations used in this schedule:
| | | | |
| PLC | | — | | Public Limited Company |
| REIT | | — | | Real Estate Investment Trust |
Currency Abbreviations used in this schedule:
| | | | |
| AUD | | — | | Australian Dollar |
| CAD | | — | | Canadian Dollar |
| | | | |
See Notes to Financial Statements.
79
Schedules of Investments
(continued)
Destinations Real Assets Fund
Summary of Investments by Security Sector^ (unaudited)
| | | | |
Energy | | | 51.6 | % |
Basic Materials | | | 19.6 | |
Exchange Traded Fund (ETF) | | | 16.4 | |
Short-Term Investments | | | 4.5 | |
Money Market Fund | | | 7.9 | |
| | | | |
| | | 100.0 | % |
| | | | |
| ^ | As a percentage of total investments. |
See Notes to Financial Statements.
80
Schedules of Investments
(continued)
Destinations Core Fixed Income Fund
| | | | | | | | |
Face Amount/Units | | | | Security | | Value | |
U.S. GOVERNMENT AGENCIES & OBLIGATIONS - 21.6% | |
U.S. GOVERNMENT OBLIGATIONS - 21.0% | |
| | | | U.S. Treasury Bonds: | | | | |
$ 1,000,000 | | | | 6.125% due 11/15/27 | | $ | 1,275,391 | |
1,500,000 | | | | 5.250% due 11/15/28 | | | 1,824,844 | |
3,500,000 | | | | 6.250% due 5/15/30 | | | 4,696,836 | |
1,800,000 | | | | 5.375% due 2/15/31 | | | 2,276,719 | |
3,300,000 | | | | 4.500% due 5/15/38 | | | 4,040,695 | |
3,500,000 | | | | 4.375% due 11/15/39 | | | 4,233,496 | |
3,500,000 | | | | 3.875% due 8/15/40 | | | 3,956,777 | |
3,000,000 | | | | 4.375% due 5/15/41 | | | 3,644,531 | |
2,500,000 | | | | 3.125% due 11/15/41 | | | 2,514,258 | |
3,500,000 | | | | 2.750% due 8/15/42 | | | 3,288,223 | |
1,000,000 | | | | 2.750% due 11/15/42 | | | 938,203 | |
8,780,000 | | | | 3.125% due 2/15/43 | | | 8,802,979 | |
300,000 | | | | 3.750% due 11/15/43 | | | 333,527 | |
3,500,000 | | | | 3.125% due 8/15/44 | | | 3,502,324 | |
5,850,000 | | | | 3.000% due 11/15/45 | | | 5,711,977 | |
500,000 | | | | 2.500% due 5/15/46 | | | 440,781 | |
3,500,000 | | | | 3.000% due 2/15/47 | | | 3,412,910 | |
1,000,000 | | | | 3.000% due 5/15/47 | | | 974,688 | |
1,000,000 | | | | 2.750% due 8/15/47 | | | 926,406 | |
500,000 | | | | 2.750% due 11/15/47 | | | 463,242 | |
| | | | U.S. Treasury Inflation Indexed Notes: | | | | |
1,824,642 | | | | 0.125% due 4/15/22 | | | 1,795,874 | |
1,814,022 | | | | 0.375% due 7/15/27 | | | 1,757,899 | |
| | | | U.S. Treasury Notes: | | | | |
6,310,000 | | | | 1.000% due 3/15/18 | | | 6,309,278 | |
3,000,000 | | | | 3.625% due 8/15/19 | | | 3,060,703 | |
6,000,000 | | | | 1.000% due 10/15/19 | | | 5,884,219 | |
6,000,000 | | | | 1.375% due 12/15/19 | | | 5,909,531 | |
7,000,000 | | | | 1.375% due 1/31/20 | | | 6,884,883 | |
4,000,000 | | | | 1.625% due 3/15/20 | | | 3,946,875 | |
3,000,000 | | | | 1.125% due 4/30/20 | | | 2,924,766 | |
7,000,000 | | | | 3.500% due 5/15/20 | | | 7,176,914 | |
5,000,000 | | | | 1.375% due 5/31/20 | | | 4,895,313 | |
12,000,000 | | | | 1.500% due 5/31/20 | | | 11,782,500 | |
2,500,000 | | | | 1.500% due 6/15/20 | | | 2,453,906 | |
4,000,000 | | | | 1.625% due 6/30/20 | | | 3,935,000 | |
3,000,000 | | | | 1.500% due 7/15/20 | | | 2,942,109 | |
3,000,000 | | | | 2.625% due 8/15/20 | | | 3,018,867 | |
11,000,000 | | | | 1.375% due 9/30/20 | | | 10,728,438 | |
4,000,000 | | | | 1.875% due 12/15/20 | | | 3,944,219 | |
2,000,000 | | | | 1.750% due 12/31/20 | | | 1,964,219 | |
25,520,000 | | | | 2.125% due 1/31/21 | | | 25,307,666 | |
See Notes to Financial Statements.
81
Schedules of Investments
(continued)
Destinations Core Fixed Income Fund
| | | | | | | | |
Face Amount/Units | | | | Security | | Value | |
U.S. GOVERNMENT OBLIGATIONS - 21.0% - (continued) | |
$ 2,000,000 | | | | 2.250% due 3/31/21 | | $ | 1,988,281 | |
4,000,000 | | | | 1.875% due 1/31/22 | | | 3,897,031 | |
6,000,000 | | | | 1.750% due 2/28/22 | | | 5,813,203 | |
10,740,000 | | | | 1.750% due 3/31/22 | | | 10,397,243 | |
2,000,000 | | | | 1.875% due 3/31/22 | | | 1,945,156 | |
500,000 | | | | 1.625% due 8/15/22 | | | 479,434 | |
20,000,000 | | | | 1.875% due 9/30/22 | | | 19,349,219 | |
4,000,000 | | | | 1.875% due 10/31/22 | | | 3,867,656 | |
6,000,000 | | | | 1.750% due 1/31/23 | | | 5,752,500 | |
5,000,000 | | | | 1.500% due 3/31/23 | | | 4,724,805 | |
6,000,000 | | | | 1.625% due 5/31/23 | | | 5,691,328 | |
6,000,000 | | | | 1.375% due 8/31/23 | | | 5,595,469 | |
5,000,000 | | | | 1.625% due 10/31/23 | | | 4,716,406 | |
6,000,000 | | | | 2.250% due 12/31/23 | | | 5,845,313 | |
5,000,000 | | | | 2.750% due 2/15/24 | | | 5,003,711 | |
10,210,000 | | | | 2.125% due 2/29/24 | | | 9,859,430 | |
9,500,000 | | | | 2.125% due 3/31/24 | | | 9,167,129 | |
2,000,000 | | | | 2.500% due 5/15/24 | | | 1,970,938 | |
900,000 | | | | 2.000% due 5/31/24 | | | 860,660 | |
4,000,000 | | | | 2.000% due 6/30/24 | | | 3,822,188 | |
1,000,000 | | | | 1.875% due 8/31/24 | | | 947,070 | |
400,000 | | | | 2.125% due 9/30/24 | | | 384,156 | |
4,000,000 | | | | 2.250% due 11/15/24 | | | 3,866,406 | |
4,000,000 | | | | 2.125% due 11/30/24 | | | 3,835,781 | |
2,400,000 | | | | 2.250% due 12/31/24 | | | 2,318,531 | |
6,500,000 | | | | 2.250% due 11/15/25 | | | 6,236,953 | |
11,780,000 | | | | 1.625% due 5/15/26 | | | 10,719,800 | |
400,000 | | | | 2.375% due 5/15/27 | | | 383,656 | |
1,000,000 | | | | 2.250% due 8/15/27 | | | 947,383 | |
1,500,000 | | | | 2.250% due 11/15/27 | | | 1,419,316 | |
| | | | | | | | |
| | | | TOTAL U.S. GOVERNMENT OBLIGATIONS | | | 315,688,138 | |
| | | | | | | | |
U.S. GOVERNMENT AGENCIES - 0.6% | | | | |
4,500,000 | | | | Federal Home Loan Bank (FHLB), 1.375% due 3/18/19 | | | 4,465,246 | |
| | | | Federal Home Loan Mortgage Corp. (FHLMC): | | | | |
2,000,000 | | | | 2.375% due 1/13/22 | | | 1,982,820 | |
1,300,000 | | | | 6.250% due 7/15/32 | | | 1,742,781 | |
500,000 | | | | Federal National Mortgage Association (FNMA),
1.875% due 9/24/26 | | | 455,164 | |
| | | | | | | | |
| | | | TOTAL U.S. GOVERNMENT AGENCIES | | | 8,646,011 | |
| | | | | | | | |
| | | | TOTAL U.S. GOVERNMENT AGENCIES & OBLIGATIONS (Cost - $332,292,810) | | | 324,334,149 | |
| | | | | | | | |
See Notes to Financial Statements.
82
Schedules of Investments
(continued)
Destinations Core Fixed Income Fund
| | | | | | | | |
Face Amount/Units | | | | Security | | Value | |
MORTGAGE-BACKED SECURITIES - 21.6% | | | | |
FHLMC - 6.9% | |
| | | | Federal Home Loan Mortgage Corp. (FHLMC), Gold: | | | | |
$ 4,100,000 | | | | 2.500% due 3/1/33 - 3/1/48(a) | | $ | 3,991,419 | |
14,900,000 | | | | 3.000% due 3/1/33 - 3/1/48(a) | | | 14,557,345 | |
37,415,646 | | | | 3.000% due 3/1/42 - 2/1/47 | | | 36,388,885 | |
13,625,000 | | | | 3.500% due 3/1/33 - 3/1/48(a) | | | 13,634,411 | |
25,278,802 | | | | 3.500% due 12/1/46 | | | 25,308,572 | |
4,577,341 | | | | 4.000% due 5/1/46 | | | 4,720,288 | |
3,550,000 | | | | 4.000% due 3/1/48(a) | | | 3,636,823 | |
1,175,000 | | | | 4.500% due 3/1/43(a) | | | 1,230,859 | |
| | | | | | | | |
| | | | TOTAL FHLMC | | | 103,468,602 | |
| | | | | | | | |
FNMA - 11.9% | |
| | | | Federal National Mortgage Association (FNMA): | | | | |
1,700,000 | | | | 2.490% due 9/1/28 | | | 1,579,961 | |
5,650,000 | | | | 2.500% due 1/1/33 - 3/1/47(a) | | | 5,498,733 | |
19,942,483 | | | | 2.500% due 2/1/47 | | | 18,643,970 | |
19,850,000 | | | | 3.000% due 3/1/33 - 3/1/48(a) | | | 19,380,490 | |
42,461,971 | | | | 3.000% due 2/1/43 - 6/1/43 | | | 41,505,031 | |
30,749,980 | | | | 3.500% due 2/1/32 - 3/1/47 | | | 30,801,942 | |
16,450,000 | | | | 3.500% due 3/1/33 - 3/1/48(a) | | | 16,427,278 | |
4,400,000 | | | | 4.000% due 3/1/33 - 3/1/48(a) | | | 4,505,694 | |
23,809,305 | | | | 4.000% due 6/1/44 - 1/1/48 | | | 24,494,420 | |
7,451,593 | | | | 4.500% due 10/1/47 | | | 7,823,233 | |
7,848,863 | | | | 5.000% due 4/1/40 - 3/1/47 | | | 8,490,923 | |
| | | | | | | | |
| | | | TOTAL FNMA | | | 179,151,675 | |
| | | | | | | | |
GNMA - 2.8% | |
| | | | Government National Mortgage Association II (GNMA): | | | | |
500,000 | | | | 2.500% due 3/1/48(a) | | | 472,813 | |
12,800,000 | | | | 3.000% due 3/1/48(a) | | | 12,515,000 | |
12,387,223 | | | | 3.500% due 4/20/47 - 12/20/47 | | | 12,472,216 | |
7,050,000 | | | | 3.500% due 3/1/48(a) | | | 7,089,381 | |
7,208,540 | | | | 4.000% due 9/20/45 - 11/20/47 | | | 7,416,437 | |
450,000 | | | | 4.000% due 3/1/48(a) | | | 461,672 | |
472,715 | | | | 4.500% due 12/20/47 - 1/20/48 | | | 493,599 | |
275,000 | | | | 4.500% due 3/1/48(a) | | | 285,828 | |
| | | | | | | | |
| | | | TOTAL GNMA | | | 41,206,946 | |
| | | | | | | | |
| | | | TOTAL MORTGAGE-BACKED SECURITIES (Cost - $329,588,329) | | | 323,827,223 | |
| | | | | | | | |
See Notes to Financial Statements.
83
Schedules of Investments
(continued)
Destinations Core Fixed Income Fund
| | | | | | | | |
Face Amount/Units | | | | Security | | Value | |
CORPORATE BONDS & NOTES - 19.0% | |
Basic Materials - 0.5% | |
$ 250,000 | | | | Agrium Inc., Senior Unsecured Notes, 6.125% due 1/15/41 | | $ | 301,584 | |
350,000 | | | | Air Products & Chemicals Inc., Senior Unsecured Notes,
3.000% due 11/3/21 | | | 349,806 | |
100,000 | | | | Barrick North America Finance LLC, Company Guaranteed Notes, 5.750% due 5/1/43 | | | 118,738 | |
400,000 | | | | BHP Billiton Finance USA Ltd., Company Guaranteed Notes, 4.125% due 2/24/42 | | | 412,390 | |
300,000 | | | | Celulosa Arauco y Constitucion SA, Senior Unsecured Notes, 4.750% due 1/11/22 | | | 308,292 | |
| | | | Dow Chemical Co., Senior Unsecured Notes: | | | | |
100,000 | | | | 4.250% due 11/15/20 | | | 103,033 | |
250,000 | | | | 4.625% due 10/1/44 | | | 256,885 | |
465,000 | | | | FMG Resources August 2006 Pty Ltd., Company Guaranteed Notes, 4.750% due 5/15/22(b) | | | 464,651 | |
905,000 | | | | Georgia-Pacific LLC, Senior Unsecured Notes,
3.600% due 3/1/25(b) | | | 910,737 | |
| | | | International Paper Co., Senior Unsecured Notes: | | | | |
500,000 | | | | 3.000% due 2/15/27 | | | 466,893 | |
100,000 | | | | 4.400% due 8/15/47 | | | 98,374 | |
| | | | Inversiones CMPC SA, Company Guaranteed Notes: | | | | |
100,000 | | | | 6.125% due 11/5/19 | | | 104,902 | |
300,000 | | | | 4.500% due 4/25/22 | | | 308,549 | |
500,000 | | | | LYB International Finance II BV, Company Guaranteed Notes, 3.500% due 3/2/27 | | | 486,710 | |
250,000 | | | | Monsanto Co., Senior Unsecured Notes, 4.400% due 7/15/44 | | | 247,023 | |
465,000 | | | | Mosaic Co., Senior Unsecured Notes, 4.050% due 11/15/27 | | | 450,690 | |
750,000 | | | | Rio Tinto Finance USA PLC, Company Guaranteed Notes,
2.875% due 8/21/22 | | | 742,174 | |
250,000 | | | | Sherwin-Williams Co., Senior Unsecured Notes,
2.250% due 5/15/20 | | | 246,557 | |
| | | | Southern Copper Corp., Senior Unsecured Notes: | | | | |
125,000 | | | | 3.875% due 4/23/25 | | | 125,360 | |
125,000 | | | | 6.750% due 4/16/40 | | | 155,990 | |
700,000 | | | | UPL Corp., Ltd, Senior Unsecured Notes, 3.250% due 10/13/21 | | | 690,577 | |
500,000 | | | | Vale Overseas Ltd., Company Guaranteed Notes,
6.250% due 8/10/26 | | | 563,850 | |
| | | | | | | | |
| | | | Total Basic Materials | | | 7,913,765 | |
| | | | | | | | |
See Notes to Financial Statements.
84
Schedules of Investments
(continued)
Destinations Core Fixed Income Fund
| | | | | | | | |
Face Amount/Units | | | | Security | | Value | |
Communications - 2.0% | |
| | | | 21st Century Fox America Inc., Company Guaranteed Notes: | | | | |
$ 250,000 | | | | 3.375% due 11/15/26 | | $ | 246,604 | |
250,000 | | | | 4.750% due 11/15/46 | | | 269,902 | |
| | | | Alibaba Group Holding Ltd., Senior Unsecured Notes: | | | | |
300,000 | | | | 3.125% due 11/28/21 | | | 300,153 | |
200,000 | | | | 4.000% due 12/6/37 | | | 191,779 | |
415,000 | | | | Altice US Finance I Corp., Senior Secured Notes,
5.375% due 7/15/23(b) | | | 421,744 | |
| | | | Amazon.com Inc., Senior Unsecured Notes: | | | | |
620,000 | | | | 2.800% due 8/22/24(b) | | | 600,304 | |
885,000 | | | | 3.800% due 12/5/24 | | | 908,106 | |
250,000 | | | | 3.150% due 8/22/27(b) | | | 240,986 | |
250,000 | | | | 4.050% due 8/22/47(b) | | | 248,638 | |
| | | | America Movil SAB de CV: | | | | |
200,000 | | | | Company Guaranteed Notes, 5.000% due 3/30/20 | | | 207,737 | |
250,000 | | | | Senior Unsecured Notes, 4.375% due 7/16/42 | | | 251,809 | |
| | | | AT&T Inc., Senior Unsecured Notes: | | | | |
500,000 | | | | 2.450% due 6/30/20 | | | 494,670 | |
500,000 | | | | 3.200% due 3/1/22 | | | 496,946 | |
250,000 | | | | 3.800% due 3/1/24 | | | 250,918 | |
715,000 | | | | 3.400% due 5/15/25 | | | 688,372 | |
250,000 | | | | 4.250% due 3/1/27 | | | 249,962 | |
150,000 | | | | 3.900% due 8/14/27 | | | 148,820 | |
100,000 | | | | 4.300% due 2/15/30(b) | | | 97,788 | |
250,000 | | | | 5.250% due 3/1/37 | | | 259,118 | |
150,000 | | | | 4.900% due 8/14/37 | | | 150,316 | |
250,000 | | | | 5.350% due 9/1/40 | | | 258,729 | |
200,000 | | | | 5.150% due 2/14/50 | | | 199,609 | |
500,000 | | | | 5.700% due 3/1/57 | | | 530,200 | |
1,500,000 | | | | Axiata SPV2 Bhd, Senior Unsecured Notes, 3.466% due 11/19/20 | | | 1,507,763 | |
600,000 | | | | Bharti Airtel International Netherlands BV, Company Guaranteed Notes, 5.125% due 3/11/23 | | | 621,377 | |
1,000,000 | | | | Bharti Airtel Ltd., Senior Unsecured Notes, 4.375% due 6/10/25 | | | 986,538 | |
| | | | CBS Corp., Company Guaranteed Notes: | | | | |
100,000 | | | | 3.375% due 3/1/22 | | | 100,074 | |
100,000 | | | | 5.900% due 10/15/40 | | | 114,292 | |
| | | | CCO Holdings LLC / CCO Holdings Capital Corp., Senior Unsecured Notes: | | | | |
105,000 | | | | 4.000% due 3/1/23(b) | | | 102,244 | |
235,000 | | | | 5.125% due 5/1/23(b) | | | 239,406 | |
See Notes to Financial Statements.
85
Schedules of Investments
(continued)
Destinations Core Fixed Income Fund
| | | | | | | | |
Face Amount/Units | | | | Security | | Value | |
Communications - 2.0% - (continued) | |
| | | | Charter Communications Operating LLC / Charter Communications Operating Capital, Senior Secured Notes: | | | | |
$ 490,000 | | | | 4.464% due 7/23/22 | | $ | 501,658 | |
250,000 | | | | 4.908% due 7/23/25 | | | 257,451 | |
250,000 | | | | 6.484% due 10/23/45 | | | 281,627 | |
245,000 | | | | Cincinnati Bell Inc., Company Guaranteed Notes, 7.000% due 7/15/24(b) | | | 232,505 | |
| | | | Cisco Systems Inc., Senior Unsecured Notes: | | | | |
500,000 | | | | 2.200% due 9/20/23 | | | 477,355 | |
100,000 | | | | 3.625% due 3/4/24 | | | 102,467 | |
| | | | Comcast Corp., Company Guaranteed Notes: | | | | |
250,000 | | | | 3.000% due 2/1/24 | | | 244,632 | |
250,000 | | | | 3.300% due 2/1/27 | | | 241,441 | |
150,000 | | | | 4.400% due 8/15/35 | | | 152,460 | |
500,000 | | | | 3.400% due 7/15/46 | | | 428,775 | |
100,000 | | | | 3.999% due 11/1/49 | | | 92,841 | |
75,000 | | | | CSC Holdings LLC, Senior Unsecured Notes, 6.750% due 11/15/21 | | | 78,891 | |
500,000 | | | | Digicel Group Ltd., Senior Unsecured Notes, 7.125% due 4/1/22 | | | 432,500 | |
| | | | Discovery Communications LLC, Company Guaranteed Notes: | | | | |
200,000 | | | | 2.950% due 3/20/23 | | | 193,345 | |
400,000 | | | | 3.800% due 3/13/24 | | | 397,047 | |
| | | | eBay Inc., Senior Unsecured Notes: | | | | |
450,000 | | | | 2.750% due 1/30/23 | | | 435,489 | |
100,000 | | | | 4.000% due 7/15/42 | | | 88,288 | |
890,000 | | | | Expedia Inc., Company Guaranteed Notes, 3.800% due 2/15/28. | | | 828,370 | |
250,000 | | | | Grupo Televisa SAB, Senior Unsecured Notes, 4.625% due 1/30/26 | | | 255,274 | |
465,000 | | | | Level 3 Financing Inc., Company Guaranteed Notes, 5.375% due 8/15/22 | | | 469,650 | |
210,000 | | | | Nexstar Broadcasting Inc., Company Guaranteed Notes, 5.625% due 8/1/24(b) | | | 211,050 | |
100,000 | | | | Omnicom Group Inc., Company Guaranteed Notes, 3.600% due 4/15/26 | | | 97,608 | |
235,000 | | | | Outfront Media Capital LLC / Outfront Media Capital Corp., Company Guaranteed Notes, 5.250% due 2/15/22 | | | 239,994 | |
100,000 | | | | Rogers Communications Inc., Company Guaranteed Notes, 5.000% due 3/15/44 | | | 109,458 | |
600,000 | | | | SingTel Group Treasury Pte Ltd., Company Guaranteed Notes, 4.500% due 9/8/21 | | | 628,909 | |
See Notes to Financial Statements.
86
Schedules of Investments
(continued)
Destinations Core Fixed Income Fund
| | | | | | | | |
Face Amount/Units | | | | Security | | Value | |
Communications - 2.0% - (continued) | |
| | | | Sirius XM Radio Inc., Company Guaranteed Notes: | | | | |
$ 185,000 | | | | 3.875% due 8/1/22(b) | | $ | 181,300 | |
150,000 | | | | 5.375% due 7/15/26(b) | | | 151,875 | |
350,000 | | | | Sprint Corp., Company Guaranteed Notes, 7.125% due 6/15/24 | | | 344,531 | |
1,000,000 | | | | Telefonica Chile SA, Senior Unsecured Notes, 3.875% due 10/12/22 | | | 1,005,362 | |
| | | | Telefonica Emisiones SAU, Company Guaranteed Notes: | | | | |
250,000 | | | | 4.103% due 3/8/27 | | | 248,247 | |
200,000 | | | | 5.213% due 3/8/47 | | | 210,217 | |
300,000 | | | | TELUS Corp., Senior Unsecured Notes, 3.700% due 9/15/27 | | | 294,892 | |
| | | | Tencent Holdings Ltd., Senior Unsecured Notes: | | | | |
600,000 | | | | 3.375% due 5/2/19 | | | 604,399 | |
200,000 | | | | 2.875% due 2/11/20 | | | 200,139 | |
1,000,000 | | | | 2.344% (3-Month USD-LIBOR + 0.605%) due 1/19/23(b)(c) | | | 1,002,077 | |
| | | | Time Warner Cable LLC, Senior Secured Notes: | | | | |
500,000 | | | | 4.000% due 9/1/21 | | | 504,823 | |
150,000 | | | | 7.300% due 7/1/38 | | | 179,876 | |
250,000 | | | | 4.500% due 9/15/42 | | | 225,835 | |
| | | | Time Warner Inc., Company Guaranteed Notes: | | | | |
500,000 | | | | 3.800% due 2/15/27 | | | 483,878 | |
250,000 | | | | 4.850% due 7/15/45 | | | 249,859 | |
420,000 | | | | Tribune Media Co., Company Guaranteed Notes, 5.875% due 7/15/22 | | | 428,400 | |
| | | | Verizon Communications Inc., Senior Unsecured Notes: | | | | |
500,000 | | | | 2.946% due 3/15/22 | | | 493,247 | |
520,000 | | | | 3.500% due 11/1/24 | | | 515,454 | |
250,000 | | | | 4.125% due 3/16/27 | | | 253,973 | |
500,000 | | | | 5.250% due 3/16/37 | | | 529,899 | |
750,000 | | | | 5.012% due 4/15/49 | | | 761,074 | |
75,000 | | | | 4.672% due 3/15/55 | | | 70,046 | |
200,000 | | | | Viacom Inc., Senior Unsecured Notes, 5.850% due 9/1/43 | | | 218,429 | |
250,000 | | | | Vodafone Group PLC, Senior Unsecured Notes, 4.375% due 2/19/43 | | | 239,519 | |
| | | | Walt Disney Co., Senior Unsecured Notes: | | | | |
500,000 | | | | 1.950% due 3/4/20 | | | 494,063 | |
500,000 | | | | 2.450% due 3/4/22 | | | 491,194 | |
125,000 | | | | 3.150% due 9/17/25 | | | 123,683 | |
| | | | | | | | |
| | | | Total Communications. | | | 29,370,280 | |
| | | | | | | | |
See Notes to Financial Statements.
87
Schedules of Investments
(continued)
Destinations Core Fixed Income Fund
| | | | | | | | |
Face Amount/Units | | | | Security | | Value | |
Consumer Cyclical - 1.2% | |
$ 435,000 | | | | 1011778 BC ULC / New Red Finance Inc., Senior Secured Notes, 4.250% due 5/15/24(b) | | $ | 415,425 | |
| | | | American Honda Finance Corp., Senior Unsecured Notes: | | | | |
500,000 | | | | 2.000% due 2/14/20 | | | 493,628 | |
500,000 | | | | 2.900% due 2/16/24 | | | 491,117 | |
445,000 | | | | Caesars Resort Collection LLC / CRC Finco Inc., Company Guaranteed Notes, 5.250% due 10/15/25(b) | | | 434,987 | |
300,000 | | | | Cintas Corp. No 2, Company Guaranteed Notes, 2.900% due 4/1/22 | | | 297,157 | |
| | | | Delta Air Lines Inc., Senior Unsecured Notes: | | | | |
300,000 | | | | 2.875% due 3/13/20 | | | 299,275 | |
560,000 | | | | 3.625% due 3/15/22 | | | 561,245 | |
250,000 | | | | Ford Motor Co., Senior Unsecured Notes, 5.291% due 12/8/46 | | | 245,900 | |
| | | | Ford Motor Credit Co. LLC, Senior Unsecured Notes: | | | | |
500,000 | | | | 2.681% due 1/9/20 | | | 496,450 | |
500,000 | | | | 3.810% due 1/9/24 | | | 492,891 | |
| | | | General Motors Co., Senior Unsecured Notes: | | | | |
205,000 | | | | 2.593% (3-Month USD-LIBOR + 0.800%) due 8/7/20(c) | | | 206,426 | |
100,000 | | | | 6.750% due 4/1/46 | | | 118,123 | |
| | | | General Motors Financial Co., Inc., Company Guaranteed Notes: | | | | |
100,000 | | | | 3.150% due 1/15/20 | | | 100,154 | |
500,000 | | | | 3.450% due 1/14/22 | | | 497,357 | |
505,000 | | | | 2.686% (3-Month USD-LIBOR + 0.990%) due 1/5/23(c) | | | 506,404 | |
415,000 | | | | 3.950% due 4/13/24 | | | 414,003 | |
500,000 | | | | 4.350% due 1/17/27 | | | 498,641 | |
1,500,000 | | | | Gohl Capital Ltd., Company Guaranteed Notes, 4.250% due 1/24/27 | | | 1,483,655 | |
440,000 | | | | Hilton Domestic Operating Co., Inc., Company Guaranteed Notes, 4.250% due 9/1/24 | | | 432,300 | |
| | | | Home Depot Inc., Senior Unsecured Notes: | | | | |
250,000 | | | | 2.625% due 6/1/22 | | | 246,853 | |
250,000 | | | | 2.125% due 9/15/26 | | | 225,696 | |
250,000 | | | | 3.500% due 9/15/56 | | | 220,693 | |
250,000 | | | | Lowe’s Cos., Inc., Senior Unsecured Notes, 3.700% due 4/15/46 | | | 230,960 | |
440,000 | | | | LTF Merger Sub Inc., Company Guaranteed Notes, 8.500% due 6/15/23(b) | | | 460,900 | |
150,000 | | | | Macy’s Retail Holdings Inc., Company Guaranteed Notes, 4.500% due 12/15/34 | | | 130,456 | |
250,000 | | | | McDonald’s Corp., Senior Unsecured Notes: | | | | |
| | | | 3.500% due 3/1/27 | | | 246,244 | |
See Notes to Financial Statements.
88
Schedules of Investments
(continued)
Destinations Core Fixed Income Fund
| | | | | | | | |
Face Amount/Units | | | | Security | | Value | |
Consumer Cyclical - 1.2% - (continued) | |
$ 75,000 | | | | 4.875% due 12/9/45 | | $ | 81,229 | |
250,000 | | | | 4.450% due 3/1/47 | | | 254,460 | |
435,000 | | | | NCL Corp., Ltd, Senior Unsecured Notes, 4.750% due 12/15/21(b) | | | 444,244 | |
| | | | Newell Brands Inc., Senior Unsecured Notes: | | | | |
250,000 | | | | 3.150% due 4/1/21 | | | 247,383 | |
125,000 | | | | 5.375% due 4/1/36 | | | 132,673 | |
345,000 | | | | 5.500% due 4/1/46 | | | 366,765 | |
300,000 | | | | Nordstrom Inc., Senior Unsecured Notes, 4.000% due 3/15/27(d) | | | 292,958 | |
300,000 | | | | PACCAR Financial Corp., Senior Unsecured Notes, 1.950% due 2/27/20 | | | 296,178 | |
435,000 | | | | Penske Automotive Group Inc., Company Guaranteed Notes, 3.750% due 8/15/20 | | | 431,737 | |
400,000 | | | | SACI Falabella, Senior Unsecured Notes, 3.750% due 4/30/23 | | | 400,749 | |
| | | | Scientific Games International Inc., Senior Secured Notes: | | | | |
95,000 | | | | 7.000% due 1/1/22(b) | | | 99,988 | |
235,000 | | | | 5.000% due 10/15/25(b) | | | 232,356 | |
550,000 | | | | Six Flags Entertainment Corp., Company Guaranteed Notes, 4.875% due 7/31/24(b) | | | 548,675 | |
| | | | Target Corp., Senior Unsecured Notes: | | | | |
100,000 | | | | 2.900% due 1/15/22 | | | 100,114 | |
125,000 | | | | 3.500% due 7/1/24 | | | 127,564 | |
100,000 | | | | 3.900% due 11/15/47 | | | 95,623 | |
445,000 | | | | Tempur Sealy International Inc., Company Guaranteed Notes, 5.625% due 10/15/23 | | | 449,450 | |
500,000 | | | | Toyota Motor Credit Corp., Senior Unsecured Notes, 1.550% due 10/18/19 | | | 492,983 | |
440,000 | | | | United Continental Holdings Inc., Company Guaranteed Notes, 4.250% due 10/1/22 | | | 438,625 | |
500,000 | | | | Walgreens Boots Alliance Inc., Senior Unsecured Notes, 3.450% due 6/1/26 | | | 473,419 | |
| | | | Walmart Inc., Senior Unsecured Notes: | | | | |
250,000 | | | | 2.550% due 4/11/23 | | | 244,875 | |
250,000 | | | | 3.300% due 4/22/24 | | | 252,597 | |
250,000 | | | | 4.300% due 4/22/44 | | | 269,601 | |
100,000 | | | | WW Grainger Inc., Senior Unsecured Notes, 4.200% due 5/15/47 | | | 100,985 | |
300,000 | | | | Wyndham Worldwide Corp., Senior Unsecured Notes, 4.150% due 4/1/24 | | | 300,631 | |
| | | | | | | | |
| | | | Total Consumer Cyclical | | | 17,422,802 | |
| | | | | | | | |
See Notes to Financial Statements.
89
Schedules of Investments
(continued)
Destinations Core Fixed Income Fund
| | | | | | | | |
Face Amount/Units | | | | Security | | Value | |
Consumer Non-cyclical - 2.9% | |
| | | | Abbott Laboratories, Senior Unsecured Notes: | | | | |
$ 250,000 | | | | 3.750% due 11/30/26 | | $ | 247,940 | |
250,000 | | | | 4.900% due 11/30/46 | | | 268,283 | |
| | | | AbbVie Inc., Senior Unsecured Notes: | | | | |
395,000 | | | | 3.200% due 11/6/22 | | | 391,983 | |
500,000 | | | | 2.850% due 5/14/23 | | | 484,938 | |
475,000 | | | | 4.450% due 5/14/46 | | | 471,155 | |
100,000 | | | | Actavis Inc., Company Guaranteed Notes, 3.250% due 10/1/22 | | | 98,640 | |
| | | | Adani Ports & Special Economic Zone Ltd., Senior Unsecured Notes: | | | | |
200,000 | | | | 3.500% due 7/29/20 | | | 200,097 | |
400,000 | | | | 3.950% due 1/19/22 | | | 400,523 | |
100,000 | | | | Aetna Inc., Senior Unsecured Notes, 3.875% due 8/15/47 | | | 88,489 | |
| | | | Allergan Funding SCS, Company Guaranteed Notes: | | | | |
250,000 | | | | 2.450% due 6/15/19 | | | 248,939 | |
140,000 | | | | 3.850% due 6/15/24 | | | 139,845 | |
925,000 | | | | 3.800% due 3/15/25 | | | 912,758 | |
100,000 | | | | 4.550% due 3/15/35 | | | 99,782 | |
84,000 | | | | 4.750% due 3/15/45 | | | 83,319 | |
250,000 | | | | Altria Group Inc., Company Guaranteed Notes, 3.875% due 9/16/46 | | | 230,630 | |
| | | | Amgen Inc., Senior Unsecured Notes: | | | | |
500,000 | | | | 2.600% due 8/19/26 | | | 454,544 | |
150,000 | | | | 4.950% due 10/1/41 | | | 162,214 | |
250,000 | | | | 4.663% due 6/15/51 | | | 252,268 | |
| | | | Anheuser-Busch InBev Finance Inc., Company Guaranteed Notes: | | | | |
975,000 | | | | 2.650% due 2/1/21 | | | 965,950 | |
300,000 | | | | 3.300% due 2/1/23 | | | 298,721 | |
125,000 | | | | 3.650% due 2/1/26 | | | 123,873 | |
450,000 | | | | 4.700% due 2/1/36 | | | 472,886 | |
| | | | Anheuser-Busch InBev Worldwide Inc., Company Guaranteed Notes: | | | | |
350,000 | | | | 4.950% due 1/15/42 | | | 379,372 | |
200,000 | | | | 3.750% due 7/15/42 | | | 183,555 | |
| | | | Anthem Inc., Senior Unsecured Notes: | | | | |
765,000 | | | | 3.300% due 1/15/23 | | | 758,945 | |
100,000 | | | | 4.650% due 1/15/43 | | | 101,897 | |
200,000 | | | | 4.375% due 12/1/47 | | | 195,394 | |
| | | | AstraZeneca PLC, Senior Unsecured Notes: | | | | |
515,000 | | | | 2.375% due 6/12/22 | | | 499,125 | |
500,000 | | | | 3.375% due 11/16/25 | | | 492,004 | |
100,000 | | | | 4.375% due 11/16/45 | | | 100,805 | |
See Notes to Financial Statements.
90
Schedules of Investments
(continued)
Destinations Core Fixed Income Fund
| | | | | | | | |
Face Amount/Units | | | | Security | | Value | |
Consumer Non-cyclical - 2.9% - (continued) | |
$ 350,000 | | | | Avantor Inc., Senior Secured Notes, 6.000% due 10/1/24(b) | | $ | 350,000 | |
475,000 | | | | B&G Foods Inc., Company Guaranteed Notes, 5.250% due 4/1/25 | | | 457,187 | |
100,000 | | | | BAT Capital Corp., Company Guaranteed Notes,
3.222% due 8/15/24(b) | | | 96,325 | |
| | | | Becton Dickinson & Co., Senior Unsecured Notes: | | | | |
500,000 | | | | 2.133% due 6/6/19 | | | 495,955 | |
880,000 | | | | 2.894% due 6/6/22 | | | 857,404 | |
200,000 | | | | 3.363% due 6/6/24 | | | 193,581 | |
250,000 | | | | 3.700% due 6/6/27 | | | 239,078 | |
100,000 | | | | Biogen Inc., Senior Unsecured Notes, 5.200% due 9/15/45 | | | 108,971 | |
250,000 | | | | Bristol-Myers Squibb Co., Senior Unsecured Notes,
3.250% due 2/27/27 | | | 246,855 | |
| | | | Cardinal Health Inc., Senior Unsecured Notes: | | | | |
875,000 | | | | 3.410% due 6/15/27 | | | 822,528 | |
250,000 | | | | 4.368% due 6/15/47 | | | 234,090 | |
| | | | Celgene Corp., Senior Unsecured Notes: | | | | |
100,000 | | | | 2.750% due 2/15/23 | | | 96,701 | |
500,000 | | | | 3.875% due 8/15/25 | | | 498,581 | |
100,000 | | | | 5.000% due 8/15/45 | | | 104,214 | |
885,000 | | | | 4.350% due 11/15/47 | | | 833,536 | |
425,000 | | | | Centene Corp., Senior Unsecured Notes, 4.750% due 1/15/25 | | | 422,610 | |
200,000 | | | | Children’s Hospital Corp., Company Guaranteed Notes,
4.115% due 1/1/47 | | | 202,693 | |
| | | | Coca-Cola Co., Senior Unsecured Notes: | | | | |
500,000 | | | | 1.375% due 5/30/19 | | | 493,668 | |
250,000 | | | | 2.200% due 5/25/22 | | | 242,603 | |
150,000 | | | | Coca-Cola Femsa SAB de CV, Company Guaranteed Notes,
3.875% due 11/26/23 | | | 153,701 | |
350,000 | | | | Constellation Brands Inc., Company Guaranteed Notes,
2.700% due 5/9/22 | | | 340,935 | |
500,000 | | | | Coventry Health Care Inc., Senior Unsecured Notes,
5.450% due 6/15/21 | | | 531,944 | |
| | | | CVS Health Corp., Senior Unsecured Notes: | | | | |
125,000 | | | | 2.125% due 6/1/21 | | | 120,586 | |
100,000 | | | | 3.500% due 7/20/22 | | | 99,623 | |
500,000 | | | | 2.875% due 6/1/26 | | | 455,856 | |
138,000 | | | | Duke University Health System Inc., Senior Unsecured Notes,
3.920% due 6/1/47 | | | 137,566 | |
1,200,000 | | | | Embotelladora Andina SA, Senior Unsecured Notes, 5.000% due 10/1/23 | | | 1,282,768 | |
540,440 | | | | ENA Norte Trust, Pass-Thru Certificates, 4.950% due 4/25/23 | | | 560,436 | |
See Notes to Financial Statements.
91
Schedules of Investments
(continued)
Destinations Core Fixed Income Fund
| | | | | | | | |
Face Amount/Units | | | | Security | | Value | |
Consumer Non-cyclical - 2.9% - (continued) | |
| | | | Estee Lauder Cos., Inc., Senior Unsecured Notes: | | | | |
$ 300,000 | | | | 1.800% due 2/7/20 | | $ | 295,528 | |
200,000 | | | | 4.150% due 3/15/47 | | | 204,863 | |
250,000 | | | | Express Scripts Holding Co., Company Guaranteed Notes, 4.800% due 7/15/46 | | | 248,967 | |
200,000 | | | | Fomento Economico Mexicano SAB de CV, Senior Unsecured Notes, 2.875% due 5/10/23 | | | 195,077 | |
| | | | Gilead Sciences Inc., Senior Unsecured Notes: | | | | |
500,000 | | | | 2.950% due 3/1/27 | | | 470,662 | |
250,000 | | | | 4.150% due 3/1/47 | | | 241,418 | |
500,000 | | | | HCA Inc., Senior Secured Notes, 4.250% due 10/15/19 | | | 506,250 | |
250,000 | | | | Humana Inc., Senior Unsecured Notes, 4.800% due 3/15/47 | | | 260,897 | |
375,000 | | | | inVentiv Group Holdings Inc. / inVentiv Health Inc./inVentiv Health Clinical Inc., Company | | | | |
| | | | Guaranteed Notes, 7.500% due 10/1/24(b) | | | 401,250 | |
475,000 | | | | JBS USA LUX SA / JBS USA Finance, Inc., Company Guaranteed Notes, 7.250% due 6/1/21(b) | | | 480,937 | |
| | | | Johnson & Johnson, Senior Unsecured Notes: | | | | |
250,000 | | | | 2.250% due 3/3/22 | | | 245,174 | |
150,000 | | | | 2.950% due 3/3/27 | | | 145,657 | |
250,000 | | | | 3.625% due 3/3/37 | | | 248,746 | |
| | | | Kraft Heinz Foods Co., Company Guaranteed Notes: | | | | |
970,000 | | | | 2.800% due 7/2/20 | | | 964,490 | |
500,000 | | | | 3.000% due 6/1/26 | | | 459,315 | |
250,000 | | | | 5.200% due 7/15/45 | | | 254,660 | |
200,000 | | | | Kroger Co., Senior Unsecured Notes, 4.450% due 2/1/47 | | | 188,173 | |
1,050,000 | | | | Laboratory Corp. of America Holdings, Senior Unsecured Notes, 3.600% due 2/1/25 | | | 1,033,115 | |
500,000 | | | | MARB BondCo PLC, Company Guaranteed Notes, 7.000% due 3/15/24(b) | | | 491,755 | |
| | | | Medtronic Global Holdings SCA, Company Guaranteed Notes: | | | | |
250,000 | | | | 1.700% due 3/28/19 | | | 247,908 | |
250,000 | | | | 3.350% due 4/1/27 | | | 246,704 | |
250,000 | | | | Medtronic Inc., Company Guaranteed Notes, 4.625% due 3/15/45 | | | 270,441 | |
250,000 | | | | Merck & Co., Inc., Senior Unsecured Notes, 3.700% due 2/10/45 | | | 242,667 | |
250,000 | | | | Merck Sharp & Dohme Corp., Company Guaranteed Notes, 5.000% due 6/30/19 | | | 257,819 | |
500,000 | | | | Molson Coors Brewing Co., Company Guaranteed Notes, 2.250% due 3/15/20 | | | 493,829 | |
300,000 | | | | Moody’s Corp., Senior Unsecured Notes, 2.750% due 12/15/21 | | | 295,671 | |
See Notes to Financial Statements.
92
Schedules of Investments
(continued)
Destinations Core Fixed Income Fund
| | | | | | | | |
Face Amount/Units | | | | Security | | Value | |
Consumer Non-cyclical - 2.9% - (continued) | |
| | | | Mylan NV, Company Guaranteed Notes: | | | | |
$ 250,000 | | | | 2.500% due 6/7/19 | | $ | 248,496 | |
250,000 | | | | 3.150% due 6/15/21 | | | 247,754 | |
250,000 | | | | 5.250% due 6/15/46 | | | 252,478 | |
10,000 | | | | Northwell Healthcare Inc., Secured Notes, 4.260% due 11/1/47 | | | 9,751 | |
| | | | Novartis Capital Corp., Company Guaranteed Notes: | | | | |
250,000 | | | | 1.800% due 2/14/20 | | | 246,355 | |
250,000 | | | | 2.400% due 5/17/22 | | | 244,633 | |
150,000 | | | | 3.100% due 5/17/27 | | | 146,707 | |
| | | | PepsiCo Inc., Senior Unsecured Notes: | | | | |
500,000 | | | | 2.750% due 3/5/22 | | | 496,891 | |
150,000 | | | | 2.375% due 10/6/26 | | | 138,181 | |
250,000 | | | | 3.450% due 10/6/46 | | | 226,989 | |
| | | | Pfizer Inc., Senior Unsecured Notes: | | | | |
500,000 | | | | 1.700% due 12/15/19 | | | 493,368 | |
250,000 | | | | 4.000% due 12/15/36 | | | 257,496 | |
250,000 | | | | 4.125% due 12/15/46 | | | 257,275 | |
| | | | Philip Morris International Inc., Senior Unsecured Notes: | | | | |
250,000 | | | | 2.000% due 2/21/20 | | | 246,283 | |
500,000 | | | | 2.625% due 2/18/22 | | | 489,772 | |
100,000 | | | | 4.125% due 3/4/43 | | | 97,035 | |
470,000 | | | | Pilgrim’s Pride Corp., Company Guaranteed Notes, 5.750% due 3/15/25(b) | | | 467,650 | |
420,000 | | | | Post Holdings Inc., Company Guaranteed Notes, 5.500% due 3/1/25(b) | | | 422,625 | |
247,000 | | | | Prime Security Services Borrower LLC / Prime Finance Inc., Secured Notes, 9.250% due 5/15/23(b) | | | 268,921 | |
| | | | Procter & Gamble Co., Senior Unsecured Notes: | | | | |
250,000 | | | | 1.750% due 10/25/19 | | | 247,449 | |
250,000 | | | | 1.900% due 11/1/19 | | | 247,915 | |
250,000 | | | | 3.500% due 10/25/47 | | | 233,715 | |
8,000 | | | | Providence St Joseph Health Obligated Group, Unsecured Notes, 3.930% due 10/1/48 | | | 7,815 | |
| | | | Reynolds American Inc., Company Guaranteed Notes: | | | | |
500,000 | | | | 6.875% due 5/1/20 | | | 540,010 | |
765,000 | | | | 4.000% due 6/12/22 | | | 780,969 | |
250,000 | | | | 5.850% due 8/15/45 | | | 289,558 | |
315,000 | | | | Select Medical Corp., Company Guaranteed Notes, 6.375% due 6/1/21 | | | 321,133 | |
| | | | Shire Acquisitions Investments Ireland DAC, Company Guaranteed Notes: | | | | |
500,000 | | | | 1.900% due 9/23/19 | | | 492,265 | |
See Notes to Financial Statements.
93
Schedules of Investments
(continued)
Destinations Core Fixed Income Fund
| | | | | | | | |
Face Amount/Units | | | | Security | | Value | |
Consumer Non-cyclical - 2.9% - (continued) | |
$ 125,000 | | | | 2.875% due 9/23/23 | | $ | 119,527 | |
480,000 | | | | Smithfield Foods Inc., Company Guaranteed Notes, 4.250% due 2/1/27(b) | | | 474,955 | |
7,000 | | | | Stanford Health Care, Unsecured Notes, 3.795% due 11/15/48 | | | 6,866 | |
| | | | Sysco Corp., Company Guaranteed Notes: | | | | |
500,000 | | | | 1.900% due 4/1/19 | | | 496,125 | |
570,000 | | | | 3.250% due 7/15/27 | | | 548,912 | |
975,000 | | | | Teva Pharmaceutical Finance Netherlands III BV, Company Guaranteed Notes, 2.800% due 7/21/23 | | | 853,410 | |
250,000 | | | | Thermo Fisher Scientific Inc., Senior Unsecured Notes, 4.100% due 8/15/47 | | | 239,787 | |
125,000 | | | | Total System Services Inc., Senior Unsecured Notes, 4.800% due 4/1/26 | | | 131,113 | |
150,000 | | | | Tyson Foods Inc., Senior Unsecured Notes, 4.550% due 6/2/47 | | | 152,028 | |
| | | | UnitedHealth Group Inc., Senior Unsecured Notes: | | | | |
750,000 | | | | 2.125% due 3/15/21 | | | 733,516 | |
250,000 | | | | 4.250% due 4/15/47 | | | 257,990 | |
415,000 | | | | Valeant Pharmaceuticals International Inc., Senior Secured Notes, 6.500% due 3/15/22(b) | | | 431,600 | |
125,000 | | | | Verisk Analytics Inc., Senior Unsecured Notes, 4.125% due 9/12/22 | | | 128,641 | |
450,000 | | | | WellCare Health Plans Inc., Senior Unsecured Notes, 5.250% due 4/1/25 | | | 455,454 | |
300,000 | | | | Western Union Co., Senior Unsecured Notes, 3.600% due 3/15/22 | | | 299,733 | |
| | | | | | | | |
| | | | Total Consumer Non-cyclical | | | 43,629,988 | |
| | | | | | | | |
Diversified - 0.1% | | | | |
| | | | CK Hutchison International 17 II Ltd., Company Guaranteed Notes: | | | | |
200,000 | | | | 2.250% due 9/29/20(b) | | | 196,399 | |
200,000 | | | | 2.250% due 9/29/20 | | | 196,380 | |
200,000 | | | | 2.750% due 3/29/23(b) | | | 192,655 | |
| | | | CK Hutchison International 17 Ltd., Company Guaranteed Notes: | | | | |
200,000 | | | | 2.875% due 4/5/22(b) | | | 195,410 | |
300,000 | | | | 2.875% due 4/5/22 | | | 293,078 | |
600,000 | | | | 3.500% due 4/5/27(b) | | | 578,813 | |
200,000 | | | | Hutchison Whampoa International 12 II Ltd., Company Guaranteed Notes, 3.250% due 11/8/22 | | | 198,390 | |
| | | | | | | | |
| | | | Total Diversified | | | 1,851,125 | |
| | | | | | | | |
See Notes to Financial Statements.
94
Schedules of Investments
(continued)
Destinations Core Fixed Income Fund
| | | | | | | | |
Face Amount/Units | | | | Security | | Value | |
Energy - 2.5% | |
| | | | Anadarko Petroleum Corp., Senior Unsecured Notes: | | | | |
$ 250,000 | | | | 5.550% due 3/15/26(d) | | $ | 273,028 | |
225,000 | | | | 6.600% due 3/15/46 | | | 280,505 | |
250,000 | | | | Apache Corp., Senior Unsecured Notes, 4.250% due 1/15/44 | | | 230,023 | |
145,000 | | | | Baker Hughes a GE Co. LLC / Baker Hughes Co.-Obligor Inc., Senior Unsecured Notes, 3.337% due 12/15/27 | | | 138,426 | |
| | | | BP Capital Markets PLC, Company Guaranteed Notes: | | | | |
250,000 | | | | 1.676% due 5/3/19 | | | 247,689 | |
100,000 | | | | 2.520% due 9/19/22 | | | 97,383 | |
500,000 | | | | 3.224% due 4/14/24 | | | 496,049 | |
1,500,000 | | | | BPRL International Singapore Pte Ltd., Company Guaranteed Notes, 4.375% due 1/18/27 | | | 1,490,559 | |
| | | | Canadian Natural Resources Ltd., Senior Unsecured Notes: | | | | |
940,000 | | | | 2.950% due 1/15/23 | | | 918,724 | |
125,000 | | | | 5.850% due 2/1/35 | | | 141,610 | |
500,000 | | | | Cenovus Energy Inc., Senior Unsecured Notes, 4.250% due 4/15/27 | | | 488,624 | |
230,000 | | | | Cheniere Energy Partners LP, Senior Secured Notes, 5.250% due 10/1/25(b) | | | 232,300 | |
| | | | Chevron Corp., Senior Unsecured Notes: | | | | |
250,000 | | | | 1.991% due 3/3/20 | | | 247,001 | |
250,000 | | | | 2.498% due 3/3/22 | | | 246,005 | |
200,000 | | | | CNOOC Finance 2012 Ltd., Company Guaranteed Notes, 3.875% due 5/2/22 | | | 202,624 | |
2,250,000 | | | | CNOOC Finance 2015 USA LLC, Company Guaranteed Notes, 3.500% due 5/5/25 | | | 2,190,604 | |
900,000 | | | | CNPC General Capital Ltd., Company Guaranteed Notes, 3.400% due 4/16/23 | | | 890,375 | |
800,000 | | | | CNPC HK Overseas Capital Ltd., Company Guaranteed Notes, 4.500% due 4/28/21 | | | 830,453 | |
| | | | ConocoPhillips Co., Company Guaranteed Notes: | | | | |
250,000 | | | | 4.950% due 3/15/26 | | | 271,566 | |
250,000 | | | | 5.950% due 3/15/46 | | | 315,230 | |
200,000 | | | | Delek & Avner Tamar Bond Ltd., Senior Secured Notes, 5.412% due 12/30/25(b) | | | 202,578 | |
| | | | Devon Energy Corp., Senior Unsecured Notes: | | | | |
75,000 | | | | 5.600% due 7/15/41 | | | 83,835 | |
250,000 | | | | 5.000% due 6/15/45 | | | 261,846 | |
500,000 | | | | Ecopetrol SA, Senior Unsecured Notes, 5.375% due 6/26/26. | | | 526,395 | |
| | | | Enbridge Inc., Senior Unsecured Notes: | | | | |
100,000 | | | | 4.000% due 10/1/23 | | | 102,115 | |
250,000 | | | | 3.700% due 7/15/27 | | | 241,459 | |
See Notes to Financial Statements.
95
Schedules of Investments
(continued)
Destinations Core Fixed Income Fund
| | | | | | | | |
Face Amount/Units | | | | Security | | Value | |
Energy - 2.5% - (continued) | |
$ 435,000 | | | | Energy Transfer Equity LP, Senior Secured Notes, 4.250% due 3/15/23 | | $ | 426,709 | |
| | | | Energy Transfer LP, Senior Unsecured Notes: | | | | |
695,000 | | | | 4.750% due 1/15/26 | | | 705,896 | |
250,000 | | | | 4.200% due 4/15/27 | | | 243,055 | |
250,000 | | | | 5.300% due 4/15/47 | | | 240,596 | |
| | | | Enterprise Products Operating LLC, Company Guaranteed Notes: | | | | |
500,000 | | | | 2.850% due 4/15/21 | | | 496,425 | |
720,000 | | | | 3.750% due 2/15/25 | | | 723,179 | |
250,000 | | | | 3.950% due 2/15/27(d) | | | 252,809 | |
250,000 | | | | 4.900% due 5/15/46 | | | 262,798 | |
950,000 | | | | EQT Corp., Senior Unsecured Notes, 3.900% due 10/1/27 | | | 906,827 | |
| | | | Exxon Mobil Corp., Senior Unsecured Notes: | | | | |
500,000 | | | | 1.708% due 3/1/19 | | | 496,980 | |
100,000 | | | | 3.567% due 3/6/45 | | | 94,856 | |
365,000 | | | | Gulfport Energy Corp., Company Guaranteed Notes, 6.375% due 5/15/25 | | | 359,981 | |
250,000 | | | | Halliburton Co., Senior Unsecured Notes, 5.000% due 11/15/45 | | | 270,272 | |
250,000 | | | | Hess Corp., Senior Unsecured Notes, 5.800% due 4/1/47 | | | 264,397 | |
| | | | Indian Oil Corp., Ltd, Senior Unsecured Notes: | | | | |
600,000 | | | | 5.625% due 8/2/21 | | | 642,197 | |
1,000,000 | | | | 5.750% due 8/1/23 | | | 1,087,531 | |
| | | | Kinder Morgan Energy Partners LP, Company Guaranteed Notes: | | | | |
125,000 | | | | 3.500% due 3/1/21 | | | 125,509 | |
100,000 | | | | 4.250% due 9/1/24 | | | 101,204 | |
150,000 | | | | 6.950% due 1/15/38 | | | 180,630 | |
75,000 | | | | 5.000% due 8/15/42 | | | 73,500 | |
| | | | Kinder Morgan Inc., Company Guaranteed Notes: | | | | |
550,000 | | | | 4.300% due 3/1/28 | | | 548,445 | |
250,000 | | | | 5.050% due 2/15/46 | | | 245,106 | |
250,000 | | | | Marathon Petroleum Corp., Senior Unsecured Notes, 5.125% due 3/1/21 | | | 264,790 | |
250,000 | | | | MPLX LP, Senior Unsecured Notes, 5.200% due 3/1/47. | | | 257,095 | |
| | | | Noble Energy Inc., Senior Unsecured Notes: | | | | |
150,000 | | | | 3.850% due 1/15/28 | | | 146,705 | |
150,000 | | | | 4.950% due 8/15/47 | | | 153,988 | |
| | | | Occidental Petroleum Corp., Senior Unsecured Notes: | | | | |
125,000 | | | | 4.100% due 2/1/21 | | | 129,266 | |
100,000 | | | | 4.400% due 4/15/46 | | | 101,899 | |
See Notes to Financial Statements.
96
Schedules of Investments
(continued)
Destinations Core Fixed Income Fund
| | | | | | | | |
Face Amount/Units | | | | Security | | Value | |
Energy - 2.5% - (continued) | |
$ 250,000 | | | | ONEOK Inc., Company Guaranteed Notes, 4.000% due 7/13/27 | | $ | 246,772 | |
| | | | ONGC Videsh Vankorneft Pte Ltd., Company Guaranteed Notes: | | | | |
200,000 | | | | 2.875% due 1/27/22 | | | 194,103 | |
1,500,000 | | | | 3.750% due 7/27/26 | | | 1,442,766 | |
535,000 | | | | Peabody Energy Corp., Senior Secured Notes, 6.000% due 3/31/22(b) | | | 548,375 | |
200,000 | | | | Petrobras Global Finance BV, Company Guaranteed Notes, 7.250% due 3/17/44 | | | 203,000 | |
| | | | Petroleos Mexicanos: | | | | |
| | | | Company Guaranteed Notes: | | | | |
750,000 | | | | 4.250% due 1/15/25 | | | 724,800 | |
500,000 | | | | 5.625% due 1/23/46 | | | 447,700 | |
100,000 | | | | 6.750% due 9/21/47 | | | 101,690 | |
465,000 | | | | Senior Unsecured Notes, 6.350% due 2/12/48(b) | | | 452,213 | |
1,500,000 | | | | Petronas Capital Ltd., Company Guaranteed Notes, 3.500% due 3/18/25 | | | 1,493,175 | |
200,000 | | | | Petronas Global Sukuk Ltd., Senior Unsecured Notes, 2.707% due 3/18/20 | | | 198,735 | |
| | | | Phillips 66, Company Guaranteed Notes: | | | | |
250,000 | | | | 4.300% due 4/1/22 | | | 259,590 | |
250,000 | | | | 4.875% due 11/15/44 | | | 262,025 | |
250,000 | | | | Plains All American Pipeline LP / PAA Finance Corp.,
Senior Unsecured Notes, 4.500% due 12/15/26 | | | 249,083 | |
355,000 | | | | QEP Resources Inc., Senior Unsecured Notes, 5.250% due 5/1/23. | | | 352,338 | |
1,650,000 | | | | Reliance Holding USA Inc., Company Guaranteed Notes, 5.400% due 2/14/22 | | | 1,746,351 | |
| | | | Sabine Pass Liquefaction LLC, Senior Secured Notes: | | | | |
100,000 | | | | 5.750% due 5/15/24 | | | 108,007 | |
600,000 | | | | 5.000% due 3/15/27 | | | 623,221 | |
400,000 | | | | 4.200% due 3/15/28 | | | 391,658 | |
| | | | Shell International Finance BV, Company Guaranteed Notes: | | | | |
250,000 | | | | 1.750% due 9/12/21 | | | 239,552 | |
250,000 | | | | 2.500% due 9/12/26 | | | 232,474 | |
100,000 | | | | 4.000% due 5/10/46 | | | 99,003 | |
250,000 | | | | 3.750% due 9/12/46 | | | 237,849 | |
| | | | Sinopec Group Overseas Development 2016 Ltd., Company Guaranteed Notes: | | | | |
200,000 | | | | 2.750% due 5/3/21 | | | 197,203 | |
1,500,000 | | | | 2.750% due 9/29/26 | | | 1,367,075 | |
See Notes to Financial Statements.
97
Schedules of Investments
(continued)
Destinations Core Fixed Income Fund
| | | | | | | | |
Face Amount/Units | | | | Security | | Value | |
Energy - 2.5% - (continued) | |
$ 200,000 | | | | Sinopec Group Overseas Development 2017 Ltd., Company Guaranteed Notes, 3.625% due 4/12/27(b) | | $ | 193,996 | |
100,000 | | | | Statoil ASA, Company Guaranteed Notes, 3.700% due 3/1/24 | | | 102,307 | |
| | | | Suncor Energy Inc., Senior Unsecured Notes: | | | | |
250,000 | | | | 3.600% due 12/1/24 | | | 248,987 | |
100,000 | | | | 6.500% due 6/15/38 | | | 128,267 | |
100,000 | | | | Sunoco Logistics Partners Operations LP, Company Guaranteed Notes, 4.250% due 4/1/24 | | | 100,368 | |
445,000 | | | | Sunoco LP / Sunoco Finance Corp., Company Guaranteed Notes, 4.875% due 1/15/23(b) | | | 441,663 | |
445,000 | | | | TerraForm Power Operating LLC, Company Guaranteed Notes, 4.250% due 1/31/23(b) | | | 436,100 | |
125,000 | | | | Total Capital International SA, Company Guaranteed Notes, 2.100% due 6/19/19 | | | 124,206 | |
| | | | TransCanada PipeLines Ltd., Senior Unsecured Notes: | | | | |
250,000 | | | | 4.875% due 1/15/26 | | | 271,503 | |
75,000 | | | | 7.625% due 1/15/39 | | | 106,610 | |
250,000 | | | | Transcontinental Gas Pipe Line Co. LLC, Senior Unsecured Notes, 7.850% due 2/1/26 | | | 310,619 | |
423,000 | | | | Transocean Proteus Ltd., Senior Secured Notes, 6.250% due 12/1/24(b) | | | 435,182 | |
600,000 | | | | Transportadora de Gas Internacional SA ESP, Senior Unsecured Notes, 5.700% due 3/20/22 | | | 609,000 | |
75,000 | | | | Valero Energy Corp., Senior Unsecured Notes, 4.900% due 3/15/45 | | | 79,584 | |
| | | | Williams Partners LP, Senior Unsecured Notes: | | | | |
410,000 | | | | 3.750% due 6/15/27 | | | 396,300 | |
250,000 | | | | 5.100% due 9/15/45 | | | 258,565 | |
| | | | | | | | |
| | | | Total Energy | | | 38,111,666 | |
| | | | | | | | |
Financial - 6.0% | |
500,000 | | | | AerCap Ireland Capital DAC / AerCap Global Aviation Trust, Company Guaranteed Notes, 3.500% due 5/26/22 | | | 498,208 | |
| | | | Air Lease Corp., Senior Unsecured Notes: | | | | |
995,000 | | | | 3.250% due 3/1/25 | | | 954,232 | |
250,000 | | | | 3.625% due 4/1/27 | | | 238,806 | |
145,000 | | | | Aircastle Ltd., Senior Unsecured Notes, 5.000% due 4/1/23 | | | 149,515 | |
250,000 | | | | Alexandria Real Estate Equities Inc., Company Guaranteed Notes, 3.950% due 1/15/28 | | | 245,073 | |
250,000 | | | | Allstate Corp., Senior Unsecured Notes, 4.500% due 6/15/43 | | | 265,086 | |
See Notes to Financial Statements.
98
Schedules of Investments
(continued)
Destinations Core Fixed Income Fund
| | | | | | | | |
Face Amount/Units | | | | Security | | Value | |
Financial - 6.0% - (continued) | |
| | | | American Express Co.: | | | | |
$ 980,000 | | | | Senior Unsecured Notes, 2.500% due 8/1/22 | | $ | 946,844 | |
500,000 | | | | Subordinated Notes, 3.625% due 12/5/24 | | | 500,315 | |
250,000 | | | | American Express Credit Corp., Senior Unsecured Notes, 2.250% due 5/5/21 | | | 243,996 | |
250,000 | | | | American International Group Inc., Senior Unsecured Notes, 4.500% due 7/16/44 | | | 248,313 | |
| | | | American Tower Corp., Senior Unsecured Notes: | | | | |
100,000 | | | | 3.500% due 1/31/23 | | | 100,032 | |
100,000 | | | | 4.000% due 6/1/25 | | | 100,045 | |
200,000 | | | | Aon PLC, Company Guaranteed Notes, 4.750% due 5/15/45 | | | 210,536 | |
200,000 | | | | Banco de Costa Rica, Government Guaranteed Notes, 5.250% due 8/12/18 | | | 200,930 | |
| | | | Banco de Credito del Peru, Senior Unsecured Notes: | | | | |
1,100,000 | | | | 2.250% due 10/25/19 | | | 1,085,700 | |
700,000 | | | | 5.375% due 9/16/20 | | | 735,000 | |
1,000,000 | | | | Banco de Credito e Inversiones SA, Senior Unsecured Notes, 4.000% due 2/11/23 | | | 1,014,072 | |
800,000 | | | | Banco de Reservas de la Republica Dominicana, Subordinated Notes, 7.000% due 2/1/23 | | | 838,000 | |
| | | | Banco del Estado de Chile, Senior Unsecured Notes: | | | | |
500,000 | | | | 4.125% due 10/7/20 | | | 511,452 | |
200,000 | | | | 2.668% due 1/8/21(b) | | | 196,500 | |
300,000 | | | | 3.875% due 2/8/22 | | | 303,222 | |
1,350,000 | | | | Banco Internacional del Peru SAA, Senior Unsecured Notes, 5.750% due 10/7/20 | | | 1,419,525 | |
200,000 | | | | Banco Nacional de Costa Rica, Senior Unsecured Notes, 4.875% due 11/1/18 | | | 199,750 | |
150,000 | | | | Banco Santander Chile, Senior Unsecured Notes, 3.875% due 9/20/22 | | | 151,768 | |
1,000,000 | | | | Banco Santander Mexico SA Institucion de Banca Multiple Grupo Financiero Santand, Subordinated Notes, 5.950% (5-Year CMT Index + 4.580%) due 1/30/24(c) | | | 1,018,750 | |
200,000 | | | | Banistmo SA, Senior Unsecured Notes, 3.650% due 9/19/22(b) | | | 196,000 | |
| | | | Bank of America Corp.: | | | | |
| | | | Senior Unsecured Notes: | | | | |
500,000 | | | | 2.625% due 4/19/21 | | | 492,775 | |
980,000 | | | | 2.369% (3-Month USD-LIBOR + 0.660%) due 7/21/21(c) | | | 965,492 | |
See Notes to Financial Statements.
99
Schedules of Investments
(continued)
Destinations Core Fixed Income Fund
| | | | | | | | |
Face Amount/Units | | | | Security | | Value | |
Financial - 6.0% - (continued) | |
$ 430,000 | | | | 3.004% (3-Month USD-LIBOR + 0.790%) due 12/20/23(b)(c) | | $ | 420,736 | |
750,000 | | | | 3.875% due 8/1/25 | | | 759,931 | |
500,000 | | | | 3.366% (3-Month USD-LIBOR + 0.810%) due 1/23/26(c) | | | 488,374 | |
250,000 | | | | 4.443% (3-Month USD-LIBOR + 1.990%) due 1/20/48(c) | | | 259,574 | |
250,000 | | | | Subordinated Notes, 7.750% due 5/14/38. | | | 356,633 | |
750,000 | | | | Bank of New York Mellon Corp., Senior Unsecured Notes, 2.150% due 2/24/20 | | | 741,603 | |
500,000 | | | | Bank of Nova Scotia, Senior Unsecured Notes, 2.700% due 3/7/22 | | | 490,265 | |
| | | | Barclays PLC: | | | | |
| | | | Senior Unsecured Notes: | | | | |
500,000 | | | | 2.875% due 6/8/20 | | | 495,364 | |
250,000 | | | | 4.950% due 1/10/47 | | | 257,063 | |
250,000 | | | | Subordinated Notes, 5.200% due 5/12/26. | | | 253,948 | |
500,000 | | | | BB&T Corp., Senior Unsecured Notes, 2.750% due 4/1/22 | | | 492,884 | |
300,000 | | | | BBVA Banco Continental SA, Senior Unsecured Notes, 5.000% due 8/26/22 | | | 315,453 | |
| | | | BDO Unibank Inc., Senior Unsecured Notes: | | | | |
350,000 | | | | 2.625% due 10/24/21 | | | 341,164 | |
1,400,000 | | | | 2.950% due 3/6/23 | | | 1,344,571 | |
250,000 | | | | Berkshire Hathaway Inc., Senior Unsecured Notes, 3.125% due 3/15/26 | | | 243,305 | |
960,000 | | | | Boston Properties LP, Senior Unsecured Notes, 3.650% due 2/1/26 | | | 951,335 | |
100,000 | | | | Brighthouse Financial Inc., Senior Unsecured Notes, 3.700% due 6/22/27(b) | | | 93,496 | |
250,000 | | | | Brixmor Operating Partnership LP, Senior Unsecured Notes, 3.900% due 3/15/27 | | | 239,904 | |
500,000 | | | | Brookfield Finance LLC, Company Guaranteed Notes, 4.000% due 4/1/24 | | | 505,809 | |
| | | | Capital One Financial Corp., Senior Unsecured Notes: | | | | |
250,000 | | | | 3.050% due 3/9/22 | | | 245,473 | |
250,000 | | | | 3.750% due 3/9/27 | | | 243,013 | |
125,000 | | | | CBRE Services Inc., Company Guaranteed Notes, 5.250% due 3/15/25 | | | 133,733 | |
250,000 | | | | Charles Schwab Corp., Senior Unsecured Notes, 3.200% due 3/2/27 | | | 243,176 | |
500,000 | | | | Chubb INA Holdings Inc., Company Guaranteed Notes, 3.350% due 5/3/26 | | | 493,976 | |
See Notes to Financial Statements.
100
Schedules of Investments
(continued)
Destinations Core Fixed Income Fund
| | | | | | | | |
Face Amount/Units | | | | Security | | Value | |
Financial - 6.0% - (continued) | |
$ 500,000 | | | | Citibank NA, Senior Unsecured Notes, 2.000% due 3/20/19 | | $ | 496,952 | |
| | | | Citigroup Inc.: | | | | |
| | | | Senior Unsecured Notes: | | | | |
250,000 | | | | 2.700% due 3/30/21 | | | 246,887 | |
100,000 | | | | 2.350% due 8/2/21 | | | 97,414 | |
500,000 | | | | 2.750% due 4/25/22 | | | 489,373 | |
500,000 | | | | 3.887% (3-Month USD-LIBOR + 1.563%) due 1/10/28(c) | | | 497,763 | |
1,215,000 | | | | 3.668% (3-Month USD-LIBOR + 1.390%) due 7/24/28(c) | | | 1,188,533 | |
| | | | Subordinated Notes: | | | | |
100,000 | | | | 5.300% due 5/6/44 | | | 110,391 | |
250,000 | | | | 4.750% due 5/18/46 | | | 255,742 | |
500,000 | | | | Citizens Bank NA, Senior Unsecured Notes, 2.250% due 3/2/20 | | | 493,205 | |
760,000 | | | | Commonwealth Bank of Australia, Senior Unsecured Notes, 2.750% due 3/10/22(b) | | | 748,714 | |
| | | | Cooperatieve Rabobank UA, Company Guaranteed Notes: | | | | |
500,000 | | | | 3.875% due 2/8/22 | | | 511,113 | |
250,000 | | | | 3.750% due 7/21/26 | | | 242,947 | |
| | | | Credit Suisse Group Funding Guernsey Ltd., Company Guaranteed Notes: | | | | |
500,000 | | | | 3.125% due 12/10/20 | | | 498,512 | |
250,000 | | | | 3.750% due 3/26/25 | | | 246,795 | |
250,000 | | | | 4.550% due 4/17/26 | | | 259,207 | |
300,000 | | | | Crown Castle International Corp., Senior Unsecured Notes, 4.000% due 3/1/27 | | | 296,839 | |
| | | | DBS Group Holdings Ltd., Senior Unsecured Notes: | | | | |
200,000 | | | | 2.013% (3-Month USD-LIBOR + 0.490%) due 6/8/20(c) | | | 200,360 | |
300,000 | | | | 2.365% (3-Month USD-LIBOR + 0.620%) due 7/25/22(c) | | | 300,764 | |
1,400,000 | | | | 2.365% (3-Month USD-LIBOR + 0.620%) due 7/25/22(b)(c) | | | 1,403,567 | |
500,000 | | | | Deutsche Bank AG, Senior Unsecured Notes, 3.950% due 2/27/23 | | | 499,562 | |
810,000 | | | | Discover Financial Services, Senior Unsecured Notes, 4.100% due 2/9/27 | | | 801,147 | |
200,000 | | | | Enstar Group Ltd., Senior Unsecured Notes, 4.500% due 3/10/22 | | | 200,536 | |
500,000 | | | | ESH Hospitality Inc., Company Guaranteed Notes, 5.250% due 5/1/25(b) | | | 498,750 | |
See Notes to Financial Statements.
101
Schedules of Investments
(continued)
Destinations Core Fixed Income Fund
| | | | | | | | |
Face Amount/Units | | | | Security | | Value | |
Financial - 6.0% - (continued) | |
$ 500,000 | | | | Fifth Third Bancorp, Senior Unsecured Notes, 2.300% due 3/1/19 | | $ | 498,635 | |
| | | | GE Capital International Funding Co. Unlimited Co., Company Guaranteed Notes: | | | | |
250,000 | | | | 3.373% due 11/15/25 | | | 240,297 | |
250,000 | | | | 4.418% due 11/15/35 | | | 245,485 | |
| | | | Global Bank Corp., Senior Unsecured Notes: | | | | |
700,000 | | | | 5.125% due 10/30/19 | | | 718,375 | |
1,000,000 | | | | 4.500% due 10/20/21 | | | 1,011,500 | |
| | | | Goldman Sachs Group Inc.: | | | | |
| | | | Senior Unsecured Notes: | | | | |
500,000 | | | | 2.350% due 11/15/21 | | | 483,609 | |
200,000 | | | | 5.750% due 1/24/22 | | | 216,936 | |
500,000 | | | | 3.000% due 4/26/22 | | | 492,974 | |
935,000 | | | | 2.552% (3-Month USD-LIBOR + 0.780%) due 10/31/22(c) | | | 937,743 | |
250,000 | | | | 6.125% due 2/15/33 | | | 301,305 | |
| | | | Subordinated Notes: | | | | |
500,000 | | | | 4.250% due 10/21/25 | | | 503,985 | |
250,000 | | | | 6.750% due 10/1/37 | | | 316,676 | |
250,000 | | | | 5.150% due 5/22/45 | | | 269,936 | |
500,000 | | | | Host Hotels & Resorts LP, Senior Unsecured Notes, 3.875% due 4/1/24 | | | 496,699 | |
| | | | HSBC Holdings PLC: | | | | |
| | | | Senior Unsecured Notes: | | | | |
500,000 | | | | 3.262% (3-Month USD-LIBOR + 1.055%) due 3/13/23(c) | | | 496,373 | |
250,000 | | | | 4.041% (3-Month USD-LIBOR + 1.546%) due 3/13/28(c) | | | 250,998 | |
| | | | Subordinated Notes: | | | | |
250,000 | | | | 6.500% due 5/2/36 | | | 307,875 | |
250,000 | | | | 5.250% due 3/14/44 | | | 275,356 | |
1,000,000 | | | | HSBC USA Inc., Senior Unsecured Notes, 2.375% due 11/13/19 | | | 992,748 | |
500,000 | | | | Huntington National Bank, Senior Unsecured Notes, 2.375% due 3/10/20 | | | 496,211 | |
450,000 | | | | Icahn Enterprises LP / Icahn Enterprises Finance Corp., Company Guaranteed Notes, 6.250% due 2/1/22 | | | 456,750 | |
500,000 | | | | Industrial Senior Trust, Company Guaranteed Notes, 5.500% due 11/1/22 | | | 495,000 | |
500,000 | | | | ING Groep NV, Senior Unsecured Notes, 3.150% due 3/29/22 | | | 495,559 | |
See Notes to Financial Statements.
102
Schedules of Investments
(continued)
Destinations Core Fixed Income Fund
| | | | | | | | |
Face Amount/Units | | | | Security | | Value | |
Financial - 6.0% - (continued) | |
$ 1,700,000 | | | | Itau CorpBanca, Senior Unsecured Notes, 3.875% due 9/22/19 | | $ | 1,716,228 | |
250,000 | | | | Jefferies Group LLC / Jefferies Group Capital Finance Inc.,
Senior Unsecured Notes, 4.850% due 1/15/27 | | | 258,234 | |
| | | | JPMorgan Chase & Co.: | | | | |
| | | | Senior Unsecured Notes: | | | | |
935,000 | | | | 2.250% due 1/23/20 | | | 926,220 | |
250,000 | | | | 4.250% due 10/15/20 | | | 258,537 | |
250,000 | | | | 2.972% due 1/15/23 | | | 245,944 | |
250,000 | | | | 3.782% (3-Month USD-LIBOR + 1.337%) due 2/1/28(c) | | | 248,996 | |
250,000 | | | | 3.509% (3-Month USD-LIBOR + 0.945%) due 1/23/29(c) | | | 242,362 | |
250,000 | | | | 3.882% (3-Month USD-LIBOR + 1.360%) due 7/24/38(c) | | | 242,009 | |
150,000 | | | | 5.400% due 1/6/42 | | | 176,786 | |
250,000 | | | | 4.260% (3-Month USD-LIBOR + 1.580%) due 2/22/48(c) | | | 250,148 | |
| | | | Subordinated Notes: | | | | |
200,000 | | | | 3.875% due 9/10/24 | | | 201,357 | |
250,000 | | | | 3.625% due 12/1/27 | | | 241,329 | |
1,000,000 | | | | JPMorgan Chase Bank NA, Senior Unsecured Notes, 1.650% due 9/23/19 | | | 985,701 | |
190,000 | | | | Kennedy-Wilson Inc., Senior Unsecured Notes, 5.875% due 4/1/24(b) | | | 187,388 | |
| | | | Kreditanstalt fuer Wiederaufbau, Government Guaranteed Notes: | | | | |
2,000,000 | | | | 1.625% due 3/15/21 | | | 1,940,771 | |
500,000 | | | | 2.125% due 3/7/22 | | | 488,203 | |
500,000 | | | | 2.375% due 12/29/22 | | | 489,637 | |
100,000 | | | | 2.500% due 11/20/24 | | | 97,179 | |
75,000 | | | | Landwirtschaftliche Rentenbank, Government Guaranteed Notes, 1.750% due 7/27/26 | | | 67,874 | |
1,000,000 | | | | Lloyds Banking Group PLC, Senior Unsecured Notes, 3.100% due 7/6/21 | | | 993,166 | |
955,000 | | | | Macquarie Group Ltd., Senior Unsecured Notes, 3.189% (3-Month USD-LIBOR + 1.023%) due 11/28/23(b)(c) | | | 926,818 | |
1,700,000 | | | | Malayan Banking Bhd, Subordinated Notes, 3.905% (5-Year USD Swap Rate + 2.542%) due 10/29/26(c) | | | 1,707,791 | |
250,000 | | | | Manulife Financial Corp., Subordinated Notes, 4.061% (5-Year USD 1100 Run ICE Swap Rate + 1.647%) due 2/24/32(c) | | | 246,600 | |
See Notes to Financial Statements.
103
Schedules of Investments
(continued)
Destinations Core Fixed Income Fund
| | | | | | | | |
Face Amount/Units | | | | Security | | Value | |
Financial - 6.0% - (continued) | |
$ 250,000 | | | | Mastercard Inc., Senior Unsecured Notes, 3.950% due 2/26/48 | | $ | 252,053 | |
250,000 | | | | MetLife Inc., Senior Unsecured Notes, 4.600% due 5/13/46 | | | 263,234 | |
250,000 | | | | Mid-America Apartments LP, Senior Unsecured Notes, 3.750% due 6/15/24 | | | 251,672 | |
| | | | Mitsubishi UFJ Financial Group Inc., Senior Unsecured Notes: | | | | |
500,000 | | | | 2.998% due 2/22/22 | | | 492,475 | |
460,000 | | | | 2.757% (3-Month USD-LIBOR + 0.740%) due 3/2/23(c) | | | 460,216 | |
| | | | Mizuho Financial Group Inc., Senior Unsecured Notes: | | | | |
250,000 | | | | 2.953% due 2/28/22 | | | 245,624 | |
250,000 | | | | 3.663% due 2/28/27 | | | 246,933 | |
| | | | Morgan Stanley: | | | | |
| | | | Senior Unsecured Notes: | | | | |
1,000,000 | | | | 7.300% due 5/13/19 | | | 1,052,338 | |
500,000 | | | | 2.625% due 11/17/21 | | | 489,568 | |
945,000 | | | | 2.750% due 5/19/22 | | | 923,692 | |
250,000 | | | | 3.591% (3-Month USD-LIBOR + 1.340%) due 7/22/28(c) | | | 241,792 | |
250,000 | | | | 3.772% (3-Month USD-LIBOR + 1.140%) due 1/24/29(c) | | | 244,624 | |
250,000 | | | | 6.375% due 7/24/42 | | | 324,201 | |
250,000 | | | | Subordinated Notes, 4.350% due 9/8/26 | | | 253,781 | |
250,000 | | | | National Australia Bank Ltd., Senior Unsecured Notes, 3.375% due 1/14/26 | | | 245,036 | |
250,000 | | | | National Rural Utilities Cooperative Finance Corp., Collateral Trust, 3.050% due 2/15/22 | | | 250,179 | |
315,000 | | | | Navient Corp., Senior Unsecured Notes, 6.500% due 6/15/22 | | | 328,388 | |
405,000 | | | | New York Life Global Funding, Secured Notes, 2.300% due 6/10/22(b) | | | 391,764 | |
790,000 | | | | Nuveen Finance LLC, Senior Unsecured Notes, 4.125% due 11/1/24(b) | | | 813,616 | |
1,000,000 | | | | Oesterreichische Kontrollbank AG, Government Guaranteed Notes, 1.500% due 10/21/20 | | | 972,100 | |
800,000 | | | | Oversea-Chinese Banking Corp., Ltd., Subordinated Notes, 4.000% (5-Year USD Swap Rate + 2.203%) due 10/15/24(c) | | | 808,026 | |
500,000 | | | | PNC Bank N.A., Senior Unsecured Notes, 2.625% due 2/17/22 | | | 490,176 | |
150,000 | | | | PNC Financial Services Group Inc., Subordinated Notes, 3.900% due 4/29/24 | | | 152,774 | |
See Notes to Financial Statements.
104
Schedules of Investments
(continued)
Destinations Core Fixed Income Fund
| | | | | | | | |
Face Amount/Units | | | | Security | | Value | |
Financial - 6.0% - (continued) | |
$ 150,000 | | | | Progressive Corp., Senior Unsecured Notes, 4.125% due 4/15/47 | | $ | 151,186 | |
| | | | Prudential Financial Inc.: | | | | |
| | | | Senior Unsecured Notes: | | | | |
500,000 | | | | 7.375% due 6/15/19 | | | 529,790 | |
775,000 | | | | 3.500% due 5/15/24 | | | 780,474 | |
343,000 | | | | 3.935% due 12/7/49(b) | | | 325,813 | |
250,000 | | | | Junior Subordinated Notes, 5.625% (3-Month USD-LIBOR + 3.920%) due 6/15/43(c) | | | 263,750 | |
250,000 | | | | Regency Centers LP, Company Guaranteed Notes, 4.400% due 2/1/47 | | | 244,314 | |
| | | | Royal Bank of Canada: | | | | |
| | | | Senior Unsecured Notes: | | | | |
250,000 | | | | 2.125% due 3/2/20 | | | 246,616 | |
950,000 | | | | 2.350% due 10/30/20 | | | 938,013 | |
250,000 | | | | Subordinated Notes, 4.650% due 1/27/26. | | | 259,356 | |
815,000 | | | | Royal Bank of Scotland Group PLC, Senior Unsecured Notes, 3.498% (3-Month USD-LIBOR + 1.480%) due 5/15/23(c) | | | 802,979 | |
250,000 | | | | Sabra Health Care LP, Company Guaranteed Notes, 5.125% due 8/15/26 | | | 242,490 | |
450,000 | | | | Santander Holdings USA Inc., Senior Unsecured Notes, 3.400% due 1/18/23(b) | | | 440,082 | |
500,000 | | | | Santander UK PLC, Senior Unsecured Notes, 2.350% due 9/10/19 | | | 497,167 | |
490,000 | | | | SBA Communications Corp., Senior Unsecured Notes, 4.000% due 10/1/22(b) | | | 480,200 | |
| | | | Simon Property Group LP, Senior Unsecured Notes: | | | | |
425,000 | | | �� | 2.750% due 6/1/23 | | | 413,959 | |
100,000 | | | | 3.375% due 10/1/24 | | | 99,275 | |
| | | | SPARC EM SPC Panama Metro Line 2 SP, Senior Secured Notes: | | | | |
1,100,000 | | | | zero coupon, due 12/5/22(b) | | | 1,002,375 | |
800,000 | | | | zero coupon, due 12/5/22 | | | 729,000 | |
445,000 | | | | Starwood Property Trust Inc., Senior Unsecured Notes, 4.750% due 3/15/25(b) | | | 431,650 | |
| | | | Sumitomo Mitsui Financial Group Inc., Senior Unsecured Notes: | | | | |
500,000 | | | | 2.934% due 3/9/21 | | | 497,796 | |
590,000 | | | | 2.471% (3-Month USD-LIBOR + 0.740%) due 1/17/23(c) | | | 590,818 | |
250,000 | | | | 3.100% due 1/17/23 | | | 246,732 | |
100,000 | | | | 2.632% due 7/14/26 | | | 91,743 | |
See Notes to Financial Statements.
105
Schedules of Investments
(continued)
Destinations Core Fixed Income Fund
| | | | | | | | |
Face Amount/Units | | | | Security | | Value | |
Financial - 6.0% - (continued) | |
$ 500,000 | | | | SunTrust Bank/Atlanta GA, Senior Unsecured Notes, 2.250% due 1/31/20 | | $ | 494,225 | |
1,950,000 | | | | Temasek Financial I Ltd., Company Guaranteed Notes, 2.375% due 1/23/23 | | | 1,886,704 | |
1,000,000 | | | | Toronto-Dominion Bank, Senior Unsecured Notes, 1.450% due 8/13/19 | | | 983,597 | |
125,000 | | | | Travelers Cos., Inc., Senior Unsecured Notes, 5.350% due 11/1/40 | | | 150,368 | |
400,000 | | | | Union Bank of the Philippines, Senior Unsecured Notes, 3.369% due 11/29/22 | | | 391,543 | |
| | | | United Overseas Bank Ltd., Subordinated Notes: | | | | |
500,000 | | | | 3.750% (5-Year USD Swap Rate + 1.995%) due 9/19/24(c) | | | 502,731 | |
1,200,000 | | | | 3.500% (5-Year USD Swap Rate + 2.236%) due 9/16/26(c) | | | 1,192,466 | |
750,000 | | | | US Bancorp, Senior Unsecured Notes, 2.625% due 1/24/22 | | | 738,665 | |
100,000 | | | | Ventas Realty LP, Company Guaranteed Notes, 4.375% due 2/1/45 | | | 97,446 | |
| | | | Visa Inc., Senior Unsecured Notes: | | | | |
750,000 | | | | 2.800% due 12/14/22 | | | 740,598 | |
100,000 | | | | 4.150% due 12/14/35 | | | 105,402 | |
| | | | Wells Fargo & Co.: | | | | |
| | | | Senior Unsecured Notes: | | | | |
625,000 | | | | 3.069% due 1/24/23 | | | 616,110 | |
500,000 | | | | 3.000% due 10/23/26 | | | 471,508 | |
710,000 | | | | 3.584% (3-Month USD-LIBOR + 1.310%) due 5/22/28(c) | | | 691,997 | |
| | | | Subordinated Notes: | | | | |
250,000 | | | | 4.400% due 6/14/46 | | | 245,935 | |
250,000 | | | | 4.750% due 12/7/46 | | | 259,470 | |
1,000,000 | | | | Wells Fargo Bank NA, Senior Unsecured Notes, 2.150% due 12/6/19 | | | 989,590 | |
250,000 | | | | Westpac Banking Corp., Senior Unsecured Notes, 3.350% due 3/8/27 | | | 242,765 | |
| | | | | | | | |
| | | | Total Financial | | | 90,467,056 | |
| | | | | | | | |
Government - 0.7% | |
500,000 | | | | African Development Bank, Senior Unsecured Notes, 1.875% due 3/16/20 | | | 494,464 | |
1,500,000 | | | | Asian Development Bank, Senior Unsecured Notes, 2.000% due 2/16/22 | | | 1,459,906 | |
300,000 | | | | Banco Latinoamericano de Comercio Exterior SA, Senior Unsecured Notes, 3.250% due 5/7/20 .. | | | 296,625 | |
See Notes to Financial Statements.
106
Schedules of Investments
(continued)
Destinations Core Fixed Income Fund
| | | | | | | | |
Face Amount/Units | | | | Security | | Value | |
Government - 0.7% - (continued) | |
$ 750,000 | | | | Council Of Europe Development Bank, Senior Unsecured Notes, 1.875% due 1/27/20 | | $ | 742,633 | |
500,000 | | | | European Bank for Reconstruction & Development, Senior Unsecured Notes, 1.750% due 11/26/19 | | | 494,793 | |
| | | | European Investment Bank, Senior Unsecured Notes: | | | | |
500,000 | | | | 1.875% due 3/15/19 | | | 498,208 | |
2,000,000 | | | | 1.750% due 5/15/20 | | | 1,968,499 | |
1,000,000 | | | | FMS Wertmanagement AoeR, Government Guaranteed Notes, 1.750% due 1/24/20 | | | 987,423 | |
| | | | Inter-American Development Bank: | | | | |
500,000 | | | | Senior Unsecured Notes, 2.375% due 7/7/27. | | | 473,074 | |
1,000,000 | | | | Unsecured Notes, 1.250% due 10/15/19 | | | 982,905 | |
500,000 | | | | International Finance Corp., Unsecured Notes, 1.750% due 3/30/20 | | | 493,025 | |
1,200,000 | | | | Malaysia Sovereign Sukuk Bhd, Unsecured Notes, 3.043% due 4/22/25 | | | 1,172,460 | |
500,000 | | | | Malaysia Sukuk Global Bhd, Senior Unsecured Notes, 3.179% due 4/27/26 | | | 487,730 | |
500,000 | | | | Svensk Exportkredit AB, Senior Unsecured Notes, 2.375% due 3/9/22 | | | 491,398 | |
| | | | | | | | |
| | | | Total Government | | | 11,043,143 | |
| | | | | | | | |
Industrial - 1.1% | |
| | | | Boeing Co., Senior Unsecured Notes: | | | | |
500,000 | | | | 2.125% due 3/1/22 | | | 486,258 | |
300,000 | | | | 3.650% due 3/1/47 | | | 285,935 | |
460,000 | | | | Builders FirstSource Inc., Senior Secured Notes, 5.625% due 9/1/24(b) | | | 468,050 | |
| | | | Burlington Northern Santa Fe LLC, Senior Unsecured Notes: | | | | |
250,000 | | | | 3.250% due 6/15/27 | | | 246,736 | |
250,000 | | | | 4.125% due 6/15/47 | | | 254,838 | |
425,000 | | | | BWAY Holding Co., Senior Secured Notes, 5.500% due 4/15/24(b) | | | 434,563 | |
100,000 | | | | Canadian Pacific Railway Co., Senior Unsecured Notes, 2.900% due 2/1/25 | | | 96,165 | |
| | | | Caterpillar Financial Services Corp., Senior Unsecured Notes: | | | | |
250,000 | | | | 1.900% due 3/22/19 | | | 248,275 | |
500,000 | | | | 1.700% due 8/9/21 | | | 479,481 | |
| | | | Caterpillar Inc., Senior Unsecured Notes: | | | | |
895,000 | | | | 3.400% due 5/15/24 | | | 904,784 | |
100,000 | | | | 3.803% due 8/15/42 | | | 99,510 | |
See Notes to Financial Statements.
107
Schedules of Investments
(continued)
Destinations Core Fixed Income Fund
| | | | | | | | |
Face Amount/Units | | | | Security | | Value | |
Industrial - 1.1% - (continued) | |
| | | | CSX Corp., Senior Unsecured Notes: | | | | |
$ 250,000 | | | | 2.600% due 11/1/26 | | $ | 227,721 | |
250,000 | | | | 4.500% due 8/1/54 | | | 244,603 | |
270,000 | | | | DAE Funding LLC, Company Guaranteed Notes, 4.500% due 8/1/22(b) | | | 261,900 | |
200,000 | | | | Embraer Netherlands Finance BV, Company Guaranteed Notes, 5.400% due 2/1/27 | | | 212,000 | |
| | | | FedEx Corp., Company Guaranteed Notes: | | | | |
500,000 | | | | 3.300% due 3/15/27 | | | 486,285 | |
860,000 | | | | 4.750% due 11/15/45 | | | 893,717 | |
250,000 | | | | 4.400% due 1/15/47 | | | 248,125 | |
500,000 | | | | GATX Corp., Senior Unsecured Notes, 3.850% due 3/30/27 | | | 491,808 | |
| | | | General Electric Co., Senior Unsecured Notes: | | | | |
1,000,000 | | | | 2.200% due 1/9/20 | | | 986,633 | |
500,000 | | | | 4.500% due 3/11/44 | | | 495,298 | |
750,000 | | | | John Deere Capital Corp., Senior Unsecured Notes, 2.200% due 3/13/20 | | | 743,323 | |
200,000 | | | | Johnson Controls International PLC, Senior Unsecured Notes, 4.500% due 2/15/47 | | | 206,245 | |
250,000 | | | | L3 Technologies Inc., Company Guaranteed Notes, 5.200% due 10/15/19 | | | 258,916 | |
| | | | Lockheed Martin Corp., Senior Unsecured Notes: | | | | |
250,000 | | | | 3.550% due 1/15/26 | | | 250,070 | |
250,000 | | | | 4.700% due 5/15/46 | | | 270,520 | |
250,000 | | | | Norfolk Southern Corp., Senior Unsecured Notes, 2.900% due 6/15/26 | | | 236,440 | |
| | | | Northrop Grumman Corp., Senior Unsecured Notes: | | | | |
200,000 | | | | 2.550% due 10/15/22 | | | 193,307 | |
100,000 | | | | 4.030% due 10/15/47 | | | 96,024 | |
| | | | Parker-Hannifin Corp., Senior Unsecured Notes: | | | | |
400,000 | | | | 3.250% due 3/1/27 | | | 389,920 | |
200,000 | | | | 4.100% due 3/1/47 | | | 203,042 | |
225,000 | | | | Penske Truck Leasing Co. LP / PTL Finance Corp., Senior Unsecured Notes, 4.200% due 4/1/27(b) | | | 226,944 | |
455,000 | | | | Plastipak Holdings Inc., Senior Unsecured Notes, 6.250% due 10/15/25(b) | | | 462,963 | |
250,000 | | | | PSA International Pte Ltd., Senior Unsecured Notes, 3.875% due 2/11/21 | | | 257,271 | |
440,000 | | | | Republic Services Inc., Senior Unsecured Notes, 3.375% due 11/15/27 | | | 425,801 | |
490,000 | | | | Reynolds Group Issuer Inc. / Reynolds Group Issuer LLC / Reynolds Group Issuer Lu, Senior Secured Notes, 5.125% due 7/15/23(b) | | | 499,726 | |
See Notes to Financial Statements.
108
Schedules of Investments
(continued)
Destinations Core Fixed Income Fund
| | | | | | | | |
Face Amount/Units | | | | Security | | Value | |
Industrial - 1.1% - (continued) | |
$ 100,000 | | | | Rockwell Collins Inc., Senior Unsecured Notes, 3.200% due 3/15/24 | | $ | 98,052 | |
300,000 | | | | Ryder System Inc., Senior Unsecured Notes, 2.800% due 3/1/22 | | | 294,663 | |
1,500,000 | | | | SBA Tower Trust, Mortgage, 3.168% due 4/11/22(b) | | | 1,476,603 | |
300,000 | | | | Tech Data Corp., Senior Unsecured Notes, 3.700% due 2/15/22 | | | 297,943 | |
| | | | Union Pacific Corp., Senior Unsecured Notes: | | | | |
250,000 | | | | 3.350% due 8/15/46 | | | 224,427 | |
125,000 | | | | 3.875% due 2/1/55 | | | 117,815 | |
250,000 | | | | United Parcel Service Inc., Senior Unsecured Notes, 5.125% due 4/1/19 | | | 256,778 | |
| | | | United Technologies Corp., Senior Unsecured Notes: | | | | |
500,000 | | | | 2.300% due 5/4/22 | | | 483,858 | |
250,000 | | | | 3.750% due 11/1/46 | | | 229,820 | |
| | | | | | | | |
| | | | Total Industrial | | | 16,753,156 | |
| | | | | | | | |
Technology - 0.9% | |
| | | | Apple Inc., Senior Unsecured Notes: | | | | |
1,000,000 | | | | 1.900% due 2/7/20 | | | 988,431 | |
75,000 | | | | 2.850% due 5/6/21 | | | 75,122 | |
300,000 | | | | 2.400% due 5/3/23 | | | 290,232 | |
250,000 | | | | 3.000% due 2/9/24 | | | 246,744 | |
250,000 | | | | 3.350% due 2/9/27 | | | 246,387 | |
250,000 | | | | 3.000% due 6/20/27 | | | 239,402 | |
250,000 | | | | 4.250% due 2/9/47 | | | 257,645 | |
250,000 | | | | 3.750% due 11/13/47 | | | 238,274 | |
100,000 | | | | Applied Materials Inc., Senior Unsecured Notes, 4.350% due 4/1/47 | | | 103,495 | |
| | | | Broadcom Corp. / Broadcom Cayman Finance Ltd., Company Guaranteed Notes: | | | | |
500,000 | | | | 3.000% due 1/15/22 | | | 489,290 | |
100,000 | | | | 3.625% due 1/15/24 | | | 97,562 | |
300,000 | | | | CA Inc., Senior Unsecured Notes, 3.600% due 8/15/22 | | | 300,014 | |
| | | | Dell International LLC / EMC Corp., Senior Secured Notes: | | | | |
100,000 | | | | 5.450% due 6/15/23(b) | | | 105,567 | |
750,000 | | | | 6.020% due 6/15/26(b) | | | 802,358 | |
| | | | DXC Technology Co., Senior Unsecured Notes: | | | | |
300,000 | | | | 2.875% due 3/27/20 | | | 299,264 | |
400,000 | | | | 4.750% due 4/15/27 | | | 414,130 | |
300,000 | | | | First Data Corp., Secured Notes, 5.750% due 1/15/24(b) | | | 305,250 | |
See Notes to Financial Statements.
109
Schedules of Investments
(continued)
Destinations Core Fixed Income Fund
| | | | | | | | |
Face Amount/Units | | | | Security | | Value | |
Technology - 0.9% - (continued) | |
| | | | Hewlett Packard Enterprise Co., Senior Unsecured Notes: | | | | |
$ 100,000 | | | | 3.600% due 10/15/20 | | $ | 101,081 | |
150,000 | | | | 6.200% due 10/15/35 | | | 160,087 | |
250,000 | | | | Intel Corp., Senior Unsecured Notes, 4.100% due 5/19/46 | | | 255,392 | |
| | | | International Business Machines Corp., Senior Unsecured Notes: | | | | |
250,000 | | | | 2.500% due 1/27/22 | | | 245,336 | |
250,000 | | | | 3.300% due 1/27/27 | | | 246,843 | |
100,000 | | | | 4.000% due 6/20/42 | | | 100,566 | |
125,000 | | | | KLA-Tencor Corp., Senior Unsecured Notes, 4.650% due 11/1/24 | | | 131,312 | |
| | | | Microsoft Corp., Senior Unsecured Notes: | | | | |
500,000 | | | | 1.850% due 2/6/20 | | | 494,681 | |
250,000 | | | | 2.400% due 2/6/22 | | | 245,593 | |
250,000 | | | | 2.875% due 2/6/24 | | | 246,059 | |
250,000 | | | | 3.300% due 2/6/27 | | | 247,416 | |
250,000 | | | | 3.450% due 8/8/36 | | | 242,375 | |
750,000 | | | | 4.250% due 2/6/47 | | | 800,084 | |
| | | | Oracle Corp., Senior Unsecured Notes: | | | | |
500,000 | | | | 1.900% due 9/15/21 | | | 483,228 | |
100,000 | | | | 2.950% due 11/15/24 | | | 97,098 | |
500,000 | | | | 2.650% due 7/15/26 | | | 467,252 | |
250,000 | | | | 3.850% due 7/15/36 | | | 250,298 | |
250,000 | | | | 4.000% due 7/15/46 | | | 247,032 | |
| | | | QUALCOMM Inc., Senior Unsecured Notes: | | | | |
500,000 | | | | 3.000% due 5/20/22 | | | 489,471 | |
100,000 | | | | 4.650% due 5/20/35 | | | 102,076 | |
520,000 | | | | Quintiles IMS Inc., Company Guaranteed Notes, 4.875% due 5/15/23(b) | | | 534,300 | |
400,000 | | | | Seagate HDD Cayman, Company Guaranteed Notes, 4.250% due 3/1/22(b) | | | 395,720 | |
400,000 | | | | Xerox Corp., Senior Unsecured Notes, 4.070% due 3/17/22 | | | 402,955 | |
| | | | | | | | |
| | | | Total Technology | | | 12,485,422 | |
| | | | | | | | |
Utilities - 1.1% | |
100,000 | | | | Ameren Illinois Co., 1st Mortgage Notes, 3.700% due 12/1/47. | | | 95,755 | |
70,000 | | | | American Electric Power Co., Inc., Senior Unsecured Notes, 3.200% due 11/13/27 | | | 66,901 | |
| | | | Berkshire Hathaway Energy Co., Senior Unsecured Notes: | | | | |
200,000 | | | | 6.125% due 4/1/36 | | | 254,571 | |
250,000 | | | | 5.150% due 11/15/43 | | | 289,196 | |
See Notes to Financial Statements.
110
Schedules of Investments
(continued)
Destinations Core Fixed Income Fund
| | | | | | | | |
Face Amount/Units | | | | Security | | Value | |
Utilities - 1.1% - (continued) | |
$ 230,000 | | | | Calpine Corp., Senior Unsecured Notes, 5.750% due 1/15/25 | | $ | 215,625 | |
150,000 | | | | Commonwealth Edison Co., 1st Mortgage Notes, 3.750% due 8/15/47 | | | 143,997 | |
250,000 | | | | Consolidated Edison Co. of New York Inc., Senior Unsecured Notes, 3.950% due 3/1/43 | | | 246,793 | |
500,000 | | | | Consolidated Edison Inc., Senior Unsecured Notes, 2.000% due 3/15/20 | | | 493,187 | |
| | | | Duke Energy Corp., Senior Unsecured Notes: | | | | |
1,480,000 | | | | 2.650% due 9/1/26 | | | 1,358,942 | |
350,000 | | | | 3.750% due 9/1/46 | | | 317,987 | |
250,000 | | | | Duke Energy Progress LLC, 1st Mortgage Notes, 6.300% due 4/1/38 | | | 327,945 | |
200,000 | | | | Energuate Trust, Company Guaranteed Notes, 5.875% due 5/3/27(b) | | | 203,000 | |
600,000 | | | | Engie Energia Chile SA, Senior Unsecured Notes, 5.625% due 1/15/21 | | | 635,436 | |
100,000 | | | | Eversource Energy, Senior Unsecured Notes, 2.900% due 10/1/24. | | | 96,065 | |
500,000 | | | | Exelon Generation Co. LLC, Senior Unsecured Notes, 3.400% due 3/15/22 | | | 500,913 | |
500,000 | | | | FirstEnergy Corp., Senior Unsecured Notes, 3.900% due 7/15/27 | | | 493,788 | |
250,000 | | | | Florida Power & Light Co., 1st Mortgage Notes, 3.125% due 12/1/25 | | | 246,648 | |
415,000 | | | | Fortis Inc., Senior Unsecured Notes, 2.100% due 10/4/21 | | | 399,092 | |
| | | | Georgia Power Co., Senior Unsecured Notes: | | | | |
250,000 | | | | 2.000% due 3/30/20 | | | 246,529 | |
250,000 | | | | 3.250% due 3/30/27 | | | 242,753 | |
500,000 | | | | MidAmerican Energy Co., 1st Mortgage Notes, 3.100% due 5/1/27 | | | 483,557 | |
250,000 | | | | NextEra Energy Capital Holdings Inc., Company Guaranteed Notes, 3.550% due 5/1/27 | | | 244,550 | |
420,000 | | | | NextEra Energy Operating Partners LP, Company Guaranteed Notes, 4.250% due 9/15/24(b) | | | 414,225 | |
| | | | NiSource Inc., Senior Unsecured Notes: | | | | |
150,000 | | | | 3.490% due 5/15/27 | | | 147,017 | |
100,000 | | | | 4.375% due 5/15/47 | | | 101,318 | |
250,000 | | | | Northern States Power Co., 1st Mortgage Notes, 3.600% due 5/15/46 | | | 235,977 | |
200,000 | | | | NRG Energy Inc., Company Guaranteed Notes, 6.250% due 7/15/22 | | | 206,500 | |
100,000 | | | | Oncor Electric Delivery Co. LLC, Senior Secured Notes, 5.300% due 6/1/42 | | | 119,233 | |
See Notes to Financial Statements.
111
Schedules of Investments
(continued)
Destinations Core Fixed Income Fund
| | | | | | | | |
Face Amount/Units | | | | Security | | Value | |
Utilities - 1.1% - (continued) | |
| | | | Pacific Gas & Electric Co., Senior Unsecured Notes: | | | | |
$ 250,000 | | | | 3.300% due 3/15/27 | | $ | 236,701 | |
250,000 | | | | 6.050% due 3/1/34 | | | 291,358 | |
250,000 | | | | PECO Energy Co., 1st Mortgage Notes, 4.150% due 10/1/44 | | | 259,258 | |
| | | | PPL Capital Funding Inc., Company Guaranteed Notes: | | | | |
100,000 | | | | 3.400% due 6/1/23 | | | 99,874 | |
250,000 | | | | 3.100% due 5/15/26 | | | 237,102 | |
125,000 | | | | PSEG Power LLC, Company Guaranteed Notes, 3.000% due 6/15/21 | | | 124,641 | |
100,000 | | | | Public Service Enterprise Group Inc., Senior Unsecured Notes, 2.650% due 11/15/22 | | | 97,234 | |
100,000 | | | | San Diego Gas & Electric Co., 1st Mortgage Notes, 6.000% due 6/1/39 | | | 128,587 | |
125,000 | | | | Sempra Energy, Senior Unsecured Notes, 4.050% due 12/1/23 | | | 128,764 | |
75,000 | | | | South Carolina Electric & Gas Co., 1st Mortgage Notes, 4.500% due 6/1/64 | | | 71,203 | |
| | | | Southern California Edison Co., 1st Mortgage Notes: | | | | |
125,000 | | | | 4.050% due 3/15/42 | | | 126,313 | |
250,000 | | | | 4.000% due 4/1/47 | | | 249,540 | |
150,000 | | | | Southern California Gas Co., 1st Mortgage Notes, 3.150% due 9/15/24 | | | 149,316 | |
| | | | Southern Co., Senior Unsecured Notes: | | | | |
645,000 | | | | 1.850% due 7/1/19 | | | 637,837 | |
250,000 | | | | 4.400% due 7/1/46 | | | 250,904 | |
150,000 | | | | Southern Co. Gas Capital Corp, Company Guaranteed Notes, 4.400% due 5/30/47 | | | 150,960 | |
250,000 | | | | Southwestern Electric Power Co., Senior Unsecured Notes, 3.900% due 4/1/45 | | | 239,833 | |
100,000 | | | | Southwestern Public Service Co., 1st Mortgage Notes, 4.500% due 8/15/41 | | | 107,331 | |
1,500,000 | | | | SP PowerAssets Ltd., Senior Unsecured Notes, 2.700% due 9/14/22 | | | 1,473,661 | |
200,000 | | | | Transelec SA, Senior Unsecured Notes, 4.625% due 7/26/23. | | | 209,158 | |
800,000 | | | | Transportadora de Gas del Peru SA, Senior Unsecured Notes, 4.250% due 4/30/28 | | | 800,000 | |
| | | | Virginia Electric & Power Co., Senior Unsecured Notes: | | | | |
100,000 | | | | 2.950% due 1/15/22 | | | 99,641 | |
250,000 | | | | 3.500% due 3/15/27 | | | 248,133 | |
250,000 | | | | 4.000% due 1/15/43 | | | 247,926 | |
| | | | | | | | |
| | | | Total Utilities | | | 15,492,775 | |
| | | | | | | | |
| | | | TOTAL CORPORATE BONDS & NOTES (Cost - $289,280,121) | | | 284,541,178 | |
| | | | | | | | |
See Notes to Financial Statements.
112
Schedules of Investments
(continued)
Destinations Core Fixed Income Fund
| | | | | | | | |
Face Amount/Units | | | | Security | | Value | |
COLLATERALIZED MORTGAGE OBLIGATIONS - 18.8% | |
$ 12,533,525 | | | | Banc of America Funding Trust, Series 2007-1, Class TA2, 1.751% (1-Month USD-LIBOR + 0.130%) due 1/25/37(c) | | $ | 10,122,388 | |
| | | | BANK: | | | | |
12,563,272 | | | | Series 2017-BNK4, Class XA, 1.454% due 5/15/50(c)(e) | | | 1,177,875 | |
16,438,000 | | | | Series 2018-BN10, Class XA, 0.754% due 2/15/61(c)(e) | | | 973,256 | |
| | | | BBCMS Mortgage Trust: | | | | |
178,000 | | | | Series 2017-DELC, Class C, 2.788% (1-Month USD-LIBOR + 1.200%) due 8/15/36(b)(c) | | | 177,540 | |
203,000 | | | | Series 2017-DELC, Class D, 3.288% (1-Month USD-LIBOR + 1.700%) due 8/15/36(b)(c) | | | 202,132 | |
424,000 | | | | Series 2017-DELC, Class E, 4.088% (1-Month USD-LIBOR + 2.500%) due 8/15/36(b)(c) | | | 422,209 | |
407,000 | | | | Series 2017-DELC, Class F, 5.088% (1-Month USD-LIBOR + 3.500%) due 8/15/36(b)(c) | | | 405,367 | |
5,608,989 | | | | Bear Stearns ALT-A Trust, Series 2006-1, Class 21A2, 3.435% due 2/25/36(c) | | | 4,965,964 | |
| | | | BX Trust: | | | | |
339,000 | | | | Series 2017-SLCT, Class D, 3.638% (1-Month USD-LIBOR + 2.050%) due 7/15/34(b)(c) | | | 340,162 | |
558,000 | | | | Series 2017-SLCT, Class E, 4.738% (1-Month USD-LIBOR + 3.150%) due 7/15/34(b)(c) | | | 561,136 | |
| | | | CD Mortgage Trust: | | | | |
400,000 | | | | Series 2017-CD3, Class A4, 3.631% due 2/10/50 | | | 403,700 | |
20,333,161 | | | | Series 2017-CD4, Class XA, 1.326% due 5/10/50(c)(e) | | | 1,744,178 | |
| | | | CFCRE Commercial Mortgage Trust: | | | | |
2,054,000 | | | | Series 2016-C3, Class D, 3.052% due 1/10/48(b)(c) | | | 1,522,946 | |
2,044,628 | | | | Series 2016-C3, Class XA, 1.070% due 1/10/48(c)(e) | | | 131,915 | |
1,906,000 | | | | Series 2016-C7, Class A3, 3.839% due 12/10/54 | | | 1,947,633 | |
16,737,907 | | | | Series 2017-C8, Class XA, 1.673% due 6/15/50(c)(e) | | | 1,794,295 | |
| | | | Citigroup Commercial Mortgage Trust: | | | | |
38,059,253 | | | | Series 2015-GC35, Class XA, 0.887% due 11/10/48(c)(e) | | | 1,734,467 | |
1,250,000 | | | | Series 2016-GC37, Class A4, 3.314% due 4/10/49 | | | 1,231,831 | |
| | | | CLNS Trust: | | | | |
565,000 | | | | Series 2017-IKPR, Class D, 3.631% (1-Month USD-LIBOR + 2.050%) due 6/11/32(b)(c) | | | 567,118 | |
565,000 | | | | Series 2017-IKPR, Class E, 5.081% (1-Month USD-LIBOR + 3.500%) due 6/11/32(b)(c) | | | 568,530 | |
565,000 | | | | Series 2017-IKPR, Class F, 6.081% (1-Month USD-LIBOR + 4.500%) due 6/11/32(b)(c) | | | 569,237 | |
| | | | Cold Storage Trust: | | | | |
887,000 | | | | Series 2017-ICE3, Class A, 2.588% (1-Month USD-LIBOR + 1.000%) due 4/15/36(b)(c) | | | 890,505 | |
See Notes to Financial Statements.
113
Schedules of Investments
(continued)
Destinations Core Fixed Income Fund
| | | | | | | | |
Face Amount/Units | | | | Security | | Value | |
COLLATERALIZED MORTGAGE OBLIGATIONS - 18.8% - (continued) | |
$ 1,082,000 | | | | Series 2017-ICE3, Class C, 2.938% (1-Month USD-LIBOR + 1.350%) due 4/15/36(b)(c) | | $ | 1,085,699 | |
273,729,320 | | | | Commercial Mortgage Trust, Series 2013-CR9, Class XA, 0.153% due 7/10/45(c)(e) | | | 1,458,539 | |
| | | | Credit Suisse Commercial Mortgage Capital Trust: | | | | |
713,000 | | | | Series 2017-LSTK, Class C, 3.229% due 4/5/33(b) | | | 707,337 | |
848,000 | | | | Series 2017-LSTK, Class D, 3.331% due 4/5/33(b)(c) | | | 834,360 | |
1,246,000 | | | | Series 2017-LSTK, Class E, 3.331% due 4/5/33(b)(c) | | | 1,219,607 | |
69,653,000 | | | | Series 2017-LSTK, Class XACP, 0.570% due 4/5/33(b)(c)(e) | | | 904,270 | |
25,355,000 | | | | Series 2017-LSTK, Class XBCP, 0.205% due 4/5/33(b)(c)(e) | | | 135,779 | |
3,568,514 | | | | Credit Suisse First Boston Mortgage Securities Corp., Series 2005-9, Class 5A6, 5.500% due 10/25/35 | | | 3,210,159 | |
| | | | Federal Home Loan Mortgage Corp. (FHLMC), REMICS: | | | | |
10,808,490 | | | | Series 4223, Class SB, 3.531% (1-Month USD-LIBOR + 5.431%) due 7/15/43(c) | | | 8,535,271 | |
4,364,623 | | | | Series 4627, Class Z, 3.000% due 10/15/46 | | | 3,878,206 | |
12,263,464 | | | | Series 4640, Class VB, 3.000% due 3/15/37 | | | 11,494,265 | |
7,493,597 | | | | Series 4653, Class Z, 3.000% due 2/15/47 | | | 6,540,044 | |
7,947,598 | | | | Series 4655, Class CZ, 3.000% due 2/15/47 | | | 6,861,984 | |
26,553,047 | | | | Series 4664, Class TC, 3.000% due 6/15/41 | | | 26,278,181 | |
8,000,000 | | | | Series 4749, Class LV, 3.500% due 4/15/38 | | | 7,950,217 | |
19,886,372 | | | | Series 4750, Class PA, 3.000% due 7/15/46 | | | 19,660,008 | |
| | | | Federal National Mortgage Association (FNMA), REMICS: | | | | |
13,292,693 | | | | Series 2016-61, Class MZ, 3.000% due 9/25/46 | | | 11,455,458 | |
35,105,174 | | | | Series 2017-12, Class TA, 3.000% due 4/25/42 | | | 34,888,200 | |
7,731,019 | | | | Series 2017-24, Class LG, 3.000% due 4/25/37 | | | 7,137,350 | |
22,820,181 | | | | Series 2017-32, Class CA, 3.000% due 10/25/42 | | | 22,519,116 | |
| | | | Freddie Mac Multifamily Structured Pass-Through Certificates: | | | | |
1,750,000 | | | | Series K020, Class A2, 2.373% due 5/25/22 | | | 1,717,548 | |
1,540,000 | | | | Series K062, Class A2, 3.413% due 12/25/26 | | | 1,556,801 | |
| | | | Great Wolf Trust: | | | | |
272,000 | | | | Series 2017-WOLF, Class D, 3.838% (1-Month USD-LIBOR + 2.100%) due 9/15/34(b)(c) | | | 273,444 | |
422,000 | | | | Series 2017-WOLF, Class E, 4.838% (1-Month USD-LIBOR + 3.100%) due 9/15/34(b)(c) | | | 425,163 | |
225,000 | | | | Series 2017-WOLF, Class F, 5.808% (1-Month USD-LIBOR + 4.070%) due 9/15/34(b)(c) | | | 226,686 | |
| | | | GS Mortgage Securities Trust: | | | | |
896,614 | | | | Series 2012-GC6, Class A3, 3.482% due 1/10/45 | | | 908,085 | |
See Notes to Financial Statements.
114
Schedules of Investments
(continued)
Destinations Core Fixed Income Fund
| | | | | | | | |
Face Amount/Units | | | | Security | | Value | |
COLLATERALIZED MORTGAGE OBLIGATIONS - 18.8% - (continued) | |
$ 1,740,000 | | | | Series 2015-GC28, Class D, 4.326% due 2/10/48(b)(c) | | $ | 1,371,594 | |
10,563,252 | | | | Series 2017-GS7, Class XA, 1.141% due 8/10/50(c)(e) | | | 861,238 | |
10,464,358 | | | | HarborView Mortgage Loan Trust, Series 2006-14, Class 2A1A, 1.744% (1-Month USD-LIBOR + 0.150%) due 1/25/47(c) | | | 9,456,259 | |
| | | | JP Morgan Chase Commercial Mortgage Securities Corp.: | | | | |
214,000 | | | | Series 2017-FL10, Class B, 2.588% (1-Month USD-LIBOR + 1.000%) due 6/15/32(b)(c) | | | 215,721 | |
161,000 | | | | Series 2017-FL10, Class C, 2.838% (1-Month USD-LIBOR + 1.250%) due 6/15/32(b)(c) | | | 162,751 | |
523,000 | | | | Series 2017-FL10, Class D, 3.488% (1-Month USD-LIBOR + 1.900%) due 6/15/32(b)(c) | | | 526,525 | |
955,674 | | | | JP Morgan Chase Commercial Mortgage Securities Trust,
Series 2012-C8, Class A3, 2.829% due 10/15/45 | | | 942,113 | |
| | | | JPMBB Commercial Mortgage Securities Trust: | | | | |
1,667,000 | | | | Series 2015-C27, Class C, 4.344% due 2/15/48(c) | | | 1,631,251 | |
1,906,000 | | | | Series 2015-C28, Class C, 4.237% due 10/15/48(c) | | | 1,831,716 | |
1,817,000 | | | | Merrill Lynch Mortgage Trust, Series 2005-MKB2, Class F, 6.316% due 9/12/42(b)(c) | | | 1,905,564 | |
| | | | Morgan Stanley Bank of America Merrill Lynch Trust: | | | | |
2,000,000 | | | | Series 2014-C17, Class C, 4.451% due 8/15/47(c) | | | 1,954,468 | |
26,727,093 | | | | Series 2014-C19, Class XA, 1.122% due 12/15/47(c)(e) | | | 1,217,056 | |
852,000 | | | | Series 2016-C31, Class C, 4.319% due 11/15/49(c) | | | 833,469 | |
35,284,399 | | | | Series 2016-C32, Class XA, 0.766% due 12/15/49(c)(e) | | | 1,758,472 | |
| | | | Morgan Stanley Capital I Trust: | | | | |
1,964,000 | | | | Series 2011-C1, Class D, 5.426% due 9/15/47(b)(c) | | | 2,046,822 | |
25,580,553 | | | | Series 2016-BNK2, Class XA, 1.111% due 11/15/49(c)(e) | | | 1,697,219 | |
18,369,735 | | | | Series 2016-UB11, Class XA, 1.660% due 8/15/49(c)(e) | | | 1,719,168 | |
14,727,325 | | | | Series 2016-UB12, Class XA, 0.820% due 12/15/49(c)(e) | | | 708,172 | |
1,667,000 | | | | PFP Ltd., Series 2017-3, Class C, 4.088% (1-Month USD-LIBOR + 2.500%) due 1/14/35(b)(c) | | | 1,677,341 | |
| | | | RALI Series Trust: | | | | |
3,201,342 | | | | Series 2005-QS13, Class 1A3, 5.500% due 9/25/35 | | | 2,991,613 | |
26,962,427 | | | | Series 2007-QH5, Class AII, 1.851% (1-Month USD-LIBOR + 0.230%) due 6/25/37(c) | | | 15,222,080 | |
| | | | Rosslyn Portfolio Trust: | | | | |
429,000 | | | | Series 2017-ROSS, Class A, 2.510% (1-Month USD-LIBOR + 0.950%) due 6/15/33(b)(c) | | | 429,309 | |
429,000 | | | | Series 2017-ROSS, Class B, 2.810% (1-Month USD-LIBOR + 1.250%) due 6/15/33(b)(c) | | | 429,311 | |
| | | | UBS Commercial Mortgage Trust: | | | | |
7,129,941 | | | | Series 2017-C1, Class XA, 1.610% due 6/15/50(c)(e) | | | 766,741 | |
See Notes to Financial Statements.
115
Schedules of Investments
(continued)
Destinations Core Fixed Income Fund
| | | | | | | | |
Face Amount/Units | | | | Security | | Value | |
COLLATERALIZED MORTGAGE OBLIGATIONS - 18.8% - (continued) | |
$ 979,000 | | | | Series 2018-C8, Class C, 4.705% due 2/15/51(c) | | $ | 960,663 | |
5,165,696 | | | | UBS-Barclays Commercial Mortgage Trust, Series 2013-C5, Class XA, 0.978% due 3/10/46(b)(c)(e) | | | 204,464 | |
1,686,000 | | | | UBS-Citigroup Commercial Mortgage Trust, Series 2011-C1, Class D, 6.051% due 1/10/45(b)(c) | | | 1,788,748 | |
1,849,000 | | | | Wachovia Bank Commercial Mortgage Trust, Series 2007-C33, Class AJ, 6.008% due 2/15/51(c) | | | 1,858,245 | |
| | | | Wells Fargo Commercial Mortgage Trust: | | | | |
295,000 | | | | Series 2010-C1, Class C, 5.597% due 11/15/43(b)(c) | | | 305,131 | |
1,356,000 | | | | Series 2015-C27, Class C, 3.894% due 2/15/48 | | | 1,268,275 | |
1,000,000 | | | | Series 2015-LC20, Class A3, 3.086% due 4/15/50 | | | 996,194 | |
2,581,000 | | | | Series 2015-NXS4, Class E, 3.600% due 12/15/48(b)(c) | | | 2,028,889 | |
17,770,782 | | | | Series 2016-C33, Class XA, 1.796% due 3/15/59(c)(e) | | | 1,731,571 | |
11,115,479 | | | | Series 2016-NXS6, Class XA, 1.652% due 11/15/49(c)(e) | | | 1,033,279 | |
10,481,343 | | | | Series 2017-C38, Class XA, 1.087% due 7/15/50(c)(e) | | | 777,190 | |
1,200,000 | | | | Series 2017-C42, Class A4, 3.589% due 12/15/50 | | | 1,201,405 | |
1,505,000 | | | | WFRBS Commercial Mortgage Trust, Series 2012-C6, Class A4, 3.440% due 4/15/45 | | | 1,520,892 | |
| | | | | | | | |
| | | | TOTAL COLLATERALIZED MORTGAGE OBLIGATIONS (Cost - $290,307,540) | | | 282,347,080 | |
| | | | | | | | |
ASSET-BACKED SECURITIES - 11.1% | |
3,473,400 | | | | Apollo Aviation Securitization Equity Trust, Series 2018-1A, Class A, 3.844% due 1/16/38(b) | | | 3,473,395 | |
4,440,271 | | | | Bayview Opportunity Master Fund IIIb Trust, Series 2017-RN2, Class A1, 3.475% due 4/28/32(b)(c) | | | 4,437,160 | |
4,544,650 | | | | Bayview Opportunity Master Fund IVb Trust, Series 2017-RPL1, Class A1, step bond to yield, 3.105% due 7/28/32(b) | | | 4,528,217 | |
1,000,000 | | | | CFIP CLO Ltd., Series 2014-1A, Class AR, 3.042% (3-Month USD-LIBOR + 1.320%) due 7/13/29(b)(c) | | | 1,005,765 | |
200,000 | | | | Citibank Credit Card Issuance Trust, Series 2017-A3, Class A3, 1.920% due 4/7/22 | | | 196,853 | |
1,240,625 | | | | Coinstar Funding LLC Series, Series 2017-1A, Class A2, 5.216% due 4/25/47(b) | | | 1,277,062 | |
1,000,000 | | | | CVP CLO Ltd., Series 2017-1A, Class A, 3.085% (3-Month USD-LIBOR + 1.340%) due 7/20/30(b)(c) | | | 999,138 | |
1,000,000 | | | | Elevation CLO Ltd., Series 2014-2A, Class A1R, 2.580% (3-Month USD-LIBOR + 1.230%) due 10/15/29(b)(c) | | | 1,003,665 | |
| | | | GCAT LLC: | | | | |
12,416,290 | | | | Series 2017-2, Class A1, step bond to yield, 3.500% due 4/25/47(b) | | | 12,350,195 | |
See Notes to Financial Statements.
116
Schedules of Investments
(continued)
Destinations Core Fixed Income Fund
| | | | | | | | |
Face Amount/Units | | | | Security | | Value | |
ASSET-BACKED SECURITIES - 11.1% - (continued) | |
$ 8,909,165 | | | | Series 2017-3, Class A1, step bond to yield, 3.352% due 4/25/47(b) | | $ | 8,870,960 | |
5,848,690 | | | | Series 2017-5, Class A1, step bond to yield, 3.228% due 7/25/47(b) | | | 5,824,633 | |
4,889,381 | | | | Helios Issuer LLC Series, Series 2017-1A, Class A, 4.940% due 9/20/49(b) | | | 4,967,129 | |
| | | | Invitation Homes Trust: | | | | |
2,240,000 | | | | Series 2018-SFR1, Class C, 2.818% (1-Month USD-LIBOR + 1.250%) due 3/17/37(b)(c) | | | 2,261,048 | |
1,425,000 | | | | Series 2018-SFR1, Class D, 3.018% (1-Month USD-LIBOR + 1.450%) due 3/17/37(b)(c) | | | 1,435,685 | |
995,000 | | | | Jimmy Johns Funding LLC, Series 2017-1A, Class A2II, 4.846% due 7/30/47(b) | | | 1,005,935 | |
1,000,000 | | | | KVK CLO Ltd., Series 2015-1A, Class AR, 2.686% (3-Month USD-LIBOR + 1.250%) due 5/20/27(b)(c) | | | 1,003,592 | |
1,000,000 | | | | LCM XV LP, Series 15A, Class DR, 5.445% (3-Month USD-LIBOR + 3.700%) due 7/20/30(b)(c) | | | 1,028,098 | |
1,000,000 | | | | Madison Park Funding XI Ltd., Series 2013-11A, Class AR, 2.904% (3-Month USD-LIBOR + 1.160%) due 7/23/29(b)(c) | | | 1,000,625 | |
1,000,000 | | | | Marathon CLO V Ltd., Series 2013-5A, Class A1R, 2.762% (3-Month USD-LIBOR + 0.870%) due 11/21/27(b)(c) | | | 998,688 | |
2,000,000 | | | | Marathon CLO VII Ltd., Series 2014-7A, Class A1R, 3.080% (3-Month USD-LIBOR + 1.320%) due 10/28/25(b)(c) | | | 2,012,750 | |
| | | | Marlette Funding Trust: | | | | |
582,221 | | | | Series 2017-2A, Class A, 2.390% due 7/15/24(b) | | | 581,970 | |
1,000,000 | | | | Series 2018-1A, Class A, 2.610% due 3/15/28(b) | | | 999,443 | |
1,500,000 | | | | Midocean Credit CLO VII, Series 2017-7A, Class A1, 3.042% (3-Month USD-LIBOR + 1.320%) due 7/15/29(b)(c) | | | 1,500,906 | |
1,000,000 | | | | MP CLO III LTD, Series 2013-1A, Class AR, 2.995% (3-Month USD-LIBOR + 1.250%) due 10/20/30(b)(c) | | | 1,006,038 | |
1,000,000 | | | | MP CLO IV Ltd., Series 2013-2A, Class ARR, 3.025% (3-Month USD-LIBOR + 1.280%) due 7/25/29(b)(c) | | | 1,004,640 | |
7,255,136 | | | | New Residential Mortgage Loan Trust, Series 2017-RPL1, Class A1, step bond to yield, 3.598% due 4/25/22(b) | | | 7,236,998 | |
2,000,000 | | | | Nissan Auto Receivables Owner Trust, Series 2017-A, Class A3, 1.740% due 8/16/21 | | | 1,974,959 | |
1,000,000 | | | | Northwoods Capital XVI Ltd., Series 2017-16A, Class A, 2.686% (3-Month USD-LIBOR + 1.270%) due 11/15/30(b)(c) | | | 1,008,053 | |
14,378,109 | | | | Oak Hill Advisors Residential Loan Trust, Series 2017-NPL2, Class A1, step bond to yield, 3.000% due 7/25/57(b) | | | 14,289,067 | |
See Notes to Financial Statements.
117
Schedules of Investments
(continued)
Destinations Core Fixed Income Fund
| | | | | | | | |
Face Amount/Units | | | | Security | | Value | |
ASSET-BACKED SECURITIES - 11.1% - (continued) | |
$ 1,000,000 | | | | Octagon Loan Funding Ltd., Series 2014-1A, Class A1R, 3.025% (3-Month USD-LIBOR + 1.140%) due 11/18/26(b)(c) | | $ | 1,001,934 | |
16,451,037 | | | | Option One Mortgage Loan Trust, Series 2007-6, Class 1A1, 1.811% (1-Month USD-LIBOR + 0.190%) due 7/25/37(c) | | | 14,113,103 | |
896,666 | | | | Palmer Square Loan Funding Ltd., Series 2017-1A, Class A1, 2.462% (3-Month USD-LIBOR + 0.740%) due 10/15/25(b)(c) | | | 896,810 | |
13,383,286 | | | | PRPM LLC, Series 2017-2A, Class A1, step bond to yield, 3.470% due 9/25/22(b) | | | 13,261,076 | |
1,000,000 | | | | Rockford Tower CLO Ltd., Series 2017-3A, Class A, 2.859% (3-Month USD-LIBOR + 1.190%) due 10/20/30(b)(c) | | | 1,003,783 | |
1,000,000 | | | | Steele Creek CLO Ltd., Series 2015-1A, Class AR, 3.152% (3-Month USD-LIBOR + 1.260%) due 5/21/29(b)(c) | | | 1,001,490 | |
1,385,721 | | | | Textainer Marine Containers V Ltd., Series 2017-1A, Class A, 3.720% due 5/20/42(b) | | | 1,381,928 | |
1,000,000 | | | | THL Credit Wind River CLO Ltd., Series 2014-2A, Class AR, 2.372% (3-Month USD-LIBOR + 1.140%) due 1/15/31(b)(c) | | | 1,004,000 | |
10,930,408 | | | | VOLT LVI LLC, Series 2017-NPL3, Class A1, step bond to yield, 3.500% due 3/25/47(b) | | | 10,926,877 | |
6,695,446 | | | | VOLT LXI LLC, Series 2017-NPL8, Class A1, step bond to yield, 3.125% due 6/25/47(b) | | | 6,671,580 | |
11,347,999 | | | | WaMu Asset-Backed Certificates WaMu Series Trust, Series 2007-HE4, Class 1A, 1.791% (1- Month USD-LIBOR + 0.170%) due 7/25/47(c) | | | 8,737,734 | |
17,409,701 | | | | Washington Mutural Asset-Backed Certificates WMABS Trust, Series 2006-HE3, Class 1A, 1.776% (1-Month USD-LIBOR + 0.155%) due 8/25/36(c) | | | 15,828,019 | |
1,000,000 | | | | Wellfleet CLO Ltd., Series 2017-2A, Class A1, 2.626% (3-Month USD-LIBOR + 1.250%) due 10/20/29(b)(c) | | | 1,005,450 | |
1,000,000 | | | | Zais CLO 5 Ltd., Series 2016-2A, Class A1, 3.252% (3-Month USD-LIBOR + 1.530%) due 10/15/28(b)(c) | | | 1,003,139 | |
| | | | | | | | |
| | | | TOTAL ASSET-BACKED SECURITIES (Cost - $165,913,580) | | | 167,119,590 | |
| | | | | | | | |
SENIOR LOANS - 2.7% | |
235,000 | | | | Access CIG, LLC, due 2/14/25(f) | | | 236,617 | |
337,554 | | | | Acrisure, LLC, 5.991% (3-Month USD-LIBOR + 4.250%) due 11/22/23 | | | 342,722 | |
| | | | A-L Parent LLC: | | | | |
5,437 | | | | 0.00% due 12/1/23 | | | 5,491 | |
39,563 | | | | due 12/1/23(f) | | | 39,959 | |
See Notes to Financial Statements.
118
Schedules of Investments
(continued)
Destinations Core Fixed Income Fund
| | | | | | | | |
Face Amount/Units | | | | Security | | Value | |
SENIOR LOANS - 2.7% - (continued) | |
$ 551,735 | | | | American Tire Distributors Inc., 5.898% (1-Month USD-LIBOR + 4.250%) due 9/1/21 | | $ | 558,174 | |
110,000 | | | | American Traffic Solutions Inc., due 2/21/25(f) | | | 110,550 | |
119,700 | | | | Applied Systems Inc., 4.943% (3-Month USD-LIBOR + 3.250%) due 9/19/24 | | | 120,298 | |
543,638 | | | | AssuredPartners Inc., 5.148% (1-Month USD-LIBOR + 3.500%) due 10/22/24 | | | 546,780 | |
248,125 | | | | Asurion LLC, 4.648% (1-Month USD-LIBOR + 3.000%) due 11/3/23 | | | 249,366 | |
198,628 | | | | Avantor Inc., due 11/21/24(f) | | | 200,531 | |
625,000 | | | | Avaya Inc., 6.338% (1-Month USD-LIBOR + 4.750%) due 12/5/24 | | | 628,125 | |
225,000 | | | | BCP Renaissance Parent LLC, 5.772% (3-Month USD-LIBOR + 4.000%) due 10/31/24 | | | 226,856 | |
650,088 | | | | BJ’s Wholesale Club Inc., 5.080% (1-Month USD-LIBOR + 3.500%) due 2/3/24 | | | 648,391 | |
45,000 | | | | Blount International Inc., 5.830% (1-Month USD-LIBOR + 4.250%) due 4/12/23 | | | 45,619 | |
457,700 | | | | Brand Energy & Infrastructure Services Inc., 5.996% (2/3-Month USD-LIBOR + 4.250%) due 6/21/24 | | | 460,895 | |
631,825 | | | | Bright Bidco BV, 5.186% (2-Month USD-LIBOR + 3.500%) due 6/30/24 | | | 641,302 | |
237,634 | | | | BWay Holding Co., 4.958% (2/3-Month USD-LIBOR + 3.250%) due 4/3/24 | | | 238,525 | |
249,375 | | | | Canyon Valor Cos., Inc., 4.943% (3-Month USD-LIBOR + 3.250%) due 6/16/23 | | | 250,727 | |
705,000 | | | | Capri Acquisitions BidCo Ltd., 5.022% (3-Month USD-LIBOR + 3.250%) due 11/1/24 | | | 704,563 | |
339,150 | | | | CBS Radio Inc., 4.623% (3-Month USD-LIBOR/PRIME + 2.750%/1.750%) due 11/18/24 | | | 340,703 | |
705,000 | | | | Cengage Learning Inc., 5.838% (1-Month USD-LIBOR + 4.250%) due 6/7/23 | | | 647,035 | |
205,000 | | | | CenturyLink Inc., 4.398% (1-Month USD-LIBOR + 2.750%) due 1/31/25 | | | 201,361 | |
110,406 | | | | Ceva Group PLC, due 3/19/21(f) | | | 108,197 | |
93,005 | | | | Ceva Intercompany BV, due 3/19/21(f) | | | 91,261 | |
15,932 | | | | Ceva Logistics Canada ULC, due 3/19/21(f) | | | 15,634 | |
144,820 | | | | Ceva Logistics US Holdings Inc., due 3/19/21(f) | | | 142,104 | |
259,603 | | | | CHG Healthcare Services Inc., 4.772% (2/3-Month USD-LIBOR + 3.000%) due 6/7/23 | | | 262,090 | |
555,000 | | | | Cincinnati Bell Inc., 5.445% (3-Month USD-LIBOR + 3.750%) due 10/2/24 | | | 559,074 | |
See Notes to Financial Statements.
119
Schedules of Investments
(continued)
Destinations Core Fixed Income Fund
| | | | | | | | |
Face Amount/Units | | | | Security | | Value | |
SENIOR LOANS - 2.7% - (continued) | |
$ 218,118 | | | | CityCenter Holdings LLC, 4.148% (1-Month USD-LIBOR + 2.500%) due 4/18/24 | | $ | 219,019 | |
298,677 | | | | ClubCorp Holdings Inc., 4.943% (3-Month USD-LIBOR + 3.250%) due 9/18/24 | | | 300,331 | |
641,775 | | | | Colorado Buyer Inc., 4.780% (3-Month USD-LIBOR + 3.000%) due 5/1/24 | | | 644,868 | |
275,000 | | | | Compass Power Generation LLC, 5.391% (3-Month USD-LIBOR + 3.750%) due 12/20/24 | | | 277,236 | |
640,101 | | | | Compuware Corp., 5.150% (2-Month USD-LIBOR + 3.500%) due 12/15/21 | | | 647,834 | |
85,000 | | | | Concentra Inc., 4.530% (3-Month USD-LIBOR + 2.750%) due 6/1/22 | | | 85,531 | |
248,805 | | | | Constellis Holdings LLC, 6.693% (3-Month USD-LIBOR + 5.000%) due 4/21/24 | | | 251,293 | |
85,000 | | | | CP VI Bella Midco LLC, 4.686% (3-Month USD-LIBOR + 3.000%) due 12/27/24 | | | 85,000 | |
75,000 | | | | CSC Holdings LLC, 4.139% (3-Month USD-LIBOR + 2.500%) due 1/25/26 | | | 75,062 | |
294,583 | | | | CSM Bakery Solutions Ltd., 5.700% (3-Month USD-LIBOR + 4.000%) due 7/3/20 | | | 290,901 | |
465,000 | | | | Cvent Inc., 5.398% (1-Month USD-LIBOR + 3.750%) due 11/29/24 | | | 468,292 | |
274,000 | | | | CVS Holdings I LP, 4.790% (3-Month USD-LIBOR + 3.000%) due 2/6/25 | | | 272,973 | |
380,000 | | | | Deerfield Dakota Holding LLC, 4.833% (3-Month USD-LIBOR + 3.250%) due 2/13/25 | | | 382,744 | |
11,250 | | | | DexKo Global Inc., 1.967% (2-Month USD-LIBOR + 3.500%) due 7/24/24 | | | 11,363 | |
135,484 | | | | DG Investment Intermediate Holdings 2 Inc., 4.658% (3-Month USD-LIBOR + 3.000%) due 2/3/25 | | | 135,231 | |
9,975 | | | | Digicel International Finance Ltd., 5.020% (3-Month USD-LIBOR + 3.250%) due 5/27/24 | | | 9,992 | |
60,938 | | | | Diplomat Pharmacy Inc., 6.100% (1-Month USD-LIBOR + 4.500%) due 12/20/24 | | | 61,318 | |
615,000 | | | | EAB Global Inc., 5.484% (3-Month USD-LIBOR + 3.750%) due 11/15/24 | | | 616,537 | |
130,000 | | | | EG Group Ltd., due 2/7/25(f) | | | 129,935 | |
75,000 | | | | Equian Buyer Corp., 5.154% (3-Month USD-LIBOR + 3.250%) due 5/20/24 | | | 75,329 | |
640,171 | | | | Equinox Holdings Inc., 4.648% (1-Month USD-LIBOR + 3.500%) due 3/8/24 | | | 644,306 | |
See Notes to Financial Statements.
120
Schedules of Investments
(continued)
Destinations Core Fixed Income Fund
| | | | | | | | |
Face Amount/Units | | | | Security | | Value | |
SENIOR LOANS - 2.7% - (continued) | |
$ 70,000 | | | | EXC Holdings III Corp., 5.161% (6-Month USD-LIBOR + 3.500%) due 12/2/24 | | $ | 70,547 | |
214,463 | | | | Exgen Renewables IV LLC, 4.990% (3-Month USD-LIBOR + 3.000%) due 11/28/24 | | | 216,339 | |
511,751 | | | | Federal-Mogul Corp., 5.355% (1-Month USD-LIBOR + 3.750%) due 4/15/21 | | | 514,596 | |
105,000 | | | | Flexera Software LLC, due 2/26/25(f) | | | 105,230 | |
98,026 | | | | Forterra Finance LLC, due 10/25/23(f) | | | 91,826 | |
486,197 | | | | FTS International Inc., due 4/16/21(f) | | | 486,197 | |
322,567 | | | | Gates Global LLC, 4.443% (3-Month USD-LIBOR + 2.750%) due 4/1/24 | | | 324,583 | |
89,546 | | | | Golden Nugget Inc., 4.979% (1/2-Month USD-LIBOR + 3.250%) due 10/4/23 | | | 90,230 | |
300,000 | | | | Gopher Resource LLC, due 2/9/25(f) | | | 302,250 | |
375,000 | | | | Graftech International Ltd., 5.081% (3-Month USD-LIBOR + 3.500%) due 2/12/25 | | | 374,531 | |
631,792 | | | | Greeneden US Holdings I LLC, 5.443% (3-Month USD-LIBOR + 3.750%) due 12/1/23 | | | 633,896 | |
113,803 | | | | GW Honos Security Corp., 7.000% (3-Month USD-LIBOR + 2.500%) due 5/24/24 | | | 114,774 | |
673,313 | | | | Hayward Industries Inc., 5.148% (1-Month USD-LIBOR + 3.500%) due 8/5/24 | | | 675,837 | |
700,000 | | | | Intelsat Jackson Holdings SA, 5.706% (3-Month USD-LIBOR + 3.750%) due 11/27/23 | | | 694,624 | |
710,000 | | | | Intralinks Inc., 5.700% (3-Month USD-LIBOR + 4.000%) due 11/14/24 | | | 711,186 | |
535,000 | | | | Intrawest Resorts Holdings Inc., 4.898% (1-Month USD-LIBOR + 3.250%) due 7/31/24 | | | 536,675 | |
90,000 | | | | Invictus U.S. Newco LLC, due 2/14/25(f) | | | 90,600 | |
190,000 | | | | IRB Holding Corp., 4.829% (1-Month USD-LIBOR + 3.250%) due 2/5/25 | | | 191,765 | |
635,132 | | | | Kenan Advantage Group Holdings Corp., 4.648% (1-Month USD-LIBOR + 3.000%) due 7/29/22 | | | 636,719 | |
748,363 | | | | Klockner Pentaplast of America Inc., 5.943% (3-Month USD-LIBOR + 4.250%) due 6/30/22 | | | 735,266 | |
645,000 | | | | Kronos Acquisition Intermediate Inc., 6.175% (3-Month USD-LIBOR + 4.500%) due 8/26/22 | | | 649,438 | |
280,000 | | | | Lucid Energy Group II Borrower LLC, 4.588% (3-Month USD-LIBOR + 3.000%) due 2/17/25 | | | 280,176 | |
150,000 | | | | Marketo Inc., 5.043% (3-Month USD-LIBOR + 3.250%) due 2/7/25 | | | 149,625 | |
See Notes to Financial Statements.
121
Schedules of Investments
(continued)
Destinations Core Fixed Income Fund
| | | | | | | | |
Face Amount/Units | | | | Security | | Value | |
SENIOR LOANS - 2.7% - (continued) | |
$ 270,000 | | | | Meredith Corp., 4.658% (2-Month USD-LIBOR + 3.000%) due 1/31/25 | | $ | 271,477 | |
623,080 | | | | Milacron LLC, 4.398% (1-Month USD-LIBOR + 2.750%) due 9/28/23 | | | 624,445 | |
| | | | Mitchell International Inc.: | | | | |
522,836 | | | | 4.943% (3-Month USD-LIBOR + 3.250%) due 11/29/24 | | | 524,049 | |
140,000 | | | | 8.943% (3-Month USD-LIBOR + 7.250%) due 12/1/25 | | | 140,840 | |
322,653 | | | | Optiv Inc., 4.875% (1-Month USD-LIBOR + 3.250%) due 2/1/24 | | | 306,924 | |
570,000 | | | | Oryx Southern Delaware Holdings LLC, due 2/28/25(f) | | | 569,288 | |
678,300 | | | | Peak 10 Holding Corp., 5.193% (3-Month USD-LIBOR + 3.500%) due 8/1/24 | | | 679,657 | |
105,000 | | | | Phoenix Services International LLC, due 1/30/25(f) | | | 106,050 | |
29,925 | | | | Pike Corp., 5.150% (1-Month USD-LIBOR + 3.500%) due 9/20/24 | | | 30,187 | |
628,421 | | | | Playa Resorts Holding BV, 5.000% (2/3-Month USD-LIBOR + 3.250%) due 4/29/24 | | | 632,085 | |
174,563 | | | | PODS, LLC 4.579% (1-Month USD-LIBOR + 3.000%) due 12/6/24 | | | 175,654 | |
735,000 | | | | Power Borrower LLC, due 3/6/25(f) | | | 735,000 | |
195,000 | | | | Pro Mach Group Inc., due 3/7/25(f) | | | 195,488 | |
641,775 | | | | Project Alpha Intermediate Holding Inc., 5.040% (3-Month USD-LIBOR + 3.500%) due 4/26/24 | | | 632,752 | |
666,794 | | | | Quest Software US Holdings Inc., 7.272% (3-Month USD-LIBOR + 5.500%) due 10/31/22 | | | 677,390 | |
645,125 | | | | Radiate Holdco LLC, 4.648% (1-Month USD-LIBOR + 3.000%) due 2/1/24 | | | 643,951 | |
565,000 | | | | RentPath LLC, 6.400% (1-Month USD-LIBOR + 4.750%) due 12/17/21 | | | 566,412 | |
645,113 | | | | Reynolds Group Holdings Inc., 4.398% (1-Month USD-LIBOR + 2.750%) due 2/5/23 | | | 647,938 | |
240,000 | | | | Robertshaw US Holding Corp., due 2/15/25(f) | | | 241,951 | |
65,000 | | | | Sarbacane Topco Inc., 4.770% (3-Month USD-LIBOR + 3.000%) due 1/29/25 | | | 65,406 | |
683,313 | | | | Scientific Games International Inc., 4.449% (3-Month USD-LIBOR + 2.750%) due 8/14/24 | | | 686,305 | |
120,423 | | | | SCS Holdings I Inc., 5.898% (1-Month USD-LIBOR + 4.250%) due 10/30/22 | | | 121,276 | |
694,413 | | | | Securus Technologies Holdings Inc, 6.148% (1-Month USD-LIBOR + 4.500%) due 11/1/24 | | | 701,794 | |
See Notes to Financial Statements.
122
Schedules of Investments
(continued)
Destinations Core Fixed Income Fund
| | | | | | | | |
Face Amount/Units | | | | Security | | Value | |
SENIOR LOANS - 2.7% - (continued) | |
$ 635,200 | | | | Select Medical Corp., 5.210% (2/3-Month USD-LIBOR/PRIME + 3.500%/2.500%) due 3/1/21 | | $ | 637,582 | |
195,000 | | | | Shutterfly Inc., due 8/17/24(f) | | | 195,854 | |
100,000 | | | | SMG US Midco 2 Inc., 4.890% (2-Month USD-LIBOR + 3.250%) due 1/23/25 | | | 100,750 | |
640,114 | | | | Solera LLC, 0.00% due 3/3/23 | | | 641,445 | |
704,871 | | | | Sophia LP, 4.943% (3-Month USD-LIBOR + 3.250%) due 9/30/22 | | | 705,554 | |
705,000 | | | | Southern Graphics Inc., 5.148% (1/3-Month USD-LIBOR + 3.500%) due 12/31/22 | | | 710,506 | |
485,000 | | | | SS&C Technologies Holdings Inc., due 2/28/25(f) | | | 487,425 | |
234,413 | | | | Staples Inc., 5.787% (3-Month USD-LIBOR + 4.000%) due 9/12/24 | | | 232,802 | |
175,000 | | | | Syncreon Global Finance (US) Inc., 6.022% (3-Month USD-LIBOR + 4.250%) due 10/28/20 | | | 155,167 | |
650,088 | | | | Team Health Holdings Inc., 4.398% (1-Month USD-LIBOR + 2.750%) due 2/6/24 | | | 631,937 | |
640,163 | | | | TKC Holdings Inc., 6.030% (2/3-Month USD-LIBOR + 4.250%) due 2/1/23 | | | 646,967 | |
110,000 | | | | Traverse Midstream Partners LLC, 5.850% (3-Month USD-LIBOR + 4.000%) due 9/27/24 | | | 110,734 | |
640,138 | | | | UFC Holdings LLC, 4.900% (1-Month USD-LIBOR + 3.250%) due 8/18/23 | | | 643,038 | |
175,000 | | | | Ultra Resources Inc., 4.588% (1-Month USD-LIBOR + 3.000%) due 4/12/24 | | | 174,212 | |
309,026 | | | | Univar USA Inc., 4.148% (1-Month USD-LIBOR + 2.500%) due 7/1/24 | | | 310,515 | |
560,000 | | | | West Corp., due 10/10/24(f) | | | 564,586 | |
170,000 | | | | Wink Holdco Inc., due 12/2/24(f) | | | 169,150 | |
340,000 | | | | Zodiac Pool Solutions LLC, 5.693% (3-Month USD-LIBOR + 4.000%) due 12/20/23 | | | 340,000 | |
| | | | | | | | |
| | | | TOTAL SENIOR LOANS (Cost - $40,396,827) | | | 40,419,498 | |
| | | | | | | | |
SOVEREIGN BONDS - 1.6% | | | | |
Canada - 0.1% | | | | |
1,000,000 | | | | Province of Ontario Canada, 2.400% due 2/8/22 | | | 980,918 | |
750,000 | | | | Province of Quebec Canada, 2.375% due 1/31/22 | | | 735,475 | |
| | | | | | | | |
| | | | Total Canada | | | 1,716,393 | |
| | | | | | | | |
Chile - 0.2% | |
| | | | Chile Government International Bond: | | | | |
300,000 | | | | 2.250% due 10/30/22. | | | 287,250 | |
See Notes to Financial Statements.
123
Schedules of Investments
(continued)
Destinations Core Fixed Income Fund
| | | | | | | | |
Face Amount/Units | | | | Security | | Value | |
Chile - 0.2% - (continued) | |
$ 400,000 | | | | 3.125% due 3/27/25 | | $ | 394,400 | |
2,000,000 | | | | 3.125% due 1/21/26 | | | 1,967,000 | |
| | | | | | | | |
| | | | Total Chile | | | 2,648,650 | |
| | | | | | | | |
Colombia - 0.1% | |
| | | | Colombia Government International Bond: | | | | |
750,000 | | | | 3.875% due 4/25/27 | | | 730,500 | |
250,000 | | | | 5.625% due 2/26/44 | | | 269,750 | |
| | | | | | | | |
| | | | Total Colombia | | | 1,000,250 | |
| | | | | | | | |
Hungary - 0.0% | |
500,000 | | | | Hungary Government International Bond, 6.375% due 3/29/21 | | | 546,000 | |
| | | | | | | | |
India - 0.1% | |
| | | | Export-Import Bank of India: | | | | |
200,000 | | | | 2.892% due 8/21/22(c) | | | 200,832 | |
1,000,000 | | | | 4.000% due 1/14/23 | | | 1,012,168 | |
| | | | | | | | |
| | | | Total India | | | 1,213,000 | |
| | | | | | | | |
Indonesia - 0.1% | |
800,000 | | | | Indonesia Government International Bond, 4.875% due 5/5/21 | | | 836,829 | |
1,300,000 | | | | Perusahaan Penerbit SBSN Indonesia III, 4.150% due 3/29/27(b) | | | 1,288,625 | |
| | | | | | | | |
| | | | Total Indonesia | | | 2,125,454 | |
| | | | | | | | |
Israel - 0.1% | |
| | | | Israel Government International Bond: | | | | |
400,000 | | | | 4.000% due 6/30/22 | | | 413,896 | |
900,000 | | | | 3.150% due 6/30/23 | | | 897,726 | |
700,000 | | | | 2.875% due 3/16/26 | | | 670,526 | |
| | | | | | | | |
| | | | Total Israel | | | 1,982,148 | |
| | | | | | | | |
Japan - 0.1% | |
| | | | Japan Bank for International Cooperation: | | | | |
500,000 | | | | 1.750% due 5/28/20 | | | 489,846 | |
250,000 | | | | 2.750% due 11/16/27. | | | 239,502 | |
| | | | | | | | |
| | | | Total Japan | | | 729,348 | |
| | | | | | | | |
Mexico - 0.2% | |
| | | | Mexico Government International Bond: | | | | |
500,000 | | | | 3.500% due 1/21/21 | | | 509,250 | |
600,000 | | | | 4.000% due 10/2/23 | | | 611,400 | |
1,000,000 | | | | 4.150% due 3/28/27 | | | 998,500 | |
See Notes to Financial Statements.
124
Schedules of Investments
(continued)
Destinations Core Fixed Income Fund
| | | | | | | | |
Face Amount/Units | | Rating†† | | Security | | Value | |
Mexico - 0.2% - (continued) | |
$ 750,000 | | | | 4.600% due 1/23/46 | | $ | 700,500 | |
| | | | | | | | |
| | | | Total Mexico | | | 2,819,650 | |
| | | | | | | | |
Panama - 0.1% | |
| | | | Panama Government International Bond: | | | | |
600,000 | | | | 4.000% due 9/22/24 | | | 618,000 | |
200,000 | | | | 3.875% due 3/17/28 | | | 201,800 | |
250,000 | | | | 4.500% due 5/15/47 | | | 254,500 | |
| | | | | | | | |
| | | | Total Panama | | | 1,074,300 | |
| | | | | | | | |
Peru - 0.1% | | | | |
700,000 | | | | Fondo MIVIVIENDA SA, 3.500% due 1/31/23 | | | 686,875 | |
100,000 | | | | Peruvian Government International Bond, 5.625% due 11/18/50 | | | 119,500 | |
| | | | | | | | |
| | | | Total Peru | | | 806,375 | |
| | | | | | | | |
Philippines - 0.2% | |
| | | | Philippine Government International Bond: | | | | |
2,100,000 | | | | 4.200% due 1/21/24 | | | 2,188,328 | |
750,000 | | | | 3.950% due 1/20/40 | | | 733,487 | |
| | | | | | | | |
| | | | Total Philippines | | | 2,921,815 | |
| | | | | | | | |
Poland - 0.0% | |
500,000 | | | | Republic of Poland Government International Bond, 4.000% due 1/22/24 | | | 517,580 | |
| | | | | | | | |
South Korea - 0.1% | |
750,000 | | | | Export-Import Bank of Korea, 2.125% due 1/25/20 | | | 737,083 | |
| | | | | | | | |
United States - 0.1% | |
| | | | International Bank for Reconstruction & Development: | | | | |
2,000,000 | | | | 1.875% due 3/15/19 | | | 1,993,540 | |
250,000 | | | | 1.875% due 10/27/26. | | | 228,113 | |
| | | | | | | | |
| | | | Total United States | | | 2,221,653 | |
| | | | | | | | |
Uruguay - 0.0% | |
250,000 | | | | Uruguay Government International Bond, 4.125% due 11/20/45 | | | 235,625 | |
| | | | | | | | |
| | | | TOTAL SOVEREIGN BONDS (Cost - $23,879,250) | | | 23,295,324 | |
| | | | | | | | |
MUNICIPAL BONDS - 0.2% | |
California - 0.1% | |
125,000 | | AA | | Bay Area Toll Authority, Revenue Bonds, Series F2, 6.263% due 4/1/49 | | | 173,052 | |
See Notes to Financial Statements.
125
Schedules of Investments
(continued)
Destinations Core Fixed Income Fund
| | | | | | | | |
Face Amount/Units | | Rating†† | | Security | | Value | |
California - 0.1% - (continued) | |
$ 100,000 | | AA+ | | Los Angeles Community College District, GO, Series E, 6.750% due 8/1/49 | | $ | 146,263 | |
150,000 | | AA+ | | Los Angeles Department of Water & Power Power System Revenue, Revenue Bonds, Series B, 6.603% due 7/1/50 | | | 217,746 | |
150,000 | | AA- | | Los Angeles Unified School District, GO, Series RY, 6.758% due 7/1/34 | | | 199,718 | |
| | | | State of California, GO: | | | | |
100,000 | | AA- | | 7.500% due 4/1/34 | | | 142,774 | |
200,000 | | AA- | | 7.550% due 4/1/39 | | | 301,130 | |
125,000 | | AA- | | 7.600% due 11/1/40 | | | 192,007 | |
| | | | University of California, Revenue Bonds: | | | | |
100,000 | | AA | | Series AJ, 4.601% due 5/15/31 | | | 107,127 | |
25,000 | | AA | | Series AX, 3.063% due 7/1/25 | | | 24,754 | |
75,000 | | AA | | Series R, 5.770% due 5/15/43 | | | 94,599 | |
| | | | | | | | |
| | | | Total California | | | 1,599,170 | |
| | | | | | | | |
Illinois - 0.0% | |
| | | | State of Illinois, GO: | | | | |
250,000 | | BBB- | | 5.100% due 6/1/33 | | | 235,707 | |
100,000 | | BBB- | | 6.725% due 4/1/35 | | | 105,074 | |
| | | | | | | | |
| | | | Total Illinois | | | 340,781 | |
| | | | | | | | |
Massachusetts - 0.0% | |
100,000 | | AA | | Commonwealth of Massachusetts, GO, Series E, 5.456% due 12/1/39 | | | 122,467 | |
| | | | | | | | |
Nevada - 0.0% | |
100,000 | | AA- | | County of Clark Department of Aviation, Revenue Bonds, Series C, 6.820% due 7/1/45 | | | 147,385 | |
| | | | | | | | |
New Jersey - 0.0% | |
100,000 | | A+ | | New Jersey Turnpike Authority, Revenue Bonds, Series F, 7.414% due 1/1/40 | | | 146,729 | |
| | | | | | | | |
New York - 0.1% | |
150,000 | | AA | | Metropolitan Transportation Authority, Revenue Bonds, Series C, 7.336% due 11/15/39 | | | 222,423 | |
125,000 | | AA+ | | New York City Water & Sewer System, Revenue Bonds, Series AA, 5.440% due 6/15/43 | | | 154,049 | |
250,000 | | AAA | | New York State Urban Development Corp., Revenue Bonds, Series B, 2.100% due 3/15/22 | | | 246,472 | |
200,000 | | AA- | | Port Authority of New York & New Jersey, Revenue Bonds, 4.458% due 10/1/62 | | | 215,608 | |
| | | | | | | | |
| | | | Total New York | | | 838,552 | |
| | | | | | | | |
See Notes to Financial Statements.
126
Schedules of Investments
(continued)
Destinations Core Fixed Income Fund
| | | | | | | | |
Face Amount/Units | | Rating†† | | Security | | Value | |
Ohio - 0.0% | | | | | | |
$ 100,000 | | A | | American Municipal Power Inc., Revenue Bonds, Combined Hydroelectric Projects B, 8.084% due 2/15/50 | | $ | 163,150 | |
| | | | | | | | |
Texas - 0.0% | | | | | | |
75,000 | | AAA | | State of Texas, GO, Series A, 5.517% due 4/1/39 | | | 94,481 | |
| | | | | | | | |
Wisconsin - 0.0% | | | | | | |
10,000 | | AA- | | State of Wisconsin, Revenue Bonds,
Series C, 3.154% due 5/1/27. | | | 9,793 | |
| | | | | | | | |
| | | | TOTAL MUNICIPAL BONDS (Cost - $3,438,041) | | | 3,462,508 | |
| | | | | | | | |
| | | | TOTAL INVESTMENTS BEFORE SHORT-TERM INVESTMENTS (Cost - $1,475,096,498) | | | 1,449,346,550 | |
| | | | | | | | |
SHORT-TERM INVESTMENTS - 10.3% | | | | |
TIME DEPOSITS - 10.3% | | | | |
55,286,763 | | | | ANZ National Bank - London, 0.780% due 3/1/18 | | | 55,286,763 | |
5,164,059 | | | | BNP Paribas - Paris, 0.780% due 3/1/18 | | | 5,164,059 | |
53,436,814 | | | | Citibank - New York, 0.780% due 3/1/18. | | | 53,436,814 | |
33,065,484 | | | | Standard Chartered Bank - London, 0.780% due 3/1/18 | | | 33,065,484 | |
7,986,400 | | | | Sumitomo - Tokyo, 0.780% due 3/1/18 | | | 7,986,400 | |
| | | | | | | | |
| | | | TOTAL TIME DEPOSITS (Cost - $154,939,520) | | | 154,939,520 | |
| | | | | | | | |
INVESTMENTS PURCHASED WITH CASH PROCEEDS FROM SECURITIES LENDING - 0.1% | | | | |
MONEY MARKET FUND - 0.1% | | | | |
569,695 | | | | Federated Government Obligations Fund, Premier Class(g) (Cost - $569,695) | | | 569,695 | |
| | | | | | | | |
| | | | TOTAL INVESTMENTS - 107.0% (Cost - $1,630,605,713#) | | | 1,604,855,765 | |
| | | | | | | | |
| | | | Liabilities in Excess of Other Assets - (7.0)% | | | (105,110,755 | ) |
| | | | | | | | |
| | | | TOTAL NET ASSETS - 100.0% | | $ | 1,499,745,010 | |
| | | | | | | | |
| †† | All ratings are by Standard & Poor’s Rating Service, unless otherwise noted (unaudited). |
| (a) | This security is traded on a TBA basis (See Note 5). |
| (b) | Restricted security that may be sold to “qualified institutional buyers” pursuant to the conditions of Rule 144A under the Securities Act of 1933, as amended. This security has been deemed liquid pursuant to guidelines approved by the Board of Trustees, unless otherwise noted. The aggregate value of restricted 144A holdings at February 28, 2018, amounts to approximately $183,571,164 and represents 12.24% of net assets. |
| (c) | Variable rate security. Interest rate disclosed is that which was in effect at February 28, 2018. |
| (d) | All or a portion of this security is on loan (See Note 5). |
See Notes to Financial Statements.
127
Schedules of Investments
(continued)
Destinations Core Fixed Income Fund
| (e) | Interest only security. |
| (f) | This position represents an unsettled loan commitment at period end. Certain details associated with this purchase are not known prior to the settlement date, including coupon rate. |
| (g) | Represents investment of collateral received from securities lending transactions. |
| # | Aggregate cost for federal income tax purposes is $1,630,745,331. |
Abbreviations used in this schedule:
| | | | |
| CLO | | — | | Collateralized Loan Obligation |
CMT | | — | | Constant Maturity Index |
| GO | | — | | General Obligation |
ICE | | — | | Intercontinental Exchange |
LIBOR | | — | | London Interbank Offered Rate |
| LLC | | — | | Limited Liability Company |
| PLC | | — | | Public Limited Company |
| REMICS | | — | | Real Estate Mortgage Investment Conduit |
See pages 186-188 for definitions of ratings.
Summary of Investments by Security Type^ (unaudited)
| | | | |
U.S. Government Agencies & Obligations | | | 20.2 | % |
Mortgage-Backed Securities | | | 20.2 | |
Corporate Bonds & Notes | | | 17.7 | |
Collateralized Mortgage Obligations | | | 17.6 | |
Asset-Backed Securities | | | 10.4 | |
Senior Loans | | | 2.5 | |
Sovereign Bonds | | | 1.5 | |
Municipal Bonds | | | 0.2 | |
Short-Term Investments | | | 9.7 | |
Money Market Fund | | | 0.0 | * |
| | | | |
| | | 100.0 | % |
| | | | |
| ^ | As a percentage of total investments. |
| * | Position represents less than 0.05%. |
See Notes to Financial Statements.
128
Schedules of Investments
(continued)
Destinations Low Duration Fixed Income Fund
| | | | | | | | |
Face
Amount/Units† | | | | Security | | Value | |
CORPORATE BONDS & NOTES - 55.6% | |
Basic Materials - 6.4% | | | | |
$ 740,000 | | | | A Schulman Inc., Company Guaranteed Notes, 6.875% due 6/1/23 | | $ | 784,400 | |
100,000 | | | | Celulosa Arauco y Constitucion SA, Senior Unsecured Notes, 4.750% due 1/11/22 | | | 102,764 | |
3,829,000 | | | | Freeport-McMoRan Inc., Company Guaranteed Notes, 2.375% due 3/15/18 | | | 3,825,937 | |
1,500,000 | | | | Hexion Inc., Senior Secured Notes, 6.625% due 4/15/20 | | | 1,395,000 | |
200,000 | | | | Inversiones CMPC SA, Company Guaranteed Notes, 4.500% due 4/25/22 | | | 205,699 | |
1,178,000 | | | | Kraton Polymers LLC / Kraton Polymers Capital Corp., Company Guaranteed Notes, 10.500% due 4/15/23(a) | | | 1,316,415 | |
2,000,000 | | | | Prince Mineral Holding Corp., Senior Secured Notes, 11.500% due 12/15/19(a) | | | 2,067,500 | |
140,000 | | | | Sherwin-Williams Co., Senior Unsecured Notes, 2.250% due 5/15/20 | | | 138,072 | |
1,520,000 | | | | Signode Industrial Group Lux SA / Signode Industrial Group US Inc., Company Guaranteed Notes, 6.375% due 5/1/22(a) | | | 1,573,200 | |
| | | | | | | | |
| | | | Total Basic Materials | | | 11,408,987 | |
| | | | | | | | |
Communications - 7.1% | | | | |
20,000 | | | | Amazon.com Inc., Senior Unsecured Notes, 1.900% due 8/21/20(a) | | | 19,588 | |
140,000 | | | | AT&T Inc., Senior Unsecured Notes, 2.800% due 2/17/21 | | | 138,942 | |
200,000 | | | | Axiata SPV2 Bhd, Senior Unsecured Notes, 3.466% due 11/19/20 | | | 201,035 | |
75,000 | | | | Comcast Corp., Company Guaranteed Notes, 5.150% due 3/1/20 | | | 78,569 | |
2,522,000 | | | | DISH DBS Corp., Company Guaranteed Notes, 4.250% due 4/1/18 | | | 2,522,000 | |
2,243,000 | | | | HC2 Holdings Inc., Senior Secured Notes, 11.000% due 12/1/19(a) | | | 2,299,075 | |
854,000 | | | | Lamar Media Corp., Company Guaranteed Notes, 5.875% due 2/1/22 | | | 871,849 | |
278,000 | | | | Lee Enterprises Inc., Senior Secured Notes, 9.500% due 3/15/22(a) | | | 291,205 | |
2,685,000 | | | | Level 3 Financing Inc., Company Guaranteed Notes, 6.125% due 1/15/21 | | | 2,730,309 | |
1,033,000 | | | | MHGE Parent LLC / MHGE Parent Finance Inc., Senior Unsecured Notes, 8.500% due 8/1/19(a)(b) | | | 1,027,835 | |
See Notes to Financial Statements.
129
Schedules of Investments
(continued)
Destinations Low Duration Fixed Income Fund
| | | | | | | | |
Face
Amount/Units† | | | | Security | | Value | |
Communications - 7.1% - (continued) | | | | |
$ 1,376,000 | | | | Sprint Communications Inc., Company Guaranteed Notes, 9.000% due 11/15/18(a) | | | 1,427,600 | |
989,000 | | | | TEGNA Inc., Company Guaranteed Notes, 5.125% due 10/15/19 | | | 1,002,599 | |
| | | | | | | | |
| | | | Total Communications | | | 12,610,606 | |
| | | | | | | | |
Consumer Cyclical - 9.1% | | | | |
20,000 | | | | American Honda Finance Corp., Senior Unsecured Notes, 1.950% due 7/20/20 | | | 19,618 | |
477,000 | | | | Brinker International Inc., Senior Unsecured Notes, 2.600% due 5/15/18 | | | 475,807 | |
140,000 | | | | Cintas Corp. No 2, Company Guaranteed Notes, 2.900% due 4/1/22 | | | 138,673 | |
3,112,000 | | | | Dollar Tree Inc., Company Guaranteed Notes, 5.250% due 3/1/20 | | | 3,150,900 | |
800,000 | | EUR | | European Lingerie Group AB, Senior Secured Notes, 7.750%
(3-Month EURIBOR + 0.078%) due 2/22/21(c)(d) | | | 978,440 | |
| | | | General Motors Financial Co., Inc., Company Guaranteed Notes: | | | | |
70,000 | | | | 2.650% due 4/13/20 | | | 69,333 | |
70,000 | | | | 3.200% due 7/6/21 | | | 69,474 | |
2,554,000 | | | | International Automotive Components Group SA, Secured Notes, 9.125% due 6/1/18(a) | | | 2,477,380 | |
2,900,000 | | | | Michaels Stores Inc., Company Guaranteed Notes, 5.875% due 12/15/20(a) | | | 2,943,500 | |
1,978,000 | | | | NAI Entertainment Holdings / NAI Entertainment Holdings Finance Corp., Senior Secured Notes, 5.000% due 8/1/18(a) | | | 1,978,000 | |
140,000 | | | | Newell Brands Inc., Senior Unsecured Notes, 3.150% due 4/1/21 | | | 138,534 | |
1,682,000 | | | | Regal Entertainment Group, Senior Unsecured Notes, 5.750% due 3/15/22 | | | 1,728,255 | |
1,500,000 | | | | William Carter Co., Company Guaranteed Notes, 5.250% due 8/15/21 | | | 1,531,875 | |
588,000 | | | | Yum! Brands Inc., Senior Unsecured Notes, 6.250% due 3/15/18 | | | 588,588 | |
| | | | | | | | |
| | | | Total Consumer Cyclical | | | 16,288,377 | |
| | | | | | | | |
Consumer Non-cyclical - 6.3% | | | | |
200,000 | | | | Adani Ports & Special Economic Zone Ltd., Senior Unsecured Notes, 3.500% due 7/29/20 | | | 200,097 | |
120,000 | | | | Amgen Inc., Senior Unsecured Notes, 2.200% due 5/11/20 | | | 118,352 | |
See Notes to Financial Statements.
130
Schedules of Investments
(continued)
Destinations Low Duration Fixed Income Fund
| | | | | | | | |
Face
Amount/Units† | | | | Security | | Value | |
Consumer Non-cyclical - 6.3% - (continued) | | | | |
| | | | Anthem Inc., Senior Unsecured Notes: | | | | |
$ 70,000 | | | | 2.300% due 7/15/18 | | $ | 70,002 | |
30,000 | | | | 2.500% due 11/21/20 | | | 29,669 | |
140,000 | | | | AstraZeneca PLC, Senior Unsecured Notes, 2.375% due 11/16/20 | | | 138,127 | |
90,000 | | | | BAT Capital Corp., Company Guaranteed Notes, 2.297% due 8/14/20(a) | | | 88,367 | |
1,000,000 | | | | BI-LO LLC / BI-LO Finance Corp., Senior Secured Notes, 9.250% due 2/15/19(a) | | | 967,500 | |
140,000 | | | | Cardinal Health Inc., Senior Unsecured Notes, 1.948% due 6/14/19 | | | 138,662 | |
2,317,000 | | | | Carolina Beverage Group LLC / Carolina Beverage Group Finance Inc., Senior Secured Notes, 10.625% due 8/1/18(a)(e) | | | 2,325,689 | |
140,000 | | | | Celgene Corp., Senior Unsecured Notes, 2.875% due 8/15/20 | | | 139,650 | |
140,000 | | | | CVS Health Corp., Senior Unsecured Notes, 2.800% due 7/20/20 | | | 139,015 | |
144,117 | | | | ENA Norte Trust, Pass-Thru Certificates, 4.950% due 4/25/23 | | | 149,449 | |
200,000 | | | | IOI Investment L Bhd, Company Guaranteed Notes, 4.375% due 6/27/22 | | | 203,087 | |
65,000 | | | | Kroger Co., Company Guaranteed Notes, 6.150% due 1/15/20 | | | 68,755 | |
65,000 | | | | McKesson Corp., Senior Unsecured Notes, 2.284% due 3/15/19 | | | 64,806 | |
40,000 | | | | Molson Coors Brewing Co., Company Guaranteed Notes, 1.450% due 7/15/19 | | | 39,304 | |
3,063,000 | | | | Nielsen Finance LLC / Nielsen Finance Co., Company Guaranteed Notes, 4.500% due 10/1/20 .. | | | 3,074,486 | |
50,000 | | | | Reynolds American Inc., Company Guaranteed Notes, 3.250% due 6/12/20 | | | 50,149 | |
3,258,000 | | | | Wells Enterprises Inc., Senior Secured Notes, 6.750% due 2/1/20(a) | | | 3,315,015 | |
| | | | | | | | |
| | | | Total Consumer Non-cyclical | | | 11,320,181 | |
| | | | | | | | |
Diversified - 0.1% | | | | |
200,000 | | | | CK Hutchison International 17 Ltd., Company Guaranteed Notes, 2.875% due 4/5/22(a) | | | 195,410 | |
| | | | | | | | |
Energy - 2.5% | | | | |
200,000 | | | | Bharat Petroleum Corp., Ltd., Senior Unsecured Notes, 4.625% due 10/25/22 | | | 207,354 | |
200,000 | | | | CNOOC Finance 2015 Australia Pty Ltd., Company Guaranteed Notes, 2.625% due 5/5/20 | | | 198,237 | |
See Notes to Financial Statements.
131
Schedules of Investments
(continued)
Destinations Low Duration Fixed Income Fund
| | | | | | | | |
Face
Amount/Units† | | | | Security | | Value | |
Energy - 2.5% - (continued) | | | | |
$ 200,000 | | | | CNPC General Capital Ltd., Company Guaranteed Notes, 3.950% due 4/19/22 | | $ | 203,605 | |
160,000 | | | | Delek & Avner Tamar Bond Ltd., Senior Secured Notes, 4.435% due 12/30/20(a) | | | 160,406 | |
50,000 | | | | Ecopetrol SA, Senior Unsecured Notes, 7.625% due 7/23/19 | | | 52,875 | |
15,000 | | | | Enterprise Products Operating LLC, Company Guaranteed Notes, 2.800% due 2/15/21 | | | 14,898 | |
200,000 | | | | Indian Oil Corp., Ltd, Senior Unsecured Notes, 5.625% due 8/2/21 | | | 214,066 | |
90,000 | | | | Kinder Morgan Inc., Company Guaranteed Notes, 3.050% due 12/1/19 | | | 90,059 | |
1,296,000 | | | | McDermott International Inc., Secured Notes, 8.000% due 5/1/21(a) | | | 1,326,780 | |
200,000 | | | | ONGC Videsh Ltd., Company Guaranteed Notes, 3.250% due 7/15/19 | | | 200,202 | |
200,000 | | | | Petronas Global Sukuk Ltd., Senior Unsecured Notes, 2.707% due 3/18/20 | | | 198,735 | |
250,000 | | | | Reliance Holding USA Inc., Company Guaranteed Notes, 5.400% due 2/14/22 | | | 264,599 | |
200,000 | | | | Sinopec Group Overseas Development 2015 Ltd., Company Guaranteed Notes, 2.500% due 4/28/20 | | | 197,214 | |
1,146,000 | | | | WPX Energy Inc., Senior Unsecured Notes, 7.500% due 8/1/20 | | | 1,226,220 | |
| | | | | | | | |
| | | | Total Energy | | | 4,555,250 | |
| | | | | | | | |
Financial - 8.6% | | | | |
200,000 | | | | Agromercantil Senior Trust, Company Guaranteed Notes, 6.250% due 4/10/19 | | | 203,024 | |
145,000 | | | | Air Lease Corp., Senior Unsecured Notes, 2.500% due 3/1/21 | | | 142,402 | |
980,000 | | | | Avison Young Canada Inc., Senior Secured Notes, 9.500% due 12/15/21(a) | | | 997,150 | |
200,000 | | | | Banco de Credito del Peru, Senior Unsecured Notes, 2.250% due 10/25/19 | | | 197,400 | |
200,000 | | | | Banco del Estado de Chile, Senior Unsecured Notes, 4.125% due 10/7/20 | | | 204,581 | |
200,000 | | | | Banco GNB Sudameris SA, Senior Unsecured Notes, 3.875% due 5/2/18 | | | 199,700 | |
200,000 | | | | Banco Internacional del Peru SAA, Senior Unsecured Notes, 5.750% due 10/7/20 | | | 210,300 | |
150,000 | | | | Banco Santander Chile, Senior Unsecured Notes, 3.875% due 9/20/22 | | | 151,768 | |
200,000 | | | | Banco Santander Mexico SA Institucion de Banca Multiple Grupo Financiero Santand, Subordinated Notes, 5.950%
(5-Year CMT Index + 4.580%) due 1/30/24(d) | | | 203,750 | |
See Notes to Financial Statements.
132
Schedules of Investments
(continued)
Destinations Low Duration Fixed Income Fund
| | | | | | | | |
Face
Amount/Units† | | | | Security | | Value | |
Financial - 8.6% - (continued) | |
$ 75,000 | | | | Bank of America Corp., Senior Unsecured Notes, 2.814%
(3-Month USD-LIBOR + 0.008%) due 3/5/24(d) | | $ | 75,000 | |
70,000 | | | | Bank of Nova Scotia, Senior Unsecured Notes, 2.150% due 7/14/20 | | | 68,949 | |
65,000 | | | | BNP Paribas SA, Company Guaranteed Notes, 5.000% due 1/15/21 | | | 68,321 | |
145,000 | | | | Capital One Financial Corp., Senior Unsecured Notes, 2.400% due 10/30/20 | | | 142,445 | |
| | | | Citigroup Inc., Senior Unsecured Notes: | | | | |
80,000 | | | | 2.050% due 12/7/18 | | | 79,785 | |
65,000 | | | | 2.705% (3-Month USD-LIBOR + 0.960%) due 4/25/22(d) | | | 65,918 | |
90,000 | | | | Commonwealth Bank of Australia, Senior Unsecured Notes, 2.250% due 3/10/20(a) | | | 88,914 | |
200,000 | | | | DBS Group Holdings Ltd., Junior Subordinated Notes, 3.600% (5-Year USD Swap Rate + 2.390%)(d)(f) | | | 195,880 | |
200,000 | | | | Global Bank Corp., Senior Unsecured Notes, 5.125% due 10/30/19 | | | 205,250 | |
140,000 | | | | Goldman Sachs Group Inc., Senior Unsecured Notes, 2.300% due 12/13/19 | | | 138,835 | |
2,008,000 | | | | Homefed Corp., Company Guaranteed Notes, 6.500% due 10/1/19(a) | | | 1,998,457 | |
3,546,000 | | | | Hunt Cos., Inc., Senior Secured Notes, 9.625% due 3/1/21(a) | | | 3,717,981 | |
2,214,000 | | | | Icahn Enterprises LP / Icahn Enterprises Finance Corp., Company Guaranteed Notes, 6.000% due 8/1/20 | | | 2,257,173 | |
140,000 | | | | JPMorgan Chase & Co., Senior Unsecured Notes, 2.250% due 1/23/20 | | | 138,685 | |
12,000,000 | | SEK | | MaxFastigheter i Sverige AB, Senior Unsecured Notes, 6.500% (3-Month SEK-STIBOR + 0.065%) due 9/15/20(c)(d) | | | 1,426,451 | |
140,000 | | | | Morgan Stanley, Senior Unsecured Notes, 2.675%
(3-Month USD-LIBOR + 0.930%) due 7/22/22(d) | | | 141,546 | |
70,000 | | | | MUFG Americas Holdings Corp., Senior Unsecured Notes, 2.250% due 2/10/20 | | | 69,051 | |
45,000 | | | | Nuveen Finance LLC, Senior Unsecured Notes, 2.950% due 11/1/19(a) | | | 45,021 | |
200,000 | | | | Oversea-Chinese Banking Corp., Ltd., Subordinated Notes, 4.000% (5-Year USD Swap Rate + 2.203%) due 10/15/24(d) | | | 202,007 | |
135,000 | | | | PNC Financial Services Group Inc., Senior Unsecured Notes, 4.375% due 8/11/20 | | | 139,591 | |
105,000 | | | | Prudential Financial Inc., Senior Unsecured Notes, 7.375% due 6/15/19 | | | 111,256 | |
95,000 | | | | Royal Bank of Canada, Senior Unsecured Notes, 1.500% due 7/29/19 | | | 93,565 | |
See Notes to Financial Statements.
133
Schedules of Investments
(continued)
Destinations Low Duration Fixed Income Fund
| | | | | | | | |
Face Amount/Units† | | | | Security | | Value | |
Financial - 8.6% - (continued) | |
3,000,000 | | SEK | | Samhallsbyggnadsbolaget i Norden AB, Senior Unsecured Notes, 3.900% (3-Month SEK-STIBOR + 0.039%) due 1/29/21(c)(d) | | $ | 361,591 | |
$ 130,000 | | | | Simon Property Group LP, Senior Unsecured Notes, 2.200% due 2/1/19 | | | 129,607 | |
200,000 | | | | SPARC EM SPC Panama Metro Line 2 SP, Senior Secured Notes, zero coupon, due 12/5/22 | | | 182,250 | |
20,000 | | | | Sumitomo Mitsui Financial Group Inc., Senior Unsecured Notes, 2.058% due 7/14/21 | | | 19,303 | |
200,000 | | | | Union Bank of the Philippines, Senior Unsecured Notes, 3.369% due 11/29/22 | | | 195,772 | |
200,000 | | | | United Overseas Bank Ltd., Subordinated Notes, 3.750% (5-Year USD Swap Rate + 1.995%) due 9/19/24(d) | | | 201,092 | |
140,000 | | | | Wells Fargo & Co., Senior Unsecured Notes, 2.150% due 1/30/20 | | | 138,075 | |
70,000 | | | | Westpac Banking Corp., Senior Unsecured Notes, 1.600% due 8/19/19 | | | 68,902 | |
| | | | | | | | |
| | | | Total Financial | | | 15,276,748 | |
| | | | | | | | |
Government - 0.2% | |
250,000 | | | | Wakala Global Sukuk Bhd, Senior Unsecured Notes, 4.646% due 7/6/21 | | | 264,070 | |
| | | | | | | | |
Industrial - 8.6% | | | | | | |
2,041,000 | | | | Ardagh Packaging Finance PLC / Ardagh Holdings USA Inc., Company Guaranteed Notes, 6.000% due 6/30/21(a) | | | 2,086,922 | |
140,000 | | | | Caterpillar Financial Services Corp., Senior Unsecured Notes, 2.100% due 1/10/20 | | | 138,771 | |
2,590,000 | | | | Clean Harbors Inc., Company Guaranteed Notes, 5.250% due 8/1/20 | | | 2,602,950 | |
880,000 | | | | Gibraltar Industries Inc., Company Guaranteed Notes, 6.250% due 2/1/21 | | | 892,100 | |
600,000 | | | | Golar LNG Partners LP, Senior Unsecured Notes, 6.304%
(3-Month USD-LIBOR + 4.400%) due 5/22/20(d) | | | 588,000 | |
788,000 | | | | Masco Corp., Senior Unsecured Notes, 6.625% due 4/15/18 | | | 792,096 | |
140,000 | | | | Northrop Grumman Corp., Senior Unsecured Notes, 2.080% due 10/15/20 | | | 137,119 | |
1,000,000 | | | | Orbital ATK Inc., Company Guaranteed Notes, 5.250% due 10/1/21 | | | 1,023,750 | |
145,000 | | | | Packaging Corp. of America, Senior Unsecured Notes, 2.450% due 12/15/20 | | | 142,950 | |
See Notes to Financial Statements.
134
Schedules of Investments
(continued)
Destinations Low Duration Fixed Income Fund
| | | | | | | | |
Face
Amount/Units† | | | | Security | | Value | |
Industrial - 8.6% - (continued) | |
| | | | Ply Gem Industries Inc., Company Guaranteed Notes: | | | | |
$ 409,000 | | | | 6.500% due 2/1/22 | | $ | 423,961 | |
409,000 | | | | 6.500% due 2/1/22 | | | 423,573 | |
200,000 | | | | PSA International Pte Ltd., Senior Unsecured Notes, 4.625% due 9/11/19 | | | 205,580 | |
2,425,677 | | | | Reynolds Group Issuer Inc. / Reynolds Group Issuer LLC / Reynolds Group Issuer Lu, Senior Secured Notes, 5.750% due 10/15/20 | | | 2,459,030 | |
124,000 | | | | Scorpio Tankers Inc., Senior Unsecured Notes, 2.375% due 7/1/19(a) | | | 112,531 | |
2,096,000 | | | | Silgan Holdings Inc., Senior Unsecured Notes, 5.000% due 4/1/20 | | | 2,090,760 | |
992,000 | | | | Teekay Corp., Senior Unsecured Notes, 8.500% due 1/15/20(g) | | | 1,034,160 | |
| | | | United Technologies Corp., Senior Unsecured Notes: | | | | |
55,000 | | | | 1.500% due 11/1/19 | | | 53,937 | |
85,000 | | | | 1.900% due 5/4/20 | | | 83,657 | |
| | | | | | | | |
| | | | Total Industrial | | | 15,291,847 | |
| | | | | | | | |
Technology - 6.5% | |
1,750,000 | | | | ACI Worldwide Inc., Company Guaranteed Notes, 6.375% due 8/15/20(a) | | | 1,767,500 | |
3,000,000 | | | | Amkor Technology Inc., Senior Unsecured Notes, 6.625% due 6/1/21 | | | 3,026,250 | |
275,000 | | | | Dell Inc., Senior Unsecured Notes, 5.650% due 4/15/18 | | | 275,825 | |
3,786,000 | | | | EMC Corp., Senior Unsecured Notes, 1.875% due 6/1/18 | | | 3,774,611 | |
1,460,000 | | | | Infor US Inc., Senior Secured Notes, 5.750% due 8/15/20(a) | | | 1,489,200 | |
1,223,000 | | | | NXP BV / NXP Funding LLC, Company Guaranteed Notes, 3.750% due 6/1/18(a) | | | 1,224,529 | |
| | | | | | | | |
| | | | Total Technology | | | 11,557,915 | |
| | | | | | | | |
Utilities - 0.2% | |
25,000 | | | | American Electric Power Co., Inc., Senior Unsecured Notes, 2.150% due 11/13/20 | | | 24,529 | |
| | | | Consolidated Edison Inc., Senior Unsecured Notes: | | | | |
95,000 | | | | 2.000% due 3/15/20 | | | 93,705 | |
45,000 | | | | 2.000% due 5/15/21 | | | 43,661 | |
75,000 | | | | Southern Co., Senior Unsecured Notes, 1.850% due 7/1/19 | | | 74,167 | |
200,000 | | | | SP PowerAssets Ltd., Senior Unsecured Notes, 2.700% due 9/14/22 | | | 196,488 | |
| | | | | | | | |
| | | | Total Utilities | | | 432,550 | |
| | | | | | | | |
| | | | TOTAL CORPORATE BONDS & NOTES (Cost - $99,814,253) | | | 99,201,941 | |
| | | | | | | | |
See Notes to Financial Statements.
135
Schedules of Investments
(continued)
Destinations Low Duration Fixed Income Fund
| | | | | | | | |
Face
Amount/Units† | | | | Security | | Value | |
ASSET-BACKED SECURITIES - 9.1% | | | | |
$ 1,000,000 | | | | Apidos CLO XVI, Series 2013-16A, Class A1R, 2.719%
(3-Month USD-LIBOR + 0.980%) due 1/19/25(a)(d) | | $ | 1,000,864 | |
| | | | Avant Loans Funding Trust: | | | | |
395,322 | | | | Series 2017-A, Class A, 2.410% due 3/15/21(a) | | | 395,396 | |
359,123 | | | | Series 2017-B, Class A, 2.290% due 6/15/20(a) | | | 358,749 | |
500,000 | | | | Avery Point VII CLO Ltd., Series 2015-7A, Class A1, 3.222% (3-Month USD-LIBOR + 1.500%) due 1/15/28(a)(d) | | | 506,286 | |
277,517 | | | | Bayview Opportunity Master Fund IIIb Trust, Series 2017-RN2, Class A1, 3.475% due 4/28/32(a)(d) | | | 277,323 | |
70,000 | | | | BSPRT Issuer Ltd., Series 2017-FL1, Class A, 2.938%
(1-Month USD-LIBOR + 1.350%) due 6/15/27(a)(d) | | | 70,235 | |
184,444 | | | | CLUB Credit Trust, Series 2017-NP1, Class A, 2.390% due 4/17/23(a) | | | 184,472 | |
125,718 | | | | Conn’s Receivables Funding LLC, Series 2017-A, Class A, 2.730% due 7/15/19(a) | | | 125,752 | |
237,557 | | | | Crown Point CLO II Ltd., Series 2013-2A, Class A1LR, 2.312% (3-Month USD-LIBOR + 0.590%) due 12/31/23(a)(d) | | | 237,605 | |
395,692 | | | | Earnest Student Loan Program LLC, Series 2017-A, Class A2, 2.650% due 1/25/41(a) | | | 387,926 | |
776,018 | | | | GCAT LLC, Series 2017-2, Class A1, step bond to yield, 3.500% due 4/25/47(a) | | | 771,887 | |
425,000 | | | | Halcyon Loan Advisors Funding Ltd., Series 2015-2A, Class A, 3.135% (3-Month USD-LIBOR + 1.390%) due 7/25/27(a)(d) | | | 424,965 | |
200,000 | | | | Invitation Homes Trust, Series 2018-SFR1, Class A, 2.268%
(1-Month USD-LIBOR + 0.700%) due 3/17/37(a)(d) | | | 200,121 | |
| | | | Jamestown CLO IX Ltd.: | | | | |
500,000 | | | | Series 2016-9A, Class A1A, 3.315% (3-Month USD-LIBOR + 1.570%) due 10/20/28(a)(d) | | | 504,889 | |
500,000 | | | | Series 2016-9A, Class A1B, 3.245% (3-Month USD-LIBOR + 1.500%) due 10/20/28(a)(d) | | | 503,773 | |
1,000,000 | | | | Marathon CLO VII Ltd., Series 2014-7A, Class A1R, 3.080% (3-Month USD-LIBOR + 1.320%) due 10/28/25(a)(d) | | | 1,006,375 | |
291,111 | | | | Marlette Funding Trust, Series 2017-2A, Class A, 2.390% due 7/15/24(a) | | | 290,985 | |
725,514 | | | | New Residential Mortgage Loan Trust, Series 2017-RPL1, Class A1, step bond to yield, 3.598% due 4/25/22(a) | | | 723,700 | |
250,000 | | | | OCP CLO Ltd., Series 2014-5A, Class A1R, 0.000% (3-Month USD-LIBOR + 1.080%) due 4/26/31(a)(d) | | | 249,688 | |
1,000,000 | | | | Race Point IX CLO Ltd., Series 2015-9A, Class A1AR, 2.932% (3-Month USD-LIBOR + 1.210%) due 10/15/30(a)(d) | | | 1,005,310 | |
See Notes to Financial Statements.
136
Schedules of Investments
(continued)
Destinations Low Duration Fixed Income Fund
| | | | | | | | |
Face
Amount/Units† | | | | Security | | Value | |
ASSET-BACKED SECURITIES - 9.1% - (continued) | | | | |
| | | | Sofi Consumer Loan Program LLC: | | | | |
$ 689,743 | | | | Series 2017-3, Class A, 2.770% due 5/25/26(a) | | $ | 685,966 | |
704,304 | | | | Series 2017-5, Class A1, 2.140% due 9/25/26(a) | | | 700,814 | |
346,475 | | | | Sofi Professional Loan Program LLC, Series 2017-C, Class A2A, 1.750% due 7/25/40(a) | | | 343,842 | |
765,833 | | | | SpringCastle America Funding LLC, Series 2016-AA, Class A, 3.050% due 4/25/29(a) | | | 766,027 | |
722,195 | | | | U.S. Residential Opportunity Fund IV Trust, Series 2017-1III, Class A, step bond to yield, 3.352% due 11/27/37(a) | | | 719,800 | |
135,633 | | | | Venture VII CDO Ltd., Series 2006-7A, Class A1A, 1.975%
(3-Month USD-LIBOR + 0.230%) due 1/20/22(a)(d) | | | 135,494 | |
641,355 | | | | VOLT LIX LLC, Series 2017-NPL6, Class A1, step bond to yield, 3.250% due 5/25/47(a) | | | 639,356 | |
780,743 | | | | VOLT LVI LLC, Series 2017-NPL3, Class A1, step bond to yield, 3.500% due 3/25/47(a) | | | 780,491 | |
496,899 | | | | VOLT LVII LLC, Series 2017-NPL4, Class A1, step bond to yield, 3.375% due 4/25/47(a) | | | 496,654 | |
827,847 | | | | Wachovia Student Loan Trust, Series 2006-1, Class A5, 1.865% (3-Month USD-LIBOR + 0.120%) due 7/26/27(a)(d) | | | 827,193 | |
1,000,000 | | | | Zais CLO 2 Ltd., Series 2014-2A, Class A1AR, 2.945% (3-Month USD-LIBOR + 1.200%) due 7/25/26(a)(d) | | | 1,000,928 | |
| | | | | | | | |
| | | | TOTAL ASSET-BACKED SECURITIES (Cost - $16,348,285) | | | 16,322,866 | |
| | | | | | | | |
COLLATERALIZED MORTGAGE OBLIGATIONS - 6.2% | | | | |
118,000 | | | | Atrium Hotel Portfolio Trust, Series 2017-ATRM, Class E, 4.638% (1-Month USD-LIBOR + 3.050%) due 11/15/19(a)(d) | | | 116,965 | |
| | | | BANK: | | | | |
1,574,880 | | | | Series 2017-BNK4, Class XA, 1.454% due 5/15/50(d)(h) | | | 147,653 | |
1,901,088 | | | | Series 2017-BNK6, Class XA, 0.879% due 7/15/60(d)(h) | | | 113,561 | |
1,819,446 | | | | Series 2017-BNK9, Class XA, 0.826% due 11/15/54(d)(h) | | | 112,314 | |
275,000 | | | | BBCMS Mortgage Trust, Series 2017-GLKS, Class E, 4.438% (1-Month USD-LIBOR + 2.850%) due 11/15/34(a)(d) | | | 275,044 | |
122,576 | | | | Bear Stearns Commercial Mortgage Securities Trust, Series 2005-PW10, Class AJ, 5.590% due 12/11/40(d) | | | 128,861 | |
| | | | BSPRT Issuer Ltd.: | | | | |
231,000 | | | | Series 2017-FL2, Class A, 2.408% (1-Month USD-LIBOR + 0.820%) due 10/15/34(a)(d) | | | 230,910 | |
81,000 | | | | Series 2017-FL2, Class AS, 2.688% (1-Month USD-LIBOR + 1.100%) due 10/15/34(a)(d) | | | 80,627 | |
81,000 | | | | Series 2017-FL2, Class B, 2.988% (1-Month USD-LIBOR + 1.400%) due 10/15/34(a)(d) | | | 80,773 | |
See Notes to Financial Statements.
137
Schedules of Investments
(continued)
Destinations Low Duration Fixed Income Fund
| | | | | | | | |
Face
Amount/Units† | | | | Security | | Value | |
COLLATERALIZED MORTGAGE OBLIGATIONS - 6.2% - (continued) | | | | |
| | | | BX Trust: | | | | |
$ 27,000 | | | | Series 2017-IMC, Class D, 3.838% (1-Month USD-LIBOR + 2.250%) due 10/15/32(a)(d) | | $ | 27,076 | |
44,000 | | | | Series 2017-IMC, Class E, 4.838% (1-Month USD-LIBOR + 3.250%) due 10/15/32(a)(d) | | | 44,178 | |
117,000 | | | | BXMT Ltd., Series 2017-FL1, Class C, 3.538% (1-Month USD-LIBOR + 1.950%) due 6/15/35(a)(d) | | | 117,269 | |
1,700,740 | | | | CD Mortgage Trust, Series 2017-CD4, Class XA, 1.326% due 5/10/50(d)(h) | | | 145,890 | |
| | | | CFCRE Commercial Mortgage Trust: | | | | |
1,390,016 | | | | Series 2017-C8, Class XA, 1.673% due 6/15/50(d)(h) | | | 149,009 | |
287,000 | | | | Series 2017-C8, Class XB, 0.956% due 6/15/50(d)(h) | | | 21,107 | |
| | | | CHT Mortgage Trust: | | | | |
117,000 | | | | Series 2017-CSMO, Class A, 2.518% (1-Month USD-LIBOR + 0.930%) due 11/15/36(a)(d) | | | 117,317 | |
77,000 | | | | Series 2017-CSMO, Class E, 4.588% (1-Month USD-LIBOR + 3.000%) due 11/15/36(a)(d) | | | 77,436 | |
41,000 | | | | Series 2017-CSMO, Class F, 5.329% (1-Month USD-LIBOR + 3.741%) due 11/15/36(a)(d) | | | 41,231 | |
| | | | CLNS Trust: | | | | |
47,000 | | | | Series 2017-IKPR, Class D, 3.631% (1-Month USD-LIBOR + 2.050%) due 6/11/32(a)(d) | | | 47,176 | |
47,000 | | | | Series 2017-IKPR, Class E, 5.081% (1-Month USD-LIBOR + 3.500%) due 6/11/32(a)(d) | | | 47,294 | |
| | | | Cold Storage Trust: | | | | |
74,000 | | | | Series 2017-ICE3, Class A, 2.588% (1-Month USD-LIBOR + 1.000%) due 4/15/36(a)(d) | | | 74,292 | |
90,000 | | | | Series 2017-ICE3, Class C, 2.938% (1-Month USD-LIBOR + 1.350%) due 4/15/36(a)(d) | | | 90,308 | |
555,920 | | | | COLT Mortgage Loan Trust, Series 2017-1, Class A2, 2.819% due 5/27/47(a)(d) | | | 548,562 | |
| | | | Commercial Mortgage Trust: | | | | |
23,501,293 | | | | Series 2013-CR9, Class XA, 0.153% due 7/10/45(d)(h) | | | 125,224 | |
2,335,102 | | | | Series 2013-LC6, Class XA, 1.413% due 1/10/46(d)(h) | | | 129,811 | |
| | | | Credit Suisse Commercial Mortgage Capital Trust: | | | | |
70,000 | | | | Series 2017-CHOP, Class D, 3.488% (1-Month USD-LIBOR + 1.900%) due 7/15/32(a)(d) | | | 70,264 | |
107,000 | | | | Series 2017-LSTK, Class C, 3.229% due 4/5/33(a) | | | 106,150 | |
128,000 | | | | Series 2017-LSTK, Class D, 3.331% due 4/5/33(a)(d) | | | 125,941 | |
47,000 | | | | Series 2017-LSTK, Class E, 3.331% due 4/5/33(a)(d) | | | 46,005 | |
8,157,000 | | | | Series 2017-LSTK, Class XACP, 0.570% due 4/5/33(a)(d)(h) | | | 105,898 | |
See Notes to Financial Statements.
138
Schedules of Investments
(continued)
Destinations Low Duration Fixed Income Fund
| | | | | | | | |
Face
Amount/Units† | | | | Security | | Value | |
COLLATERALIZED MORTGAGE OBLIGATIONS - 6.2% - (continued) | | | | |
$ 2,969,000 | | | | Series 2017-LSTK, Class XBCP, 0.205% due 4/5/33(a)(d)(h) | | $ | 15,899 | |
| | | | CSAIL Commercial Mortgage Trust: | | | | |
824,564 | | | | Series 2017-C8, Class XA, 1.256% due 6/15/50(d)(h) | | | 63,678 | |
4,831,111 | | | | Series 2017-CX10, Class XA, 0.731% due 11/15/50(d)(h) | | | 262,819 | |
| | | | Deephaven Residential Mortgage Trust: | | | | |
437,540 | | | | Series 2017-1A, Class A1, 2.725% due 12/26/46(a)(d) | | | 431,434 | |
437,540 | | | | Series 2017-1A, Class A2, 2.928% due 12/26/46(a)(d) | | | 433,011 | |
3,625,350 | | | | GS Mortgage Securities Corp. II, Series 2017-GS8, Class XA, 0.983% due 11/10/50(d)(h) | | | 262,149 | |
| | | | GS Mortgage Securities Corp. Trust: | | | | |
77,000 | | | | Series 2017-500K, Class E, 3.088% (1-Month USD-LIBOR + 1.500%) due 7/15/32(a)(d) | | | 77,240 | |
53,000 | | | | Series 2017-500K, Class F, 3.388% (1-Month USD-LIBOR + 1.800%) due 7/15/32(a)(d) | | | 53,199 | |
34,000 | | | | Series 2017-500K, Class G, 4.088% (1-Month USD-LIBOR + 2.500%) due 7/15/32(a)(d) | | | 34,149 | |
| | | | GS Mortgage Securities Trust: | | | | |
109,026 | | | | Series 2013-GC14, Class A2, 2.995% due 8/10/46 | | | 109,157 | |
5,319,511 | | | | Series 2016-GS4, Class XA, 0.596% due 11/10/49(d)(h) | | | 190,529 | |
2,326,111 | | | | Series 2017-GS6, Class XA, 1.051% due 5/10/50(d)(h) | | | 181,347 | |
78,000 | | | | Hilton Orlando Trust, Series 2018-ORL, Class B, 2.624%
(1-Month USD-LIBOR + 1.050%) due 12/15/34(a)(d) | | | 78,122 | |
| | | | JP Morgan Chase Commercial Mortgage Securities Trust: | | | | |
51,594 | | | | Series 2007-LD11, Class AM, 6.040% due 6/15/49(d) | | | 52,309 | |
50,911 | | | | Series 2007-LDPX, Class AM, 5.464% due 1/15/49(d) | | | 51,068 | |
3,612,724 | | | | Series 2014-C20, Class XA, 1.095% due 7/15/47(d)(h) | | | 134,744 | |
25,649 | | | | Series 2014-FL6, Class A, 2.988% (1-Month USD-LIBOR + 1.400%) due 11/15/31(a)(d) | | | 25,662 | |
1,440,113 | | | | JPMBB Commercial Mortgage Securities Trust,
Series 2015-C32, Class XA, 1.470% due 11/15/48(d)(h) | | | 83,896 | |
2,952,259 | | | | Morgan Stanley Bank of America Merrill Lynch Trust,
Series 2016-C32, Class XA, 0.766% due 12/15/49(d)(h) | | | 147,132 | |
| | | | Morgan Stanley Capital I Trust: | | | | |
164,000 | | | | Series 2011-C1, Class D, 5.426% due 9/15/47(a)(d) | | | 170,916 | |
2,207,669 | | | | Series 2016-BNK2, Class XA, 1.111% due 11/15/49(d)(h) | | | 146,474 | |
1,537,482 | | | | Series 2016-UB11, Class XA, 1.660% due 8/15/49(d)(h) | | | 143,888 | |
4,256,424 | | | | Series 2016-UB12, Class XA, 0.820% due 12/15/49(d)(h) | | | 204,673 | |
76,000 | | | | Series 2017-ASHF, Class D, 3.788% (1-Month USD-LIBOR + 2.200%) due 11/15/34(a)(d) | | | 76,048 | |
162,000 | | | | Series 2017-ASHF, Class E, 4.738% (1-Month USD-LIBOR + 3.150%) due 11/15/34(a)(d) | | | 162,002 | |
See Notes to Financial Statements.
139
Schedules of Investments
(continued)
Destinations Low Duration Fixed Income Fund
| | | | | | | | |
Face
Amount/Units† | | | | Security | | Value | |
COLLATERALIZED MORTGAGE OBLIGATIONS - 6.2% - (continued) | | | | |
$ 123,000 | | | | Series 2017-ASHF, Class F, 5.938% (1-Month USD-LIBOR + 4.350%) due 11/15/34(a)(d) | | $ | 123,079 | |
186,000 | | | | Series 2017-CLS, Class E, 3.538% (1-Month USD-LIBOR + 1.950%) due 11/15/34(a)(d) | | | 186,641 | |
206,000 | | | | Series 2017-CLS, Class F, 4.188% (1-Month USD-LIBOR + 2.600%) due 11/15/34(a)(d) | | | 206,710 | |
995,502 | | | | Series 2017-H1, Class XA, 1.458% due 6/15/50(d)(h) | | | 91,475 | |
| | | | RAIT Trust: | | | | |
127,976 | | | | Series 2017-FL7, Class A, 2.538% (1-Month USD-LIBOR + 0.950%) due 6/15/37(a)(d) | | | 128,094 | |
36,000 | | | | Series 2017-FL7, Class AS, 2.888% (1-Month USD-LIBOR + 1.300%) due 6/15/37(a)(d) | | | 36,000 | |
870,883 | | | | RCO Trust, Series 2017-INV1, Class A, 3.197% due 11/25/52(a)(d) | | | 876,412 | |
| | | | Rosslyn Portfolio Trust: | | | | |
35,000 | | | | Series 2017-ROSS, Class A, 2.510% (1-Month USD-LIBOR + 0.950%) due 6/15/33(a)(d) | | | 35,025 | |
35,000 | | | | Series 2017-ROSS, Class B, 2.810% (1-Month USD-LIBOR + 1.250%) due 6/15/33(a)(d) | | | 35,026 | |
493,617 | | | | SG Residential Mortgage Trust, Series 2017-1, Class A1, 3.709% due 4/25/47(a)(d) | | | 488,073 | |
| | | | UBS Commercial Mortgage Trust: | | | | |
1,906,886 | | | | Series 2012-C1, Class XA, 2.078% due 5/10/45(a)(d)(h) | | | 131,885 | |
1,381,463 | | | | Series 2017-C1, Class XA, 1.610% due 6/15/50(d)(h) | | | 148,560 | |
641,666 | | | | Verus Securitization Trust, Series 2018-1, Class A1, 2.929% due 2/25/48(a)(d) | | | 641,729 | |
152,000 | | | | Wachovia Bank Commercial Mortgage Trust, Series 2007-C33, Class AJ, 6.008% due 2/15/51(d) | | | 152,760 | |
| | | | Wells Fargo Commercial Mortgage Trust: | | | | |
2,910,608 | | | | Series 2015-LC22, Class XA, 0.888% due 9/15/58(d)(h) | | | 142,958 | |
6,210,410 | | | | Series 2015-NXS2, Class XA, 0.770% due 7/15/58(d)(h) | | | 229,350 | |
196,000 | | | | Series 2017-SMP, Class A, 2.463% (1-Month USD-LIBOR + 0.750%) due 12/15/34(a)(d) | | | 196,062 | |
| | | | | | | | |
| | | | TOTAL COLLATERALIZED MORTGAGE OBLIGATIONS (Cost - $11,409,440) | | | 10,985,530 | |
| | | | | | | | |
SENIOR LOANS - 5.1% | | | | |
| | | | Appvion Inc.: | | | | |
542,000 | | | | 8.148% (1-Month USD-LIBOR + 6.500%) due 7/2/18 | | | 539,290 | |
191,158 | | | | 10.482% (1-Month USD-LIBOR + 9.250%) due 7/2/18 | | | 191,397 | |
| | | | Crestwood Holdings LLC: | | | | |
1,878,584 | | | | 9.590% (1-Month USD-LIBOR + 7.500%) due 6/19/19 | | | 1,877,024 | |
2,001,000 | | | | due 2/28/23(i) | | | 1,965,983 | |
See Notes to Financial Statements.
140
Schedules of Investments
(continued)
Destinations Low Duration Fixed Income Fund
| | | | | | | | |
Face
Amount/Units† | | | | Security | | Value | |
SENIOR LOANS - 5.1% - (continued) | | | | |
$ 1,627,867 | | | | Internap Corp., 8.580% (1-Month USD-LIBOR + 7.000%) due 4/6/22(i) | | $ | 1,644,146 | |
412,347 | | | | Licensing IP International S.a.r.l, 14.000% (FIXED) due 10/18/18 | | | 453,582 | |
1,383,000 | | | | LSC Communications Inc., 7.148% (1-Month USD-LIBOR + 5.500%) due 9/30/22 | | | 1,389,915 | |
992,188 | | | | Reddy Ice Corp., 7.256% (3-Month USD-LIBOR/PRIME + 5.500%/4.500%) due 5/1/19 | | | 992,188 | |
| | | | | | | | |
| | | | TOTAL SENIOR LOANS (Cost - $9,026,685) | | | 9,053,525 | |
| | | | | | | | |
U.S. GOVERNMENT OBLIGATIONS - 1.5% | | | | |
| | | | U.S. Treasury Inflation Indexed Notes: | | | | |
458,578 | | | | 0.125% due 4/15/18 | | | 460,865 | |
674,500 | | | | 1.375% due 7/15/18 | | | 684,099 | |
| | | | U.S. Treasury Notes: | | | | |
650,000 | | | | 2.000% due 8/31/21 | | | 638,727 | |
780,000 | | | | 2.125% due 9/30/21 | | | 769,244 | |
190,000 | | | | 1.875% due 1/31/22 | | | 185,109 | |
| | | | | | | | |
| | | | TOTAL U.S. GOVERNMENT OBLIGATIONS (Cost - $2,768,080) | | | 2,738,044 | |
| | | | | | | | |
SOVEREIGN BONDS - 1.0% | | | | |
Chile - 0.1% | | | | |
200,000 | | | | Chile Government International Bond, 3.250% due 9/14/21 | | | 201,200 | |
| | | | | | | | |
Dominican Republic - 0.1% | | | | |
200,000 | | | | Dominican Republic International Bond, 7.500% due 5/6/21 | | | 215,600 | |
| | | | | | | | |
India - 0.1% | | | | |
200,000 | | | | Export-Import Bank of India, 2.892% due 8/21/22(d) | | | 200,832 | |
| | | | | | | | |
Indonesia - 0.1% | | | | |
200,000 | | | | Indonesia Government International Bond, 4.875% due 5/5/21 | | | 209,207 | |
| | | | | | | | |
Israel - 0.1% | | | | |
200,000 | | | | Israel Government International Bond, 4.000% due 6/30/22 | | | 206,948 | |
| | | | | | | | |
Panama - 0.1% | | | | |
100,000 | | | | Panama Government International Bond, 5.200% due 1/30/20 | | | 104,500 | |
| | | | | | | | |
Peru - 0.2% | | | | |
200,000 | | | | Corp. Financiera de Desarrollo SA, 3.250% due 7/15/19 | | | 200,000 | |
200,000 | | | | Fondo MIVIVIENDA SA, 3.375% due 4/2/19 | | | 200,000 | |
| | | | | | | | |
| | | | Total Peru | | | 400,000 | |
| �� | | | | | | | |
Philippines - 0.2% | | | | |
300,000 | | | | Philippine Government International Bond, 4.000% due 1/15/21 | | | 307,681 | |
| | | | | | | | |
| | | | TOTAL SOVEREIGN BONDS (Cost - $1,874,249) | | | 1,845,968 | |
| | | | | | | | |
See Notes to Financial Statements.
141
Schedules of Investments
(continued)
Destinations Low Duration Fixed Income Fund
| | | | | | | | |
| Shares/Units | | | | Security | | Value | |
EXCHANGE TRADED FUND (ETF) - 15.2% | |
548,502 | | | | iShares Core 1-5 Year USD Bond(g) (Cost - $27,510,450) | | $ | 27,052,119 | |
| | | | TOTAL INVESTMENTS BEFORE SHORT-TERM INVESTMENTS (Cost - $168,751,442) | | | 167,199,993 | |
| | | | | | | | |
| | | |
Face Amount | | | | | | | |
SHORT-TERM INVESTMENTS - 8.5% | |
TIME DEPOSITS - 5.1% | |
$ 5,182,762 | | | | Banco Santander SA - Frankfurt, 0.780% due 3/1/18 | | | 5,182,762 | |
56,326 | | | | BNP Paribas - Paris, 0.780% due 3/1/18 | | | 56,326 | |
2,870,314 | | | | JPMorgan Chase & Co. - New York, 0.780% due 3/1/18 | | | 2,870,314 | |
1,072,754 | | | | Wells Fargo - Grand Cayman, 0.780% due 3/1/18 | | | 1,072,754 | |
| | | | | | | | |
| | | | TOTAL TIME DEPOSITS (Cost - $9,182,156) | | | 9,182,156 | |
| | | | | | | | |
COMMERCIAL PAPERS - 2.4% | |
2,095,000 | | | | EI du Pont de Nemours & Co., 1.908% due 4/16/18(j) | | | 2,089,519 | |
2,095,000 | | | | Walgreens Boots Alliance Inc., 2.123% due 5/14/18(j) | | | 2,085,791 | |
| | | | | | | | |
| | | | TOTAL COMMERCIAL PAPERS (Cost - $4,175,827) | | | 4,175,310 | |
| | | | | | | | |
U.S. GOVERNMENT OBLIGATIONS - 1.0% | | | | |
| | | | U.S. Treasury Bills: | | | | |
550,000 | | | | 1.270% due 3/8/18(j) | | | 549,865 | |
320,000 | | | | 1.530% due 4/19/18(j) | | | 319,335 | |
930,000 | | | | 1.791% due 8/16/18(j) | | | 922,226 | |
| | | | TOTAL U.S. GOVERNMENT OBLIGATIONS (Cost - $1,791,497) | | | 1,791,426 | |
| | | | | | | | |
| | | | TOTAL SHORT-TERM INVESTMENTS (Cost - $15,149,480) | | | 15,148,892 | |
| | | | | | | | |
INVESTMENTS PURCHASED WITH CASH PROCEEDS FROM SECURITIES LENDING - 1.3% | | | | |
MONEY MARKET FUND - 1.3% | | | | |
2,300,425 | | | | Federated Government Obligations Fund, Premier Class(k) (Cost - $2,300,425) | | | 2,300,425 | |
| | | | TOTAL INVESTMENTS - 103.5% (Cost - $186,201,347#) | | | 184,649,310 | |
| | | | | | | | |
| | | | Liabilities in Excess of Other Assets - (3.5)% | | | (6,180,397 | ) |
| | | | | | | | |
| | | | TOTAL NET ASSETS - 100.0% | | $ | 178,468,913 | |
| | | | | | | | |
See Notes to Financial Statements.
142
Schedules of Investments
(continued)
Destinations Low Duration Fixed Income Fund
| † | Face amount denominated in U.S. dollars, unless otherwise noted. |
| (a) | Restricted security that may be sold to “qualified institutional buyers” pursuant to the conditions of Rule 144A under the Securities Act of 1933, as amended. This security has been deemed liquid pursuant to guidelines approved by the Board of Trustees, unless otherwise noted. The aggregate value of restricted 144A holdings at February 28, 2018, amounts to approximately $62,764,670 and represents 35.17% of net assets. |
| (b) | Payment in-kind security for which part of the income earned may be paid as additional principal. |
| (c) | Security is valued in good faith at fair value by or under the direction of the Board of Trustees. |
| (d) | Variable rate security. Interest rate disclosed is that which was in effect at February 28, 2018. |
| (f) | Security is perpetual in nature and has no stated maturity date. |
| (g) | All or a portion of this security is on loan (See Note 5). |
| (h) | Interest only security. |
| (i) | This position represents an unsettled loan commitment at period end. Certain details associated with this purchase are not known prior to the settlement date, including coupon rate. |
| (j) | Rate shown represents yield-to-maturity. |
| (k) | Represents investment of collateral received from securities lending transactions. |
| # | Aggregate cost for federal income tax purposes is $186,205,736. |
Abbreviations used in this schedule:
| | | | | | |
CDO | | | — | | | Collateralized Debt Obligation |
CLO | | | — | | | Collateralized Loan Obligation |
CMT | | | — | | | Constant Maturity Index |
LIBOR | | | — | | | London Interbank Offered Rate |
LLC | | | — | | | Limited Liability Company |
PLC | | | — | | | Public Limited Company |
Currency Abbreviations used in this schedule:
| | | | | | |
EUR | | | — | | | Euro |
SEK | | | — | | | Swedish Krona |
| | | | |
| Summary of Investments by Security Type^ (unaudited) | |
| |
Corporate Bonds & Notes | | | 53.7 | % |
Exchange Traded Fund (ETF) | | | 14.7 | |
Asset-Backed Securities | | | 8.8 | |
Collateralized Mortgage Obligations | | | 6.0 | |
Senior Loans | | | 4.9 | |
U.S. Government Agencies & Obligations | | | 1.5 | |
Sovereign Bonds | | | 1.0 | |
Short-Term Investments | | | 8.2 | |
Money Market Fund | | | 1.2 | |
| | | | |
| | | 100.0 | % |
| | | | |
| ^ | As a percentage of total investments. |
See Notes to Financial Statements.
143
Schedules of Investments
(continued)
Destinations Global Fixed Income Opportunities Fund
| | | | | | | | |
Face
Amount/Units† | | | | Security | | Value | |
CORPORATE BONDS & NOTES - 69.2% | | | | |
Australia - 0.8% | | | | |
| | | | BHP Billiton Finance USA Ltd., Company Guaranteed Notes: | | | | |
$ 1,000,000 | | | | 6.250% (5-Year USD Swap Rate + 4.971%) due 10/19/75(a)(b) | | $ | 1,063,050 | |
550,000 | | | | 6.750% (5-Year USD Swap Rate + 5.093%) due 10/19/75(a)(b) | | | 624,250 | |
3,335,000 | | | | CNOOC Finance 2015 Australia Pty Ltd., Company Guaranteed Notes, 2.625% due 5/5/20 | | | 3,305,610 | |
| | | | | | | | |
| | | | Total Australia | | | 4,992,910 | |
| | | | | | | | |
Austria - 0.0% | | | | |
400,000 | | | | OAS Investments GmbH, Company Guaranteed Notes, 8.250% due 10/19/19(c)(d) | | | 43,333 | |
| | | | | | | | |
Bermuda - 0.8% | | | | |
600,000 | | | | Digicel Group Ltd., Senior Unsecured Notes, 8.250% due 9/30/20 | | | 562,500 | |
4,100,000 | | | | Stolt-Nielsen Ltd., Senior Unsecured Notes, 6.375% due 9/21/22 | | | 3,997,500 | |
| | | | | | | | |
| | | | Total Bermuda | | | 4,560,000 | |
| | | | | | | | |
British Virgin Islands - 2.1% | | | | |
1,920,000 | | | | CNOOC Finance 2012 Ltd., Company Guaranteed Notes, 3.875% due 5/2/22 | | | 1,945,192 | |
| | | | CNPC General Capital Ltd., Company Guaranteed Notes: | | | | |
3,000,000 | | | | 2.750% due 5/14/19 | | | 2,993,249 | |
2,000,000 | | | | 3.950% due 4/19/22 | | | 2,036,048 | |
3,000,000 | | | | Sinopec Group Overseas Development 2015 Ltd., Company Guaranteed Notes, 2.500% due 4/28/20 | | | 2,958,205 | |
| | | | Sinopec Group Overseas Development 2016 Ltd., Company Guaranteed Notes: | | | | |
680,000 | | | | 2.125% due 5/3/19 | | | 673,282 | |
600,000 | | | | 2.000% due 9/29/21(b) | | | 574,663 | |
200,000 | | | | 2.000% due 9/29/21 | | | 191,555 | |
| | | | Sinopec Group Overseas Development 2017 Ltd., Company Guaranteed Notes: | | | | |
1,000,000 | | | | 3.000% due 4/12/22 | | | 981,289 | |
200,000 | | | | 3.000% due 4/12/22(b) | | | 196,258 | |
| | | | | | | | |
| | | | Total British Virgin Islands | | | 12,549,741 | |
| | | | | | | | |
Canada - 0.9% | | | | |
1,413,000 | | | | Avison Young Canada Inc., Senior Secured Notes, 9.500% due 12/15/21(b) | | | 1,437,727 | |
1,950,000 | | | | Emera Inc., Subordinated Notes, 6.750% (3-Month USD-LIBOR + 5.440%) due 6/15/76(a) | | | 2,164,500 | |
See Notes to Financial Statements.
144
Schedules of Investments
(continued)
Destinations Global Fixed Income Opportunities Fund
| | | | | | | | |
Face
Amount/Units† | | | | Security | | Value | |
Canada - 0.9 - (continued) | | | | |
$ 1,327,000 | | | | NOVA Chemicals Corp., Senior Unsecured Notes, 5.250% due 6/1/27(b) | | $ | 1,297,143 | |
806,000 | | CAD | | Postmedia Network Inc., Senior Secured Notes, 8.250% due 7/15/21(b) | | | 596,600 | |
| | | | | | | | |
| | | | Total Canada | | | 5,495,970 | |
| | | | | | | | |
Cayman Islands - 3.0% | | | | |
1,000,000 | | | | Agromercantil Senior Trust, Company Guaranteed Notes, 6.250% due 4/10/19 | | | 1,015,120 | |
| | | | Alibaba Group Holding Ltd., Senior Unsecured Notes: | | | | |
1,500,000 | | | | 2.500% due 11/28/19 | | | 1,493,576 | |
500,000 | | | | 3.125% due 11/28/21 | | | 500,255 | |
| | | | CK Hutchison International 17 Ltd., Company Guaranteed Notes: | | | | |
2,200,000 | | | | 2.875% due 4/5/22(b) | | | 2,149,513 | |
2,700,000 | | | | 2.875% due 4/5/22 | | | 2,637,700 | |
1,181,687 | | | | Guanay Finance Ltd., Senior Secured Notes, 6.000% due 12/15/20 | | | 1,205,716 | |
147,285 | | | | Interoceanica IV Finance Ltd., Senior Secured Notes, zero coupon, due 11/30/18 | | | 145,076 | |
| | | | Peru Enhanced Pass-Through Finance Ltd., Pass-Thru Certificates: | | | | |
302,581 | | | | zero coupon, due 5/31/18 | | | 299,108 | |
280,000 | | | | zero coupon, due 6/2/25 | | | 242,200 | |
| | | | SPARC EM SPC Panama Metro Line 2 SP, Senior Secured Notes: | | | | |
3,300,000 | | | | zero coupon, due 12/5/22 | | | 3,007,125 | |
2,700,000 | | | | zero coupon, due 12/5/22(b) | | | 2,460,375 | |
| | | | Tencent Holdings Ltd., Senior Unsecured Notes: | | | | |
200,000 | | | | 3.375% due 5/2/19 | | | 201,467 | |
2,400,000 | | | | 2.875% due 2/11/20 | | | 2,401,664 | |
| | | | | | | | |
| | | | Total Cayman Islands | | | 17,758,895 | |
| | | | | | | | |
Chile - 3.1% | | | | |
4,500,000 | | | | Banco del Estado de Chile, Senior Unsecured Notes, 3.875% due 2/8/22 | | | 4,548,324 | |
| | | | Banco Santander Chile, Senior Unsecured Notes: | | | | |
800,000 | | | | 2.500% due 12/15/20(b) | | | 788,000 | |
1,700,000 | | | | 3.875% due 9/20/22 | | | 1,720,035 | |
400,000 | | | | Celulosa Arauco y Constitucion SA, Senior Unsecured Notes, 4.750% due 1/11/22 | | | 411,056 | |
1,030,000 | | | | Engie Energia Chile SA, Senior Unsecured Notes, 5.625% due 1/15/21 | | | 1,090,832 | |
4,700,000 | | | | Inversiones CMPC SA, Company Guaranteed Notes, 4.500% due 4/25/22 | | | 4,833,932 | |
See Notes to Financial Statements.
145
Schedules of Investments
(continued)
Destinations Global Fixed Income Opportunities Fund
| | | | | | | | |
Face
Amount/Units† | | | | Security | | Value | |
Chile - 3.1% - (continued) | | | | |
$ 600,000 | | | | Itau CorpBanca, Senior Unsecured Notes, 3.875% due 9/22/19 | | $ | 605,727 | |
740,000 | | | | SACI Falabella, Senior Unsecured Notes, 3.750% due 4/30/23 | | | 741,385 | |
4,000,000 | | | | Telefonica Chile SA, Senior Unsecured Notes, 3.875% due 10/12/22 | | | 4,021,446 | |
| | | | | | | | |
| | | | Total Chile | | | 18,760,737 | |
| | | | | | | | |
Colombia - 1.0% | | | | |
50,000 | | | | Ecopetrol SA, Senior Unsecured Notes, 7.625% due 7/23/19 | | | 52,875 | |
1,600,000 | | | | Empresas Publicas de Medellin ESP, Senior Unsecured Notes, 7.625% due 7/29/19 | | | 1,700,000 | |
4,100,000 | | | | Transportadora de Gas Internacional SA ESP, Senior Unsecured Notes, 5.700% due 3/20/22 | | | 4,161,500 | |
| | | | | | | | |
| | | | Total Colombia | | | 5,914,375 | |
| | | | | | | | |
Costa Rica - 0.3% | | | | |
800,000 | | | | Banco de Costa Rica, Government Guaranteed Notes, 5.250% due 8/12/18 | | | 803,720 | |
| | | | Banco Nacional de Costa Rica, Senior Unsecured Notes: | | | | |
480,000 | | | | 4.875% due 11/1/18 | | | 479,400 | |
400,000 | | | | 5.875% due 4/25/21(b) | | | 410,200 | |
| | | | | | | | |
| | | | Total Costa Rica | | | 1,693,320 | |
| | | | | | | | |
France - 0.7% | | | | |
| | | | BNP Paribas SA, Junior Subordinated Notes: | | | | |
200,000 | | | | 7.375% (5-Year USD Swap Rate + 5.150%)(a)(b)(e) | | | 222,920 | |
410,000 | | | | 7.625% (5-Year USD Swap Rate + 6.314%)(a)(b)(e) | | | 445,875 | |
1,300,000 | | | | Credit Agricole SA, Junior Subordinated Notes, 8.125% (5-Year USD Swap Rate + 6.185%) (a)(b)(e) | | | 1,521,000 | |
2,000,000 | | | | Societe Generale SA, Junior Subordinated Notes, 7.875% (5-Year USD Swap Rate + 4.979%) (a)(b)(e) | | | 2,225,000 | |
| | | | | | | | |
| | | | Total France | | | 4,414,795 | |
| | | | | | | | |
India - 2.2% | | | | |
2,800,000 | | | | Adani Ports & Special Economic Zone Ltd., Senior Unsecured Notes, 3.500% due 7/29/20 | | | 2,801,361 | |
3,680,000 | | | | Bharat Petroleum Corp., Ltd., Senior Unsecured Notes, 4.625% due 10/25/22 | | | 3,815,313 | |
2,240,000 | | | | Indian Oil Corp., Ltd, Senior Unsecured Notes, 5.625% due 8/2/21 | | | 2,397,537 | |
1,835,000 | | | | Oil India Ltd., Senior Unsecured Notes, 3.875% due 4/17/19 | | | 1,847,845 | |
2,500,000 | | | | ONGC Videsh Ltd., Company Guaranteed Notes, 3.250% due 7/15/19 | | | 2,502,525 | |
| | | | | | | | |
| | | | Total India | | | 13,364,581 | |
| | | | | | | | |
See Notes to Financial Statements.
146
Schedules of Investments
(continued)
Destinations Global Fixed Income Opportunities Fund
| | | | | | | | |
Face
Amount/Units† | | | | Security | | Value | |
Israel - 0.6% | | | | |
$ 1,984,000 | | | | Delek & Avner Tamar Bond Ltd., Senior Secured Notes, 4.435% due 12/30/20(b) | | $ | 1,989,039 | |
1,600,000 | | | | Israel Electric Corp., Ltd., Senior Secured Notes, 5.625% due 6/21/18 | | | 1,613,216 | |
| | | | | | | | |
| | | | Total Israel | | | 3,602,255 | |
| | | | | | | | |
Italy - 0.6% | | | | |
2,025,000 | | | | Intesa Sanpaolo SpA, Company Guaranteed Notes, 7.700%
(5-Year USD Swap Rate + 5.462%)(a)(b)(e) | | | 2,204,719 | |
1,450,000 | | | | UniCredit SpA, Junior Subordinated Notes, 8.000% (5-Year USD Swap Rate + 5.180%) (Restricted)(a)(e) | | | 1,566,000 | |
| | | | | | | | |
| | | | Total Italy | | | 3,770,719 | |
| | | | | | | | |
Luxembourg - 1.3% | | | | |
1,200,000 | | | | Euronav Luxembourg SA, Company Guaranteed Notes, 7.500% due 5/31/22 | | | 1,201,200 | |
6,581,000 | | | | International Automotive Components Group SA, Secured Notes, 9.125% due 6/1/18(b) | | | 6,383,570 | |
| | | | | | | | |
| | | | Total Luxembourg | | | 7,584,770 | |
| | | | | | | | |
Malaysia - 2.7% | | | | |
4,600,000 | | | | Axiata SPV2 Bhd, Senior Unsecured Notes, 3.466% due 11/19/20 | | | 4,623,805 | |
600,000 | | | | IOI Investment L Bhd, Company Guaranteed Notes, 4.375% due 6/27/22 | | | 609,260 | |
200,000 | | | | Malayan Banking Bhd, Subordinated Notes, 3.905% (5-Year USD Swap Rate + 2.542%) due 10/29/26(a) | | | 200,916 | |
1,600,000 | | | | Petronas Capital Ltd., Company Guaranteed Notes, 3.125% due 3/18/22 | | | 1,592,240 | |
3,480,000 | | | | Petronas Global Sukuk Ltd., Senior Unsecured Notes, 2.707% due 3/18/20 | | | 3,457,982 | |
5,250,000 | | | | Wakala Global Sukuk Bhd, Senior Unsecured Notes, 4.646% due 7/6/21 | | | 5,545,470 | |
| | | | | | | | |
| | | | Total Malaysia | | | 16,029,673 | |
| | | | | | | | |
Marshall Island - 1.8% | | | | |
3,764,000 | | | | Borealis Finance LLC, Senior Secured Notes, 7.500% due 11/16/22(b) | | | 3,768,705 | |
4,000,000 | | | | Chembulk Holding LLC, Senior Secured Notes, 8.000% due 2/2/23 | | | 4,030,000 | |
800,000 | | | | Eagle Bulk Shipco LLC, Senior Secured Notes, 8.250% due 11/28/22 | | | 812,000 | |
See Notes to Financial Statements.
147
Schedules of Investments
(continued)
Destinations Global Fixed Income Opportunities Fund
| | | | | | | | |
Face
Amount/Units† | | | | Security | | Value | |
Marshall Island - 1.8% - (continued) | | | | |
$ 2,200,000 | | | | Golar LNG Partners LP, Senior Unsecured Notes, 6.304%
(3-Month USD-LIBOR + 4.400%) due 5/22/20(a) | | $ | 2,156,000 | |
326,000 | | | | Scorpio Tankers Inc., Senior Unsecured Notes, 2.375% due 7/1/19(b) | | | 295,847 | |
| | | | | | | | |
| | | | Total Marshall Island | | | 11,062,552 | |
| | | | | | | | |
Mauritius - 0.4% | | | | |
2,600,000 | | | | UPL Corp., Ltd, Senior Unsecured Notes, 3.250% due 10/13/21 | | | 2,565,001 | |
| | | | | | | | |
Mexico - 2.6% | | | | |
| | | | America Movil SAB de CV: | | | | |
800,000 | | | | Company Guaranteed Notes, 5.000% due 3/30/20 | | | 830,946 | |
2,600,000 | | | | Senior Unsecured Notes, 3.125% due 7/16/22 | | | 2,574,470 | |
4,400,000 | | | | Banco Santander Mexico SA Institucion de Banca Multiple Grupo Financiero Santand, Subordinated Notes, 5.950% (5-Year CMT Index + 4.580%) due 1/30/24(a) | | | 4,482,500 | |
1,600,000 | | | | Coca-Cola Femsa SAB de CV, Company Guaranteed Notes, 4.625% due 2/15/20 | | | 1,654,908 | |
2,800,000 | | | | Comision Federal de Electricidad, Senior Unsecured Notes, 4.875% due 5/26/21 | | | 2,898,000 | |
2,800,000 | | | | Grupo Bimbo SAB de CV, Company Guaranteed Notes, 4.875% due 6/30/20 | | | 2,910,426 | |
400,000 | | | | Grupo Idesa SA de CV, Company Guaranteed Notes, 7.875% due 12/18/20 | | | 389,220 | |
| | | | | | | | |
| | | | Total Mexico | | | 15,740,470 | |
| | | | | | | | |
Netherlands - 1.0% | | | | |
2,000,000 | | | | Bharti Airtel International Netherlands BV, Company Guaranteed Notes, 5.125% due 3/11/23 .. | | | 2,071,258 | |
1,500,000 | | | | Cooperatieve Rabobank UA, Junior Subordinated Notes, 11.000% (3-Month USD-LIBOR + 10.868%)(a)(b)(e) | | | 1,638,750 | |
2,200,000 | | | | MPC Container Ships Invest BV, Senior Secured Notes, 6.40793% (3-Month USD-LIBOR + 4.750%) due 9/22/22(a)(c) | | | 2,208,250 | |
| | | | | | | | |
| | | | Total Netherlands | | | 5,918,258 | |
| | | | | | | | |
Panama - 2.3% | | | | |
3,325,000 | | | | Banco Latinoamericano de Comercio Exterior SA, Senior Unsecured Notes, 3.250% due 5/7/20 .. | | | 3,287,594 | |
300,000 | | | | Banistmo SA, Senior Unsecured Notes, 3.650% due 9/19/22(b) | | | 294,000 | |
3,501,969 | | | | ENA Norte Trust, Pass-Thru Certificates, 4.950% due 4/25/23 | | | 3,631,542 | |
2,500,000 | | | | Global Bank Corp., Senior Unsecured Notes, 5.125% due 10/30/19 | | | 2,565,625 | |
3,711,000 | | | | McDermott International Inc., Secured Notes, 8.000% due 5/1/21(b) | | | 3,799,136 | |
| | | | | | | | |
| | | | Total Panama | | | 13,577,897 | |
| | | | | | | | |
See Notes to Financial Statements.
148
Schedules of Investments
(continued)
Destinations Global Fixed Income Opportunities Fund
| | | | | | | | |
Face
Amount/Units† | | | | Security | | Value | |
Paraguay - 0.0% | | | | |
$ 200,000 | | | | Telefonica Celular del Paraguay SA, Senior Unsecured Notes, 6.750% due 12/13/22 | | $ | 204,644 | |
| | | | | | | | |
Peru - 1.2% | | | | |
| | | | Banco de Credito del Peru, Senior Unsecured Notes: | | | | |
400,000 | | | | 2.250% due 10/25/19 | | | 394,800 | |
3,000,000 | | | | 5.375% due 9/16/20 | | | 3,150,000 | |
3,500,000 | | | | Banco Internacional del Peru SAA, Senior Unsecured Notes, 5.750% due 10/7/20 | | | 3,680,250 | |
| | | | | | | | |
| | | | Total Peru | | | 7,225,050 | |
| | | | | | | | |
Philippines - 0.5% | | | | |
650,000 | | | | BDO Unibank Inc., Senior Unsecured Notes, 2.625% due 10/24/21 | | | 633,590 | |
2,500,000 | | | | Union Bank of the Philippines, Senior Unsecured Notes, 3.369% due 11/29/22 | | | 2,447,145 | |
| | | | | | | | |
| | | | Total Philippines | | | 3,080,735 | |
| | | | | | | | |
Singapore - 4.7% | | | | |
| | | | DBS Group Holdings Ltd.: | | | | |
3,200,000 | | | | Junior Subordinated Notes, 3.600% (5-Year USD Swap Rate + 2.390%)(a)(e) | | | 3,134,080 | |
| | | | Senior Unsecured Notes: | | | | |
300,000 | | | | 2.013% (3-Month USD-LIBOR + 0.490%) due 6/8/20(a) | | | 300,540 | |
1,700,000 | | | | 2.365% (3-Month USD-LIBOR + 0.620%) due 7/25/22(a)(b) | | | 1,704,331 | |
2,580,000 | | | | ONGC Videsh Vankorneft Pte Ltd., Company Guaranteed Notes, 2.875% due 1/27/22 | | | 2,503,926 | |
4,200,000 | | | | Oversea-Chinese Banking Corp., Ltd., Subordinated Notes, 4.000% (5-Year USD Swap Rate + 2.203%) due 10/15/24(a) | | | 4,242,136 | |
3,500,000 | | | | PSA International Pte Ltd., Senior Unsecured Notes, 4.625% due 9/11/19 | | | 3,597,650 | |
4,700,000 | | | | SP PowerAssets Ltd., Senior Unsecured Notes, 2.700% due 9/14/22 | | | 4,617,472 | |
3,200,000 | | | | Temasek Financial I Ltd., Company Guaranteed Notes, 2.375% due 1/23/23 | | | 3,096,129 | |
| | | | United Overseas Bank Ltd., Subordinated Notes: | | | | |
1,600,000 | | | | 3.750% (5-Year USD Swap Rate + 1.995%) due 9/19/24(a) | | | 1,608,738 | |
3,100,000 | | | | 3.500% (5-Year USD Swap Rate + 2.236%) due 9/16/26(a) | | | 3,080,538 | |
200,000 | | | | 2.880% (5-Year USD Swap Rate + 1.654%) due 3/8/27(a) | | | 192,721 | |
| | | | | | | | |
| | | | Total Singapore | | | 28,078,261 | |
| | | | | | | | |
Sweden - 0.2% | | | | |
9,000,000 | | SEK | | Samhallsbyggnadsbolaget i Norden AB, Senior Unsecured Notes, 3.900% (3-Month SEK-STIBOR + 4.750%) due 1/29/21(a)(c) | | | 1,084,773 | |
| | | | | | | | |
See Notes to Financial Statements.
149
Schedules of Investments
(continued)
Destinations Global Fixed Income Opportunities Fund
| | | | | | | | |
Face
Amount/Units† | | | | Security | | Value | |
Switzerland - 0.4% | | | | |
$ 1,000,000 | | | | Credit Suisse Group AG, Junior Subordinated Notes, 7.500%
(5-Year USD Swap Rate + 4.598%)(a)(b)(e) | | $ | 1,109,800 | |
1,200,000 | | | | UBS Group AG, Junior Subordinated Notes, 7.000% (5-Year USD Swap Rate + 4.866%) (Restricted)(a)(e) | | | 1,322,640 | |
| | | | | | | | |
| | | | Total Switzerland | | | 2,432,440 | |
| | | | | | | | |
United Kingdom - 1.0% | | | | |
| | | | Barclays PLC, Junior Subordinated Notes: | | | | |
600,000 | | | | 7.875% (5-Year USD Swap Rate + 6.772%)(a)(e) | | | 647,250 | |
1,600,000 | | | | 8.250% (5-Year USD Swap Rate + 6.705%)(a)(e) | | | 1,660,000 | |
2,150,000 | | | | Lloyds Banking Group PLC, Junior Subordinated Notes, 7.500% (5-Year USD Swap Rate + 4.760%)(a)(e) | | | 2,356,938 | |
1,445,000 | | | | Royal Bank of Scotland Group PLC, Junior Subordinated Notes, 8.625% (5-Year USD Swap Rate + 7.598%)(a)(e) | | | 1,596,725 | |
| | | | | | | | |
| | | | Total United Kingdom | | | 6,260,913 | |
| | | | | | | | |
United States - 33.0% | | | |
2,118,000 | | | | A Schulman Inc., Company Guaranteed Notes, 6.875% due 6/1/23 | | | 2,245,080 | |
2,772,000 | | | | Abbott Laboratories, Senior Unsecured Notes, 2.350% due 11/22/19 | | | 2,757,511 | |
7,174,000 | | | | Activision Blizzard Inc., Senior Unsecured Notes, 6.125% due 9/15/23(b) | | | 7,515,306 | |
1,585,000 | | | | AerCap Global Aviation Trust, Company Guaranteed Notes, 6.500% (3-Month USD-LIBOR + 4.300%) due 6/15/45(a)(b) | | | 1,719,725 | |
155,272 | | | | America West Airlines Pass-Through Trust, Series 2000-1, Pass-Thru Certificates, 8.057% due 7/2/20 | | | 171,161 | |
574,000 | | | | American Axle & Manufacturing Inc., Company Guaranteed Notes, 6.500% due 4/1/27(f) | | | 592,655 | |
1,291,000 | | | | American Express Co., Junior Subordinated Notes, 5.200%
(3-Month USD-LIBOR + 3.428%)(a)(e) | | | 1,323,404 | |
1,500,000 | | | | American International Group Inc., Junior Subordinated Notes, 8.175% (3-Month USD-LIBOR + 4.195%) due 5/15/58(a) | | | 2,019,000 | |
373,000 | | | | Apple Inc., Senior Unsecured Notes, 2.300% (3-Month USD-LIBOR + 0.500%) due 2/9/22(a) | | | 377,627 | |
2,544,000 | | | | Assured Guaranty Municipal Holdings Inc., Company Guaranteed Notes, 6.400% (1-Month USD-LIBOR + 2.215%) due 12/15/66(a)(b) | | | 2,540,184 | |
| | | | Bank of America Corp., Junior Subordinated Notes: | | | | |
185,000 | | | | 5.397% (3-Month USD-LIBOR + 3.630%)(a)(e) | | | 185,277 | |
805,000 | | | | 6.300% (3-Month USD-LIBOR + 4.553%)(a)(e) | | | 883,488 | |
365,000 | | | | 6.500% (3-Month USD-LIBOR + 4.174%)(a)(e) | | | 400,204 | |
3,090,000 | | | | 8.125% (3-Month USD-LIBOR + 3.640%)(a)(e) | | | 3,136,350 | |
See Notes to Financial Statements.
150
Schedules of Investments
(continued)
Destinations Global Fixed Income Opportunities Fund
| | | | | | | | |
Face
Amount/Units† | | | | Security | | Value | |
United States - 33.0% - (continued) | | | | |
$ 1,315,000 | | | | Bank of New York Mellon Corp., Junior Subordinated Notes, 4.950% (3-Month USD-LIBOR + 3.420%)(a)(e) | | $ | 1,346,231 | |
3,360,000 | | | | BI-LO LLC / BI-LO Finance Corp., Senior Secured Notes, 9.250% due 2/15/19(b) | | | 3,250,800 | |
4,176,000 | | | | Brunswick Corp., Senior Unsecured Notes, 4.625% due 5/15/21(b) | | | 4,220,047 | |
1,800,000 | | | | Capital One Financial Corp., Junior Subordinated Notes, 5.550% (3-Month USD-LIBOR + 3.800%)(a)(e) | | | 1,853,550 | |
6,333,000 | | | | Carolina Beverage Group LLC / Carolina Beverage Group Finance Inc., Senior Secured Notes, 10.625% due 8/1/18(b)(g) | | | 6,356,749 | |
| | | | Citigroup Inc., Junior Subordinated Notes: | | | | |
1,830,000 | | | | 5.875% (3-Month USD-LIBOR + 4.059%)(a)(e) | | | 1,896,337 | |
265,000 | | | | 5.950% (3-Month USD-LIBOR + 4.095%)(a)(e) | | | 274,487 | |
1,000,000 | | | | Citizens Financial Group Inc., Junior Subordinated Notes, 5.500% (3-Month USD-LIBOR + 3.960%)(a)(e) | | | 1,026,500 | |
| | | | Comcast Corp., Company Guaranteed Notes: | | | | |
93,000 | | | | 3.000% due 2/1/24 | | | 91,003 | |
186,000 | | | | 3.300% due 2/1/27 | | | 179,632 | |
415,550 | | | | Continental Airlines Class A Pass-Through Trust, Series 2007-1, Pass-Thru Certificates, 5.983% due 4/19/22 | | | 448,794 | |
490,400 | | | | Continental Airlines Class A-1 Pass-Through Trust, Series 2000-2, Pass-Thru Certificates, 7.707% due 4/2/21 | | | 530,858 | |
124,429 | | | | Continental Airlines Class C-2 Pass-Through Trust, Series 1999-2, Pass-Thru Certificates, 6.236% due 3/15/20 | | | 126,606 | |
1,347,000 | | | | Crescent Communities LLC / Crescent Ventures Inc., Senior Secured Notes, 8.875% due 10/15/21(b) | | | 1,421,085 | |
2,528,000 | | | | Crestwood Midstream Partners LP / Crestwood Midstream Finance Corp., Company Guaranteed Notes, 6.250% due 4/1/23 | | | 2,603,840 | |
35,000 | | | | Dairy Farmers of America Inc., Junior Subordinated Notes, 7.125%(b)(e) | | | 38,587 | |
1,060,000 | | | | Discover Financial Services, Junior Subordinated Notes, 5.500% (3-Month USD-LIBOR + 3.076%)(a)(e) | | | 1,063,975 | |
9,161,000 | | | | Dollar Tree Inc., Company Guaranteed Notes, 5.750% due 3/1/23 | | | 9,527,440 | |
57,652,000 | | | | DPH Holdings Corp., Senior Unsecured Notes, 6.550% due 6/15/06(d) | | | — | |
750,000 | | | | DXC Technology Co., Senior Unsecured Notes, 2.956% (3-Month USD-LIBOR + 0.950%) due 3/1/21(a) | | | 751,124 | |
8,272,000 | | | | Ford Motor Credit Co. LLC, Senior Unsecured Notes, 2.339% (3-Month USD-LIBOR + 0.790%) due 6/12/20(a) | | | 8,327,257 | |
1,678,000 | | | | Fresh Market Inc., Senior Secured Notes, 9.750% due 5/1/23(b) | | | 1,136,845 | |
1,911,000 | | | | FXI Holdings Inc., Senior Secured Notes, 7.875% due 11/1/24(b) | | | 1,884,724 | |
See Notes to Financial Statements.
151
Schedules of Investments
(continued)
Destinations Global Fixed Income Opportunities Fund
| | | | | | | | |
Face
Amount/Units† | | | | Security | | Value | |
United States - 33.0% - (continued) | | | | |
$ 2,800,000 | | | | General Electric Co., Junior Subordinated Notes, 5.000% (3-Month USD-LIBOR + 3.330%)(a)(e) | | $ | 2,768,920 | |
2,935,000 | | | | General Motors Financial Co., Inc., Junior Subordinated Notes, 5.750% (3-Month USD-LIBOR + 3.598%)(a)(e)(f) | | | 2,975,796 | |
3,206,000 | | | | Goldman Sachs Group Inc., Junior Subordinated Notes, 5.375% (3-Month USD-LIBOR + 3.922%)(a)(e) | | | 3,277,718 | |
6,448,000 | | | | HC2 Holdings Inc., Senior Secured Notes, 11.000% due 12/1/19(b) | | | 6,609,200 | |
| | | | Hexion Inc., Senior Secured Notes: | | | | |
1,123,000 | | | | 10.000% due 4/15/20 | | | 1,089,310 | |
2,518,000 | | | | 10.375% due 2/1/22(b) | | | 2,455,050 | |
5,218,000 | | | | Homefed Corp., Company Guaranteed Notes, 6.500% due 10/1/19(b) | | | 5,193,201 | |
5,874,000 | | | | Hunt Cos., Inc., Senior Secured Notes, 9.625% due 3/1/21(b) | | | 6,158,889 | |
1,089,000 | | | | INVISTA Finance LLC, Senior Secured Notes, 4.250% due 10/15/19(b) | | | 1,094,445 | |
362,000 | | | | j2 Cloud Services LLC / j2 Global Co.-Obligor Inc., Company Guaranteed Notes, 6.000% due 7/15/25(b) | | | 374,670 | |
| | | | Jones Energy Holdings LLC / Jones Energy Finance Corp.: | | | | |
2,688,000 | | | | Company Guaranteed Notes, 9.250% due 3/15/23 | | | 1,800,960 | |
1,538,000 | | | | Senior Secured Notes, 9.250% due 3/15/23(b) | | | 1,507,240 | |
| | | | JPMorgan Chase & Co., Junior Subordinated Notes: | | | | |
2,750,000 | | | | 6.750% (3-Month USD-LIBOR + 3.780%)(a)(e) | | | 3,038,750 | |
500,000 | | | | 7.900% (3-Month USD-LIBOR + 3.470%)(a)(e) | | | 505,150 | |
1,575,000 | | | | KeyCorp, Junior Subordinated Notes, 5.000% (3-Month USD-LIBOR + 3.606%)(a)(e) | | | 1,572,433 | |
4,483,000 | | | | Kraton Polymers LLC / Kraton Polymers Capital Corp., Company Guaranteed Notes, 10.500% due 4/15/23(b) | | | 5,009,752 | |
1,500,000 | | | | Land O’ Lakes Inc., Junior Subordinated Notes, 7.250%(b)(e) | | | 1,672,500 | |
2,755,000 | | | | LBI Media Inc., Senior Secured Notes, 10.000% due 4/15/19(b) | | | 2,734,338 | |
2,380,000 | | | | Lee Enterprises Inc., Senior Secured Notes, 9.500% due 3/15/22(b) | | | 2,493,050 | |
625,000 | | | | M&T Bank Corp., Junior Subordinated Notes, 5.125% (3-Month USD-LIBOR + 3.520%)(a)(e) | | | 636,875 | |
2,100,000 | | | | MetLife Inc., Junior Subordinated Notes, 5.250% (3-Month USD-LIBOR + 3.575%)(a)(e) | | | 2,154,180 | |
2,719,000 | | | | MHGE Parent LLC / MHGE Parent Finance Inc., Senior Unsecured Notes, 8.500% (8.500% cash or 9.250% PIK) due 8/1/19(b)(h) | | | 2,705,405 | |
5,893,000 | | | | Michaels Stores Inc., Company Guaranteed Notes, 5.875% due 12/15/20(b) | | | 5,981,395 | |
See Notes to Financial Statements.
152
Schedules of Investments
(continued)
Destinations Global Fixed Income Opportunities Fund
| | | | | | | | |
Face
Amount/Units† | | | | Security | | Value | |
United States - 33.0% - (continued) | | | | |
$ 275,000 | | | | Morgan Stanley, Junior Subordinated Notes, 5.550% (3-Month USD-LIBOR + 3.810%)(a)(e) | | $ | 284,983 | |
10,898,000 | | | | Mueller Industries Inc., Subordinated Notes, 6.000% due 3/1/27 | | | 10,925,245 | |
325,000 | | | | Netflix Inc., Senior Unsecured Notes, 4.875% due 4/15/28(b) | | | 319,313 | |
1,630,000 | | | | PNC Financial Services Group Inc., Junior Subordinated Notes, 5.000% (3-Month USD-LIBOR + 3.300%)(a)(e) | | | 1,654,450 | |
1,865,000 | | | | Prospect Capital Corp., Senior Unsecured Notes, 5.750% due 3/15/18(f) | | | 1,871,994 | |
1,000,000 | | | | Provident Financing Trust I, Limited Guaranteed Notes, 7.405% due 3/15/38 | | | 1,135,000 | |
1,136,000 | | | | Real Alloy Holding Inc., Senior Secured Notes, 10.000% due 1/15/19(b)(d) | | | 817,920 | |
| | | | Reliance Holding USA Inc., Company Guaranteed Notes: | | | | |
2,900,000 | | | | 4.500% due 10/19/20 | | | 2,997,272 | |
2,150,000 | | | | 5.400% due 2/14/22 | | | 2,275,548 | |
486,000 | | | | Salem Media Group Inc., Senior Secured Notes, 6.750% due 6/1/24(b) | | | 473,850 | |
5,487,000 | | | | SBA Tower Trust, Mortgage Notes, 3.598% due 4/10/18(b) | | | 5,493,983 | |
1,488,000 | | | | Sirius XM Radio Inc., Company Guaranteed Notes, 5.000% due 8/1/27(b) | | | 1,446,634 | |
3,825,000 | | | | SiTV LLC / SiTV Finance Inc., Senior Secured Notes, 10.375% due 7/1/19(b) | | | 2,347,594 | |
1,290,000 | | | | Southern States Cooperative Inc., Secured Notes, 10.000% due 8/15/21(b) | | | 1,290,000 | |
6,280,000 | | | | Spirit AeroSystems Inc., Company Guaranteed Notes, 5.250% due 3/15/22 | | | 6,448,430 | |
524,000 | | | | Sprint Corp., Company Guaranteed Notes, 7.250% due 9/15/21 | | | 546,925 | |
250,000 | | | | Stanley Black & Decker Inc., Junior Subordinated Notes, 5.750% (3-Month USD-LIBOR + 4.304%) due 12/15/53(a) | | | 257,125 | |
1,500,000 | | | | State Street Corp., Junior Subordinated Notes, 5.250% (3-Month USD-LIBOR + 3.597%)(a)(e) | | | 1,556,250 | |
1,360,000 | | | | SunTrust Banks Inc., Junior Subordinated Notes, 5.050% (3-Month USD-LIBOR + 3.102%)(a)(e) | | | 1,358,300 | |
| | | | Tapestry Inc., Senior Unsecured Notes: | | | | |
362,000 | | | | 3.000% due 7/15/22 | | | 353,402 | |
3,341,000 | | | | 4.250% due 4/1/25 | | | 3,336,990 | |
362,000 | | | | 4.125% due 7/15/27 | | | 354,017 | |
1,352,000 | | | | TEGNA Inc., Company Guaranteed Notes, 5.125% due 10/15/19 | | | 1,370,590 | |
1,319,343 | | | | Toll Road Investors Partnership II LP, Senior Secured Notes, zero coupon, due 2/15/45(b) | | | 303,438 | |
See Notes to Financial Statements.
153
Schedules of Investments
(continued)
Destinations Global Fixed Income Opportunities Fund
| | | | | | | | |
Face
Amount/Units† | | | | Security | | Value | |
United States - 33.0% - (continued) | | | | |
$ 757,000 | | | | Triumph Group Inc., Company Guaranteed Notes, 7.750% due 8/15/25 | | $ | 782,549 | |
1,045,000 | | | | US Bancorp, Junior Subordinated Notes, 5.125% (3-Month USD-LIBOR + 3.486%)(a)(e) | | | 1,083,038 | |
1,240,000 | | | | Voya Financial Inc., Company Guaranteed Notes, 5.650% (3-Month USD-LIBOR + 3.580%) due 5/15/53(a) | | | 1,277,200 | |
635,000 | | | | Wachovia Capital Trust III, Limited Guaranteed Notes, 5.570% (3-Month USD-LIBOR + 0.930%)(a)(e) | | | 635,000 | |
181,000 | | | | Walt Disney Co., Senior Unsecured Notes, 2.950% due 6/15/27(f) | | | 174,477 | |
| | | | Wells Fargo & Co., Junior Subordinated Notes: | | | | |
2,060,000 | | | | 5.875% (3-Month USD-LIBOR + 3.990%)(a)(e) | | | 2,190,048 | |
1,250,000 | | | | 7.980% (3-Month USD-LIBOR + 3.770%)(a)(e) | | | 1,271,875 | |
1,903,000 | | | | Westmoreland Coal Co., Senior Secured Notes, 8.750% due 1/1/22(b) | | | 784,988 | |
2,764,000 | | | | Xerium Technologies Inc., Senior Secured Notes, 9.500% due 8/15/21 | | | 2,784,730 | |
| | | | | | | | |
| | | | Total United States | | | 198,235,828 | |
| | | | | | | | |
| | | | TOTAL CORPORATE BONDS & NOTES (Cost - $421,142,432) | | | 416,002,896 | |
| | | | | | | | |
SENIOR LOANS - 7.9% | | | | |
| | | | Appvion Inc.: | | | | |
2,164,000 | | | | 8.148% (1-Month USD-LIBOR + 6.500%) due 7/2/18 | | | 2,153,180 | |
763,477 | | | | 10.482% (1-Month USD-LIBOR + 9.250%) due 7/2/18 | | | 764,431 | |
2,035,646 | | | | Autoparts Holdings (No. 1) Ltd., 8.398% (1-Month USD-LIBOR + 6.750%) due 12/23/21 | | | 2,045,824 | |
5,724,000 | | | | Crestwood Holdings LLC, due 2/28/23(i) | | | 5,623,830 | |
| | | | Dell International LLC: | | | | |
3,839,100 | | | | due 9/7/21(i) | | | 3,834,301 | |
2,160,000 | | | | due 9/7/23(i) | | | 2,159,547 | |
3,251,907 | | | | Eastman Kodak Co., 8.023% (3-Month USD-LIBOR + 6.250%) due 9/3/19 | | | 2,942,976 | |
2,537,000 | | | | Envigo Holdings Inc., due 12/29/23(i) | | | 2,479,917 | |
2,234,228 | | | | Envigo Laboratories Inc., 10.000% (1-Month USD-LIBOR + 8.500%) due 11/3/21 | | | 2,234,228 | |
4,659,060 | | | | Internap Corp., due 4/6/22(i) | | | 4,705,651 | |
721,375 | | | | Kingpin Intermediate Holdings LLC, 5.730% (3-Month USD-LIBOR + 4.250%) due 7/3/24 | | | 733,097 | |
| | | | Lee Enterprises Inc.: | | | | |
173,977 | | | | 7.898% (1-Month USD-LIBOR + 6.250%) due 3/31/19 | | | 173,977 | |
1,715,089 | | | | 12.000% (FLAT) due 12/15/22 | | | 1,766,541 | |
See Notes to Financial Statements.
154
Schedules of Investments
(continued)
Destinations Global Fixed Income Opportunities Fund
| | | | | | | | |
Face
Amount/Units† | | | | Security | | Value | |
SENIOR LOANS - 7.9% - (continued) | | | | |
$ 3,637,000 | | | | LSC Communications Inc., 7.148% (1-Month USD-LIBOR + 5.500%) due 9/30/22 | | $ | 3,655,185 | |
1,442,750 | | | | MND Holdings III Corp., 5.443% (3-Month USD-LIBOR + 3.750%) due 6/19/24 | | | 1,460,784 | |
| | | | Real Alloy Holding Inc.: | | | | |
1,429,000 | | | | 10.000% (FLAT) due 5/16/18(c) | | | 1,429,000 | |
336,393 | | | | 11.500% (FLAT) due 6/19/18(c) | | | 336,393 | |
3,252,391 | | | | Reddy Ice Corp., 7.256% (3-Month USD-LIBOR + 5.500%) due 4/1/19 | | | 3,252,391 | |
625,000 | | | | Tacala Investment Corp., 4.825% (1-Month USD-LIBOR + 3.250%) due 1/31/25 | | | 628,125 | |
188,055 | | | | Travel Leaders Group, LLC, 6.350% (3-Month USD-LIBOR + 4.500%) due 1/25/24 | | | 190,171 | |
392,726 | | | | YI LLC, 7.500% (3-Month USD-LIBOR + 4.500/3.000%) due 11/7/24 | | | 393,708 | |
4,328,000 | | | | YI LLC, 5.693% (3-Month USD-LIBOR + 4.000%) due 11/7/24 | | | 4,338,820 | |
| | | | | | | | |
| | | | TOTAL SENIOR LOANS (Cost - $47,234,784) | | | 47,302,077 | |
| | | | | | | | |
SOVEREIGN BONDS - 7.4% | | | | |
Chile - 1.3% | | | | |
| | | | Chile Government International Bond: | | | | |
660,000 | | | | 3.250% due 9/14/21 | | | 663,960 | |
7,700,000 | | | | 2.250% due 10/30/22 | | | 7,372,750 | |
| | | | | | | | |
| | | | Total Chile | | | 8,036,710 | |
| | | | | | | | |
Costa Rica - 0.2% | | | | |
920,000 | | | | Costa Rica Government International Bond, 9.995% due 8/1/20 | | | 1,028,072 | |
| | | | | | | | |
Dominican Republic - 0.3% | | | | |
1,800,000 | | | | Dominican Republic International Bond, 7.500% due 5/6/21 | | | 1,940,400 | |
| | | | | | | | |
India - 0.7% | | | | |
| | | | Export-Import Bank of India: | | | | |
200,000 | | | | 2.750% due 4/1/20 | | | 198,267 | |
3,200,000 | | | | 3.125% due 7/20/21 | | | 3,174,589 | |
1,000,000 | | | | 2.892% due 8/21/22(a) | | | 1,004,160 | |
| | | | | | | | |
| | | | Total India | | | 4,377,016 | |
| | | | | | | | |
See Notes to Financial Statements.
155
Schedules of Investments
(continued)
Destinations Global Fixed Income Opportunities Fund
| | | | | | | | |
Face
Amount/Units† | | | | Security | | Value | |
Indonesia - 1.2% | | | | |
| | | | Indonesia Government International Bond: | | | | |
$ 4,000,000 | | | | 4.875% due 5/5/21 | | $ | 4,184,144 | |
2,240,000 | | | | 3.700% due 1/8/22 | | | 2,252,018 | |
440,000 | | | | Perusahaan Penerbit SBSN Indonesia III, 6.125% due 3/15/19 | | | 454,740 | |
| | | | | | | | |
| | | | Total Indonesia | | | 6,890,902 | |
| | | | | | | | |
Israel - 0.8% | | | | |
4,600,000 | | | | Israel Government International Bond, 4.000% due 6/30/22 | | | 4,759,804 | |
| | | | | | | | |
Mexico - 0.4% | | | | |
2,200,000 | | | | Mexico Government International Bond, 3.625% due 3/15/22 | | | 2,233,000 | |
| | | | | | | | |
Panama - 0.5% | | | | |
3,000,000 | | | | Panama Government International Bond, 5.200% due 1/30/20 | | | 3,135,000 | |
| | | | | | | | |
Peru - 0.4% | | | | |
2,150,000 | | | | Fondo MIVIVIENDA SA, 3.500% due 1/31/23 | | | 2,109,687 | |
| | | | | | | | |
Philippines - 1.1% | | | | |
6,700,000 | | | | Philippine Government International Bond, 4.000% due 1/15/21 | | | 6,871,547 | |
| | | | | | | | |
Poland - 0.5% | | | | |
2,800,000 | | | | Republic of Poland Government International Bond, 5.125% due 4/21/21 | | | 2,976,820 | |
| | | | | | | | |
| | | | TOTAL SOVEREIGN BONDS (Cost - $45,334,144) | | | 44,358,958 | |
| | | | | | | | |
| | | |
Shares/Units | | | | | | | |
PREFERRED STOCKS - 1.9% | | | | |
Bermuda - 0.2% | | | | |
29,008 | | | | Aspen Insurance Holdings Ltd., 5.625%(e) | | | 716,498 | |
31,722 | | | | Axis Capital Holdings Ltd., 5.500%(e) | | | 771,479 | |
| | | | | | | | |
| | | | Total Bermuda | | | 1,487,977 | |
| | | | | | | | |
United States - 1.7% | | | | |
1,000 | | | | Dairy Farmers of America Inc., 7.875%(b)(e) | | | 114,187 | |
50,000 | | | | Delphi Financial Group Inc., 5.029% (3-Month USD-LIBOR + 3.190%)(a) | | | 1,137,500 | |
19,210 | | | | Farm Credit Bank of Texas, 6.750% (3-Month USD-LIBOR + 4.010%)(a)(b)(e) | | | 2,074,680 | |
25,550 | | | | GMAC Capital Trust I, 7.624% (3-Month USD-LIBOR + 5.785%)(a) | | | 659,190 | |
54,847 | | | | Huntington Bancshares Inc., 6.250%(e) | | | 1,475,384 | |
| | | | Morgan Stanley: | | | | |
95,960 | | | | 5.850% (3-Month USD-LIBOR + 3.491%)(a)(e) | | | 2,551,576 | |
10,600 | | | | 6.375% (3-Month USD-LIBOR + 3.708%)(a)(e) | | | 290,440 | |
See Notes to Financial Statements.
156
Schedules of Investments
(continued)
Destinations Global Fixed Income Opportunities Fund
| | | | | | | | |
| Shares/Units | | | | Security | | Value | |
United States - 1.7% - (continued) | | | | |
$ 4,400 | | | | 6.875% (3-Month USD-LIBOR + 3.940%)(a)(e) | | $ | 124,080 | |
20,000 | | | | New York Community Bancorp Inc., 6.375% (3-Month USD-LIBOR + 3.821%)(a)(e) | | | 563,000 | |
45,000 | | | | NuStar Energy LP, 7.625% (3-Month USD-LIBOR + 5.643%)(a)(e) | | | 1,018,350 | |
5,800 | | | | Wells Fargo & Co., 6.625% (3-Month USD-LIBOR +
3.690%)(a)(e) | | | 160,486 | |
| | | | | | | | |
| | | | Total United States | | | 10,168,873 | |
| | | | | | | | |
| | | | TOTAL PREFERRED STOCKS (Cost - $11,783,461) | | | 11,656,850 | |
| | | | | | | | |
COMMON STOCK - 0.0% | | | | |
Colombia - 0.0% | | | | |
8,481 | | | | Frontera Energy Corp.*(f)
(Cost - $268,679) | | | 280,975 | |
| | | | | | | | |
| | | | TOTAL INVESTMENTS BEFORE SHORT-TERM INVESTMENTS (Cost - $525,763,500) | | | 519,601,756 | |
| | | | | | | | |
Face Amount | | | | | | | |
SHORT-TERM INVESTMENTS - 15.4% | | | | |
COMMERCIAL PAPERS - 8.7% | | | | |
5,978,000 | | | | Arconic Inc., 2.205% due 3/16/18(j) | | | 5,972,479 | |
6,252,000 | | | | Arrow Electronics Inc., 2.203% due 3/23/18(j) | | | 6,243,396 | |
7,263,000 | | | | Constellation Brands Inc., 2.206% due 4/5/18(j) | | | 7,246,833 | |
5,997,000 | | | | EI du Pont de Nemours & Co., 1.908% due 4/16/18(j) | | | 5,981,310 | |
6,409,000 | | | | HP Inc., 1.982% due 3/16/18(j) | | | 6,404,648 | |
7,256,000 | | | | Marriott International Inc., 1.964% due 3/27/18(j) | | | 7,245,666 | |
7,370,000 | | | | Sherwin-Williams Co., 2.053% due 3/19/18(j) | | | 7,363,885 | |
5,997,000 | | | | Walgreens Boots Alliance Inc., 2.123% due 5/14/18(j) | | | 5,970,638 | |
| | | | | | | | |
| | | | TOTAL COMMERCIAL PAPERS (Cost - $52,428,898) | | | 52,428,855 | |
| | | | | | | | |
TIME DEPOSITS - 6.7% | | | | |
6,933,234 | | | | Banco Santander SA - Frankfurt, 0.780% due 3/1/18 | | | 6,933,234 | |
1,265,330 | | | | Standard Chartered Bank - London, 0.780% due 3/1/18 | | | 1,265,330 | |
32,116,133 | | | | Wells Fargo - Grand Cayman, 0.780% due 3/1/18 | | | 32,116,133 | |
| | | | | | | | |
| | | | TOTAL TIME DEPOSITS (Cost - $40,314,697) | | | 40,314,697 | |
| | | | | | | | |
| | | | TOTAL SHORT-TERM INVESTMENTS (Cost - $92,743,595) | | | 92,743,552 | |
| | | | | | | | |
See Notes to Financial Statements.
157
Schedules of Investments
(continued)
Destinations Global Fixed Income Opportunities Fund
| | | | | | | | |
| Face Amount | | | | Security | | Value | |
INVESTMENTS PURCHASED WITH CASH PROCEEDS FROM SECURITIES LENDING - 0.8% | | | | |
MONEY MARKET FUND - 0.8% | | | | |
$ 4,838,084 | | | | Federated Government Obligations Fund, Premier Class(k) (Cost - $4,838,084) | | $ | 4,838,084 | |
| | | | | | | | |
| | | | TOTAL INVESTMENTS - 102.6% (Cost - $623,345,179#) | | | 617,183,392 | |
| | | | | | | | |
| | | | Liabilities in Excess of Other Assets - (2.6)% | | | (15,818,085 | ) |
| | | | | | | | |
| | | | TOTAL NET ASSETS - 100.0% | | $ | 601,365,307 | |
| | | | | | | | |
| † | Face amount denominated in U.S. dollars, unless otherwise noted. |
| * | Non-income producing security. |
| (a) | Variable rate security. Interest rate disclosed is that which was in effect at February 28, 2018. |
| (b) | Restricted security that may be sold to “qualified institutional buyers” pursuant to the conditions of Rule 144A under the Securities Act of 1933, as amended. This security has been deemed liquid pursuant to guidelines approved by the Board of Trustees, unless otherwise noted. The aggregate value of restricted 144A holdings at February 28, 2018, amounts to approximately $128,740,245 and represents 21.41% of net assets. |
| (c) | Security is valued in good faith at fair value by or under the direction of the Board of Trustees. |
| (d) | Security is currently in default. |
| (e) | Security is perpetual in nature and has no stated maturity date. |
| (f) | All or a portion of this security is on loan (See Note 5). |
| (h) | Payment in-kind security for which part of the income earned may be paid as additional principal. |
| (i) | This position represents an unsettled loan commitment at period end. Certain details associated with this purchase are not known prior to the settlement date, including coupon rate. |
| (j) | Rate shown represents yield-to-maturity. |
| (k) | Represents investment of collateral received from securities lending transactions. |
| # | Aggregate cost for federal income tax purposes is $623,466,527. |
Abbreviations used in this schedule:
| | | | | | |
CMT | | | — | | | Constant Maturity Index |
LIBOR | | | — | | | London Interbank Offered Rate |
LLC | | | — | | | Limited Liability Company |
PLC | | | — | | | Public Limited Company |
Currency Abbreviations used in this schedule:
| | | | | | |
CAD | | | — | | | Canadian Dollar |
SEK | | | — | | | Swedish Krona |
See Notes to Financial Statements.
158
Schedules of Investments
(continued)
Destinations Global Fixed Income Opportunities Fund
Summary of Investments by Security Type^ (unaudited)
| | | | |
Corporate Bonds & Notes | | | 67.4 | % |
Senior Loans | | | 7.7 | |
Sovereign Bonds | | | 7.2 | |
Preferred Stocks | | | 1.9 | |
Common Stock | | | 0.0 | * |
Short-Term Investments | | | 15.0 | |
Money Market Fund | | | 0.8 | |
| | | | |
| | | 100.0 | % |
| | | | |
| ^ | As a percentage of total investments. |
| * | Position represents less than 0.05%. |
See Notes to Financial Statements.
159
Schedules of Investments
(continued)
Destinations Municipal Fixed Income Fund
| | | | | | | | |
Face Amount | | Rating†† | | Security | | Value | |
MUNICIPAL BONDS - 66.6% | | | | |
Alaska - 0.5% | | | | | | |
$ 1,000,000 | | AA+ | | Alaska Housing Finance Corp., Revenue Bonds, Series A, 5.000% due 6/1/30 | | $ | 1,148,230 | |
| | | | | | | | |
Arizona - 0.5% | | | | | | |
1,000,000 | | AAA | | City of Scottsdale AZ, GO, Project 2004 Preserve Acquisition, 5.000% due 7/1/23 | | | 1,149,850 | |
| | | | | | | | |
California - 6.0% | | | | | | |
| | | | Bay Area Toll Authority, Revenue Bonds, Senior Sanitary Francisco Bay Area Toll: | | | | |
3,000,000 | | AA | | 2.000% due 4/1/53(a) | | | 2,924,130 | |
1,500,000 | | AA | | 2.125% due 4/1/53(a) | | | 1,457,025 | |
3,500,000 | | AA- | | California Health Facilities Financing Authority, Revenue Bonds, Sutter Health, Series C, 1.000% due 8/15/53(a) | | | 3,469,445 | |
1,500,000 | | Aa2(b) | | Los Angeles Unified School District, GO, Series A, 5.000% due 7/1/27 | | | 1,815,870 | |
1,555,000 | | AA | | San Francisco Municipal Transportation Agency, Revenue Bonds, 5.000% due 3/1/31 | | | 1,838,990 | |
2,355,000 | | AA | | State of California Department of Water Resources Power Supply, Revenue Bonds, Series L, 5.000% due 5/1/18 | | | 2,369,719 | |
| | | | | | | | |
| | | | Total California | | | 13,875,179 | |
| | | | | | | | |
Connecticut - 2.4% | | | | | | |
4,465,000 | | AAA | | Connecticut State Health & Educational Facilities Authority, Revenue Bonds, Yale University, Series V1, 1.020% due 7/1/36(a) | | | 4,465,000 | |
1,000,000 | | AAA | | State of Connecticut Clean Water Fund - State Revolving Fund, Revenue Bonds, Series B, 5.000% due 6/1/22 | | | 1,127,200 | |
| | | | | | | | |
| | | | Total Connecticut | | | 5,592,200 | |
| | | | | | | | |
District of Columbia - 2.5% | | | | |
3,500,000 | | AA | | District of Columbia, GO, Series D, 5.000% due 6/1/31 | | | 4,110,890 | |
1,500,000 | | AA- | | Washington Metropolitan Area Transit Authority, Revenue Bonds, Series B, 5.000% due 7/1/34 | | | 1,738,545 | |
| | | | | | | | |
| | | | Total District of Columbia | | | 5,849,435 | |
| | | | | | | | |
Georgia - 3.3% | | | | | | |
| | | | State of Georgia, GO, Series C: | | | | |
3,835,000 | | AAA | | 5.000% due 7/1/29 | | | 4,600,121 | |
2,500,000 | | AAA | | 5.000% due 7/1/30 | | | 2,985,025 | |
| | | | | | | | |
| | | | Total Georgia | | | 7,585,146 | |
| | | | | | | | |
See Notes to Financial Statements.
160
Schedules of Investments
(continued)
Destinations Municipal Fixed Income Fund
| | | | | | | | |
Face Amount | | Rating†† | | Security | | Value | |
Hawaii - 0.3% | | | | | | |
$ 500,000 | | AA+ | | State of Hawaii, GO, Series FH, 5.000% due 10/1/28 | | $ | 588,380 | |
| | | | | | | | |
Idaho - 1.4% | | | | | | |
2,830,000 | | Aa1(b) | | Kootenai County School District No 271 Coeur d’Alene, GO, 4.000% due 9/15/28 | | | 3,139,998 | |
| | | | | | | | |
Iowa - 0.6% | | | | | | |
1,155,000 | | Aa1(b) | | City of Cedar Rapids IA, GO, Series A, 5.000% due 6/1/25 | | | 1,341,301 | |
| | | | | | | | |
Kansas - 0.5% | | | | | | |
1,000,000 | | Aa2(b) | | Geary County Unified School District No 475, GO, Series B, 5.000% due 9/1/20 | | | 1,077,040 | |
| | | | | | | | |
Kentucky - 0.5% | | | | | | |
1,000,000 | | A | | Kentucky State Property & Building Commission, Revenue Bonds, Series B, 5.000% due 11/1/27 | | | 1,140,900 | |
| | | | | | | | |
Louisiana - 0.8% | | | | | | |
1,500,000 | | AA | | Louisiana Local Government Environmental Facilities & Community Development Authority, Revenue Bonds, Lctcs Acourt 391 Project, 5.000% due 10/1/26 | | | 1,747,635 | |
| | | | | | | | |
Maryland - 3.1% | | | | | | |
2,500,000 | | AAA | | County of Howard MD, GO, Series D, 5.000% due 2/15/30 | | | 3,010,975 | |
1,000,000 | | AAA | | County of Montgomery MD, GO, Consolidated Public Improvement, Series D, 4.000% due 11/1/29 | | | 1,096,520 | |
2,500,000 | | AAA | | State of Maryland, GO, Series A, 5.000% due 8/1/26 | | | 2,986,200 | |
| | | | | | | | |
| | | | Total Maryland | | | 7,093,695 | |
| | | | | | | | |
Massachusetts - 0.2% | | | | | | |
500,000 | | AA+ | | Massachusetts Development Finance Agency, Revenue Bonds, Williams College, Series N, 1.450% due 7/1/41(a) | | | 488,960 | |
| | | | | | | | |
Michigan - 0.7% | | | | | | |
| | | | Michigan State Hospital Finance Authority, Revenue Bonds, Trinity Health Credit Group, Series C: | | | | |
750,000 | | AA- | | 5.000% due 12/1/19 | | | 793,612 | |
700,000 | | AA- | | 5.000% due 12/1/20 | | | 759,563 | |
| | | | | | | | |
| | | | Total Michigan | | | 1,553,175 | |
| | | | | | | | |
Minnesota - 3.4% | | | | | | |
| | | | State of Minnesota, GO: | | | | |
3,000,000 | | AA+ | | Series D, 5.000% due 8/1/25 | | | 3,542,430 | |
3,685,000 | | AA+ | | Various Purpose, Series A, 5.000% due 8/1/26 | | | 4,270,325 | |
| | | | | | | | |
| | | | Total Minnesota | | | 7,812,755 | |
| | | | | | | | |
See Notes to Financial Statements.
161
Schedules of Investments
(continued)
Destinations Municipal Fixed Income Fund
| | | | | | | | |
Face Amount | | Rating†† | | Security | | Value | |
Mississippi - 1.9% | | | | | | |
| | | | State of Mississippi, GO, Series A: | | | | |
$ 2,500,000 | | AA | | 5.000% due 10/1/29 | | $ | 2,945,500 | |
1,250,000 | | AA | | 5.000% due 10/1/34 | | | 1,446,650 | |
| | | | | | | | |
| | | | Total Mississippi | | | 4,392,150 | |
| | | | | | | | |
Missouri - 1.3% | | | | | | |
2,500,000 | | AAA | | Metropolitan St Louis Sewer District, Revenue Bonds, Series A, 5.000% due 5/1/37 | | | 2,891,400 | |
| | | | | | | | |
Nevada - 2.0% | | | | | | |
| | | | Clark County School District, GO, Series A: | | | | |
1,500,000 | | AA- | | 5.000% due 6/15/24 | | | 1,710,270 | |
2,500,000 | | AA- | | 5.000% due 6/15/25 | | | 2,870,775 | |
| | | | | | | | |
| | | | Total Nevada | | | 4,581,045 | |
| | | | | | | | |
New York - 8.7% | | | | | | |
2,825,000 | | AA+ | | City of New York NY, GO, Adjusted Fiscal 2015 Subordinated, Series F4, 1.200% due 6/1/44(a) | | | 2,825,000 | |
3,000,000 | | AA | | New York City Transitional Finance Authority Building Aid Revenue, Revenue Bonds, Series S1, 5.000% due 7/15/29 | | | 3,527,010 | |
| | AAA | | New York City Transitional Finance Authority Future Tax Secured Revenue, Revenue Bonds: | | | | |
2,000,000 | | | | Series A3, 4.000% due 8/1/42 | | | 2,058,520 | |
3,700,000 | | AAA | | Series A5, 1.100% due 8/1/41(a) | | | 3,700,000 | |
2,500,000 | | AAA | | New York State Dormitory Authority, Revenue Bonds, Series A, 5.000% due 3/15/31 | | | 2,932,025 | |
5,000,000 | | AA+ | | Triborough Bridge & Tunnel Authority, Revenue Bonds, Gem Subordinated, Series B3, 1.170% due 1/1/32(a) | | | 5,000,000 | |
| | | | | | | | |
| | | | Total New York | | | 20,042,555 | |
| | | | | | | | |
North Carolina - 2.1% | | | | | | |
4,000,000 | | AAA | | State of North Carolina, GO, Series A, 5.000% due 6/1/26 | | | 4,793,680 | |
| | | | | | | | |
Ohio - 2.9% | | | | | | |
4,000,000 | | AAA | | City of Columbus OH, GO, Series 2017-1, 5.000% due 4/1/24 | | | 4,644,000 | |
2,000,000 | | AAA | | Ohio Water Development Authority Water Pollution Control Loan Fund, Revenue Bonds, Series A, 1.200% due 12/1/36(a) | | | 2,000,000 | |
| | | | | | | | |
| | | | Total Ohio | | | 6,644,000 | |
| | | | | | | | |
Oklahoma - 0.3% | | | | | | |
500,000 | | A+ | | Canadian County Educational Facilities Authority, Revenue Bonds, Mustang Public School Project, 5.000% due 9/1/26 | | | 582,670 | |
| | | | | | | | |
Oregon - 2.4% | | | | | | |
5,505,000 | | AA | | Portland Community College District, GO, 5.000% due 6/15/18 | | | 5,562,858 | |
| | | | | | | | |
See Notes to Financial Statements.
162
Schedules of Investments
(continued)
Destinations Municipal Fixed Income Fund
| | | | | | | | |
Face Amount | | Rating†† | | Security | | Value | |
Pennsylvania - 0.9% | | | | | | |
$ 1,000,000 | | A | | Lehigh County Industrial Development Authority, Revenue Bonds, PPL Electric Utilities Corp., Series A, 1.800% due 9/1/29(a) | | $ | 974,980 | |
1,000,000 | | A+ | | Northampton County General Purpose Authority, Revenue Bonds, Lafayette College, 5.000% due 11/1/27 | | | 1,183,250 | |
| | | | | | | | |
| | | | Total Pennsylvania | | | 2,158,230 | |
| | | | | | | | |
Rhode Island - 1.0% | | | | | | |
2,000,000 | | AA+ | | Rhode Island Health & Educational Building Corp., Revenue Bonds, Brown University, Series A, 5.000% due 9/1/29 | | | 2,399,780 | |
| | | | | | | | |
South Carolina - 0.1% | | | | |
250,000 | | AA+ | | Town of Mount Pleasent SC Water & Sewer Revenue, Revenue Bonds, Series A, 5.000% due 6/1/31 | | | 294,303 | |
| | | | | | | | |
Tennessee - 1.5% | | | | | | |
3,000,000 | | AA+ | | County of Shelby TN, GO, Series A, 5.000% due 4/1/31 | | | 3,531,150 | |
| | | | | | | | |
Texas - 7.1% | | | | | | | | |
250,000 | | Aa2(b) | | City of Houston TX Combined Utility System Revenue, Revenue Bonds, Series B, 4.000% due 11/15/21 | | | 268,865 | |
1,040,000 | | AAA | | City of Irving TX, GO, 5.500% due 8/15/23. | | | 1,219,514 | |
2,175,000 | | AAA | | Conroe Independent School District, GO, PSF-GTD-Insured, 5.000% due 2/15/30 | | | 2,560,997 | |
1,000,000 | | AAA | | Houston Independent School District, GO, Schoolhouse, Series A2, PSF-GTD-Insured, 3.000% due 6/1/39(a) | | | 1,017,200 | |
1,225,000 | | AA+ | | Lewisville Independent School District, GO, Series B, 5.000% due 8/15/28 | | | 1,424,810 | |
1,195,000 | | Aaa(b) | | San Antonio Independent School District, GO, Series A, PSF-GTD-Insured, 5.000% due 8/1/28 | | | 1,409,467 | |
| | | | State of Texas, GO: | | | | |
2,655,000 | | AAA | | Transportation Commission Highway Improvement, Series A, 5.000% due 4/1/26 | | | 3,144,263 | |
1,500,000 | | AAA | | Transportation Commission Mobility Fund, 5.000% due 10/1/30 | | | 1,781,130 | |
2,500,000 | | AAA | | Texas A&M University, Revenue Bonds, Revenues Financing System, Series E, 5.000% due 5/15/26 | | | 2,962,875 | |
400,000 | | AA+ | | Trinity River Authority LLC Denton Creek Wastewater Treatment System Revenue, Revenue Bonds, Regional Treatment System, 5.000% due 2/1/22 | | | 445,592 | |
| | | | | | | | |
| | | | Total Texas | | | 16,234,713 | |
| | | | | | | | |
Virginia - 4.7% | | | | | | |
2,635,000 | | AAA | | City of Suffolk VA, GO, Series A, 5.000% due 2/1/27 | | | 3,165,399 | |
| | | | County of Fairfax VA, GO, Public Improvement, Series A: | | | | |
250,000 | | AAA | | 4.000% due 10/1/27 | | | 275,932 | |
3,000,000 | | AAA | | 5.000% due 10/1/27 | | | 3,630,240 | |
See Notes to Financial Statements.
163
Schedules of Investments
(continued)
Destinations Municipal Fixed Income Fund
| | | | | | | | |
Face Amount | | Rating†† | | Security | | Value | |
Virginia - 4.7% - (continued) | | | | |
$ 3,180,000 | | AA | | Hampton Roads Transportation Accountability Commission, Revenue Bonds, Transn Fund Senior Lien, Series A, 5.000% due 7/1/35 | | $ | 3,697,291 | |
| | | | | | | | |
| | | | Total Virginia | | | 10,768,862 | |
| | | | | | | | |
Washington - 0.2% | | | | | | |
500,000 | | AA+ | | Pierce County School District No 3 Puyallup, GO, 5.000% due 12/1/34 | | | 581,085 | |
| | | | | | | | |
Wisconsin - 2.8% | | | | | | |
5,000,000 | | AA | | State of Wisconsin, GO, Series 3, 5.000% due 11/1/30 | | | 5,887,900 | |
500,000 | | AA+ | | Wisconsin Health & Educational Facilities Authority, Revenue Bonds, Ascension Senior Credit Group, Series A, 4.000% due 11/15/36 | | | 516,230 | |
| | | | | | | | |
| | | | Total Wisconsin | | | 6,404,130 | |
| | | | | | | | |
| | | | TOTAL MUNICIPAL BONDS (Cost - $156,155,475) | | | 153,046,490 | |
| | | | | | | | |
SHORT-TERM INVESTMENTS - 32.5% | | | | |
MUNICIPAL BONDS - 23.0% | | | | |
3,500,000 | | MIG1(b) | | Charleston County School District, GO, 5.000% due 3/30/18 | | | 3,511,673 | |
2,000,000 | | MIG1(b) | | City of Houston TX, GO, 5.000% due 6/29/18 | | | 2,024,420 | |
3,000,000 | | SP-1+ | | Colorado State Education Loan Program, Revenue Notes, Series A, 5.000% due 6/28/18 | | | 3,035,220 | |
10,000,000 | | SP-1+ | | Commonwealth of Massachusetts, GO, Series B, 2.000% due 5/21/18 | | | 10,016,100 | |
5,000,000 | | SP-1+ | | County of Erie NY, GO, 2.000% due 6/30/18 | | | 5,011,350 | |
3,000,000 | | SP-1+ | | San Diego Unified School District, GO, Series A, 3.000% due 6/29/18 | | | 3,017,910 | |
5,000,000 | | MIG1(b) | | School District of Broward County, GO, 2.000% due 6/15/18 | | | 5,010,050 | |
1,400,000 | | SP-1+ | | State of Colorado, Revenue Notes, Series A, 4.000% due 6/27/18 | | | 1,412,586 | |
3,375,000 | | SP-1+ | | State of Idaho, GO, 4.000% due 6/29/18 | | | 3,404,835 | |
7,500,000 | | SP-1+ | | State of Oregon, GO, Series A, 5.000% due 9/28/18 | | | 7,656,825 | |
8,500,000 | | SP-1+ | | State of Texas, Revenue Notes, 4.000% due 8/30/18 | | | 8,614,495 | |
| | | | | | | | |
| | | | TOTAL MUNICIPAL BONDS (Cost - $52,782,283) | | | 52,715,464 | |
| | | | | | | | |
TIME DEPOSITS - 9.5% | | | | |
104,160 | | | | ANZ National Bank - London, 0.780% due 3/1/18 | | | 104,160 | |
21,691,661 | | | | Citibank - New York, 0.780% due 3/1/18 | | | 21,691,661 | |
| | | | | | | | |
| | | | TOTAL TIME DEPOSITS (Cost - $21,795,821) | | | 21,795,821 | |
| | | | | | | | |
See Notes to Financial Statements.
164
Schedules of Investments
(continued)
Destinations Municipal Fixed Income Fund
| | | | | | | | |
| | | | | | | Value | |
| | | | TOTAL SHORT-TERM INVESTMENTS (Cost - $ 74,578,104) | | $ | 74,511,285 | |
| | | | | | | | |
| | | | TOTAL INVESTMENTS - 99.1% (Cost - $ 230,733,579#) | | | 227,557,775 | |
| | | | | | | | |
| | | | Other Assets in Excess of Liabilities - 0.9% | | | 2,179,320 | |
| | | | | | | | |
| | | | TOTAL NET ASSETS - 100.0% | | $ | 229,737,095 | |
| | | | | | | | |
| †† | All ratings are by Standard & Poor’s Rating Service, unless otherwise noted (unaudited). |
| (a) | Variable rate security. Interest rate disclosed is that which was in effect at February 28, 2018. |
| (b) | Rating by Moody’s Investors Service. |
| # | Aggregate cost for federal income tax purposes is $230,733,348. |
Abbreviations used in this schedule:
| | | | | | |
| GO | | | — | | | General Obligation |
| LLC | | | — | | | Limited Liability Company |
| PSF-GTD | | | — | | | Permanent School Fund Guaranteed |
See pages 186-188 for definitions of ratings.
| | | | |
Summary of Investments by Security Industry^ (unaudited) | |
General Obligation | | | 39.1 | % |
Education | | | 13.8 | |
Transportation | | | 7.3 | |
Water and Sewer | | | 2.6 | |
Health Care Providers and Services | | | 2.4 | |
Power | | | 1.1 | |
Single Family Housing | | | 0.5 | |
Development | | | 0.4 | |
Short-Term Investments | | | 32.8 | |
| | | | |
| | | 100.0 | % |
| | | | |
| ^ | As a percentage of total investments. |
See Notes to Financial Statements.
165
Schedules of Investments
(continued)
Destinations Multi Strategy Alternatives Fund
| | | | | | | | |
Face Amount/ Units/Shares† | | | | Security | | Value | |
CORPORATE BONDS & NOTES - 25.2% | |
Basic Materials - 0.9% | | | | |
| | | | Hexion Inc., Senior Secured Notes: | | | | |
$ 1,960,000 | | | | 6.625% due 4/15/20 | | $ | 1,822,800 | |
3,834,000 | | | | 10.000% due 4/15/20 | | | 3,718,980 | |
2,028,000 | | | | 10.375% due 2/1/22(a) | | | 1,977,300 | |
1,056,000 | | | | Hexion Inc. / Hexion Nova Scotia Finance ULC, Secured Notes, 9.000% due 11/15/20(b) | | | 850,080 | |
| | | | | | | | |
| | | | Total Basic Materials | | | 8,369,160 | |
| | | | | | | | |
Communications - 5.5% | | | | |
2,795,000 | | | | Altice Luxembourg SA, Company Guaranteed Notes, 7.750% due 5/15/22(a)(c) | | | 2,606,338 | |
5,546,000 | | | | Avaya Inc., Senior Secured Notes, 7.000% due 4/1/19(a)(d) | | | — | |
1,750,000 | | | | CCO Holdings LLC / CCO Holdings Capital Corp., Senior Unsecured Notes, 5.125% due 5/1/27(a) | | | 1,682,187 | |
2,500,000 | | | | Ciena Corp., Senior Unsecured Notes, 3.750% due 10/15/18(a)(c) | | | 3,049,577 | |
2,500,000 | | | | Clear Channel Worldwide Holdings Inc., Company Guaranteed Notes, 7.625% due 3/15/20 | | | 2,496,875 | |
5,346,000 | | | | Consolidated Communications Inc., Company Guaranteed Notes, 6.500% due 10/1/22 | | | 4,677,750 | |
| | | | Digicel Ltd., Company Guaranteed Notes: | | | | |
3,820,000 | | | | 6.750% due 3/1/23(c) | | | 3,557,375 | |
4,450,000 | | | | 6.750% due 3/1/23(a)(c) | | | 4,155,188 | |
3,440,000 | | | | EIG Investors Corp., Company Guaranteed Notes, 10.875% due 2/1/24(c) | | | 3,766,800 | |
3,000,000 | | | | Frontier Communications Corp., Senior Unsecured Notes, 8.500% due 4/15/20 | | | 2,943,750 | |
8,545,000 | | | | HC2 Holdings Inc., Senior Secured Notes, 11.000% due 12/1/19(a)(c) | | | 8,758,625 | |
| | | | Intelsat Jackson Holdings SA: | | | | |
3,980,000 | | | | Company Guaranteed Notes, 9.750% due 7/15/25(a) | | | 3,781,000 | |
2,617,000 | | | | Senior Secured Notes, 8.000% due 2/15/24(a) | | | 2,747,850 | |
3,180,000 | | | | SFR Group SA, Senior Secured Notes, 7.375% due 5/1/26(a)(c) | | | 3,069,654 | |
2,380,000 | | | | Sinclair Television Group Inc., Company Guaranteed Notes, 5.625% due 8/1/24(a)(c) | | | 2,415,700 | |
525,000 | | | | Sprint Corp., Company Guaranteed Notes, 7.625% due 3/1/26 | | | 522,375 | |
| | | | | | | | |
| | | | Total Communications | | | 50,231,044 | |
| | | | | | | | |
Consumer Cyclical - 2.7% | | | | |
| | | | American Axle & Manufacturing Inc., Company Guaranteed Notes: | | | | |
900,000 | | | | 6.250% due 4/1/25(b) | | | 928,687 | |
1,230,000 | | | | 6.500% due 4/1/27(b) | | | 1,269,975 | |
See Notes to Financial Statements.
166
Schedules of Investments
(continued)
Destinations Multi Strategy Alternatives Fund
| | | | | | | | |
Face Amount/ Units/Shares† | | | | Security | | Value | |
Consumer Cyclical - 2.7% - (continued) | | | | |
| | | | Codere Finance 2 Luxembourg SA, Senior Secured Notes: | | | | |
4,000,000 | | EUR | | 6.750% due 11/1/21 | | $ | 5,085,204 | |
$ 2,625,000 | | | | 7.625% due 11/1/21 | | | 2,636,602 | |
7,593,000 | | | | JC Penney Corp. Inc., Senior Secured Notes, 5.875% due 7/1/23(a) | | | 7,289,280 | |
1,460,000 | | | | Men’s Wearhouse Inc., Company Guaranteed Notes, 7.000% due 7/1/22 | | | 1,452,700 | |
6,008,000 | | | | Neiman Marcus Group Ltd. LLC, Company Guaranteed Notes, 8.000% due 10/15/21(a)(c) | | | 3,634,840 | |
1,142,000 | | | | Pinnacle Entertainment Inc., Senior Unsecured Notes, 5.625% due 5/1/24(c) | | | 1,205,392 | |
1,231,000 | | | | Rite Aid Corp., Company Guaranteed Notes, 6.125% due 4/1/23(a) | | | 1,240,233 | |
| | | | | | | | |
| | | | Total Consumer Cyclical | | | 24,742,913 | |
| | | | | | | | |
Consumer Non-cyclical - 5.6% | | | | |
1,200,000 | | | | Adecoagro SA, Senior Unsecured Notes, 6.000% due 9/21/27(a)(c) | | | 1,139,640 | |
3,122,000 | | | | Ceridian HCM Holding Inc., Senior Unsecured Notes, 11.000% due 3/15/21(a)(c) | | | 3,226,056 | |
| | | | CHS/Community Health Systems Inc., Senior Secured Notes: | | | | |
2,450,000 | | | | 5.125% due 8/1/21(b) | | | 2,260,125 | |
4,994,000 | | | | 6.250% due 3/31/23 | | | 4,544,540 | |
8,878,000 | | | | Endo Dac / Endo Finance LLC / Endo Finco Inc., Company Guaranteed Notes, 6.000% due 2/1/25(a) | | | 6,364,416 | |
1,500,000 | | | | Endo Finance LLC, Company Guaranteed Notes, 5.750% due 1/15/22(a) | | | 1,226,250 | |
| | | | Kindred Healthcare Inc., Company Guaranteed Notes: | | | | |
2,856,000 | | | | 8.000% due 1/15/20(c) | | | 3,052,350 | |
3,364,000 | | | | 6.375% due 4/15/22(c) | | | 3,406,050 | |
5,000,000 | | | | Mallinckrodt International Finance SA / Mallinckrodt CB LLC, Company Guaranteed Notes, 4.875% due 4/15/20(a) | | | 4,837,500 | |
6,801,000 | | | | Rent-A-Center Inc., Company Guaranteed Notes, 4.750% due 5/1/21(b) | | | 6,018,885 | |
5,510,000 | | | | Sotera Health Holdings LLC, Senior Unsecured Notes, 6.500% due 5/15/23(a)(c) | | | 5,592,650 | |
5,000,000 | | | | Valeant Pharmaceuticals International Inc., Company Guaranteed Notes, 9.000% due 12/15/25(a) | | | 5,009,375 | |
4,077,000 | | | | Vector Group Ltd., Senior Secured Notes, 6.125% due 2/1/25(a)(c) | | | 4,163,636 | |
| | | | | | | | |
| | | | Total Consumer Non-cyclical | | | 50,841,473 | |
| | | | | | | | |
See Notes to Financial Statements.
167
Schedules of Investments
(continued)
Destinations Multi Strategy Alternatives Fund
| | | | | | | | |
Face Amount/ Units/Shares† | | | | Security | | Value | |
Diversified - 0.6% | | | | |
$ 5,371,000 | | | | HRG Group Inc., Senior Unsecured Notes, 7.750% due 1/15/22(c) | | $ | 5,602,624 | |
Energy - 3.5% | | | | |
3,920,000 | | | | Antero Resources Corp., Company Guaranteed Notes, 5.000% due 3/1/25(c) | | | 3,949,400 | |
5,736,000 | | | | California Resources Corp., Secured Notes, 8.000% due 12/15/22(a) | | | 4,538,610 | |
750,000 | | | | Chesapeake Energy Corp., Company Guaranteed Notes, 8.000% due 1/15/25(a)(c) | | | 740,625 | |
803,238 | | | | Connacher Oil & Gas Ltd., Secured Notes, 12.000% due 8/31/18(a)(d)(e)(f) | | | 8,032 | |
2,996,000 | | | | Continental Resources Inc., Company Guaranteed Notes, 4.900% due 6/1/44(c) | | | 2,872,415 | |
2,418,000 | | | | Denbury Resources Inc., Secured Notes, 9.000% due 5/15/21(a) | | | 2,472,405 | |
1,800,000 | | | | Enbridge Energy Partners LP, Junior Subordinated Notes, 5.492% (3-Month USD-LIBOR + 3.798%) due 10/1/37(c)(g) | | | 1,795,500 | |
| | | | EP Energy LLC / Everest Acquisition Finance Inc.: | | | | |
| | | | Company Guaranteed Notes: | | | | |
742,000 | | | | 7.750% due 9/1/22 | | | 474,880 | |
4,310,000 | | | | 6.375% due 6/15/23 | | | 2,327,400 | |
3,909,000 | | | | Secured Notes, 9.375% due 5/1/24(a) | | | 2,882,888 | |
1,000,000 | | | | Senior Secured Notes, 8.000% due 11/29/24(a) | | | 1,030,000 | |
| | | | Sable Permian Resources Land LLC / AEPB Finance Corp., Senior Unsecured Notes: | | | | |
6,336,000 | | | | 7.125% due 11/1/20(a) | | | 4,942,080 | |
3,242,000 | | | | 7.375% due 11/1/21(a) | | | 2,528,760 | |
| | | | Transocean Inc., Company Guaranteed Notes: | | | | |
690,000 | | | | 9.000% due 7/15/23(a)(c) | | | 743,475 | |
150,000 | | | | 7.500% due 1/15/26(a) | | | 151,125 | |
| | | | | | | | |
| | | | Total Energy | | | 31,457,595 | |
| | | | | | | | |
Financial - 3.7% | | | | |
2,276,000 | | | | Abe Investment Holdings Inc. / Getty Images Inc., Senior Unsecured Notes, 7.000% due 10/15/20(a)(c) | | | 1,820,800 | |
960,000 | | | | Acrisure LLC / Acrisure Finance Inc., Senior Unsecured Notes, 7.000% due 11/15/25(a)(c) | | | 938,400 | |
36,032 | | | | Capital Southwest Corp., Corporate Unsecured Notes, 5.950% due 12/15/22 | | | 945,120 | |
2,307,000 | | | | ESH Hospitality Inc., Company Guaranteed Notes, 5.250% due 5/1/25(a)(c) | | | 2,301,233 | |
| | | | ILFC E-Capital Trust I, Limited Guaranteed Notes: | | | | |
3,738,000 | | | | 4.370% due 12/21/65(a)(g) | | | 3,691,275 | |
434,000 | | | | 4.370% due 12/21/65(g) | | | 428,575 | |
See Notes to Financial Statements.
168
Schedules of Investments
(continued)
Destinations Multi Strategy Alternatives Fund
| | | | | | | | |
Face Amount/ Units/Shares† | | | | Security | | Value | |
Financial - 3.7% - (continued) | | | | |
$ 5,000,000 | | | | JPMorgan Chase & Co., Junior Subordinated Notes, 7.900% (3-Month USD-LIBOR + 3.470%) (c)(g)(h) | | $ | 5,051,500 | |
24,762 | | | | KCAP Financial Inc., Corporate Unsecured Notes, 6.125% due 9/30/22 | | | 624,498 | |
17,824 | | | | MVC Capital Inc., Corporate Unsecured Notes, 6.250% due 11/30/22 | | | 455,403 | |
4,590,000 | | | | Royal Bank of Scotland Group PLC, Junior Subordinated Notes, 4.013% (3-Month USD-LIBOR + 2.320%)(c)(g)(h) | | | 4,653,113 | |
4,213,000 | | | | State Street Corp., Junior Subordinated Notes, 2.588% (3-Month USD-LIBOR + 1.000%) due 6/15/47(c)(g) | | | 3,849,629 | |
21,189 | | | | TriplePoint Venture Growth BDC Corp., Corporate Unsecured Notes, 5.750% due 7/15/22 | | | 542,438 | |
1,207,000 | | | | Uniti Group LP / Uniti Group Finance Inc. / CSL Capital LLC, Company Guaranteed Notes, 8.250% due 10/15/23(c) | | | 1,125,528 | |
8,215,000 | | | | USB Realty Corp., Junior Subordinated Notes, 2.867% (3-Month USD-LIBOR + 1.147%) (a)(c)(g)(h) | | | 7,348,318 | |
| | | | | | | | |
| | | | Total Financial | | | 33,775,830 | |
| | | | | | | | |
Industrial - 1.1% | |
985,000 | | | | Aeropuertos Argentina 2000 SA, Senior Secured Notes, 6.875% due 2/1/27(a)(c) | | | 1,027,256 | |
250,000 | | | | Amsted Industries Inc., Company Guaranteed Notes, 5.000% due 3/15/22(a) | | | 255,000 | |
2,355,000 | | | | Ardagh Packaging Finance PLC / Ardagh Holdings USA Inc., Company Guaranteed Notes, 6.000% due 2/15/25(a)(c) | | | 2,413,875 | |
3,004,000 | | | | Builders FirstSource Inc., Senior Secured Notes, 5.625% due 9/1/24(a)(c) | | | 3,056,570 | |
2,853,000 | | | | XPO CNW Inc., Senior Unsecured Notes, 6.700% due 5/1/34(c) | | | 3,024,180 | |
| | | | | | | | |
| | | | Total Industrial | | | 9,776,881 | |
| | | | | | | | |
Technology - 1.2% | |
7,963,516 | | | | DynCorp International Inc., Secured Notes, 11.875% (10.375% cash or 1.500% PIK) due 11/30/20(c)(i) | | | 8,321,874 | |
1,750,000 | | | | Microchip Technology Inc., Senior Subordinated Notes, 1.625% due 2/15/25(c) | | | 3,045,660 | |
| | | | | | | | |
| | | | Total Technology | | | 11,367,534 | |
| | | | | | | | |
Utilities - 0.4% | |
104,000 | | | | FirstEnergy Solutions Corp., Company Guaranteed Notes, 6.800% due 8/15/39 | | | 36,660 | |
3,383,000 | | | | Talen Energy Supply LLC, Company Guaranteed Notes, 10.500% due 1/15/26(a) | | | 3,171,563 | |
| | | | | | | | |
| | | | Total Utilities | | | 3,208,223 | |
| | | | | | | | |
| | | | TOTAL CORPORATE BONDS & NOTES (Cost - $233,020,875) | | | 229,373,277 | |
| | | | | | | | |
See Notes to Financial Statements.
169
Schedules of Investments
(continued)
Destinations Multi Strategy Alternatives Fund
| | | | | | | | |
Face Amount/ Units/Shares† | | | | Security | | Value | |
SENIOR LOANS - 10.9% | |
$ 2,754,646 | | | | Acrisure LLC, 5.991% (3-Month USD-LIBOR + 4.250%) due 11/22/23 | | $ | 2,796,820 | |
2,800,000 | | | | Asurion LLC, 7.648% (1-Month USD-LIBOR + 6.000%) due 8/4/25 | | | 2,867,900 | |
| | | | ATP Oil & Gas Corp.: | | | | |
42 | | | | due 2/23/14(f)(j) | | | — | |
647 | | | | due 3/3/14(f)(j) | | | — | |
537 | | | | due 2/28/17(f)(j) | | | — | |
4,480,000 | | | | Avaya Inc., 6.338% (1-Month USD-LIBOR + 4.750%) due 12/15/24 | | | 4,502,400 | |
1,695,000 | | | | California Resources Corp., 11.971% (1-Month USD-LIBOR + 10.375%) due 12/31/21 | | | 1,911,112 | |
5,485,780 | | | | Chobani LLC, 5.148% (1-Month USD-LIBOR + 3.500%) due 10/10/23 | | | 5,521,767 | |
4,944,528 | | | | Communications Sales & Leasing Inc., 4.648% (1-Month USD-LIBOR + 3.000%) due 10/24/22 | | | 4,748,823 | |
450,000 | | | | Consolidated Communications Inc., 4.650% (1-Month USD-LIBOR + 3.000%) due 10/5/23 | | | 442,206 | |
| | | | DigiCert Inc.: | | | | |
2,250,000 | | | | 6.522% (3-Month USD-LIBOR + 4.750%) due 10/31/24 | | | 2,273,918 | |
1,500,000 | | | | 9.772% (3-Month USD-LIBOR + 8.000%) due 10/31/25 | | | 1,515,000 | |
1,805,778 | | | | DynCorp International Inc., 7.750% (3-Month USD-LIBOR + 6.000%) due 7/7/20 | | | 1,809,534 | |
2,103,353 | | | | EIG Investors Corp., 5.955% (1/3-Month USD-LIBOR + 4.000%) due 2/9/23 | | | 2,114,627 | |
| | | | Equinox Holdings Inc.: | | | | |
3,225,666 | | | | 4.648% (1-Month USD-LIBOR + 3.000%) due 3/8/24 | | | 3,246,503 | |
1,000,000 | | | | 8.648% (1-Month USD-LIBOR + 7.000%) due 9/6/24 | | | 1,028,750 | |
5,157,499 | | | | Evergreen Skills Lux SÀRL, 6.398% (1-Month USD-LIBOR + 4.750%) due 4/28/21 | | | 4,990,705 | |
150,000 | | | | Genworth Financial Inc., due 2/28/23(j) | | | 152,250 | |
7,978,010 | | | | Getty Images Inc., 5.193% (3-Month USD-LIBOR + 3.500%) due 10/18/19 | | | 7,624,345 | |
8,435,867 | | | | Hoya Midco LLC, 5.648% (1-Month USD-LIBOR + 4.000%) due 6/30/24 | | | 8,446,412 | |
7,595,000 | | | | La Paloma Generating Co. LLC, 9.250% due 2/20/20)(d)(e)(f) | | | 189,875 | |
| | | | McAfee LLC: | | | | |
1,915,200 | | | | 6.148% (1-Month USD-LIBOR + 4.500%) due 9/30/24 | | | 1,924,087 | |
1,600,000 | | | | 10.148% (1-Month USD-LIBOR + 8.500%) due 9/29/25 | | | 1,604,000 | |
2,994,498 | | | | Navistar Inc., 5.080% (1-Month USD-LIBOR + 3.500%) due 11/6/24 | | | 3,002,913 | |
See Notes to Financial Statements.
170
Schedules of Investments
(continued)
Destinations Multi Strategy Alternatives Fund
| | | | | | | | |
Face Amount/ Units/Shares† | | Rating†† | | Security | | Value | |
SENIOR LOANS - 10.9% - (continued) | |
$ 876,058 | | | | Neiman Marcus Group Ltd. LLC, 4.830% (1-Month USD-LIBOR + 3.250%) due 10/25/20 | | $ | 741,180 | |
3,973,912 | | | | ProQuest LLC, 5.398% (1-Month USD-LIBOR + 3.750%) due 10/24/21 | | | 4,022,354 | |
2,737,071 | | | | QCP SNF East REIT LLC, due 10/31/22(j) | | | 2,761,020 | |
669,704 | | | | Quorum Health Corp., 8.398% (1-Month USD-LIBOR + 6.750%) due 4/29/22 | | | 683,098 | |
7,730,625 | | | | Scientific Games International Inc., 4.449% (3-Month USD-LIBOR + 2.750%) due 8/14/24 | | | 7,764,485 | |
6,592,251 | | | | Seadrill Operating LP, 4.693% (3-Month USD-LIBOR + 3.000%) due 2/21/21 | | | 5,705,594 | |
3,117,343 | | | | Southern Pacific Resource Corp., 14.250% due 3/31/19(d)(e)(f) | | | — | |
2,768,347 | | | | Supervalu Inc., 5.148% (1-Month USD-LIBOR + 3.500%) due 6/8/24 | | | 2,740,220 | |
| | | | Syniverse Holdings Inc.: | | | | |
2,250,000 | | | | due 2/9/23(j) | | | 2,267,573 | |
1,200,000 | | | | due 2/9/24(j) | | | 1,216,500 | |
5,056,595 | | | | Uber Technologies Inc., 5.648% (1-Month USD-LIBOR + 4.000%) due 7/13/23 | | | 5,084,407 | |
3,234,373 | | | | UOS LLC, 7.148% (1-Month USD-LIBOR + 5.500%) due 4/18/23 | | | 3,323,319 | |
| | | | | | | | |
| | | | TOTAL SENIOR LOANS (Cost - $ 98,167,115) | | | 99,023,697 | |
| | | | | | | | |
MUNICIPAL BONDS - 0.9% | |
Ohio - 0.1% | |
2,060,000 | | C | | Ohio Air Quality Development Authority, Revenue Bonds, First Energy Generation Corp., Series A, 3.750% due 12/1/23(g) | | | 700,400 | |
| | | | | | | | |
Puerto Rico - 0.8% | |
11,175,000 | | D | | Commonwealth of Puerto Rico, GO, Series A, 8.000% due 7/1/35(d) | | | 3,436,312 | |
| | | | Government Development Bank for Puerto Rico, Revenue Bonds: | | | | |
6,380,000 | | D | | Series A, 3.875% due 2/1/17(d) | | | 1,786,400 | |
1,515,000 | | NR | | Series B, 4.704% due 5/1/16(d) | | | 424,200 | |
3,220,000 | | NR | | Series H, 4.900% due 8/1/21(d) | | | 901,600 | |
2,615,000 | | NR | | Series I, 4.350% due 8/1/18(d) | | | 732,200 | |
| | | | | | | | |
| | | | Total Puerto Rico | | | 7,280,712 | |
| | | | | | | | |
| | | | TOTAL MUNICIPAL BONDS (Cost - $ 7,057,299) | | | 7,981,112 | |
| | | | | | | | |
U.S. GOVERNMENT OBLIGATION - 0.7% | |
6,717,600 | | | | U.S. Treasury Notes, 1.125% due 1/31/19 (Cost - $ 6,675,929) | | | 6,659,608 | |
| | | | | | | | |
See Notes to Financial Statements.
171
Schedules of Investments
(continued)
Destinations Multi Strategy Alternatives Fund
| | | | | | | | |
| Shares/Units | | | | Security | | Value | |
OPEN-END FUNDS - 20.3% | |
4,764,845 | | | | BrandywineGLOBAL - Global Unconstrained Bond Fund, Class I Shares | | $ | 59,751,160 | |
10,766,377 | | | | JPMorgan Strategic Income Opportunities Fund, Class I Shares | | | 124,889,974 | |
| | | | | | | | |
| | | | TOTAL OPEN-END FUNDS (Cost - $ 183,227,137) | | | 184,641,134 | |
| | | | | | | | |
COMMON STOCKS - 17.6% | |
BASIC MATERIALS - 1.1% | |
Chemicals - 1.1% | |
169,118 | | | | Huntsman Corp. | | | 5,457,438 | |
239,189 | | | | Venator Materials PLC* | | | 4,578,077 | |
| | | | | | | | |
| | | | Total Chemicals | | | 10,035,515 | |
| | | | | | | | |
| | | | TOTAL BASIC MATERIALS | | | 10,035,515 | |
| | | | | | | | |
COMMUNICATIONS - 0.9% | |
Media - 0.8% | | | | | | | | |
629,618 | | | | Altice NV, Class A Shares* | | | 6,057,505 | |
127,501 | | | | TiVo Corp.(c) | | | 1,912,515 | |
| | | | | | | | |
| | | | Total Media | | | 7,970,020 | |
| | | | | | | | |
Telecommunications - 0.1% | | | | |
149,274 | | | | HC2 Holdings Inc.* | | | 740,399 | |
| | | | | | | | |
| | | | TOTAL COMMUNICATIONS | | | 8,710,419 | |
| | | | | | | | |
CONSUMER CYCLICAL - 0.4% | | | | |
Auto Manufacturers - 0.2% | | | | |
40,676 | | | | General Motors Co.(c) | | | 1,600,601 | |
| | | | | | | | |
Retail - 0.2% | | | | | | |
26,008 | | | | Group 1 Automotive Inc. | | | 1,790,391 | |
| | | | | | | | |
| | | | TOTAL CONSUMER CYCLICAL | | | 3,390,992 | |
| | | | | | | | |
CONSUMER NON-CYCLICAL - 4.5% | | | | |
Biotechnology - 1.9% | | | | |
231,445 | | | | Adverum Biotechnologies Inc.* | | | 1,602,757 | |
40,918 | | | | Blueprint Medicines Corp.* | | | 3,541,862 | |
105,338 | | | | Loxo Oncology Inc.*(c) | | | 11,715,692 | |
| | | | | | | | |
| | | | Total Biotechnology | | | 16,860,311 | |
| | | | | | | | |
Commercial Services - 0.4% | | | | |
93,547 | | | | Quanta Services Inc.* | | | 3,221,759 | |
25,720 | | | | Rent-A-Center Inc.(b) | | | 193,414 | |
| | | | | | | | |
| | | | Total Commercial Services | | | 3,415,173 | |
| | | | | | | | |
See Notes to Financial Statements.
172
Schedules of Investments
(continued)
Destinations Multi Strategy Alternatives Fund
| | | | | | | | |
| Shares/Units | | | | Security | | Value | |
Healthcare-Products - 0.1% | | | | |
115,268 | | | | Nuvectra Corp.* | | $ | 1,229,910 | |
| | | | | | | | |
Healthcare-Services - 0.3% | | | | |
263,698 | | | | Natera Inc.*(c) | | | 2,373,282 | |
| | | | | | | | |
Pharmaceuticals - 1.8% | | | | |
184,140 | | | | Aclaris Therapeutics Inc.*(b)(c) | | | 3,671,752 | |
456,181 | | | | Array BioPharma Inc.* | | | 7,901,055 | |
91,630 | | | | Catalyst Pharmaceuticals Inc.* | | | 292,300 | |
239,080 | | | | Clementia Pharmaceuticals Inc.*(b)(c) | | | 3,810,935 | |
53,452 | | | | Concert Pharmaceuticals Inc.*(c) | | | 1,169,530 | |
| | | | | | | | |
| | | | Total Pharmaceuticals | | | 16,845,572 | |
| | | | | | | | |
| | | | TOTAL CONSUMER NON-CYCLICAL | | | 40,724,248 | |
| | | | | | | | |
DIVERSIFIED - 0.5% | | | | |
SPACs - 0.5% | | | | | | |
56,552 | | | | Andina Acquisition Corp. II* | | | 557,037 | |
26,313 | | | | Atlantic Acquisition Corp.* | | | 258,131 | |
42,941 | | | | Big Rock Partners Acquisition Corp.* | | | 442,292 | |
34,933 | | | | Black Ridge Acquisition Corp.* | | | 336,754 | |
52,566 | | | | CM Seven Star Acquisition Corp.* | | | 511,467 | |
22,935 | | | | Constellation Alpha Capital Corp.* | | | 224,763 | |
21,044 | | | | Draper Oakwood Technology Acquisition Inc., Class A Shares* | | | 206,231 | |
50,123 | | | | Haymaker Acquisition Corp.* | | | 497,220 | |
42,864 | | | | Hennessy Capital Acquisition Corp. III*(b) | | | 422,210 | |
25,795 | | | | Industrea Acquisition Corp., Class A Shares*(b) | | | 253,307 | |
35,601 | | | | Legacy Acquisition Corp.* | | | 352,450 | |
52,477 | | | | Leisure Acquisition Corp.* | | | 520,047 | |
30,010 | | | | Osprey Energy Acquisition Corp.* | | | 288,696 | |
60,188 | | | | Pensare Acquisition Corp.* | | | 583,222 | |
| | | | | | | | |
| | | | Total SPACs | | | 5,453,827 | |
| | | | | | | | |
| | | | TOTAL DIVERSIFIED | | | 5,453,827 | |
| | | | | | | | |
ENERGY - 0.4% | | | | |
Oil & Gas - 0.4% | | | | |
534,616 | | | | Connacher Oil & Gas Ltd.*(e)(f) | | | — | |
74,542 | | | | EQT Corp. | | | 3,750,208 | |
| | | | | | | | |
| | | | Total Oil & Gas | | | 3,750,208 | |
| | | | | | | | |
| | | | TOTAL ENERGY | | | 3,750,208 | |
| | | | | | | | |
FINANCIAL - 3.6% | | | | |
Banks - 0.4% | | | | | | |
11,949 | | | | BB&T Corp.(c) | | | 649,428 | |
50,713 | | | | Huntington Bancshares Inc.(c) | | | 796,194 | |
See Notes to Financial Statements.
173
Schedules of Investments
(continued)
Destinations Multi Strategy Alternatives Fund
| | | | | | | | |
| Shares/Units | | | | Security | | Value | |
Banks - 0.4% - (continued) | | | | |
47,400 | | | | Kearny Financial Corp.(c) | | $ | 616,200 | |
30,122 | | | | KeyCorp(c) | | | 636,478 | |
3,264 | | | | M&T Bank Corp.(c) | | | 619,638 | |
| | | | | | | | |
| | | | Total Banks | | | 3,317,938 | |
| | | | | | | | |
Insurance - 1.2% | | | | |
1,132,616 | | | | FGL Holdings*(c) | | | 10,918,418 | |
| | | | | | | | |
Investment Companies - 0.7% | | | | |
108,353 | | | | American Capital Senior Floating Ltd. | | | 1,170,212 | |
249,718 | | | | Corporate Capital Trust Inc.(b) | | | 3,873,126 | |
50,845 | | | | FS Investment Corp. | | | 360,999 | |
65,060 | | | | Garrison Capital Inc. | | | 510,070 | |
| | | | | | | | |
| | | | Total Investment Companies | | | 5,914,407 | |
| | | | | | | | |
Savings & Loans - 1.3% | | | | |
43,385 | | | | Investors Bancorp Inc.(c) | | | 585,698 | |
206,791 | | | | OceanFirst Financial Corp.(c) | | | 5,351,751 | |
229,484 | | | | Oritani Financial Corp.(c) | | | 3,579,950 | |
126,526 | | | | Waterstone Financial Inc.(c) | | | 2,176,247 | |
| | | | | | | | |
| | | | Total Savings & Loans | | | 11,693,646 | |
| | | | | | | | |
| | | | TOTAL FINANCIAL | | | 31,844,409 | |
| | | | | | | | |
INDUSTRIAL - 3.8% | | | | |
Aerospace/Defense - 0.7% | | | | |
47,236 | | | | Rockwell Collins Inc. | | | 6,505,342 | |
| | | | | | | | |
Building Materials - 1.3% | | | | |
170,354 | | | | Builders FirstSource Inc.*(c) | | | 3,267,390 | |
48,696 | | | | Eagle Materials Inc. | | | 4,880,800 | |
16,158 | | | | Martin Marietta Materials Inc. | | | 3,295,101 | |
| | | | | | | | |
| | | | Total Building Materials | | | 11,443,291 | |
| | | | | | | | |
Transportation - 1.8% | | | | |
128,120 | | | | Knight-Swift Transportation Holdings Inc., Class A Shares | | | 6,170,259 | |
104,092 | | | | XPO Logistics Inc.*(c) | | | 10,245,776 | |
| | | | | | | | |
| | | | Total Transportation | | | 16,416,035 | |
| | | | | | | | |
| | | | TOTAL INDUSTRIAL | | | 34,364,668 | |
| | | | | | | | |
See Notes to Financial Statements.
174
Schedules of Investments
(continued)
Destinations Multi Strategy Alternatives Fund
| | | | | | | | |
| Shares/Units | | | | Security | | Value | |
TECHNOLOGY - 2.4% | | | | |
Semiconductors - 2.1% | | | | |
80,249 | | | | Marvell Technology Group Ltd. | | $ | 1,885,049 | |
137,826 | | | | NXP Semiconductors NV*(c) | | | 17,181,389 | |
| | | | | | | | |
| | | | Total Semiconductors | | | 19,066,438 | |
| | | | | | | | |
Software - 0.3% | |
147,263 | | | | Avaya Holdings Corp.*(c) | | | 3,091,041 | |
| | | | | | | | |
| | | | TOTAL TECHNOLOGY | | | 22,157,479 | |
| | | | | | | | |
| | | | TOTAL COMMON STOCKS (Cost - $147,522,189) | | | 160,431,765 | |
| | | | | | | | |
CLOSED-END FUNDS - 12.8% | |
154,881 | | | | Advent/Claymore Enhanced Growth & Income Fund, Class Common Shares | | | 1,251,438 | |
283,173 | | | | AllianzGI Convertible & Income 2024 Target, Class Common Shares | | | 2,610,855 | |
158,171 | | | | AllianzGI NFJ Dividend Interest & Premium Strategy Fund, Class Common Shares | | | 2,076,785 | |
602,552 | | | | Alpine Total Dynamic Dividend Fund, Class Common Shares | | | 5,603,734 | |
308 | | | | BlackRock 2022 Global Income Opportunity Trust, Class Common Shares | | | 2,926 | |
176,089 | | | | BlackRock Credit Allocation Income Trust, Class Common Shares | | | 2,236,330 | |
26,736 | | | | BlackRock Debt Strategies Fund Inc., Class Common Shares | | | 306,662 | |
10,059 | | | | BlackRock Municipal 2030 Target Term Trust, Class Common Shares | | | 214,760 | |
212,410 | | | | BrandywineGLOBAL Global Income Opportunities Fund Inc., Class Common Shares | | | 2,729,468 | |
95,160 | | | | Clough Global Equity Fund, Class Common Shares | | | 1,289,418 | |
590,762 | | | | Clough Global Opportunities Fund, Class Common Shares | | | 6,504,290 | |
118,666 | | | | Cornerstone Strategic Value Fund Inc., Class Common Shares(b) | | | 1,845,256 | |
325,017 | | | | Delaware Enhanced Global Dividend & Income Fund, Class Common Shares | | | 3,857,952 | |
66,754 | | | | Delaware Investments Dividend & Income Fund Inc., Class Common Shares | | | 711,598 | |
163,642 | | | | Eagle Growth & Income Opportunities Fund, Class Common Shares | | | 2,546,269 | |
129,666 | | | | Eaton Vance Floating-Rate 2022 Target Term Trust, Class Common Shares | | | 1,199,410 | |
380,667 | | | | First Trust Senior Floating Rate 2022 Target Term Fund, Class Common Shares | | | 3,563,043 | |
253,499 | | | | Gabelli Equity Trust Inc., Class Common Shares | | | 1,599,579 | |
See Notes to Financial Statements.
175
Schedules of Investments
(continued)
Destinations Multi Strategy Alternatives Fund
| | | | | | | | |
| Shares/Units | | | | Security | | Value | |
CLOSED-END FUNDS - 12.8% - (continued) | |
21,578 | | | | General American Investors Co., Inc., 5.950%, Class Preferred Shares(h) | | $ | 563,186 | |
353,171 | | | | Highland Floating Rate Opportunities Fund, Class Common Shares | | | 5,661,331 | |
243,103 | | | | Invesco High Income Trust II, Class Common Shares | | | 3,413,166 | |
485,499 | | | | Invesco Senior Income Trust, Class Common Shares(b) | | | 2,136,196 | |
138,156 | | | | Kayne Anderson MLP Investment Co., Class Common Shares* | | | 2,405,296 | |
61,095 | | | | Lazard World Dividend & Income Fund Inc., Class Common Shares | | | 720,310 | |
879,486 | | | | Liberty All Star Equity Fund, Class Common Shares | | | 5,496,787 | |
135,308 | | | | Madison Covered Call & Equity Strategy Fund, Class Common Shares | | | 1,024,282 | |
54,641 | | | | Managed Duration Investment Grade Municipal Fund, Class Common Shares | | | 727,272 | |
196,383 | | | | Morgan Stanley Emerging Markets Debt Fund Inc., Class Common Shares | | | 1,881,349 | |
70,771 | | | | Morgan Stanley Emerging Markets Fund Inc., Class Common Shares | | | 1,309,263 | |
9,331 | | | | Morgan Stanley Income Securities Inc., Class Common Shares | | | 175,516 | |
117,211 | | | | NexPoint Credit Strategies Fund, Class Common Shares(b) | | | 2,790,794 | |
138,430 | | | | Nuveen AMT-Free Quality Municipal Income Fund, Class Common Shares | | | 1,803,743 | |
164,032 | | | | Nuveen Credit Strategies Income Fund, Class Common Shares(b) | | | 1,327,019 | |
46,130 | | | | Nuveen Emerging Markets Debt 2022 Target Term Fund, Class Common Shares(b) | | | 422,551 | |
114,032 | | | | Nuveen Intermediate Duration Quality Municipal Term Fund, Class Common Shares | | | 1,429,961 | |
62,201 | | | | Nuveen Mortgage Opportunity Term Fund 2, Class Common Shares | | | 1,424,403 | |
93,953 | | | | Nuveen Mortgage Opportunity Term Fund, Class Common Shares | | | 2,231,384 | |
132,821 | | | | Nuveen Quality Municipal Income Fund, Class Common Shares | | | 1,749,253 | |
99,616 | | | | PIMCO Dynamic Credit & Mortgage Income Fund, Class Common Shares | | | 2,217,452 | |
459,165 | | | | PIMCO High Income Fund, Class Common Shares(b) | | | 3,425,371 | |
172,203 | | | | Prudential Global Short Duration High Yield Fund Inc., Class Common Shares | | | 2,417,730 | |
32,505 | | | | Prudential Short Duration High Yield Fund Inc., Class Common Shares(b) | | | 466,772 | |
74,785 | | | | Reaves Utility Income Fund, Class Common Shares | | | 2,107,441 | |
151,962 | | | | Royce Micro-Capital Trust Inc., Class Common Shares | | | 1,429,962 | |
388,182 | | | | Sprott Focus Trust Inc., Class Common Shares(b) | | | 3,093,810 | |
See Notes to Financial Statements.
176
Schedules of Investments
(continued)
Destinations Multi Strategy Alternatives Fund
| | | | | | | | |
| Shares/Units | | | | Security | | Value | |
CLOSED-END FUNDS - 12.8% - (continued) | |
225,898 | | | | Sprott Physical Gold & Silver Trust, Class Common Shares | | $ | 2,970,559 | |
421,101 | | | | Templeton Emerging Markets Income Fund, Class Common Shares | | | 4,947,937 | |
383,488 | | | | Templeton Global Income Fund, Class Common Shares | | | 2,442,819 | |
5,711 | | | | Tortoise Energy Infrastructure Corp., Class Common Shares(b) | | | 158,195 | |
255,618 | | | | Virtus Total Return Fund Inc., Class Common Shares | | | 2,811,798 | |
174,391 | | | | Voya Prime Rate Trust, Class Common Shares(b) | | | 901,601 | |
274,906 | | | | Western Asset Emerging Markets Debt Fund Inc., Class Common Shares | | | 4,035,620 | |
572,442 | | | | Western Asset High Income Opportunity Fund Inc., Class Common Shares | | | 2,787,793 | |
84,933 | | | | Western Asset/Claymore Inflation-Linked Opportunities & Income Fund, Class Common Shares | | | 973,332 | |
| | | | | | | | |
| | | | TOTAL CLOSED-END FUNDS (Cost - $115,149,571) | | | 116,031,027 | |
| | | | | | | | |
PREFERRED STOCKS - 0.4% | |
FINANCIAL - 0.4% | |
Banks - 0.4% | |
130,384 | | | | GMAC Capital Trust I, 7.624% (3-Month USD-LIBOR + 5.785%)(c)(g) | | | 3,363,907 | |
| | | | | | | | |
| | | | TOTAL FINANCIAL | | | 3,363,907 | |
| | | | | | | | |
| | | | TOTAL PREFERRED STOCKS (Cost - $3,429,657) | | | 3,363,907 | |
| | | | | | | | |
EXCHANGE TRADED FUND (ETF) - 0.1% | |
3,045 | | | | SPDR S&P 500 Trust (Cost - $818,805) | | | 827,174 | |
| | | | | | | | |
WARRANTS - 0.0% | |
DIVERSIFIED - 0.0% | |
SPACs - 0.0% | |
52,399 | | | | Black Ridge Acquisition Corp.* | | | 16,768 | |
26,283 | | | | CM Seven Star Acquisition Corp.* | | | 6,571 | |
22,935 | | | | Constellation Alpha Capital Corp.* | | | 4,816 | |
10,522 | | | | Draper Oakwood Technology Acquisition Inc.* | | | 8,891 | |
32,148 | | | | Hennessy Capital Acquisition Corp. III* | | | 25,397 | |
26,357 | | | | I-AM Capital Acquisition Co.* | | | 9,752 | |
25,795 | | | | Industrea Acquisition Corp.* | | | 15,477 | |
15,005 | | | | Osprey Energy Acquisition Corp.* | | | 9,903 | |
30,094 | | | | Pensare Acquisition Corp.* | | | 13,542 | |
| | | | Total SPACs | | | 111,117 | |
| | | | | | | | |
| | | | TOTAL DIVERSIFIED | | | 111,117 | |
| | | | | | | | |
| | | | TOTAL WARRANTS (Cost - $101,924) | | | 111,117 | |
| | | | | | | | |
See Notes to Financial Statements.
177
Schedules of Investments
(continued)
Destinations Multi Strategy Alternatives Fund
| | | | | | | | |
| Shares/Units | | | | Security | | Value | |
RIGHTS - 0.0% | |
26,313 | | | | Atlantic Acquisition Corp.* | | $ | 14,209 | |
17,467 | | | | Black Ridge Acquisition Corp.* | | | 5,240 | |
52,566 | | | | CM Seven Star Acquisition Corp.* | | | 13,667 | |
22,935 | | | | Constellation Alpha Capital Corp.* | | | 6,880 | |
21,044 | | | | Draper Oakwood Technology Acquisition Inc.* | | | 10,901 | |
60,188 | | | | Pensare Acquisition Corp.* | | | 27,085 | |
| | | | TOTAL RIGHTS (Cost - $71,390) | | | 77,982 | |
| | | | | | | | |
Number of Contracts | | Notional
Amounts | | | | | |
PURCHASED OPTIONS - 0.1% | |
Equity Options - 0.1% | |
510 | | $ 6,291,870 | | Monsanto Co., Call @ $120.00, expires 7/20/18, NFSC | | | 329,970 | |
331 | | 4,459,894 | | United Technologies Corp., Call @ $135.00, expires 1/18/19, GSC | | | 396,869 | |
| | | | | | | | |
| | | | Total United States | | | 726,839 | |
| | | | | | | | |
| | | | TOTAL PURCHASED OPTIONS (Cost - $583,429) | | | 726,839 | |
| | | | | | | | |
| | | | TOTAL INVESTMENTS BEFORE SHORT-TERM INVESTMENTS (Cost - $795,825,320) | | | 809,248,639 | |
| | | | | | | | |
Face Amount | | | | | | | |
SHORT-TERM INVESTMENTS - 6.9% | |
TIME DEPOSITS - 6.9% | |
$ 3,859,953 | | | | ANZ National Bank - London, 0.780% due 3/1/18 | | | 3,859,953 | |
21,076,407 | | | | BNP Paribas - Paris, 0.780% due 3/1/18 | | | 21,076,407 | |
3,824 | | | | Brown Brothers Harriman - Grand Cayman, 0.780% due 3/1/18 | | | 3,824 | |
37,992,145 | | | | JPMorgan Chase & Co. - New York, 0.780% due 3/1/18 | | | 37,992,145 | |
| | | | | | | | |
| | | | TOTAL TIME DEPOSITS (Cost - $62,932,329) | | | 62,932,329 | |
| | | | | | | | |
INVESTMENTS PURCHASED WITH CASH PROCEEDS FROM SECURITIES LENDING - 1.9% | |
MONEY MARKET FUND - 1.9% | |
17,012,174 | | | | Federated Government Obligations Fund, Premier Class(k) (Cost - $17,012,174) | | | 17,012,174 | |
| | | | | | | | |
| | | | TOTAL INVESTMENTS - 97.8%
(Cost - $875,769,823#) | | | 889,193,142 | |
| | | | | | | | |
| | | | Other Assets in Excess of Liabilities - 2.2% | | | 20,184,006 | |
| | | | | | | | |
| | | | TOTAL NET ASSETS - 100.0% | | $ | 909,377,148 | |
| | | | | | | | |
See Notes to Financial Statements.
178
Schedules of Investments
(continued)
Destinations Multi Strategy Alternatives Fund
| † | Face amount denominated in U.S. dollars, unless otherwise noted. |
| †† | All ratings are by Standard & Poor’s Rating Service, unless otherwise noted (unaudited). |
| * | Non-income producing security. |
| (a) | Restricted security that may be sold to “qualified institutional buyers” pursuant to the conditions of Rule 144A under the Securities Act of 1933, as amended. This security has been deemed liquid pursuant to guidelines approved by the Board of Trustees, unless otherwise noted. The aggregate value of restricted 144A holdings at February 28, 2018, amounts to approximately $124,029,585 and represents 13.64% of net assets. |
| (b) | All or a portion of this security is on loan (See Note 5). |
| (c) | All or a portion of this security is pledged by the Fund as collateral for short sales or derivative transactions. |
| (d) | Security is currently in default. |
| (f) | Security is valued in good faith at fair value by or under the direction of the Board of Trustees. |
| (g) | Variable rate security. Interest rate disclosed is that which was in effect at February 28, 2018. |
| (h) | Security is perpetual in nature and has no stated maturity date. |
| (i) | Payment in-kind security for which part of the income earned may be paid as additional principal. |
| (j) | This position represents an unsettled loan commitment at period end. Certain details associated with this purchase are not known prior to the settlement date, including coupon rate. |
| (k) | Represents investment of collateral received from securities lending transactions. |
| # | Aggregate cost for federal income tax purposes is $840,094,592. |
Abbreviations used in this schedule:
| | | | |
| GO | | — | | General Obligation |
| LIBOR | | — | | London Interbank Offered Rate |
| LLC | | — | | Limited Liability Company |
| PLC | | — | | Public Limited Company |
| REIT | | — | | Real Estate Investment Trust |
| SPACs | | — | | Special Purpose Acquisition Companies |
See pages 186-188 for definitions of ratings.
See Notes to Financial Statements.
179
Schedules of Investments
(continued)
Destinations Multi Strategy Alternatives Fund
| | | | |
| Summary of Investments by Security Type^ (unaudited) | |
| |
Corporate Bonds & Notes | | | 25.8 | % |
Open-End Funds | | | 20.8 | |
Common Stocks | | | 18.0 | |
Closed-End Funds | | | 13.0 | |
Senior Loans | | | 11.1 | |
Municipal Bonds | | | 0.9 | |
U.S. Government Obligation | | | 0.8 | |
Preferred Stocks | | | 0.4 | |
Exchange Traded Fund (ETF) | | | 0.1 | |
Purchased Options | | | 0.1 | |
Warrants | | | 0.0 | * |
Rights | | | 0.0 | * |
Short-Term Investments | | | 7.1 | |
Money Market Fund | | | 1.9 | |
| | | | |
| | | 100.0 | % |
| | | | |
| ^ | As a percentage of total investments. |
| * | Position represents less than 0.05%. |
Schedule of Options Contracts Written
Equity Options
| | | | | | | | | | | | | | | | | | | | | | | | |
Number of Contracts | | | Notional
Amounts | | | Security Name | | Counterparty | | | Expiration
Date | | | Strike
Price | | | Value | |
| | 510 | | | $ | 6,291,870 | | | Monsanto Co., Call | | | NFSC | | | | 7/20/18 | | | $ | 125.00 | | | $ | 125,460 | |
| | 510 | | | | 6,291,870 | | | Monsanto Co., Put | | | NFSC | | | | 7/20/18 | | | | 105.00 | | | | 45,900 | |
| | 1,375 | | | | 17,140,750 | | | NXP Semiconductors NV, Call | | | GSC | | | | 1/18/19 | | | | 110.00 | | | | 2,378,750 | |
| | | | | | | | | | | | | | | | | | | | | | | | |
| | | | | | | | TOTAL OPTIONS CONTRACTS WRITTEN | | | | | | | | | | | | | | | | |
| | | | | | | | (Premiums received — $1,004,275) | | | | | | | | | | | | | | | $2,550,110 | |
| | | | | | | | | | | | | | | | | | | | | | | | |
See Notes to Financial Statements.
180
Schedules of Investments
(continued)
Destinations Multi Strategy Alternatives Fund
At February 28, 2018, Destinations Multi Strategy Alternatives Fund had open exchange traded futures contracts as described below.
The unrealized appreciation/(depreciation) on the open contracts reflected in the accompanying financial statements were as follows:
| | | | | | | | | | | | | | | | | | | | |
Open Futures Contracts | | Number of
Contracts | | | Expiration
Date
(Month/Year) | | | Notional
Amounts | | | Market Value | | | Unrealized
Appreciation/
(Depreciation) | |
Contracts to Sell: | | | | | | | | | | | | | | | | | | | | |
U.S. Treasury 5-Year Note June Futures | | | 485 | | | | 6/18 | | | $ | 55,358,203 | | | $ | 55,255,899 | | | $ | 102,304 | |
U.S. Treasury 10-Year Note June Futures | | | 150 | | | | 6/18 | | | | 18,036,328 | | | | 18,007,031 | | | | 29,297 | |
U.S. Long Bond June Futures | | | 61 | | | | 6/18 | | | | 8,735,391 | | | | 8,749,688 | | | | (14,297 | ) |
| | | | | | | | | | | | | | | | | | | | |
Net Unrealized Appreciation on Open Exchange Traded Futures Contracts | | | | 117,304 | |
| | | | | | | | | | | | | | | | | | | | |
At February 28, 2018, Destinations Multi Strategy Alternatives Fund had deposited cash of $566,600 with a broker or brokers as margin collateral on open exchange traded futures contracts.
At February 28, 2018, Destinations Multi Strategy Alternatives Fund had open forward foreign currency contracts as described below.
The unrealized appreciation on the open contracts reflected in the accompanying financial statements were as follows:
| | | | | | | | | | | | | | | | | | | | | | | | | | | | |
Foreign Currency | | Local
Currency | | | Counterparty | | | Market Value | | | Settlement
Date | | | Unrealized
Appreciation | | | Unrealized
(Depreciation) | | | Net
Unrealized
Appreciation/
(Depreciation) | |
Contracts to Sell: | | | | | | | | | | | | | | | | | | | | | | | | | | | | |
Euro | | | 2,900,000 | | | | GSC | | | $ | 3,556,000 | | | | 5/7/18 | | | $ | 17,737 | | | $ | — | | | $ | 17,737 | |
Euro | | | 2,200,000 | | | | GSC | | | | 2,697,655 | | | | 5/7/18 | | | | 13,455 | | | | — | | | | 13,455 | |
Euro | | | 4,000,000 | | | | MSC | | | | 4,904,828 | | | | 5/7/18 | | | | 117,608 | | | | — | | | | 117,608 | |
| | | | | | | | | | | | | | | | | | | | | | | | | | | | |
Net Unrealized Appreciation on Open Forward Foreign Currency Contracts | | | $ | 148,800 | | | $ | — | | | $ | 148,800 | |
| | | | | | | | | | | | | | | | | | | | | | | | | | | | |
At February 28, 2018, Destinations Multi Strategy Alternatives Fund held the following OTC Credit Default Swap Contracts:
OTC Credit Default Swaps on Corporate and Sovereign Issues - Buy Protection (1)
| | | | | | | | | | | | | | | | | | | | | | | | | | | | | | | | | | |
Reference Obligation | | Fixed Deal
(Pay) Rate | | | Maturity
Date | | | Payment
Frequency | | Counterparty | | | Implied
Credit
Spread at
2/28/18(2) | | | Notional
Amounts
in (000’s)(3) | | | Market
Value | | | Upfront
Premiums
Paid | | | Unrealized
(Depreciation) | |
Supervalu Inc., B- | | | (5.000 | )% | | | 12/20/22 | | | 3-Month | | | GSC | | | | 6.807 | % | | $ | 2,840 | | | $ | 153,178 | | | $ | 181,050 | | | $ | (27,872 | ) |
| (1) | If the Fund is a buyer of protection and a credit event occurs, as defined under the terms of that particular swap agreement, the Fund will either: (i) receive from the seller of protection an amount equal to the notional amount of the swap and deliver the referenced obligation or underlying securities comprising the |
See Notes to Financial Statements.
181
Schedules of Investments
(continued)
Destinations Multi Strategy Alternatives Fund
| | referenced index or (ii) receive a net settlement amount in the form of cash or securities equal to the notional amount of the swap less the recovery value of the referenced obligation or underlying securities comprising the referenced index. |
| (2) | Implied credit spreads, represented in absolute terms, utilized in determining the market value of credit default swap agreements on corporate issues or sovereign issues of on emerging country as of period end serve as indicator of the current status of the payment/performance risk and represent the likelihood or risk of default for the credit derivative. The implied credit spread of a particular referenced entity reflects the cost of buying/selling protection and may include upfront payments required to be made to enter into the agreement. Wider credit spreads represent a deterioration of the referenced entity’s credit soundness and a greater likelihood or risk of default or other credit event occurring as defined under the terms of the agreement. A credit spread identified as “Defaulted” indicates a credit event has occurred for the referenced entity or obligation. |
| (3) | The maximum potential amount the Fund could be required to pay as a seller of credit protection or receive as a buyer of credit protection if a credit event occurs as defined under the terms of that particular swap agreement. |
At February 28, 2018, Destinations Multi Strategy Alternatives Fund held the following OTC Total Return Swap Contracts:
OTC Total Return Swaps on Baskets
| | | | | | | | | | | | | | | | | | | | | | | | | | | | | | | | |
Currency | | Notional
Amounts | | | Maturity
Date | | | Counterparty | | | Payment
Frequency | | | Pay | | | Receive | | | Upfront
Premiums
Paid/
(Received) | | | Unrealized
(Depreciation) | |
USD | | $ | 430,583 | | | | 8/25/18 | | | | GSC | | | | 1-Month | | |
| USD-LIBOR-BBA
+ 0.400% |
| |
| GSCBDRC2
Basket* |
| | $ | — | | | $ | (67,333 | ) |
USD | | | 1,336,156 | | | | 8/25/18 | | | | GSC | | | | 1-Month | | |
| USD-LIBOR-BBA
+ 0.400% |
| |
| GSCBDRS2
Basket** |
| | | — | | | | (16,524 | ) |
| | | | | | | | | | | | | | | | | | | | | | | | | | | | | | | | |
| | | | | | | | | | | | | | | | | | | | | | | | | | $ | — | | | $ | (83,857 | ) |
| | | | | | | | | | | | | | | | | | | | | | | | | | | | | | | | |
| * | GSCBDRC2 Basket consists of a portfolio of Chesapeake Energy Corp., California Resources Corp., Oasis Petroleum Inc. and Whiting Petroleum Corp. |
| ** | GSCBDRS2 Basket consists of a portfolio of Anadarko Petroleum Corp., Devon Energy Corp., Diamondback Energy Inc., Helmerich Payne Inc. and Pioneer Natural Resources Co. |
See Notes to Financial Statements.
182
Schedules of Investments
(continued)
Destinations Multi Strategy Alternatives Fund
OTC Total Return Swaps
| | | | | | | | | | | | | | | | | | | | | | | | | | | | |
Currency | | Reference
Obligation | | Notional Amounts | | | Maturity
Date | | | Counterparty | | | Pay | | | Receive | | Upfront
Premiums
Paid | | | Unrealized
Appreciation/
(Depreciation) | |
| EGP | | Arab Republic of Egypt, Treasury Bill | | | EGP 70,500,000 | | | | 6/5/18 | | | | GSC | | | | $3,663,451 | | | Total Return of Reference Obligation | | $ | 3,663,451 | | | $ | 145,386 | |
| EGP | | Arab Republic of Egypt, Treasury Bill | | | EGP 51,187,500 | | | | 8/7/18 | | | | GSC | | | | $2,707,294 | | | Total Return of Reference Obligation | | | 2,707,294 | | | | (20,849 | ) |
| | | | | | | | | | | | | | | | | | | | | | | | | | | | |
| | | | | | | | | | | | | | | | | | | | | | $ | 6,370,745 | | | $ | 124,537 | |
| | | | | | | | | | | | | | | | | | | | | | | | | | | | |
At February 28, 2018, Destinations Multi Strategy Alternatives Fund held the following OTC Variance Swap Contracts:
| | | | | | | | | | | | | | | | | | | | | | | | | | | | | | |
Buy/Sale Contracts | | Reference
Obligation | | Volatility
Strike | | | Maturity
Date | | | Counterparty | | | Notional
Amounts | | | Market
Value | | | Upfront
Premiums
Paid/
(Received) | | | Unrealized
Appreciation/
(Depreciation) | |
| Buy | | S&P 500 Index | | | 22.00 | % | | | 5/18/18 | | | | BAML | | | $ | 15,000,000 | | | $ | (302,581 | ) | | $ | — | | | $ | (302,581 | ) |
| Sale | | S&P 500 Index | | | 22.74 | % | | | 5/18/18 | | | | BAML | | | | 15,504,545 | | | | 346,159 | | | | — | | | | 346,159 | |
| Buy | | S&P 500 Index | | | 24.50 | % | | | 5/18/18 | | | | BAML | | | | 19,500,000 | | | | (973,040 | ) | | | — | | | | (973,040 | ) |
| Sale | | S&P 500 Index | | | 25.29 | % | | | 5/18/18 | | | | BAML | | | | 20,128,775 | | | | 1,077,933 | | | | — | | | | 1,077,933 | |
| | | | | | | | | | | | | | | | | | | | | | | | | | | | | | |
| | | | | | | | | | | | | | | | | | | | $ | 148,471 | | | $ | — | | | $ | 148,471 | |
| | | | | | | | | | | | | | | | | | | | | | | | | | | | | | |
Currency Abbreviations used in this schedule:
| | | | | | |
EGP | | | — | | | Egyptian Pound |
EUR | | | — | | | Euro |
Counterparty Abbreviations used in this schedule:
| | | | | | |
BAML | | | — | | | Bank of America Merrill Lynch |
GSC | | | — | | | Goldman Sachs & Co. |
MSC | | | — | | | Morgan Stanley |
NFSC | | | — | | | National Financial Services Corp. |
See Notes to Financial Statements.
183
Schedules of Investments
(continued)
Destinations Multi Strategy Alternatives Fund
| | | | | | | | |
| Face Amount | | | | Security | | Value | |
SECURITIES SOLD SHORT - 4.8% | |
CORPORATE BONDS & NOTES - 0.5% | |
Consumer Cyclical - 0.1% | | | | |
$ 1,750,000 | | | | PetSmart Inc., Company Guaranteed Notes, 7.125% due 3/15/23(a) | | $ | 1,115,450 | |
| | | | | | | | |
Consumer Non-cyclical - 0.4% | | | | |
1,750,000 | | | | CHS/Community Health Systems Inc., Company Guaranteed Notes, 6.875% due 2/1/22 | | | 1,137,500 | |
2,750,000 | | | | Mallinckrodt International Finance SA / Mallinckrodt CB LLC, Company Guaranteed Notes, 5.500% due 4/15/25(a) | | | 2,200,000 | |
| | | | | | | | |
| | | | Total Consumer Non-cyclical | | | 3,337,500 | |
| | | | | | | | |
Industrial - 0.0% | | | | | | |
250,000 | | | | Amsted Industries Inc., Company Guaranteed Notes, 5.000% due 3/15/22(a) | | | 255,000 | |
| | | | | | | | |
| | | | TOTAL CORPORATE BONDS & NOTES (Proceeds - $5,410,625) | | | 4,707,950 | |
| | | | | | | | |
Shares/Units | | | | | | | |
EXCHANGE TRADED FUNDS (ETFs) - 2.5% | | | | |
23,000 | | | | iShares iBoxx $ High Yield Corporate Bond | | | 1,982,140 | |
54,693 | | | | iShares Nasdaq Biotechnology | | | 5,911,219 | |
16,500 | | | | iShares Russell 2000 | | | 2,480,775 | |
134,629 | | | | SPDR S&P Biotech | | | 12,165,076 | |
| | | | | | | | |
| | | | TOTAL EXCHANGE TRADED FUNDS (ETFs) (Proceeds - $19,856,302) | | | 22,539,211 | |
| | | | | | | | |
COMMON STOCKS - 1.8% | | | | |
COMMUNICATIONS - 0.7% | | | | |
Media - 0.5% | | | | | | | | |
262,800 | | | | Altice USA Inc., Class A Shares* | | | 4,782,960 | |
| | | | | | | | |
Telecommunications - 0.2% | | | | |
64,400 | | | | Ciena Corp.* | | | 1,492,148 | |
| | | | | | | | |
| | | | TOTAL COMMUNICATIONS | | | 6,275,108 | |
| | | | | | | | |
CONSUMER CYCLICAL - 0.1% | | | | |
Retail - 0.1% | | | | | | | | |
26,000 | | | | Tailored Brands Inc. | | | 608,660 | |
| | | | | | | | |
ENERGY - 0.4% | | | | |
Oil & Gas - 0.4% | | | | |
74,542 | | | | EQT Corp. | | | 3,750,208 | |
| | | | | | | | |
FINANCIAL - 0.3% | | | | |
Equity Real Estate Investment Trusts (REIT) - 0.3% | | | | |
211,873 | | | | Quality Care Properties Inc.* | | | 2,625,107 | |
| | | | | | | | |
See Notes to Financial Statements.
184
Schedules of Investments
(continued)
Destinations Multi Strategy Alternatives Fund
| | | | | | | | |
| Shares/Units | | | | Security | | Value | |
TECHNOLOGY - 0.3% | | | | |
Semiconductors - 0.3% | | | | |
32,550 | | | | Microchip Technology Inc. | | $ | 2,894,672 | |
| | | | | | | | |
| | | | TOTAL COMMON STOCKS (Proceeds - $17,581,921) | | | 16,153,755 | |
| | | | | | | | |
| | | | TOTAL SECURITIES SOLD SHORT - 4.8% (Proceeds - $42,848,848) | | $ | 43,400,915 | |
| | | | | | | | |
| * | Non-income producing security. |
| (a) | Restricted security that may be sold to “qualified institutional buyers” pursuant to the conditions of Rule 144A under the Securities Act of 1933, as amended. This security has been deemed liquid pursuant to guidelines approved by the Board of Trustees, unless otherwise noted. The aggregate value of restricted 144A holdings at February 28, 2018, amounts to approximately $3,570,450 and represents 0.39% of net assets. |
See Notes to Financial Statements.
185
Ratings
(unaudited)
The definitions of the applicable rating symbols are set forth below:
Standard & Poor’s Ratings Service (“Standard & Poor’s”) — Ratings from “AA” to “CCC” may be modified by the addition of a plus (+) or minus (-) sign to show relative standings within the major rating categories.
AAA — Bonds rated “AAA” have the highest rating assigned by Standard & Poor’s. Capacity to pay interest and repay principal is extremely strong.
AA — Bonds rated “AA” have a very strong capacity to pay interest and repay principal and differ from the highest rated issues only in a small degree.
A — Bonds rated “A” have a strong capacity to pay interest and repay principal although they are somewhat more susceptible to the adverse effects of changes in circumstances and economic conditions than debt in higher rated categories.
BBB — Bonds rated “BBB” are regarded as having an adequate capacity to pay interest and repay principal. Whereas they normally exhibit adequate protection parameters, adverse economic conditions or changing circumstances are more likely to lead to a weakened capacity to pay interest and repay principal for bonds in this category than in higher rated categories.
BB, B, CCC, CC and C — Bonds rated “BB”, “B”, “CCC”, “CC” and “C” are regarded, on balance, as predominantly speculative with respect to capacity to pay interest and repay principal in accordance with the terms of the obligation. “BB” represents the lowest degree of speculation and “C” the highest degree of speculation. While such bonds will likely have some quality and protective characteristics, these are outweighed by large uncertainties or major risk exposures to adverse conditions.
D — Bonds rated “D” are in default and payment of interest and/or repayment of principal is in arrears.
P — Preliminary rating.
u — The upgrade state defines bonds that have recently been upgraded into higher rating categories.
Moody’s Investors Service (“Moody’s”) — Numerical modifiers 1, 2 and 3 may be applied to each generic rating from “Aa” to “Caa,” where 1 is the highest and 3 the lowest ranking within its generic category.
Aaa — Bonds rated “Aaa” are judged to be of the best quality. They carry the smallest degree of investment risk and are generally referred to as “gilt edge.” Interest payments are protected by a large or by an exceptionally stable margin and principal is secure. While the various protective elements are likely to change, such changes as can be visualized are most unlikely to impair the fundamentally strong position of such issues.
Aa — Bonds rated “Aa” are judged to be of high quality by all standards. Together with the “Aaa” group they comprise what are generally known as high grade bonds. They are rated lower than the best bonds because margins of protection may not be as large as in “Aaa” securities or fluctuation of protective elements may be of greater amplitude or there may be other elements present which make the long-term risks appear somewhat larger than in “Aaa” securities.
A — Bonds rated “A” possess many favorable investment attributes and are to be considered as upper medium grade obligations. Factors giving security to principal and interest are considered adequate but elements may be present which suggest a susceptibility to impairment some time in the future.
186
Ratings
(unaudited) (continued)
Baa — Bonds rated “Baa” are considered as medium grade obligations, i.e., they are neither highly protected nor poorly secured. Interest payments and principal security appear adequate for the present but certain protective elements may be lacking or may be characteristically unreliable over any great length of time. Such bonds lack outstanding investment characteristics and in fact have speculative characteristics as well.
Ba — Bonds rated “Ba” are judged to have speculative elements; their future cannot be considered as well assured. Often the protection of interest and principal payments may be very moderate and therefore not well safeguarded during both good and bad times over the future. Uncertainty of position characterizes bonds in this class.
B — Bonds rated “B” generally lack characteristics of desirable investments. Assurance of interest and principal payments or of maintenance of other terms of the contract over any long period of time may be small.
Caa — Bonds rated “Caa” are of poor standing. These may be in default, or present elements of danger may exist with respect to principal or interest.
Ca — Bonds rated “Ca” represent obligations which are speculative in a high degree. Such issues are often in default or have other marked short-comings.
C — Bonds rated “C” are the lowest class of bonds and issues so rated can be regarded as having extremely poor prospects of ever attaining any real investment standing.
e — Expected.
u — Upgraded.
Fitch Ratings Service (“Fitch”) — Ratings from “AA” to “CCC” may be modified by the addition of a plus (+) or minus (-) sign to show relative standings within the major rating categories.
AAA — Bonds rated “AAA” have the highest rating assigned by Fitch. Capacity to pay interest and repay principal is extremely strong.
AAApre — Stable Outlook rating is based on the pledge of securities in the escrow deposit fund securing the bonds and reflects the lien of the refunded bondholders on the escrow trust funds and that all amounts have been invested in direct non-callable obligations of the United States.
AA — Bonds rated “AA” have a very strong capacity to pay interest and repay principal and differ from the highest rated issues only in a small degree.
A — Bonds rated “A” have a strong capacity to pay interest and repay principal although they are somewhat more susceptible to the adverse effects of changes in circumstances and economic conditions than debt in higher rated categories.
BBB — Bonds rated “BBB” are regarded as having an adequate capacity to pay interest and repay principal. Whereas they normally exhibit adequate protection parameters, adverse economic conditions or changing circumstances are more likely to lead to a weakened capacity to pay interest and repay principal for bonds in this category than in higher rated categories.
BB, B, CCC, CC and C — Bonds rated “BB”, “B”, “CCC”, “CC” and “C” are regarded, on balance, as predominantly speculative with respect to capacity to pay interest and repay principal in accordance with the
187
Ratings
(unaudited) (continued)
terms of the obligation. “BB” represents a lower degree of speculation than “B”, and “CC” the highest degree of speculation. While such bonds will likely have some quality and protective characteristics, these are outweighed by large uncertainties or major risk exposures to adverse conditions.
D — Bonds rated “D” are in default and payment of interest and/or repayment of principal is in arrears.
NR — Indicates that the bond is not rated by Standard & Poor’s, Moody’s, or Fitch.
WD, WR — Indicates that the bonds rating has been withdrawn and the issuer is no longer rated by Standard & Poor’s, Moody’s or Fitch.
Short-Term Security Ratings
SP-1 — Standard & Poor’s highest rating indicating very strong or strong capacity to pay principal and interest; those issues determined to possess overwhelming safety characteristics are denoted with a plus (+) sign.
A-1 — Standard & Poor’s highest commercial paper and variable-rate demand obligation (VRDO) rating indicating that the degree of safety regarding timely payment is either overwhelming or very strong; those issues determined to possess overwhelming safety characteristics are denoted with a plus (+) sign.
VMIG 1 — Moody’s highest rating for issues having a demand feature — VRDO.
MIG1 — Moody’s highest rating for short-term municipal obligations.
P-1 — Moody’s highest rating for commercial paper and for VRDO prior to the advent of the VMIG 1 rating.
F-1 — Fitch’s highest rating indicating the strongest capacity for timely payment of financial commitments; those issues determined to possess overwhelming strong credit feature are denoted with a plus (+) sign.
F-2 — Fitch’s rating indicating a good capacity for timely payment of financial commitments.
188
Statements of Assets and Liabilities
February 28, 2018
| | | | | | | | | | | | | | | | | | | | |
| | | Destinations
Large Cap
Equity
Fund | | | Destinations
Small-Mid
Cap Equity
Fund | | | Destinations
International
Equity
Fund | | | Destinations
Equity
Income
Fund | | | Destinations
Real Assets
Fund | |
ASSETS: | | | | | | | | | | | | | | | | | | | | |
Investments, at value1,2 | | $ | 2,823,249,855 | | | $ | 718,766,011 | | | $ | 1,432,376,541 | | | $ | 320,157,548 | | | $ | 242,200,715 | |
Foreign currency, at value3 | | | 4 | | | | — | | | | 807,242 | | | | — | | | | 4 | |
Cash | | | 39,694 | | | | 11,415 | | | | 22,336 | | | | 3,680 | | | | 6,324 | |
Unrealized appreciation on unfunded loan commitments | | | — | | | | — | | | | — | | | | — | | | | — | |
Receivable for securities sold | | | 1,195,445 | | | | 10,356,112 | | | | 3,538,813 | | | | 1,835 | | | | — | |
Dividends and interest receivable | | | 4,081,400 | | | | 471,148 | | | | 1,176,393 | | | | 1,081,273 | | | | 53,859 | |
Receivable for Fund shares sold | | | 1,392,096 | | | | 339,597 | | | | 623,535 | | | | 60,957 | | | | 96,456 | |
Receivable for expense reimbursement | | | — | | | | — | | | | — | | | | — | | | | — | |
Unrealized appreciation on open forward foreign currency contracts (Note 4) | | | — | | | | — | | | | 23,364 | | | | — | | | | — | |
Unrealized appreciation on swap contracts4 (Note 4) | | | — | | | | — | | | | — | | | | — | | | | — | |
Upfront premiums paid on swap contracts (Note 4) | | | — | | | | — | | | | — | | | | — | | | | — | |
Deposits with counterparty5 | | | 446,600 | | | | — | | | | — | | | | — | | | | — | |
Cash held at Broker | | | — | | | | — | | | | — | | | | — | | | | — | |
Prepaid expenses | | | 18,604 | | | | 4,502 | | | | 7,782 | | | | 2,230 | | | | 1,292 | |
Prepaid offering fees | | | 26,920 | | | | 6,416 | | | | 11,506 | | | | 3,200 | | | | 1,939 | |
| | | | | | | | | | | | | | | | | | | | |
Total Assets | | | 2,830,450,618 | | | | 729,955,201 | | | | 1,438,587,512 | | | | 321,310,723 | | | | 242,360,589 | |
| | | | | | | | | | | | | | | | | | | | |
LIABILITIES: | | | | | | | | | | | | | | | | | | | | |
Payable for collateral received from securities on loan | | | 16,521,899 | | | | 17,329,790 | | | | 19,777,529 | | | | 628,002 | | | | 19,121,905 | |
Payable for Fund shares repurchased | | | 870,015 | | | | 205,459 | | | | 447,342 | | | | 191,745 | | | | 74,681 | |
Payable for securities purchased | | | 6,999,626 | | | | 10,924,994 | | | | 3,689,447 | | | | 213,853 | | | | 352,155 | |
Investment management fee payable | | | 1,278,266 | | | | 415,046 | | | | 929,770 | | | | 158,270 | | | | 157,325 | |
Transfer agent fees payable | | | 333,281 | | | | 83,415 | | | | 169,594 | | | | 39,223 | | | | 26,461 | |
Custody fee payable | | | 250,536 | | | | 64,013 | | | | 296,439 | | | | 36,843 | | | | 34,115 | |
Trustees’ fees payable | | | 28,641 | | | | 6,283 | | | | 13,833 | | | | 3,802 | | | | 1,974 | |
Registration fees payable | | | 154,094 | | | | 46,522 | | | | 83,769 | | | | 34,259 | | | | 27,150 | |
Shareholder services | | | 26,568 | | | | 2,819 | | | | 11,117 | | | | 1,898 | | | | 747 | |
Variation margin on open future contracts (Note 4) | | | 125,677 | | | | — | | | | — | | | | — | | | | — | |
Unrealized depreciation on swap contracts6 (Note 4) | | | — | | | | — | | | | — | | | | — | | | | — | |
Securities sold short7 (Note 5) | | | — | | | | — | | | | — | | | | — | | | | — | |
Due to custodian3 | | | — | | | | — | | | | — | | | | 69 | | | | — | |
Options contracts written, at value8 (Note 4) | | | — | | | | — | | | | — | | | | — | | | | — | |
Unrealized depreciation on open forward foreign currency contracts (Note 4) | | | — | | | | — | | | | 88,319 | | | | — | | | | — | |
Foreign capital gains tax payable | | | — | | | | — | | | | 458,664 | | | | — | | | | — | |
Investment interest payable on securities sold short | | | — | | | | — | | | | — | | | | — | | | | — | |
Dividends payable for securities sold short | | | — | | | | — | | | | — | | | | — | | | | — | |
Accrued Chief Compliance Officer expense | | | 8,970 | | | | 2,126 | | | | 4,156 | | | | 1,160 | | | | 737 | |
Accrued expenses | | | 122,886 | | | | 29,729 | | | | 52,358 | | | | 19,032 | | | | 12,677 | |
| | | | | | | | | | | | | | | | | | | | |
Total Liabilities | | | 26,720,459 | | | | 29,110,196 | | | | 26,022,337 | | | | 1,328,156 | | | | 19,809,927 | |
| | | | | | | | | | | | | | | | | | | | |
Total Net Assets | | $ | 2,803,730,159 | | | $ | 700,845,005 | | | $ | 1,412,565,175 | | | $ | 319,982,567 | | | $ | 222,550,662 | |
| | | | | | | | | | | | | | | | | | | | |
NET ASSETS: | | | | | | | | | | | | | | | | | | | | |
Par value | | $ | 239,400 | | | $ | 63,808 | | | $ | 120,791 | | | $ | 31,561 | | | $ | 24,893 | |
Paid-in capital in excess of par value | | | 2,401,668,474 | | | | 654,415,900 | | | | 1,233,034,313 | | | | 312,412,615 | | | | 248,889,259 | |
Undistributed net investment income | | | 3,884,995 | | | | — | | | | 64,955 | | | | 1,089,086 | | | | — | |
Accumulated net realized gain (loss) on investments, futures contracts, options contracts written, forward sale commitments, securities sold short, swap contracts, forward foreign currency contracts and foreign currency transactions | | | 24,547,034 | | | | 2,545,942 | | | | 1,897,776 | | | | 2,871,869 | | | | (2,260,069 | ) |
Net unrealized appreciation (depreciation) on investments, futures contracts, options contracts written, forward sale commitments, securities sold short, swap contracts, forward foreign currency contracts and foreign currency transactions | | | 373,390,256 | | | | 43,819,355 | | | | 177,447,340 | | | | 3,577,436 | | | | (24,103,421 | ) |
| | | | | | | | | | | | | | | | | | | | |
Total Net Assets | | $ | 2,803,730,159 | | | $ | 700,845,005 | | | $ | 1,412,565,175 | | | $ | 319,982,567 | | | $ | 222,550,662 | |
| | | | | | | | | | | | | | | | | | | | |
Shares Outstanding | | | 239,400,198 | | | | 63,807,699 | | | | 120,790,662 | | | | 31,561,479 | | | | 24,893,265 | |
| | | | | | | | | | | | | | | | | | | | |
Net Asset Value | | $ | 11.71 | | | $ | 10.98 | | | $ | 11.69 | | | $ | 10.14 | | | $ | 8.94 | |
| | | | | | | | | | | | | | | | | | | | |
1 Investments, at cost | | $ | 2,449,996,892 | | | $ | 674,946,656 | | | $ | 1,254,432,061 | | | $ | 316,581,653 | | | $ | 266,303,836 | |
| | | | | | | | | | | | | | | | | | | | |
2 Includes securities on loan | | $ | 15,893,318 | | | $ | 16,607,389 | | | $ | 17,646,836 | | | $ | 611,698 | | | $ | 17,289,786 | |
| | | | | | | | | | | | | | | | | | | | |
3 Foreign currency, at cost | | $ | 390 | | | $ | — | | | $ | 810,945 | | | $ | (69 | ) | | $ | 4 | |
| | | | | | | | | | | | | | | | | | | | |
4 Swap contracts - assets, at cost | | $ | — | | | $ | — | | | $ | — | | | $ | — | | | $ | — | |
| | | | | | | | | | | | | | | | | | | | |
5 Related to futures contracts | | $ | 446,600 | | | $ | — | | | $ | — | | | $ | — | | | $ | — | |
| | | | | | | | | | | | | | | | | | | | |
6 Swaps contracts - liabilities, at cost | | $ | — | | | $ | — | | | $ | — | | | $ | — | | | $ | — | |
| | | | | | | | | | | | | | | | | | | | |
7 Proceeds received | | $ | — | | | $ | — | | | $ | — | | | $ | — | | | $ | — | |
| | | | | | | | | | | | | | | | | | | | |
8 Premiums received | | $ | — | | | $ | — | | | $ | — | | | $ | — | | | $ | — | |
| | | | | | | | | | | | | | | | | | | | |
189
Statements of Assets and Liabilities
February 28, 2018 (continued)
| | | | | | | | | | | | | | | | | | | | |
| | | Destinations
Core Fixed
Income
Fund | | | Destinations
Low Duration
Fixed Income
Fund | | | Destinations
Global Fixed
Income
Opportunities
Fund | | | Destinations
Municipal Fixed
Income
Fund | | | Destinations
Multi Strategy
Alternatives
Fund | |
ASSETS: | | | | | | | | | | | | | | | | | | | | |
Investments, at value1,2 | | $ | 1,604,855,765 | | | $ | 184,649,310 | | | $ | 617,183,392 | | | $ | 227,557,775 | | | $ | 889,193,142 | |
Foreign currency, at value3 | | | — | | | | — | | | | — | | | | — | | | | 268 | |
Cash | | | 102,662 | | | | 5,889 | | | | 30,223 | | | | 13,605 | | | | 37,821 | |
Unrealized appreciation on unfunded loan commitments | | | 427 | | | | 139 | | | | 5,581 | | | | — | | | | — | |
Receivable for securities sold | | | 4,278,592 | | | | 39,580 | | | | 735,128 | | | | — | | | | 11,408,514 | |
Dividends and interest receivable | | | 6,765,726 | | | | 1,671,770 | | | | 7,316,159 | | | | 2,325,746 | | | | 5,375,634 | |
Receivable for Fund shares sold | | | 504,126 | | | | 59,168 | | | | 197,001 | | | | 293,392 | | | | 337,029 | |
Receivable for expense reimbursement | | | — | | | | — | | | | — | | | | 12,134 | | | | — | |
Unrealized appreciation on open forward foreign currency contracts (Note 4) | | | — | | | | — | | | | — | | | | — | | | | 148,800 | |
Unrealized appreciation on swap contracts4 (Note 4) | | | — | | | | — | | | | — | | | | — | | | | 1,569,478 | |
Upfront premiums paid on swap contracts (Note 4) | | | — | | | | — | | | | — | | | | — | | | | 6,551,795 | |
Deposits with counterparty5 | | | — | | | | — | | | | — | | | | — | | | | 566,600 | |
Cash held at Broker | | | — | | | | — | | | | — | | | | — | | | | 71,952,063 | |
Prepaid expenses | | | 10,409 | | | | 1,071 | | | | 3,425 | | | | 3 | | | | 6,921 | |
Prepaid offering fees | | | 15,076 | | | | 1,590 | | | | 4,952 | | | | 153 | | | | 10,381 | |
| | | | | | | | | | | | | | | | | | | | |
Total Assets | | | 1,616,532,783 | | | | 186,428,517 | | | | 625,475,861 | | | | 230,202,808 | | | | 987,158,446 | |
| | | | | | | | | | | | | | | | | | | | |
LIABILITIES: | | | | | | | | | | | | | | | | | | | | |
Payable for collateral received from securities on loan | | | 569,695 | | | | 2,300,425 | | | | 4,838,084 | | | | — | | | | 17,012,174 | |
Payable for Fund shares repurchased | | | 537,666 | | | | 121,987 | | | | 286,752 | | | | 267,961 | | | | 376,016 | |
Payable for securities purchased | | | 114,493,090 | | | | 2,586,402 | | | | 17,354,790 | | | | — | | | | 11,790,007 | |
Investment management fee payable | | | 621,830 | | | | 85,336 | | | | 328,852 | | | | 97,367 | | | | 587,604 | |
Transfer agent fees payable | | | 180,262 | | | | 21,495 | | | | 71,587 | | | | 27,162 | | | | 110,258 | |
Custody fee payable | | | 204,655 | | | | 31,820 | | | | 67,372 | | | | 21,940 | | | | 137,341 | |
Trustees’ fees payable | | | 14,527 | | | | 1,858 | | | | 5,356 | | | | 2,133 | | | | 10,288 | |
Registration fees payable | | | 93,400 | | | | 26,680 | | | | 44,630 | | | | 27,928 | | | | 68,283 | |
Shareholder services | | | 11,871 | | | | 812 | | | | 3,071 | | | | 2,062 | | | | 6,742 | |
Variation margin on open future contracts (Note 4) | | | — | | | | — | | | | — | | | | — | | | | 136,345 | |
Unrealized depreciation on swap contracts6 (Note 4) | | | — | | | | — | | | | — | | | | — | | | | 1,408,199 | |
Securities sold short7 (Note 5) | | | — | | | | — | | | | — | | | | — | | | | 43,400,915 | |
Due to custodian3 | | | — | | | | 2,764,344 | | | | 1,086,104 | | | | — | | | | — | |
Options contracts written, at value8 (Note 4) | | | — | | | | — | | | | — | | | | — | | | | 2,550,110 | |
Unrealized depreciation on open forward foreign currency contracts (Note 4) | | | — | | | | — | | | | — | | | | — | | | | — | |
Foreign capital gains tax payable | | | — | | | | — | | | | — | | | | — | | | | — | |
Investment interest payable on securities sold short | | | — | | | | — | | | | — | | | | — | | | | 130,424 | |
Dividends payable for securities sold short | | | — | | | | — | | | | — | | | | — | | | | 14,052 | |
Accrued Chief Compliance Officer expense | | | 5,753 | | | | 678 | | | | 1,977 | | | | 229 | | | | 3,843 | |
Accrued expenses | | | 55,024 | | | | 17,767 | | | | 21,979 | | | | 18,931 | | | | 38,697 | |
| | | | | | | | | | | | | | | | | | | | |
Total Liabilities | | | 116,787,773 | | | | 7,959,604 | | | | 24,110,554 | | | | 465,713 | | | | 77,781,298 | |
| | | | | | | | | | | | | | | | | | | | |
Total Net Assets | | $ | 1,499,745,010 | | | $ | 178,468,913 | | | $ | 601,365,307 | | | $ | 229,737,095 | | | $ | 909,377,148 | |
| | | | | | | | | | | | | | | | | | | | |
NET ASSETS: | | | | | | | | | | | | | | | | | | | | |
Par value | | $ | 152,535 | | | $ | 18,032 | | | $ | 60,199 | | | $ | 23,133 | | | $ | 89,173 | |
Paid-in capital in excess of par value | | | 1,526,773,137 | | | | 180,196,962 | | | | 608,413,676 | | | | 232,908,221 | | | | 890,443,181 | |
Undistributed net investment income | | | 1,425,425 | | | | (1,298 | ) | | | — | | | | 50,769 | | | | 1,189,564 | |
Accumulated net realized gain (loss) on investments, futures contracts, options contracts written, forward sale commitments, securities sold short, swap contracts, forward foreign currency contracts and foreign currency transactions | | | (2,856,566 | ) | | | (277,613 | ) | | | (1,004,745 | ) | | | (69,224 | ) | | | 5,900,821 | |
Net unrealized appreciation (depreciation) on investments, futures contracts, options contracts written, forward sale commitments, securities sold short, swap contracts, forward foreign currency contracts and foreign currency transactions | | | (25,749,521 | ) | | | (1,467,170 | ) | | | (6,103,823 | ) | | | (3,175,804 | ) | | | 11,754,409 | |
| | | | | | | | | | | | | | | | | | | | |
Total Net Assets | | $ | 1,499,745,010 | | | $ | 178,468,913 | | | $ | 601,365,307 | | | $ | 229,737,095 | | | $ | 909,377,148 | |
| | | | | | | | | | | | | | | | | | | | |
Shares Outstanding | | | 152,534,608 | | | | 18,032,049 | | | | 60,199,462 | | | | 23,133,003 | | | | 89,172,747 | |
| | | | | | | | | | | | | | | | | | | | |
Net Asset Value | | $ | 9.83 | | | $ | 9.90 | | | $ | 9.99 | | | $ | 9.93 | | | $ | 10.20 | |
| | | | | | | | | | | | | | | | | | | | |
1 Investments, at cost | | $ | 1,630,605,713 | | | $ | 186,201,347 | | | $ | 623,345,179 | | | $ | 230,733,579 | | | $ | 875,769,823 | |
| | | | | | | | | | | | | | | | | | | | |
2 Includes securities on loan | | $ | 553,235 | | | $ | 2,245,548 | | | $ | 4,628,391 | | | $ | — | | | $ | 16,464,252 | |
| | | | | | | | | | | | | | | | | | | | |
3 Foreign currency, at cost | | $ | — | | | $ | (2,849,540 | ) | | $ | (1,138,868 | ) | | $ | — | | | $ | 283 | |
| | | | | | | | | | | | | | | | | | | | |
4 Swap contracts - assets, at cost | | $ | — | | | $ | — | | | $ | — | | | $ | — | | | $ | 6,551,795 | |
| | | | | | | | | | | | | | | | | | | | |
5 Related to futures contracts | | $ | — | | | $ | — | | | $ | — | | | $ | — | | | $ | 566,600 | |
| | | | | | | | | | | | | | | | | | | | |
6 Swaps contracts - liabilities, at cost | | $ | — | | | $ | — | | | $ | — | | | $ | — | | | $ | — | |
| | | | | | | | | | | | | | | | | | | | |
7 Proceeds received | | $ | — | | | $ | — | | | $ | — | | | $ | — | | | $ | 42,848,848 | |
| | | | | | | | | | | | | | | | | | | | |
8 Premiums received | | $ | — | | | $ | — | | | $ | — | | | $ | — | | | $ | 1,004,275 | |
| | | | | | | | | | | | | | | | | | | | |
190
Statements of Operations
For the period from March 20, 2017 (commencement of operations) through February 28, 2018
| | | | | | | | | | | | | | | | | | | | |
| | | Destinations
Large Cap
Equity
Fund | | | Destinations
Small-Mid
Cap Equity
Fund | | | Destinations
International
Equity
Fund | | | Destinations
Equity
Income
Fund | | | Destinations
Real Assets
Fund | |
INVESTMENT INCOME: | | | | | | | | | | | | | |
Dividends | | $ | 42,489,368 | | | $ | 7,559,452 | | | $ | 20,894,918 | | | $ | 12,411,234 | | | $ | 2,153,762 | |
Interest | | | 522,059 | | | | 138,573 | | | | 315,214 | | | | 79,090 | | | | 59,285 | |
Income from securities lending | | | 79,118 | | | | 115,267 | | | | 429,477 | | | | 21,575 | | | | 12,919 | |
Less: Foreign taxes withheld (Note 3) | | | (135,887 | ) | | | (7,774 | ) | | | (1,136,098 | ) | | | (199,839 | ) | | | (110,252 | ) |
Miscellaneous income | | | — | | | | — | | | | — | | | | — | | | | — | |
| | | | | | | | | | | | | | | | | | | | |
Total Investment Income | | | 42,954,658 | | | | 7,805,518 | | | | 20,503,511 | | | | 12,312,060 | | | | 2,115,714 | |
| | | | | | | | | | | | | | | | | | | | |
EXPENSES: | | | | | | | | | | | | | |
Investment management fee (Note 7) | | | 17,684,732 | | | | 4,887,963 | | | | 11,143,055 | | | | 2,395,104 | | | | 1,735,870 | |
Transfer agent fees | | | 3,595,702 | | | | 827,678 | | | | 1,701,768 | | | | 456,327 | | | | 264,727 | |
Custody fees | | | 785,147 | | | | 208,532 | | | | 1,022,793 | | | | 133,380 | | | | 112,009 | |
Trustees’ fees | | | 206,155 | | | | 47,157 | | | | 94,569 | | | | 26,291 | | | | 14,364 | |
Insurance | | | 70,260 | | | | 16,976 | | | | 28,359 | | | | 8,401 | | | | 5,297 | |
Audit and tax | | | 44,811 | | | | 14,052 | | | | 25,913 | | | | 10,119 | | | | 7,882 | |
Legal expense | | | 193,191 | | | | 43,624 | | | | 98,837 | | | | 27,890 | | | | 14,064 | |
Chief Compliance Officer expense | | | 67,657 | | | | 15,483 | | | | 31,541 | | | | 8,750 | | | | 4,945 | |
Organizational expense | | | 1,090 | | | | 267 | | | | 442 | | | | 130 | | | | 79 | |
Offering fees | | | 98,619 | | | | 23,464 | | | | 42,220 | | | | 11,686 | | | | 7,132 | |
Shareholder services | | | 62,591 | | | | 19,393 | | | | 32,817 | | | | 13,931 | | | | 13,332 | |
Registration fees | | | 182,712 | | | | 66,609 | | | | 106,282 | | | | 53,495 | | | | 44,148 | |
Miscellaneous expense | | | 42,496 | | | | 9,840 | | | | 66,855 | | | | 5,414 | | | | 3,066 | |
Interest expense | | | — | | | | — | | | | — | | | | — | | | | — | |
| | | | | | | | | | | | | | | | | | | | |
Total Expenses | | | 23,035,163 | | | | 6,181,038 | | | | 14,395,451 | | | | 3,150,918 | | | | 2,226,915 | |
Less: Fee waivers and/or expense reimbursement (Note 7) | | | (3,027,146 | ) | | | (612,545 | ) | | | (1,616,335 | ) | | | (366,661 | ) | | | (157,315 | ) |
| | | | | | | | | | | | | | | | | | | | |
Net Expenses | | | 20,008,017 | | | | 5,568,493 | | | | 12,779,116 | | | | 2,784,257 | | | | 2,069,600 | |
| | | | | | | | | | | | | | | | | | | | |
Net Investment Income (Loss) | | $ | 22,946,641 | | | $ | 2,237,025 | | | $ | 7,724,395 | | | $ | 9,527,803 | | | $ | 46,114 | |
| | | | | | | | | | | | | | | | | | | | |
REALIZED AND UNREALIZED GAIN (LOSS) ON INVESTMENTS, FUTURES CONTRACTS, OPTIONS CONTRACTS WRITTEN, FORWARD SALE COMMITMENTS, SECURITIES SHORT SOLD, SWAP CONTRACTS, FORWARD FOREIGN CURRENCY CONTRACTS AND FOREIGN CURRENCY TRANSACTIONS (NOTES 3 AND 4): | | | | | | | | | | | | | | | | | | | | |
Net Realized Gain (Loss) From: | | | | | | | | | | | | | | | | | | | | |
Investments | | $ | 19,992,322 | | | $ | 5,990,710 | | | $ | 4,159,459 | * | | $ | 4,032,040 | | | $ | 3,186,356 | |
Futures contracts | | | 4,214,522 | | | | — | | | | — | | | | — | | | | — | |
Forward sale commitments | | | — | | | | — | | | | — | | | | — | | | | — | |
Securities sold short | | | — | | | | — | | | | — | | | | — | | | | — | |
Swap contracts | | | — | | | | — | | | | — | | | | — | | | | — | |
Forward foreign currency contracts | | | — | | | | — | | | | (137,403 | ) | | | — | | | | (33,943 | ) |
Foreign currency transactions | | | (21 | ) | | | — | | | | (564,455 | ) | | | 61,542 | | | | 85,751 | |
| | | | | | | | | | | | | | | | | | | | |
Realized Gain (Loss) | | | 24,206,823 | | | | 5,990,710 | | | | 3,457,601 | | | | 4,093,582 | | | | 3,238,164 | |
| | | | | | | | | | | | | | | | | | | | |
Change in Net Unrealized Appreciation (Depreciation) From: | | | | | | | | | | | | | | | | | | | | |
Investments | | | 373,252,963 | | | | 43,819,355 | | | | 177,485,816 | ** | | | 3,575,895 | | | | (24,103,121 | ) |
Futures contracts | | | 137,679 | | | | — | | | | — | | | | — | | | | — | |
Unfunded loan commitments | | | — | | | | — | | | | — | | | | — | | | | — | |
Options contracts written | | | — | | | | — | | | | — | | | | — | | | | — | |
Securities sold short | | | — | | | | — | | | | — | | | | — | | | | — | |
Swap contracts | | | — | | | | — | | | | — | | | | — | | | | — | |
Forward foreign currency contracts | | | — | | | | — | | | | (64,955 | ) | | | — | | | | — | |
Foreign currency transactions | | | (386 | ) | | | — | | | | 26,479 | | | | 1,541 | | | | (300 | ) |
| | | | | | | | | | | | | | | | | | | | |
Change in Net Unrealized Appreciation (Depreciation): | | | 373,390,256 | | | | 43,819,355 | | | | 177,447,340 | | | | 3,577,436 | | | | (24,103,421 | ) |
| | | | | | | | | | | | | | | | | | | | |
Net Gain (Loss) on Investments, Futures Contracts, Options Contracts Written, Forward Sale Commitments, Securities Short Sold, Swap Contracts, Forward Foreign Currency Contracts and Foreign Currency Transactions | | | 397,597,079 | | | | 49,810,065 | | | | 180,904,941 | | | | 7,671,018 | | | | (20,865,257 | ) |
| | | | | | | | | | | | | | | | | | | | |
Total Increase (Decrease) in Net Assets from Operations | | $ | 420,543,720 | | | $ | 52,047,090 | | | $ | 188,629,336 | | | $ | 17,198,821 | | | $ | (20,819,143 | ) |
| | | | | | | | | | | | | | | | | | | | |
| * | Includes foreign capital gains tax of $6,824 for Destinations International Equity Fund. |
| ** | Includes accrued foreign capital gains tax of $458,664 for Destinations International Equity Fund. |
191
Statements of Operations
For the period from March 20, 2017 (commencement of operations) through February 28, 2018 (continued)
| | | | | | | | | | | | | | | | | | | | |
| | | Destinations
Core Fixed
Income
Fund | | | Destinations
Low Duration
Fixed Income
Fund | | | Destinations
Global Fixed
Income
Opportunities
Fund | | | Destinations
Municipal Fixed
Income
Fund | | | Destinations
Multi
Strategy
Alternatives
Fund | |
INVESTMENT INCOME: | | | | | | | | | | | | | |
Dividends | | $ | 6,585 | | | $ | 473,570 | | | $ | 558,092 | | | $ | 131 | | | $ | 14,499,261 | |
Interest | | | 38,846,754 | | | | 5,127,199 | | | | 21,951,438 | | | | 2,105,776 | | | | 20,447,162 | |
Income from securities lending | | | 4,227 | | | | 54,853 | | | | 31,595 | | | | — | | | | 118,093 | |
Less: Foreign taxes withheld (Note 3) | | | — | | | | — | | | | — | | | | — | | | | (354 | ) |
Miscellaneous income | | | — | | | | — | | | | — | | | | — | | | | 71,468 | |
| | | | | | | | | | | | | | | | | | | | |
Total Investment Income | | | 38,857,566 | | | | 5,655,622 | | | | 22,541,125 | | | | 2,105,907 | | | | 35,135,630 | |
| | | | | | | | | | | | | | | | | | | | |
EXPENSES: | | | | | | | | | | | | | |
Investment management fee (Note 7) | | | 8,332,542 | | | | 1,046,877 | | | | 3,939,002 | | | | 928,423 | | | | 11,662,097 | |
Transfer agent fees | | | 1,953,629 | | | | 227,626 | | | | 706,523 | | | | 204,199 | | | | 1,316,286 | |
Custody fees | | | 647,439 | | | | 111,024 | | | | 216,304 | | | | 57,688 | | | | 436,705 | |
Trustees’ fees | | | 110,545 | | | | 12,647 | | | | 38,857 | | | | 9,578 | | | | 75,744 | |
Insurance | | | 40,691 | | | | 4,169 | | | | 13,146 | | | | 50 | | | | 26,576 | |
Audit and tax | | | 32,191 | | | | 12,607 | | | | 17,888 | | | | 11,241 | | | | 25,202 | |
Legal expense | | | 126,047 | | | | 12,943 | | | | 38,793 | | | | 11,711 | | | | 191,786 | |
Chief Compliance Officer expense | | | 38,037 | | | | 4,465 | | | | 13,488 | | | | 3,346 | | | | 25,985 | |
Organizational expense | | | 633 | | | | 65 | | | | 205 | | | | 2 | | | | 416 | |
Offering fees | | | 55,384 | | | | 5,844 | | | | 18,118 | | | | 518 | | | | 38,558 | |
Shareholder services | | | 36,676 | | | | 12,284 | | | | 18,272 | | | | 4,259 | | | | 26,992 | |
Registration fees | | | 117,246 | | | | 43,579 | | | | 64,346 | | | | 44,473 | | | | 89,661 | |
Miscellaneous expense | | | 24,045 | | | | 2,812 | | | | 8,317 | | | | 2,283 | | | | 237,715 | |
Interest expense | | | — | | | | — | | | | — | | | | — | | | | 776,825 | |
| | | | | | | | | | | | | | | | | | | | |
Total Expenses | | | 11,515,105 | | | | 1,496,942 | | | | 5,093,259 | | | | 1,277,771 | | | | 14,930,548 | |
Less: Fee waivers and/or expense reimbursement (Note 7) | | | (1,083,624 | ) | | | (89,240 | ) | | | (525,324 | ) | | | (216,403 | ) | | | (4,158,391 | ) |
| | | | | | | | | | | | | | | | | | | | |
Net Expenses | | | 10,431,481 | | | | 1,407,702 | | | | 4,567,935 | | | | 1,061,368 | | | | 10,772,157 | |
| | | | | | | | | | | | | | | | | | | | |
Net Investment Income (Loss) | | $ | 28,426,085 | | | $ | 4,247,920 | | | $ | 17,973,190 | | | $ | 1,044,539 | | | $ | 24,363,473 | |
| | | | | | | | | | | | | | | | | | | | |
REALIZED AND UNREALIZED GAIN (LOSS) ON INVESTMENTS, FUTURES CONTRACTS, OPTIONS CONTRACTS WRITTEN, FORWARD SALE COMMITMENTS, SECURITIES SHORT SOLD, SWAP CONTRACTS, FORWARD FOREIGN CURRENCY CONTRACTS AND FOREIGN CURRENCY TRANSACTIONS (NOTES 3 AND 4): | | | | | | | | | | | | | | | | | | | | |
Net Realized Gain (Loss) From: | | | | | | | | | | | | | | | | | | | | |
Investments | | $ | (597,178 | ) | | $ | (195,878 | ) | | $ | (887,436 | ) | | $ | 116,426 | | | $ | 3,499,806 | |
Futures contracts | | | — | | | | — | | | | — | | | | — | | | | 2,643,603 | |
Forward sale commitments | | | 2,777 | | | | — | | | | — | | | | — | | | | — | |
Securities sold short | | | — | | | | — | | | | — | | | | — | | | | (3,494,652 | ) |
Swap contracts | | | — | | | | — | | | | — | | | | — | | | | 639,645 | |
Forward foreign currency contracts | | | — | | | | — | | | | — | | | | — | | | | (610,261 | ) |
Foreign currency transactions | | | — | | | | (88,382 | ) | | | (50,775 | ) | | | — | | | | (416,243 | ) |
| | | | | | | | | | | | | | | | | | | | |
Realized Gain (Loss) | | | (594,401 | ) | | | (284,260 | ) | | | (938,211 | ) | | | 116,426 | | | | 2,261,898 | |
| | | | | | | | | | | | | | | | | | | | |
Change in Net Unrealized Appreciation (Depreciation) From: | | | | | | | | | | | | | | | | | | | | |
Investments | | | (25,749,948 | ) | | | (1,552,037 | ) | | | (6,161,787 | ) | | | (3,175,804 | ) | | | 13,423,319 | |
Futures contracts | | | — | | | | — | | | | — | | | | — | | | | 117,304 | |
Unfunded loan commitments | | | 427 | | | | 139 | | | | 5,581 | | | | — | | | | — | |
Options contracts written | | | — | | | | — | | | | — | | | | — | | | | (1,545,835 | ) |
Securities sold short | | | — | | | | — | | | | — | | | | — | | | | (552,067 | ) |
Swap contracts | | | — | | | | — | | | | — | | | | — | | | | 161,279 | |
Forward foreign currency contracts | | | — | | | | — | | | | — | | | | — | | | | 148,800 | |
Foreign currency transactions | | | — | | | | 84,728 | | | | 52,383 | | | | — | | | | 1,609 | |
| | | | | | | | | | | | | | | | | | | | |
Change in Net Unrealized Appreciation (Depreciation): | | | (25,749,521 | ) | | | (1,467,170 | ) | | | (6,103,823 | ) | | | (3,175,804 | ) | | | 11,754,409 | |
| | | | | | | | | | | | | | | | | | | | |
Net Gain (Loss) on Investments, Futures Contracts, Options Contracts Written, Forward Sale Commitments, Securities Short Sold, Swap Contracts, Forward Foreign Currency Contracts and Foreign Currency Transactions | | | (26,343,922 | ) | | | (1,751,430 | ) | | | (7,042,034 | ) | | | (3,059,378 | ) | | | 14,016,307 | |
| | | | | | | | | | | | | | | | | | | | |
Total Increase (Decrease) in Net Assets from Operations | | $ | 2,082,163 | | | $ | 2,496,490 | | | $ | 10,931,156 | | | $ | (2,014,839 | ) | | $ | 38,379,780 | |
| | | | | | | | | | | | | | | | | | | | |
192
Statements of Changes in Net Assets
For the period from March 20, 2017 (commencement of operations) through February 28, 2018
| | | | | | | | | | | | | | | | | | | | |
| | | Destinations
Large Cap Equity
Fund | | | Destinations
Small-Mid Cap
Equity Fund | | | Destinations
International
Equity Fund | | | Destinations
Equity Income
Fund | | | Destinations
Real Assets
Fund | |
OPERATIONS: | | | | | | | | | | | | | | | | | | | | |
Net investment income (loss) | | $ | 22,946,641 | | | $ | 2,237,025 | | | $ | 7,724,395 | | | $ | 9,527,803 | | | $ | 46,114 | |
Net realized gain (loss) | | | 24,206,823 | | | | 5,990,710 | | | | 3,457,601 | | | | 4,093,582 | | | | 3,238,164 | |
Change in unrealized appreciation (depreciation) | | | 373,390,256 | | | | 43,819,355 | | | | 177,447,340 | | | | 3,577,436 | | | | (24,103,421 | ) |
| | | | | | | | | | | | | | | | | | | | |
Increase (Decrease) in Net Assets From Operations | | | 420,543,720 | | | | 52,047,090 | | | | 188,629,336 | | | | 17,198,821 | | | | (20,819,143 | ) |
| | | | | | | | | | | | | | | | | | | | |
DISTRIBUTIONS TO SHAREHOLDERS FROM (NOTE 5): | |
Net investment income | | | (18,721,435 | ) | | | (2,375,380 | ) | | | (8,662,171 | ) | | | (8,407,094 | ) | | | (744,187 | ) |
Net realized gains | | | — | | | | (3,306,413 | ) | | | (557,094 | ) | | | (1,253,336 | ) | | | (4,800,160 | ) |
| | | | | | | | | | | | | | | | | | | | |
Decrease in Net Assets From Distributions to Shareholders | | | (18,721,435 | ) | | | (5,681,793 | ) | | | (9,219,265 | ) | | | (9,660,430 | ) | | | (5,544,347 | ) |
| | | | | | | | | | | | | | | | | | | | |
FUND SHARE TRANSACTIONS : | |
Net proceeds from sale of shares | | | 2,934,660,735 | | | | 780,805,732 | | | | 1,376,881,445 | | | | 404,877,952 | | | | 266,757,729 | |
Reinvestment of distributions | | | 18,718,734 | | | | 5,680,960 | | | | 9,217,957 | | | | 8,979,970 | | | | 5,543,554 | |
Cost of shares repurchased | | | (551,471,595 | ) | | | (132,006,984 | ) | | | (152,944,298 | ) | | | (101,413,746 | ) | | | (23,387,131 | ) |
| | | | | | | | | | | | | | | | | | | | |
Increase (Decrease) in Net Assets From Fund Share Transactions | | | 2,401,907,874 | | | | 654,479,708 | | | | 1,233,155,104 | | | | 312,444,176 | | | | 248,914,152 | |
| | | | | | | | | | | | | | | | | | | | |
Increase (Decrease) in Net Assets | | | 2,803,730,159 | | | | 700,845,005 | | | | 1,412,565,175 | | | | 319,982,567 | | | | 222,550,662 | |
| | | | | |
NET ASSETS: | | | | | | | | | | | | | | | | | | | | |
Beginning of period | | | — | | | | — | | | | — | | | | — | | | | — | |
| | | | | | | | | | | | | | | | | | | | |
End of period*† | | $ | 2,803,730,159 | | | $ | 700,845,005 | | | $ | 1,412,565,175 | | | $ | 319,982,567 | | | $ | 222,550,662 | |
| | | | | | | | | | | | | | | | | | | | |
* Includes undistributed net investment income of: | | $ | 3,884,995 | | | $ | — | | | $ | 64,955 | | | $ | 1,089,086 | | | $ | — | |
| | | | | | | | | | | | | | | | | | | | |
† Includes accumulated net investment loss of: | | $ | — | | | $ | — | | | $ | — | | | $ | — | | | $ | — | |
| | | | | | | | | | | | | | | | | | | | |
193
Statements of Changes in Net Assets
For the period from March 20, 2017 (commencement of operations) through February 28, 2018 (continued)
| | | | | | | | | | | | | | | | | | | | |
| | | Destinations Core
Fixed Income
Fund | | | Destinations
Low Duration
Fixed Income
Fund | | | Destinations
Global Fixed
Income
Opportunities
Fund | | | Destinations
Municipal
Fixed Income
Fund | | | Destinations
Multi Strategy
Alternatives Fund | |
OPERATIONS: | | | | | | | | | | | | | | | | | | | | |
Net investment income (loss) | | $ | 28,426,085 | | | $ | 4,247,920 | | | $ | 17,973,190 | | | $ | 1,044,539 | | | $ | 24,363,473 | |
Net realized gain (loss) | | | (594,401 | ) | | | (284,260 | ) | | | (938,211 | ) | | | 116,426 | | | | 2,261,898 | |
Change in unrealized appreciation (depreciation) | | | (25,749,521 | ) | | | (1,467,170 | ) | | | (6,103,823 | ) | | | (3,175,804 | ) | | | 11,754,409 | |
| | | | | | | | | | | | | | | | | | | | |
Increase (Decrease) in Net Assets From Operations | | | 2,082,163 | | | | 2,496,490 | | | | 10,931,156 | | | | (2,014,839 | ) | | | 38,379,780 | |
| | | | | | | | | | | | | | | | | | | | |
DISTRIBUTIONS TO SHAREHOLDERS FROM (NOTE 5): | |
Net investment income | | | (27,010,187 | ) | | | (4,250,705 | ) | | | (17,704,050 | ) | | | (993,759 | ) | | | (19,534,986 | ) |
Net realized gains | | | (2,252,638 | ) | | | — | | | | (335,674 | ) | | | (185,661 | ) | | | — | |
| | | | | | | | | | | | | | | | | | | | |
Decrease in Net Assets From Distributions to Shareholders | | | (29,262,825 | ) | | | (4,250,705 | ) | | | (18,039,724 | ) | | | (1,179,420 | ) | | | (19,534,986 | ) |
| | | | | | | | | | | | | | | | | | | | |
FUND SHARE TRANSACTIONS : | |
Net proceeds from sale of shares | | | 1,704,394,993 | | | | 206,141,510 | | | | 664,465,917 | | | | 260,212,529 | | | | 1,127,456,126 | |
Reinvestment of distributions | | | 28,915,598 | | | | 4,051,762 | | | | 17,731,813 | | | | 1,179,382 | | | | 19,295,487 | |
Cost of shares repurchased | | | (206,384,919 | ) | | | (29,970,144 | ) | | | (73,723,855 | ) | | | (28,460,557 | ) | | | (256,219,259 | ) |
| | | | | | | | | | | | | | | | | | | | |
Increase (Decrease) in Net Assets From Fund Share Transactions | | | 1,526,925,672 | | | | 180,223,128 | | | | 608,473,875 | | | | 232,931,354 | | | | 890,532,354 | |
| | | | | | | | | | | | | | | | | | | | |
Increase (Decrease) in Net Assets | | | 1,499,745,010 | | | | 178,468,913 | | | | 601,365,307 | | | | 229,737,095 | | | | 909,377,148 | |
| | | | | |
NET ASSETS: | | | | | | | | | | | | | | | | | | | | |
Beginning of period | | | — | | | | — | | | | — | | | | — | | | | — | |
| | | | | | | | | | | | | | | | | | | | |
End of period*† | | $ | 1,499,745,010 | | | $ | 178,468,913 | | | $ | 601,365,307 | | | $ | 229,737,095 | | | $ | 909,377,148 | |
| | | | | | | | | | | | | | | | | | | | |
* Includes undistributed net investment income of: | | $ | 1,425,425 | | | $ | — | | | $ | — | | | $ | 50,769 | | | $ | 1,189,564 | |
| | | | | | | | | | | | | | | | | | | | |
† Includes accumulated net investment loss of: | | $ | — | | | $ | (1,298 | ) | | $ | — | | | $ | — | | | $ | — | |
| | | | | | | | | | | | | | | | | | | | |
194
Financial Highlights
For a share of beneficial interest outstanding throughout the period ended February 28:
Destinations Large Cap Equity Fund
| | | | |
| | | 2018 (1) | |
Net Asset Value, Beginning of Period | | $ | 10.00 | |
| | | | |
Income from Operations: | | | | |
Net investment income(2) | | | 0.10 | |
Net realized and unrealized gain | | | 1.69 | |
| | | | |
Total Income from Operations | | | 1.79 | |
| | | | |
Less Distributions From: | | | | |
Net investment income | | | (0.08 | ) |
| | | | |
Total Distributions | | | (0.08 | ) |
| | | | |
Net Asset Value, End of Period | | $ | 11.71 | |
| | | | |
Total Return(3) | | | 17.89 | %(4) |
Net Assets, End of Period (millions) | | $ | 2,804 | |
Ratios to Average Net Assets: | | | | |
Gross expenses | | | 0.98 | %(5) |
Net expenses(6) | | | 0.85 | (5) |
Net investment income(6) | | | 0.97 | (5) |
Portfolio Turnover Rate | | | 52 | %(4) |
| (1) | For the period from Fund inception (March 20, 2017) through the period ended February 28, 2018. |
| (2) | Per share amounts have been calculated using the average shares method. |
| (3) | Performance figures may reflect fee waivers and/or expense reimbursements and assume reinvestment of dividend distribution. In the absence of fee waivers and/or expense reimbursements, the total return would have been lower. Past performance is no guarantee of future results. |
| (6) | Reflects fee waivers and/or expense reimbursements. |
195
Financial Highlights
(continued)
For a share of beneficial interest outstanding throughout the period ended February 28:
Destinations Small Mid Cap Equity
| | | | |
| | | 2018 (1) | |
Net Asset Value, Beginning of Period | | $ | 10.00 | |
| | | | |
Income from Operations: | | | | |
Net investment income(2) | | | 0.04 | |
Net realized and unrealized gain | | | 1.04 | |
| | | | |
Total Income from Operations | | | 1.08 | |
| | | | |
Less Distributions From: | | | | |
Net investment income | | | (0.04 | ) |
Net realized gain | | | (0.06 | ) |
| | | | |
Total Distributions | | | (0.10 | ) |
| | | | |
Net Asset Value, End of Period | | $ | 10.98 | |
| | | | |
Total Return(3) | | | 10.83 | %(4) |
Net Assets, End of Period (millions) | | $ | 701 | |
Ratios to Average Net Assets: | | | | |
Gross expenses | | | 1.14 | %(5) |
Net expenses(6) | | | 1.03 | (5) |
Net investment income(6) | | | 0.41 | (5) |
Portfolio Turnover Rate | | | 112 | %(4) |
| (1) | For the period from Fund inception (March 20, 2017) through the period ended February 28, 2018. |
| (2) | Per share amounts have been calculated using the average shares method. |
| (3) | Performance figures may reflect fee waivers and/or expense reimbursements and assume reinvestment of dividend distribution. In the absence of fee waivers and/or expense reimbursements, the total return would have been lower. Past performance is no guarantee of future results. |
| (6) | Reflects fee waivers and/or expense reimbursements. |
196
Financial Highlights
(continued)
For a share of beneficial interest outstanding throughout the period ended February 28:
Destinations International Equity Fund
| | | | |
| | | 2018 (1) | |
Net Asset Value, Beginning of Period | | $ | 10.00 | |
| | | | |
Income from Operations: | | | | |
Net investment income(2) | | | 0.07 | |
Net realized and unrealized gain | | | 1.70 | |
| | | | |
Total Income from Operations | | | 1.77 | |
| | | | |
Less Distributions From: | | | | |
Net investment income | | | (0.07 | ) |
Net realized gain | | | (0.01 | ) |
| | | | |
Total Distributions | | | (0.08 | ) |
| | | | |
Net Asset Value, End of Period | | $ | 11.69 | |
| | | | |
Total Return(3) | | | 17.70 | %(4) |
Net Assets, End of Period (millions) | | $ | 1,413 | |
Ratios to Average Net Assets: | | | | |
Gross expenses | | | 1.30 | %(5) |
Net expenses(6) | | | 1.15 | (5) |
Net investment income(6) | | | 0.69 | (5) |
Portfolio Turnover Rate | | | 50 | %(4) |
| (1) | For the period from Fund inception (March 20, 2017) through the period ended February 28, 2018. |
| (2) | Per share amounts have been calculated using the average shares method. |
| (3) | Performance figures may reflect fee waivers and/or expense reimbursements and assume reinvestment of dividend distribution. In the absence of fee waivers and/or expense reimbursements, the total return would have been lower. Past performance is no guarantee of future results. |
| (6) | Reflects fee waivers and/or expense reimbursements. |
197
Financial Highlights
(continued)
For a share of beneficial interest outstanding throughout the period ended February 28:
Destinations Equity Income Fund
| | | | |
| | | 2018 (1) | |
Net Asset Value, Beginning of Period | | $ | 10.00 | |
| | | | |
Income (Loss) from Operations: | | | | |
Net investment income (2) | | | 0.31 | |
Net realized and unrealized gain | | | 0.12 | |
| | | | |
Total Loss from Operations | | | 0.43 | |
| | | | |
Less Distributions From: | | | | |
Net investment income | | | (0.26 | ) |
Net realized gain | | | (0.03 | ) |
| | | | |
Total Distributions | | | (0.29 | ) |
| | | | |
Net Asset Value, End of Period | | $ | 10.14 | |
| | | | |
Total Return(3) | | | 4.34 | %(4) |
Net Assets, End of Period (millions) | | $ | 320 | |
Ratios to Average Net Assets: | | | | |
Gross expenses | | | 1.05 | %(5) |
Net expenses(6) | | | 0.93 | (5) |
Net investment income(6) | | | 3.18 | (5) |
Portfolio Turnover Rate | | | 57 | %(4) |
| (1) | For the period from Fund inception (March 20, 2017) through the period ended February 28, 2018. |
| (2) | Per share amounts have been calculated using the average shares method. |
| (3) | Performance figures may reflect fee waivers and/or expense reimbursements and assume reinvestment of dividend distribution. In the absence of fee waivers and/or expense reimbursements, the total return would have been lower. Past performance is no guarantee of future results. |
| (6) | Reflects fee waivers and/or expense reimbursements. |
198
Financial Highlights
(continued)
For a share of beneficial interest outstanding throughout the period ended February 28:
Destinations Real Assets Fund
| | | | |
| | | 2018 (1) | |
Net Asset Value, Beginning of Period | | $ | 10.00 | |
| | | | |
Income from Operations: | | | | |
Net investment loss(2) | | | 0.00 | (3) |
Net realized and unrealized loss | | | (0.78 | ) |
| | | | |
Total Income from Operations | | | (0.78 | ) |
| | | | |
Less Distributions From: | | | | |
Net investment income | | | (0.04 | ) |
Net realized gain | | | (0.24 | ) |
| | | | |
Total Distributions | | | (0.28 | ) |
| | | | |
Net Asset Value, End of Period | | $ | 8.94 | |
| | | | |
Total Return(4) | | | (7.95 | )%(5) |
Net Assets, End of Period (millions) | | $ | 223 | |
Ratios to Average Net Assets: | | | | |
Gross expenses | | | 1.29 | %(6) |
Net expenses(7) | | | 1.19 | (6) |
Net investment income(7) | | | 0.02 | (6) |
Portfolio Turnover Rate | | | 58 | %(5) |
| (1) | For the period from Fund inception (March 20, 2017) through the period ended February 28, 2018. |
| (2) | Per share amounts have been calculated using the average shares method. |
| (3) | Amounts represent less than $(0.01) per shares. |
| (4) | Performance figures may reflect fee waivers and/or expense reimbursements and assume reinvestment of dividend distribution. In the absence of fee waivers and/or expense reimbursements, the total return would have been lower. Past performance is no guarantee of future results. |
| (7) | Reflects fee waivers and/or expense reimbursements. |
199
Financial Highlights
(continued)
For a share of beneficial interest outstanding throughout the period ended February 28:
Destinations Core Fixed Income Fund
| | | | |
| | | 2018 (1) | |
Net Asset Value, Beginning of Period | | $ | 10.00 | |
| | | | |
Income (Loss) from Operations: | | | | |
Net investment income (2) | | | 0.21 | |
Net realized and unrealized loss | | | (0.17 | ) |
| | | | |
Total Income from Operations | | | 0.04 | |
| | | | |
Less Distributions From: | | | | |
Net investment income | | | (0.19 | ) |
Net realized gain | | | (0.02 | ) |
| | | | |
Total Distributions | | | (0.21 | ) |
| | | | |
Net Asset Value, End of Period | | $ | 9.83 | |
| | | | |
Total Return(3) | | | 0.34 | %(4) |
Net Assets, End of Period (millions) | | $ | 1,500 | |
Ratios to Average Net Assets: | | | | |
Gross expenses | | | 0.90 | %(5) |
Net expenses(6) | | | 0.82 | (5) |
Net investment income(6) | | | 2.22 | (5) |
Portfolio Turnover Rate | | | 170 | %(4) |
| (1) | For the period from Fund inception (March 20, 2017) through the period ended February 28, 2018. |
| (2) | Per share amounts have been calculated using the average shares method. |
| (3) | Performance figures may reflect fee waivers and/or expense reimbursements and assume reinvestment of dividend distribution. In the absence of fee waivers and/or expense reimbursements, the total return would have been lower. Past performance is no guarantee of future results. |
| (6) | Reflects fee waivers and/or expense reimbursements. |
200
Financial Highlights
(continued)
For a share of beneficial interest outstanding throughout the period ended February 28:
Destinations Low Duration Fixed Income Fund
| | | | |
| | | 2018 (1) | |
Net Asset Value, Beginning of Period | | $ | 10.00 | |
| | | | |
Income (Loss) from Operations: | | | | |
Net investment income(2) | | | 0.27 | |
Net realized and unrealized loss | | | (0.12 | ) |
| | | | |
Total Loss from Operations | | | 0.15 | |
| | | | |
Less Distributions From: | | | | |
Net investment income | | | (0.25 | ) |
| | | | |
Total Distributions | | | (0.25 | ) |
| | | | |
Net Asset Value, End of Period | | $ | 9.90 | |
| | | | |
Total Return(3) | | | 1.52 | %(4) |
Net Assets, End of Period (millions) | | $ | 178 | |
Ratios to Average Net Assets: | | | | |
Gross expenses | | | 1.00 | %(5) |
Net expenses(6) | | | 0.94 | (5) |
Net investment income(6) | | | 2.84 | (5) |
Portfolio Turnover Rate | | | 32 | %(4) |
| (1) | For the period from Fund inception (March 20, 2017) through the period ended February 28, 2018. |
| (2) | Per share amounts have been calculated using the average shares method. |
| (3) | Performance figures may reflect fee waivers and/or expense reimbursements and assume reinvestment of dividend distribution. In the absence of fee waivers and/or expense reimbursements, the total return would have been lower. Past performance is no guarantee of future results. |
| (6) | Reflects fee waivers and/or expense reimbursements. |
201
Financial Highlights
(continued)
For a share of beneficial interest outstanding throughout the period ended February 28:
Destinations Global Fixed Income Opportunities Fund
| | | | |
| | | 2018 (1) | |
Net Asset Value, Beginning of Period | | $ | 10.00 | |
| | | | |
Income (Loss) from Operations: | | | | |
Net investment income (2) | | | 0.37 | |
Net realized and unrealized loss | | | (0.02 | ) |
| | | | |
Total Loss from Operations | | | 0.35 | |
| | | | |
Less Distributions From: | | | | |
Net investment income | | | (0.35 | ) |
Net realized gain | | | (0.01 | ) |
| | | | |
Total Distributions | | | (0.36 | ) |
| | | | |
Net Asset Value, End of Period | | $ | 9.99 | |
| | | | |
Total Return(3) | | | 3.34 | %(4) |
Net Assets, End of Period (millions) | | $ | 601 | |
Ratios to Average Net Assets: | | | | |
Gross expenses | | | 1.10 | %(5) |
Net expenses(6) | | | 0.99 | (5) |
Net investment income(6) | | | 3.88 | (5) |
Portfolio Turnover Rate | | | 64 | %(4) |
| (1) | For the period from Fund inception (March 20, 2017) through the period ended February 28, 2018. |
| (2) | Per share amounts have been calculated using the average shares method. |
| (3) | Performance figures may reflect fee waivers and/or expense reimbursements and assume reinvestment of dividend distribution. In the absence of fee waivers and/or expense reimbursements, the total return would have been lower. Past performance is no guarantee of future results. |
| (6) | Reflects fee waivers and/or expense reimbursements. |
202
Financial Highlights
(continued)
For a share of beneficial interest outstanding throughout the period ended February 28:
Destinations Municipal Fixed Income Fund
| | | | |
| | | 2018 (1) | |
Net Asset Value, Beginning of Period | | $ | 10.00 | |
| | | | |
Income from Operations: | | | | |
Net investment income(2) | | | 0.08 | |
Net realized and unrealized loss | | | (0.09 | ) |
| | | | |
Total Loss from Operations | | | (0.01 | ) |
| | | | |
Less Distributions From: | | | | |
Net investment income | | | (0.05 | ) |
Net realized gain | | | (0.01 | ) |
| | | | |
Total Distributions | | | (0.06 | ) |
| | | | |
Net Asset Value, End of Period | | $ | 9.93 | |
| | | | |
Total Return(3) | | | (0.14 | )%(4) |
Net Assets, End of Period (millions) | | $ | 230 | |
Ratios to Average Net Assets: | | | | |
Gross expenses | | | 0.97 | %(5) |
Net expenses(6) | | | 0.80 | (5) |
Net investment income(6) | | | 0.79 | (5) |
Portfolio Turnover Rate | | | 69 | %(4) |
| (1) | For the period from Fund inception (March 20, 2017) through the period ended February 28, 2018. |
| (2) | Per share amounts have been calculated using the average shares method. |
| (3) | Performance figures may reflect fee waivers and/or expense reimbursements and assume reinvestment of dividend distribution. In the absence of fee waivers and/or expense reimbursements, the total return would have been lower. Past performance is no guarantee of future results. |
| (6) | Reflects fee waivers and/or expense reimbursements. |
203
Financial Highlights
(continued)
For a share of beneficial interest outstanding throughout the period ended February 28:
Destinations Multi Strategy Alternatives Fund
| | | | |
| | | 2018 (1) | |
Net Asset Value, Beginning of Period | | $ | 10.00 | |
| | | | |
Income (Loss) from Operations: | | | | |
Net investment income (2) | | | 0.27 | |
Net realized and unrealized gain | | | 0.13 | |
| | | | |
Total Income from Operations | | | 0.40 | |
| | | | |
Less Distributions From: | | | | |
Net investment income | | | (0.20 | ) |
| | | | |
Total Distributions | | | (0.20 | ) |
| | | | |
Net Asset Value, End of Period | | $ | 10.20 | |
| | | | |
Total Return(3) | | | 3.94 | %(4) |
Net Assets, End of Period (millions) | | $ | 909 | |
Ratios to Average Net Assets: | | | | |
Gross expenses | | | 1.73 | %(5)(6) |
Net expenses(7) | | | 1.25 | (5)(6) |
Net investment income(7) | | | 2.82 | (5) |
Portfolio Turnover Rate | | | 111 | %(4) |
| (1) | For the period from Fund inception (March 20, 2017) through the period ended February 28, 2018. |
| (2) | Per share amounts have been calculated using the average shares method. |
| (3) | Performance figures may reflect fee waivers and/or expense reimbursements and assume reinvestment of dividend distribution. In the absence of fee waivers and/or expense reimbursements, the total return would have been lower. Past performance is no guarantee of future results. |
| (6) | Ratio includes dividend and interest expense on short sales which represents 0.12% (annualized). |
| (7) | Reflects fee waivers and/or expense reimbursements. |
204
Notes to Financial Statements
1. Organization
The Brinker Capital Destinations Trust (“Trust”) is organized as a Delaware statutory trust and registered under the Investment Company Act of 1940, as amended (“1940 Act”), as an open-end management investment company. The Trust currently consists of Destinations Large Cap Equity Fund, Destinations Small-Mid Cap Equity Fund, Destinations International Equity Fund, Destinations Equity Income Fund, Destinations Real Assets Fund, Destinations Core Fixed Income Fund, Destinations Low Duration Fixed Income Fund, Destinations Global Fixed Income Opportunities Fund, Destinations Municipal Fixed Income Fund and Destinations Multi Strategy Alternatives Fund (individually, a “Fund” and collectively, the “Funds”).
Brinker Capital, Inc. (“Brinker Capital” or the “Adviser”), serves as the investment adviser for the Funds. The Funds employ a multimanager strategy. The Adviser selects and oversees professional money managers (each a “Sub-adviser”) who are responsible for investing the assets of the Funds allocated to them.
2. Accounting Policies
The Funds’ financial statements are prepared in accordance with accounting principles generally accepted in the United States of America (“GAAP”). Estimates and assumptions are required to be made by management regarding assets, liabilities and changes in net assets resulting from operations when financial statements are prepared. Changes in the economic environment, financial markets and any other parameters used in determining these estimates could cause actual results to differ. The Funds are investment companies and follow the accounting and reporting guidance of the Financial Accounting Standards Board (“FASB”) Accounting Standards Codification Topic 946 – Investment Companies.
In October 2016, the U.S. Securities and Exchange Commission (“SEC”) adopted new rules and forms, and amendments to certain current rules and forms, to modernize reporting and disclosure of information by registered investment companies. The amendments to Regulation S-X require standardized, enhanced disclosure about derivatives in investment company financial statements, and changed the rules governing the form and content of such financial statements. The amendments to Regulation S-X took effect on August 1, 2017.
3. Investment valuation
Equity securities for each Fund for which market quotations are readily available and are traded on an exchange are valued at the closing sale price or official closing price on the exchange on which such security is principally traded. In the event there are no sales that day, such securities are valued at the bid price. For equity securities that are primarily traded on foreign exchanges, these values are converted to U.S. dollars using the current exchange rates as of the close of the New York Stock Exchange (“NYSE”).
Futures contracts are valued at the settlement price in the market where such contracts are principally traded. Foreign currency forward contracts are valued at the current Business Day’s interpolated foreign exchange rate, as calculated using the current day’s spot rate, and the thirty, sixty, ninety and one-hundred eighty day forward rates provided by an independent source.
Portfolio securities traded in the over-the-counter market for which market quotations are readily available are valued at the last sales price that day. In the event there are no sales that day, such securities are valued at the bid price. Investments in registered open-end management investment companies are valued at reported net asset value per share.
Securities pledged by the Funds as collateral, if any, are identified as such in the Schedule of Investments.
205
Notes to Financial Statements
(continued)
Debt obligations that will mature in 60 days or less are valued at amortized cost, which approximates market value. Debt obligations that will mature in more than 60 days are valued using valuations furnished by an approved third-party pricing service; such valuations are determined by the third-party pricing service based upon its analysis of a variety of factors, including transactions in debt obligations, quotations from bond dealers, market transactions in comparable securities and its analysis of various relationships between securities, prices or yields of securities with similar characteristics, benchmark curves or information pertaining to the issuer, and as well as industry and economic events.
The Board of Trustees (the “Board”) has ultimate responsibility for ensuring the Funds’ investments are valued appropriately. The Board has delegated primary responsibility for determining or causing to be determined the value of the Funds’ investments (including any fair valuation) to the Adviser pursuant to valuation policies and procedures approved by the Board. When market quotations are not readily available or are determined to be unreliable, investments are valued at fair value as determined in good faith by the valuation committee established by the Adviser in accordance with such procedures under the oversight of the Board. Circumstances that may indicate that market quotations are not readily available or are unreliable include, but are not limited to, such instances when the value of a security has been significantly affected by events after the close of the exchange or market on which the security is principally traded, and before the applicable Fund calculates its Net Asset Value (“NAV”).
Each business day, the Funds use a Board-approved third-party pricing service to assist with the valuation of foreign equity securities. Events occurring after the close of trading on foreign exchanges may result in adjustments to the valuation of foreign securities to reflect market trading that occurs after the close of the applicable foreign markets of comparable securities or other instruments that have a strong correlation to the fair-valued securities to more accurately reflect their fair value as of the close of regular trading on the NYSE.
The Funds disclose the fair value of their investments in a hierarchy that prioritizes the inputs to valuation techniques used to measure the fair value. The hierarchy prioritizes inputs to valuation methods and requires disclosure of the fair value hierarchy, separately for each major category of assets and liabilities that segregates fair value measurements into levels (Level 1, 2, and 3). The three levels of the fair value hierarchy are as follows:
Level 1 – unadjusted quoted prices in active markets for identical securities.
Level 2 – significant observable inputs (including quoted prices for similar securities, interest rates, prepayment speeds, credit risk, etc.)
Level 3 – significant unobservable inputs (including assumptions made by the Board or persons acting at their direction that are used in determining the fair value of investments.)
The inputs or methodology used for valuing securities are not necessarily an indication of the risk associated with investing in those securities. The following are certain inputs and techniques that the Funds generally use to evaluate how to classify each major category of assets and liabilities in accordance with GAAP.
Fixed income securities including corporate, convertible and municipal bonds and notes, U.S. government agencies, U.S. treasury obligations, sovereign bonds, bank loans, convertible preferred securities and non-U.S. bonds are normally valued by third-party pricing service providers that use broker quotations, reported trades or valuation estimates from their internal pricing models. The service providers’ internal models use inputs that are observable such as issuer details, interest rates, yield curves, prepayment speeds, credit risks/spreads, default rates and quoted prices for similar assets. Securities that use similar valuation techniques and inputs as described above are categorized as Level 2 of the fair value hierarchy. To the extent that these inputs are significant and unobservable, the values are categorized as Level 3 of the fair value hierarchy.
206
Notes to Financial Statements
(continued)
Mortgage-related and asset-backed securities are usually issued as separate tranches, or classes, of securities within each deal. These securities are also normally valued by third-party pricing service providers that use broker-dealer quotations or valuation estimates from their internal pricing models. The pricing models for these securities usually consider tranche-level attributes, current market data, estimated cash flows and market-based yield spreads for each tranche, and incorporate deal collateral performance, as available. Mortgage-related and asset-backed securities and the related forward sales commitments that use similar valuation techniques and inputs as described above are categorized as Level 2 of the fair value hierarchy. To the extent that these inputs are significant and unobservable, the values are categorized as Level 3 of the fair value hierarchy.
Common stocks, preferred stocks, rights, warrants, exchange-traded funds and financial derivative instruments, such as futures contracts or options contracts that are traded on a national securities exchange, are categorized as Level 1 of the fair value hierarchy, to the extent these securities are actively traded and valuation adjustments are not applied.
Valuation adjustments may be applied to certain securities that are solely traded on a foreign exchange to account for the market movement between the close of the foreign market and the NYSE close. Securities using these valuation adjustments are categorized as Level 2 of the fair value hierarchy. Preferred securities and other equities traded on inactive markets or valued by reference to similar instruments are also categorized as Level 2 of the fair value hierarchy.
Investments in registered open-end investment management companies are valued based upon the NAVs of such investments on the valuation date and are categorized as Level 1 of the fair value hierarchy.
Short-term investments having a maturity of 60 days or less are generally valued at amortized cost which approximates fair market value. These investments are categorized as Level 2 of the fair value hierarchy.
Over-the-counter financial derivative instruments, such as forward foreign currency contracts, derive their value from underlying asset prices, indices, reference rates, and other inputs or a combination of these factors. These contracts are normally valued on the basis of broker dealer quotations or by third-party pricing service providers. Depending on the product and the terms of the transaction, the value of financial derivatives can be estimated by a third-party pricing service provider using a series of techniques, including simulation pricing models. The pricing models use inputs that are observed from actively quoted markets such as issuer details, indices, spreads, interest rates, yield curves, dividends and exchange rates. Financial derivatives that use similar valuation techniques and inputs as described above are categorized as Level 2 of the fair value hierarchy. To the extent that these inputs are significant and unobservable, the values are categorized as Level 3 of the fair value hierarchy.
Centrally cleared swaps listed or traded on the multilateral or trade facility platform, such as a registered exchange, are valued at the daily settlement price determined by the respective exchange. For centrally cleared credit default swaps, the clearing facility requires its members to provide actionable levels across complete term structures. These levels along with external third party prices are used to produce daily settlement prices. Centrally cleared interest rate swaps are valued using a pricing model that references the underlying rates including the overnight index swap rate and London Interbank Offered Rate (“LIBOR”) forward rate to produce the daily settlement price. These securities are categorized as Level 2 of the fair value hierarchy.
The Funds’ policy is to recognize transfers between levels at the end of the reporting period. In some instances, the inputs used to measure fair value might fall in different levels of the fair value hierarchy. The level in the fair value hierarchy within which the fair value measurement in its entirety falls is determined based on the lowest level input that is significant to the fair value measurement in its entirety. Because of the inherent uncertainties of valuation, the values reflected in the financial statements may materially differ from the value received upon actual sale of those investments.
207
Notes to Financial Statements
(continued)
The following table summarizes the valuation of each Fund’s assets and liabilities using the fair value hierarchy:
| | | | | | | | | | | | | | | | |
| | | Total Fair Value at
February 28, 2018 | | | Unadjusted Quoted
Prices in Active
Markets for
Identical
Investments
(Level 1) | | | Significant
Observable
Inputs
(Level 2) | | | Significant
Unobservable
Inputs
(Level 3) | |
Destinations Large Cap Equity Fund | | | | | | | | | | | | | | | | |
Investments, at value | | | | | | | | | | | | | | | | |
Corporate Bond & Note | | $ | 999,552 | | | $ | — | | | $ | 999,552 | | | $ | — | |
Common Stocks: | | | | | | | | | | | | | | | | |
Basic Materials | | | 48,978,813 | | | | 48,978,813 | | | | — | | | | — | |
Communications | | | 465,621,550 | | | | 465,621,550 | | | | — | | | | — | |
Consumer Cyclical | | | 194,283,063 | | | | 194,283,063 | | | | — | | | | — | |
Consumer Non-cyclical | | | 603,891,176 | | | | 603,891,176 | | | | — | | | | — | |
Energy | | | 162,870,710 | | | | 162,870,710 | | | | — | | | | — | |
Financial | | | 487,662,774 | | | | 487,662,774 | | | | — | | | | — | |
Industrial | | | 269,793,242 | | | | 269,793,242 | | | | — | | | | — | |
Technology | | | 451,222,200 | | | | 451,222,200 | | | | — | | | | — | |
Utilities | | | 47,756,236 | | | | 47,756,236 | | | | — | | | | — | |
Preferred Stock: | | | | | | | | | | | | | | | | |
Technology | | | 406,539 | | | | — | | | | — | | | | 406,539 | |
Short-Term Investments: | | | | | | | | | | | | | | | | |
Time Deposits | | | 73,242,101 | | | | — | | | | 73,242,101 | | | | — | |
Money Market Fund | | | 16,521,899 | | | | 16,521,899 | | | | — | | | | — | |
| | | | | | | | | | | | | | | | |
Total Investments, at value | | $ | 2,823,249,855 | | | $ | 2,748,601,663 | | | $ | 74,241,653 | | | $ | 406,539 | |
| | | | | | | | | | | | | | | | |
Other Financial Instruments - Assets | | | | | | | | | | | | | | | | |
Futures Contract | | $ | 137,679 | | | $ | 137,679 | | | $ | — | | | $ | — | |
| | | | | | | | | | | | | | | | |
Total Other Financial Instruments - Assets | | $ | 137,679 | | | $ | 137,679 | | | $ | — | | | $ | — | |
| | | | | | | | | | | | | | | | |
208
Notes to Financial Statements
(continued)
| | | | | | | | | | | | | | | | |
| | | Total Fair Value at
February 28, 2018 | | | Unadjusted Quoted
Prices in Active
Markets for
Identical
Investments
(Level 1) | | | Significant
Observable
Inputs
(Level 2) | | | Significant
Unobservable
Inputs
(Level 3) | |
Destinations Small-Mid Cap Equity Fund | | | | | | | | | | | | | | | | |
Investments, at value | | | | | | | | | | | | | | | | |
Common Stocks: | | | | | | | | | | | | | | | | |
Basic Materials | | $ | 16,768,247 | | | $ | 16,768,247 | | | $ | — | | | $ | — | |
Communications | | | 29,086,201 | | | | 29,086,201 | | | | — | | | | — | |
Consumer Cyclical | | | 45,592,259 | | | | 45,592,259 | | | | — | | | | — | |
Consumer Non-cyclical | | | 111,604,278 | | | | 111,604,278 | | | | — | | | | — | |
Energy | | | 41,861,972 | | | | 41,861,972 | | | | — | | | | — | |
Financial | | | 131,185,575 | | | | 131,185,575 | | | | — | | | | — | |
Industrial | | | 75,880,814 | | | | 75,880,814 | | | | — | | | | — | |
Technology | | | 48,644,467 | | | | 48,644,467 | | | | — | | | | — | |
Utilities | | | 28,105,367 | | | | 28,105,367 | | | | — | | | | — | |
Exchange Traded Funds (ETFs) | | | 152,875,648 | | | | 152,875,648 | | | | — | | | | — | |
Short-Term Investments: | | | | | | | | | | | | | | | | |
Time Deposits | | | 19,831,393 | | | | — | | | | 19,831,393 | | | | — | |
Money Market Fund | | | 17,329,790 | | | | 17,329,790 | | | | — | | | | — | |
| | | | | | | | | | | | | | | | |
Total Investments, at value | | $ | 718,766,011 | | | $ | 698,934,618 | | | $ | 19,831,393 | | | $ | — | |
| | | | | | | | | | | | | | | | |
| | | | |
| | | Total Fair Value at
February 28, 2018 | | | Unadjusted Quoted
Prices in Active
Markets for
Identical
Investments
(Level 1) | | | Significant
Observable
Inputs
(Level 2) | | | Significant
Unobservable
Inputs
(Level 3) | |
Destinations International Equity Fund | | | | | | | | | | | | | | | | |
Investments, at value | | | | | | | | | | | | | | | | |
Common Stocks: | | | | | | | | | | | | | | | | |
Argentina | | $ | 9,154,992 | | | $ | 9,154,992 | | | $ | — | | | $ | — | |
Australia | | | 23,534,434 | | | | — | | | | 23,534,434 | | | | — | |
Austria | | | 5,403,033 | | | | — | | | | 5,403,033 | | | | — | |
Belgium | | | 2,900,868 | | | | — | | | | 2,900,868 | | | | — | |
Bermuda | | | 3,105,842 | | | | 1,556,245 | | | | 1,549,597 | | | | — | |
Brazil | | | 25,050,081 | | | | 7,609,426 | | | | 17,440,655 | | | | — | |
Canada | | | 18,930,988 | | | | 18,930,988 | | | | — | | | | — | |
China | | | 102,546,263 | | | | 30,866,722 | | | | 71,679,541 | | | | — | |
Denmark | | | 7,096,568 | | | | — | | | | 7,096,568 | | | | — | |
Egypt | | | 1,930,290 | | | | — | | | | 1,930,290 | | | | — | |
Finland | | | 4,285,379 | | | | — | | | | 4,285,379 | | | | — | |
France | | | 55,571,899 | | | | — | | | | 55,571,899 | | | | — | |
209
Notes to Financial Statements
(continued)
| | | | | | | | | | | | | | | | |
| | | | |
| | | Total Fair Value at
February 28, 2018 | | | Unadjusted Quoted
Prices in Active
Markets for
Identical
Investments
(Level 1) | | | Significant
Observable
Inputs
(Level 2) | | | Significant
Unobservable
Inputs
(Level 3) | |
Germany | | $ | 76,712,878 | | | $ | — | | | $ | 76,712,878 | | | $ | — | |
Greece | | | 2,459,411 | | | | — | | | | 2,459,411 | | | | — | |
Hong Kong | | | 32,763,928 | * | | | — | | | | 32,763,928 | | | | —* | |
India | | | 77,715,593 | | | | — | | | | 77,715,593 | | | | — | |
Indonesia | | | 15,392,540 | | | | — | | | | 15,392,540 | | | | — | |
Ireland | | | 4,197,675 | | | | 986,571 | | | | 3,211,104 | | | | — | |
Isle of Man | | | 196,786 | | | | — | | | | 196,786 | | | | — | |
Israel | | | 3,588,111 | | | | 1,439,188 | | | | 2,148,923 | | | | — | |
Italy | | | 5,539,025 | | | | — | | | | 5,539,025 | | | | — | |
Japan | | | 173,639,635 | | | | — | | | | 173,639,635 | | | | — | |
Malaysia | | | 11,788,258 | | | | — | | | | 11,788,258 | | | | — | |
Mexico | | | 19,278,338 | | | | 4,929,074 | | | | 14,349,264 | | | | — | |
Netherlands | | | 11,719,203 | | | | 1,188,364 | | | | 10,530,839 | | | | — | |
New Zealand | | | 3,539,912 | | | | — | | | | 3,539,912 | | | | — | |
Nigeria | | | 382,886 | | | | — | | | | 382,886 | | | | — | |
Norway | | | 1,396,938 | | | | — | | | | 1,396,938 | | | | — | |
Pakistan | | | 4,048,452 | | | | — | | | | 4,048,452 | | | | — | |
Panama | | | 2,589,821 | | | | 2,589,821 | | | | — | | | | — | |
Peru | | | 1,017,964 | | | | 1,017,964 | | | | — | | | | — | |
Philippines | | | 11,963,102 | | | | — | | | | 11,963,102 | | | | — | |
Poland | | | 3,710,536 | | | | — | | | | 3,710,536 | | | | — | |
Russia | | | 10,595,461 | | | | 10,348,853 | | | | 246,608 | | | | — | |
Singapore | | | 3,795,004 | | | | 1,030,240 | | | | 2,764,764 | | | | — | |
South Africa | | | 20,468,317 | | | | 950,889 | | | | 19,517,428 | | | | — | |
South Korea | | | 34,316,263 | | | | — | | | | 34,316,263 | | | | — | |
Spain | | | 15,439,183 | | | | 3,868,366 | | | | 11,570,817 | | | | — | |
Sweden | | | 17,624,950 | | | | — | | | | 17,624,950 | | | | — | |
Switzerland | | | 51,913,086 | | | | — | | | | 51,913,086 | | | | — | |
Taiwan | | | 41,650,912 | | | | 12,245,248 | | | | 29,405,664 | | | | — | |
Thailand | | | 5,433,508 | | | | — | | | | 5,433,508 | | | | — | |
Turkey | | | 2,323,139 | | | | — | | | | 2,323,139 | | | | — | |
United Arab Emirates | | | 3,429,685 | | | | — | | | | 3,429,685 | | | | — | |
United Kingdom | | | 94,929,559 | | | | 4,447,562 | | | | 90,481,997 | | | | — | |
United States | | | 41,870,869 | | | | 37,637,413 | | | | 4,233,456 | | | | — | |
210
Notes to Financial Statements
(continued)
| | | | | | | | | | | | | | | | |
| | | | |
| | | Total Fair Value at
February 28, 2018 | | | Unadjusted Quoted
Prices in Active
Markets for
Identical
Investments
(Level 1) | | | Significant
Observable
Inputs
(Level 2) | | | Significant
Unobservable
Inputs
(Level 3) | |
Exchange Traded Funds (ETFs): | | | | | | | | | | | | | | | | |
United States | | $ | 300,673,689 | | | $ | 300,673,689 | | | $ | — | | | $ | — | |
Short-Term Investments: | | | | | | | | | | | | | | | | |
Time Deposits | | | 38,345,758 | | | | — | | | | 38,345,758 | | | | — | |
U.S. Government Agency | | | 6,638,000 | | | | — | | | | 6,638,000 | | | | — | |
Money Market Fund | | | 19,777,529 | | | | 19,777,529 | | | | — | | | | — | |
| | | | | | | | | | | | | | | | |
Total Investments, at value | | $ | 1,432,376,541 | * | | $ | 471,249,144 | | | $ | 961,127,397 | | | $ | — | * |
| | | | | | | | | | | | | | | | |
Other Financial Instruments - Assets | | | | | | | | | | | | | | | | |
Forward Foreign Currency Contracts | | $ | 23,364 | | | $ | — | | | $ | 23,364 | | | $ | — | |
| | | | | | | | | | | | | | | | |
Total Other Financial Instruments - Assets | | $ | 23,364 | | | $ | — | | | $ | 23,364 | | | $ | — | |
| | | | | | | | | | | | | | | | |
Other Financial Instruments - Liabilities | | | | | | | | | | | | | | | | |
Forward Foreign Currency Contracts | | $ | (88,319 | ) | | $ | — | | | $ | (88,319 | ) | | $ | — | |
| | | | | | | | | | | | | | | | |
Total Other Financial Instruments - Liabilities | | $ | (88,319 | ) | | $ | — | | | $ | (88,319 | ) | | $ | — | |
| | | | | | | | | | | | | | | | |
| | | | |
| | | Total Fair Value at
February 28, 2018 | | | Unadjusted Quoted
Prices in Active
Markets for
Identical
Investments
(Level 1) | | | Significant
Observable
Inputs
(Level 2) | | | Significant
Unobservable
Inputs
(Level 3) | |
Destinations Equity Income Fund | | | | | | | | | | | | | | | | |
Investments, at value | | | | | | | | | | | | | | | | |
Common Stocks: | | | | | | | | | | | | | | | | |
Basic Materials | | $ | 4,951,051 | | | $ | 4,951,051 | | | $ | — | | | $ | — | |
Communications | | | 42,285,900 | | | | 42,285,900 | | | | — | | | | — | |
Consumer Cyclical | | | 10,749,335 | | | | 10,749,335 | | | | — | | | | — | |
Consumer Non-cyclical | | | 65,504,404 | | | | 65,504,404 | | | | — | | | | — | |
Energy | | | 38,663,014 | | | | 38,663,014 | | | | — | | | | — | |
Financial | | | 27,734,891 | | | | 27,734,891 | | | | — | | | | — | |
Industrial | | | 11,981,505 | | | | 11,981,505 | | | | — | | | | — | |
Technology | | | 13,464,566 | | | | 13,464,566 | | | | — | | | | — | |
211
Notes to Financial Statements
(continued)
| | | | | | | | | | | | | | | | |
| | | Total Fair Value at
February 28, 2018 | | | Unadjusted Quoted
Prices in Active
Markets for
Identical
Investments
(Level 1) | | | Significant
Observable
Inputs
(Level 2) | | | Significant
Unobservable
Inputs
(Level 3) | |
Utilities | | $ | 30,175,262 | | | $ | 30,175,262 | | | $ | — | | | $ | — | |
Exchange Traded Fund (ETF) | | | 61,239,463 | | | | 61,239,463 | | | | — | | | | — | |
Equity Linked Notes | | | 2,737,488 | | | | — | | | | 2,737,488 | | | | — | |
Convertible Preferred Stocks: | | | | | | | | | | | | | | | | |
Consumer Non-cyclical | | | 1,029,424 | | | | 1,029,424 | | | | — | | | | — | |
Utilities | | | 1,086,258 | | | | 1,086,258 | | | | — | | | | — | |
Preferred Stock: | | | | | | | | | | | | | | | | |
Financial | | | 1,397,283 | | | | 1,397,283 | | | | — | | | | — | |
Short-Term Investments: | | | | | | | | | | | | | | | | |
Time Deposits | | | 6,529,702 | | | | — | | | | 6,529,702 | | | | — | |
Money Market Fund | | | 628,002 | | | | 628,002 | | | | — | | | | — | |
| | | | | | | | | | | | | | | | |
Total Investments, at value | | $ | 320,157,548 | | | $ | 310,890,358 | | | $ | 9,267,190 | | | $ | — | |
| | | | | | | | | | | | | | | | |
| | | | |
| | | Total Fair Value at
February 28, 2018 | | | Unadjusted Quoted
Prices in Active
Markets for
Identical
Investments
(Level 1) | | | Significant
Observable
Inputs
(Level 2) | | | Significant
Unobservable
Inputs
(Level 3) | |
Destinations Real Assets Fund | | | | | | | | | | | | | | | | |
Investments, at value | | | | | | | | | | | | | | | | |
Common Stocks: | | | | | | | | | | | | | | | | |
Canada | | $ | 64,401,236 | | | $ | 64,233,004 | | | $ | — | | | $ | 168,232 | |
United Kingdom | | | 835,227 | | | | 835,227 | | | | — | | | | — | |
United States | | | 107,294,122 | | | | 107,294,122 | | | | — | | | | — | |
Exchange Traded Fund (ETF): | | | | | | | | | | | | | | | | |
United States | | | 39,655,046 | | | | 39,655,046 | | | | — | | | | — | |
Short-Term Investments: | | | | | | | | | | | | | | | | |
Time Deposits | | | 10,893,179 | | | | — | | | | 10,893,179 | | | | — | |
Money Market Fund | | | 19,121,905 | | | | 19,121,905 | | | | — | | | | — | |
| | | | | | | | | | | | | | | | |
Total Investments, at value | | $ | 242,200,715 | | | $ | 231,139,304 | | | $ | 10,893,179 | | | $ | 168,232 | |
| | | | | | | | | | | | | | | | |
212
Notes to Financial Statements
(continued)
| | | | | | | | | | | | | | | | |
| | | Total Fair Value at
February 28, 2018 | | | Unadjusted Quoted
Prices in Active
Markets for
Identical
Investments
(Level 1) | | | Significant
Observable Inputs
(Level 2) | | | Significant
Unobservable
Inputs
(Level 3) | |
Destinations Core Fixed Income Fund | | | | | | | | | | | | | | | | |
Investments, at value | | | | | | | | | | | | | | | | |
U.S. Government Agencies & Obligations | | $ | 324,334,149 | | | $ | — | | | $ | 324,334,149 | | | $ | — | |
Mortgage-Backed Securities | | | 323,827,223 | | | | — | | | | 323,827,223 | | | | — | |
Corporate Bonds & Notes | | | 284,541,178 | | | | — | | | | 284,541,178 | | | | — | |
Collateralized Mortgage Obligations | | | 282,347,080 | | | | — | | | | 282,347,080 | | | | — | |
Asset-Backed Securities | | | 167,119,590 | | | | — | | | | 167,119,590 | | | | — | |
Senior Loans | | | 40,419,498 | | | | — | | | | 40,419,498 | | | | — | |
Sovereign Bonds | | | 23,295,324 | | | | — | | | | 23,295,324 | | | | — | |
Municipal Bonds | | | 3,462,508 | | | | — | | | | 3,462,508 | | | | — | |
Short-Term Investments: | | | | | | | | | | | | | | | | |
Time Deposits | | | 154,939,520 | | | | — | | | | 154,939,520 | | | | — | |
Money Market Fund | | | 569,695 | | | | 569,695 | | | | — | | | | — | |
| | | | | | | | | | | | | | | | |
Total Investments, at value | | $ | 1,604,855,765 | | | $ | 569,695 | | | $ | 1,604,286,070 | | | $ | — | |
| | | | | | | | | | | | | | | | |
| | | | |
| | | Total Fair Value at
February 28, 2018 | | | Unadjusted Quoted
Prices in Active
Markets for
Identical
Investments
(Level 1) | | | Significant
Observable Inputs
(Level 2) | | | Significant
Unobservable
Inputs
(Level 3) | |
Destinations Low Duration Fixed Income Fund | | | | | | | | | | | | | | | | |
Investments, at value | | | | | | | | | | | | | | | | |
Corporate Bonds & Notes | | $ | 99,201,941 | | | $ | — | | | $ | 96,425,459 | | | $ | 2,776,482 | |
Asset-Backed Securities | | | 16,322,866 | | | | — | | | | 16,322,866 | | | | — | |
Collateralized Mortgage Obligations | | | 10,985,530 | | | | — | | | | 10,985,530 | | | | — | |
Senior Loans | | | 9,053,525 | | | | — | | | | 9,053,525 | | | | — | |
U.S. Government Obligations | | | 2,738,044 | | | | — | | | | 2,738,044 | | | | — | |
213
Notes to Financial Statements
(continued)
| | | | | | | | | | | | | | | | |
| | | | |
| | | Total Fair Value at
February 28, 2018 | | | Unadjusted Quoted
Prices in Active
Markets for
Identical
Investments
(Level 1) | | | Significant
Observable Inputs
(Level 2) | | | Significant
Unobservable
Inputs
(Level 3) | |
Sovereign Bonds | | $ | 1,845,968 | | | $ | — | | | $ | 1,845,968 | | | $ | — | |
Exchange Traded Fund (ETF) | | | 27,052,119 | | | | 27,052,119 | | | | — | | | | — | |
Short-Term Investments: | | | | | | | | | | | | | | | | |
Time Deposits | | | 9,182,156 | | | | — | | | | 9,182,156 | | | | — | |
Commercial Paper | | | 4,175,310 | | | | — | | | | 4,175,310 | | | | — | |
U.S. Government Obligations | | | 1,791,426 | | | | — | | | | 1,791,426 | | | | — | |
Money Market Fund | | | 2,300,425 | | | | 2,300,425 | | | | — | | | | — | |
| | | | | | | | | | | | | | | | |
Total Investments, at value | | $ | 184,649,310 | | | $ | 29,352,544 | | | $ | 152,520,284 | | | $ | 2,766,482 | ** |
| | | | | | | | | | | | | | | | |
| | | | |
| | | Total Fair Value at
February 28, 2018 | | | Unadjusted Quoted
Prices in Active
Markets for
Identical
Investments
(Level 1) | | | Significant
Observable Inputs
(Level 2) | | | Significant
Unobservable
Inputs
(Level 3) | |
Destinations Global Fixed Income Opportunities Fund | | | | | | | | | | | | | | | | |
Investments, at value | | | | | | | | | | | | | | | | |
Corporate Bonds & Notes: | | | | | | | | | | | | | | | | |
Australia | | $ | 4,992,910 | | | $ | — | | | $ | 4,992,910 | | | $ | — | |
Austria | | | 43,333 | | | | — | | | | 43,333 | | | | — | |
Bermuda | | | 4,560,000 | | | | — | | | | 4,560,000 | | | | — | |
British Virgin Islands | | | 12,549,741 | | | | — | | | | 12,549,741 | | | | — | |
Canada | | | 5,495,970 | | | | — | | | | 5,495,970 | | | | — | |
Cayman Islands | | | 17,758,895 | | | | — | | | | 17,758,895 | | | | — | |
Chile | | | 18,760,737 | | | | — | | | | 18,760,737 | | | | — | |
Colombia | | | 5,914,375 | | | | — | | | | 5,914,375 | | | | — | |
Costa Rica | | | 1,693,320 | | | | — | | | | 1,693,320 | | | | — | |
France | | | 4,414,795 | | | | — | | | | 4,414,795 | | | | — | |
India | | | 13,364,581 | | | | — | | | | 13,364,581 | | | | — | |
Israel | | | 3,602,255 | | | | — | | | | 3,602,255 | | | | — | |
Italy | | | 3,770,719 | | | | — | | | | 3,770,719 | | | | — | |
Luxembourg | | | 7,584,770 | | | | — | | | | 7,584,770 | | | | — | |
Malaysia | | | 16,029,673 | | | | — | | | | 16,029,673 | | | | — | |
Marshall Island | | | 11,062,552 | | | | — | | | | 11,062,552 | | | | — | |
Mauritius | | | 2,565,001 | | | | — | | | | 2,565,001 | | | | — | |
Mexico | | | 15,740,470 | | | | — | | | | 15,740,470 | | | | — | |
214
Notes to Financial Statements
(continued)
| | | | | | | | | | | | | | | | |
| | | | |
| | | Total Fair Value at
February 28, 2018 | | | Unadjusted Quoted
Prices in Active
Markets for
Identical
Investments
(Level 1) | | | Significant
Observable
Inputs
(Level 2) | | | Significant
Unobservable
Inputs
(Level 3) | |
Netherlands | | $ | 5,918,258 | | | $ | — | | | $ | 3,710,008 | | | $ | 2,208,250 | |
Panama | | | 13,577,897 | | | | — | | | | 13,577,897 | | | | — | |
Paraguay | | | 204,644 | | | | — | | | | 204,644 | | | | — | |
Peru | | | 7,225,050 | | | | — | | | | 7,225,050 | | | | — | |
Philippines | | | 3,080,735 | | | | — | | | | 3,080,735 | | | | — | |
Singapore | | | 28,078,261 | | | | — | | | | 28,078,261 | | | | — | |
Sweden | | | 1,084,773 | | | | — | | | | — | | | | 1,084,773 | |
Switzerland | | | 2,432,440 | | | | — | | | | 2,432,440 | | | | — | |
United Kingdom | | | 6,260,913 | | | | — | | | | 6,260,913 | | | | — | |
United States | | | 198,235,828 | * | | | — | | | | 198,235,828 | * | | | — | |
Senior Loans | | | 47,302,077 | | | | — | | | | 45,536,684 | | | | 1,765,393 | |
Sovereign Bonds | | | 44,358,958 | | | | — | | | | 44,358,958 | | | | — | |
Preferred Stocks | | | 11,656,850 | | | | 11,656,850 | | | | | | | | | |
Common Stock | | | 280,975 | | | | 280,975 | | | | — | | | | — | |
Short-Term Investments: | | | | | | | | | | | | | | | | |
Commercial Papers | | | 52,428,855 | | | | — | | | | 52,428,855 | | | | — | |
Time Deposits | | | 40,314,697 | | | | — | | | | 40,314,697 | | | | — | |
Money Market Fund | | | 4,838,084 | | | | 4,838,084 | | | | — | | | | — | |
| | | | | | | | | | | | | | | | |
Total - Investments, at value | | $ | 617,183,392 | * | | $ | 16,775,909 | | | $ | 595,349,067 | * | | $ | 5,058,416 | |
| | | | | | | | | | | | | | | | |
| | | | | | | | | | | | | | | | |
| | | Total Fair Value at
February 28, 2018 | | | Unadjusted Quoted
Prices in Active
Markets for
Identical
Investments
(Level 1) | | | Significant
Observable
Inputs
(Level 2) | | | Significant
Unobservable
Inputs
(Level 3) | |
Destinations Municipal Fixed Income Fund | | | | | | | | | | | | | | | | |
Investments, at value | | | | | | | | | | | | | | | | |
Municipal Bonds | | $ | 153,046,490 | | | $ | — | | | $ | 153,046,490 | | | $ | — | |
Short-Term Investments: | | | | | | | | | | | | | | | | |
Municipal Bonds | | | 52,715,464 | | | | — | | | | 52,715,464 | | | | — | |
Time Deposits | | | 21,795,821 | | | | — | | | | 21,795,821 | | | | — | |
| | | | | | | | | | | | | | | | |
Total Investments, at value | | $ | 227,557,775 | | | $ | — | | | $ | 227,557,775 | | | $ | — | |
| | | | | | | | | | | | | | | | |
215
Notes to Financial Statements
(continued)
| | | | | | | | | | | | | | | | |
| | | | |
| | | Total Fair Value at
February 28, 2018 | | | Unadjusted Quoted
Prices in Active
Markets for
Identical
Investments
(Level 1) | | | Significant
Observable
Inputs
(Level 2) | | | Significant
Unobservable
Inputs
(Level 3) | |
Destinations Multi Strategy Alternatives Fund | | | | | | | | | | | | | | | | |
Investments, at value | | | | | | | | | | | | | | | | |
Corporate Bonds & Notes | | $ | 229,373,277 | * | | $ | 2,112,056 | | | $ | 227,253,189 | | | $ | 8,032 | * |
Senior Loans | | | 99,023,697 | * | | | — | | | | 98,833,822 | | | | 189,875 | * |
Municipal Bonds | | | 7,981,112 | | | | — | | | | 7,981,112 | | | | — | |
U.S. Government Obligation | | | 6,659,608 | | | | — | | | | 6,659,608 | | | | — | |
Open-End Funds | | | 184,641,134 | | | | 184,641,134 | | | | — | | | | — | |
Common Stocks: | | | | | | | | | | | | | | | | |
Basic Materials | | | 10,035,515 | | | | 10,035,515 | | | | — | | | | — | |
Communications | | | 8,710,419 | | | | 8,710,419 | | | | — | | | | — | |
Consumer Cyclical | | | 3,390,992 | | | | 3,390,992 | | | | — | | | | — | |
Consumer Non-cyclical | | | 40,724,248 | | | | 40,724,248 | | | | — | | | | — | |
Diversified | | | 5,453,827 | | | | 5,453,827 | | | | — | | | | — | |
Energy | | | 3,750,208 | * | | | 3,750,208 | | | | — | | | | — | * |
Financial | | | 31,844,409 | | | | 31,844,409 | | | | — | | | | — | |
Industrial | | | 34,364,668 | | | | 34,364,668 | | | | — | | | | — | |
Technology | | | 22,157,479 | | | | 22,157,479 | | | | — | | | | — | |
Closed-End Funds | | | 116,031,027 | | | | 116,031,027 | | | | — | | | | — | |
Preferred Stocks: | | | | | | | | | | | | | | | | |
Financial | | | 3,363,907 | | | | 3,363,907 | | | | — | | | | — | |
Exchange Traded Fund (ETF) | | | 827,174 | | | | 827,174 | | | | — | | | | — | |
Warrants: | | | | | | | | | | | | | | | | |
Diversified | | | 111,117 | | | | 111,117 | | | | — | | | | — | |
Rights | | | 77,982 | | | | 77,982 | | | | — | | | | — | |
Purchased Options | | | 726,839 | | | | 726,839 | | | | — | | | | — | |
Short-Term Investments: | | | | | | | | | | | | | | | | |
Time Deposits | | | 62,932,329 | | | | — | | | | 62,932,329 | | | | — | |
Money Market Fund | | | 17,012,174 | | | | 17,012,174 | | | | — | | | | — | |
| | | | | | | | | | | | | | | | |
Total Investments, at value | | $ | 889,193,142 | * | | $ | 485,335,175 | | | $ | 403,660,060 | | | $ | 197,907 | * |
| | | | | | | | | | | | | | | | |
Other Financial Instruments - Assets | | | | | | | | | | | | | | | | |
Futures Contracts | | $ | 131,601 | | | $ | 131,601 | | | $ | — | | | $ | — | |
Forward Foreign Currency Contracts | | | 148,800 | | | | — | | | | 148,800 | | | | — | |
OTC Total Return Swaps | | | 145,386 | | | | — | | | | 145,386 | | | | — | |
OTC Variance Swaps | | | 1,424,092 | | | | — | | | | 1,424,092 | | | | — | |
| | | | | | | | | | | | | | | | |
Total Other Financial Instruments - Assets | | $ | 1,849,879 | | | $ | 131,601 | | | $ | 1,718,278 | | | $ | — | |
| | | | | | | | | | | | | | | | |
216
Notes to Financial Statements
(continued)
| | | | | | | | | | | | | | | | |
| | | | |
| | | Total Fair Value at
February 28, 2018 | | | Unadjusted Quoted
Prices in Active
Markets for
Identical
Investments
(Level 1) | | | Significant
Observable
Inputs
(Level 2) | | | Significant
Unobservable
Inputs
(Level 3) | |
Other Financial Instruments - Liabilities | | | | | | | | | | | | | | | | |
Options Contracts Written | | $ | (2,550,110 | ) | | $ | (2,550,110 | ) | | $ | — | | | $ | — | |
Futures Contract | | | (14,297 | ) | | | (14,297 | ) | | | — | | | | — | |
OTC Credit Default Swaps | | | (27,872 | ) | | | — | | | | (27,872 | ) | | | — | |
OTC Total Return Swaps on Baskets | | | (83,857 | ) | | | — | | | | (83,857 | ) | | | — | |
OTC Total Return Swaps | | | (20,849 | ) | | | — | | | | (20,849 | ) | | | — | |
OTC Variance Swaps | | | (1,275,621 | ) | | | — | | | | (1,275,621 | ) | | | — | |
Securities Sold Short: | | | | | | | | | | | | | | | | |
Corporate Bonds & Notes | | | (4,707,950 | ) | | | — | | | | (4,707,950 | ) | | | — | |
Exchange Traded Funds (ETFs) | | | (22,539,211 | ) | | | (22,539,211 | ) | | | — | | | | — | |
Common Stocks | | | (16,153,755 | ) | | | (16,153,755 | ) | | | — | | | | — | |
| | | | | | | | | | | | | | | | |
Total Other Financial Instruments - Liabilities | | $ | (47,373,522 | ) | | $ | (41,257,373 | ) | | $ | (6,116,149 | ) | | $ | — | |
| | | | | | | | | | | | | | | | |
| * | Includes securities that are fair valued by the Board at $0. |
| ** | The following table summarizes the valuation technique used and unobservable input approved by the Valuation Committee to determine the fair value of certain, material Level 3 investments. |
| | | | | | | | | | | | | | |
| | | | |
| | | Fair Value at
February 28, 2018 | | | Valuation technique | | Unobservable Input | | | Range | |
Corporate Bonds | | $ | 2,766,482 | | | Indicative Market
Quotation | | | Single Broker Quote | | | $ | 98.50-$100.25 | |
The level classification by major category of investments is the same as the category presentation in the Schedules of Investments.
During the period ended February 28, 2018 there were no transfers between levels.
217
Notes to Financial Statements
(continued)
The following is a reconciliation of assets for which significant unobservable inputs (Level 3) were used in determining fair value during the period March 20, 2017 through February 28, 2018:
| | | | | | | | | | | | | | | | | | | | |
| | | Total | | | Common
Stocks | | | Corporate
Bonds &
Notes | | | Preferred
Stocks | | | Senior
Loans | |
Destinations Large Cap Equity Fund | | | | | | | | | | | | | | | | | | | | |
Balance as of March 20, 2017* | | $ | — | | | $ | — | | | $ | — | | | $ | — | | | $ | — | |
Purchases | | | 406,539 | | | | — | | | | — | | | | 406,539 | | | | — | |
(Sales/Paydowns) | | | — | | | | — | | | | — | | | | — | | | | — | |
Total realized gain (loss) | | | — | | | | — | | | | — | | | | — | | | | — | |
Change in unrealized appreciation (depreciation) | | | — | | | | — | | | | — | | | | — | | | | — | |
Transfers In | | | — | | | | — | | | | — | | | | — | | | | — | |
Transfers Out | | | — | | | | — | | | | — | | | | — | | | | — | |
| | | | | | | | | | | | | | | | | | | | |
Balance as of February 28, 2018 | | $ | 406,539 | | | $ | — | | | $ | — | | | $ | 406,539 | | | $ | — | |
| | | | | | | | | | | | | | | | | | | | |
Change in unrealized appreciation (depreciation) from Investments held as of February 28, 2018 | | $ | — | | | $ | — | | | $ | — | | | $ | — | | | $ | — | |
| | | | | | | | | | | | | | | | | | | | |
Destinations International Equity Fund | | | | | | | | | | | | | | | | | | | | |
Balance as of March 20, 2017* | | $ | — | | | $ | — | | | $ | — | | | $ | — | | | $ | — | |
Purchases | | | — | ** | | | — | ** | | | — | | | | — | | | | — | |
(Sales/Paydowns) | | | — | | | | — | | | | — | | | | — | | | | — | |
Total realized gain (loss) | | | — | | | | — | | | | — | | | | — | | | | — | |
Change in unrealized appreciation (depreciation) | | | — | | | | — | | | | — | | | | — | | | | — | |
Transfers In | | | — | | | | — | | | | — | | | | — | | | | — | |
Transfers Out | | | — | | | | — | | | | — | | | | — | | | | — | |
| | | | | | | | | | | | | | | | | | | | |
Balance as of February 28, 2018 | | $ | — | ** | | $ | — | ** | | $ | — | | | $ | — | | | $ | — | |
| | | | | | | | | | | | | | | | | | | | |
Change in unrealized appreciation (depreciation) from Investments held as of February 28, 2018 | | $ | — | | | $ | — | | | $ | — | | | $ | — | | | $ | — | |
| | | | | | | | | | | | | | | | | | | | |
Destinations Real Assets Fund | | | | | | | | | | | | | | | | | | | | |
Balance as of March 20, 2017* | | $ | — | | | $ | — | | | $ | — | | | $ | — | | | $ | — | |
Purchases | | | 201,123 | | | | 201,123 | | | | — | | | | — | | | | — | |
(Sales/Paydowns) | | | — | | | | — | | | | — | | | | — | | | | — | |
Total realized gain (loss) | | | — | | | | — | | | | — | | | | — | | | | — | |
Change in unrealized appreciation (depreciation) | | | (32,891 | ) | | | (32,891 | ) | | | — | | | | — | | | | — | |
Transfers In | | | — | | | | — | | | | — | | | | — | | | | — | |
Transfers Out | | | — | | | | — | | | | — | | | | — | | | | — | |
| | | | | | | | | | | | | | | | | | | | |
Balance as of February 28, 2018 | | $ | 168,232 | | | $ | 168,232 | | | $ | — | | | $ | — | | | $ | — | |
| | | | | | | | | | | | | | | | | | | | |
Change in unrealized appreciation (depreciation) from Investments held as of February 28, 2018 | | $ | (32,891 | ) | | $ | (32,891 | ) | | $ | — | | | $ | — | | | $ | — | |
| | | | | | | | | | | | | | | | | | | | |
218
Notes to Financial Statements
(continued)
| | | | | | | | | | | | | | | | | | | | |
| | | Total | | | Common
Stocks | | | Corporate
Bonds &
Notes | | | Preferred
Stocks | | | Senior
Loans | |
Destinations Low Duration Fixed Income Fund | | | | | | | | | | | | | | | | | | | | |
Balance as of March 20, 2017* | | $ | — | | | $ | — | | | $ | — | | | $ | — | | | $ | — | |
Purchases | | | 2,864,151 | | | | — | | | | 2,864,151 | | | | — | | | | — | |
(Sales/Paydowns) | | | — | | | | — | | | | — | | | | — | | | | — | |
Total realized gain (loss) | | | — | | | | — | | | | — | | | | — | | | | — | |
Change in unrealized appreciation (depreciation) | | | (97,669 | ) | | | — | | | | (97,669 | ) | | | — | | | | — | |
Transfers In | | | — | | | | — | | | | — | | | | — | | | | — | |
Transfers Out | | | — | | | | — | | | | — | | | | — | | | | — | |
| | | | | | | | | | | | | | | | | | | | |
Balance as of February 28, 2018 | | $ | 2,766,482 | | | $ | — | | | $ | 2,766,482 | | | $ | — | | | $ | — | |
| | | | | | | | | | | | | | | | | | | | |
Change in unrealized appreciation (depreciation) from Investments held as of February 28, 2018 | | $ | (97,669 | ) | | $ | — | | | $ | (97,669 | ) | | $ | — | | | $ | — | |
| | | | | | | | | | | | | | | | | | | | |
Destinations Global Fixed Income Opportunities Fund | | | | | | | | | | | | | | | | | | | | |
Balance as of March 20, 2017* | | $ | — | | | $ | — | | | $ | — | | | $ | — | | | $ | — | |
Purchases | | | 4,953,606 | | | | — | | | | 3,300,530 | | | | — | | | | 1,653,076 | |
(Sales/Paydowns) | | | — | | | | — | | | | — | | | | — | | | | — | |
Accrued Discounts (premiums) | | | 633 | | | | — | | | | 633 | | | | — | | | | — | |
Total realized gain (loss) | | | — | | | | — | | | | — | | | | — | | | | — | |
Change in unrealized appreciation (depreciation) | | | 104,177 | | | | — | | | | (8,140 | ) | | | — | | | | 112,317 | |
Transfers In | | | — | | | | — | | | | — | | | | — | | | | — | |
Transfers Out | | | — | | | | — | | | | — | | | | — | | | | — | |
| | | | | | | | | | | | | | | | | | | | |
Balance as of February 28, 2018 | | $ | 5,058,416 | | | $ | — | | | $ | 3,293,023 | | | $ | — | | | $ | 1,765,393 | |
| | | | | | | | | | | | | | | | | | | | |
Change in unrealized appreciation (depreciation) from Investments held as of February 28, 2018 | | $ | 104,177 | | | $ | — | | | $ | (8,140 | ) | | $ | — | | | $ | 112,317 | |
| | | | | | | | | | | | | | | | | | | | |
Destinations Multi Strategy Alternatives Fund | | | | | | | | | | | | | | | | | | | | |
Balance as of March 20, 2017* | | $ | — | | | $ | — | | | $ | — | | | $ | — | | | $ | — | |
Purchases | | | 1,225,174 | ** | | | — | ** | | | 160,647 | ** | | | — | | | | 1,064,527 | ** |
(Sales/Paydowns) | | | (933 | ) | | | — | | | | — | | | | — | | | | (933 | ) |
Total realized gain (loss) | | | 933 | | | | — | | | | — | | | | — | | | | 933 | |
Change in unrealized appreciation (depreciation) | | | (1,027,267 | ) | | | — | | | | (152,615 | ) | | | — | | | | (874,652 | ) |
Transfers In | | | — | | | | — | | | | — | | | | — | | | | — | |
Transfers Out | | | — | | | | — | | | | — | | | | — | | | | — | |
| | | | | | | | | | | | | | | | | | | | |
Balance as of February 28, 2018 | | $ | 197,907 | ** | | $ | — | ** | | $ | 8,032 | ** | | $ | — | | | $ | 189,875 | ** |
| | | | | | | | | | | | | | | | | | | | |
Change in unrealized appreciation (depreciation) from Investments held as of February 28, 2018 | | $ | (1,027,267 | ) | | $ | — | | | $ | (152,615 | ) | | $ | — | | | $ | (874,652 | ) |
| | | | | | | | | | | | | | | | | | | | |
| ** | Includes securities that are fair valued at $0. |
219
Notes to Financial Statements
(continued)
4. Accounting for Derivative Instruments
Certain Funds may use derivative instruments including futures, options, forward foreign currency contracts, swaptions and swap contracts as part of their investment strategies. All open derivative positions at period end for each Fund are disclosed in the Fund’s Schedule of Investments. The following is a description of these derivative instruments, including the primary underlying risk exposures related to each instrument type:
| | (a) | Futures Contracts. Certain Funds may enter into futures contracts, to the extent permitted by their investment policies and objectives, for bonafide hedging and other permissible risk management purposes including protecting against anticipated changes in the value of securities a Fund intends to purchase. Upon entering into a futures contract, a Fund is required to deposit cash or securities as initial margin. Additional securities are also segregated as collateral up to the current market value of the futures contracts. Subsequent payments, known as variation margin, are made or received by the Fund, depending on the fluctuation in the value of the underlying financial instruments. The Fund recognizes an unrealized gain or loss equal to the variation margin. When futures contracts are closed, a realized gain or loss is recognized which is equal to the difference between the proceeds from (or cost of) the closing transactions and the Fund’s basis in the contracts. |
The risks associated with entering into futures contracts include the possibility that a change in the value of the contract may not correlate with the changes in the value of the underlying instruments. In addition, investing in futures contracts involves the risk that the Fund could lose more than the original margin deposit due to subsequent payments that may be required for a futures transaction.
| | (b) | Options Written. Certain Funds may write options to manage exposure to certain changes in the market. When a Fund writes an option, an amount equal to the premium received by the Fund is recorded as a liability, the value of which is marked-to-market daily to reflect the current market value of the option written. If the option expires, the Fund realizes a gain from investments equal to the amount of the premium received. When a written call option is exercised, the premium received is added to the proceeds from the sale of the underlying security in determining whether the Fund has a realized gain or loss. When a written put option is exercised, the amount of the premium received reduces the cost of the security purchased by the Fund. |
When writing a covered call option, a Fund may forego the opportunity of profit if the market price of the underlying security increases more than the premium received and the option is exercised. When writing a put option, a Fund may incur a loss if the market price of the underlying security decreases more than the premium received and the option is exercised. In addition, there is the risk that the Fund may not be able to enter into a closing transaction because of an illiquid secondary market.
| | (c) | Purchased Options. Certain Funds may purchase options to manage exposure to certain changes in the market. A Fund will normally purchase call options in anticipation of an increase in the market value of securities of the type in which they may invest, an amount equal to the value is recorded as an asset. The purchase of a call option will entitle a Fund, in return for the premium paid, to purchase specified securities at a specified price during the option period. A Fund will ordinarily realize a gain if, during the option period, the value of such securities exceeded the sum of the exercise price, the premium paid and transaction costs; otherwise, the Fund will realize a loss equal to the amount of the premium paid on the purchase of the call option. |
A Fund will normally purchase put options in anticipation of a decline in the market value of securities in its portfolio (“protective puts”) or in securities in which it may invest. The purchase of a put option will entitle the Fund, in exchange for the premium paid, to sell specified securities at a specified price during the option period. The purchase of protective puts is designed to offset or hedge against a decline in the market value of the Fund’s securities. Put options may also be purchased by a Fund for the purpose of affirmatively benefiting from a decline in the price of securities which it does not own.
220
Notes to Financial Statements
(continued)
The Fund will ordinarily realize a gain if, during the option period, the value of the underlying securities decreased below the exercise price sufficiently to more than cover the premium and transaction costs; otherwise the Fund will realize a loss equal to the amount of the premium paid on the purchase of the put option. Gains and losses on the purchase of protective put options would tend to be offset by countervailing changes in the value of the underlying portfolio securities.
| | (d) | Forward Foreign Currency Contracts. Certain Funds may enter into forward foreign currency contracts to hedge against foreign currency exchange rate risk on their non-U.S. dollar denominated securities or to facilitate settlement of foreign currency denominated portfolio transactions. A forward foreign currency contract is an agreement between two parties to buy and sell a currency at a set price on a future date. The contract is marked-to-market daily and the change in value is recorded by a Fund as an unrealized gain or loss. When a forward foreign currency contract is extinguished, through either delivery or offset by entering into another forward foreign currency contract, the Fund records a realized gain or loss equal to the difference between the value of the contract at the time it was opened and the value of the contract at the time it was extinguished. |
Forward foreign currency contracts involve elements of market risk in excess of the amounts reflected in the Statements of Assets and Liabilities. The Fund bears the risk of an unfavorable change in the foreign exchange rate underlying the forward foreign currency contract. Risks may also arise upon entering into these contracts from the potential inability of the counterparties to meet the terms of their contracts.
| | (e) | Swaptions. Swaptions contracts entered into by the Funds typically represent an option that gives the purchaser the right, but not the obligation, to enter into a swap contract on a future date. Certain Funds may purchase swaptions to manage exposure to fluctuations in interest rates and to enhance portfolio yield. Changes in the value of purchased swaptions are reported as net change in unrealized appreciation or depreciation on the Statements of Operations and Changes in Net Assets Gain or loss is recognized when the swaptions contract expires or is closed as net realized gain or loss on the Statements of Operations and changes in Net Assets. Details of purchased swaptions contracts held at period end are included on the Fund’s Schedule of Investments under the caption “Purchased Options”. |
Certain Funds may write swaption contracts to manage exposure to fluctuations in interest rates and to enhance portfolio yield. Swaption contracts written by a Fund represent an option that obligates the writer upon exercise by the purchaser, to enter into a previously agreed upon swap contract on a future date. If a written call swaption is exercised, the writer will enter into a swap and is obligated to pay the fixed rate and receive a floating rate in exchange. If a written put swaption is exercised, the writer will enter a swap and is obligated to pay the floating rate and receive a fixed rate in exchange.
When a Fund writes a swaption, the premium received is recorded as a liability in the Statements of Assets and Liabilities and is subsequently adjusted to the current market value of the swaption. Changes in the value of the swaption are reported as unrealized gains or losses in the Statements of Operations. A gain or loss is recognized when the swaption contract expires or is closed. Premiums received from writing swaptions that expire or are exercised are treated by the Fund as realized gains from investments. The difference between the premium and the amount paid on effecting a closing purchase transaction is also treated as a realized gain or, if the premium received is less than the amount paid for the closing purchase, as a realized loss.
Entering into a swaption contract involves, to varying degrees, the elements of credit, market and interest rate risk, associated with both option contracts and swap contracts. To reduce credit risk from potential counterparty default, a Fund only enters into swaption contracts with counterparties that meet certain standards of creditworthiness. A Fund bears the market risk arising from any change in index values or interest rates.
221
Notes to Financial Statements
(continued)
| | (f) | Swap Contracts. Swaps involve the exchange by a Fund with another party of the respective amounts payable with respect to a notional principal amount related to one or more indices. Certain Funds may enter into these transactions to preserve a return or spread on a particular investment or portion of its assets, as a duration management technique or to protect against any increase in the price of securities the Fund anticipates purchasing at a later date. Certain Funds may also use these transactions for speculative purposes, such as to obtain the price performance of a security without actually purchasing the security in circumstances where, for example, the subject security is illiquid, is unavailable for direct investment or available only on less attractive terms. |
Swaps are marked-to-market daily based upon quotations from market makers and the change, if any, is recorded as change in unrealized appreciation or depreciation in the Statements of Operations. Net receipts or payments of interest are recorded as realized gains or losses, respectively. Gains and losses are realized upon termination of a swap contract. An upfront payment received by the Fund is recorded as a liability on the Fund’s books. An upfront payment made by the Fund is recorded as an asset on the Fund’s books. Any upfront payments paid or received upon entering a swap contract to compensate for differences between stated terms of the agreement and prevailing market conditions (e.g. credit spreads, interest rates or other factors) are recorded as a realized gain or loss at the termination of the swap.
Swaps have risks associated with them, including possible default by the counterparty to the transaction, illiquidity and, where swaps are used as hedges, the risk that the use of a swap could result in losses greater than if the swap had not been employed. This risk is mitigated by the posting of collateral by the counterparty to the Fund to cover the Fund’s exposure to the counterparty.
| | i. | Credit Default Swaps. Certain Funds may enter into credit default swap contracts for investment purposes, to manage their credit risk or to add leverage. As a seller in a credit default swap contract, a Fund is required to pay the notional or other agreed-upon value to the counterparty in the event of a default by a third party, such as a U.S. or foreign corporate issuer, on the referenced debt obligation. In return, the Fund receives from the counterparty a periodic stream of payments over the term of the contract provided that no event of default has occurred. If no default occurs, the Fund keeps the stream of payments and has no payment obligations. Such periodic payments are accrued daily and accounted for as realized gains. |
Certain Funds may also purchase credit default swap contracts in order to hedge against the risk of default by debt securities held in their portfolios. In these cases a Fund functions as the counterparty referenced in the preceding paragraph. As a purchaser of a credit default swap contract, the Fund receives the notional or other agreed upon value from the counterparty in the event of a default by a third party, such as a U.S. or foreign corporate issuer, on the referenced debt obligation. In return, the Fund makes periodic payments to the counterparty over the term of the contract provided no event of default has occurred. Such periodic payments are accrued daily and accounted for as realized losses.
For a credit default swap sold by a Fund, payment of the agreed upon amount made by the Fund in the event of default of the referenced debt obligation is recorded as the cost of the referenced debt obligation received. For a credit default swap purchased by a Fund, the agreed upon amount received by the Fund in the event of default of the referenced debt obligation is recorded as proceeds from sale/delivery of the referenced debt obligation and the resulting gain or loss realized on the referenced debt obligation is recorded as such by the Fund.
Entering into credit default swaps involves, to varying degrees, elements of credit and market risk in excess of the related amounts recognized on the Statements of Assets and Liabilities. Such risks involve the possibility that there will be no liquid market for these agreements, that the counterparty to the agreements may default on its obligation to perform or disagree as to the meaning of the contractual terms in the agreements, and that there will be unfavorable changes in
222
Notes to Financial Statements
(continued)
net interest rates. As privately negotiated transactions, swaps may involve risk, which is the risk that the swap contracts fail to contemplate a particular outcome or that the parties disagree about the proper interpretation of a transaction term.
| | ii. | Interest Rate Swaps. Certain Funds may enter into interest rate swaps for investment purposes to manage exposure to fluctuations in interest rates or to add leverage. Interest rate swaps represent an agreement between two counterparties to exchange cash flows based on the difference in the fixed interest rate and the floating interest rate, applied to the notional principal amount for a specified period. The payment flows are usually netted against each other, with the difference being paid by one party to the other. Once the payments are settled in cash, the net amount is recorded as realized gain or loss from swap contracts on the Statements of Operations. The Funds settle accrued net receivable or payable under the swap contracts on a periodic basis. |
The primary risk associated with interest rate swaps is that unfavorable changes in interest rates could adversely impact a Fund.
| | iii. | Cross-Currency Swaps. Certain Funds may enter into cross-currency swaps to gain or mitigate exposure to currency risk. Cross-currency swaps involve two parties exchanging two different currencies with an agreement to reverse the exchange at a later date at specific exchange rates. The exchange of currencies at the inception date of the contract takes place at the current spot rate. The re-exchange at maturity may take place at the same exchange rate, a specified rate, or the then current spot rate. Interest payments, if applicable, are made between the parties based on interest rates available in the two currencies at the inception of the contract. The terms of cross-currency swap contracts may extend for many years. Cross-currency swaps are usually negotiated with commercial and investment banks. Some cross-currency swaps may not provide for exchanging principal cash flows, but only for exchanging interest cash flows. |
| | iv. | Total Return Swaps. Certain Funds may enter into total return swaps to gain exposure and benefit from reference asset (single asset, or a basket of assets) without actually having to own it. Total return swaps are agreements where the total return of a reference asset is paid in exchange for periodic cash flows, either fixed or variable, and typically a floating rate such as LIBOR +/- a basis point spread. The deal is structured such that the total return (asset income plus capital appreciation/depreciation) is exchanged, in the cash flows. Periodic payments received or made by the Fund are recorded as realized gain or loss from swap contracts on the Statement of Operations. |
| | v. | Variance Swaps. Certain Funds may enter into variance swaps to hedge equity market risk or adjust exposure to the equity markets. Variance swaps are contracts in which two parties agree to exchange cash payments based on the difference between the stated level of variance and the actual variance realized on underlying asset(s) or index(es). Actual “variance” as used here is defined as the sum of the square of the returns on the reference asset(s) or index(es) (which in effect is a measure of its “volatility”) over the length of the contract term. So the parties to a variance swap can be said to exchange actual volatility for a contractually stated rate of volatility. |
223
Notes to Financial Statements
(continued)
The following is a summary of the fair valuations of the Funds’ derivative instruments categorized by risk exposure at February 28, 2018:
Destinations Large Cap Equity Fund
Fair Values of Derivative Instruments on the Statements of Assets and Liabilities as of February 28, 2018
| | | | | | | | | | | | | | | | | | | | |
Location | | Interest rate
risk | | | Foreign
exchange
risk | | | Credit
risk | | | Equity
risk | | | Total | |
Asset derivatives | | | | | | | | | | | | | | | | | | | | |
Unrealized appreciation on open futures contracts (a) | | $ | — | | | $ | — | | | $ | — | | | $ | 137,679 | | | $ | 137,679 | |
| | | | | | | | | | | | | | | | | | | | |
| | $ | — | | | $ | — | | | $ | — | | | $ | 137,679 | | | $ | 137,679 | |
| | | | | | | | | | | | | | | | | | | | |
Effect of Derivative Instruments on the Statements of Operations of February 28, 2018
| | | | | | | | | | | | | | | | | | | | |
Location | | Interest rate
risk | | | Foreign
exchange
risk | | | Credit
risk | | | Equity
risk | | | Total | |
Realized gain/(loss) on derivatives recognized in income (b) | |
Net realized gain (loss) on futures contracts | | $ | — | | | $ | — | | | $ | — | | | $ | 4,214,522 | | | $ | 4,214,522 | |
| | | | | | | | | | | | | | | | | | | | |
| | $ | — | | | $ | — | | | $ | — | | | $ | 4,214,522 | | | $ | 4,214,522 | |
| | | | | | | | | | | | | | | | | | | | |
Change in unrealized appreciation (depreciation) on derivatives recognized in income (c) | |
Net change in unrealized appreciation (depreciation) on futures contracts | | $ | — | | | $ | — | | | $ | — | | | $ | 137,679 | | | $ | 137,679 | |
| | | | | | | | | | | | | | | | | | | | |
| | $ | — | | | $ | — | | | $ | — | | | $ | 137,679 | | | $ | 137,679 | |
| | | | | | | | | | | | | | | | | | | | |
Destinations International Equity Fund
Fair Values of Derivative Instruments on the Statements of Assets and Liabilities as of February 28, 2018
| | | | | | | | | | | | | | | | | | | | |
Location | | Interest rate
risk | | | Foreign
exchange
risk | | | Credit
risk | | | Equity
risk | | | Total | |
Asset derivatives | | | | | | | | | | | | | |
Unrealized appreciation on forward foreign currency contracts (d) | | $ | — | | | $ | 23,364 | | | $ | — | | | $ | — | | | $ | 23,364 | |
| | | | | | | | | | | | | | | | | | | | |
| | $ | — | | | $ | 23,364 | | | $ | — | | | $ | — | | | $ | 23,364 | |
| | | | | | | | | | | | | | | | | | | | |
Liability derivatives | | | | | | | | | | | | | |
Unrealized depreciation on forward foreign currency contracts (e) | | $ | — | | | $ | 88,319 | | | $ | — | | | $ | — | | | $ | 88,319 | |
| | | | | | | | | | | | | | | | | | | | |
| | $ | — | | | $ | 88,319 | | | $ | — | | | $ | — | | | $ | 88,319 | |
| | | | | | | | | | | | | | | | | | | | |
224
Notes to Financial Statements
(continued)
Effect of Derivative Instruments on the Statements of Operations of February 28, 2018
| | | | | | | | | | | | | | | | | | | | |
Location | | Interest rate
risk | | | Foreign
exchange
risk | | | Credit
risk | | | Equity
risk | | | Total | |
Realized gain/(loss) on derivatives recognized in income (b) | | | | | |
Net realized gain (loss) on forward foreign currency contracts | | $ | — | | | $ | (137,403 | ) | | $ | — | | | $ | — | | | $ | (137,403 | ) |
| | | | | | | | | | | | | | | | | | | | |
| | $ | — | | | $ | (137,403 | ) | | $ | — | | | $ | — | | | $ | (137,403 | ) |
| | | | | | | | | | | | | | | | | | | | |
Change in unrealized appreciation (depreciation) on derivatives recognized in income (c) | |
Net change in unrealized appreciation (depreciation) on forward foreign currency contracts | | $ | — | | | $ | (64,955 | ) | | $ | — | | | $ | — | | | $ | (64,955 | ) |
| | | | | | | | | | | | | | | | | | | | |
| | $ | — | | | $ | (64,955 | ) | | $ | — | | | $ | — | | | $ | (64,955 | ) |
| | | | | | | | | | | | | | | | | | | | |
Destinations Real Assets Fund
Effect of Derivative Instruments on the Statements of Operations of February 28, 2018
| | | | | | | | | | | | | | | | | | | | |
Location | | Interest rate
risk | | | Foreign
exchange
risk | | | Credit
risk | | | Equity
risk | | | Total | |
Realized gain/(loss) on derivatives recognized in income (b) | | | | | |
Net realized gain (loss) on forward foreign currency contracts | | $ | — | | | $ | (33,943 | ) | | $ | — | | | $ | — | | | $ | (33,943 | ) |
| | | | | | | | | | | | | | | | | | | | |
| | $ | — | | | $ | (33,943 | ) | | $ | — | | | $ | — | | | $ | (33,943 | ) |
| | | | | | | | | | | | | | | | | | | | |
Destinations Multi Strategy Alternatives Fund
Fair Values of Derivative Instruments on the Statements of Assets and Liabilities as of February 28, 2018
| | | | | | | | | | | | | | | | | | | | |
Location | | Interest rate
risk | | | Foreign
exchange
risk | | | Credit
risk | | | Equity
risk | | | Total | |
Asset derivatives | | | | | | | | | | | | | | | | | | | | |
Purchased options (d) | | $ | — | | | $ | — | | | $ | — | | | $ | 726,839 | | | $ | 726,839 | |
Unrealized appreciation on open futures contracts (a) | | | 131,601 | | | | — | | | | — | | | | — | | | | 131,601 | |
Unrealized appreciation on forward foreign currency contracts (d) | | | — | | | | 148,800 | | | | — | | | | — | | | | 148,800 | |
Unrealized appreciation on open swaps (d) | | | — | | | | 145,386 | | | | — | | | | 1,424,092 | | | | 1,569,478 | |
| | | | | | | | | | | | | | | | | | | | |
| | $ | 131,601 | | | $ | 294,186 | | | $ | — | | | $ | 2,150,931 | | | $ | 2,576,718 | |
| | | | | | | | | | | | | | | | | | | | |
Liability derivatives | | | | | | | | | | | | | | | | | | | | |
Options contracts written outstanding (e) | | $ | — | | | $ | — | | | $ | — | | | $ | 2,550,110 | | | $ | 2,550,110 | |
Unrealized depreciation on open futures contracts (a) | | | 14,297 | | | | — | | | | — | | | | — | | | | 14,297 | |
Unrealized depreciation on open swaps (e) | | | — | | | | 20,849 | | | | 27,872 | | | | 1,359,478 | | | | 1,408,199 | |
| | | | | | | | | | | | | | | | | | | | |
| | $ | 14,297 | | | $ | 20,849 | | | $ | 27,872 | | | $ | 3,909,588 | | | $ | 3,972,606 | |
| | | | | | | | | | | | | | | | | | | | |
225
Notes to Financial Statements
(continued)
Effect of Derivative Instruments on the Statements of Operations of February 28, 2018
| | | | | | | | | | | | | | | | | | | | |
Location | | Interest rate
risk | | | Foreign
exchange
risk | | | Credit
risk | | | Equity
risk | | | Total | |
Realized gain/(loss) on derivatives recognized in income (b) | |
Net realized gain (loss) on purchased options | | $ | — | | | $ | — | | | $ | — | | | $ | (19,403 | ) | | $ | (19,403 | ) |
Net realized gain (loss) on futures contracts | | | 2,817,707 | | | | — | | | | — | | | | (174,104 | ) | | | 2,643,603 | |
Net realized gain (loss) on forward foreign currency contracts. | | | — | | | | (610,261 | ) | | | — | | | | — | | | | (610,261 | ) |
Net realized gain (loss) on swap contracts | | | — | | | | — | | | | (108,306 | ) | | | 747,951 | | | | 639,645 | |
| | | | | | | | | | | | | | | | | | | | |
| | $ | 2,817,707 | | | $ | (610,261 | ) | | $ | (108,306 | ) | | $ | 554,444 | | | $ | 2,653,584 | |
| | | | | | | | | | | | | | | | | | | | |
Change in unrealized appreciation (depreciation) on derivatives recognized in income (c) | |
Net change in unrealized appreciation (depreciation) on purchased options | | $ | — | | | $ | — | | | $ | — | | | $ | 143,410 | | | $ | 143,410 | |
Net change in unrealized appreciation (depreciation) on options contracts written | | | — | | | | — | | | | — | | | | (1,545,835 | ) | | | (1,545,835 | ) |
Net change in unrealized appreciation (depreciation) on futures contracts | | | 117,304 | | | | — | | | | — | | | | — | | | | 117,304 | |
Net change in unrealized appreciation (depreciation) on forward foreign currency contracts | | | — | | | | 148,800 | | | | — | | | | — | | | | 148,800 | |
Net change in unrealized appreciation (depreciation) on swap contracts | | | — | | | | 124,537 | | | | (27,872 | ) | | | 64,614 | | | | 161,279 | |
| | | | | | | | | | | | | | | | | | | | |
| | $ | 117,304 | | | $ | 273,337 | | | $ | (27,872 | ) | | $ | (1,337,811 | ) | | $ | (975,042 | ) |
| | | | | | | | | | | | | | | | | | | | |
| (a) | Only variation margin, if any, is reported within the Statements of Assets and Liabilities. Cumulative appreciation (depreciation) on futures contracts is reported in the “Open Futures Contracts” table. |
| (b) | Statements of Operations location: Net realized gain (loss) from investments, foreign currency transactions, futures contracts, options contracts written or swap contracts. |
| (c) | Statements of Operations location: Change in net unrealized appreciation (depreciation) from investments, foreign currency transactions, futures contracts, options contracts written or swap contracts. |
| (d) | Statements of Assets and Liabilities location: Investments, at value or unrealized appreciation on open forward foreign currency contracts or open swap contracts, at value. |
| (e) | Statements of Assets and Liabilities location: Unrealized depreciation on open forward foreign currency contracts, swap contracts, at value or options contracts written, at value. |
The average notional amounts of futures contracts, swaps contracts, forward foreign currency contracts, and the average market value of purchased options and options contracts written during the period ended February 28, 2018 were as follows:
Destinations Large Cap Equity Fund
| | | | | | | | | | | | | | | | | | | | |
| | | Interest rate
risk | | | Foreign
exchange
risk | | | Credit
risk | | | Equity
risk | | | Total | |
Futures contracts | | $ | — | | | $ | — | | | $ | — | | | $ | 20,617,973 | | | $ | 20,617,973 | |
226
Notes to Financial Statements
(continued)
Destinations International Equity Fund
| | | | | | | | | | | | | | | | | | | | |
| | | Interest rate
risk | | | Foreign
exchange
risk | | | Credit
risk | | | Equity
risk | | | Total | |
Forward foreign currency contracts | | $ | — | | | $ | 13,813,563 | | | $ | — | | | $ | — | | | $ | 13,813,563 | |
Destinations Real Assets Fund
| | | | | | | | | | | | | | | | | | | | |
| | | Interest rate
risk | | | Foreign
exchange
risk | | | Credit
risk | | | Equity
risk | | | Total | |
Forward foreign currency contracts | | $ | — | | | $ | 723,738 | | | $ | — | | | $ | — | | | $ | 723,738 | |
Destinations Multi Strategy Alternatives Fund
| | | | | | | | | | | | | | | | | | | | |
| | | Interest rate
risk | | | Foreign
exchange
risk | | | Credit
risk | | | Equity
risk | | | Total | |
Purchased options | | $ | — | | | $ | — | | | $ | — | | | $ | 440,021 | | | $ | 440,021 | |
Option contracts written | | | — | | | | — | | | | — | | | | 1,716,679 | | | | 1,716,679 | |
Futures contracts | | | 79,755,140 | | | | — | | | | — | | | | 4,601,409 | | | | 84,356,549 | |
Forward foreign currency contracts | | | — | | | | 10,136,763 | | | | — | | | | — | | | | 10,136,763 | |
Swap contracts | | | 4,728,770 | | | | — | | | | 2,741,111 | | | | 35,992,035 | | | | 43,461,916 | |
5. Accounting for Other Instruments
| | (a) | Stripped Securities. Certain Funds may invest in “Stripped Securities”, a term used collectively for stripped fixed income securities. Stripped Securities can be principal-only securities (“PO”), which are debt obligations that have been stripped of interest coupons, or interest-only securities (“IO”), which are interest coupons that have been stripped from debt obligations. As is the case with all securities, the market value of Stripped Securities will fluctuate in response to changes in economic conditions, interest rates and the market’s perception of the securities. However, fluctuations in response to interest rates may be greater in Stripped Securities than for debt obligations of comparable maturities that pay interest currently. The amount of fluctuation increases with a longer period of maturity. The yield-to-maturity on an IO is sensitive to the rate of principal repayments (including prepayments) on the related underlying debt obligation and principal payments may have a material effect on yield to maturity. If the underlying debt obligation experiences greater than anticipated prepayments of principal, the Fund may not fully recoup its initial investment in the IO. |
| | (b) | Time Deposits. Certain Funds may purchase overnight time deposits issued by offshore branches of U.S. banks that meet credit and risk standards established by the custodian and approved by the Board. |
| | (c) | Lending of Portfolio Securities. The Trust has an agreement with its custodian, whereby the custodian, as agent, may lend securities owned by the Funds to brokers, dealers and other financial organizations that have been approved as borrowers by the Funds. The custodian enters into agreements with the borrowers. Loans of securities by a Fund are collateralized by cash, U.S. government securities or irrevocable performance letters of credit issued by banks approved by the Funds. Cash collateral received by the Funds as a result of securities lending activities is invested in an unaffiliated registered money market fund, and is recorded as Payable for collateral received from securities on loan within the Statements of Assets and Liabilities. Securities lending income represents the income earned on investing cash collateral plus any premium payments that may be received on the loan of certain types of securities, less fees and expenses associated with the loan. Each Fund maintains the risk of any market loss on its securities on loan as well as the potential loss on investments |
227
Notes to Financial Statements
(continued)
| | purchased with cash collateral received from its securities lending. The custodian has the right under its agreement with the borrowers to recover any loaned securities from the borrower on demand. Additionally, the Funds are exposed to risks that a borrower may not provide additional collateral when required or return loaned securities when due. If the borrower fails to return the securities, the custodian will use the collateral to purchase replacement securities. The custodian is responsible for any shortfall in collateral value under certain circumstances. See Note 5(o). |
The following table presents securities on loan that are subject to enforceable netting arrangements as of February 28, 2018.
| | | | | | | | | | | | | | | | |
Gross Amounts Not Offset in the Statements of Assets and Liabilities | |
| | | Gross Asset Amount
Presented in Statements
of Assets and Liabilities (a) | | | Financial
Instrument | | | Collateral
Received (b)(c) | | | Net Amount
(Not Less than $0) | |
Destinations Large Cap Equity Fund | | $ | 15,893,318 | | | | — | | | $ | (15,893,318 | ) | | $ | — | |
Destinations Small-Mid Cap Equity Fund | | | 16,607,389 | | | | — | | | | (16,607,389 | ) | | | — | |
Destinations International Equity Fund | | | 17,646,836 | | | | — | | | | (17,646,836 | ) | | | — | |
Destinations Equity Income Fund | | | 611,698 | | | | — | | | | (611,698 | ) | | | — | |
Destinations Real Assets Fund | | | 17,289,786 | | | | — | | | | (17,289,786 | ) | | | — | |
Destinations Core Fixed Income Fund | | | 553,235 | | | | — | | | | (553,235 | ) | | | — | |
Destinations Low Duration Fixed Income Fund | | | 2,245,548 | | | | — | | | | (2,245,548 | ) | | | — | |
Destinations Global Fixed Income Opportunities Fund | | | 4,628,391 | | | | — | | | | (4,628,391 | ) | | | — | |
Destinations Multi Strategy Alternatives Fund | | | 16,464,252 | | | | — | | | | (16,464,252 | ) | | | — | |
| (a) | Represents market value of securities on loan at period end. |
| (b) | The Funds received cash collateral of $16,521,899, $17,329,790, $19,777,529, $628,002, $19,121,905, $569,695, $2,300,425, $4,838,084 and $17,012,174, respectively, which was subsequently invested in Federated Government Obligations Fund as reported in the Schedules of Investments. |
| (c) | The actual collateral received could be greater than the amount shown here due to overcollateralization. |
The Funds have adopted the disclosure provisions of FASB Accounting Standards Update No. 2014-11 (“ASU No. 2014-11”), “Transfers & Servicing (Topic 860): Repurchase-to-Maturity Transactions, Repurchase Financings, and Disclosures”. ASU No. 2014-11 is intended to provide increased transparency about the types of collateral pledged in securities lending transactions and other similar transactions that are accounted for as secured borrowing.
The table below represents the disaggregation at February 28, 2018 of the gross amount of recognized liabilities for securities lending transactions. As the securities loaned are subject to termination by the Funds or the borrower at any time, the remaining contractual maturities of the transactions presented below are considered to be overnight and continuous.
| | | | | | | | | | | | | | | | | | | | |
| | | Remaining Contractual Maturity of the Agreements | |
| | | As of February 28, 2018 | |
| | | Overnight and
Continuous | | | < 30 days | | | Between 30 & 90
days | | | > 90 days | | | Total | |
Destinations Large Cap Equity Fund | | | | | | | | | | | | | | | | | | | | |
Securities Lending Transactions | | | | | | | | | | | | | | | | | | | | |
Common Stocks | | $ | 16,521,899 | | | $ | – | | | $ | – | | | $ | – | | | $ | 16,521,899 | |
| | | | | | | | | | | | | | | | | | | | |
Total Borrowings | | $ | 16,521,899 | | | $ | – | | | $ | – | | | $ | – | | | $ | 16,521,899 | |
| | | | | | | | | | | | | | | | | | | | |
228
Notes to Financial Statements
(continued)
| | | | | | | | | | | | | | | | | | | | |
| | | Remaining Contractual Maturity of the Agreements | |
| | | As of February 28, 2018 | |
| | | Overnight and
Continuous | | | < 30 days | | | Between 30 & 90
days | | | > 90 days | | | Total | |
Gross amount of recognized liabilities for securities lending transactions | | $ | – | | | $ | – | | | $ | – | | | $ | – | | | $ | 16,521,899 | |
| | | | | | | | | | | | | | | | | | | | |
Destinations Small-Mid Cap Equity Fund | | | | | | | | | | | | | | | | | | | | |
Securities Lending Transactions | | | | | | | | | | | | | | | | | | | | |
Common Stocks | | $ | 17,329,790 | | | $ | – | | | $ | – | | | $ | – | | | $ | 17,329,790 | |
| | | | | | | | | | | | | | | | | | | | |
Total Borrowings | | $ | 17,329,790 | | | $ | – | | | $ | – | | | $ | – | | | $ | 17,329,790 | |
| | | | | | | | | | | | | | | | | | | | |
Gross amount of recognized liabilities for securities lending transactions | | $ | – | | | $ | – | | | $ | – | | | $ | – | | | $ | 17,329,790 | |
| | | | | | | | | | | | | | | | | | | | |
Destinations International Equity Fund | | | | | | | | | | | | | | | | | | | | |
Securities Lending Transactions | | | | | | | | | | | | | | | | | | | | |
Common Stocks | | $ | 19,777,529 | | | $ | – | | | $ | – | | | $ | – | | | $ | 19,777,529 | |
| | | | | | | | | | | | | | | | | | | | |
Total Borrowings | | $ | 19,777,529 | | | $ | – | | | $ | – | | | $ | – | | | $ | 19,777,529 | |
| | | | | | | | | | | | | | | | | | | | |
Gross amount of recognized liabilities for securities lending transactions | | $ | – | | | $ | – | | | $ | – | | | $ | – | | | $ | 19,777,529 | |
| | | | | | | | | | | | | | | | | | | | |
Destinations Equity Income Fund | | | | | | | | | | | | | | | | | | | | |
Securities Lending Transactions | | | | | | | | | | | | | | | | | | | | |
Common Stocks | | $ | 628,002 | | | $ | – | | | $ | – | | | $ | – | | | $ | 628,002 | |
| | | | | | | | | | | | | | | | | | | | |
Total Borrowings | | $ | 628,002 | | | $ | – | | | $ | – | | | $ | – | | | $ | 628,002 | |
| | | | | | | | | | | | | | | | | | | | |
Gross amount of recognized liabilities for securities lending transactions | | $ | – | | | $ | – | | | $ | – | | | $ | – | | | $ | 628,002 | |
| | | | | | | | | | | | | | | | | | | | |
Destinations Real Assets Fund | | | | | | | | | | | | | | | | | | | | |
Securities Lending Transactions | | | | | | | | | | | | | | | | | | | | |
Common Stocks | | $ | 19,121,905 | | | $ | – | | | $ | – | | | $ | – | | | $ | 19,121,905 | |
| | | | | | | | | | | | | | | | | | | | |
Total Borrowings | | $ | 19,121,905 | | | $ | – | | | $ | – | | | $ | – | | | $ | 19,121,905 | |
| | | | | | | | | | | | | | | | | | | | |
Gross amount of recognized liabilities for securities lending transactions | | $ | – | | | $ | – | | | $ | – | | | $ | – | | | $ | 19,121,905 | |
| | | | | | | | | | | | | | | | | | | | |
Destinations Core Fixed Income Fund | | | | | | | | | | | | | | | | | | | | |
Securities Lending Transactions | | | | | | | | | | | | | | | | | | | | |
Corporate Securities | | $ | 569,695 | | | | – | | | | – | | | | – | | | $ | 569,695 | |
| | | | | | | | | | | | | | | | | | | | |
Total Borrowings | | $ | 569,695 | | | $ | – | | | $ | – | | | $ | – | | | $ | 569,695 | |
| | | | | | | | | | | | | | | | | | | | |
Gross amount of recognized liabilities for securities lending transactions | | $ | – | | | $ | – | | | $ | – | | | $ | – | | | $ | 569,695 | |
| | | | | | | | | | | | | | | | | | | | |
Destinations Low Duration Fixed Income Fund | | | | | | | | | | | | | | | | | |
Securities Lending Transactions | | | | | | | | | | | | | | | | | | | | |
Common Stocks | | $ | 1,251,225 | | | $ | – | | | $ | – | | | $ | – | | | $ | 1,251,225 | |
Corporate Securities | | | 1,049,200 | | | | – | | | | – | | | | – | | | | 1,049,200 | |
| | | | | | | | | | | | | | | | | | | | |
Total Borrowings | | $ | 2,300,425 | | | $ | – | | | $ | – | | | $ | – | | | $ | 2,300,425 | |
| | | | | | | | | | | | | | | | | | | | |
Gross amount of recognized liabilities for securities lending transactions | | $ | – | | | $ | – | | | $ | – | | | $ | – | | | $ | 2,300,425 | |
| | | | | | | | | | | | | | | | | | | | |
229
Notes to Financial Statements
(continued)
| | | | | | | | | | | | | | | | | | | | |
| | | Remaining Contractual Maturity of the Agreements | |
| | | As of February 28, 2018 | |
| | | Overnight and
Continuous | | | < 30 days | | | Between 30 & 90
days | | | > 90 days | | | Total | |
Destinations Global Fixed Income Opportunities Fund | | | | | | | | | | | | | | | | | |
Securities Lending Transactions | | | | | | | | | | | | | | | | | | | | |
Common Stocks | | $ | 122,850 | | | $ | – | | | $ | – | | | $ | – | | | $ | 122,850 | |
Corporate Securities | | | 4,715,234 | | | | – | | | | – | | | | – | | | | 4,715,234 | |
| | | | | | | | | | | | | | | | | | | | |
Total Borrowings | | $ | 4,838,084 | | | $ | – | | | $ | – | | | $ | – | | | $ | 4,838,084 | |
| | | | | | | | | | | | | | | | | | | | |
Gross amount of recognized liabilities for securities lending transactions | | $ | – | | | $ | – | | | $ | – | | | $ | – | | | $ | 4,838,084 | |
| | | | | | | | | | | | | | | | | | | | |
Destinations Multi Strategy Alternatives Fund | | | | | | | | | | | | | | | | | |
Securities Lending Transactions | | | | | | | | | | | | | | | | | | | | |
Common Stocks | | $ | 7,639,866 | | | $ | – | | | $ | – | | | $ | – | | | $ | 7,639,866 | |
Corporate Securities | | | 9,372,308 | | | | – | | | | – | | | | – | | | | 9,372,308 | |
| | | | | | | | | | | | | | | | | | | | |
Total Borrowings | | $ | 17,012,174 | | | $ | – | | | $ | – | | | $ | – | | | $ | 17,012,174 | |
| | | | | | | | | | | | | | | | | | | | |
Gross amount of recognized liabilities for securities lending transactions | | $ | – | | | $ | – | | | $ | – | | | $ | – | | | $ | 17,012,174 | |
| | | | | | | | | | | | | | | | | | | | |
| | (d) | To-Be-Announced Purchase and Sale Commitments. Certain Funds may trade securities on a to-be-announced (“TBA”) basis. In a TBA transaction, a Fund commits to purchasing or selling securities which have not yet been issued by the issuer and for which specific information is not known, such as the face amount and maturity date and the underlying pool of investments in U.S. government agency mortgage pass-through transactions. Securities purchased on a TBA basis are not settled until they are delivered to the Fund, normally 15 to 45 days later. Beginning on the date the Fund enters into a TBA transaction, cash, U.S. government securities or other liquid high-grade debt obligations are segregated in an amount equal in value to the purchase price of the TBA security. These transactions are marked-to-market on a daily basis and are subject to market fluctuations. Realized gains or losses on TBA purchase commitments are included in “Net realized gain (loss) on investments” on the Statements of Operations. Any fluctuation in the value of the purchased TBA commitments is included in “Net change in unrealized appreciation (depreciation) on investments” on the Statements of Operations. |
Additionally, when a Fund sells TBA securities without already owning or having the right to obtain the deliverable securities (an uncovered forward commitment to sell), it incurs a risk of loss because it could have to purchase the securities at a price that is higher than the price at which it sold them. A Fund may be unable to purchase the deliverable securities if the corresponding market is illiquid.
TBA securities subject to a forward commitment to sell at period end are included at the end of the Fund’s Schedule of Investments under the caption “Schedule of Forward Sale Commitments”. The proceeds and value of these commitments are recorded as Forward Sale Commitments at value in the Statements of Assets and Liabilities.
| | (e) | Short Sales of Securities. A short sale is a transaction in which a Fund sells securities it does not own in anticipation of a decline in the market price of the securities. To complete a short sale, the Fund may arrange through a broker to borrow the securities to be delivered to the buyer. The proceeds received by the Fund for the short sale are retained by the broker until the Fund replaces the borrowed securities. In borrowing the securities to be delivered to the buyer, the Fund becomes obligated to replace the securities borrowed at their market price at the time of replacement, whatever that price may be. |
230
Notes to Financial Statements
(continued)
The risk of engaging in short sale transactions is that selling short magnifies the potential for loss to a Fund. The larger the Fund’s short position, the greater the potential loss. If a security sold short increases in price, the Fund may have to cover its short position at a higher price than the short sale price, resulting in a loss. To borrow the security, the Fund also may be required to pay a premium, which could decrease the proceeds of the security sold short. The amount of any gain will be decreased, and the amount of any loss increased, by the amount of the premium, dividends, interest or expenses the Fund may be required to pay in connection with the short sale. In addition, because the Fund’s loss on a short sale arises from increases in the value of the security sold short, such loss is unlimited.
| | (f) | Mortgage Dollar Rolls. Certain Funds may sell mortgage-backed securities for delivery in the current month and simultaneously contract to repurchase substantially similar (same type, coupon and maturity) securities to settle on a specific future date at an agreed upon price. Pools of mortgage securities are used to collateralize mortgage dollar roll transactions and may have different prepayment histories than those sold. During the period between the sale and the repurchase, a Fund forgoes principal and interest paid on the securities sold. Proceeds of the sale will be invested in short-term instruments and the income from these investments, together with any additional fee income received on a sale, is intended to generate income for a Fund. A Fund accounts for mortgage dollar roll transactions as purchases and sales and realizes the gain or loss at the time the transaction is entered into on these transactions. If certain criteria are met, these dollar roll transactions may be considered financing transactions, whereby the difference in the sale price and the future purchase price is recorded as an adjustment to interest income. |
Mortgage dollar roll transactions involve the risk that the market value of the securities a Fund is obligated to repurchase under the agreement may decline below the repurchase price of those securities. If investment performance of securities purchased with proceeds from these transactions does not exceed the income, capital appreciation and gain or loss that would have been realized on the securities sold as part of the dollar roll, the use of this technique will adversely impact the investment performance of a Fund. In the event the buyer of securities under a mortgage dollar roll files for bankruptcy or becomes insolvent, the Fund’s use of proceeds of the dollar roll may be restricted pending a determination by the other party, or its trustee or receiver, whether to enforce the Fund’s obligation to repurchase the securities.
| | (g) | Security Transactions and Investment Income. Security transactions are accounted for on a trade date basis. Interest income, adjusted for amortization of premium and accretion of discount, is recorded on an accrual basis. Dividend income is recorded on the ex-dividend date. Foreign dividend income is recorded on the ex-dividend date or as soon as practical after a Fund determines the existence of a dividend declaration after exercising reasonable due diligence. Withholding taxes on foreign dividends, if applicable, are paid (a portion of which may be reclaimable) or provided for in accordance with the applicable country’s tax rules and rates and are disclosed in the Statement of Operations. Withholding tax reclaims are filed in certain countries to recover a portion of the amounts previously withheld. The Fund records a reclaim receivable based on a number of factors, including a jurisdiction’s legal obligation to pay reclaims as well as payment history and market convention. The cost of investments sold is determined by use of the specific identification method. To the extent any issuer defaults on an expected interest payment, the Trust’s policy is to generally halt any additional “interest income accruals and accretion” and consider the Fund’s ability to realize interest accrued up to the date of default. |
| | (h) | Foreign Investments. Dividends or other income (including, in some cases, capital gains) received by a Fund from investments in foreign securities may be subject to withholding and other taxes imposed by foreign countries. Foreign taxes paid by a Fund will reduce the return from the Fund’s investments. Tax conventions between certain countries and the U.S. may reduce or eliminate such taxes in some cases. If, as of the end of a Fund’s taxable year, more than 50% of the Fund’s assets consist of foreign securities, that |
231
Notes to Financial Statements
(continued)
| | Fund may elect to permit shareholders to claim a credit or deduction on their income tax returns for their pro rata portions of qualified taxes paid by that Fund during that taxable year to foreign countries in respect of foreign securities that the Fund has held for at least the minimum period specified in the IRC. In such a case, shareholders will include in gross income from foreign sources their pro rata shares of such taxes and must treat the amount so included as if the shareholder had paid the foreign tax directly. The shareholder may then either deduct the taxes deemed paid by him or her in computing his or her taxable income or, alternatively, use the foregoing information in calculating any foreign tax credit they may be entitled to use against the shareholders’ federal income tax. If a Fund makes the election, such Fund (or its administrative agent) will report annually to their shareholders the respective amounts per share of the Fund’s income from sources within, and taxes paid to, foreign countries and U.S. possessions. Shareholders of Funds that do not hold sufficient foreign securities to meet the above 50% threshold will not be entitled to claim a credit or further deduction with respect to foreign taxes paid by those Funds. |
| | (i) | Foreign Currency Translation. Investment securities and other assets and liabilities denominated in foreign currencies are translated into U.S. dollar amounts based upon prevailing exchange rates on the date of valuation. Purchases and sales of investment securities and income and expense items denominated in foreign currencies are translated into U.S. dollar amounts based upon prevailing exchange rates on the respective dates of such transactions. |
The Funds do not isolate that portion of the results of operations resulting from changes in foreign exchange rates on investments from the fluctuations arising from changes in market prices of securities held. Such fluctuations are included with the net realized and unrealized gain or loss on investments in the Statements of Operations.
Net realized foreign exchange gains or losses arise from sales of foreign currencies, including gains and losses on forward foreign currency contracts, currency gains or losses realized between the trade and settlement dates on securities transactions and the difference between the amounts of dividends, interest and foreign withholding taxes recorded on the Funds’ books and the U.S. dollar equivalent of the amounts actually received or paid. Net unrealized foreign exchange gains and losses arise from changes in the fair values of assets and liabilities, other than investments in securities, at the date of valuation, resulting from changes in exchange rates.
Foreign security and currency transactions may involve certain considerations and risks not typically associated with those of U.S. dollar denominated transactions as a result of, among other factors, the possibility of lower levels of governmental supervision and regulation of foreign securities markets and the possibility of political or economic instability.
| | (j) | Distributions to Shareholders. The Funds distribute their investment income periodically. It is the policy of the Destinations Equity Income and Destinations Multi Strategy Alternatives Funds to distribute their investment income quarterly. It is the policy of the Destinations Large Cap Equity, Destinations Small-Mid Cap Equity, Destinations International Equity and Destinations Real Assets Funds to distribute their investment income annually. It is the policy of the Destinations Core Fixed Income, Destinations Municipal Fixed Income, Destinations Global Fixed Income Opportunities and Destinations Low Duration Fixed Income Funds to distribute their investment income monthly. The Funds will make distributions of any undistributed capital gains earned annually. A Fund may make an additional payment of dividends or other distributions if it deems it to be desirable or necessary at other times during any year. |
| | (k) | All distributions will be paid in cash. Generally, distributions are taxable events for shareholders whether the distributions are received in cash or reinvested. |
| | (l) | Federal and Other Taxes. It is the Trust’s policy to comply with the federal income and excise tax requirements of the Internal Revenue Code of 1986, as amended, applicable to regulated investment |
232
Notes to Financial Statements
(continued)
| | companies. Accordingly, each Fund intends to distribute substantially all of its income and net realized gains on investments, if any, to shareholders each year. Therefore, no federal income tax provision is required in the Funds’ financial statements. Under the applicable foreign tax laws, a withholding tax may be imposed on interest, dividends and capital gains at various rates. |
Management has reviewed the tax positions and has concluded that no liability for unrecognized tax benefits should be recorded related to uncertain tax positions taken on returns filed for open tax years or expected to be taken on the 2018 tax returns.
| | (m) | Reclassification. GAAP requires that certain components of net assets be adjusted to reflect permanent differences between financial and tax reporting. These reclassifications have no effect on net assets or net asset values per share. |
| | | | | | | | | | | | |
Fund | | Undistributed
Net
Investment
Income/(Loss) | | | Undistributed
Realized Gains/
(Accumulated Net
Realized Losses) | | | Paid-in
Capital | |
Destinations Large Cap Equity Fund (a),(g) | | $ | (340,211 | ) | | $ | 340,211 | | | $ | — | |
Destinations Small-Mid Cap Equity Fund (a),(c),(e) | | | 138,355 | | | | (138,355 | ) | | | — | |
Destinations International Equity Fund (c),(e),(g) | | | 1,002,731 | | | | (1,002,731 | ) | | | — | |
Destinations Equity Income Fund (a),(g) | | | (31,623 | ) | | | 31,623 | | | | — | |
Destinations Real Assets Fund (e),(g) | | | 698,073 | | | | (698,073 | ) | | | — | |
Destinations Core Fixed Income Fund (e),(f) | | | 9,527 | | | | (9,527 | ) | | | — | |
Destinations Low Duration Fixed Income Fund (b),(g) | | | 1,487 | | | | 6,647 | | | | (8,134 | ) |
Destinations Global Fixed Income Opportunities Fund (e),(f),(g) | | | (269,140 | ) | | | 269,140 | | | | — | |
Destinations Municipal Fixed Income Fund (e) | | | (11 | ) | | | 11 | | | | — | |
Destinations Multi Strategy Alternatives Fund (a),(c),(d),(e),(g) | | | (3,638,923 | ) | | | 3,638,923 | | | | — | |
| | (a) | Reclassifications are primarily due to book/tax differences in the treatment of distributions from real estate investment trusts. |
| | (b) | Reclassifications are primarily due to a tax net operating loss. |
| | (c) | Reclassifications are primarily due to book/tax differences in the treatment of passive foreign investment companies. |
| | (d) | Reclassifications are primarily due to differences between book and tax amortization of premium on fixed income securities. |
| | (e) | Reclassifications are primarily due to distribution reclass. |
| | (f) | Reclassifications are primarily due to consent payment income reclass. |
| | (g) | Reclassifications are primarily due to foreign currency transactions treated as ordinary income for tax purposes. |
| | (n) | Restricted Securities. All Funds may invest in non-publicly traded securities, commonly called restricted securities. Restricted securities may be less liquid than publicly-traded securities. Although certain restricted securities may be resold in privately negotiated transactions, the values realized from these sales could be less than originally paid by a Fund. Certain restricted securities may be deemed liquid by the Manager and/or Sub-adviser pursuant to the procedures approved by the Board. |
| | (o) | Indemnification. In the normal course of business, the Funds may enter into contracts that provide certain indemnifications. The Funds’ maximum exposure under these arrangements is dependent on future claims that may be made against the Funds and, therefore, cannot be estimated; however, based on experience, risk of loss from such claims is considered remote. |
| | (p) | Senior Floating-Rate Loans. Certain Funds may purchase assignments of, and participations in, senior secured floating rate and fixed rate loans (“Senior Loans”) originated, negotiated and structured by a |
233
Notes to Financial Statements
(continued)
| | U.S. or foreign commercial bank, insurance company, finance company or other financial institution (the “Agent”) for a lending syndicate of financial institutions (the “Lender”). When purchasing an assignment, a Fund typically succeeds to all the rights and obligations under the loan of the assigning Lender and becomes a lender under the credit agreement with respect to the debt obligation purchased. Assignments may, however, be arranged through private negotiations between potential assignees and potential assignors, and the rights and obligations acquired by the purchaser of an assignment may differ from, and be more restricted than, those held by the assigning Lender. Participation typically results in a contractual relationship only with the institution participating out the interest, not with the borrower. In purchasing participations, a Fund generally will have no right to enforce compliance by the borrower with the terms of the loan agreement or any rights of setoff against the borrower, and the Fund may not directly benefit from the collateral supporting the debt obligation in which it has purchased the participation. As a result, the Fund will be exposed to the credit risk of both the borrower and the institution selling the participation. |
In connection with bank loan interests, Funds may enter into unfunded bank loan interests (“commitments”). Unfunded loan commitments may be partially or wholly unfunded. The fund is obligated to fund these commitments at borrower’s discretion. In connection with these commitments, Funds earn a commitment fee, which is included in interest income in the Statement of Operations and recognized respectively over the commitment period. Funds have sufficient cash/securities to cover commitments.
The following table summarizes the Funds’ wholly and partially unfunded loans positions as of February 28, 2018.
| | | | | | | | | | | | | | | | |
| | | Principal | | | Unfunded Bank
Loan
Interest (Cost) | | | Value of Underlying
Bank
Loan Interest (Value) | | | Unrealized
Appreciation/
(Depreciation) | |
Destinations Core Fixed Income Fund | | | | | | | | | | | | | | | | |
DexKo Global Inc. | | $ | 18,750 | | | $ | 18,750 | | | $ | 18,938 | | | $ | 188 | |
DG Investment Intermediate Holdings 2 Inc. | | | 14,516 | | | | 14,480 | | | | 14,489 | | | | 9 | |
Mitchell International Inc. | | | 42,164 | | | | 42,032 | | | | 42,262 | | | | 230 | |
| | | | | | | | | | | | | | | | |
| | $ | 75,430 | | | $ | 75,262 | | | $ | 75,689 | | | $ | 427 | |
| | | | | | | | | | | | | | | | |
Destinations Low Duration Fixed Income Fund | | | | | | | | | | | | | | | | |
Appvion Inc. | | $ | 6,994 | | | $ | 6,863 | | | $ | 7,002 | | | $ | 139 | |
| | | | | | | | | | | | | | | | |
Destinations Global Fixed Income Opportunities Fund | | | | | | | | | | | | | | | | |
Appvion Inc. | | $ | 27,932 | | | $ | 27,411 | | | $ | 27,967 | | | $ | 556 | |
Real Alloy Holding Inc. | | | 378,443 | | | | 378,443 | | | | 378,443 | | | | — | |
YI LLC | | | 689,274 | | | | 685,972 | | | | 690,997 | | | | 5,025 | |
| | | | | | | | | | | | | | | | |
| | $ | 1,095,649 | | | $ | 1,091,826 | | | $ | 1,097,407 | | | $ | 5,581 | |
| | | | | | | | | | | | | | | | |
| | (q) | Disclosure about Offsetting Assets and Liabilities. In order to better define contractual rights under derivative contracts and to secure rights that will help the Funds mitigate their counterparty risk, a sub-adviser may, on behalf of the Funds, enter into an International Swaps and Derivatives Association, Inc. Master Agreement (“ISDA Master Agreement”) or similar agreement with its derivative contract counterparties. An ISDA Master Agreement is a bilateral agreement between the Funds and a counterparty that governs OTC derivatives and foreign exchange contracts and typically contains, among other things, collateral posting terms and netting provisions in the event of a default |
234
Notes to Financial Statements
(continued)
| | and/or termination event. The ISDA Master Agreement gives a Fund the right, upon an event of default by the applicable counterparty or a termination of the agreement, to close out all transactions traded under such agreement and to net amounts owed under each transaction to one net amount payable by one party to the other. Absent an event of default by the counterparty or a termination of the agreement, the ISDA Master Agreement does not result in an offset of reported amounts of assets and liabilities in the Statements of Assets and Liabilities across the transactions between the Funds and the applicable counterparty. The right to offset and net payments across all transactions traded under the ISDA Master Agreement could result in a reduction of the Funds’ credit risk to such counterparty equal to any amounts payable by the Funds under the applicable transactions, if any. The enforceability of the right to offset may vary by jurisdiction. |
Cash collateral that has been received or pledged to cover obligations under derivative contracts, if any, will be reported separately in the Statements of Assets and Liabilities. Generally the amount of collateral due from or to a counterparty is subject to a minimum transfer threshold amount before a transfer is required, which may vary by counterparty. Collateral pledged for the benefit of a Fund and/or counterparty is held in segregated accounts by the Fund’s custodian and cannot be sold, re-pledged, assigned or otherwise used while pledged. The portion of such collateral representing cash, if any, is reflected as deposits with counterparties and, in the case of cash pledged by a counterparty for the benefit of a Fund, a corresponding liability in the Statements of Assets and Liabilities. Securities pledged by a Fund as collateral, if any, are identified as such in the Schedule of Investments. The carrying amount of such deposits due to brokers at February 28, 2018 approximated their fair value. If measured at fair value, such deposits would have been considered as Level 2 in the fair value hierarchy (see Note 3).
For financial reporting purposes, the Funds do not offset financial assets and financial liabilities that are subject to master netting arrangements or similar agreements on the Statements of Assets and Liabilities.
The following table presents the Funds’ gross and net amounts of assets and liabilities, by derivative type, available for offset under a master netting agreement, or similar agreement as of February 28, 2018.
| | | | | | | | |
| | | Assets | | | Liabilities | |
Derivative Instruments (a) | | Gross Amounts of
Recognized Assets
Presented in the
Statements of
Assets and Liabilities | | | Gross Amounts of
Recognized Liabilities
Presented in the
Statements of Assets
and Liabilities | |
Destinations International Equity Fund: | | | | | | | | |
Forward foreign currency contracts | | $ | 23,364 | | | $ | 88,319 | |
| | | | | | | | |
Total Derivative Instruments, subject to master netting arrangement or similar arrangement | | $ | 23,364 | | | $ | 88,319 | |
| | | | | | | | |
Destinations Multi Strategy Alternatives Fund: | | | | | | | | |
Forward foreign currency contracts | | $ | 148,800 | | | $ | — | |
Swap contracts (b) | | | 1,569,478 | | | | 1,408,199 | |
| | | | | | | | |
Total Derivative Instruments, subject to master netting arrangement or similar arrangement | | $ | 1,718,278 | | | $ | 1,408,199 | |
| | | | | | | | |
| (a) | Excludes exchange-traded derivatives. |
| (b) | The total value of the net amounts of assets and liabilities is comprised of Swap contracts, at value on the Statements of Assets and Liabilities less the net value of the Upfront premiums paid (received) disclosed in the Fund’s Schedules of Investments. |
235
Notes to Financial Statements
(continued)
The following table presents the Funds’ derivative assets and liabilities by counterparty net of amounts available for offset under master netting or similar agreements, and net of related collateral received or pledged as of February 28, 2018.
| | | | | | | | | | | | | | | | |
Counterparty | | Gross amounts
of Recognized
Assets
presented in the
Statements of
Assets and
Liabilities | | | Financial
Instruments
Available for
Offset (a) | | | Other
Cash
Collateral (e) | | | Net Amount (b) | |
Destinations International Equity Fund | | | | | | | | | | | | | | | | |
Over-the-counter | | | | | | | | | | | | | | | | |
Bank of America | | $ | 15,975 | | | $ | — | | | $ | — | | | $ | 15,975 | |
Morgan Stanley | | | 7,389 | | | | — | | | | — | | | | 7,389 | |
| | | | | | | | | | | | | | | | |
Total Over-the-counter derivative instruments | | $ | 23,364 | | | $ | — | | | $ | — | | | $ | 23,364 | |
| | | | | | | | | | | | | | | | |
| | | | | | | | | | | | | | | | |
Counterparty | | Gross amounts
of Recognized
Liabilities
presented in the
Statements of
Assets and
Liabilities | | | Financial
Instruments
Available for
Offset (c) | | | Other
Cash
Collateral (e) | | | Net Amount (d) | |
Destinations International Equity Fund | | | | | | | | | | | | | | | | |
Over-the-counter | | | | | | | | | | | | | | | | |
Barclays Bank PLC | | $ | 42,853 | | | $ | — | | | $ | — | | | $ | 42,853 | |
State Street Bank and Trust Co. | | | 45,466 | | | $ | — | | | | — | | | | 45,466 | |
| | | | | | | | | | | | | | | | |
Total Over-the-counter derivative instruments | | $ | 88,319 | | | $ | — | | | $ | — | | | $ | 88,319 | |
| | | | | | | | | | | | | | | | |
| | | | | | | | | | | | | | | | |
Counterparty | | Gross amounts
of Recognized
Assets
presented in the
Statements of
Assets and
Liabilities | | | Financial
Instruments
Available for
Offset (a) | | | Other
Cash
Collateral (e) | | | Net Amount (b) | |
Destinations Multi Strategy Alternatives Fund | | | | | | | | | | | | | | | | |
Over-the-counter | | | | | | | | | | | | | | | | |
Bank of America Merrill Lynch | | $ | 1,424,092 | | | $ | (1,275,621 | ) | | $ | — | | | $ | 148,471 | |
Goldman Sachs & Co. | | | 294,186 | | | | (132,578 | ) | | | — | | | | 161,608 | |
| | | | | | | | | | | | | | | | |
Total Over-the-counter derivative instruments | | $ | 1,718,278 | | | $ | (1,408,199 | ) | | $ | — | | | $ | 310,079 | |
| | | | | | | | | | | | | | | | |
236
Notes to Financial Statements
(continued)
| | | | | | | | | | | | | | | | |
Counterparty | | Gross amounts
of Recognized
Liabilities
presented in the
Statements of
Assets and
Liabilities | | | Financial
Instruments
Available for
Offset (c) | | | Other
Cash
Collateral (e) | | | Net Amount (d) | |
Destinations Multi Strategy Alternatives Fund | | | | | | | | | | | | | | | | |
Over-the-counter | | | | | | | | | | | | | | | | |
Bank of America Merrill Lynch | | $ | 1,275,621 | | | $ | (1,275,621 | ) | | $ | — | | | $ | — | |
Goldman Sachs & Co. | | | 132,578 | | | | (132,578 | ) | | | — | | | | — | |
| | | | | | | | | | | | | | | | |
Total Over-the-counter derivative instruments | | $ | 1,408,199 | | | $ | (1,408,199 | ) | | $ | — | | | $ | — | |
| | | | | | | | | | | | | | | | |
| (a) | Represents the amount of assets that could be offset by liabilities with the same counterparty under master netting or similar agreements that are not offset on the Statements of Assets and Liabilities. |
| (b) | Net amount represents the new amount receivable from the counterparty in the event of default. |
| (c) | Represents the amount of liabilities that could be offset by assets with the same counterparty under master netting or similar agreements that are not offset on the Statements of Assets and Liabilities. |
| (d) | Net amount represents the net amount payable to the counterparty in the event of default. |
| (e) | In some instances, the actual collateral received and/or pledged may be more than the amount shown here due to overcollateralization. |
6. Significant Risks and Uncertainties
| | (a) | Credit and Market Risk. Certain Funds invest in high yield instruments that are subject to certain credit and market risks. The yields of high yield obligations reflect, among other things, perceived credit and market risks. Each Fund’s investment in securities rated below investment grade typically involve risks not associated with higher rated securities, including, among others, greater risk related to timely and ultimate payment of interest and principal, greater market price volatility and less liquid secondary market trading. |
| | (b) | Foreign Investment and Currency Risks. Certain Funds’ investments in foreign securities may involve risks not present in domestic investments. Because securities may be denominated in foreign currencies and may require settlement in foreign currencies and pay interest or dividends in foreign currencies, changes in the relationship of these foreign currencies to the U.S. dollar can significantly affect the value of the investments and earnings of a Fund. Foreign investments may also subject the Fund to foreign government exchange restrictions, expropriation, taxation or other political, social or economic developments, all of which affect the market and/or credit risk of the investments. |
| | (c) | Emerging Markets Risk. In addition to foreign investment and currency risks, which tend to be amplified in emerging markets, emerging markets may experience rising interest rates, or, more significantly, rapid inflation or hyperinflation. The economies of emerging market countries may grow at slower rates than expected or suffer a downturn or recession. Emerging market securities may present market, credit, liquidity, legal, political and other risks different from, or greater than, the risks of investing in developed foreign countries. |
| | (d) | Volatility Risk. Volatility risk refers to the magnitude of the movement, but not the direction of the movement, in a financial instrument’s price over a defined time period. Large increases or decreases in a financial instrument’s price over a relative time period typically indicate greater volatility risk, while small increases or decreases in its price typically indicate lower volatility risk. |
237
Notes to Financial Statements
(continued)
7. Investment Management Agreement.
Brinker Capital, Inc., serves as investment adviser to the Trust pursuant to an investment advisory agreement (“Advisory Agreement”) between the Trust and Brinker Capital. Each Sub-adviser serves as investment adviser to a Fund pursuant to separate written agreements with the Adviser on behalf of the Funds (“Sub-advisory Agreements”). Under the Advisory Agreement, each Fund pays Brinker Capital an investment advisory fee calculated daily at an annual rate based on each Fund’s average daily net assets and paid monthly in arrears. Brinker Capital pays each Sub-adviser a sub-advisory fee from its investment advisory fees.
The maximum allowable annual management fee represents the total amount that could be charged to each Fund. The aggregate subadvisory fee expected to be paid by Brinker Capital to the Sub-advisers and the maximum fee expected to be retained by Brinker Capital for the Trust’s current fiscal year are indicated below:
| | | | | | | | | | | | |
Fund | | Subadvisory
Fee | | | Brinker
Capital
Inc. Fee | | | Maximum Allowable
Annual Management
Fee | |
Destinations Large Cap Equity Fund | | | 0.24 | % | | | 0.39 | % | | | 0.75 | % |
Destinations Small-Mid Cap Equity Fund | | | 0.40 | % | | | 0.39 | % | | | 0.90 | % |
Destinations International Equity Fund | | | 0.50 | % | | | 0.39 | % | | | 1.00 | % |
Destinations Equity Income Fund | | | 0.28 | % | | | 0.39 | % | | | 0.80 | % |
Destinations Real Assets Fund | | | 0.57 | % | | | 0.39 | % | | | 1.00 | % |
Destinations Core Fixed Income Fund | | | 0.18 | % | | | 0.39 | % | | | 0.65 | % |
Destinations Low Duration Fixed Income Fund | | | 0.27 | % | | | 0.39 | % | | | 0.70 | % |
Destinations Global Fixed Income Opportunities Fund | | | 0.35 | % | | | 0.39 | % | | | 0.85 | % |
Destinations Municipal Fixed Income Fund | | | 0.19 | % | | | 0.39 | % | | | 0.70 | % |
Destinations Multi Strategy Alternatives Fund | | | 0.49 | % | | | 0.39 | % | | | 1.35 | % |
Each Fund’s actual advisory fees may be less than the amounts set forth above due to the effect of additional voluntary fee waivers. Effective March 20, 2017, Brinker Capital has contractually agreed to waive a portion of its advisory fee with respect to any Fund until the period ended June 30, 2018 in order to keep the Fund’s management fees from exceeding 0.39% more than the total amount of sub-advisory fees paid by Brinker Capital with respect to such Fund. The agreement may be amended or terminated only with the consent of the Board of Trustees.
The Adviser voluntarily waived a portion of its advisory fee for Destinations Municipal Fixed Income Fund in order to keep the Funds’ expected total annual operating expenses at or below 0.80%. This voluntary waiver applies only to the advisory fee and does not apply to any other direct or indirect expenses incurred by the Fund. The Adviser may discontinue all or part of this voluntary waiver at anytime.
For the period ended February 28, 2018, the amounts waived by the Adviser were as follows:
| | | | |
Fund* | | | |
Destinations Large Cap Equity Fund | | $ | 3,027,146 | |
Destinations Small-Mid Cap Equity Fund | | | 612,545 | |
Destinations International Equity Fund | | | 1,616,335 | |
Destinations Equity Income Fund | | | 366,661 | |
Destinations Real Assets Fund | | | 157,315 | |
Destinations Core Fixed Income Fund | | | 1,083,624 | |
Destinations Low Duration Fixed Income Fund | | | 89,240 | |
Destinations Global Fixed Income Opportunities Fund | | | 525,324 | |
Destinations Municipal Fixed Income Fund | | | 216,403 | |
Destinations Multi Strategy Alternatives Fund | | | 4,158,391 | |
| * | The Adviser and certain Sub-advisers waived their fees for certain of the Funds on April 6, 2017 and April 7, 2017 as part of the transition of assets into the Funds. The waived fees are not recoupable. |
238
Notes to Financial Statements
(continued)
8. Investments
During the period ended February 28, 2018, the aggregate cost of purchases and proceeds from sales of investments (excluding short-term investments) for each Fund were as follows:
| | | | | | | | | | | | | | | | |
Fund | | Investments | | | U.S. Government & Agency
Obligations | |
| | | Purchases | | | Sales | | | Purchases | | | Sales | |
Destinations Large Cap Equity Fund | | $ | 2,966,127,839 | | | $ | 1,190,934,397 | | | $ | — | | | $ | — | |
Destinations Small-Mid Cap Equity Fund | | | 1,121,429,563 | | | | 592,332,510 | | | | — | | | | — | |
Destinations International Equity Fund | | | 1,512,855,956 | | | | 542,980,435 | | | | — | | | | — | |
Destinations Equity Income Fund | | | 474,760,704 | | | | 168,994,113 | | | | — | | | | — | |
Destinations Real Assets Fund | | | 331,479,936 | | | | 98,377,094 | | | | — | | | | — | |
Destinations Core Fixed Income Fund | | | 1,022,022,370 | | | | 204,048,405 | | | | 2,543,725,246 | | | | 1,885,436,224 | |
Destinations Low Duration Fixed Income Fund | | | 231,197,617 | | | | 30,317,535 | | | | 7,582,296 | | | | 5,950,334 | |
Destinations Global Fixed Income Opportunities Fund | | | 580,046,608 | | | | 237,890,485 | | | | — | | | | — | |
Destinations Municipal Fixed Income Fund | | | 229,414,414 | | | | 61,799,435 | | | | — | | | | — | |
Destinations Multi Strategy Alternatives Fund | | | 1,221,456,163 | | | | 740,991,625 | | | | 6,668,005 | | | | — | |
At February 28, 2018, the aggregate gross unrealized appreciation and depreciation of investments for federal income tax purposes were as follows:
| | | | | | | | | | | | | | | | |
Fund | | Aggregate Cost
For Federal Income
Tax Purposes | | | Gross
Unrealized
Appreciation | | | Gross
Unrealized
(Depreciation) | | | Net Unrealized
Appreciation
(Depreciation) | |
Destinations Large Cap Equity Fund | | $ | 2,452,562,586 | | | $ | 451,427,964 | | | $ | (80,603,016 | ) | | $ | 370,824,948 | |
Destinations Small-Mid Cap Equity Fund | | | 676,425,510 | | | | 64,850,579 | | | | (22,510,078 | ) | | | 42,340,501 | |
Destinations International Equity Fund | | | 1,255,959,221 | | | | 216,616,789 | | | | (40,264,424 | ) | | | 176,352,365 | |
Destinations Equity Income Fund | | | 316,987,898 | | | | 19,627,909 | | | | (16,458,259 | ) | | | 3,169,650 | |
Destinations Real Assets Fund | | | 268,806,837 | | | | 10,153,818 | | | | (36,759,940 | ) | | | (26,606,122 | ) |
Destinations Core Fixed Income Fund | | | 1,630,745,331 | | | | 3,570,224 | | | | (29,459,790 | ) | | | (25,889,566 | ) |
Destinations Low Duration Fixed Income Fund | | | 186,205,736 | | | | 205,897 | | | | (1,762,323 | ) | | | (1,556,426 | ) |
Destinations Global Fixed Income Opportunities Fund | | | 623,466,527 | | | | 2,252,812 | | | | (8,535,947 | ) | | | (6,283,135 | ) |
Destinations Municipal Fixed Income Fund | | | 230,733,348 | | | | 21,821 | | | | (3,197,394 | ) | | | (3,175,573 | ) |
Destinations Multi Strategy Alternatives Fund | | | 840,094,592 | * | | | 35,769,705 | | | | (24,638,727 | ) | | | 11,130,978 | |
| * | Aggregate cost for federal income tax purposes includes premiums paid on OTC Credit Default Swaps. |
239
Notes to Financial Statements
(continued)
9. Shares of Beneficial Interest
At February 28, 2018, the Trust had an unlimited number of units of beneficial interest (shares) authorized with a par value of $0.001 per share. At February 28, 2018, Trustees and executive officers of the Trust as a group owned of record less than 1% of the outstanding shares of the Trust.
Transactions in shares of each Fund were as follows:
| | | | |
| | | Period ended
February 28, 2018* | |
Destinations Large Cap Equity Fund | | | | |
Shares sold | | | 287,473,592 | |
Shares issued on reinvestment | | | 1,649,228 | |
Shares repurchased | | | (49,722,622 | ) |
| | | | |
Net Increase | | | 239,400,198 | |
| |
| | | Period ended
February 28, 2018* | |
Destinations Small-Mid Cap Equity Fund | | | | |
Shares sold | | | 75,742,390 | |
Shares issued on reinvestment | | | 515,514 | |
Shares repurchased | | | (12,450,205 | ) |
| | | | |
Net Increase | | | 63,807,699 | |
| |
| | | Period ended
February 28, 2018* | |
Destinations International Equity Fund | | | | |
Shares sold | | | 133,664,043 | |
Shares issued on reinvestment | | | 808,593 | |
Shares repurchased | | | (13,681,974 | ) |
| | | | |
Net Increase | | | 120,790,662 | |
| |
| | | Period ended
February 28, 2018* | |
Destinations Equity Income Fund | | | | |
Shares sold | | | 40,405,705 | |
Shares issued on reinvestment | | | 871,531 | |
Shares repurchased | | | (9,715,757 | ) |
| | | | |
Net Increase | | | 31,561,479 | |
| |
| | | Period ended
February 28, 2018* | |
Destinations Real Assets Fund | | | | |
Shares sold | | | 26,710,372 | |
Shares issued on reinvestment | | | 587,864 | |
Shares repurchased | | | (2,404,971 | ) |
| | | | |
Net Increase | | | 24,893,265 | |
240
Notes to Financial Statements
(continued)
| | | | |
| |
| | | Period ended
February 28, 2018* | |
Destinations Core Fixed Income Fund | | | | |
Shares sold | | | 170,214,773 | |
Shares issued on reinvestment | | | 2,882,755 | |
Shares repurchased | | | (20,562,920 | ) |
| | | | |
Net Increase | | | 152,534,608 | |
| |
| | | Period ended
February 28, 2018* | |
Destinations Low Duration Fixed Income Fund | | | | |
Shares sold | | | 20,631,298 | |
Shares issued on reinvestment | | | 407,204 | |
Shares repurchased | | | (3,006,453 | ) |
| | | | |
Net Increase | | | 18,032,049 | |
| |
| | | Period ended
February 28, 2018* | |
Destinations Global Fixed Income Opportunities Fund | | | | |
Shares sold | | | 65,732,883 | |
Shares issued on reinvestment | | | 1,756,026 | |
Shares repurchased | | | (7,289,447 | ) |
| | | | |
Net Increase | | | 60,199,462 | |
| |
| | | Period ended
February 28, 2018* | |
Destinations Municipal Fixed Income Fund | | | | |
Shares sold | | | 25,843,707 | |
Shares issued on reinvestment | | | 117,490 | |
Shares repurchased | | | (2,828,194 | ) |
| | | | |
Net Increase | | | 23,133,003 | |
| |
| | | Period ended
February 28, 2018* | |
Destinations Multi Strategy Alternatives Fund | | | | |
Shares sold | | | 112,492,168 | |
Shares issued on reinvestment | | | 1,912,479 | |
Shares repurchased | | | (25,231,900 | ) |
| | | | |
Net Increase | | | 89,172,747 | |
| * | The values shown represent the period from Fund’s inception (March 20, 2017) through the period end February 28, 2018. |
241
Notes to Financial Statements
(continued)
10. Dividend and Tax Components of Capital
The tax character of distributions paid during the fiscal period ended February 28, 2018, were as follows:
| | | | | | | | | | | | | | | | |
| | | Destinations
Large Cap
Equity Fund | | | Destinations
Small-Mid Cap
Equity Fund | | | Destinations
International
Equity Fund | | | Destinations
Equity Income
Fund | |
Distributions paid from: | | | | | | | | | | | | | | | | |
Tax Exempt | | $ | — | | | $ | — | | | $ | — | | | $ | — | |
Ordinary Income | | | 18,721,435 | | | | 5,681,793 | | | | 9,219,265 | | | | 9,660,430 | |
| | | | | | | | | | | | | | | | |
Total Distributions Paid | | $ | 18,721,435 | | | $ | 5,681,793 | | | $ | 9,219,265 | | | $ | 9,660,430 | |
| | | | | | | | | | | | | | | | |
| | | | |
| | | Destinations
Real Assets
Fund | | | Destinations
Core Fixed Income
Fund | | | Destinations
Low Duration
Fixed Income
Fund | | | Destinations
Global Fixed
Income
Opportunities Fund | |
Distributions paid from: | | | | | | | | | | | | | | | | |
Tax Exempt | | $ | — | | | $ | — | | | $ | — | | | $ | — | |
Ordinary Income | | | 5,544,347 | | | | 29,262,825 | | | | 4,250,705 | | | | 18,039,724 | |
| | | | | | | | | | | | | | | | |
Total Distributions Paid | | $ | 5,544,347 | | | $ | 29,262,825 | | | $ | 4,250,705 | | | $ | 18,039,724 | |
| | | | | | | | | | | | | | | | |
| | | | |
| | | Destinations
Municipal
Fixed Income
Fund | | | Destinations
Multi Strategy
Alternatives
Fund | | | | | | | |
Distributions paid from: | | | | | | | | | | | | | | | | |
Tax Exempt | | $ | 993,770 | | | $ | — | | | | | | | | | |
Ordinary Income | | | 185,650 | | | | (19,534,986 | ) | | | | | | | | |
| | | | | | | | | | | | | | | | |
Total Distributions Paid | | $ | 1,179,420 | | | $ | (19,534,986 | ) | | | | | | | | |
| | | | | | | | | | | | | | | | |
As of February 28, 2018, the components of accumulated earnings on a tax basis were as follows:
| | | | | | | | | | | | | | | | |
| | | Destinations
Large Cap
Equity
Fund | | | Destinations
Small-Mid
Cap Equity
Fund | | | Destinations
International
Equity
Fund | | | Destinations
Equity
Income
Fund | |
Undistributed ordinary income—net | | $ | 28,219,012 | | | $ | 3,835,110 | | | $ | 3,489,891 | | | $ | 4,316,536 | |
Undistributed long-term capital gains—net | | | 2,778,711 | | | | 189,686 | | | | | | | | 50,664 | |
| | | | | | | | | | | | | | | | |
Total Undistributed earnings | | | 30,997,723 | | | | 4,024,796 | | | | 3,489,891 | | | | 4,367,200 | |
Capital Loss Carryforward | | | — | | | | — | | | | — | | | | — | |
Current Year Late Year Loss Deferral | | | — | | | | — | | | | — | | | | — | |
Other book/tax temporary differences | | | (2,565,694 | )(d) | | | (1,478,854 | )(e) | | | (1,527,160 | )(c) | | | (406,245 | )(e) |
Unrealized appreciation (depreciation) | | | 373,390,256 | | | | 43,819,355 | | | | 177,447,340 | | | | 3,577,436 | |
Tax exempt spillback | | | — | | | | — | | | | — | | | | — | |
| | | | | | | | | | | | | | | | |
Total accumulated earnings/(losses)—net | | $ | 401,822,285 | | | $ | 46,365,297 | | | $ | 179,410,071 | | | $ | 7,538,391 | |
| | | | | | | | | | | | | | | | |
242
Notes to Financial Statements
(continued)
| | | | | | | | | | | | | | | | |
| | | | |
| | | Destinations
Real Assets
Fund | | | Destinations
Core Fixed
Income
Fund | | | Destinations
Low Duration
Fixed Income
Fund | | | Destinations
Global Fixed
Income
Opportunities
Fund | |
Undistributed ordinary income—net | | $ | 242,932 | | | $ | 1,425,425 | | | $ | — | | | $ | — | |
Undistributed long-term capital gains—net | | | — | | | | — | | | | — | | | | — | |
Undistributed Tax Exempt Income—net | | | — | | | | — | | | | — | | | | — | |
| | | | | | | | | | | | | | | | |
Total Undistributed earnings | | | 242,932 | | | | 1,425,425 | | | | — | | | | — | |
Capital Loss Carryforward | | | — | | | | — | | | | (274,522 | ) | | | — | |
Current Year Late Year Loss Deferral | | | — | | | | (2,716,948 | ) | | | — | | | | (883,397 | ) |
Other book/tax temporary differences | | | (2,503,001 | )(a) | | | (139,618 | )(a) | | | (4,389 | )(f) | | | (121,348 | )(a) |
Unrealized appreciation (depreciation) | | | (24,103,421 | ) | | | (25,749,521 | ) | | | (1,467,170 | ) | | | (6,103,823 | ) |
Tax exempt spillback | | | — | | | | — | | | | — | | | | — | |
| | | | | | | | | | | | | | | | |
Total accumulated earnings/(losses)—net | | $ | (26,363,490 | ) | | $ | (27,180,662 | ) | | $ | (1,746,081 | ) | | $ | (7,108,568 | ) |
| | | | | | | | | | | | | | | | |
| | | | |
| | | Destinations
Municipal
Fixed Income
Fund | | | Destinations
Multi Strategy
Alternatives
Fund | | | | | | | |
Undistributed ordinary income—net | | $ | — | | | $ | 4,280,032 | | | | | | | | | |
Undistributed long-term capital gains—net | | | — | | | | 3,432,175 | | | | | | | | | |
| | | | | | | | | | | | | | | | |
Total Undistributed earnings | | | — | | | | 7,712,207 | | | | | | | | | |
Capital Loss Carryforward | | | — | | | | — | | | | | | | | | |
Current Year Late Year Loss Deferral | | | (69,224 | ) | | | — | | | | | | | | | |
Other book/tax temporary differences | | | 231 | (g) | | | (621,822 | )(b) | | | | | | | | |
Unrealized appreciation (depreciation) | | | (3,175,804 | ) | | | 11,754,409 | | | | | | | | | |
Tax exempt spillback | | | 50,538 | | | | — | | | | | | | | | |
| | | | | | | | | | | | | | | | |
Total accumulated earnings/(losses)—net | | $ | (3,194,259 | ) | | $ | 18,844,794 | | | | | | | | | |
| | | | | | | | | | | | | | | | |
| (a) | The difference between book-basis and tax-basis unrealized appreciation (depreciation) is attributable primarily to the tax deferral of losses on wash sales. |
| (b) | The difference between book-basis and tax-basis unrealized appreciation (depreciation) is attributable primarily to the tax deferral of losses on wash sales, tax cost adjustments related to forwards and futures, the realization for tax purposes of unrealized gains on investments in passive foreign investment companies and the difference between book and tax amortization methods for premiums on fixed income securities. |
| (c) | The difference between book-basis and tax-basis unrealized appreciation (depreciation) is attributable primarily to the tax deferral of losses on wash sales, tax cost adjustments related to forwards, and the realization for tax purposes of unrealized gains on investments in passive foreign investment companies. |
| (d) | The difference between book-basis and tax-basis unrealized appreciation (depreciation) is attributable primarily to the tax deferral of losses on wash sales, tax cost adjustments related to ROC dividends received and real estate investments, partnerships and futures. |
| (e) | The difference between book-basis and tax-basis unrealized appreciation (depreciation) is attributable primarily to the tax deferral of losses on wash sales, tax cost adjustments related to ROC dividends received and real estate investments. |
| (f) | The difference between book-basis and tax-basis unrealized appreciation (depreciation) is attributable primarily to the tax deferral of losses on wash sales and the difference between book and tax amortization methods for premiums on fixed income securities. |
243
Notes to Financial Statements
(continued)
| (g) | The difference between book-basis and tax-basis unrealized appreciation (depreciation) is attributable primarily to the difference between book and tax amortization methods for premiums on fixed income securities. |
11. Capital Loss Carry Forward
As of February 28, 2018, the Funds had the following net capital loss carryforwards remaining:
| | | | | | | | | | | | | | | | | | | | |
Year of Expiration | | Destinations
Large Cap
Equity
Fund | | | Destinations
Small-Mid
Cap Equity
Fund | | | Destinations
International
Equity Fund | | | Destinations
Equity
Income
Fund | | | Destinations
Real Assets
Fund | |
Non-expiring: | | $ | — | | | $ | — | | | $ | — | | | $ | — | | | $ | — | |
Short-Term | | | — | | | | — | | | | — | | | | — | | | | — | |
Long-Term | | | — | | | | — | | | | — | | | | — | | | | — | |
| | | | | | | | | | | | | | | | | | | | |
| | $ | — | | | $ | — | | | $ | — | | | $ | — | | | $ | — | |
| | | | | | | | | | | | | | | | | | | | |
| | | | | |
Year of Expiration | | Destinations
Core Fixed
Income
Fund | | | Destinations
Low Duration
Fixed Income
Fund | | | Destinations
Global Fixed
Income
Opportunities
Fund | | | Destinations
Municipal
Fixed
Income
Fund | | | Destinations
Multi
Strategy
Alternatives
Fund | |
Non-expiring: | | $ | — | | | $ | — | | | $ | — | | | $ | — | | | $ | — | |
Short-Term | | | — | | | | 274,522 | | | | — | | | | — | | | | — | |
Long-Term | | | — | | | | — | | | | — | | | | — | | | | — | |
| | | | | | | | | | | | | | | | | | | | |
| | $ | — | | | $ | 274,522 | | | $ | — | | | $ | — | | | $ | — | |
| | | | | | | | | | | | | | | | | | | | |
12. Subsequent Events
Management has evaluated subsequent events after the balance sheet date through the date that the financial statements were issued and has not identified any events or transactions that would require recognition or disclosure in the financial statements.
244
Report of Independent Registered Public Accounting Firm
To the Shareholders and Board of Trustees
of Brinker Capital Destinations Trust
Opinion on the Financial Statements
We have audited the accompanying statements of assets and liabilities of Destinations Large Cap Equity Fund, Destinations Small-Mid Cap Equity Fund, Destinations International Equity Fund, Destinations Equity Income Fund, Destinations Real Assets Fund, Destinations Core Fixed Income Fund, Destinations Low Duration Fixed Income Fund, Destinations Global Fixed Income Opportunities Fund, Destinations Municipal Fixed Income Fund and Destinations Multi Strategy Alternatives Fund (the “Funds”), each a series of Brinker Capital Destinations Trust (the “Trust”), including the schedules of investments, as of February 28, 2018, the related statements of operations, the statements of changes in net assets, and financial highlights for the period March 20, 2017 (commencement of operations) to February 28, 2018, and the related notes (collectively referred to as the “financial statements”). In our opinion, the financial statements present fairly, in all material respects, the financial position of the Funds as of February 28, 2018, the results of their operations, the changes in their net assets and their financial highlights for the period ended February 28, 2018, in conformity with accounting principles generally accepted in the United States of America.
Basis for Opinion
These financial statements are the responsibility of the Funds’ management. Our responsibility is to express an opinion on the Funds’ financial statements based on our audits. We are a public accounting firm registered with the Public Company Accounting Oversight Board (United States) (“PCAOB”) and are required to be independent with respect to the Funds in accordance with the U.S. federal securities laws and the applicable rules and regulations of the Securities and Exchange Commission and the PCAOB. We have served as the auditor of one or more of the funds in the Trust since 2018.
We conducted our audits in accordance with the standards of the PCAOB. Those standards require that we plan and perform the audits to obtain reasonable assurance about whether the financial statements are free of material misstatement, whether due to error or fraud. The Funds are not required to have, nor were we engaged to perform, an audit of the Funds’ internal control over financial reporting. As part of our audits we are required to obtain an understanding of internal control over financial reporting, but not for the purpose of expressing an opinion on the effectiveness of the Funds’ internal control over financial reporting. Accordingly, we express no such opinion.
Our audits included performing procedures to assess the risks of material misstatement of the financial statements, whether due to error or fraud, and performing procedures that respond to those risks. Such procedures included examining, on a test basis, evidence regarding the amounts and disclosures in the financial statements. Our audits also included evaluating the accounting principles used and significant estimates made by management, as well as evaluating the overall presentation of the financial statements. Our procedures included confirmation of securities owned as of February 28, 2018 by correspondence with the custodian, brokers, transfer agents and agent banks; when replies were not received, we performed other auditing procedures. We believe that our audits provide a reasonable basis for our opinion.
TAIT, WELLER & BAKER LLP
Philadelphia, Pennsylvania
April 30, 2018
245
Board Approval of Management Agreement and Investment Advisory Agreements
(unaudited)
Approval of Management Agreement and Subadvisory Agreements
Brinker Capital Destinations Trust (“Trust” and, each series thereof a “Fund”) and Brinker Capital, Inc. (“Manager”), have entered into an investment management agreement (“Management Agreement”). Pursuant to the Management Agreement, the Manager both selects investments in third-party funds and serves as “manager of managers” for the Trust and selects and oversees professional money managers (each, a “Sub-adviser” and collectively, the “Sub-advisers”) who are responsible for investing the portion of assets of the Funds allocated to them pursuant to investment advisory agreements (the “Subadvisory Agreements” and, together with the Management Agreement, the “Agreements”) between the Manager and each of the Sub-advisers.
The Investment Company Act of 1940, as amended (the “1940 Act”), requires that the Agreements be approved initially, as well as annually thereafter, by the Trust’s Board of Trustees (“Board”) and by a majority of the Trustees who are not “interested persons” (as defined in the 1940 Act) of any party to the Agreements (“Independent Trustees”), by vote cast in person at a meeting called for the purpose of voting on such approval. In connection with their consideration of the approval of the Agreements, the Independent Trustees must request and evaluate such information as may reasonably be necessary to make a reasonable business judgment with respect to the approval of the Agreements, and the Manager and Sub-advisers are required to provide such information.
At an in-person meeting held on January 17-18, 2017, the Board, including a majority of the Independent Trustees, approved the Agreements for an initial two-year period. In doing so, the Independent Trustees requested and received information from the Manager and the Sub-advisers that they deemed reasonably necessary for their review of the Agreements and the performance of the Manager and Sub-advisers under the Agreements. The Independent Trustees were assisted in their review by Fund counsel and met in executive sessions separate from representatives of the Manager and the Sub-advisers. In addition to the Management Agreement, the Board approved the Subadvisory Agreements with the following Sub-advisers on behalf of the indicated Fund:
| | |
Sub-adviser Name | | Fund(s)1 |
Avenue Capital Management II, L.P. | | ◆ Destinations Multi Strategy Alternatives Fund |
| |
BAMCO, Inc. | | ◆ Destinations International Equity Fund |
| |
BlackRock Investment Management, Inc. | | ◆ Destinations Core Fixed Income Fund |
| | ◆ Destinations Large Cap Equity Fund |
| |
Ceredex Value Advisors LLC | | ◆ Destinations Small-Mid Cap Equity Fund |
| |
Columbia Management Investment Advisers, LLC | | ◆ Destinations Equity Income Fund |
| | ◆ Destinations Large Cap Equity Fund |
| |
CrossingBridge Advisors, LLC | | ◆ Destinations Global Fixed Income Opportunities Fund |
| | ◆ Destinations Low Duration Fixed Income Fund |
| |
| Delaware Investments Fund Advisers/ Macquarie Investment Management | | ◆ Destinations Large Cap Equity Fund |
| |
DoubleLine Capital LP | | ◆ Destinations Core Fixed Income Fund |
| | ◆ Destinations Global Fixed Income Opportunities Fund |
| | ◆ Destinations Low Duration Fixed Income Fund |
246
Board Approval of Management Agreement and Investment Advisory Agreements
(unaudited) (continued)
| | |
Sub-adviser Name | | Fund(s)1 |
Driehaus Capital Management LLC | | ◆ Destinations Multi Strategy Alternatives Fund |
| | ◆ Destinations Small-Mid Cap Equity Fund |
| |
Federated Equity Management Company of Pennsylvania | | ◆ Destinations Equity Income Fund |
| |
Fort Washington Investment Advisors, Inc. | | ◆ Destinations Large Cap Equity Fund |
| |
LMCG Investments, LLC | | ◆ Destinations Small-Mid Cap Equity Fund |
| |
MFS Investment Management | | ◆ Destinations International Equity Fund |
| |
Northern Trust Investments, Inc. | | ◆ Destinations Municipal Fixed Income Fund |
| |
Nuveen Asset Management, LLC | | ◆ Destinations Global Fixed Income Opportunities Fund |
| |
RiverNorth Capital Management, LLC | | ◆ Destinations Multi Strategy Alternatives Fund |
| |
SailingStone Capital Partners LLC | | ◆ Destinations Real Assets Fund |
| |
T. Rowe Price Associates, Inc. | | ◆ Destinations International Equity Fund |
| | ◆ Destinations Large Cap Equity Fund |
| |
TCW Investment Management Company | | ◆ Destinations Large Cap Equity Fund |
| |
Wasatch Advisors, Inc. | | ◆ Destinations International Equity Fund |
| 1 | Approval of Subadvisory Agreement for initial two-year period occurred on January 18, 2017. Subadvisory Agreement is dated January 18, 2017 |
In voting to approve the Agreements, the Independent Trustees considered whether the approval of the Agreements would be in the best interests of the respective Fund and its shareholders, an evaluation based on several factors including those discussed below.
Nature, Extent and Quality of the Services Provided Under the Agreements
The Board received and considered information regarding the nature, extent and quality of services to be provided to the Funds by the Manager and the Sub-advisers under the Agreements. The Independent Trustees considered information regarding the process by which the Manager selected and recommended the Sub-advisers for Board approval and the Manager’s anticipated supervisory activities over the Sub-advisers, including the Manager’s process for determining how Fund assets are allocated among the applicable Sub-advisers. The Independent Trustees noted that the Manager would monitor and evaluate the performance of each Fund’s Sub-advisers, including the Sub-advisers’ compliance with the investment objective, policies, and restrictions of the relevant Fund. The Board also received a description of the proposed administrative and other services to be provided to the Trust and its shareholders. The Board noted information received at the meeting related to the proposed services to be provided by the Manager about the management of the Trust’s affairs and its role in coordinating the activities of the Sub-advisers and the Trust’s other service providers. The Board considered each
247
Board Approval of Management Agreement and Investment Advisory Agreements
(unaudited) (continued)
Sub-adviser’s proposed specific responsibilities in all aspects of the day-to-day management of the portion of the respective Fund’s assets allocated to it, as well as the qualifications, experience and responsibilities of the persons proposed to serve as the portfolio managers for the portion of the Fund’s assets managed by the respective Sub-adviser, and other key personnel at the Sub-adviser. The Board specifically took into account each Sub-adviser’s investment process and capabilities, evaluating, if applicable, how the Sub-adviser complemented each of the other Sub-advisers to the respective Fund. The Board also discussed the background and experience of each Sub-adviser’s portfolio managers. The Independent Trustees also considered the services that the Manager would provide to the Funds in directly managing a portion of the Funds’ portfolios, which would be invested in shares of third-party exchange-traded funds (“ETFs”), and the fact that the Manager would determine how best to allocate each Fund’s portfolio between passive investments in ETFs and active investments through the Sub-advisers.
The Independent Trustees also discussed the acceptability of the terms of the Sub-Advisory Agreements. The Independent Trustees considered the Manager’s favorable assessment of the nature and quality of the sub-advisory services to be provided to the Funds by the Sub-advisers. The Board also reviewed information received from the Manager and the Trust’s Chief Compliance Officer regarding the Trust’s compliance policies and procedures established pursuant to Rule 38a-1 under the 1940 Act and those of each Sub-adviser.
At the meeting, the Board reviewed the qualifications, backgrounds and responsibilities of the Trust’s senior personnel and the portfolio management team to be primarily responsible for the management of the Funds. In its discussion with the Funds’ portfolio managers, the Board elicited information about their experience with the various Sub-advisers, noting that the portfolio managers were familiar with the various Sub-advisers and their investment strategies through their experience in managing separate accounts that had exposure to the Sub-advisers’ investment strategies through investments in third-party registered investment companies. The Board also considered the Manager’s and the Sub-advisers’ brokerage policies and practices, transaction execution standards, policies and practices regarding soft dollars, and quality controls applicable to brokerage allocation procedures.
The Board concluded, in the context of its full deliberations, that, overall, the nature, extent and quality of services expected to be provided under the Management Agreement and the Subadvisory Agreements were adequate and appropriate.
Fund Performance
With respect to performance, the Funds had no history of operations at the time of the Meeting. The Board considered the historical performance of each Sub-adviser’s investment mandate, as well as the manner in which the Sub-advisers proposed to manage the Funds. The Board also evaluated the historical performance of the Manager’s separate accounts, which had exposure to the Sub-adviser’s strategies through investments in third-party registered investment companies.
The Board concluded, in the context of its full deliberations, that based on the experience of the Manager, each Sub-adviser and each Sub-adviser’s proposed portfolio managers, the Manager and Sub-advisers had a reasonable expectation of delivering acceptable performance. The Trustees determined to continue to evaluate the Funds’ performance, once available, and to continue to periodically review Fund performance with the Manager.
248
Board Approval of Management Agreement and Investment Advisory Agreements
(unaudited) (continued)
Management Fees and Expense Ratios
As to each Fund, the Board reviewed and considered the proposed contractual management fees (“Contractual Management Fees”) payable by the Fund to the Manager any by the Manager to the Sub-advisers in light of the nature, extent and quality of the management and subadvisory services provided by the Manager and the Sub-advisers, respectively. The Board also reviewed and considered whether fee waiver and/or expense reimbursement arrangements were being proposed for a Fund and considered the actual fee rate (after taking any such waivers and reimbursements into account) (“Actual Management Fee”) and whether any fee waivers and expense reimbursements could be discontinued. The Board noted that the compensation to be paid to the Sub-advisers would be paid by the Manager, not the Funds, and, accordingly, that the retention of the Sub-advisers would not increase the fees or expenses otherwise incurred by the Fund and its shareholders. Further, the Board considered that, as a result of proposed contractual advisory fee waivers, the Manager would not retain a different percentage of the overall advisory fee based on the Sub-advisers selected, the fees charged to Sub-advisers or the allocation of a Fund’s assets among Sub-advisers. The Board also reviewed with management the scope of services to be provided to the Funds by the Manager, noting that the Funds would be provided with regulatory compliance services, office facilities and Trust officers (including the Trust’s chief financial, chief operational and chief compliance officers), and that the Manager would coordinate and oversee the provision of services to each Fund by other fund service providers, including the Sub-Advisers. The Board also considered and discussed information about the Sub-advisers’ proposed fees and comparable information for other subadvised funds and accounts managed by the Sub-advisers.
The Board determined, in the context of its full deliberations, that, as to each Fund, the proposed management fee to be paid by the Fund to the Manager and the proposed sub-advisory fees to be paid by the Manager to the Sub-advisers were reasonable in light of comparative performance and expense information and the nature, extent and quality of the services expected to be provided to the Fund under the Agreements.
Manager Profitability
The Board considered the expected profits to be realized by the Manager in connection with the operation of the Funds, and whether the amount of profit would be a fair entrepreneurial profit for the management of the Funds. In particular, the Board considered that the Manager would retain a maximum amount of compensation (as a percentage of Fund assets) from each Fund. The Board also considered the expected profitability of the Manager for providing advisory services to the Funds as an overall complex, noting that the Manager implements its model-based investment advice through allocations of assets among the Funds. The Board also considered the expected reduction in investor expenses in moving from the Manager’s separate account-based platform to the Funds, noting the resulting impact on the Manager’s profitability. The Board also considered the Funds’ estimated operating expenses and the expected impact of any fee waivers and expense reimbursements on the Manager’s profits. As to each Fund, the Board concluded, in the context of its full deliberations, that the Manager’s expected level of profitability was not excessive in light of the nature, extent and quality of the services to be provided to the Fund.
Economies of Scale
As to each Fund, the Board considered information regarding whether there would be economies of scale with respect to the management of the Fund, whether the Fund would appropriately benefit from any economies of scale and whether there was potential for realization of any further economies of scale. The Board considered the various ways economies of scale could be realized and shared with Fund investors, and whether economies of scale in the provision of services to the Fund would be passed along to the shareholders. As to each Fund, the Board also noted that to the extent the Fund’s assets increased over time, the Fund and its shareholders should realize economies of scale as certain expenses, such as fixed fund fees, become a smaller percentage of overall
249
Board Approval of Management Agreement and Investment Advisory Agreements
(unaudited) (continued)
assets. The Board noted that it appeared that the benefits of any economies of scale also would be appropriately shared with shareholders through increased investment in fund management resources.
Other Benefits to the Manager and the Sub-advisers
As to each Fund, the Board considered other anticipated benefits received by the Manager, the Sub-advisers and their affiliates as a result of their relationship with the Funds, including soft dollar arrangements, receipt of brokerage and the opportunity to offer additional products and services to Fund shareholders.
In light of the Manager’s proposed costs of providing investment management and other services to the Funds and the Manager’s ongoing commitment to the Funds and each Sub-adviser’s day-to-day management of the portion of the respective Fund’s assets allocated to it, the anticipated profits and ancillary benefits that the Manager, the Sub-advisers and their affiliates could receive were considered reasonable.
Based on their discussions and considerations, including those described above, the Board approved the Management Agreement and the Subadvisory Agreements for an initial two-year period. No single factor reviewed by the Board was identified by the Board as the principal factor in determining whether to approve the Management Agreement and the Subadvisory Agreements.
250
Additional Information
(unaudited)
Trustees and Officers of the Trust
The Trust’s Board of Trustees (“Board” or “Trustees”) is responsible for overseeing the Trust’s management and operations. The Board approves all significant agreements between the Trust and the companies that furnish services to the Funds, including agreements with the Trust’s distributor, Sub-advisers, custodian, transfer agent and administrator. The Board elects officers who are responsible for the day-to-day operations of the Trust and the Funds and who execute policies authorized by the Board.
Brinker Capital, Inc. (“Manager”) serves as the investment adviser for each Fund. The Funds employ a “multi-manager” strategy. The Manager selects and oversees professional money managers (each a “Sub-adviser”) who are responsible for investing the assets of the Funds allocated to them. In addition to investment management services, the Manager monitors and supervises the services provided to the Trust by its administrator. The Manager also is responsible for conducting all operations of the Trust, except those operations contracted to the Sub-advisers, the custodian, the transfer agent and the administrator.
The names of the Trustees and officers of the Trust, their addresses and years of birth, together with information as to their principal business occupations and, for the Trustees, other board memberships they have held during the past five years, are set forth below. The executive officers of the Trust are employees of organizations that provide services to the Funds.
| | | | | | | | | | | | | | |
Name, Address and
Date of Birth | | Position(s)
Held with
Trust | | Term of Office
and Length of
Time Served* | | | Principal
Occupation(s)
During Past
Five Years | | Number of
Funds
in Fund
Complex
Overseen
by Trustee | | | Other Board
Memberships
Held During Past Five
Years by Trustee |
| | | | |
INDEPENDENT TRUSTEES | | | | | | | | | | | | |
Ellyn L. Brown Brown Associates 11055 Greenspring Ave, Annex A Lutherville, MD 21093 Birth Year: 1950 | | Chairman
of the Board of Trustees | |
| Chair as of
April 1, 2018;
Trustee Since
2017 |
| | Retired Attorney since 2006. Former Principal of Brown and Associates from 1996 to 2006. | | | 10 | | | CNO Financial, Inc. since 2012, Walter Investment Management Corp. from 2013 to 2017, NYSE Regulation, Inc. from 2010 to 2014. NYSE Euronext and predecessor entities from 2006 to 2013, Financial Industry Regulatory Authority, Inc. (FINRA) from 2007 to 2012, Financial Accounting Foundation, Inc. from 2007 to 2012 |
251
Additional Information
(unaudited) (continued)
| | | | | | | | | | |
Name, Address and
Date of Birth | | Position(s)
Held with
Trust | | Term of Office
and Length of
Time Served* | | Principal
Occupation(s)
During Past
Five Years | | Number of
Funds
in Fund
Complex
Overseen
by Trustee | | Other Board
Memberships
Held During Past Five
Years by Trustee |
J. Scott Coleman, CFA 7 Forest Road Wayne, PA 19087 Birth Year: 1960 | | Trustee | | Since 2017 | | Retired since 2015. President and CEO of Optimum Fund Trust from 2011 to 2015. President of Delaware Distributors from 2008 to 2015. Executive Vice President, Head of Distribution and Marketing, Delaware Investments 2008 to 2015. In addition, Head of Macquarie Investment Management EMEA Distribution from 2012 to 2015. Managing Director at Goldman Sachs & Co. from 2001 to 2008. | | 10 | | Optimum Fund Trust from 2011 to 2015. |
| | | | | |
Nicholas Marsini, Jr. 120 St. Moritz Drive Wilmington, DE 19807 Birth Year: 1955 | | Trustee,
Chair of
Audit
Committee | | Since 2017 | | Retired since 2016. Regional President of PNC Delaware from 2011to 2016. Executive Vice President and Chief Financial Officer of PNC Global Investment Servicing from 1997 to 2010. | | 10 | | FundVantage Trust. |
| | | | | |
Gregory E. McGowan Franklin Templeton 300 SE 2nd Street Fort Lauderdale, FL 33301 Birth Year: 1949 | | Trustee | | Since 2017 | | Senior Strategic Advisor, Franklin Templeton Investments since 2016. Executive Vice President, Director and General Counsel of Templeton International, Inc.from 1992 to 2016. Executive Vice President, Secretary and General Counsel of Templeton Global Advisors Limited (a Bahamian corporation) from 1992 to 2016. | | 10 | | Global Capital PLC (Malta Public Company), Franklin Templeton Sealand Fund Management Co. Ltd., China Life Franklin Asset Management Company Limited |
252
Additional Information
(unaudited) (continued)
| | | | | | | | | | |
Name, Address and
Date of Birth | | Position(s)
Held with
Trust | | Term of Office
and Length of
Time Served* | | Principal
Occupation(s)
During Past
Five Years | | Number of
Funds
in Fund
Complex
Overseen
by Trustee | | Other Board
Memberships
Held During Past Five
Years by Trustee |
|
INTERESTED TRUSTEES |
Joseph V. Del Raso** Pepper Hamilton LLP 3000 Two Logan Square, 18th & Arch Streets Philadelphia, PA 19103-2799 Birth Year: 1952 | | Trustee | | Since 2017 (Chair of the Board until April 1, 2018). | | Partner at Pepper Hamilton LLP (law firm) since 1998. | | 10 | | Global Capital PLC (Malta Public Company) |
| | | | | |
Noreen D. Beaman*** Brinker Capital, Inc. 1055 Westlakes Drive, Suite 250 Berwyn, PA 19312 Birth Year: 1964 | | Trustee
and Chief
Executive
Officer | | Since 2018 | | Chief Executive Officer of Brinker Capital, Inc. since 2012. | | 10 | | PIMCO RIA Advisory Board, MMI Board of Governors, MMI Leadership Pathway, Envestnet Institute Women In Wealth; St. Peter’s University Board of Trustees (2014 to 2017) |
| | | | | | | | | | |
Name, Address and
Date of Birth | | Position(s)
Held with
Trust | | | Term of Office****
and Length of
Time Served | | | Principal
Occupation(s)
During Past
Five Years |
| | | |
OFFICERS | | | | | | | | | | |
Philip Green, Jr. Brinker Capital, Inc. 1055 Westlakes Drive, Suite 250 Berwyn, PA 19312 Birth Year: 1970 | |
| Chief Financial
Officer &
Treasurer |
| |
| Since January
2017 |
| | Chief Financial Officer, Brinker Capital Holdings Inc., Brinker Capital Inc. and Brinker Capital Securities since 2000. |
| | | |
Brian Ferko Brinker Capital, Inc. 1055 Westlakes Drive, Suite 250 Berwyn, PA 19312 Birth Year: 1971 | |
| Chief Compliance
Officer &
Anti-Money
Laundering
Officer |
| |
| Since January
2017 |
| | Chief Compliance Officer of Brinker Capital, Inc. since 2015; Chief Compliance Officer of Brinker Capital, Inc. contracted through Cipperman Compliance Services from 2010 to 2015; Chief Operating Officer of CCS from 2012 to 2015. |
| | | |
Jason B. Moore Brinker Capital, Inc. 1055 Westlakes Drive, Suite 250 Berwyn, PA 19312 Birth Year: 1972 | | | President | | |
| Since January
2017 |
| | Chief Administrative Officer, Brinker Capital, Inc. since 2016; Managing Director, Morgan Stanley from 2012 to 2016. |
253
Additional Information
(unaudited) (continued)
| | | | | | |
Name, Address and
Date of Birth | | Position(s)
Held with
Trust | | Term of Office****
and
Length of
Time
Served | | Principal
Occupation(s)
During Past
Five Years |
Donna Marley Brinker Capital, Inc. 1055 Westlakes Drive, Suite 250 Berwyn, PA 19312 Birth Year: 1955 | | Chief Operating
Officer | | Since
April
2017 | | Senior Vice President of Funds, Brinker Capital, Inc. since 2017; Executive Director, Morgan Stanley (2009-2017) |
| | | |
Peter Townsend Brinker Capital, Inc. 1055 Westlakes Drive, Suite 250 Berwyn, PA 19312 Birth Year: 1977 | | Secretary &
Deputy Chief
Compliance
Officer | | Since
January
2017 | | Deputy Funds Chief Compliance Officer at Brinker Capital, Inc. since 2017; Director of Compliance at Penn Capital Management Company, Inc. from 2015 to 2017; Director of Compliance at Cipperman Compliance Services from 2013 to 2015; Associate at J.P. Morgan Chase & Co. from 2008 to 2013. |
| | | |
Charles Widger Brinker Capital, Inc. 1055 Westlakes Drive, Suite 250 Berwyn, PA 19312 Birth Year: 1945 | | Investment
Officer | | Since
January
2017 | | Executive Chairman of Brinker Capital, Inc. since 2012. |
| | | |
Jeffrey Raupp, CFA Brinker Capital, Inc. 1055 Westlakes Drive, Suite 250 Berwyn, PA 19312 Birth Year: 1969 | | Investment
Officer | | Since
January
2017 | | Director of Investments of Brinker Capital, Inc. since 2017; Senior Vice President of Brinker Capital, Inc. in2016; Senior Investment Manager of Brinker Capital, Inc. from 2008 to 2016. |
| | | |
Amy Magnotta, CFA Brinker Capital, Inc. 1055 Westlakes Drive, Suite 250 Berwyn, PA 19312 Birth Year: 1978 | | Investment
Officer | | Since
January
2017 | | Senior Vice President and Head of Discretionary Portfolios of Brinker Capital Inc. since 2017; Senior Investment Manager of Brinker Capital, Inc. from 2008 to 2017. |
| | | |
Leigh Lowman, CFA Brinker Capital, Inc. 1055 Westlakes Drive, Suite 250 Berwyn, PA 19312 Birth Year: 1982 | | Investment
Officer | | Since
January
2017 | | Investment Manager, Brinker Capital, Inc. since 2017; Senior Investment Analyst, Brinker Capital, Inc. from 2015 to 2017; Outreach Analyst, The Investment Fund for Foundations from 2014 to 2015; Senior Associate, Mondrian Investment Partners from 2011 to 2014. |
254
Additional Information
(unaudited) (continued)
| | | | | | |
Name, Address and
Date of Birth | | Position(s)
Held with
Trust | | Term of Office****
and
Length of
Time
Served | | Principal
Occupation(s)
During Past
Five Years |
| | | |
Christopher Hart Brinker Capital, Inc. 1055 Westlakes Drive, Suite 250 Berwyn, PA 19312 Birth Year: 1971 | | Investment
Officer | | Since
January
2017 | | Senior Vice President and Head of Platform Manager Research at Brinker Capital, Inc. since 2017; Senior Vice President in 2016; Core Investment Manager at Brinker Capital, Inc. from 2014 to 2016; Investment Director at RS Investments 2013; Vice President/Investment Officer at Morgan Stanley Smith Barney from 2006 to 2013. |
| | | |
Timothy Holland, CFA Brinker Capital, Inc. 1055 Westlakes Drive, Suite 250 Berwyn, PA 19312 Birth Year: 1969 | | Investment
Officer | | Since
June
2017 | | Senior Vice President and Global Investment Strategist of Brinker Capital, Inc. since 2017; Co-Head US Sub Advisory of Pictet Asset Management in 2016; Portfolio Manager and Partner of TAMRO Capital Partners from 2005 to 2016. |
| * | Each Trustee remains in office until he or she resigns, retires or is removed. |
| ** | Mr. Del Raso became an “interested” Trustee (as such term is defined under Section 2(a)(19) of the Investment Company Act) as of April 1, 2018. |
| *** | At a meeting of the Board of Trustees held on March 8, 2018, the Board appointed Ms. Beaman to the Board, effectively replacing Mr. John E. Coyne, who left Brinker Capital at the end of 2017 and resigned from the Board effective March 8, 2018. |
| **** | The President, Treasurer and Secretary hold office until their respective successors are chosen and qualified or until he or she sooner dies, resigns, is removed or becomes disqualified. Each of the other officers serves at the pleasure of the Board. |
Board Composition and Leadership Structure
As of April 1, 2018, four of the six Trustees on the Board (66.67%) are not “interested persons” (as defined in the 1940 Act) of the Trust and as such are not affiliated with the Manager or any Sub-adviser (“Independent Trustees”). Effective April 1, 2018, the Board appointed Ms. Brown, an Independent Trustee, to serve as Chair of the Board. Prior to April 1, 2018, Mr. Del Raso served as Chair of the Board. With Mr. Del Raso’s change in status from independent to interested effective April 1, 2018, the Board determined that Ms. Brown should be elected as Chair. In making this determination, the Board considered, among other factors, industry best practices.
There is one primary committee of the Board: the Audit Committee. The Audit Committee is chaired by an Independent Trustee and comprised solely of Independent Trustees. Effective April 1, 2018, Mr. Del Raso stepped down from the Audit Committee, due to his change in status from independent to interested. The Board has determined that this leadership structure is appropriate given the specific characteristics and circumstances of the Trust and in light of the services that the Manager and its affiliates and the Sub-advisers provide to the Trust and potential conflicts of interest that could arise from these relationships. The Board believes that the existing Board structure is appropriate because, among other things, it allows the Independent Trustees to exercise independent business judgment in evaluating the Trust’s management and service providers.
255
Additional Information
(unaudited) (continued)
Board Oversight of Risk Management
The Board considers risk management issues as part of its general oversight responsibilities. As is the case with virtually all investment companies (as distinguished from operating companies), service providers to the Trust, primarily the Manager and its affiliates and the Sub-advisers, have responsibility for the day-to-day management of the Funds, which includes responsibility for risk management (including management of investment performance and investment risk, valuation risk, issuer and counterparty credit risk, compliance risk and operational risk). As part of its oversight, the Board, acting at its scheduled meetings, or the Chairman of the Board or the appropriate Committee, acting between Board meetings, regularly interacts with and receives reports from senior personnel of service providers, including the Manager’s investment officers, the Trust’s and the Manager’s Chief Compliance Officer (“CCO”) and the Sub-advisers’ portfolio management personnel. The Board’s Audit Committee meets during its scheduled meetings, and between meetings the Audit Committee chair maintains contact, with the Trust’s independent registered public accounting firm and the Trust’s Chief Financial Officer. The Board receives periodic presentations from senior personnel of the Manager or its affiliates regarding investment performance of the Funds and the applicable investment risk management process. The Board also receives periodic presentations from senior personnel of the Manager or its affiliates and the Sub-advisers regarding risk management generally, as well as periodic presentations regarding specific operational, compliance or investment areas, such as business continuity, anti-money laundering, cybersecurity, personal trading, valuation, credit, investment research, portfolio trading and transactions, and securities lending. The Board has adopted policies and procedures designed to address certain risks to the Funds. In addition, the Manager and other service providers to the Trust have adopted a variety of policies, procedures and controls designed to address particular risks to the Funds. Different processes, procedures and controls are employed with respect to different types of risks. However, it is not possible to eliminate all of the risks applicable to the Funds. The Board also receives reports from counsel to the Trust or counsel to the Manager and the Independent Trustees’ own independent legal counsel regarding regulatory compliance and governance matters. The Board’s oversight role does not make the Board a guarantor of the Funds’ investments or activities.
Individual Trustee Qualifications
The Board believes that each Trustee’s experience, qualifications, attributes or skills on an individual basis and in combination with those of the other Trustees lead to the conclusion that the Board possesses the requisite attributes and skills to effectively oversee the management of the Trust and the interests of Fund shareholders. The Board believes that the significance of each Trustee’s experience, qualifications, attributes or skills is an individual matter (meaning that experience that is important for one Trustee may not have the same value for another) and that these factors are best evaluated at the Board level, with no single Trustee, or particular factor, being indicative of Board effectiveness. However, the Board believes that Trustees must have the ability to critically review, evaluate, question and discuss information provided to them, and to interact effectively with Trust management, service providers and counsel, in order to exercise effective business judgment in the performance of their duties. The Board believes that the Trustees satisfy this standard. Experience relevant to having this ability may be achieved through a Trustee’s educational background; business, professional training or practice (e.g., accounting or law), public service or academic positions; experience from service as a board member (including the Board of the Trust) or as an executive of investment funds, public companies or significant private or not-for-profit entities or other organizations; and/or other life experiences. The Board noted that most of the Trustees had experience serving as directors on the boards of operating companies and/or other investment companies. The Board considered that the various Trustees have or had careers in the financial services or investment management industries, including holding executive positions in companies engaged in these industries, which allows these Trustees to bring valuable, relevant experience as members of the Board.
��
256
Additional Information
(unaudited) (continued)
Board Committees
The Trust has an Audit Committee. The members of the Audit Committee consist of all the Independent Trustees of the Trust, namely Ms. Brown, Mr. Coleman, Mr. Marsini, Jr. and Mr. McGowan. The Board also at times may constitute other committees of the Board to assist in the evaluation of specific matters.
The Audit Committee oversees each Fund’s audit, accounting and financial reporting policies and practices and its internal controls. The Audit Committee approves, and recommends to the Board for its ratification, the selection, appointment, retention or termination of the Trust’s independent registered public accounting firm and approves the compensation of the independent registered public accounting firm. The Audit Committee also approves all audit and permissible non-audit services provided to each Fund by the independent registered public accounting firm and all permissible non-audit services provided by the Trust’s independent registered public accounting firm to the Manager and any affiliated service providers if the engagement relates directly to Fund operations and financial reporting. The Audit Committee met once during the Trust’s most recent fiscal year.
257
Important Tax Information
(unaudited)
The following information is provided with respect to the distributions paid during the taxable year ended February 28, 2018:
| | | | | | | | | | | | | | | | | | | | |
| | | Destinations
Large Cap
Equity
Fund | | | Destinations
Small-Mid
Cap Equity
Fund | | | Destinations
International
Equity
Fund | | | Destinations
Equity
Income
Fund | | | Destinations
Real Assets
Fund | |
Ordinary Income: | | | | | | | | | | | | | | | | | | | | |
Qualified Dividend Income for Individuals | | | 100 | % | | | 58.86 | % | | | 96.91 | % | | | 74.94 | % | | | 6.63 | % |
Dividends Qualifying for the Dividends Received Deduction for Corporations | | | 100 | % | | | 59.53 | % | | | 3.09 | % | | | 56.19 | % | | | 1.85 | % |
Foreign Taxes Paid | | | | | | | | | | $ | 889,506 | | | | | | | | | |
Foreign Source Income | | | | | | | | | | $ | 13,044,591 | | | | | | | | | |
Foreign Tax Paid Per Share | | | — | | | | — | | | | 0.01 | | | | — | | | | — | |
Foreign Source Income Per Share | | | — | | | | — | | | | 0.11 | | | | — | | | | — | |
| | | | | |
| | | Destinations
Core Fixed
Income
Fund | | | Destinations
Low Duration
Fixed Income
Fund | | | Destinations
Global Fixed
Income
Opportunities
Fund | | | Destinations
Municipal
Fixed
Income
Fund | | | Destinations
Multi
Strategy
Alternatives
Fund | |
Ordinary Income: | | | | | | | | | | | | | | | | | | | | |
Qualified Dividend Income for Individuals | | | — | | | | — | | | | 2.93 | % | | | — | | | | 33.07 | % |
Dividends Qualifying for the Dividends Received Deduction for Corporations | | | — | | | | — | | | | 2.93 | % | | | — | | | | 33.30 | % |
Interest from Tax-Exempt Obligations | | | — | | | | — | | | | — | | | | 100 | % | | | — | |
258

Brinker Capital Destinations Trust
Investment Adviser
Brinker Capital, Inc.
1055 Westlakes Drive, Suite 250
Berwyn, PA 19312
www.brinkercapital.com
Distributor
Foreside Fund Services, LLC
Three Canal Plaza, Suite 100
Portland, ME 04101
www.foreside.com
Legal Counsel
Morgan, Lewis & Bockius LLP
1701 Market Street
Philadelphia, PA 19103
www.morganlewis.com
This report is submitted for the general information of the shareholders of the Fund. It is not authorized for distribution to prospective investors unless preceded or accompanied by an effective prospectus, which includes information regarding the Fund’s risk, objectives, fees and expenses, experience of its management, and other information.
Visit www.destinationsfunds.com for more information.
ITEM 2. CODE OF ETHICS.
As of the period ended February 28, 2018 (“Reporting Period”), the Registrant has adopted a code of ethics (“Code”) that applies to the Registrant’s principal executive officer, principal financial officer, principal accounting officer or controller, or persons performing similar functions, regardless of whether these individuals are employed by the Registrant or a third party. The Registrant has not amended any provision in its Code that relates to an element of the Code’s definitions enumerated in paragraph (b) of Item 2 of this Form N-CSR. A copy of this Code is filed as an Exhibit to this Form N-CSR pursuant to Item 13(a)(1). The Registrant has not granted any waiver, including any implicit waiver, from a provision of its Code to the Registrant’s principal executive officer, principal financial officer, principal accounting officer or controller, or persons performing similar functions, regardless of whether these individuals are employed by the Registrant or a third party.
ITEM 3. AUDIT COMMITTEE FINANCIAL EXPERT.
The Board of Trustees of the Registrant has determined that Nicholas Marsini Jr. possesses the attributes identified in Instruction (b) of Item 3 to Form N-CSR to qualify as an “audit committee financial expert,” and has designated Mr. Marsini as the Registrant’s audit committee financial expert. Mr. Marsini is an “independent” Trustee pursuant to paragraph (a)(2) of Item 3 to Form N-CSR.
ITEM 4. PRINCIPAL ACCOUNTANT FEES AND SERVICES.
The Funds commenced operations during the fiscal year ended February 28, 2018. Accordingly, the fees disclosed in items (a) through (h) below are disclosed for the fiscal year ended February 28, 2018 only.
AUDIT FEES –
(a) Audit Fees. The aggregate fees billed for the fiscal year ended February 28, 2018, for professional services rendered by the Registrant’s principal accountant (“Auditor”) for the audit of the Registrant’s annual financial statements, or services that are normally provided by the Auditor in connection with the statutory and regulatory filings or engagements for the last fiscal year, was $175,000 in 2018.
(b) Audit-Related Fees. The aggregate fees billed for the last fiscal year ended February 28, 2018, for assurance and related services by the Auditor that were reasonably related to the performance of the audit of the Registrant’s financial statements and were not reported under paragraph (a) of this Item 4, was $0 in 2018.
(c) Tax Fees. The aggregate fees billed for the fiscal year ended February 28, 2018, for professional services rendered by the Auditor for tax compliance, tax advice and tax planning (“Tax Services”) were $25,000 in 2018. These services consisted of (i) review or preparation of U.S. federal, state, local and excise tax returns; (ii) U.S. federal, state and local tax planning, advice and assistance regarding statutory, regulatory or administrative developments, and (iii) tax advice regarding tax qualification matters and/or treatment of various financial instruments held or proposed to be acquired or held.
(d) All Other Fees. The aggregate fees billed for the fiscal year ended February 28, 2018, for products and services provided by the Auditor to the Registrant, other than the services reported in paragraphs (a) through (c) of this Item 4, were $0 for 2018.
(e)(1) The Charter for the Audit Committee (“Committee”) of the Brinker Capital Destinations Trust provides that the Committee may pre-approve all audit and permitted non-audit services the independent auditor provides to a Fund, and all services that the independent auditor provides to the Fund’s investment adviser(s) and advisory affiliates (whether or not directly related to the Fund’s operations and financial reporting); except that (a) services provided to a sub-adviser whose role is primarily portfolio management and is sub-contracted or overseen by another investment adviser, and (b) de minimis non-audit services, shall not require pre-approval
(e)(2) The percentage of services described in each of paragraphs (b) through (d) of this Item that were approved by the audit committee pursuant to paragraph (c)(7)(i)(c) of Rule 2-01 of Regulation S-X, with respect to: Audit-Related Fees were 0% for 2018; Tax Fees were 0% for 2018; and Other Fees were 0% for 2018.
(f) Not Applicable.
(g) Aggregate non-audit fees billed by the Auditor for services rendered to the Registrant and the Registrant’s investment adviser (not including any sub-adviser whose role is primarily portfolio management as is subcontracted with or overseen by another investment adviser), and any entity controlling, controlled by, or under common control with the adviser that provides ongoing services to the Registrant for the last fiscal year of the Registrant (“Service Affiliates”) were $0 for 2018.
(h) The Registrant’s Audit Committee has considered whether the provision of non-audit services that were rendered to Service Affiliates that were not pre-approved pursuant to paragraph (c)(7)ii of Rule 2-01 of Regulation S-X is compatible with maintaining the Auditor’s independence.
ITEM 5. AUDIT COMMITTEE OF LISTED REGISTRANTS.
Not Applicable.
ITEM 6. INVESTMENTS.
| (a) | A Schedule of Investments in securities of unaffiliated issuers as of the close of the Reporting Period is included as part of the report to shareholders filed under Item 1 of this Form N-CSR. |
ITEM 7. DISCLOSURE OF PROXY VOTING POLICIES AND PROCEDURES FOR CLOSED-END MANAGEMENT INVESTMENT COMPANIES.
Not Applicable.
ITEM 8. PORTFOLIO MANAGERS OF CLOSED-END MANAGEMENT INVESTMENT COMPANIES.
Not Applicable.
ITEM 9. PURCHASES OF EQUITY SECURITIES BY CLOSED-END MANAGEMENT INVESTMENT COMPANIES AND AFFILIATED PURCHASERS.
Not Applicable.
ITEM 10. SUBMISSION OF MATTERS TO A VOTE OF SECURITY HOLDERS.
There have been no material changes to the procedures by which the shareholders may recommend nominees to the Registrant’s Board of Trustees, where those changes were implemented after the Registrant last provided disclosure in response to the requirements of Item 407(c)(2)(iv) of Regulation S-K (as required by Item 22(b)(15) of Schedule 14A (17 CFR 240.14a-101)), or this Item.
ITEM 11. CONTROLS AND PROCEDURES.
(a) The Registrant’s principal executive officer and principal financial officer, or persons performing similar functions, have concluded that the Registrant’s disclosure controls and procedures (as defined in Rule 30a-3(c) under the Investment Company Act of 1940, as amended (17 CFR 270.30a-3(c)) were effective, as of a date within 90 days of the filing date of this report, based on their evaluations of these disclosure controls and procedures as required by Rule 30a-3(b) under the Investment Company Act of 1940, as amended (17 CFR 270.30a-3(b)), and
Rules 13a-15(b) or 15d-15(b) under the Securities Exchange Act of 1934, as amended (17 CFR 240.13a-15(b) or 240.15d-15(b)).
(b) There were no changes in the Registrant’s internal control over financial reporting (as defined in Rule 30a-3(d) under the Investment Company Act of 1940, as amended (17 CFR 270.30a-3(d)), that occurred during the Registrant’s fiscal year ended February 28, 2018 that has materially affected, or is reasonably likely to materially affect, the Registrant’s internal control over financial reporting.
ITEM 12. DISCLOSURE OF SECURITIES LENDING ACTIVITIES FOR CLOSED-END MANAGEMENT INVESTMENT COMPANIES.
Not Applicable.
ITEM 13. EXHIBITS.
(a)(1) Code of ethics, or any amendment thereto, that is the subject of disclosure required by Item 2 is attached hereto.
(a)(2) Certifications pursuant to Rule 30a-2(a) under the Investment Company Act of 1940, as amended (17 CFR 270.30a-2(a)) are attached hereto.
(a)(3) Not Applicable.
(a)(4) Not Applicable.
(b) Certifications pursuant to 18 U.S.C. Section 1350 as adopted pursuant to Section 906 of the Sarbanes-Oxley Act of 2002 are attached hereto.
SIGNATURES
Pursuant to the requirements of the Securities Exchange Act of 1934 and the Investment Company Act of 1940, the Registrant has duly caused this Report to be signed on its behalf by the undersigned, thereunto duly authorized.
| | |
| Brinker Capital Destinations Trust |
| |
| By: | | /s/ Jason B. Moore |
| | Jason B. Moore |
| | President |
| |
| Date: | | May 3, 2018 |
Pursuant to the requirements of the Securities Exchange Act of 1934 and the Investment Company Act of 1940, this report has been signed below by the following persons on behalf of the Registrant and in the capacities and on the dates indicated.
| | |
| By: | | /s/ Jason B. Moore |
| | Jason B. Moore |
| | President |
| |
| Date: | | May 3, 2018 |
| | |
| Brinker Capital Destinations Trust |
| |
| By: | | /s/ Philip Green, Jr. |
| | Philip Green, Jr. |
| | Chief Financial Officer |
| |
| Date: | | May 3, 2018 |