
Subordinated Notes Offering Presentation January 2022 CONFIDENTIAL
2 Table of Contents I. II. III. IV. V. VI. VII. Executive Summary Company Overview Assets Highlights Liabilities Highlights Capital Highlights Income Statement Highlights Appendix 5 18 22 30 33 36 43
3 Notice to Recipients This confidential presentation (this “Presentation”) has been prepared solely for general informational purposes by Southern States Bancshares, Inc. (the “Company,” the “holding company,” “we” or “our”), and is being furnished solely for use by prospective participants in considering participation in the proposed private offering (the “Offering”) of the Company’s subordinated notes (the “Securities”). The Company reserves the right to withdraw or amend this offering for any reason and to reject any subscription in whole or in part. The Company has authorized Performance Trust Capital Partners, LLC (“Performance Trust”) to act as its sole placement agent in the Offering. The Securities are not a deposit or bank account, and are not, and will not be, insured or guaranteed by the Federal Deposit Insurance Corporation (the “FDIC”) or any other federal or state government agency. Neither the Securities nor the investment in the Securities has not been approved or disapproved by the Securities and Exchange Commission (the “SEC”), the FDIC, the Board of Governors of the Federal Reserve System, or any other federal or state regulatory authority, nor has any authority passed upon or endorsed the merits of the Offering or the accuracy or adequacy of this Presentation. Any representation to the contrary is a criminal offense. The offer to invest in the Securities of the Company and the sale thereof have not been registered under the Securities Act of 1933, as amended, or any state securities laws, and may not be reoffered or resold absent registration or an exemption from registration under applicable law. The Securities will be subject to significant restrictions and limitations on their liquidity. Only potential investors who can bear the risk of an unregistered illiquid investment should consider investment in the Securities described herein. The Securities are being offered only to individuals and entities that qualify as an “accredited investor,” as defined in Rule 501(a) of Regulation D promulgated under the Securities Act of 1933, as amended, and qualified institutional buyers. This Presentation does not constitute an offer to sell, or a solicitation of an offer to buy, any securities of the Company by any person in any jurisdiction in which it is unlawful for such person to make such an offering or solicitation. This Presentation has been prepared based on information regarding our operations, as well as information from public sources. The information contained herein is intended only as an outline and summary that has been prepared to assist interested parties in making their own evaluations of the Company. It does not purport to be all- inclusive or to contain all of the information that a prospective participant may desire. Each recipient of the information and data contained herein should perform its own independent investigation and analysis of the Offering and the value of the Company. The information and data contained herein are not a substitute for a recipient’s independent evaluation and analysis. In making an investment decision, prospective participants must rely on their own examination of the Company, including the merits and risks involved. The Company is not providing you with any legal, business, tax or other advice regarding an investment in the Securities. Prospective participants are urged to consult with their own legal, tax, investment and accounting advisers with respect to the consequences of an investment in the Securities. In the event that any portion of this Presentation is inconsistent with or contrary to any of the terms of the subordinated note purchase agreement (the “NPA”), the NPA shall control. Except as otherwise indicated, this Presentation speaks as of the date hereof. The delivery of this Presentation shall not, under any circumstances, create any implication that there has been no change in the affairs of the Company after the date hereof. Certain of the information contained herein may be derived from information provided by industry sources. The Company believes that such information is accurate and that the sources from which it has been obtained are reliable. The Company cannot guarantee the accuracy of such information, however, and has not independently verified such information. The Company is not making any implied or express representation or warranty as to the accuracy or completeness of the information summarized herein or made available in connection with any further investigation of the Company. The Company expressly disclaims any and all liability which may be based on such information, errors therein or omissions therefrom. You will be given the opportunity to ask questions of and receive answers from Company representatives concerning the Company’s business and the terms and conditions of the Offering, and the Company may provide you with additional relevant information that you may reasonably request to the extent the Company possesses such information or can obtain it without unreasonable effort or expense. Except for information provided in response to such requests, the Company has not authorized any other person to give you information that is not found in this Presentation. If such unauthorized information is obtained or provided, the Company cannot and does not assume responsibility for its accuracy, credibility, or validity. This Presentation may contain statistics and other data that in some cases has been obtained from or compiled from information made available by third-party service providers. The Company makes no representation or warrants, express or implied, with respect to the accuracy, reasonableness or completeness of such information. No representation or warranty as to the accuracy, completeness, or fairness of any of the foregoing information is being made by the Company or any other person, including Performance Trust, and neither the Company nor any other person shall have any liability for any information contained herein, or for any omissions from this Presentation or any other written or oral communications transmitted or made available to the recipient by the Company or any other person in the course of the recipient’s evaluation of the Offering, except for any liabilities expressly assumed by the Company in the NPA and the related documentation for each purchase of Securities. This Presentation is for information purposes only and is being furnished on a confidential basis to a limited number of institutional accredited investors and qualified institutional buyers. The information in this Presentation is confidential and may not be reproduced or redistributed, passed on or divulged, directly or indirectly, to any other person. The Company reserves the right to request the return of this Presentation at any time. In addition to reporting GAAP results, the Company reports non-GAAP financial measures in this presentation and other disclosures. Our management believes that these non-GAAP financial measures and the information they provide are useful to investors since these measures permit investors to view our performance using the same tools that our management uses to evaluate our performance. While we believe that these non-GAAP financial measures are useful in evaluating our performance, this information should be considered as supplemental in nature and not as a substitute for or superior to the related financial information prepared in accordance with GAAP. Additionally, these non-GAAP financial measures may differ from similar measures presented by other companies. For a reconciliation of the non- GAAP measures we use to the most comparable GAAP measures, see the Appendix to this presentation.
4 Offering Disclaimer Any offering of Securities may be made only by the NPA and the information contained herein will be superseded in its entirety by such NPA. Each potential investor should review the NPA, make such investigation as it deems necessary to arrive at an independent evaluation of an investment in the Securities and should consult legal counsel and financial, accounting, regulatory and tax advisors to determine the consequences of such an investment prior to making an investment decision and should not rely on any information set forth in this Presentation. This Presentation and oral statements made from time to time by the Company’s representatives may constitute “forward-looking statements" within the meaning of Section 27A of the Securities Act of 1933, as amended, and Section 21E of the Security Exchange Act of 1934, as amended, that are subject to risks and uncertainties. You should not place undue reliance on those statements because they are subject to numerous risks and uncertainties relating to the Company’s operations and business environment, all of which are difficult to predict and may be beyond our control. Forward-looking statements include information concerning the Company’s future results, interest rates and the interest rate environment, loan and deposit growth, loan performance, operations, employees and business strategy. These statements often include words such as "may," "believe," "expect," "anticipate," "intend," “potential,” “opportunity,” “could,” “project,” “seek,” “should,” “will,” “would,” "plan," "estimate" or other similar expressions. Forward-looking statements are not a guarantee of future performance or results, are based on information available at the time the statements are made and involve known and unknown risks, uncertainties and other factors that could cause our actual results to differ materially from the information in the forward-looking statements and can change as a result of many possible events or factors, not all of which are known to us or in our control. These factors include but are not limited to: (i) potential risks and uncertainties relating to the effects of COVID-19, including the duration of the COVID-19 outbreak, actions that have been and will be taken by governmental authorities to contain the COVID-19 outbreak or to treat its impact, and the potential negative impacts of COVID-19 on the global economy and financial markets, including U.S. GDP decreases and increases in unemployment; (ii) our ability to execute and prudently manage our growth and execute our strategy, including expansion activities; (iii) our ability to adequately measure and limit our credit risk; (iv) business, market and economic conditions generally and in the financial services industry, nationally and within our local markets; (v) factors that can impact the performance of our loan portfolio, including real estate values and liquidity in our markets and the financial health of our commercial borrowers; (vi) the failure of assumptions and estimates, as well as differences in, and changes to, economic, market, and credit conditions, including changes in borrowers’ credit risks and payment behaviors; (vii) compliance with governmental and regulatory requirements, including the Dodd-Frank Act and others relating to banking, consumer protection, securities and tax matters, and our ability to maintain licenses required in connection with mortgage origination, sale and servicing operations; (viii) compliance with the Bank Secrecy Act, OFAC rules and anti-money laundering laws and regulations; (ix) governmental monetary and fiscal policies; (x) the effectiveness of our risk management framework, including internal controls; (xi) the composition of and changes in our management team and our ability to attract and retain key personnel; (xii) geographic concentration of our business in certain Alabama and Georgia markets; (xiii) our ability to attract and retain customers; (xiv) the risks of changes in interest rates on the levels, composition and costs of deposits, loan demand, and the values and liquidity of loan collateral, securities, and interest-sensitive assets and liabilities, and the risks and uncertainty of the amounts realizable; (xv) changes in the availability and cost of credit and capital in the financial markets, and the types of instruments that may be included as capital for regulatory purposes; (xvi) changes in the prices, values and sales volumes of residential and commercial real estate; (xvii) the effects of competition from a wide variety of local, regional, national and other providers of financial, investment, trust and other wealth management services and insurance services, including the disruption effects of financial technology and other competitors who are not subject to the same regulations as the Company; (xviii) the failure of assumptions and estimates underlying the establishment of allowances for possible loan losses and other asset impairments, losses, valuations of assets and liabilities and other estimates; (xix) the risks of mergers, acquisitions and divestitures, including, without limitation, the related time and costs of implementing such transactions, integrating operations as part of these transactions and possible failures to achieve expected gains, revenue growth and/or expense savings from such transactions; (xx) changes in technology or products that may be more difficult, costly, or less effective than anticipated; (xxi) systems failures or interruptions involving our risk management framework, our information technology and telecommunications systems or third-party servicers; (xxii) unauthorized data access, cyber-crime and other threats to data security and customer privacy; (xxiii) our ability to maintain our historical rate of growth; (xxiv) our ability to identify potential candidates for, consummate, and achieve synergies resulting from, potential future acquisitions; (xxv) deterioration of our asset quality or the value of collateral securing loans; (xxvi) changes in the laws, rules, regulations, interpretations or policies relating to financial institutions, accounting, tax, trade, monetary and fiscal matters and appropriate compliance with applicable law and regulation; (xxvii) operational risks associated with our business; (xxviii) volatility and direction of market interest rates and the shape of the yield curve; (xxix) our ability to maintain important deposit customer relationships, maintain our reputation or otherwise avoid liquidity risks; (xxx) the obligations associated with being a public company; (xxxi) the commencement and outcome of litigation and other legal proceedings against us or to which we may become subject; (xxxii) natural disasters and adverse weather, acts of terrorism, an outbreak of hostilities or other international or domestic calamities as well as national and international economic conditions and health issues, such as COVID-19, and other matters beyond our control and (xxxii) other factors disclosed by the Company in its filings with the SEC. All statements in this Presentation, including forward-looking statements, speak only as of the date they are made. Although the Company believes that these forward-looking statements are based on reasonable assumptions, beliefs and expectations, if a change occurs or our beliefs, assumptions and expectations were incorrect, our business, financial condition, liquidity or results of operations may vary materially from those expressed in our forward-looking statements. Subsequent written and oral forward-looking statements attributable to us or persons acting on our behalf are expressly qualified in their entirety by these cautionary statements. New risks and uncertainties arise from time to time, and we cannot predict these events or how they may affect the Company. The Company has no duty to, and does not intend to, update or revise the forward-looking statements after the date on which they are made. In light of these risks and uncertainties, you should keep in mind that any forward-looking statement made in this Presentation or elsewhere might not reflect our actual results.

5 I. Executive Summary
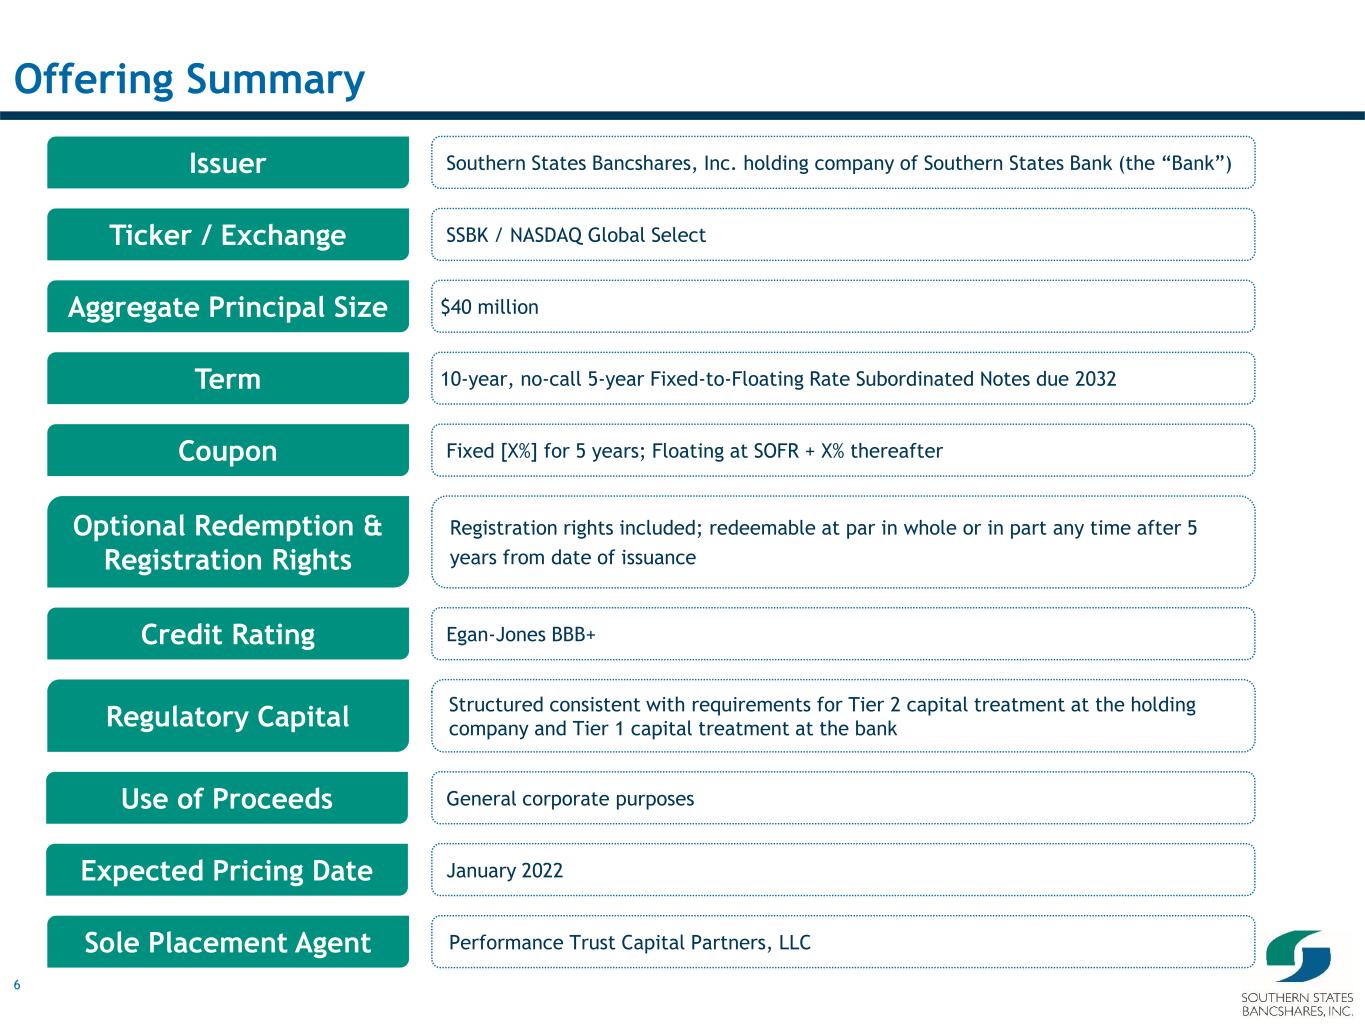
6 Offering Summary SSBK / NASDAQ Global Select 10-year, no-call 5-year Fixed-to-Floating Rate Subordinated Notes due 2032 Southern States Bancshares, Inc. holding company of Southern States Bank (the “Bank”) January 2022 Coupon Optional Redemption & Registration Rights Regulatory Capital Use of Proceeds Expected Pricing Date Sole Placement Agent Issuer Ticker / Exchange Aggregate Principal Size Term Performance Trust Capital Partners, LLC Egan-Jones BBB+Credit Rating Structured consistent with requirements for Tier 2 capital treatment at the holding company and Tier 1 capital treatment at the bank General corporate purposes $40 million Fixed [X%] for 5 years; Floating at SOFR + X% thereafter Registration rights included; redeemable at par in whole or in part any time after 5 years from date of issuance

7 Huntsville Birmingham Montgomery Columbus Atlanta Alabama Georgia 65 85 75 Anniston Auburn 20 85 75 85 65 65 59 Tuscaloosa YoY Core Deposit Growth: 38.4%Loans / Deposits(1)(2): 79.7% Overview of Southern States Bancshares, Inc. Q4 ‘21 Financial Highlights YoY Asset Growth: 33.8%Assets ($B): $1.8 NPLs / Loans: 0.16% YoY Loan Growth: 21.4%Gross Loans ($B): $1.3 LLR / Loans: 1.19% YoY Deposit Growth: 36.6%Deposits ($B): $1.6 YTD NCOs / Avg. Loans: 0.00% TCE / TA(1): 9.00% Core Net Income(1)($M): $4.3 Core ROAA(1): 1.04% NIM: 3.68% Core Efficiency Ratio(1): 59.07% Mobile Savannah Macon Valdosta Augusta Southern States Bancshares (NASDAQ: SSBK) was founded in August 2007 by current CEO and Chairman, Steve Whatley, and a group of organizing directors and priced its IPO on August 11, 2021 Management team with 200 years of collective experience in the banking industry and deep ties to local markets History of solid growth, top-tier profitability and a strong credit culture Bifurcated growth strategy through organic growth and disciplined M&A Focused on being a dominant bank in our smaller markets and a competitive player in the larger metropolitan areas Diversified loan portfolio complemented by low-cost, core funding base Branches (15) Legend Loan Production Office (“LPO”) (1) Sources: S&P Capital IQ Pro; Company provided documents and filings Consolidated financial data as of the three months ended 12/31/2021 unless otherwise noted; core deposits defined as total deposits less jumbo time deposits; jumbo time deposits classified as deposits larger than $250,000 (1) Please refer to non-GAAP reconciliation in the appendix (2) Excludes PPP loans and net of unearned income
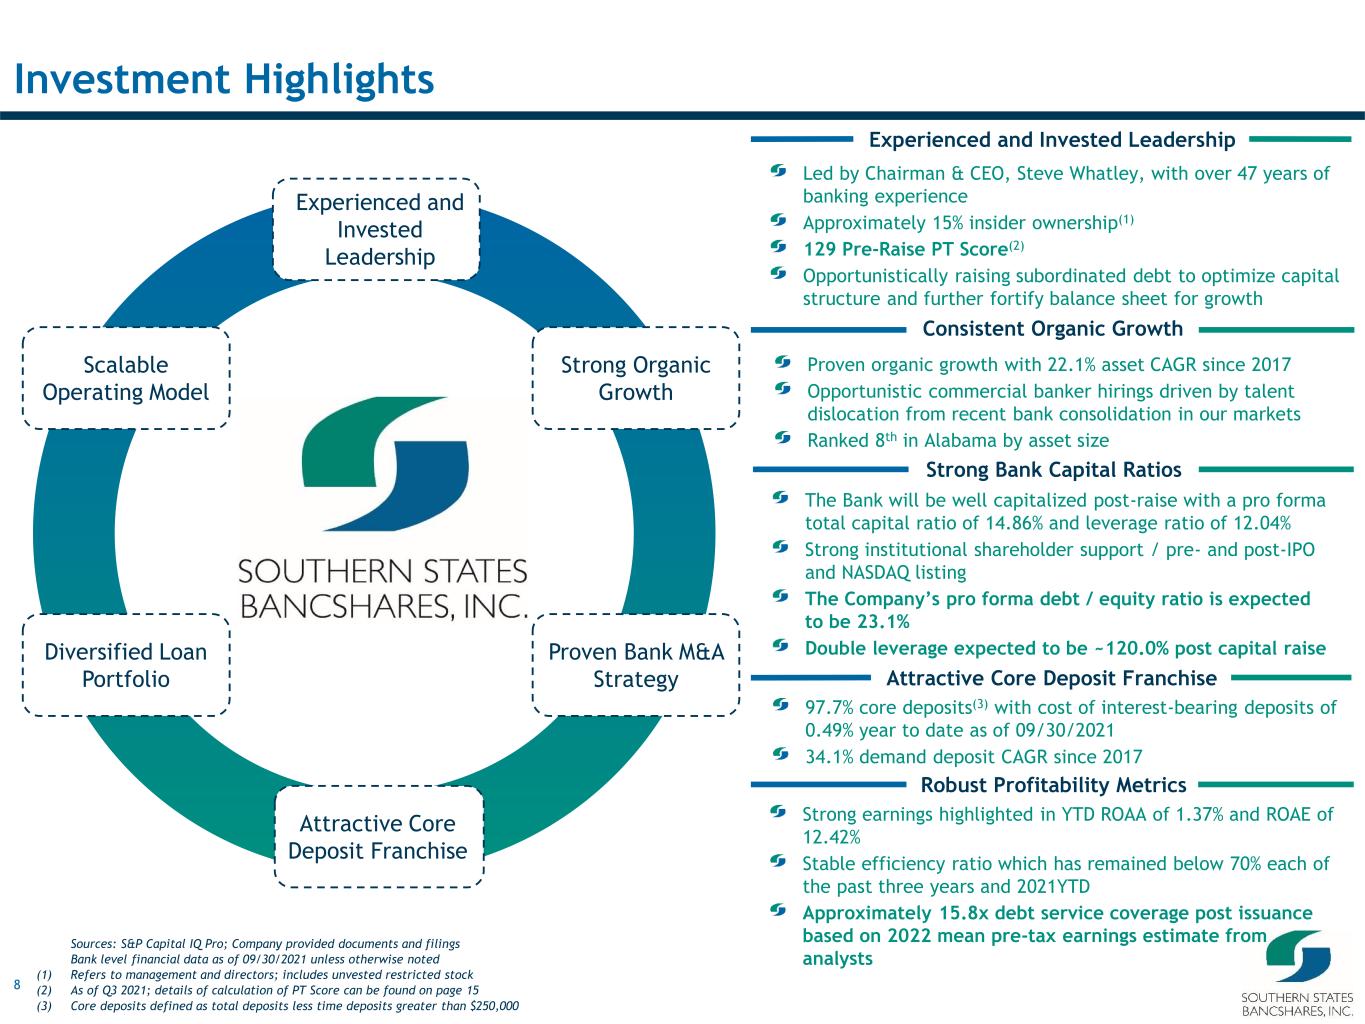
8 Investment Highlights Experienced and Invested Leadership Strong Organic Growth Proven Bank M&A Strategy Diversified Loan Portfolio Attractive Core Deposit Franchise Scalable Operating Model Led by Chairman & CEO, Steve Whatley, with over 47 years of banking experience Approximately 15% insider ownership(1) 129 Pre-Raise PT Score(2) Opportunistically raising subordinated debt to optimize capital structure and further fortify balance sheet for growth Experienced and Invested Leadership Consistent Organic Growth Proven organic growth with 22.1% asset CAGR since 2017 Opportunistic commercial banker hirings driven by talent dislocation from recent bank consolidation in our markets Ranked 8th in Alabama by asset size Strong Bank Capital Ratios The Bank will be well capitalized post-raise with a pro forma total capital ratio of 14.86% and leverage ratio of 12.04% Strong institutional shareholder support / pre- and post-IPO and NASDAQ listing The Company’s pro forma debt / equity ratio is expected to be 23.1% Double leverage expected to be ~120.0% post capital raise Robust Profitability Metrics Strong earnings highlighted in YTD ROAA of 1.37% and ROAE of 12.42% Stable efficiency ratio which has remained below 70% each of the past three years and 2021YTD Approximately 15.8x debt service coverage post issuance based on 2022 mean pre-tax earnings estimate from analysts 97.7% core deposits(3) with cost of interest-bearing deposits of 0.49% year to date as of 09/30/2021 34.1% demand deposit CAGR since 2017 Attractive Core Deposit Franchise Sources: S&P Capital IQ Pro; Company provided documents and filings Bank level financial data as of 09/30/2021 unless otherwise noted (1) Refers to management and directors; includes unvested restricted stock (2) As of Q3 2021; details of calculation of PT Score can be found on page 15 (3) Core deposits defined as total deposits less time deposits greater than $250,000
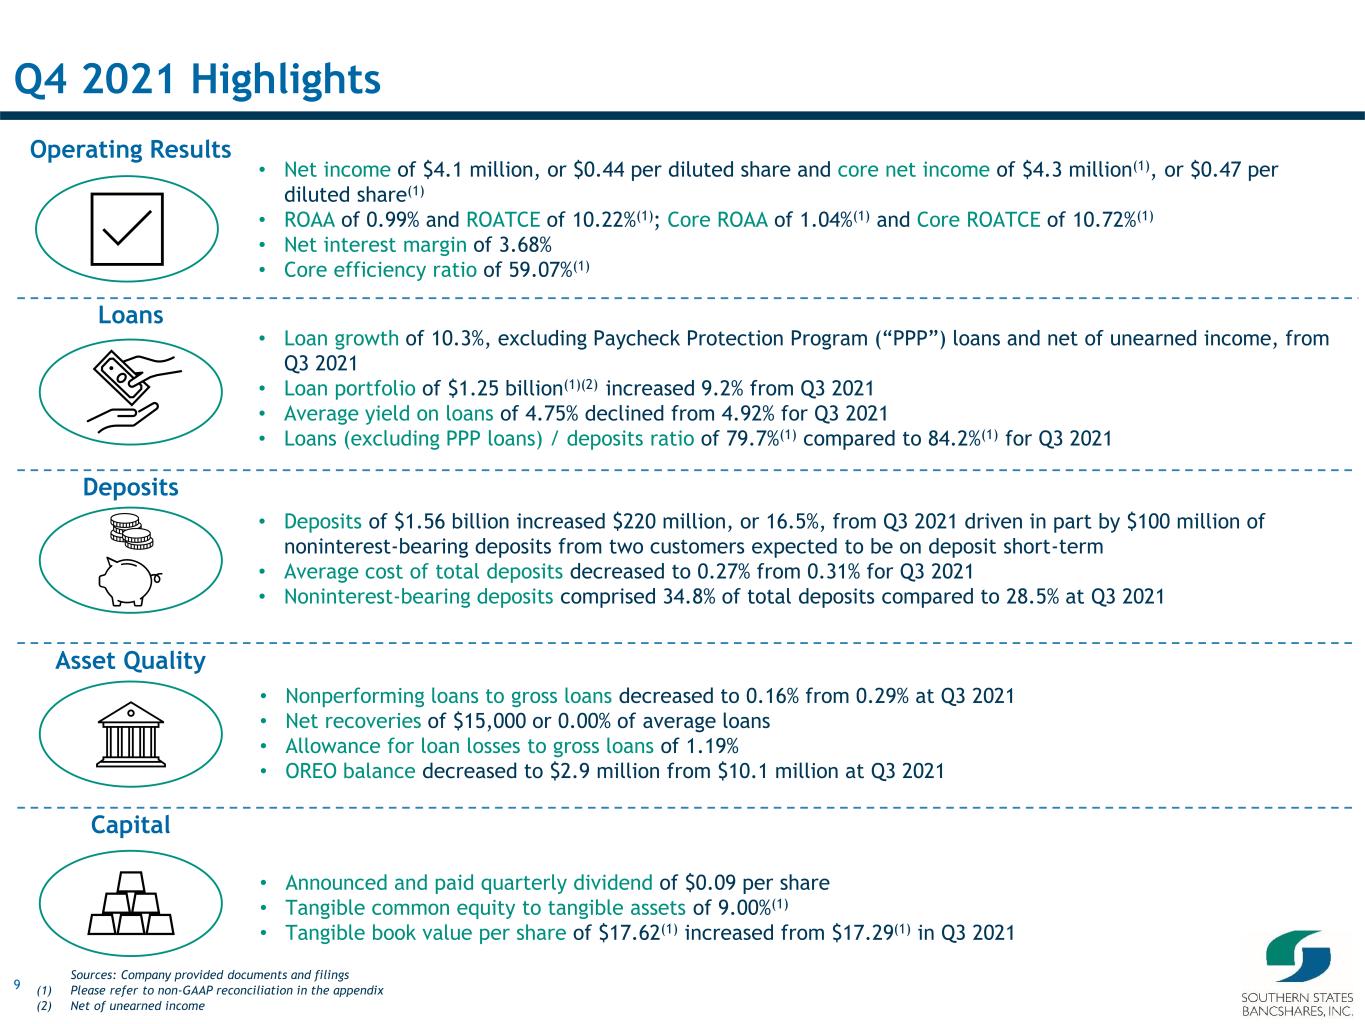
9 Q4 2021 Highlights Sources: Company provided documents and filings (1) Please refer to non-GAAP reconciliation in the appendix (2) Net of unearned income • Net income of $4.1 million, or $0.44 per diluted share and core net income of $4.3 million(1), or $0.47 per diluted share(1) • ROAA of 0.99% and ROATCE of 10.22%(1); Core ROAA of 1.04%(1) and Core ROATCE of 10.72%(1) • Net interest margin of 3.68% • Core efficiency ratio of 59.07%(1) Loans • Loan growth of 10.3%, excluding Paycheck Protection Program (“PPP”) loans and net of unearned income, from Q3 2021 • Loan portfolio of $1.25 billion(1)(2) increased 9.2% from Q3 2021 • Average yield on loans of 4.75% declined from 4.92% for Q3 2021 • Loans (excluding PPP loans) / deposits ratio of 79.7%(1) compared to 84.2%(1) for Q3 2021 • Deposits of $1.56 billion increased $220 million, or 16.5%, from Q3 2021 driven in part by $100 million of noninterest-bearing deposits from two customers expected to be on deposit short-term • Average cost of total deposits decreased to 0.27% from 0.31% for Q3 2021 • Noninterest-bearing deposits comprised 34.8% of total deposits compared to 28.5% at Q3 2021 Deposits Asset Quality Capital • Nonperforming loans to gross loans decreased to 0.16% from 0.29% at Q3 2021 • Net recoveries of $15,000 or 0.00% of average loans • Allowance for loan losses to gross loans of 1.19% • OREO balance decreased to $2.9 million from $10.1 million at Q3 2021 • Announced and paid quarterly dividend of $0.09 per share • Tangible common equity to tangible assets of 9.00%(1) • Tangible book value per share of $17.62(1) increased from $17.29(1) in Q3 2021 Operating Results
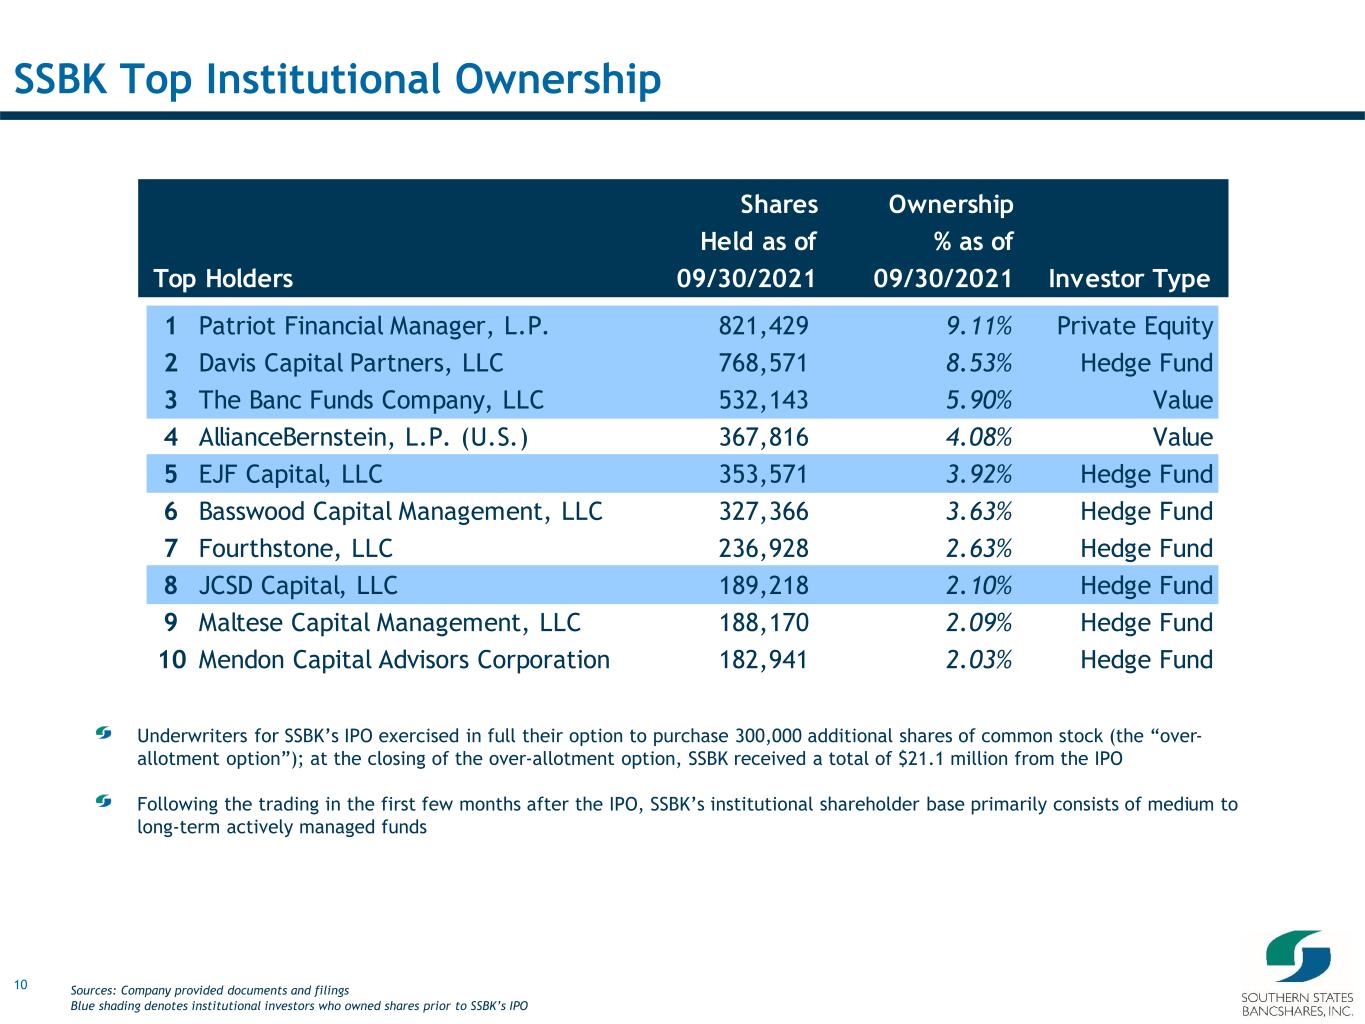
10 SSBK Top Institutional Ownership Sources: Company provided documents and filings Blue shading denotes institutional investors who owned shares prior to SSBK’s IPO Top Holders Shares Held as of 09/30/2021 Ownership % as of 09/30/2021 Investor Type 1 Patriot Financial Manager, L.P. 821,429 9.11% Private Equity 2 Davis Capital Partners, LLC 768,571 8.53% Hedge Fund 3 The Banc Funds Company, LLC 532,143 5.90% Value 4 AllianceBernstein, L.P. (U.S.) 367,816 4.08% Value 5 EJF Capital, LLC 353,571 3.92% Hedge Fund 6 Basswood Capital Management, LLC 327,366 3.63% Hedge Fund 7 Fourthstone, LLC 236,928 2.63% Hedge Fund 8 JCSD Capital, LLC 189,218 2.10% Hedge Fund 9 Maltese Capital Management, LLC 188,170 2.09% Hedge Fund 10 Mendon Capital Advisors Corporation 182,941 2.03% Hedge Fund Underwriters for SSBK’s IPO exercised in full their option to purchase 300,000 additional shares of common stock (the “over- allotment option”); at the closing of the over-allotment option, SSBK received a total of $21.1 million from the IPO Following the trading in the first few months after the IPO, SSBK’s institutional shareholder base primarily consists of medium to long-term actively managed funds
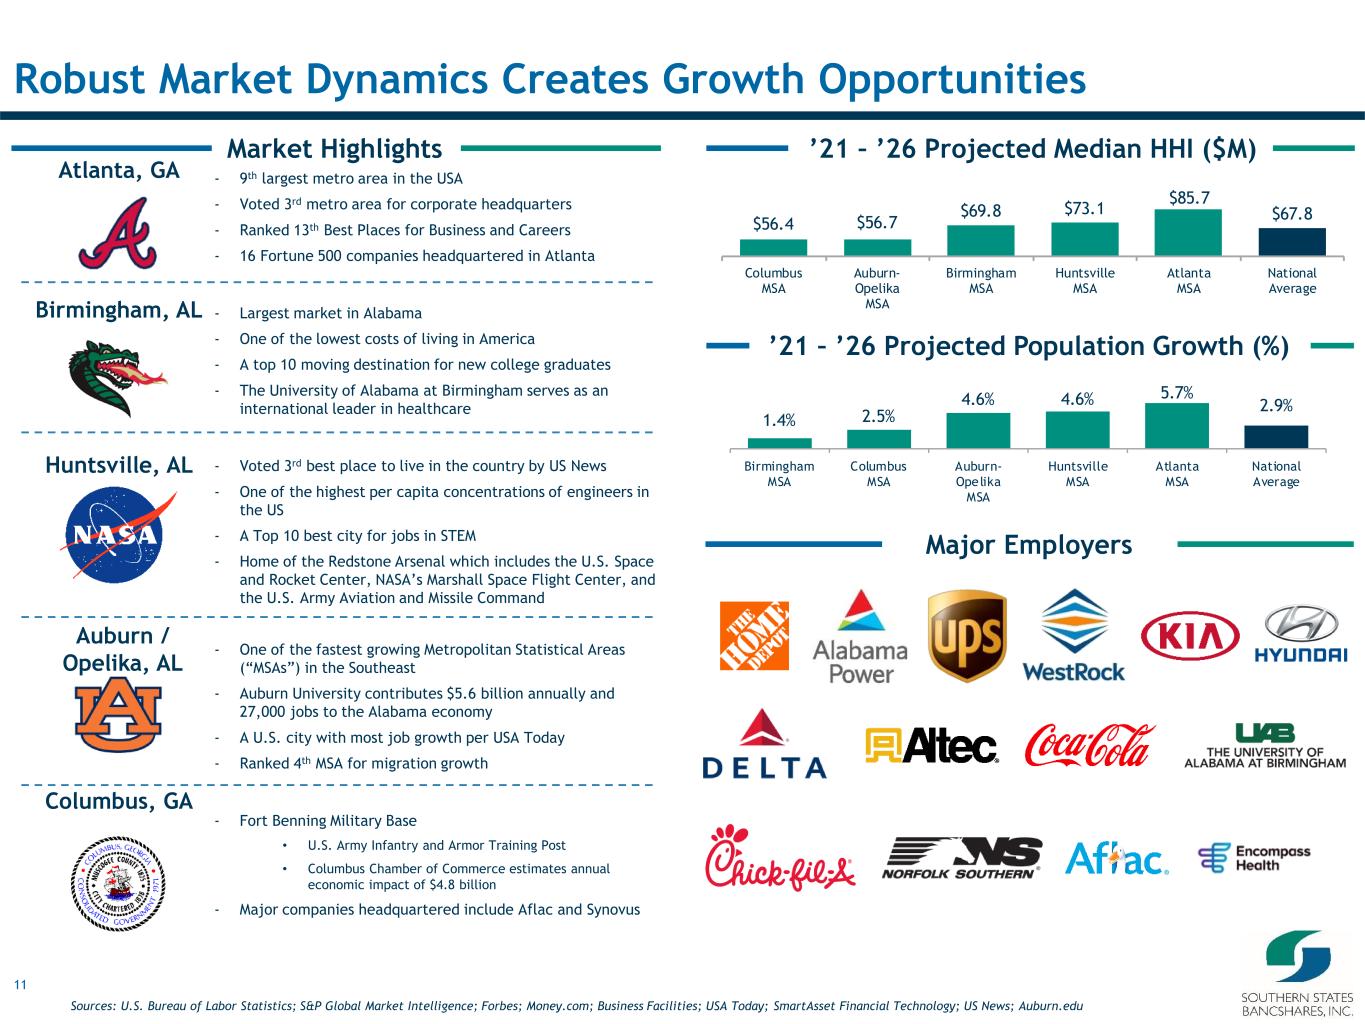
11 - 9th largest metro area in the USA - Voted 3rd metro area for corporate headquarters - Ranked 13th Best Places for Business and Careers - 16 Fortune 500 companies headquartered in Atlanta - Largest market in Alabama - One of the lowest costs of living in America - A top 10 moving destination for new college graduates - The University of Alabama at Birmingham serves as an international leader in healthcare - Voted 3rd best place to live in the country by US News - One of the highest per capita concentrations of engineers in the US - A Top 10 best city for jobs in STEM - Home of the Redstone Arsenal which includes the U.S. Space and Rocket Center, NASA’s Marshall Space Flight Center, and the U.S. Army Aviation and Missile Command - One of the fastest growing Metropolitan Statistical Areas (“MSAs”) in the Southeast - Auburn University contributes $5.6 billion annually and 27,000 jobs to the Alabama economy - A U.S. city with most job growth per USA Today - Ranked 4th MSA for migration growth - Fort Benning Military Base • U.S. Army Infantry and Armor Training Post • Columbus Chamber of Commerce estimates annual economic impact of $4.8 billion - Major companies headquartered include Aflac and Synovus Columbus, GA $56.4 $56.7 $69.8 $73.1 $85.7 $67.8 Columbus MSA Auburn- Opelika MSA Birmingham MSA Huntsville MSA Atlanta MSA National Average 1.4% 2.5% 4.6% 4.6% 5.7% 2.9% Birmingham MSA Columbus MSA Auburn- Opelika MSA Huntsville MSA Atlanta MSA National Average Major Employers Market Highlights Robust Market Dynamics Creates Growth Opportunities Huntsville, AL Birmingham, AL Atlanta, GA ’21 – ’26 Projected Median HHI ($M) ’21 – ’26 Projected Population Growth (%) Auburn / Opelika, AL Sources: U.S. Bureau of Labor Statistics; S&P Global Market Intelligence; Forbes; Money.com; Business Facilities; USA Today; SmartAsset Financial Technology; US News; Auburn.edu
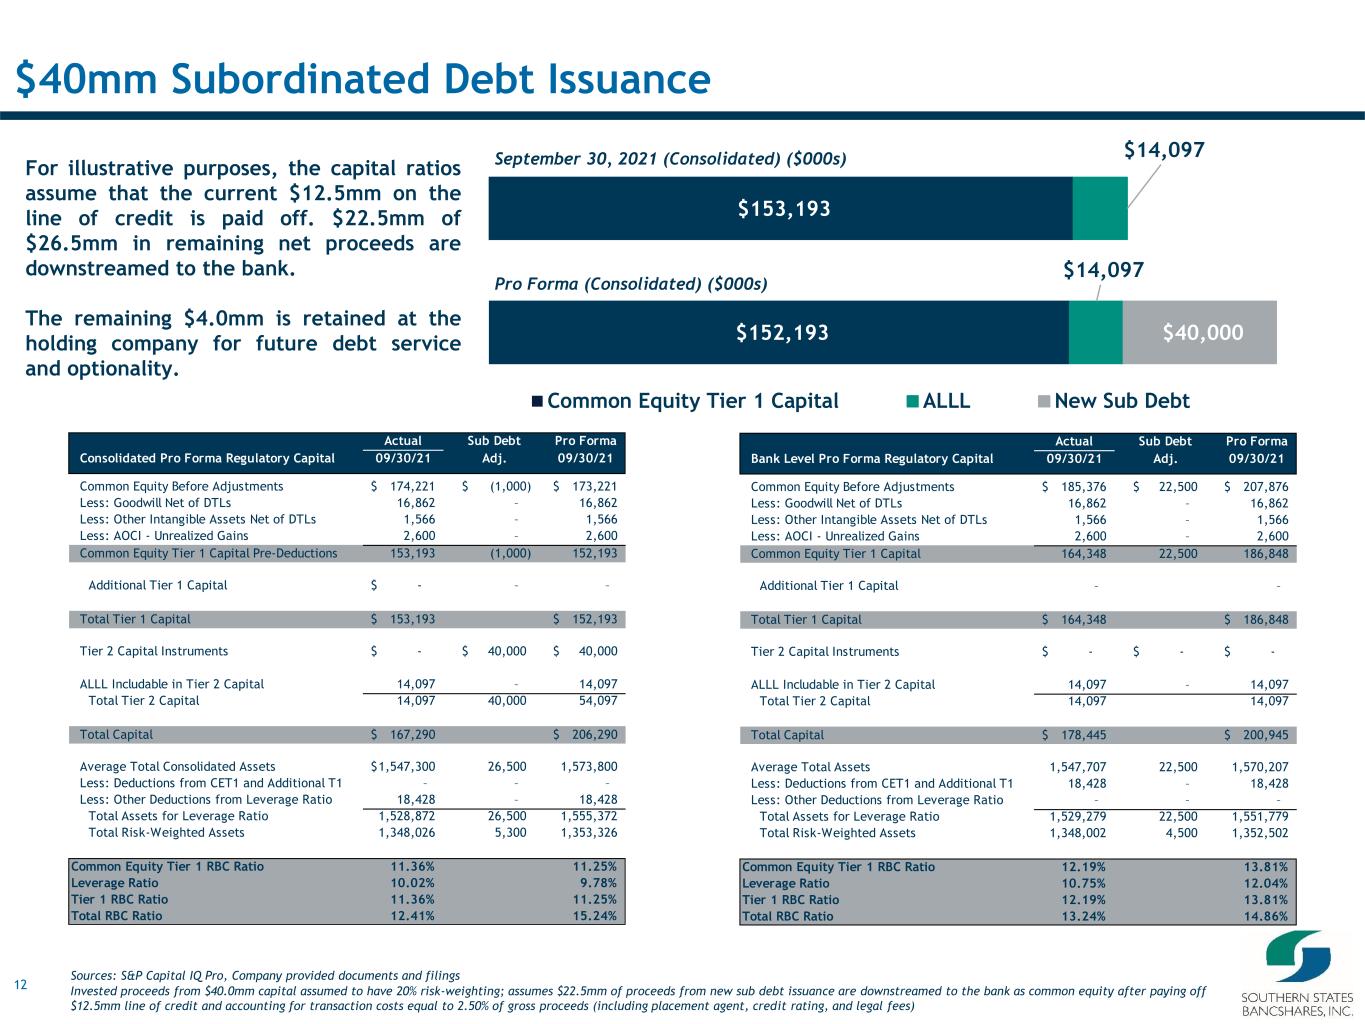
12 Actual Sub Debt Pro Forma Consolidated Pro Forma Regulatory Capital 09/30/21 Adj. 09/30/21 Common Equity Before Adjustments 174,221$ (1,000)$ 173,221$ Less: Goodwill Net of DTLs 16,862 – 16,862 Less: Other Intangible Assets Net of DTLs 1,566 – 1,566 Less: AOCI - Unrealized Gains 2,600 – 2,600 Common Equity Tier 1 Capital Pre-Deductions 153,193 (1,000) 152,193 Additional Tier 1 Capital -$ – – Total Tier 1 Capital 153,193$ 152,193$ Tier 2 Capital Instruments -$ 40,000$ 40,000$ ALLL Includable in Tier 2 Capital 14,097 – 14,097 Total Tier 2 Capital 14,097 40,000 54,097 Total Capital 167,290$ 206,290$ Average Total Consolidated Assets 1,547,300$ 26,500 1,573,800 Less: Deductions from CET1 and Additional T1 – – – Less: Other Deductions from Leverage Ratio 18,428 – 18,428 Total Assets for Leverage Ratio 1,528,872 26,500 1,555,372 Total Risk-Weighted Assets 1,348,026 5,300 1,353,326 Common Equity Tier 1 RBC Ratio 11.36% 11.25% Leverage Ratio 10.02% 9.78% Tier 1 RBC Ratio 11.36% 11.25% Total RBC Ratio 12.41% 15.24% $40mm Subordinated Debt Issuance For illustrative purposes, the capital ratios assume that the current $12.5mm on the line of credit is paid off. $22.5mm of $26.5mm in remaining net proceeds are downstreamed to the bank. The remaining $4.0mm is retained at the holding company for future debt service and optionality. September 30, 2021 (Consolidated) ($000s) $153,193 $14,097 $152,193 $14,097 $40,000 Common Equity Tier 1 Capital ALLL New Sub Debt Pro Forma (Consolidated) ($000s) Actual Sub Debt Pro Forma Bank Level Pro Forma Regulatory Capital 09/30/21 Adj. 09/30/21 Common Equity Before Adjustments 185,376$ 22,500$ 207,876$ Less: Goodwill Net of DTLs 16,862 – 16,862 Less: Other Intangible Assets Net of DTLs 1,566 – 1,566 Less: AOCI - Unrealized Gains 2,600 – 2,600 Common Equity Tier 1 Capital 164,348 22,500 186,848 Additional Tier 1 Capital – – Total Tier 1 Capital 164,348$ 186,848$ Tier 2 Capital Instruments -$ -$ -$ ALLL Includable in Tier 2 Capital 14,097 – 14,097 Total Tier 2 Capital 14,097 14,097 Total Capital 178,445$ 200,945$ Average Total Assets 1,547,707 22,500 1,570,207 Less: Deductions from CET1 and Additional T1 18,428 – 18,428 Less: Other Deductions from Leverage Ratio – – – Total Assets for Leverage Ratio 1,529,279 22,500 1,551,779 Total Risk-Weighted Assets 1,348,002 4,500 1,352,502 Common Equity Tier 1 RBC Ratio 12.19% 13.81% Leverage Ratio 10.75% 12.04% Tier 1 RBC Ratio 12.19% 13.81% Total RBC Ratio 13.24% 14.86% Sources: S&P Capital IQ Pro, Company provided documents and filings Invested proceeds from $40.0mm capital assumed to have 20% risk-weighting; assumes $22.5mm of proceeds from new sub debt issuance are downstreamed to the bank as common equity after paying off $12.5mm line of credit and accounting for transaction costs equal to 2.50% of gross proceeds (including placement agent, credit rating, and legal fees)
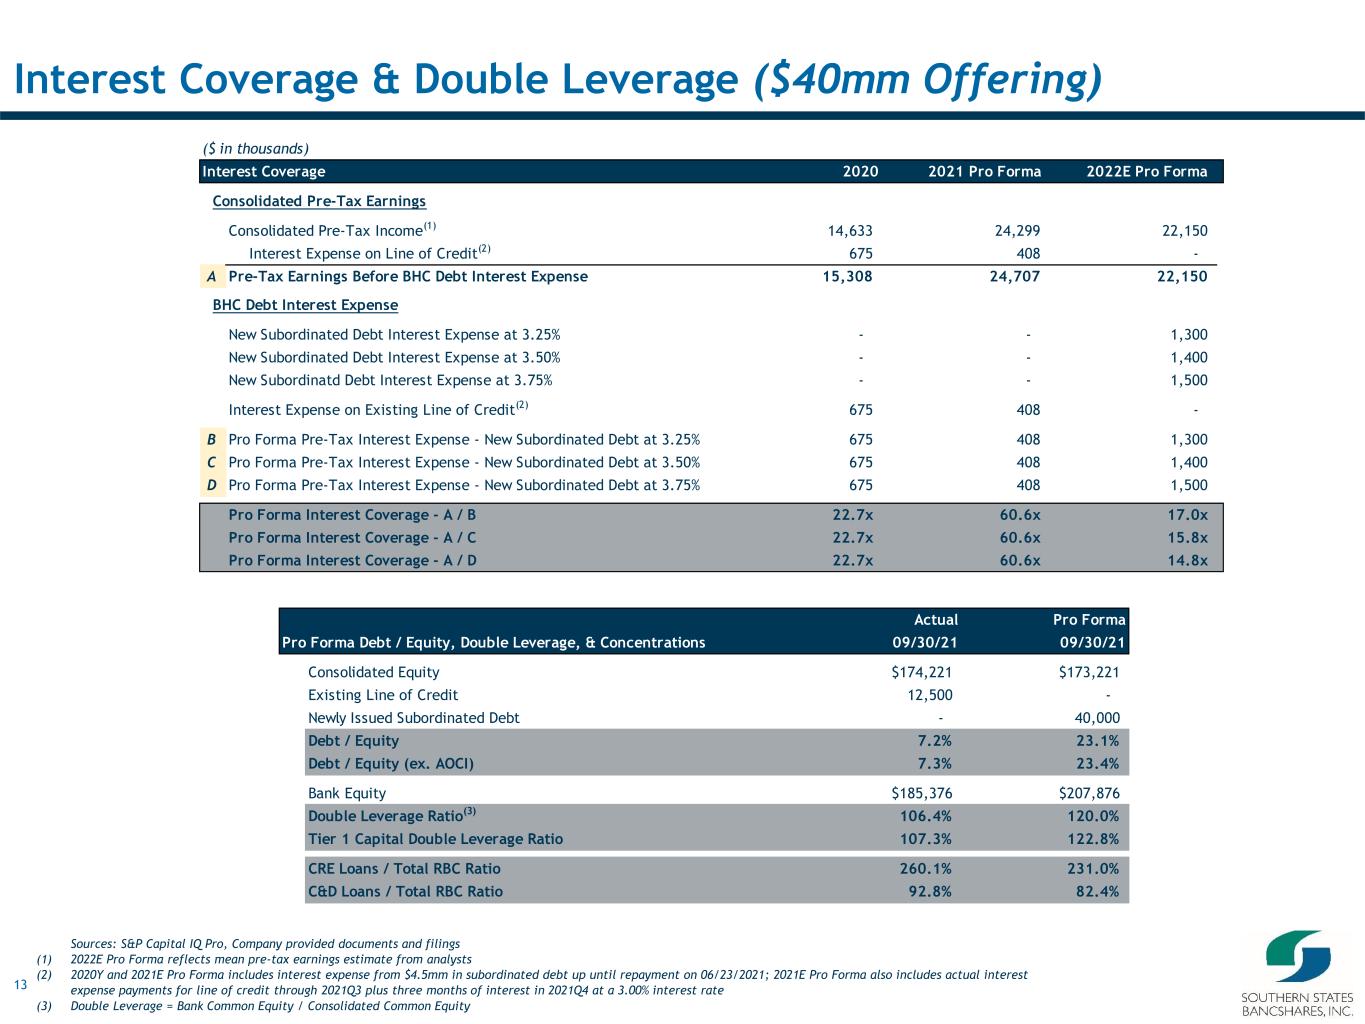
13 Interest Coverage & Double Leverage ($40mm Offering) ($ in thousands) Interest Coverage 2020 2021 Pro Forma 2022E Pro Forma Consolidated Pre-Tax Earnings Consolidated Pre-Tax Income(1) 14,633 24,299 22,150 Interest Expense on Line of Credit(2) 675 408 - A Pre-Tax Earnings Before BHC Debt Interest Expense 15,308 24,707 22,150 BHC Debt Interest Expense New Subordinated Debt Interest Expense at 3.25% - - 1,300 New Subordinated Debt Interest Expense at 3.50% - - 1,400 New Subordinatd Debt Interest Expense at 3.75% - - 1,500 Interest Expense on Existing Line of Credit(2) 675 408 - B Pro Forma Pre-Tax Interest Expense - New Subordinated Debt at 3.25% 675 408 1,300 C Pro Forma Pre-Tax Interest Expense - New Subordinated Debt at 3.50% 675 408 1,400 D Pro Forma Pre-Tax Interest Expense - New Subordinated Debt at 3.75% 675 408 1,500 Pro Forma Interest Coverage - A / B 22.7x 60.6x 17.0x Pro Forma Interest Coverage - A / C 22.7x 60.6x 15.8x Pro Forma Interest Coverage - A / D 22.7x 60.6x 14.8x Actual Pro Forma Pro Forma Debt / Equity, Double Leverage, & Concentrations 09/30/21 09/30/21 Consolidated Equity $174,221 $173,221 Existing Line of Credit 12,500 - Newly Issued Subordinated Debt - 40,000 Debt / Equity 7.2% 23.1% Debt / Equity (ex. AOCI) 7.3% 23.4% Bank Equity $185,376 $207,876 Double Leverage Ratio(3) 106.4% 120.0% Tier 1 Capital Double Leverage Ratio 107.3% 122.8% CRE Loans / Total RBC Ratio 260.1% 231.0% C&D Loans / Total RBC Ratio 92.8% 82.4% Sources: S&P Capital IQ Pro, Company provided documents and filings (1) 2022E Pro Forma reflects mean pre-tax earnings estimate from analysts (2) 2020Y and 2021E Pro Forma includes interest expense from $4.5mm in subordinated debt up until repayment on 06/23/2021; 2021E Pro Forma also includes actual interest expense payments for line of credit through 2021Q3 plus three months of interest in 2021Q4 at a 3.00% interest rate (3) Double Leverage = Bank Common Equity / Consolidated Common Equity
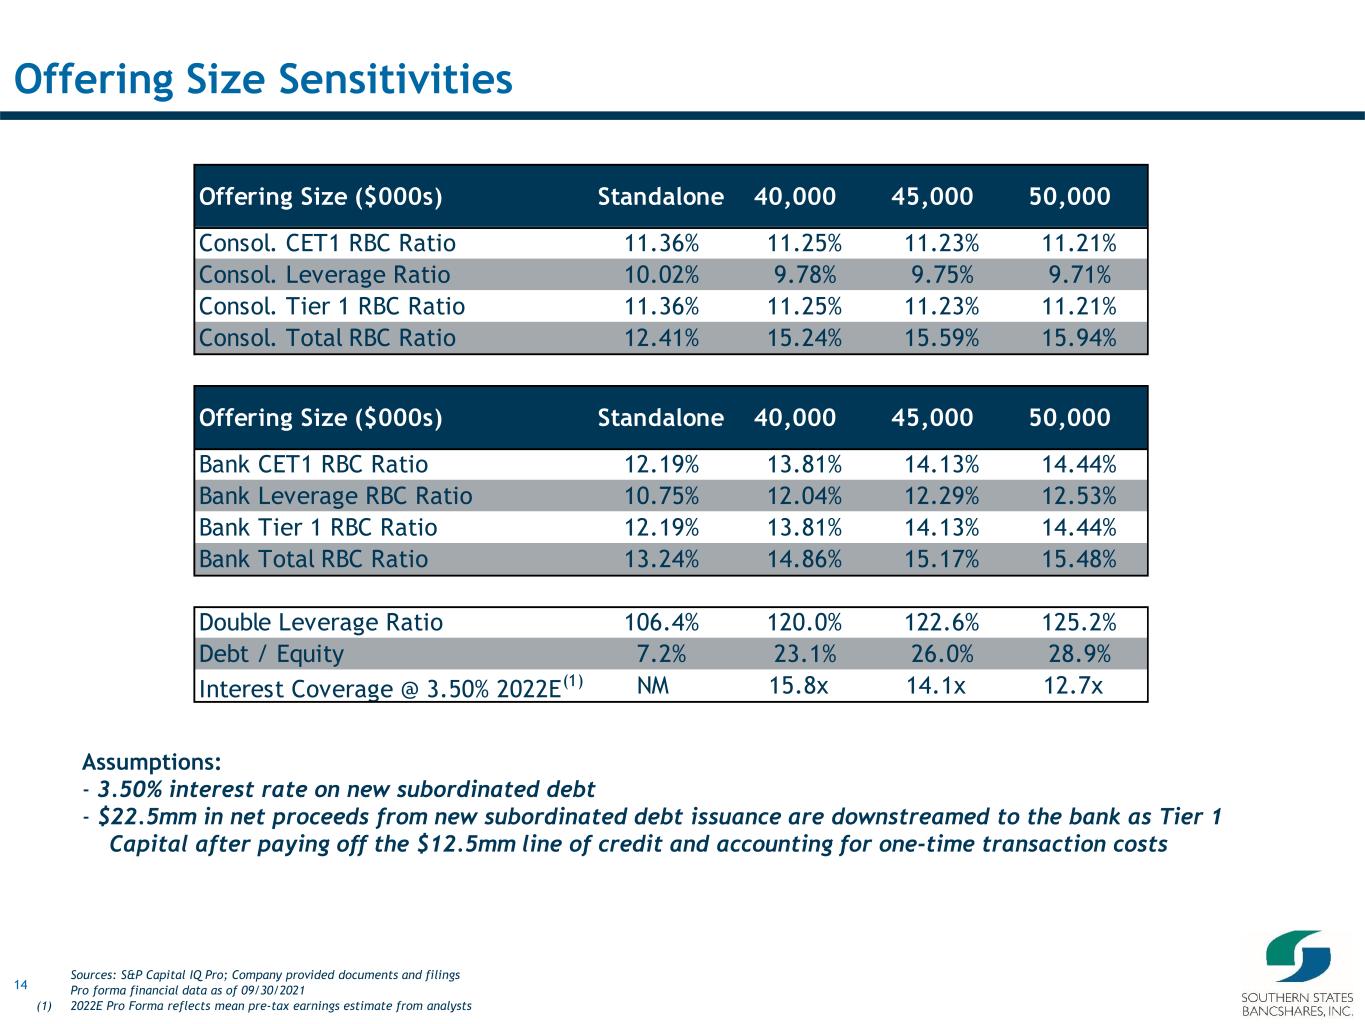
14 Offering Size Sensitivities Assumptions: - 3.50% interest rate on new subordinated debt - $22.5mm in net proceeds from new subordinated debt issuance are downstreamed to the bank as Tier 1 Capital after paying off the $12.5mm line of credit and accounting for one-time transaction costs Sources: S&P Capital IQ Pro; Company provided documents and filings Pro forma financial data as of 09/30/2021 (1) 2022E Pro Forma reflects mean pre-tax earnings estimate from analysts Offering Size ($000s) Standalone 40,000 45,000 50,000 Consol. CET1 RBC Ratio 11.36% 11.25% 11.23% 11.21% Consol. Leverage Ratio 10.02% 9.78% 9.75% 9.71% Consol. Tier 1 RBC Ratio 11.36% 11.25% 11.23% 11.21% Consol. Total RBC Ratio 12.41% 15.24% 15.59% 15.94% Offering Size ($000s) Standalone 40,000 45,000 50,000 Bank CET1 RBC Ratio 12.19% 13.81% 14.13% 14.44% Bank Leverage RBC Ratio 10.75% 12.04% 12.29% 12.53% Bank Tier 1 RBC Ratio 12.19% 13.81% 14.13% 14.44% Bank Total RBC Ratio 13.24% 14.86% 15.17% 15.48% Double Leverage Ratio 106.4% 120.0% 122.6% 125.2% Debt / Equity 7.2% 23.1% 26.0% 28.9% Interest Coverage @ 3.50% 2022E(1) NM 15.8x 14.1x 12.7x
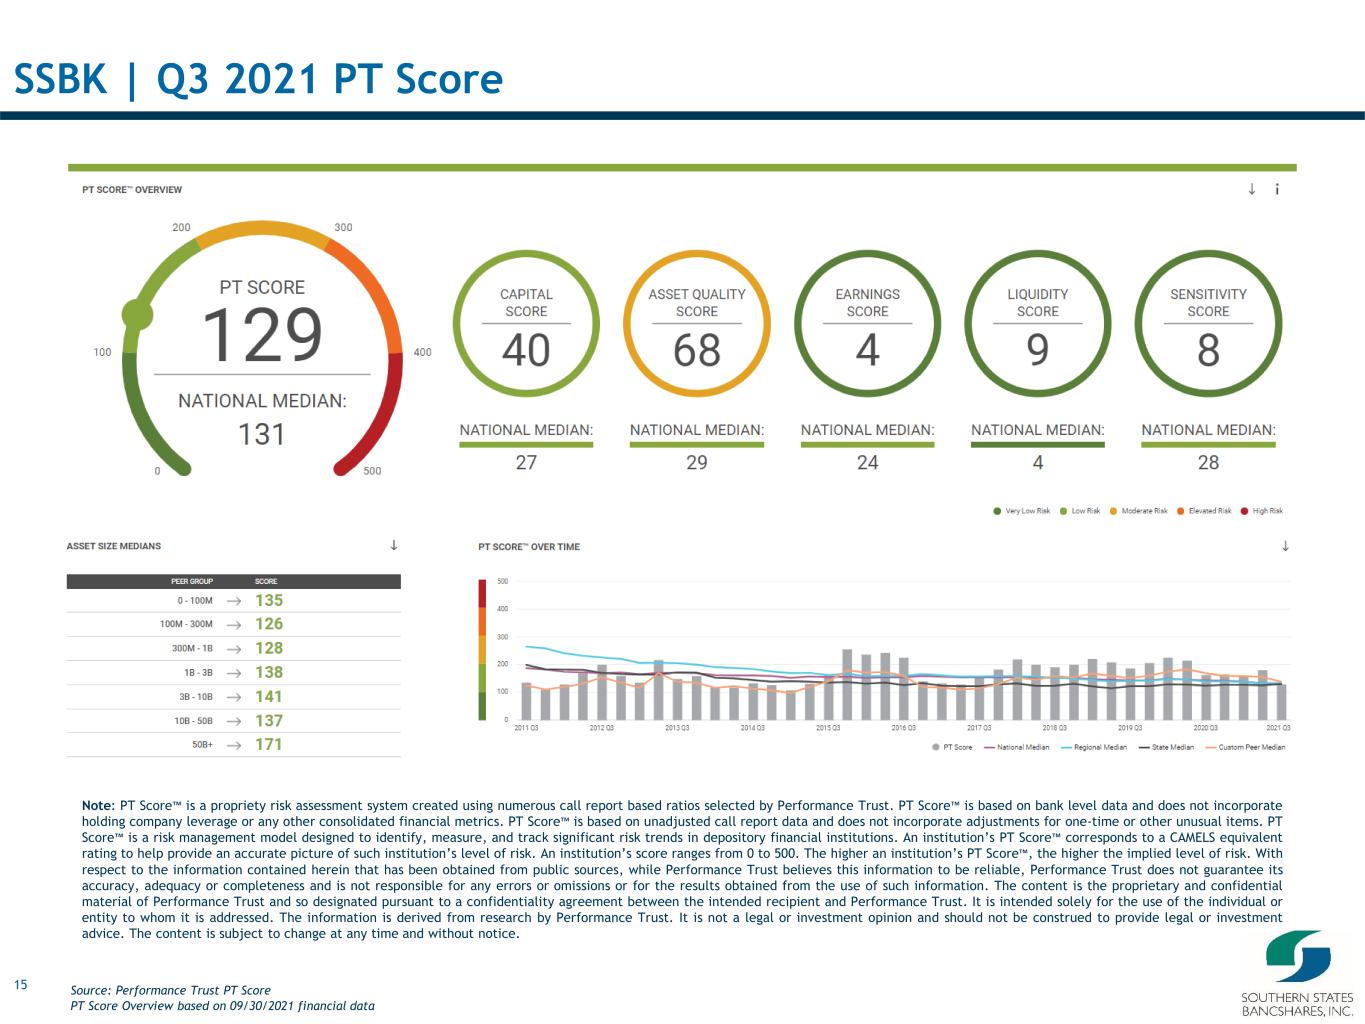
15 SSBK | Q3 2021 PT Score Note: PT Score™ is a propriety risk assessment system created using numerous call report based ratios selected by Performance Trust. PT Score™ is based on bank level data and does not incorporate holding company leverage or any other consolidated financial metrics. PT Score™ is based on unadjusted call report data and does not incorporate adjustments for one-time or other unusual items. PT Score™ is a risk management model designed to identify, measure, and track significant risk trends in depository financial institutions. An institution’s PT Score™ corresponds to a CAMELS equivalent rating to help provide an accurate picture of such institution’s level of risk. An institution’s score ranges from 0 to 500. The higher an institution’s PT Score™, the higher the implied level of risk. With respect to the information contained herein that has been obtained from public sources, while Performance Trust believes this information to be reliable, Performance Trust does not guarantee its accuracy, adequacy or completeness and is not responsible for any errors or omissions or for the results obtained from the use of such information. The content is the proprietary and confidential material of Performance Trust and so designated pursuant to a confidentiality agreement between the intended recipient and Performance Trust. It is intended solely for the use of the individual or entity to whom it is addressed. The information is derived from research by Performance Trust. It is not a legal or investment opinion and should not be construed to provide legal or investment advice. The content is subject to change at any time and without notice. Source: Performance Trust PT Score PT Score Overview based on 09/30/2021 financial data
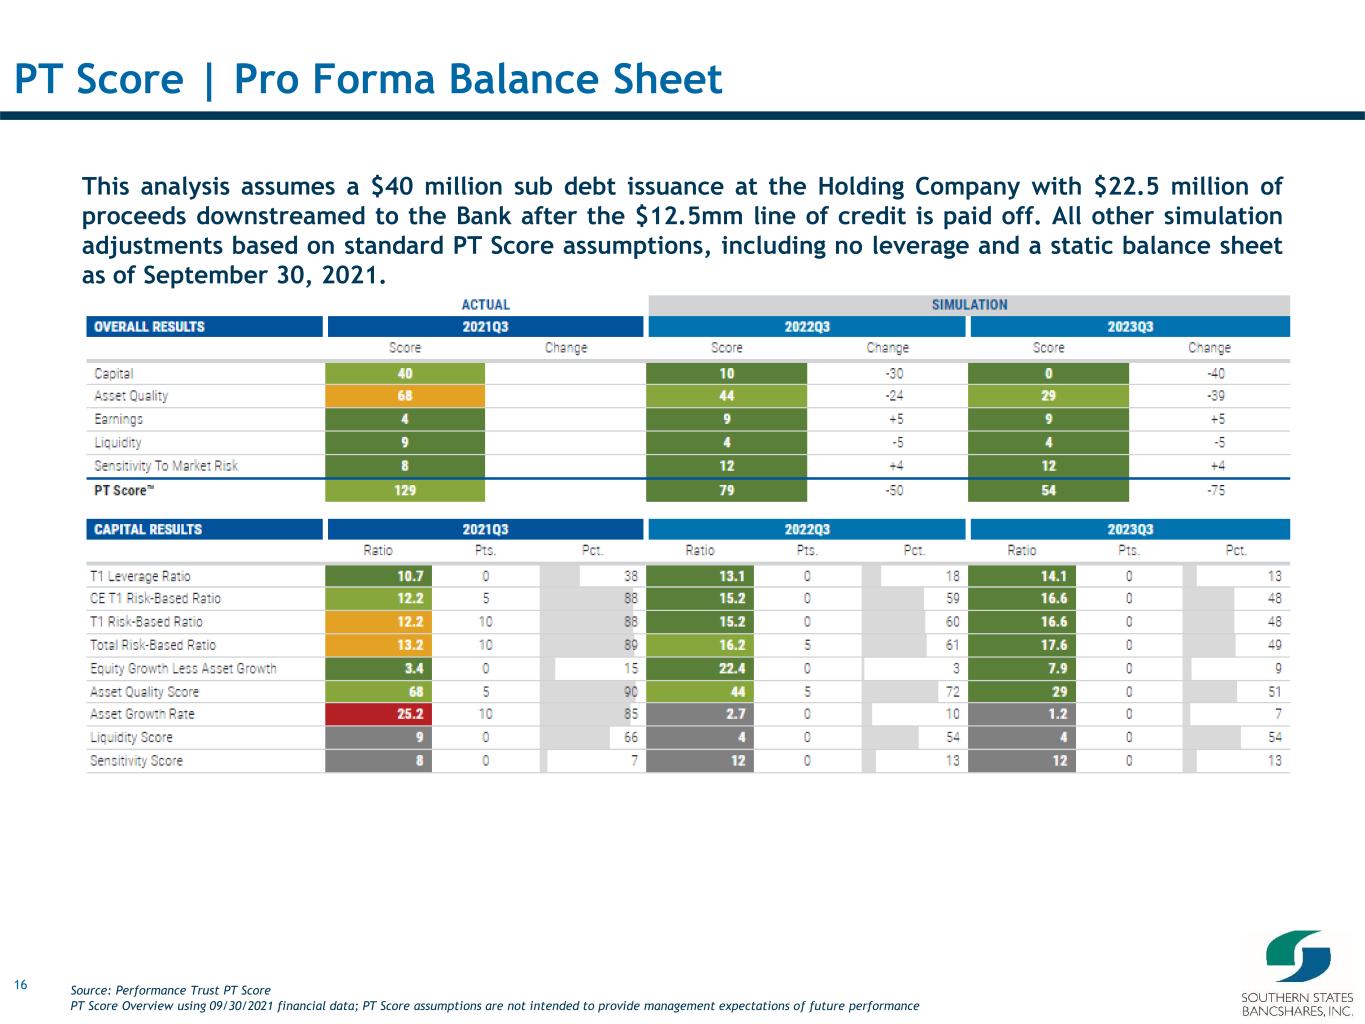
16 PT Score | Pro Forma Balance Sheet This analysis assumes a $40 million sub debt issuance at the Holding Company with $22.5 million of proceeds downstreamed to the Bank after the $12.5mm line of credit is paid off. All other simulation adjustments based on standard PT Score assumptions, including no leverage and a static balance sheet as of September 30, 2021. Source: Performance Trust PT Score PT Score Overview using 09/30/2021 financial data; PT Score assumptions are not intended to provide management expectations of future performance
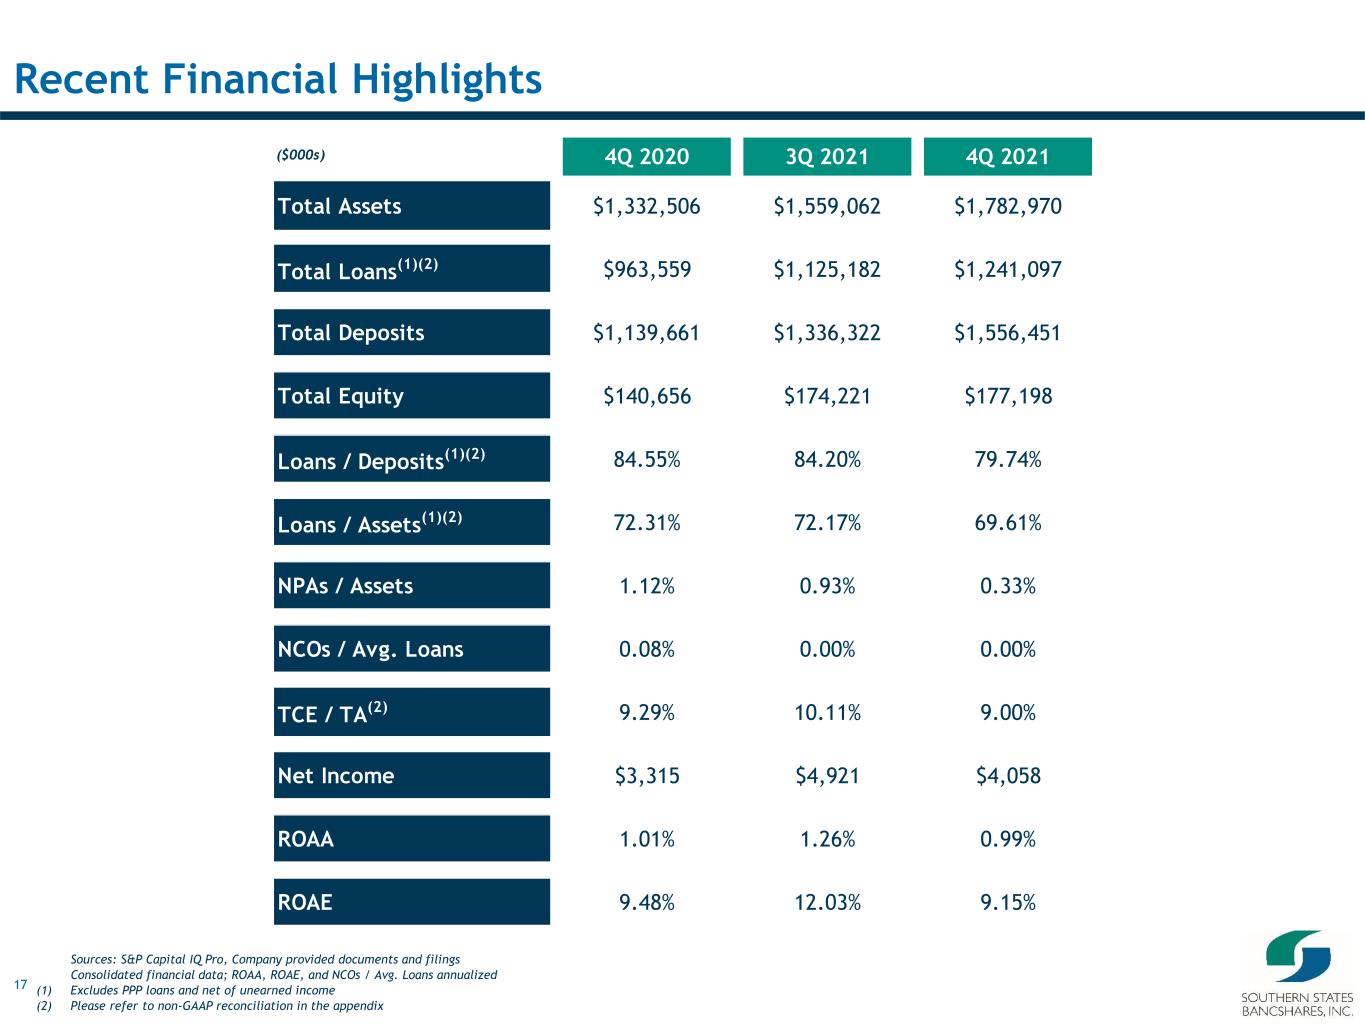
17 Recent Financial Highlights Sources: S&P Capital IQ Pro, Company provided documents and filings Consolidated financial data; ROAA, ROAE, and NCOs / Avg. Loans annualized (1) Excludes PPP loans and net of unearned income (2) Please refer to non-GAAP reconciliation in the appendix ($000s) 4Q 2020 3Q 2021 4Q 2021 Total Assets $1,332,506 $1,559,062 $1,782,970 Total Loans (1)(2) $963,559 $1,125,182 $1,241,097 Total Deposits $1,139,661 $1,336,322 $1,556,451 Total Equity $140,656 $174,221 $177,198 Loans / Deposits (1)(2) 84.55% 84.20% 79.74% Loans / Assets (1)(2) 72.31% 72.17% 69.61% NPAs / Assets 1.12% 0.93% 0.33% NCOs / Avg. Loans 0.08% 0.00% 0.00% TCE / TA (2) 9.29% 10.11% 9.00% Net Income $3,315 $4,921 $4,058 ROAA 1.01% 1.26% 0.99% ROAE 9.48% 12.03% 9.15%
18 II. Company Overview

19 $0.1 $0.2 $0.2 $0.2 $0.3 $0.3 $0.3 $0.5 $0.6 $0.7 $0.9 $1.1 $1.3 $1.8 2008 2009 2010 2011 2012 2013 2014 2015 2016 2017 2018 2019 2020 2021 2007 Our History & Growth H is to ri c a l H ig h li g h ts August 2007 Established Anniston, AL headquarters and Opelika, AL Office with $31 million in capital at $10.00 per share May 2012 Acquired Alabama Trust Bank in Sylacauga, AL 2015 Opened offices in Huntsville, AL, Carrollton, GA, and an LPO in Atlanta, GA Acquired Columbus Community Bank in Columbus, GA and opened a second location in Columbus February 2017 Completed $3.4 million local capital raise at $14 per share 2018 Established a full-service banking office in Newnan, GA 2020 through 2021 Hired 4 commercial bankers in Georgia franchise Priced initial public offering Anniston Opelika Anniston Mobile Huntsville Tuscaloosa Dothan Savannah Columbus Birmingham Huntsville Montgomery Mobile Athens Tuscaloosa Albany Dothan Valdosta Montgomery Birmingham 16 20 75 65 65 59 65 65 59 Opelika Anniston Atlanta Total Assets ($B) September 2019 Closed acquisition of Small Town Bank in Wedowee, AL 2016 Opened Auburn, AL office Issued $4.5 million of 10-year subordinated notes Completed $41.2 million capital raise at $14 per share 2021 2 Branches 15 Branches and an LPO Branch LPO 2008 Established a full-service banking office in Birmingham, AL Sources: S&P Capital IQ Pro; Company provided documents and filings
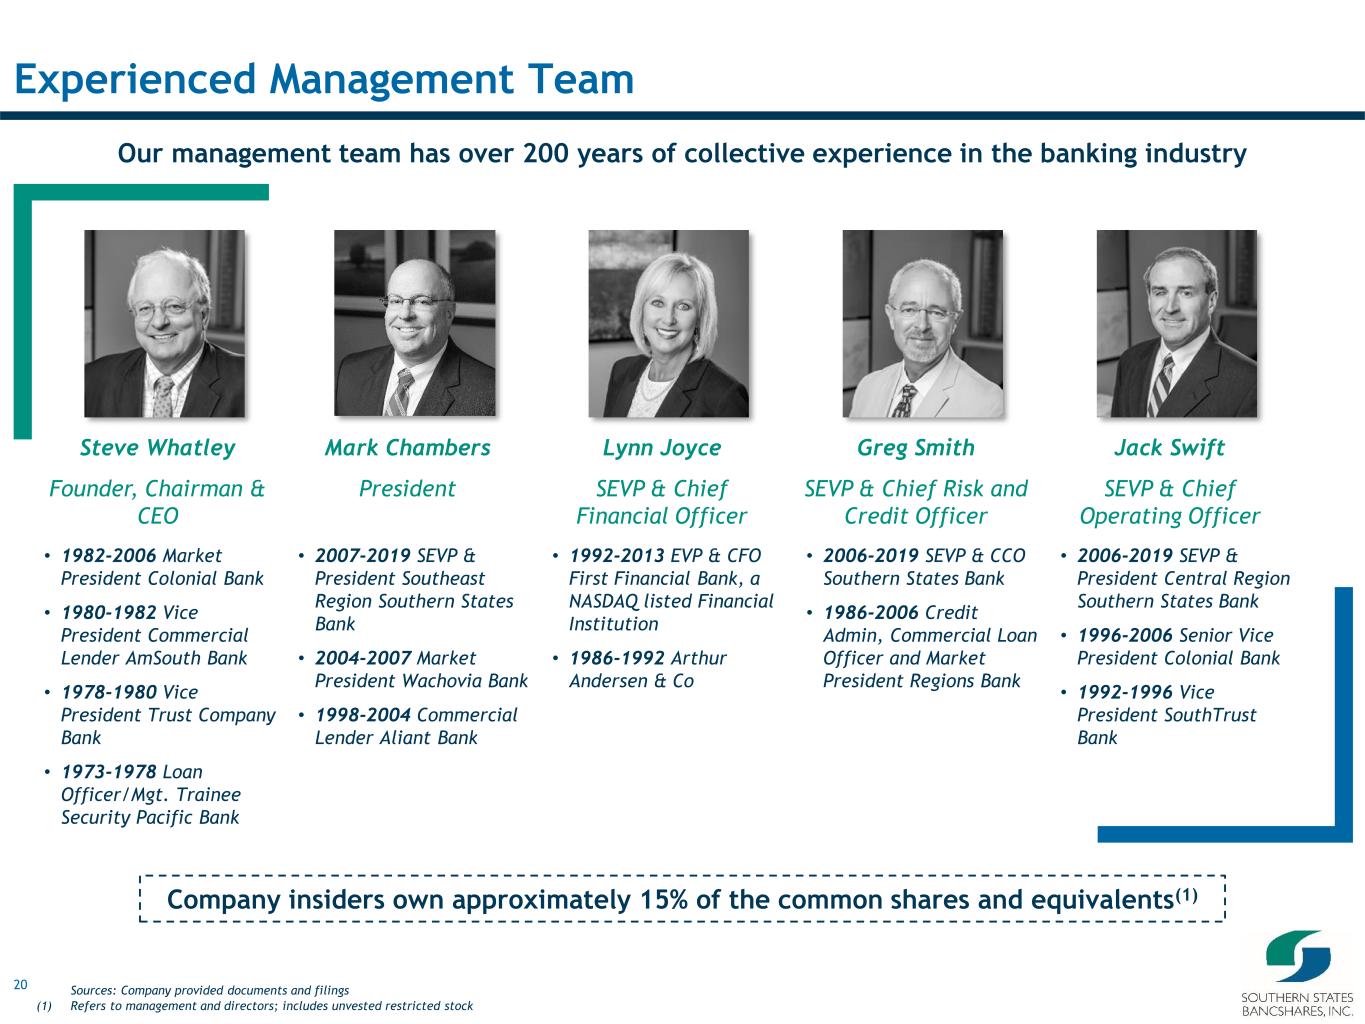
20 Experienced Management Team Steve Whatley Founder, Chairman & CEO Lynn Joyce SEVP & Chief Financial Officer Greg Smith SEVP & Chief Risk and Credit Officer Jack Swift SEVP & Chief Operating Officer Our management team has over 200 years of collective experience in the banking industry Mark Chambers President Company insiders own approximately 15% of the common shares and equivalents(1) • 1982-2006 Market President Colonial Bank • 1980-1982 Vice President Commercial Lender AmSouth Bank • 1978-1980 Vice President Trust Company Bank • 1973-1978 Loan Officer/Mgt. Trainee Security Pacific Bank • 2007-2019 SEVP & President Southeast Region Southern States Bank • 2004-2007 Market President Wachovia Bank • 1998-2004 Commercial Lender Aliant Bank • 1992-2013 EVP & CFO First Financial Bank, a NASDAQ listed Financial Institution • 1986-1992 Arthur Andersen & Co • 2006-2019 SEVP & CCO Southern States Bank • 1986-2006 Credit Admin, Commercial Loan Officer and Market President Regions Bank • 2006-2019 SEVP & President Central Region Southern States Bank • 1996-2006 Senior Vice President Colonial Bank • 1992-1996 Vice President SouthTrust Bank Sources: Company provided documents and filings (1) Refers to management and directors; includes unvested restricted stock
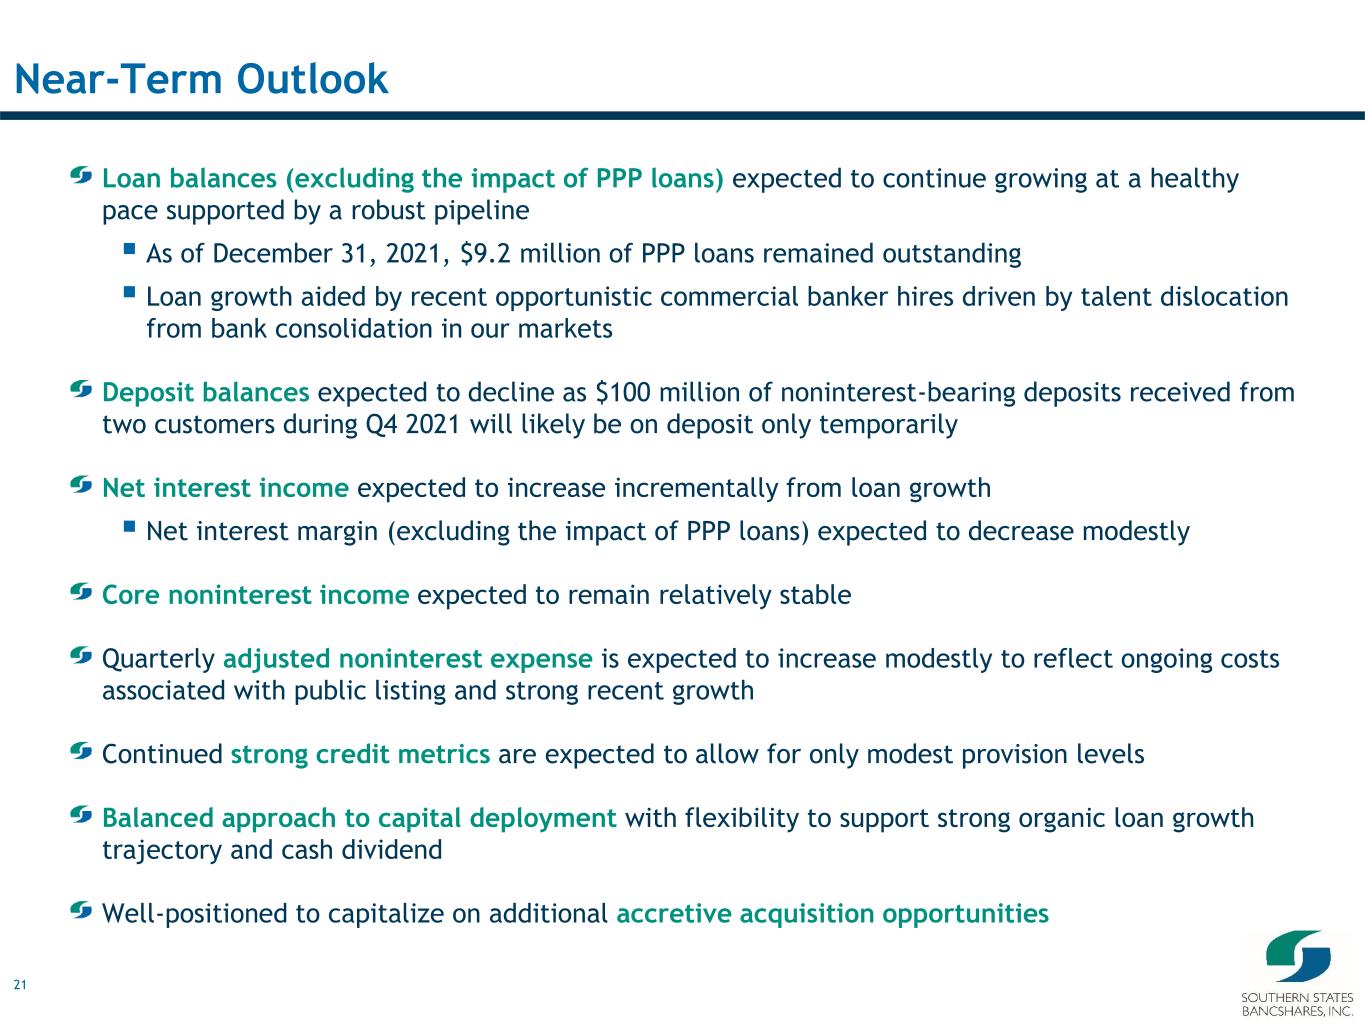
21 Near-Term Outlook Loan balances (excluding the impact of PPP loans) expected to continue growing at a healthy pace supported by a robust pipeline ▪ As of December 31, 2021, $9.2 million of PPP loans remained outstanding ▪ Loan growth aided by recent opportunistic commercial banker hires driven by talent dislocation from bank consolidation in our markets Deposit balances expected to decline as $100 million of noninterest-bearing deposits received from two customers during Q4 2021 will likely be on deposit only temporarily Net interest income expected to increase incrementally from loan growth ▪ Net interest margin (excluding the impact of PPP loans) expected to decrease modestly Core noninterest income expected to remain relatively stable Quarterly adjusted noninterest expense is expected to increase modestly to reflect ongoing costs associated with public listing and strong recent growth Continued strong credit metrics are expected to allow for only modest provision levels Balanced approach to capital deployment with flexibility to support strong organic loan growth trajectory and cash dividend Well-positioned to capitalize on additional accretive acquisition opportunities
22 III. Assets Highlights
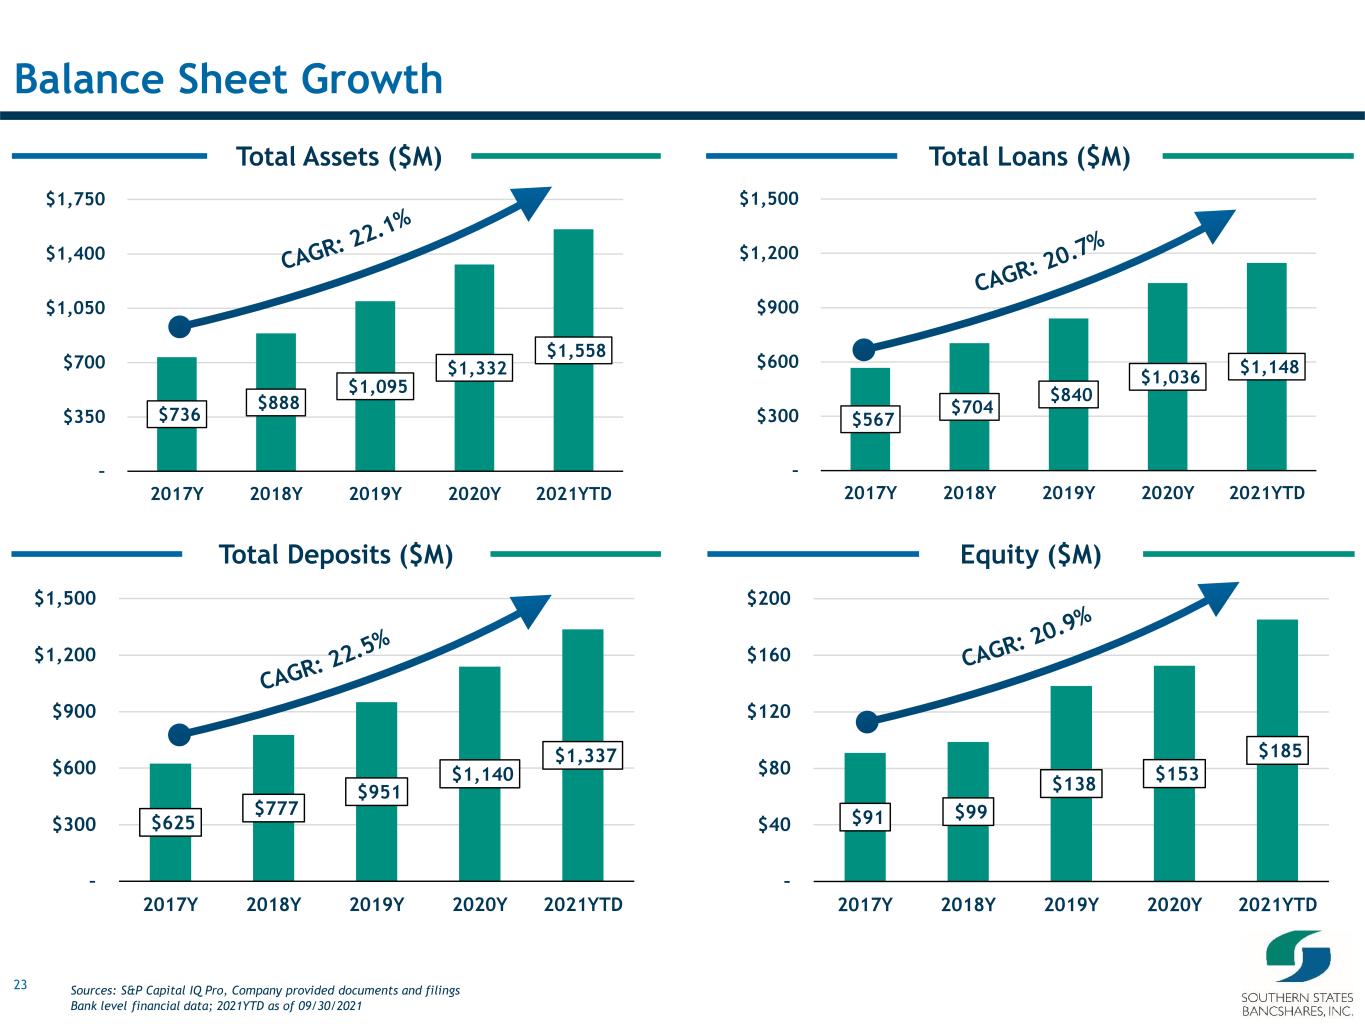
23 $91 $99 $138 $153 $185 – $40 $80 $120 $160 $200 2017Y 2018Y 2019Y 2020Y 2021YTD $625 $777 $951 $1,140 $1,337 – $300 $600 $900 $1,200 $1,500 2017Y 2018Y 2019Y 2020Y 2021YTD $567 $704 $840 $1,036 $1,148 – $300 $600 $900 $1,200 $1,500 2017Y 2018Y 2019Y 2020Y 2021YTD $736 $888 $1,095 $1,332 $1,558 – $350 $700 $1,050 $1,400 $1,750 2017Y 2018Y 2019Y 2020Y 2021YTD Equity ($M)Total Deposits ($M) Total Loans ($M)Total Assets ($M) Balance Sheet Growth Sources: S&P Capital IQ Pro, Company provided documents and filings Bank level financial data; 2021YTD as of 09/30/2021
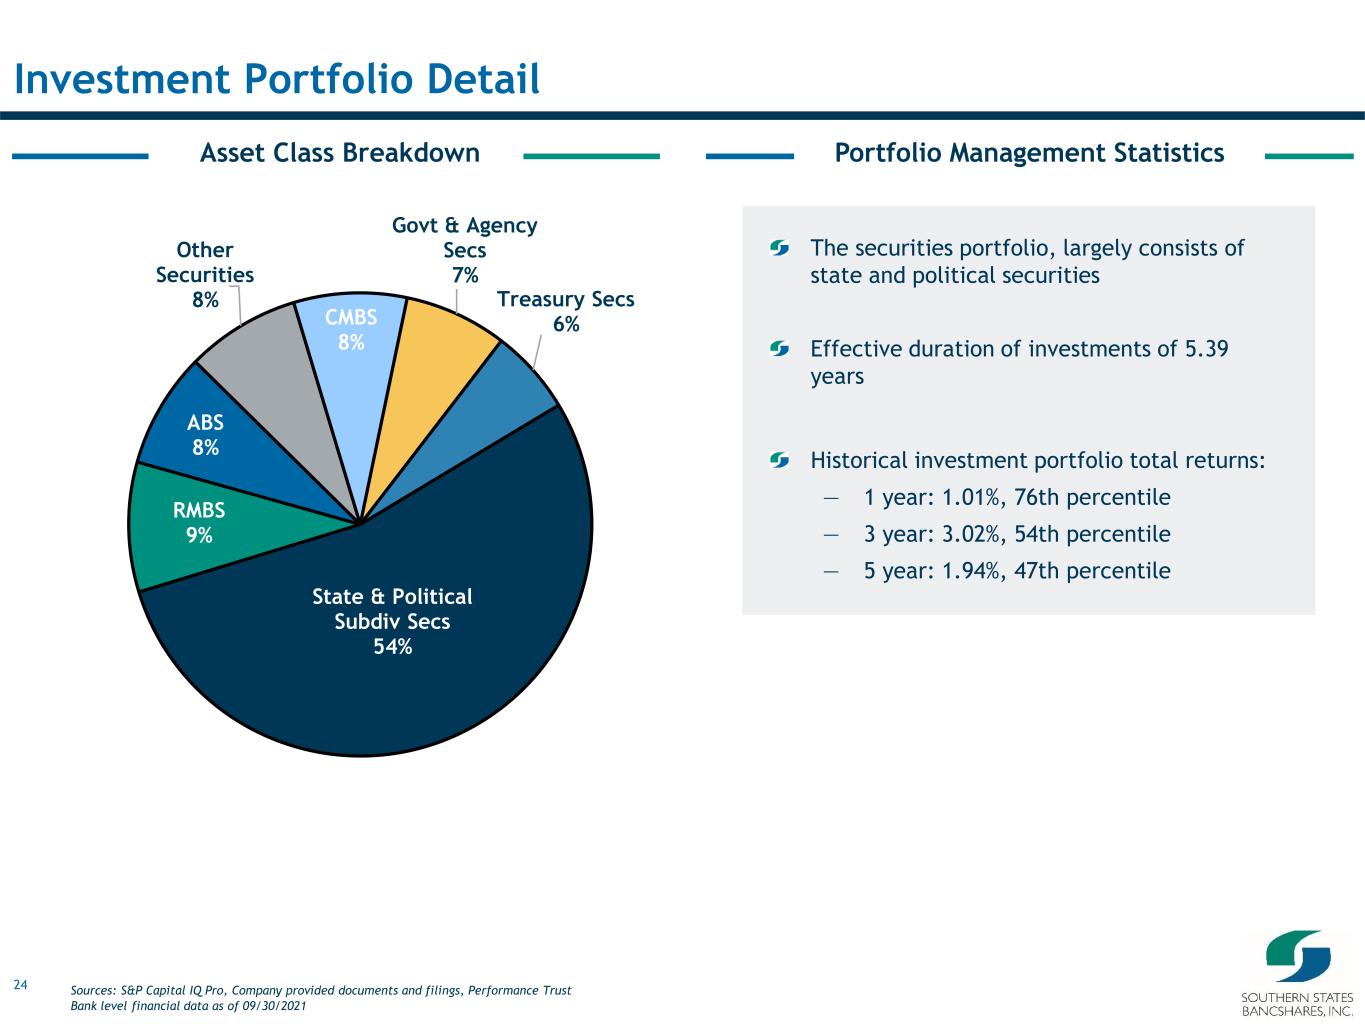
24 Asset Class Breakdown Investment Portfolio Detail The securities portfolio, largely consists of state and political securities Effective duration of investments of 5.39 years Historical investment portfolio total returns: — 1 year: 1.01%, 76th percentile — 3 year: 3.02%, 54th percentile — 5 year: 1.94%, 47th percentile Portfolio Management Statistics State & Political Subdiv Secs 54% RMBS 9% ABS 8% Other Securities 8% CMBS 8% Govt & Agency Secs 7% Treasury Secs 6% Sources: S&P Capital IQ Pro, Company provided documents and filings, Performance Trust Bank level financial data as of 09/30/2021

25 Q3 2021 Loan CompositionLoan Trends ($M) Loan Portfolio Diversification & Growth As of 09/30/2021, the Bank has $20.3 million of PPP loans held on balance sheet Pre-Raise Concentrations: — C&D: 92.82% — CRE: 260.10% $567 $704 $840 $1,036 $1,148 $- $200 $400 $600 $800 $1,000 $1,200 2017Y 2018Y 2019Y 2020Y 2021YTD Owner Occ. CRE 30.3% Non Owner Occ. CRE 23.9% C&I 16.8% Constr & Land Dev 14.4% 1-4 Family 10.1% Multifamily 2.0% Farm 1.2% Consumer 0.8% Other 0.4% Ag. Prod. 0.1% Sources: S&P Capital IQ Pro, Company provided documents and filings Bank level financial data; 2021YTD as of 09/30/2021
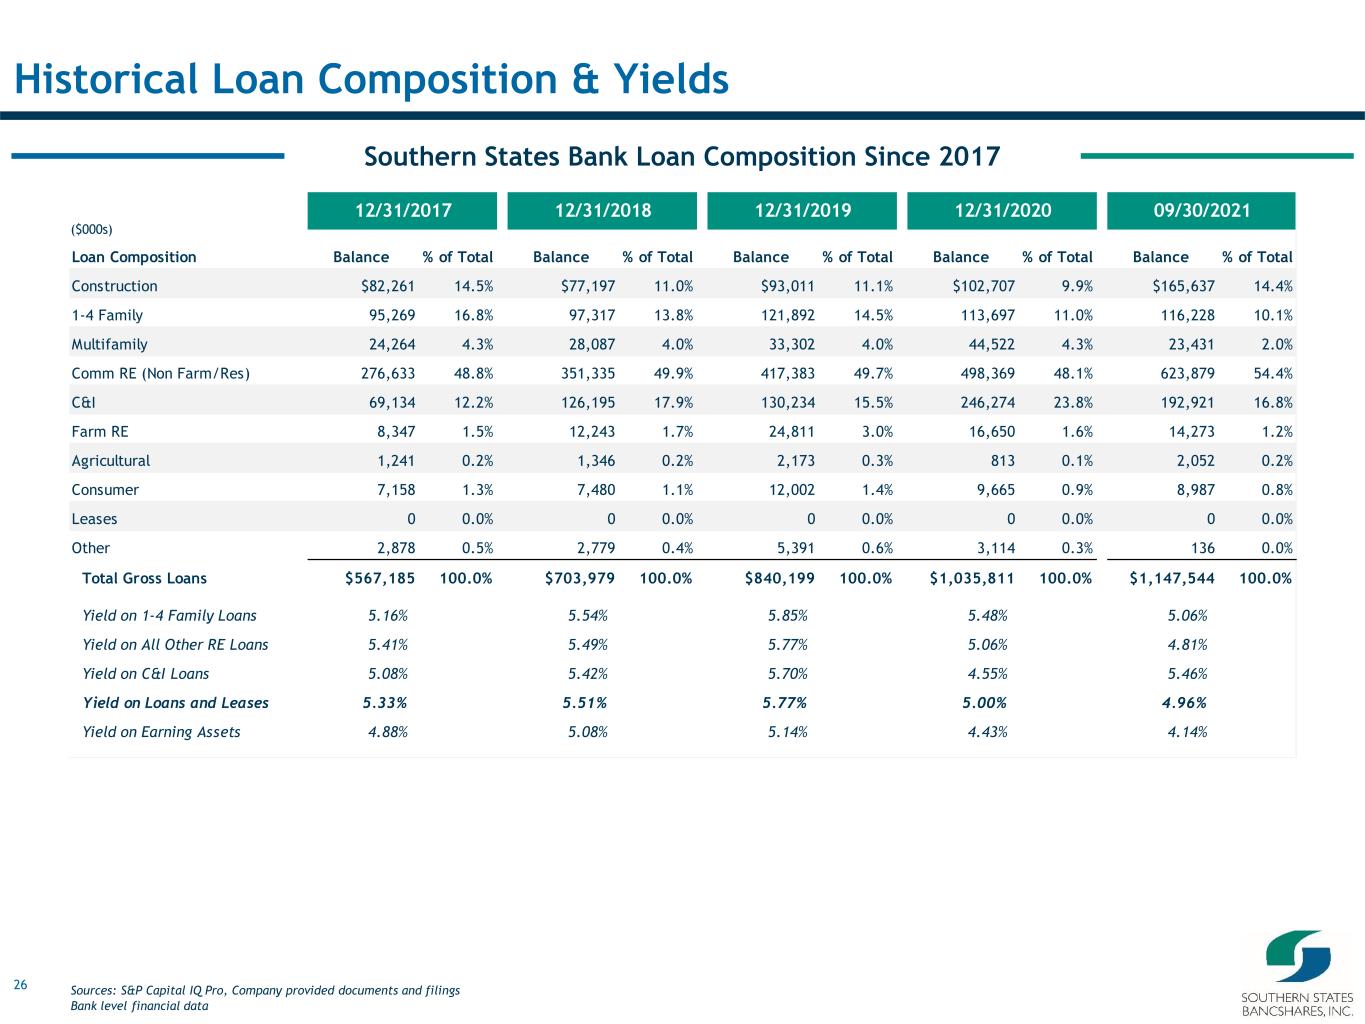
26 Southern States Bank Loan Composition Since 2017 Historical Loan Composition & Yields 12/31/2017 12/31/2018 12/31/2019 12/31/2020 09/30/2021 Loan Composition Balance % of Total Balance % of Total Balance % of Total Balance % of Total Balance % of Total Construction $82,261 14.5% $77,197 11.0% $93,011 11.1% $102,707 9.9% $165,637 14.4% 1-4 Family 95,269 16.8% 97,317 13.8% 121,892 14.5% 113,697 11.0% 116,228 10.1% Multifamily 24,264 4.3% 28,087 4.0% 33,302 4.0% 44,522 4.3% 23,431 2.0% Comm RE (Non Farm/Res) 276,633 48.8% 351,335 49.9% 417,383 49.7% 498,369 48.1% 623,879 54.4% C&I 69,134 12.2% 126,195 17.9% 130,234 15.5% 246,274 23.8% 192,921 16.8% Farm RE 8,347 1.5% 12,243 1.7% 24,811 3.0% 16,650 1.6% 14,273 1.2% Agricultural 1,241 0.2% 1,346 0.2% 2,173 0.3% 813 0.1% 2,052 0.2% Consumer 7,158 1.3% 7,480 1.1% 12,002 1.4% 9,665 0.9% 8,987 0.8% Leases 0 0.0% 0 0.0% 0 0.0% 0 0.0% 0 0.0% Other 2,878 0.5% 2,779 0.4% 5,391 0.6% 3,114 0.3% 136 0.0% Total Gross Loans $567,185 100.0% $703,979 100.0% $840,199 100.0% $1,035,811 100.0% $1,147,544 100.0% Yield on 1-4 Family Loans 5.16% 5.54% 5.85% 5.48% 5.06% Yield on All Other RE Loans 5.41% 5.49% 5.77% 5.06% 4.81% Yield on C&I Loans 5.08% 5.42% 5.70% 4.55% 5.46% Yield on Loans and Leases 5.33% 5.51% 5.77% 5.00% 4.96% Yield on Earning Assets 4.88% 5.08% 5.14% 4.43% 4.14% Sources: S&P Capital IQ Pro, Company provided documents and filings Bank level financial data ($000s)
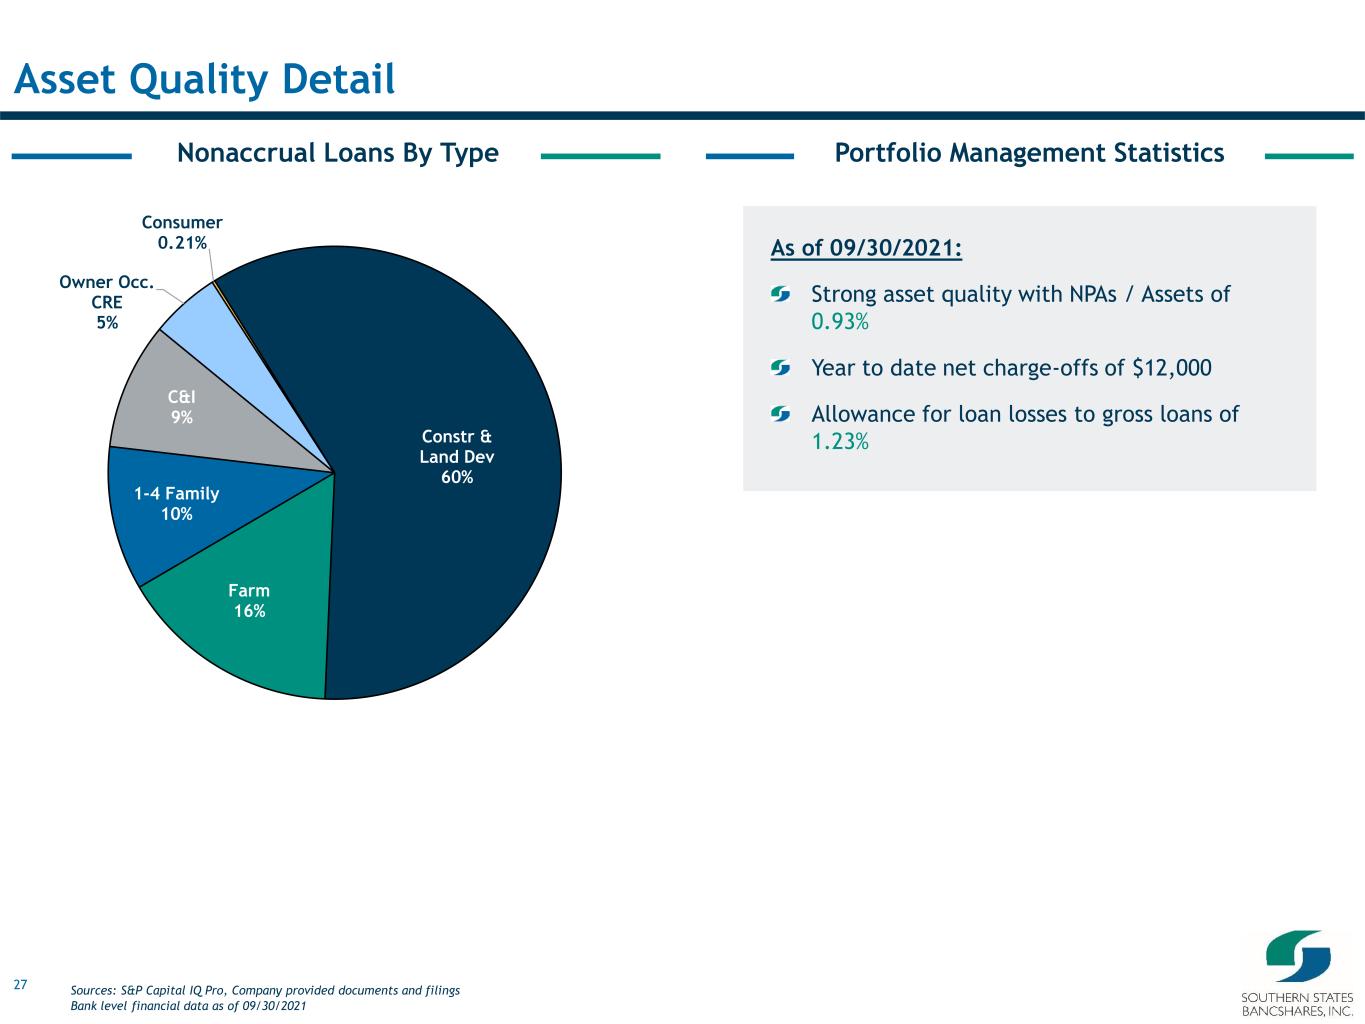
27 Nonaccrual Loans By Type Asset Quality Detail As of 09/30/2021: Strong asset quality with NPAs / Assets of 0.93% Year to date net charge-offs of $12,000 Allowance for loan losses to gross loans of 1.23% Portfolio Management Statistics Constr & Land Dev 60% Farm 16% 1-4 Family 10% C&I 9% Owner Occ. CRE 5% Consumer 0.21% Sources: S&P Capital IQ Pro, Company provided documents and filings Bank level financial data as of 09/30/2021
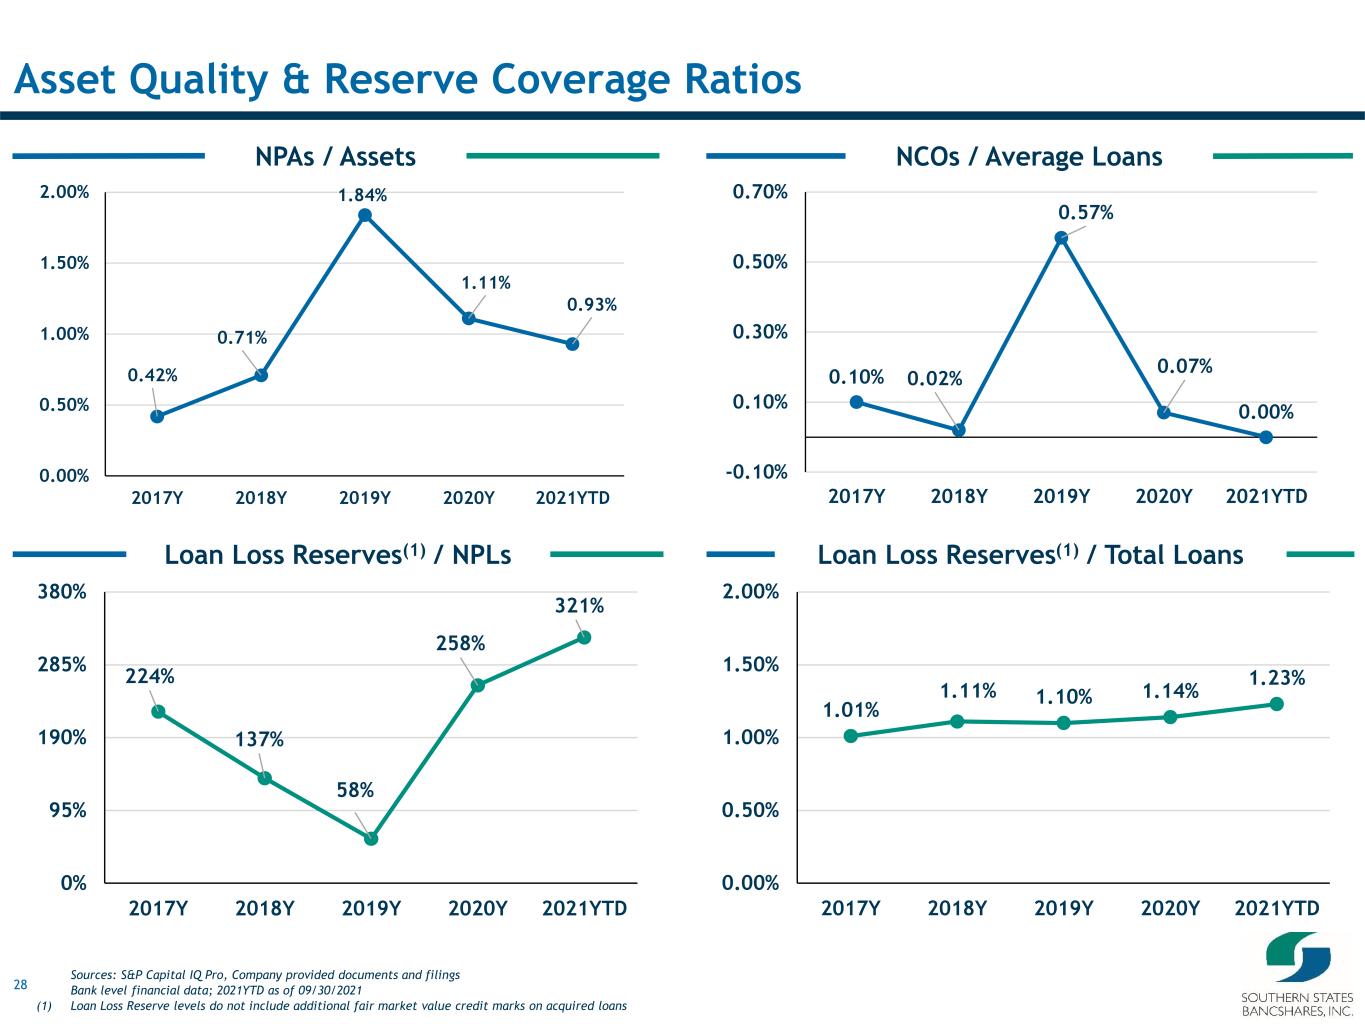
28 1.01% 1.11% 1.10% 1.14% 1.23% 0.00% 0.50% 1.00% 1.50% 2.00% 2017Y 2018Y 2019Y 2020Y 2021YTD Loan Loss Reserves(1) / NPLs NCOs / Average LoansNPAs / Assets Asset Quality & Reserve Coverage Ratios Loan Loss Reserves(1) / Total Loans 0.42% 0.71% 1.84% 1.11% 0.93% 0.00% 0.50% 1.00% 1.50% 2.00% 2017Y 2018Y 2019Y 2020Y 2021YTD 224% 137% 58% 258% 321% 0% 95% 190% 285% 380% 2017Y 2018Y 2019Y 2020Y 2021YTD 0.10% 0.02% 0.57% 0.07% 0.00% -0.10% 0.10% 0.30% 0.50% 0.70% 2017Y 2018Y 2019Y 2020Y 2021YTD Sources: S&P Capital IQ Pro, Company provided documents and filings Bank level financial data; 2021YTD as of 09/30/2021 (1) Loan Loss Reserve levels do not include additional fair market value credit marks on acquired loans
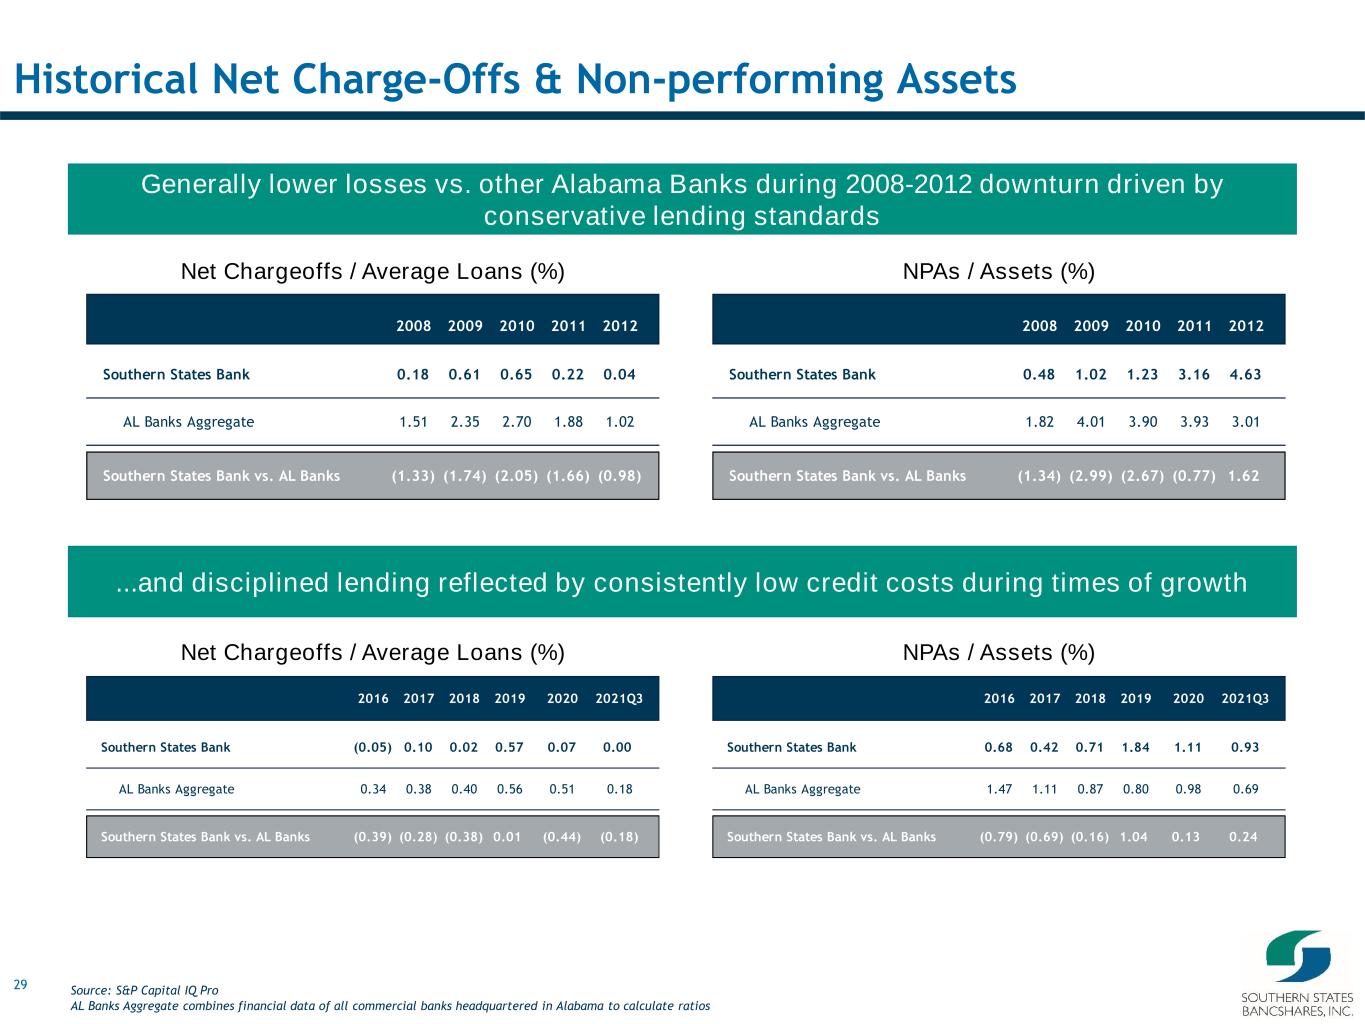
29 Historical Net Charge-Offs & Non-performing Assets Source: S&P Capital IQ Pro AL Banks Aggregate combines financial data of all commercial banks headquartered in Alabama to calculate ratios 2016 2017 2018 2019 2020 2021Q3 Southern States Bank (0.05) 0.10 0.02 0.57 0.07 0.00 AL Banks Aggregate 0.34 0.38 0.40 0.56 0.51 0.18 Southern States Bank vs. AL Banks (0.39) (0.28) (0.38) 0.01 (0.44) (0.18) 2008 2009 2010 2011 2012 Southern States Bank 0.18 0.61 0.65 0.22 0.04 AL Banks Aggregate 1.51 2.35 2.70 1.88 1.02 Southern States Bank vs. AL Banks (1.33) (1.74) (2.05) (1.66) (0.98) Generally lower losses vs. other Alabama Banks during 2008-2012 downturn driven by conservative lending standards 2016 2017 2018 2019 2020 2021Q3 Southern States Bank 0.68 0.42 0.71 1.84 1.11 0.93 AL Banks Aggregate 1.47 1.11 0.87 0.80 0.98 0.69 Southern States Bank vs. AL Banks (0.79) (0.69) (0.16) 1.04 0.13 0.24 2008 2009 2010 2011 2012 Southern States Bank 0.48 1.02 1.23 3.16 4.63 AL Banks Aggregate 1.82 4.01 3.90 3.93 3.01 Southern States Bank vs. AL Banks (1.34) (2.99) (2.67) (0.77) 1.62 ...and disciplined lending reflected by consistently low credit costs during times of growth Net Chargeoffs / Average Loans (%) NPAs / Assets (%) Net Chargeoffs / Average Loans (%) NPAs / Assets (%)
30 IV. Liabilities Highlights
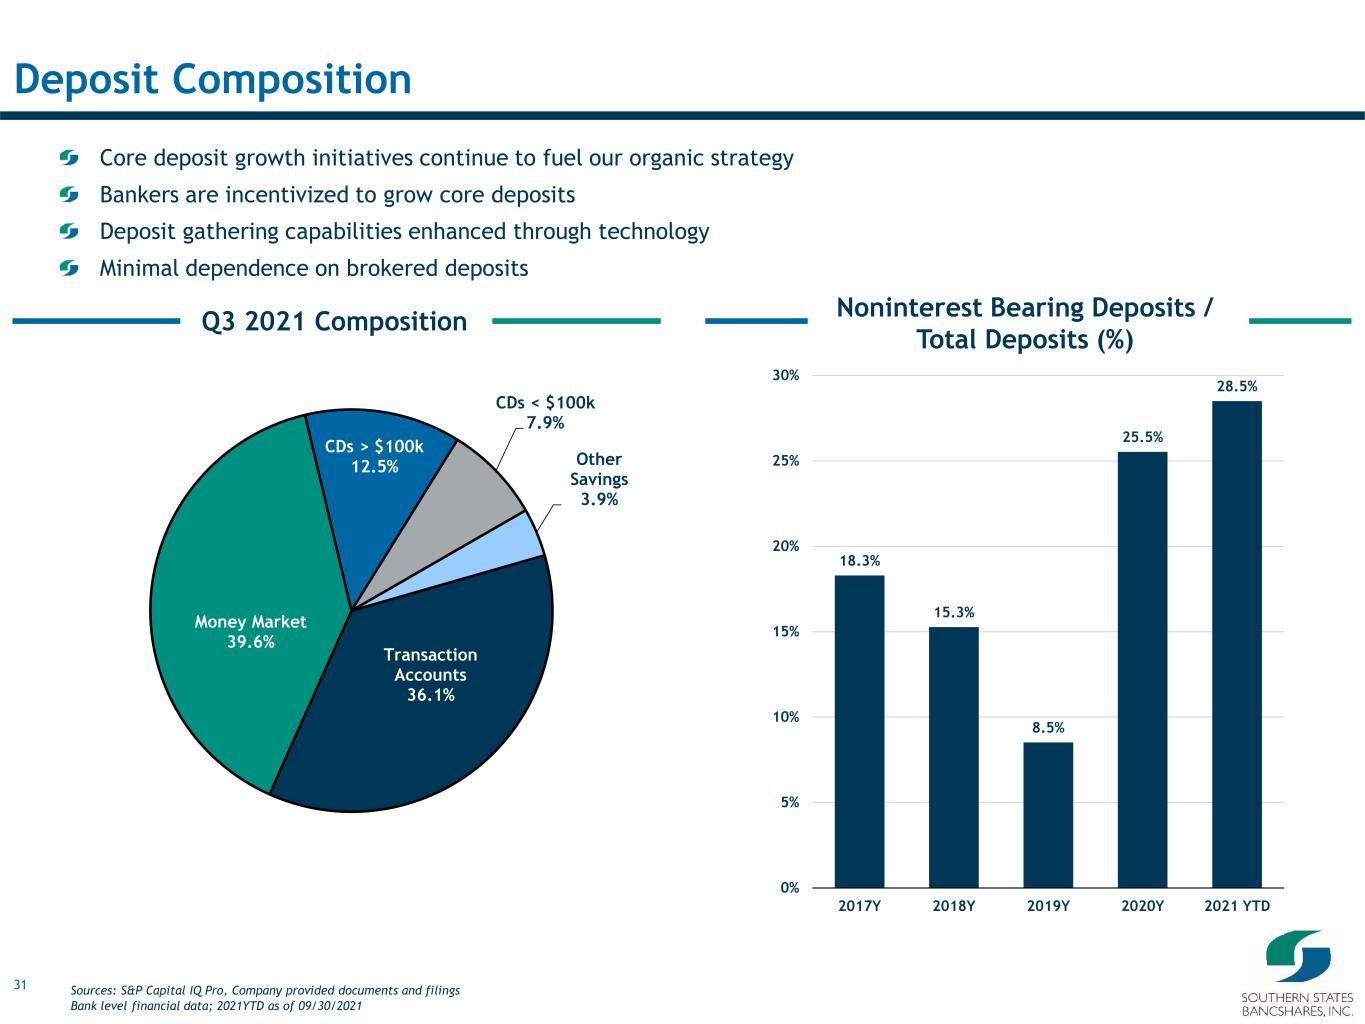
31 Core deposit growth initiatives continue to fuel our organic strategy Bankers are incentivized to grow core deposits Deposit gathering capabilities enhanced through technology Minimal dependence on brokered deposits 18.3% 15.3% 8.5% 25.5% 28.5% 0% 5% 10% 15% 20% 25% 30% 2017Y 2018Y 2019Y 2020Y 2021 YTD Noninterest Bearing Deposits / Total Deposits (%) Deposit Composition Q3 2021 Composition Transaction Accounts 36.1% Money Market 39.6% CDs > $100k 12.5% CDs < $100k 7.9% Other Savings 3.9% Sources: S&P Capital IQ Pro, Company provided documents and filings Bank level financial data; 2021YTD as of 09/30/2021
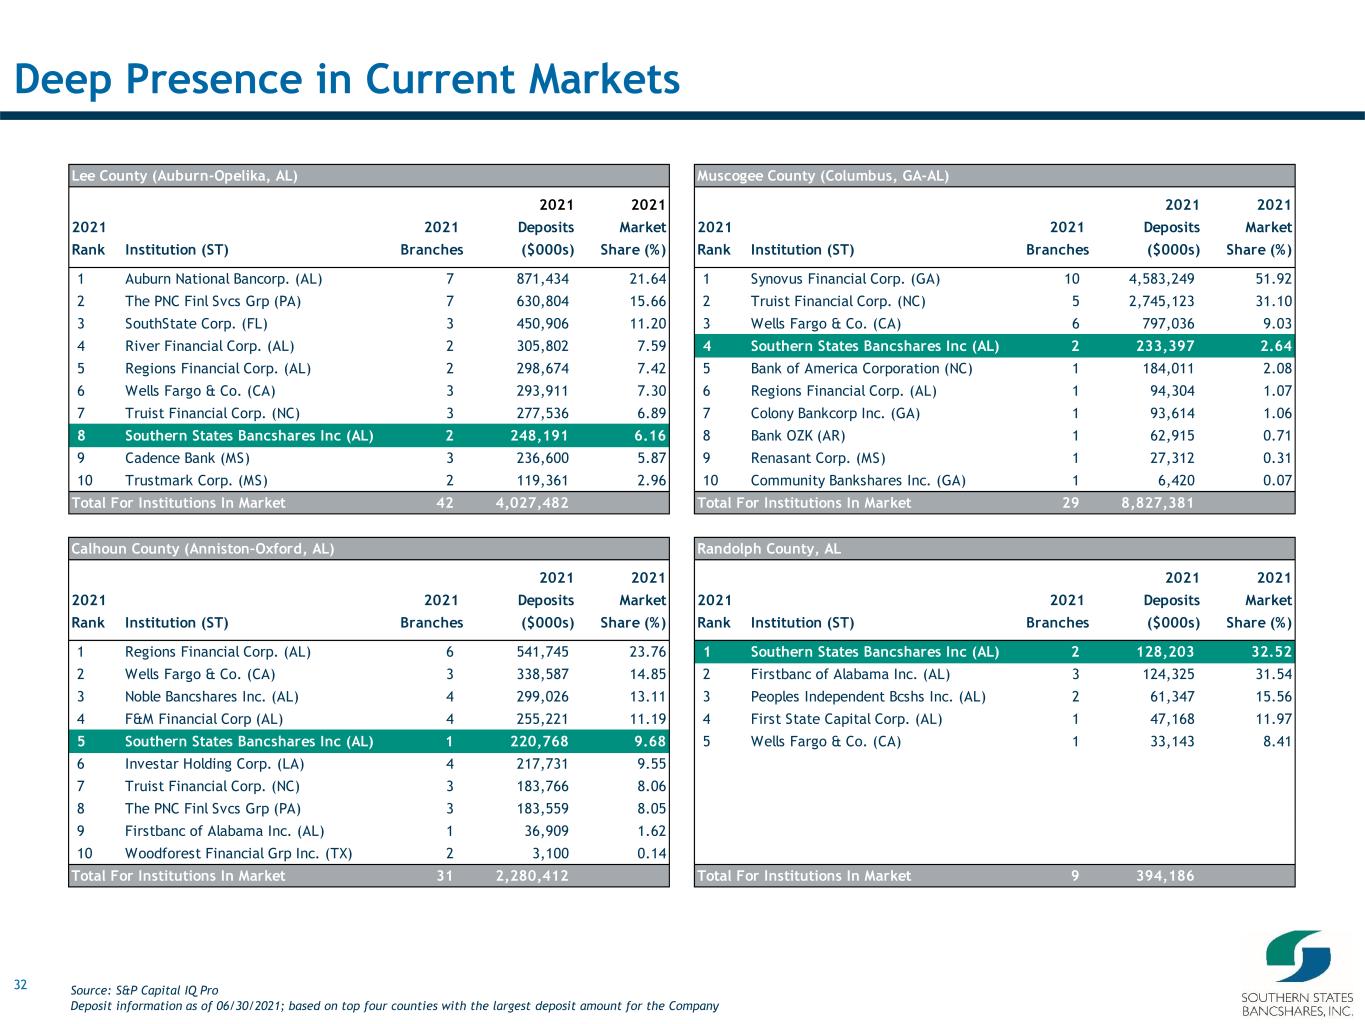
32 Deep Presence in Current Markets Calhoun County (Anniston–Oxford, AL) 2021 2021 2021 2021 Deposits Market Rank Institution (ST) Branches ($000s) Share (%) 1 Regions Financial Corp. (AL) 6 541,745 23.76 2 Wells Fargo & Co. (CA) 3 338,587 14.85 3 Noble Bancshares Inc. (AL) 4 299,026 13.11 4 F&M Financial Corp (AL) 4 255,221 11.19 5 Southern States Bancshares Inc (AL) 1 220,768 9.68 6 Investar Holding Corp. (LA) 4 217,731 9.55 7 Truist Financial Corp. (NC) 3 183,766 8.06 8 The PNC Finl Svcs Grp (PA) 3 183,559 8.05 9 Firstbanc of Alabama Inc. (AL) 1 36,909 1.62 10 Woodforest Financial Grp Inc. (TX) 2 3,100 0.14 Total For Institutions In Market 31 2,280,412 Randolph County, AL 2021 2021 2021 2021 Deposits Market Rank Institution (ST) Branches ($000s) Share (%) 1 Southern States Bancshares Inc (AL) 2 128,203 32.52 2 Firstbanc of Alabama Inc. (AL) 3 124,325 31.54 3 Peoples Independent Bcshs Inc. (AL) 2 61,347 15.56 4 First State Capital Corp. (AL) 1 47,168 11.97 5 Wells Fargo & Co. (CA) 1 33,143 8.41 Total For Institutions In Market 9 394,186 Muscogee County (Columbus, GA-AL) 2021 2021 2021 2021 Deposits Market Rank Institution (ST) Branches ($000s) Share (%) 1 Synovus Financial Corp. (GA) 10 4,583,249 51.92 2 Truist Financial Corp. (NC) 5 2,745,123 31.10 3 Wells Fargo & Co. (CA) 6 797,036 9.03 4 Southern States Bancshares Inc (AL) 2 233,397 2.64 5 Bank of America Corporation (NC) 1 184,011 2.08 6 Regions Financial Corp. (AL) 1 94,304 1.07 7 Colony Bankcorp Inc. (GA) 1 93,614 1.06 8 Bank OZK (AR) 1 62,915 0.71 9 Renasant Corp. (MS) 1 27,312 0.31 10 Community Bankshares Inc. (GA) 1 6,420 0.07 Total For Institutions In Market 29 8,827,381 Lee County (Auburn-Opelika, AL) 2021 2021 2021 2021 Deposits Market Rank Institution (ST) Branches ($000s) Share (%) 1 Auburn National Bancorp. (AL) 7 871,434 21.64 2 The PNC Finl Svcs Grp (PA) 7 630,804 15.66 3 SouthState Corp. (FL) 3 450,906 11.20 4 River Financial Corp. (AL) 2 305,802 7.59 5 Regions Financial Corp. (AL) 2 298,674 7.42 6 Wells Fargo & Co. (CA) 3 293,911 7.30 7 Truist Financial Corp. (NC) 3 277,536 6.89 8 Southern States Bancshares Inc (AL) 2 248,191 6.16 9 Cadence Bank (MS) 3 236,600 5.87 10 Trustmark Corp. (MS) 2 119,361 2.96 Total For Institutions In Market 42 4,027,482 Source: S&P Capital IQ Pro Deposit information as of 06/30/2021; based on top four counties with the largest deposit amount for the Company
33 V. Capital Highlights
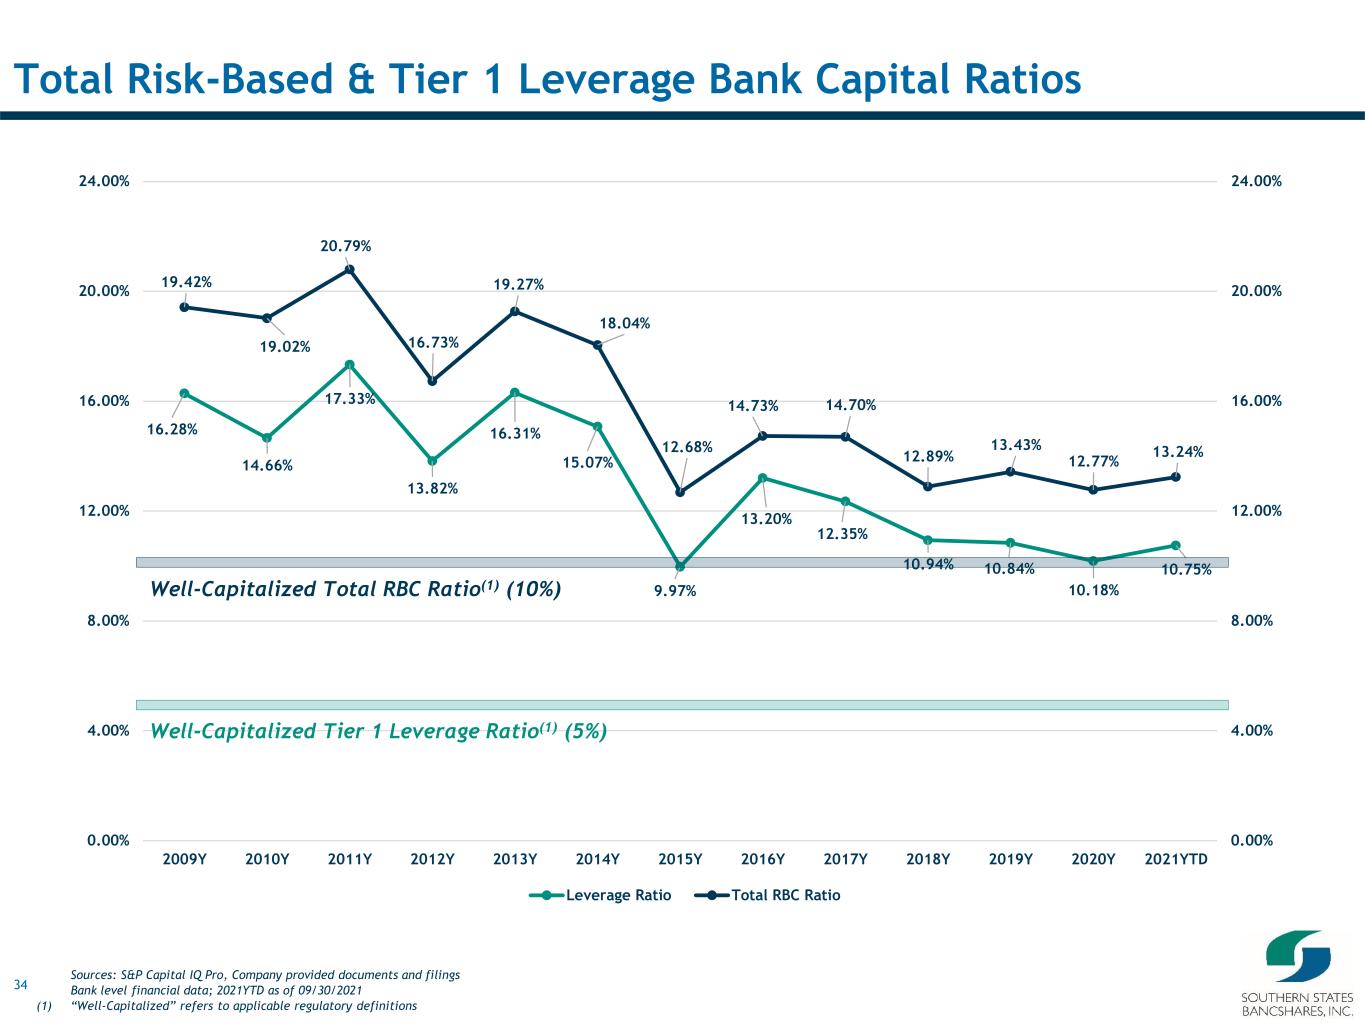
34 16.28% 14.66% 17.33% 13.82% 16.31% 15.07% 9.97% 13.20% 12.35% 10.94% 10.84% 10.18% 10.75% 19.42% 19.02% 20.79% 16.73% 19.27% 18.04% 12.68% 14.73% 14.70% 12.89% 13.43% 12.77% 13.24% 0.00% 4.00% 8.00% 12.00% 16.00% 20.00% 24.00% 0.00% 4.00% 8.00% 12.00% 16.00% 20.00% 24.00% 2009Y 2010Y 2011Y 2012Y 2013Y 2014Y 2015Y 2016Y 2017Y 2018Y 2019Y 2020Y 2021YTD Leverage Ratio Total RBC Ratio Total Risk-Based & Tier 1 Leverage Bank Capital Ratios Well-Capitalized Total RBC Ratio(1) (10%) Well-Capitalized Tier 1 Leverage Ratio(1) (5%) Sources: S&P Capital IQ Pro, Company provided documents and filings Bank level financial data; 2021YTD as of 09/30/2021 (1) “Well-Capitalized” refers to applicable regulatory definitions
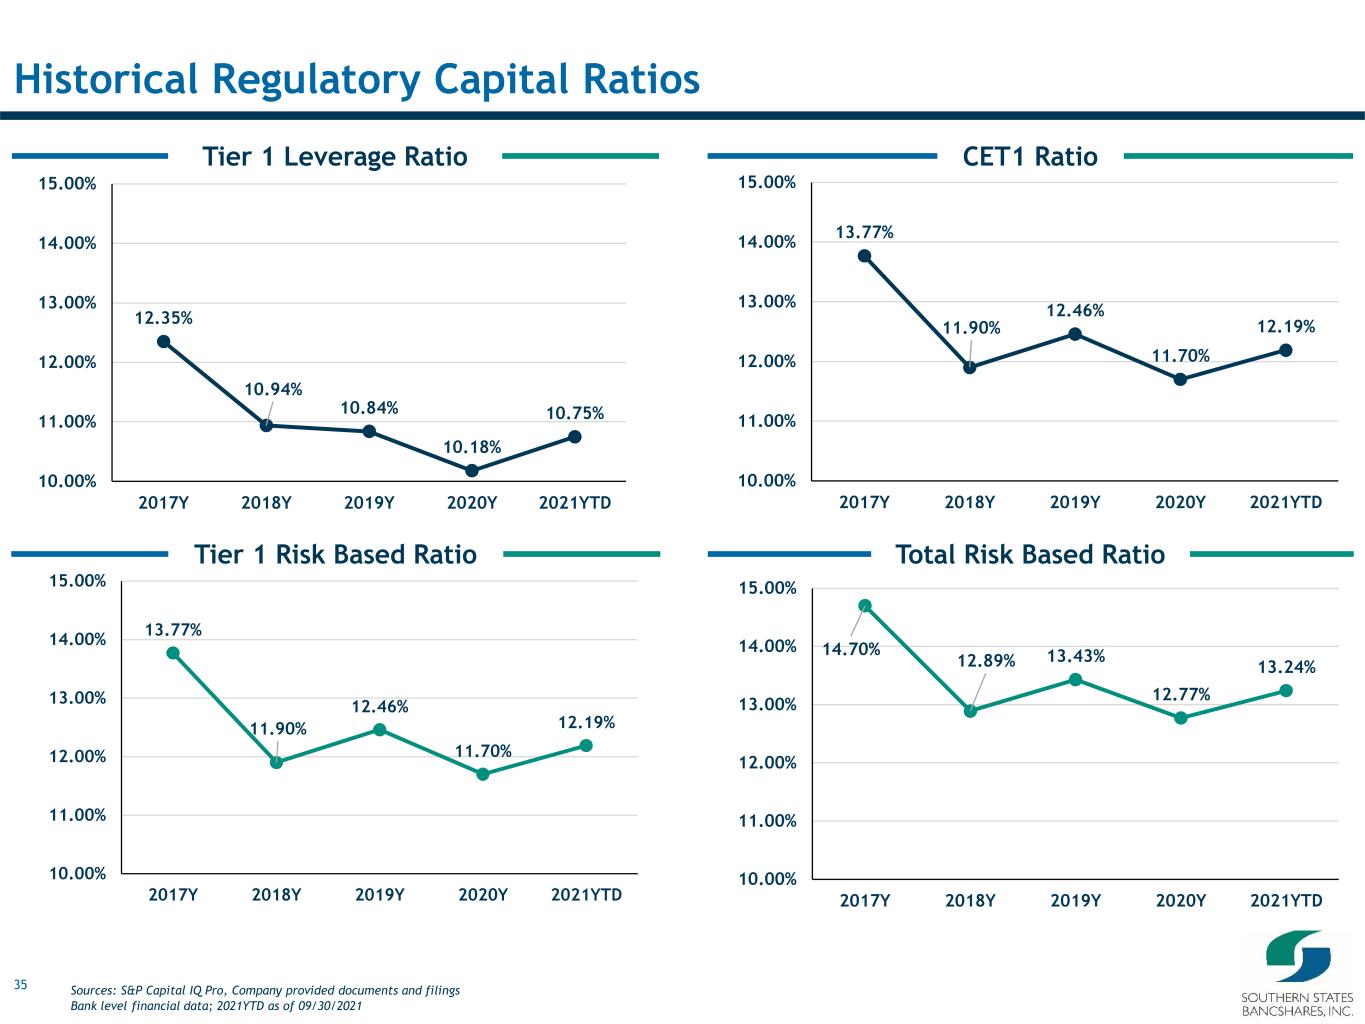
35 Total Risk Based RatioTier 1 Risk Based Ratio CET1 RatioTier 1 Leverage Ratio Historical Regulatory Capital Ratios 12.35% 10.94% 10.84% 10.18% 10.75% 10.00% 11.00% 12.00% 13.00% 14.00% 15.00% 2017Y 2018Y 2019Y 2020Y 2021YTD 14.70% 12.89% 13.43% 12.77% 13.24% 10.00% 11.00% 12.00% 13.00% 14.00% 15.00% 2017Y 2018Y 2019Y 2020Y 2021YTD 13.77% 11.90% 12.46% 11.70% 12.19% 10.00% 11.00% 12.00% 13.00% 14.00% 15.00% 2017Y 2018Y 2019Y 2020Y 2021YTD 13.77% 11.90% 12.46% 11.70% 12.19% 10.00% 11.00% 12.00% 13.00% 14.00% 15.00% 2017Y 2018Y 2019Y 2020Y 2021YTD Sources: S&P Capital IQ Pro, Company provided documents and filings Bank level financial data; 2021YTD as of 09/30/2021
36 VI. Income Statement Highlights
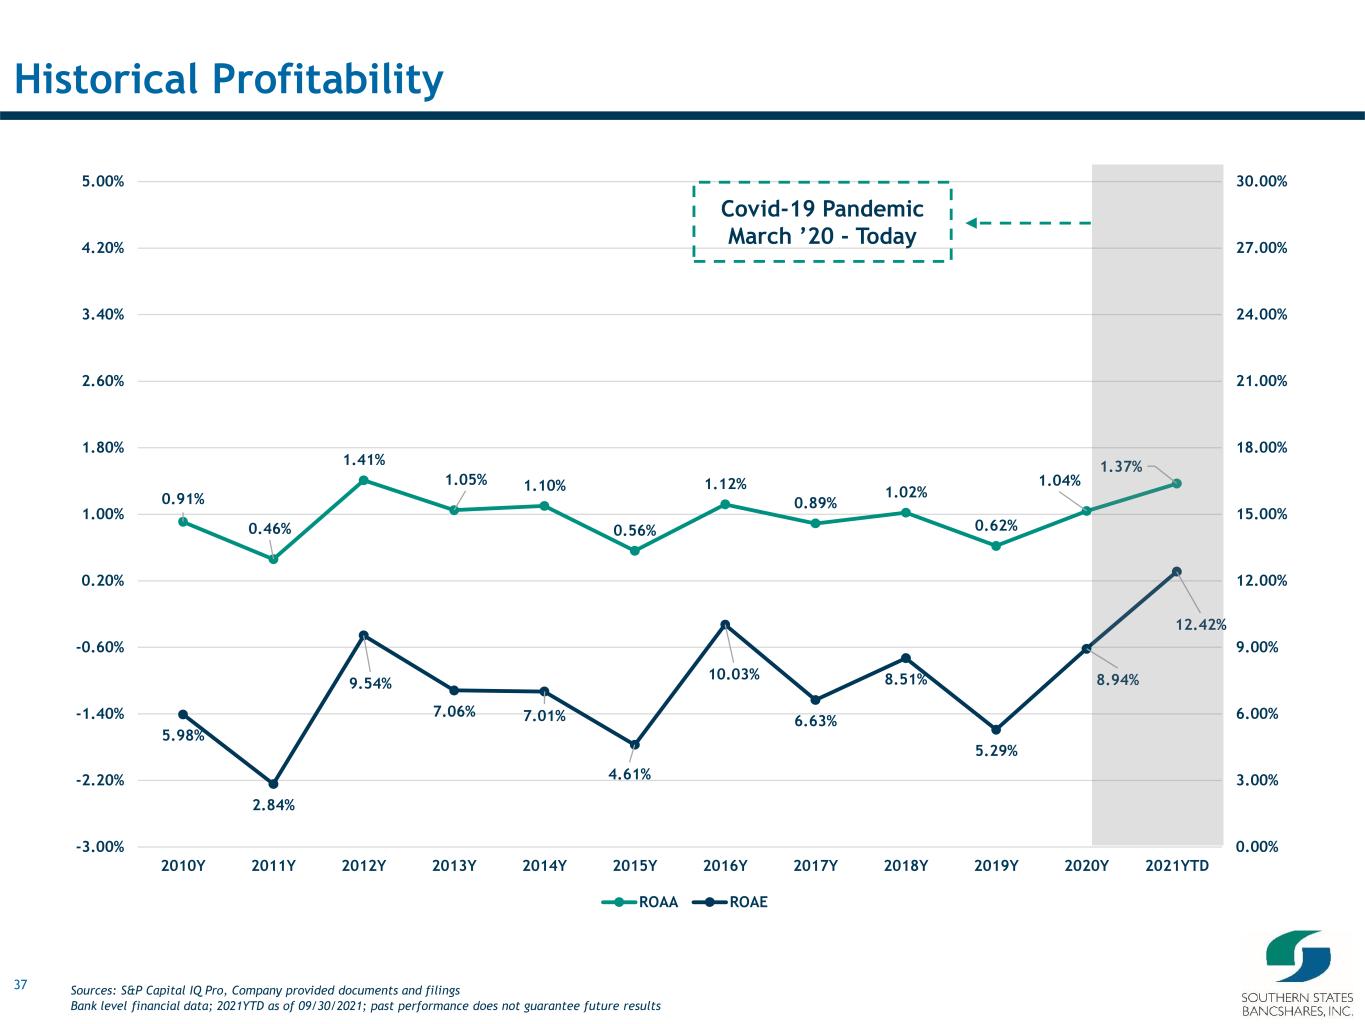
37 0.91% 0.46% 1.41% 1.05% 1.10% 0.56% 1.12% 0.89% 1.02% 0.62% 1.04% 1.37% 5.98% 2.84% 9.54% 7.06% 7.01% 4.61% 10.03% 6.63% 8.51% 5.29% 8.94% 12.42% 0.00% 3.00% 6.00% 9.00% 12.00% 15.00% 18.00% 21.00% 24.00% 27.00% 30.00% -3.00% -2.20% -1.40% -0.60% 0.20% 1.00% 1.80% 2.60% 3.40% 4.20% 5.00% 2010Y 2011Y 2012Y 2013Y 2014Y 2015Y 2016Y 2017Y 2018Y 2019Y 2020Y 2021YTD ROAA ROAE Historical Profitability Covid-19 Pandemic March ’20 - Today Sources: S&P Capital IQ Pro, Company provided documents and filings Bank level financial data; 2021YTD as of 09/30/2021; past performance does not guarantee future results
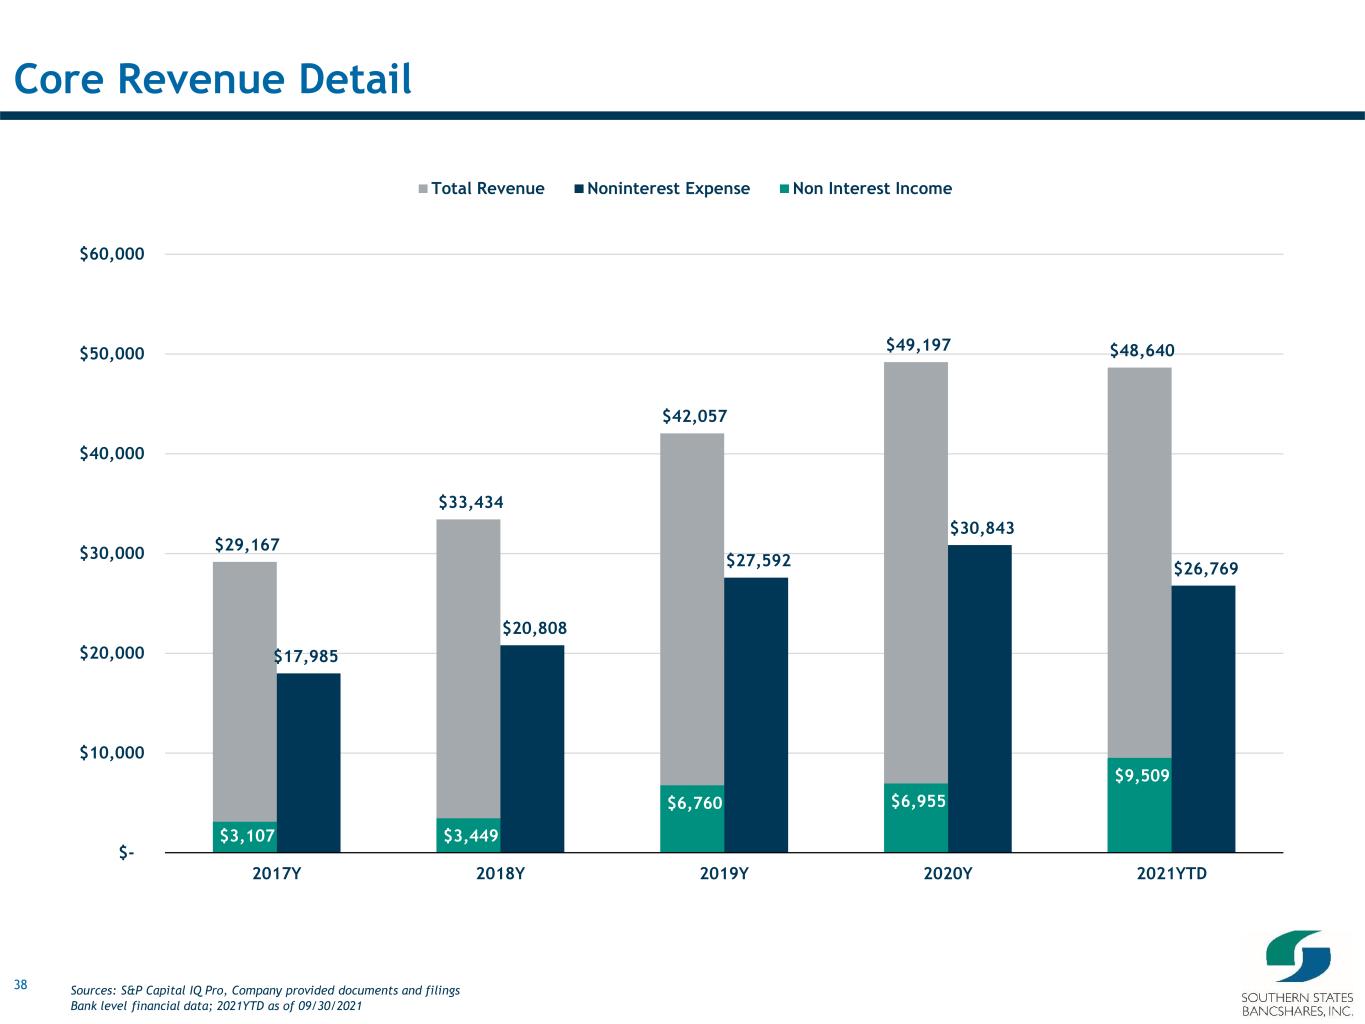
38 Core Revenue Detail $29,167 $33,434 $42,057 $49,197 $48,640 $17,985 $20,808 $27,592 $30,843 $26,769 $3,107 $3,449 $6,760 $6,955 $9,509 $- $10,000 $20,000 $30,000 $40,000 $50,000 $60,000 2017Y 2018Y 2019Y 2020Y 2021YTD Total Revenue Noninterest Expense Non Interest Income Sources: S&P Capital IQ Pro, Company provided documents and filings Bank level financial data; 2021YTD as of 09/30/2021
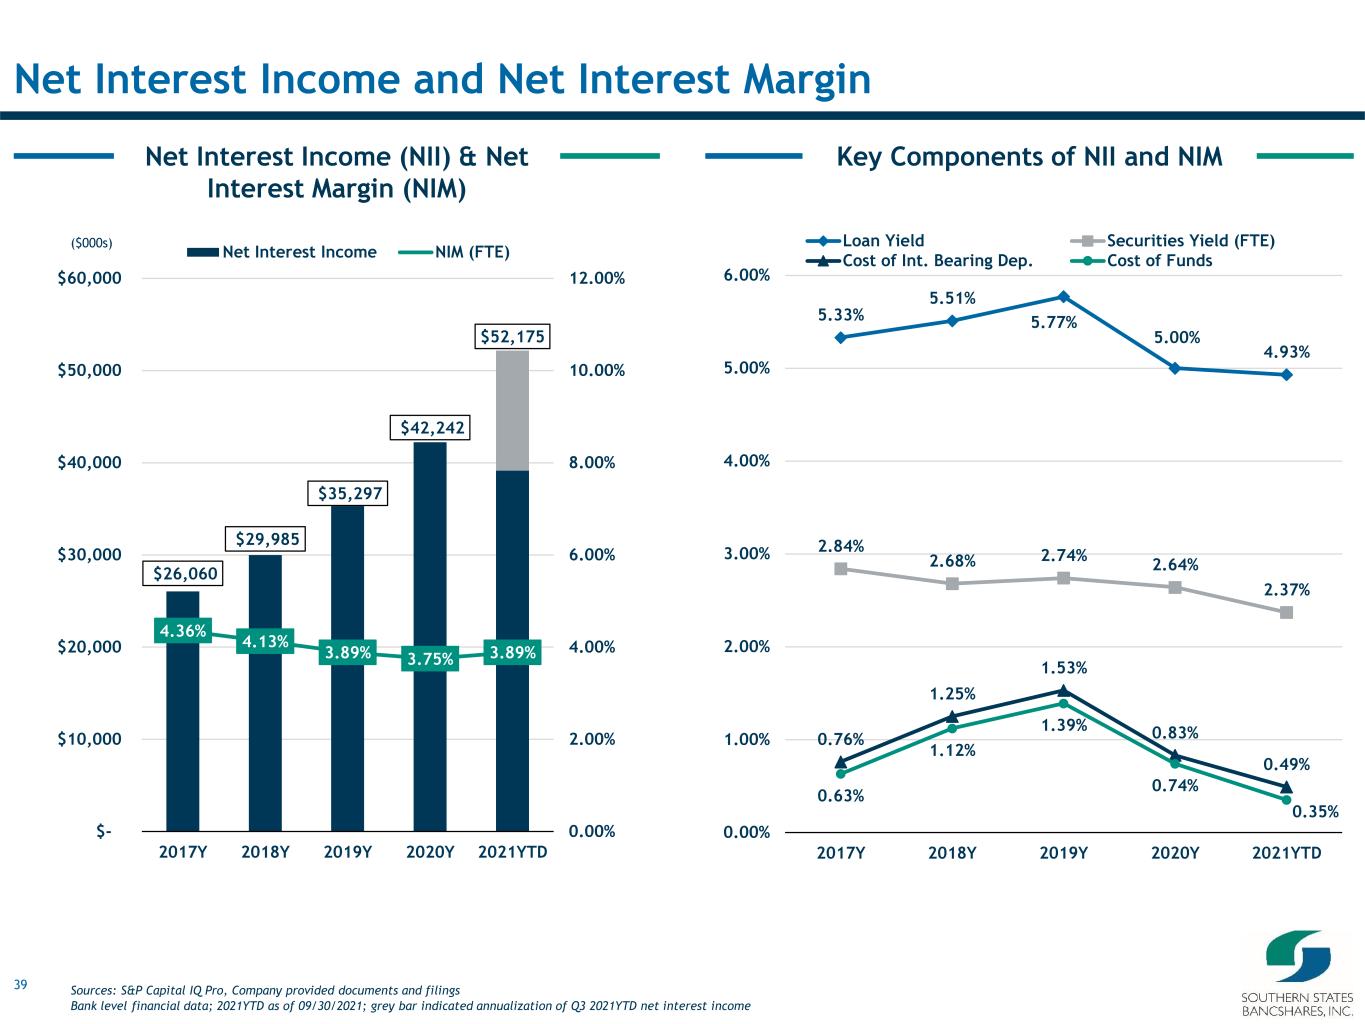
39 Key Components of NII and NIMNet Interest Income (NII) & Net Interest Margin (NIM) Net Interest Income and Net Interest Margin $26,060 $29,985 $35,297 $42,242 $52,175 4.36% 4.13% 3.89% 3.75% 3.89% 0.00% 2.00% 4.00% 6.00% 8.00% 10.00% 12.00% $- $10,000 $20,000 $30,000 $40,000 $50,000 $60,000 2017Y 2018Y 2019Y 2020Y 2021YTD Net Interest Income NIM (FTE) 5.33% 5.51% 5.77% 5.00% 4.93% 2.84% 2.68% 2.74% 2.64% 2.37% 0.76% 1.25% 1.53% 0.83% 0.49% 0.63% 1.12% 1.39% 0.74% 0.35% 0.00% 1.00% 2.00% 3.00% 4.00% 5.00% 6.00% 2017Y 2018Y 2019Y 2020Y 2021YTD Loan Yield Securities Yield (FTE) Cost of Int. Bearing Dep. Cost of Funds Sources: S&P Capital IQ Pro, Company provided documents and filings Bank level financial data; 2021YTD as of 09/30/2021; grey bar indicated annualization of Q3 2021YTD net interest income ($000s)

40 Pre-Tax ROAE & ROAAEfficiency Ratio & NIE / Average Assets Profitability and Expense Controls 61.2% 61.9% 65.2% 62.2% 54.6% 2.74% 2.64% 2.80% 2.49% 2.43% 0.00% 1.00% 2.00% 3.00% 4.00% 5.00% 6.00% 7.00% 8.00% 9.00% 10.00% 0.0% 10.0% 20.0% 30.0% 40.0% 50.0% 60.0% 70.0% 80.0% 90.0% 100.0% 2017Y 2018Y 2019Y 2020Y 2021YTD N o n in te re st E x p e n se / A v g . A sse ts E ff ic ie n c y R a ti o Efficiency Ratio Noninterest Expense / Avg. Assets 11.2% 11.1% 7.6% 10.9% 16.1% 1.50% 1.33% 0.89% 1.27% 1.78% 0.00% 0.30% 0.60% 0.90% 1.20% 1.50% 1.80% 2.10% 2.40% 2.70% 3.00% 0.0% 2.0% 4.0% 6.0% 8.0% 10.0% 12.0% 14.0% 16.0% 18.0% 20.0% 2017Y 2018Y 2019Y 2020Y 2021YTD P re -T a x R O A AP re -T a x R O A E Pre-Tax ROAE Pre-Tax ROAA Sources: S&P Capital IQ Pro, Company provided documents and filings Bank level financial data; 2021YTD as of 09/30/2021
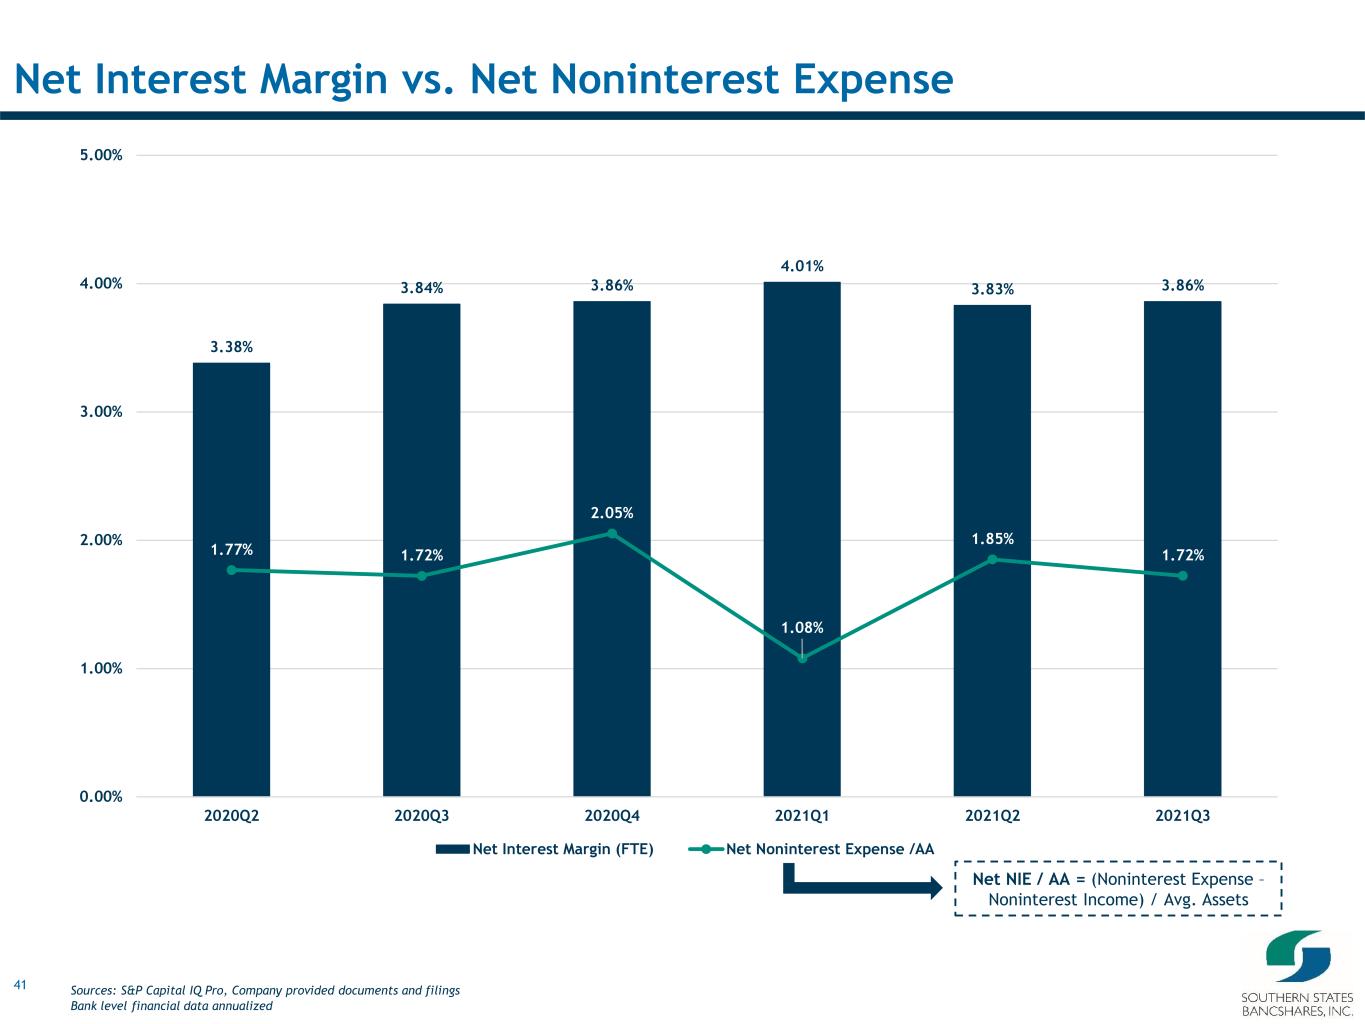
41 Net Interest Margin vs. Net Noninterest Expense 3.38% 3.84% 3.86% 4.01% 3.83% 3.86% 1.77% 1.72% 2.05% 1.08% 1.85% 1.72% 0.00% 1.00% 2.00% 3.00% 4.00% 5.00% 2020Q2 2020Q3 2020Q4 2021Q1 2021Q2 2021Q3 Net Interest Margin (FTE) Net Noninterest Expense /AA Net NIE / AA = (Noninterest Expense – Noninterest Income) / Avg. Assets Sources: S&P Capital IQ Pro, Company provided documents and filings Bank level financial data annualized

42 Net Interest Margin Sensitivity Profile Asset-Liability Management Profile Economic Value Sensitivity Profile Interest Rate Scenario -400 -300 -200 -100 Base 100 200 300 400 Net Interest Income Change - Next 12 Months -17.6% -12.8% -7.4% -1.9% 0.0% 6.4% 13.0% 19.6% 26.1% Interest Rate Scenario -400 -300 -200 -100 Base 100 200 300 400 EVE Change -12.1% -10.2% -7.7% -4.6% 0.0% 3.2% 6.1% 8.7% 10.9% Sources: Company provided documents and filings As of 09/30/2021
43 VII. Appendix

44 Financial Highlights (Bank Regulatory) For the Years Ended: For the Quarters Ended: 9/30/2021 12/31/2017 12/31/2018 12/31/2019 12/31/2020 12/31/2020 3/31/2021 6/30/2021 9/30/2021 CAGR Balance Sheet Total Assets ($000) 735,821 888,073 1,095,493 1,332,475 1,332,475 1,458,519 1,513,421 1,557,978 22.1% Total Loans ($000) 567,185 703,979 840,199 1,035,811 1,035,811 1,085,542 1,100,326 1,147,544 20.7% Total Deposits ($000) 624,805 777,047 951,124 1,139,822 1,139,822 1,260,306 1,312,882 1,337,285 22.5% Tangible Equity ($000) 84,396 92,227 119,386 134,045 134,045 137,993 142,480 166,948 Loans / Deposits (%) 90.8 90.6 88.3 90.9 90.9 86.1 83.8 85.8 (Cash + Securities)/ Assets (%) 14.4 13.8 13.8 14.5 14.5 17.7 18.7 17.7 TCE / TA (%) 11.6 10.5 11.1 10.2 10.2 9.6 9.5 10.8 Tier 1 Leverage Ratio (%) 12.4 10.9 10.8 10.2 10.2 10.1 9.5 10.8 Total Risk-Based Capital Ratio (%) 14.7 12.9 13.4 12.8 12.8 12.2 12.0 13.2 Profitability Net Income ($000) 5,841 8,012 6,112 12,960 3,513 5,875 4,146 5,085 ROAA (%) 0.89 1.02 0.62 1.04 1.08 1.72 1.11 1.31 ROAE (%) 6.63 8.51 5.29 8.94 9.31 15.20 10.45 11.75 Net Interest Margin (%) 4.30 4.10 3.86 3.72 3.83 3.99 3.81 3.84 Efficiency Ratio (%) 61.2 61.9 65.2 62.2 63.2 49.0 59.3 56.2 Noninterest Inc/ Operating Rev (%) 10.7 10.3 16.1 14.1 12.1 28.1 14.4 15.3 Noninterest Exp/ AA (%) 2.7 2.6 2.8 2.5 2.5 2.5 2.4 2.4 Asset Quality (%) NPLs / Loans (%) 0.5 0.8 1.9 0.4 0.4 0.5 0.3 0.4 NPAs / Assets (%) 0.4 0.7 1.8 1.1 1.1 1.0 0.9 0.9 Texas Ratio (%) 3.4 6.3 16.0 10.2 10.2 10.0 8.6 8.0 Reserves / Loans (%) 1.01 1.11 1.10 1.14 1.14 1.16 1.21 1.23 NCOs / Avg Loans (%) 0.10 0.02 0.57 0.07 0.34 - 0.01 - Sources: S&P Capital IQ Pro, Company provided documents and filings Bank level financial data
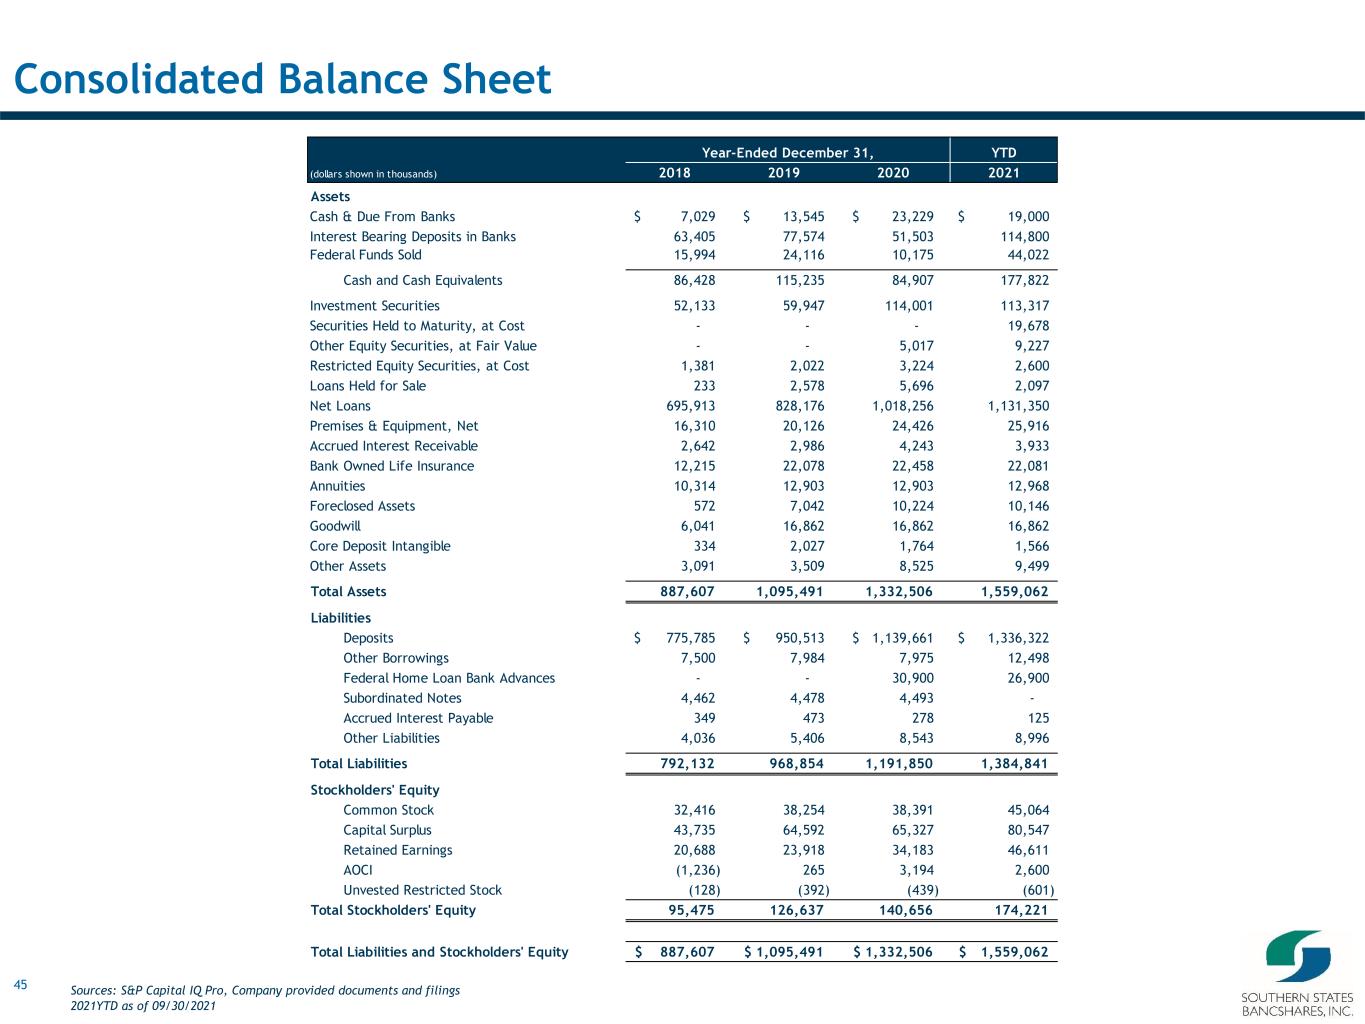
45 Consolidated Balance Sheet Year-Ended December 31, YTD (dollars shown in thousands) 2018 2019 2020 2021 Assets Cash & Due From Banks 7,029$ 13,545$ 23,229$ 19,000$ Interest Bearing Deposits in Banks 63,405 77,574 51,503 114,800 Federal Funds Sold 15,994 24,116 10,175 44,022 Cash and Cash Equivalents 86,428 115,235 84,907 177,822 Investment Securities 52,133 59,947 114,001 113,317 Securities Held to Maturity, at Cost - - - 19,678 Other Equity Securities, at Fair Value - - 5,017 9,227 Restricted Equity Securities, at Cost 1,381 2,022 3,224 2,600 Loans Held for Sale 233 2,578 5,696 2,097 Net Loans 695,913 828,176 1,018,256 1,131,350 Premises & Equipment, Net 16,310 20,126 24,426 25,916 Accrued Interest Receivable 2,642 2,986 4,243 3,933 Bank Owned Life Insurance 12,215 22,078 22,458 22,081 Annuities 10,314 12,903 12,903 12,968 Foreclosed Assets 572 7,042 10,224 10,146 Goodwill 6,041 16,862 16,862 16,862 Core Deposit Intangible 334 2,027 1,764 1,566 Other Assets 3,091 3,509 8,525 9,499 Total Assets 887,607 1,095,491 1,332,506 1,559,062 Liabilities Deposits 775,785$ 950,513$ 1,139,661$ 1,336,322$ Other Borrowings 7,500 7,984 7,975 12,498 Federal Home Loan Bank Advances - - 30,900 26,900 Subordinated Notes 4,462 4,478 4,493 - Accrued Interest Payable 349 473 278 125 Other Liabilities 4,036 5,406 8,543 8,996 Total Liabilities 792,132 968,854 1,191,850 1,384,841 Stockholders' Equity Common Stock 32,416 38,254 38,391 45,064 Capital Surplus 43,735 64,592 65,327 80,547 Retained Earnings 20,688 23,918 34,183 46,611 AOCI (1,236) 265 3,194 2,600 Unvested Restricted Stock (128) (392) (439) (601) Total Stockholders' Equity 95,475 126,637 140,656 174,221 Total Liabilities and Stockholders' Equity 887,607$ 1,095,491$ 1,332,506$ 1,559,062$ Sources: S&P Capital IQ Pro, Company provided documents and filings 2021YTD as of 09/30/2021
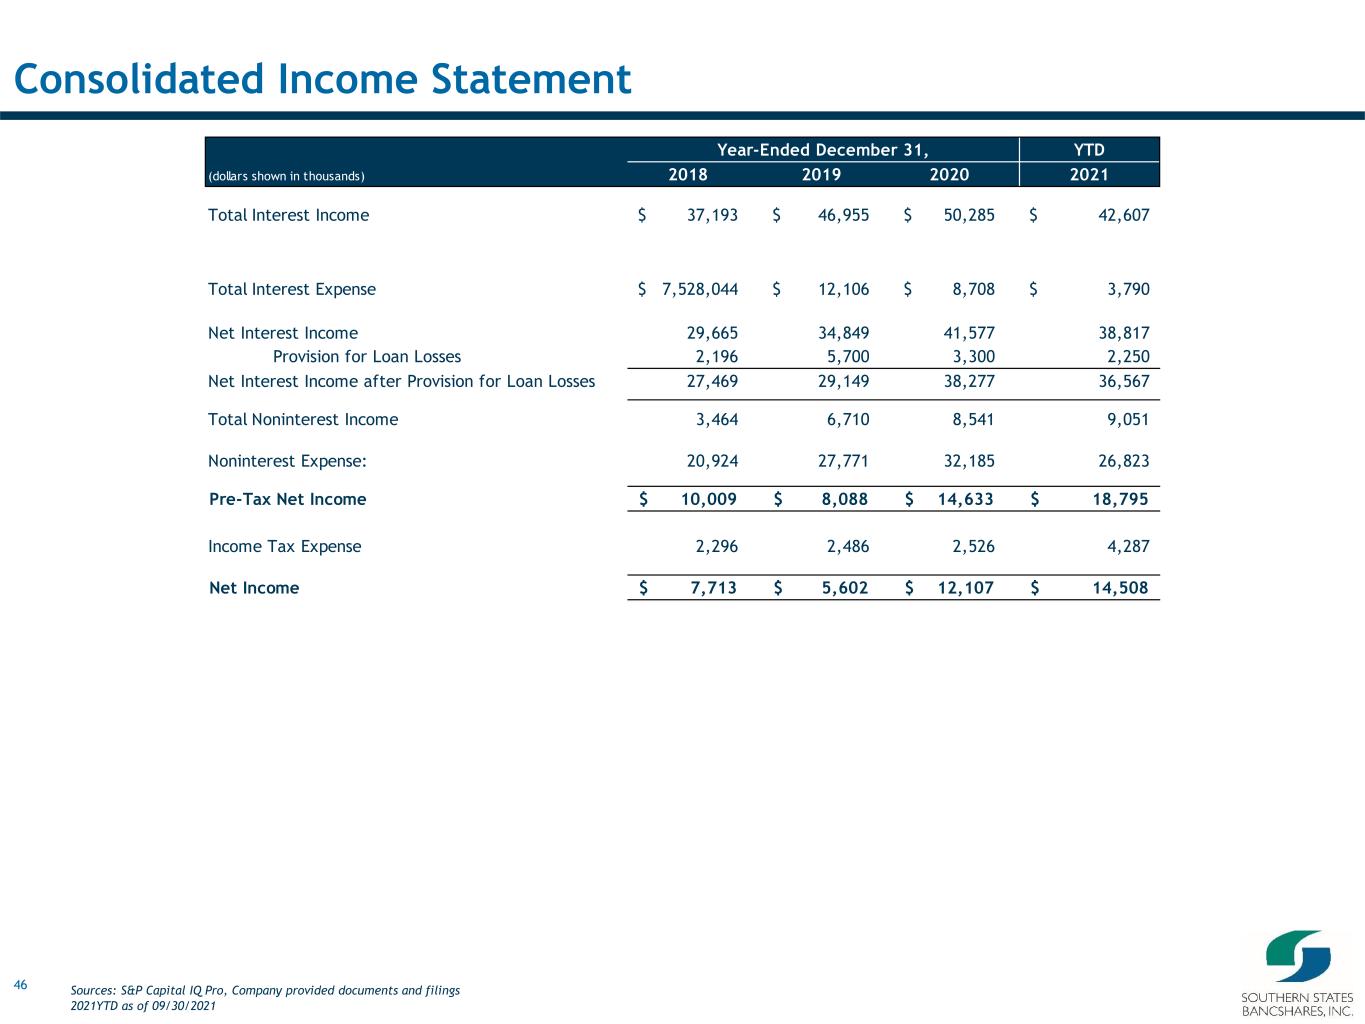
46 Consolidated Income Statement Year-Ended December 31, YTD (dollars shown in thousands) 2018 2019 2020 2021 Total Interest Income 37,193$ 46,955$ 50,285$ 42,607$ Total Interest Expense 7,528,044$ 12,106$ 8,708$ 3,790$ Net Interest Income 29,665 34,849 41,577 38,817 Provision for Loan Losses 2,196 5,700 3,300 2,250 Net Interest Income after Provision for Loan Losses 27,469 29,149 38,277 36,567 Total Noninterest Income 3,464 6,710 8,541 9,051 Noninterest Expense: 20,924 27,771 32,185 26,823 Pre-Tax Net Income 10,009$ 8,088$ 14,633$ 18,795$ Income Tax Expense 2,296 2,486 2,526 4,287 Net Income 7,713$ 5,602$ 12,107$ 14,508$ Sources: S&P Capital IQ Pro, Company provided documents and filings 2021YTD as of 09/30/2021
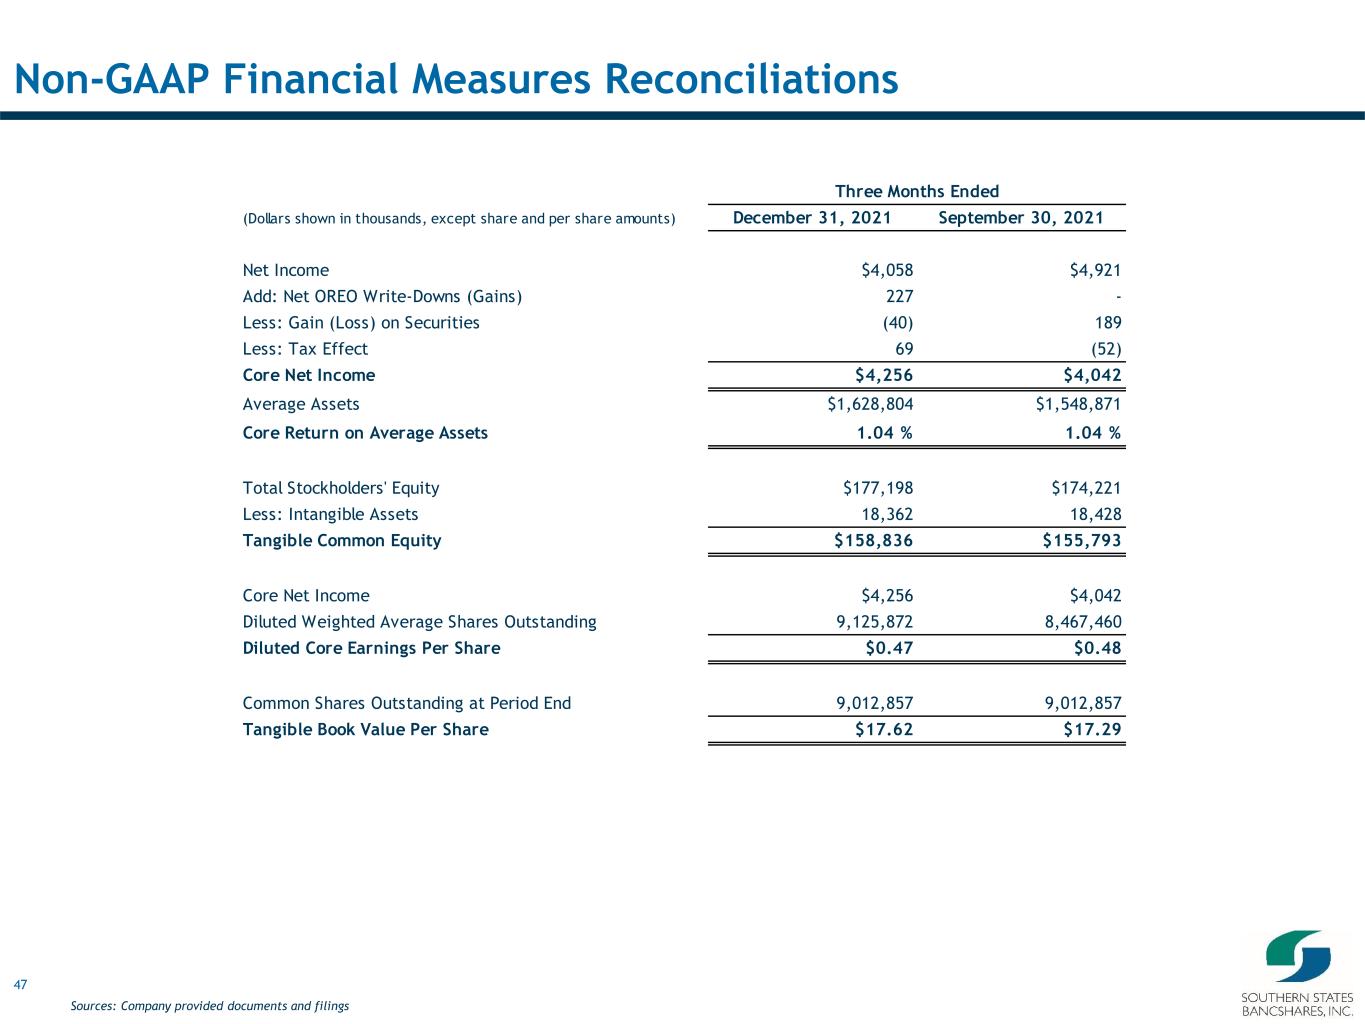
47 Non-GAAP Financial Measures Reconciliations Sources: Company provided documents and filings Three Months Ended (Dollars shown in thousands, except share and per share amounts) December 31, 2021 September 30, 2021 Net Income $4,058 $4,921 Add: Net OREO Write-Downs (Gains) 227 - Less: Gain (Loss) on Securities (40) 189 Less: Tax Effect 69 (52) Core Net Income $4,256 $4,042 Average Assets $1,628,804 $1,548,871 Core Return on Average Assets 1.04 % 1.04 % Total Stockholders' Equity $177,198 $174,221 Less: Intangible Assets 18,362 18,428 Tangible Common Equity $158,836 $155,793 Core Net Income $4,256 $4,042 Diluted Weighted Average Shares Outstanding 9,125,872 8,467,460 Diluted Core Earnings Per Share $0.47 $0.48 Common Shares Outstanding at Period End 9,012,857 9,012,857 Tangible Book Value Per Share $17.62 $17.29

48 Non-GAAP Financial Measures Reconciliations (Continued) Three Months Ended (Dollars shown in thousands, except share and per share amounts) December 31, 2021 September 30, 2021 Total Average Shareholders' Equity $175,913 $162,305 Less: Average Intangible Assets 18,402 18,470 Average Tangible Common Equity $157,511 $143,835 Net Income to Common Shareholders $4,058 $4,921 Return on Average Tangible Common Equity 10.22 % 13.57 % Core Net Income $4,256 $4,042 Core Return on Average Tangible Common Equity 10.72 % 11.15 % Net Interest Income $14,096 $13,640 Add: Noninterest Income 1,751 2,509 Less: Nonrecurring BOLI Death Benefits - 742 Less: Gain (Loss) on Securities (40) 189 Operating Revenue $15,887 $15,218 Expenses: Total Noninterest Expense $9,612 $9,185 Less: Net OREO Write-Down (Gains) 227 - Adjusted Noninterest Expenses $9,385 $9,185 Core Efficiency Ratio 59.07 % 60.36 % Sources: Company provided documents and filings
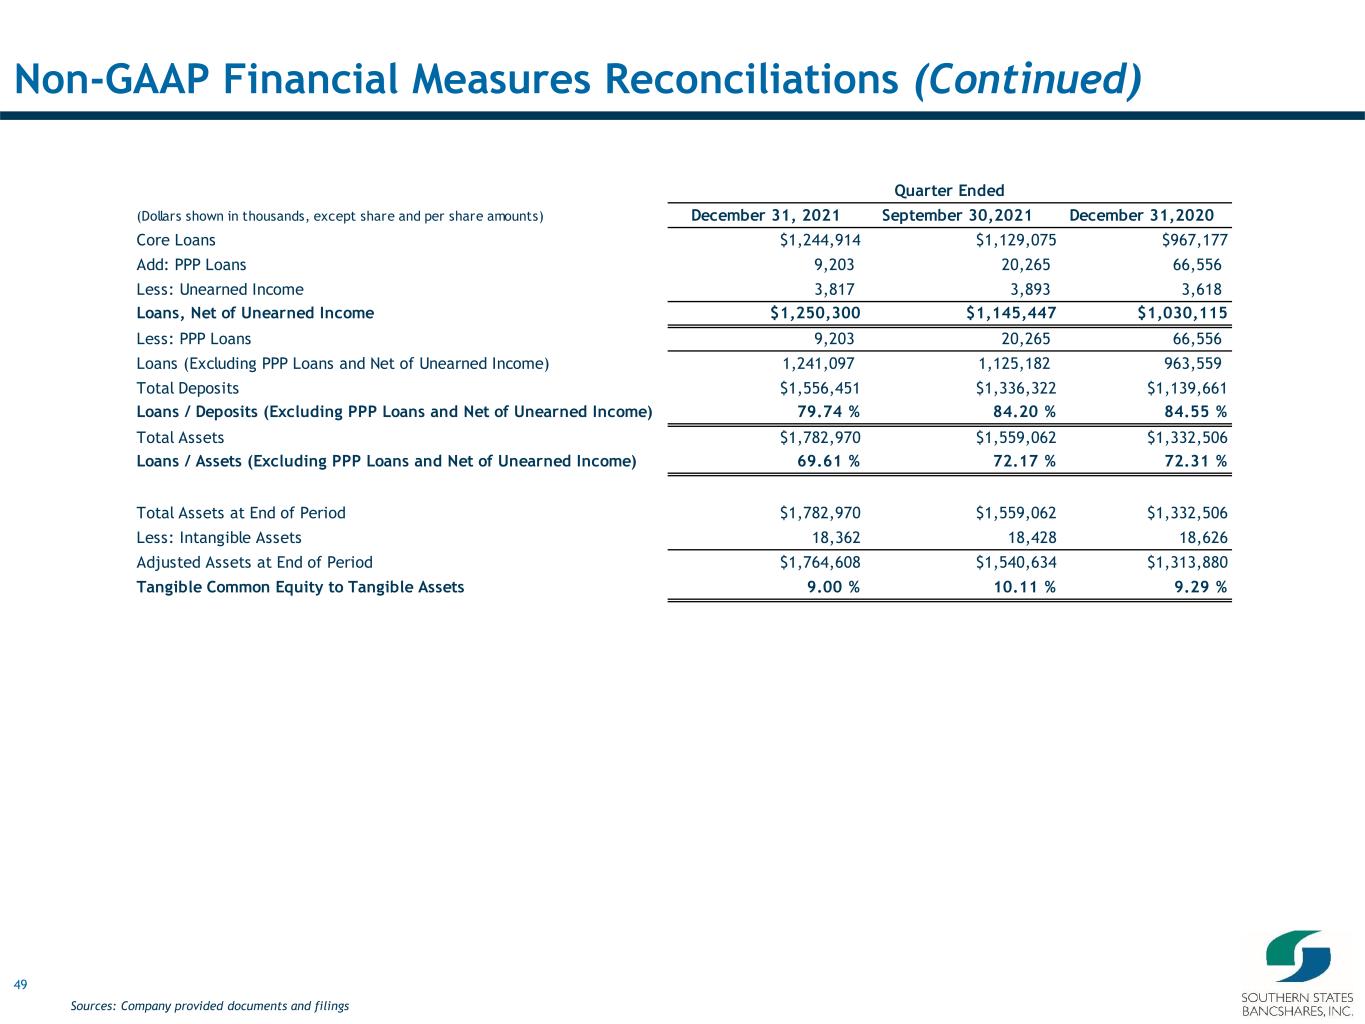
49 Non-GAAP Financial Measures Reconciliations (Continued) Sources: Company provided documents and filings Quarter Ended (Dollars shown in thousands, except share and per share amounts) December 31, 2021 September 30, 2021 December 31, 2020 Core Loans $1,244,914 $1,129,075 $967,177 Add: PPP Loans 9,203 20,265 66,556 Less: Unearned Income 3,817 3,893 3,618 Loans, Net of Unearned Income $1,250,300 $1,145,447 $1,030,115 Less: PPP Loans 9,203 20,265 66,556 Loans (Excluding PPP Loans and Net of Unearned Income) 1,241,097 1,125,182 963,559 Total Deposits $1,556,451 $1,336,322 $1,139,661 Loans / Deposits (Excluding PPP Loans and Net of Unearned Income) 79.74 % 84.20 % 84.55 % Total Assets $1,782,970 $1,559,062 $1,332,506 Loans / Assets (Excluding PPP Loans and Net of Unearned Income) 69.61 % 72.17 % 72.31 % Total Assets at End of Period $1,782,970 $1,559,062 $1,332,506 Less: Intangible Assets 18,362 18,428 18,626 Adjusted Assets at End of Period $1,764,608 $1,540,634 $1,313,880 Tangible Common Equity to Tangible Assets 9.00 % 10.11 % 9.29 %


