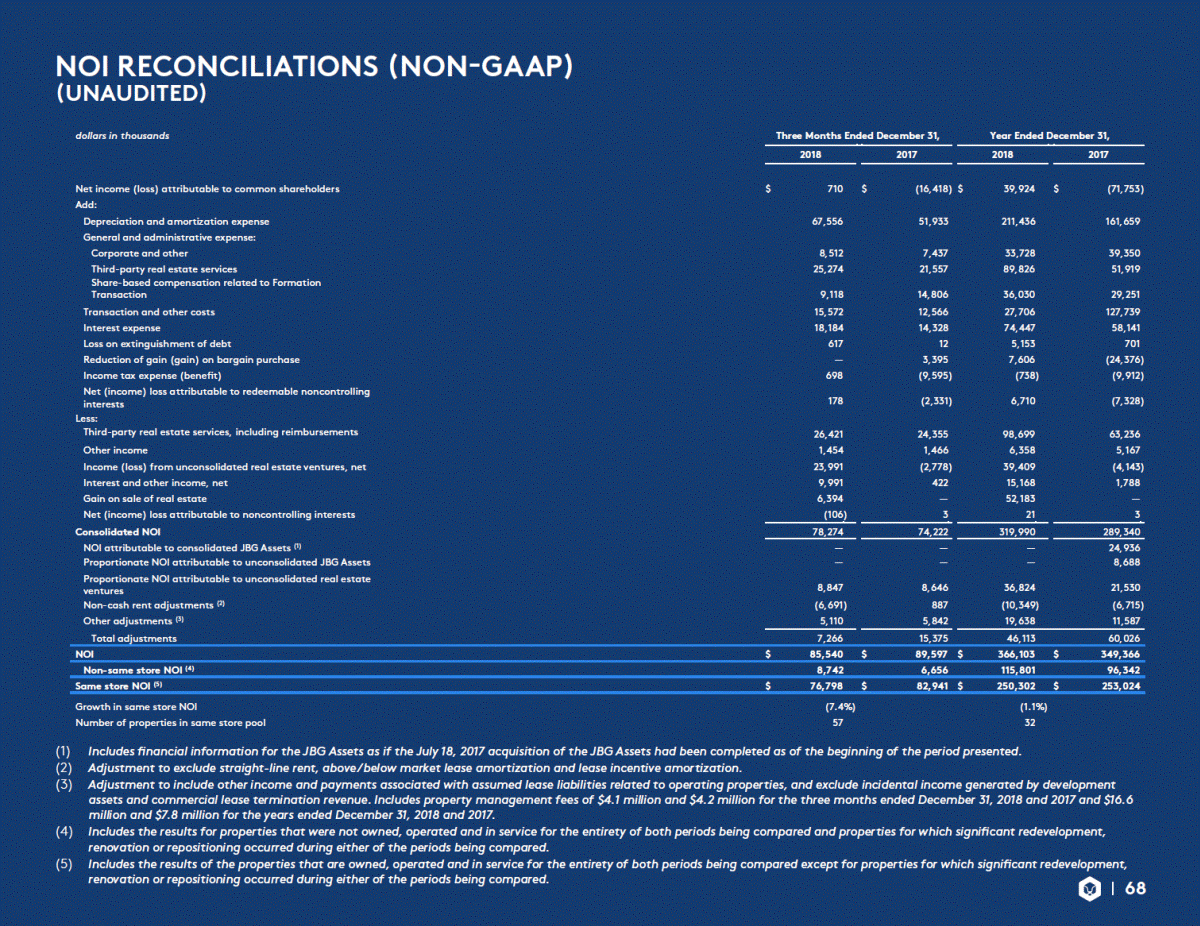
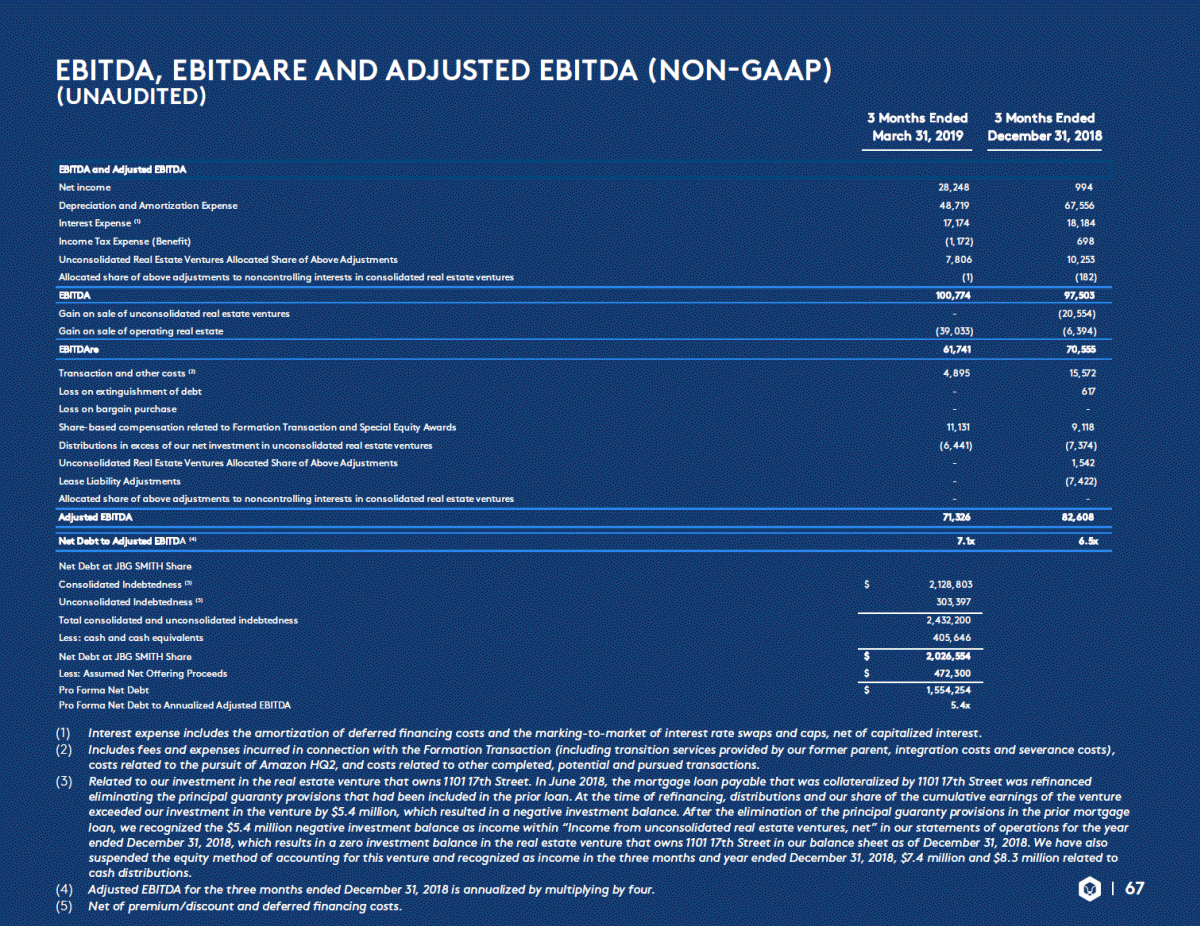
NOI RECONCILIATIONS (UNAUDITED) (NON-GAAP) dollars in thousands Three Months Ended December 31, Year Ended December 31, 2018 2018 2017 2018 2017 Net income (loss) attributable to common shareholders Add: Depreciation and amortization expense General and administrative expense: Corporate and other Third-party real estate services Share-based compensation related to Formation Transaction Transaction and other costs Interest expense Loss on extinguishment of debt Reduction of gain (gain) on bargain purchase Income tax expense (benefit) Net (income) loss attributable to redeemable noncontrolling interests Less: Third-party real estate services, including reimbursements Other income Income (loss) from unconsolidated real estate ventures, net Interest and other income, net Gain on sale of real estate Net (income) loss attributable to noncontrolling interests Consolidated NOI NOI attributable to consolidated JBG Assets (1) Proportionate NOI attributable to unconsolidated JBG Assets Net income (loss) attributable to common shareholders Add: Depreciation and amortization expense $ 710 $ (16,418) $ 39,924 $ (71,753) 67,556 51,933 211,436 161,659 8,512 25,274 7,437 21,557 33,728 89,826 39,350 51,919 9,11 Transaction and special equity awards 9,118 15,572 18,184 617 — 698 14,806 12,566 14,328 12 3,395 (9,595) 36,030 27,706 74,447 5,153 7,606 (738) 29,251 127,739 58,141 701 (24,376) (9,912) 18,1 61 698 Income tax expense (benefit) 17 178 (2,331) 6,710 (7,328) interests Less: Third-party real estate services, including reimbursements 26,421 1,454 23,991 9,991 6,394 (106) 24,355 1,466 (2,778) 422 — 3 98,699 6,358 39,409 15,168 52,183 21 63,236 5,167 (4,143) 1,788 — 3 9,991 Interest and other income, net 78,274 74,222 319,990 289,340 NOI attributable to consolidated JBG Assets Proportionate NOI attributable to unconsolidated JBG Assets Proportionate NOI attributable to unconsolidated real estate — — — — — — 24,936 8,688 — (1) Proportionate NOI attributable to unconsolidated real estate ventures Non-cash rent adjustments (2) Other adjustments (3) Total adjustments 8,847 (6,691) 5,110 8,646 887 5,842 36,824 (10,349) 19,638 21,530 (6,715) 11,587 (6,691 5,11 Non-cash rent adjustments (2) Other adjustments (3) Total adjustments 7,266 15,375 46,113 60,026 NOI NOI $ 85,540 $ 89,597 $ 366,103 $ 349,366 Non-same store NOI (4) 8,742 6,656 115,801 96,342 Same store NOI (5) $ 76,798 $ 82,941 $ 250,302 $ 253,024 Growth in same store NOI Number of properties in same store pool (7.4% (7.4%) 57 % (1.1%) 32 Number of properties in same store pool (1) (2) (3) Includes financial information for the JBG Assets as if the July 18, 2017 acquisition of the JBG Assets had been completed as of the beginning of the period presented. Adjustment to exclude straight-line rent, above/below market lease amortization and lease incentive amortization. Adjustment to include other income and payments associated with assumed lease liabilities related to operating properties, and exclude incidental income generated by development assets and commercial lease termination revenue. Includes property management fees of $4.1 million and $4.2 million for the three months ended December 31, 2018 and 2017 and $16.6 million and $7.8 million for the years ended December 31, 2018 and 2017. Includes the results for properties that were not owned, operated and in service for the entirety of both periods being compared and properties for which significant redevelopment, renovation or repositioning occurred during either of the periods being compared. Includes the results of the properties that are owned, operated and in service for the entirety of both periods being compared except for properties for which significant redevelopment, (4) (5) renovation or repositioning occurred during either of the periods being compared. 68
