Exhibit 99.1

INVESTOR PRESENTATION NOVEMBER 2019 Illustrative Central District Retail

DISCLOSURES FORWARD-LOOKING STATEMENTS Certain statements contained herein may constitute “forward-looking statements” as such term is defined in Section 27A of the Securities Act of 1933, as amended, and Section 21E of the Securities Exchange Act of 1934, as amended. Forward-looking statements are not guarantees of performance. They represent our intentions, plans, expectations and beliefs and are subject to numerous assumptions, risks and uncertainties. Consequently, the future results of JBG SMITH Properties (“JBG SMITH” or the “Company”) may differ materially from those expressed in these forward-looking statements. You can find many of these statements by looking for words such as “approximate”, “hypothetical”, “potential”, “believes”, “expects”, “anticipates”, “estimates”, “intends”, “plans”, “would”, “may” or similar expressions in this Investor Presentation. We also note the following forward-looking statements: our potential NOI growth and the assumptions on which such growth is premised, our estimated future leverage (Debt /EBITDA) profile, the potential effect of Amazon on job growth, rent growth and cap rates in the Washington, DC metropolitan area and National Landing, in particular, our anticipated dispositions and 1031 exchanges, and annualized net operating income; in the case of our construction assets, estimated square feet, estimated number of units, weighted average targeted NOI yield, NOI yield or estimated total project cost, estimated total NOI weighted average completion date, weighted average stabilization date and estimated incremental investment, intended type of asset use and potential tenants, and in the case of our future development assets, estimated potential development density; expected key Amazon transaction terms and time frames for closing, planned infrastructure and education improvements related to Amazon HQ2; the economic impacts of Amazon HQ2 on the DC region and National Landing; our development plans related to Amazon HQ2 that submitted and anticipated entitlements will be obtained; the expected accretion to our NAV as a result of the Amazon transaction and our future NAV growth rate; in the case of our Amazon lease transaction and our new development opportunities in National Landing, the total square feet to be leased to Amazon and the expected net effective rent, estimated square feet, estimated number of units, the estimated construction start and occupancy dates, estimated incremental investment, targeted NOI yield and anticipated lease extensions and expirations; and in the case of our future development opportunities, estimated potential development density. Many of the factors that will determine the outcome of these and our other forward-looking statements are beyond our ability to control or predict. These factors include, among others: adverse economic conditions in the Washington, DC metropolitan area, the timing of and costs associated with development and property improvements, financing commitments, and general competitive factors. For further discussion of factors that could materially affect the outcome of our forward-looking statements and other risks and uncertainties, see “Risk Factors” and the Cautionary Statement Concerning Forward-Looking Statements in the Company’s Annual Report on Form 10-K for the year ended December 31, 2018 and other periodic reports the Company files with the Securities and Exchange Commission. For these statements, we claim the protection of the safe harbor for forward-looking statements contained in the Private Securities Litigation Reform Act of 1995. You are cautioned not to place undue reliance on our forward-looking statements. All subsequent written and oral forward-looking statements attributable to us or any person acting on our behalf are expressly qualified in their entirety by the cautionary statements contained or referred to in this section. We do not undertake any obligation to release publicly any revisions to our forward-looking statements after the date hereof. PRO RATA INFORMATION We present certain financial information and metrics in this release “at JBG SMITH Share,” which refers to our ownership percentage of consolidated and unconsolidated assets in real estate ventures (collectively, “real estate ventures”) as applied to these financial measures and metrics. Financial information “at JBG SMITH Share” is calculated on an asset-by-asset basis by applying our percentage economic interest to each applicable line item of that asset’s financial information. “At JBG SMITH Share” information, which we also refer to as being “at share,” “our pro rata share” or “our share,” is not, and is not intended to be, a presentation in accordance with GAAP. Given that a substantial portion of our assets are held through real estate ventures, we believe this form of presentation, which presents our economic interests in the partially owned entities, provides investors valuable information regarding a significant component of our portfolio, its composition, performance and capitalization. We do not control the unconsolidated real estate ventures and do not have a legal claim to our co-venturers’ share of assets, liabilities, revenue and expenses. The operating agreements of the unconsolidated real estate ventures generally allow each co-venturer to receive cash distributions to the extent there is available cash from operations. The amount of cash each investor receives is based upon specific provisions of each operating agreement and varies depending on certain factors including the amount of capital contributed by each investor and whether any investors are entitled to preferential distributions 2

DISCLOSURES With respect to any such third-party arrangement, we would not be in a position to exercise sole decision-making authority regarding the property, real estate venture or other entity, and may, under certain circumstances, be exposed to economic risks not present were a third party not involved. We and our respective co-venturers may each have the right to trigger a buy-sell or forced sale arrangement, which could cause us to sell our interest, or acquire our co-venturers’ interests, or to sell the underlying asset, either on unfavorable terms or at a time when we otherwise would not have initiated such a transaction. Our real estate ventures may be subject to debt, and the repayment or refinancing of such debt may require equity capital calls. To the extent our co-venturers do not meet their obligations to us or our real estate ventures or they act inconsistently with the interests of the real estate venture, we may be adversely affected. Because of these limitations, the non-GAAP “at JBG SMITH Share” financial information should not be considered in isolation or as a substitute for our financial statements as reported under GAAP. All other information shown as of September 30, 2019 and all data shown at JBG SMITH’s share, unless otherwise noted. MARKET DATA Market data and industry forecasts are used in this Investor Presentation, including data obtained from publicly available sources. These sources generally state that the information they provide has been obtained from sources believed to be the reliable, but the accuracy and completeness of the information is not assured. The Company has not independently verified any such information. DEFINITIONS AND RECONCILIATIONS For certain definitions and reconciliations see pages 46-52. Information herein with respect to the proposed transaction with Amazon is based on executed leases and purchase and sale agreements between us and Amazon. Closing under these agreements is subject to customary closing conditions. 3

AGENDA HIGHLIGHTS & STRATEGY 1 2 2019 UPDATES 3 STATE OF THE MARKET 4 GROWTH AND CAPITALIZATION 4

HIGHLIGHTS & STRATEGY 5

HIGHLIGHTS & STRATEGY: JBG SMITH AT A GLANCE OPERATING PORTFOLIO UNDER CONSTRUCTION FUTURE DEVELOPMENT PIPELINE COMMERCIAL SF 11.0M MULTIFAMILY UNITS 4,537 COMMERCIAL SF 821K MULTIFAMILY UNITS 1,298 COMMERCIAL SF 8.4M MULTIFAMILY SF 10.3M Q3 2019 ANNUALIZED NOI $313.2M WEIGHTED AVERAGE LEASE TERM METRO SERVED OVER 98% 6.0 YEARS Illustrative 1900 N Street TOTAL ENTERPRISE VALUE(1) $7.6B WEIGHTED AVERAGE WALK SCORE 83 NET DEBT/ANNUALIZED ADJUSTED EBITDA 5.3x NET DEBT/ TOTAL ENTERPRISE VALUE(1) 22.9% (1) Total Enterprise Value is based on the closing price per share of $39.21 as of September 30, 2019. 6

HIGHLIGHTS & STRATEGY: SUMMARY EVERY DECISION IS EVALUATED THROUGH THE LENS OF MAXIMIZING LONG-TERM NET ASSET VALUE (NAV) PER SHARE SUBMARKET CONCENTRATION Invested in high growth urban submarkets in Washington, DC Metro Area HIGH-GROWTH ASSETS Own and operate high risk-adjusted return assets, with emphasis on multifamily over the longer term PROVEN DEVELOPMENT EXPERTISE Mixed-use operator with track record of value creation in development and redevelopment DISCIPLINED CAPITAL ALLOCATOR Demonstrated capital allocation discipline to maximize value and mitigate downside risk 7

HIGHLIGHTS & STRATEGY: SUBMARKET CONCENTRATION CONCENTRATION OF HIGH-GROWTH ASSETS IN THE BEST SUBMARKETS Bethesda MD TOTAL PORTFOLIO COMPOSITION NORTHERN VIRGINIA NATIONAL LANDING 57% RESTON 9% RB CORRIDOR 5% Washington, DC WASHINGTON, DC DC EMERGING 16% DC MATURE 5% MARYLAND BETHESDA CBD 2% OTHER MD 6% VA National 83% OF PORTFOLIO WITHIN 20-MINUTE COMMUTE(1) OF NATIONAL LANDING Landing Note: Geographic composition includes square footage of Operating, Under Construction, and Future Development Pipeline assets. (1) 20-minute commute calculated on a Monday morning to National Landing. 8 OPERATING AND UNDER CONSTRUCTION ASSETS FUTURE DEVELOPMENT PIPELINE 20-MINUTE COMMUTE TO NATIONAL LANDING
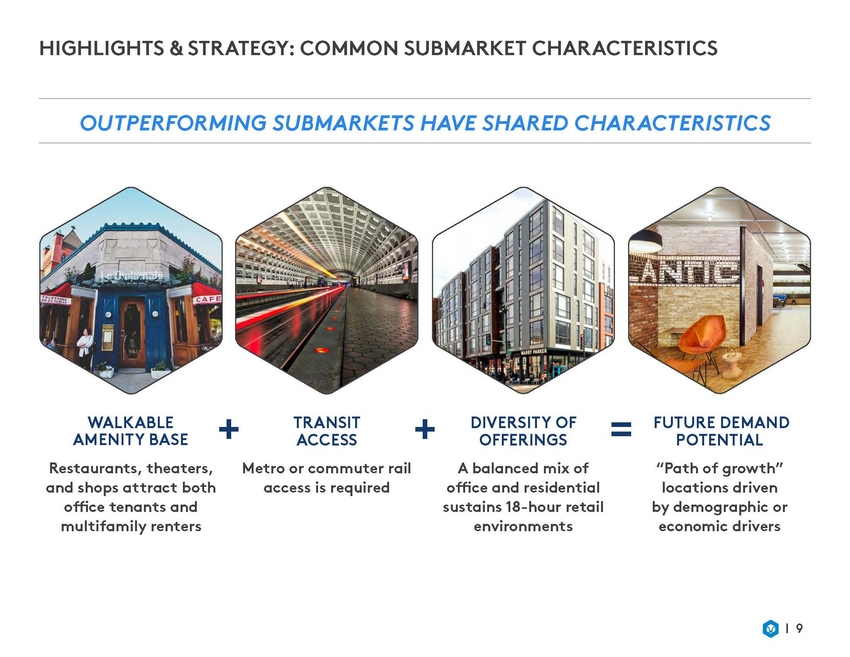
HIGHLIGHTS & STRATEGY: COMMON SUBMARKET CHARACTERISTICS OUTPERFORMING SUBMARKETS HAVE SHARED CHARACTERISTICS + + = WALKABLE AMENITY BASE Restaurants, theaters, TRANSIT ACCESS DIVERSITY OF OFFERINGS A balanced mix of office and residential sustains 18-hour retail environments FUTURE DEMAND POTENTIAL “Path of growth” locations driven by demographic or economic drivers Metro or commuter rail access is required and shops attract both office tenants and multifamily renters 9

HIGHLIGHTS & STRATEGY: JBG SMITH OFFICE SUBMARKETS RENT GROWTH AND OCCUPANCY IN OUR OFFICE SUBMARKETS OUTPERFORM OTHER SUBMARKETS 2018 ASKING RENTS RELATIVE TO MARKET 2008-2018 ASKING RENT GROWTH 2008-2018 AVERAGE OCCUPANCY 30.3% 86.5% 30.0% 87.0% 25.0% 25.0% 86.0% 20.0% 20.0% 85.0% 15.0% 14.1% 15.0% 10.0% 84.0% 5.0% 83.0% 10.0% 0.0% 82.0% -5.0% 5.0% -10.0% 81.0% -15.0% -14.3% 0.0% 80.0% -20.0% 10 Source: JLL JBGS 2.4% NON-JBGS JBGS 81.4% NON-JBGS JBGS NON-JBGS +5.1% +11.7% +40.6%

HIGHLIGHTS & STRATEGY: JBG SMITH MULTIFAMILY SUBMARKETS RENT GROWTH AND NET ABSORPTION IN OUR MULTIFAMILY SUBMARKETS OUTPERFORM OTHER SUBMARKETS 2018 ASKING RENTS RELATIVE TO MARKET 2008-2018 ASKING RENT GROWTH 2008-2018 NET ABSORPTION AS % OF STARTING INVENTORY 20.0% 39.0% 37.6% 15.3% 70.0% 59.7% 38.0% 15.0% 37.0% 60.0% 36.0% 50.0% 10.0% 35.0% 34.0% 40.0% 5.0% 33.0% 30.0% 32.0% 0.0% 31.0% 20.0% 30.0% -5.0% 10.0% 29.0% -10.0% 28.0% 0.0% -8.6% 11 Source: JLL JBGS 22.9% NON-JBGS JBGS NON-JBGS JBGS 31.8% NON-JBGS +5.8% +36.8% +23.9%

2019 UPDATES 12

2019 UPDATES: AMAZON HQ2 AMAZON LEASING TO DATE AMAZON LAND SALE INITIAL CONSTRUCTION START OF AMAZON DEVELOPMENT 2020 585K SF 4.1M SF REAGAN NATIONAL AIRPORT to Grade KEY AMAZON LEASING TO DATE AMAZON LAND SALE INFRASTRUCTURE/EDUCATION (STATE & LOCAL FUNDED) JBG SMITH OWNERSHIP 13 Route One Virginia Tech Innovation Campus New Rail Station and Airport Pedestrian Bridge New Metro Entrance New Metro Entrance
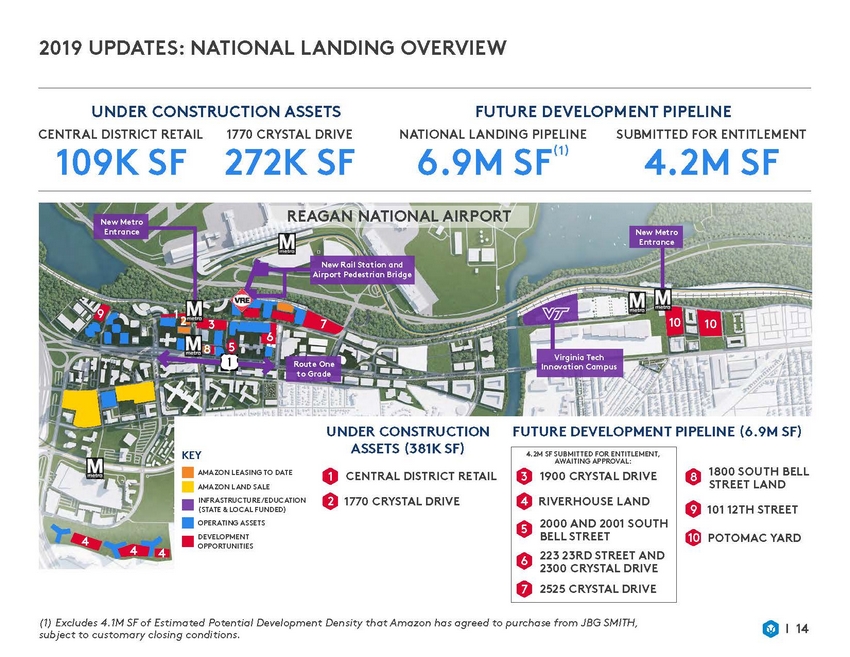
2019 UPDATES: NATIONAL LANDING OVERVIEW UNDER CONSTRUCTION ASSETS FUTURE DEVELOPMENT PIPELINE CENTRAL DISTRICT RETAIL 1770 CRYSTAL DRIVE 272K SF NATIONAL LANDING PIPELINE SUBMITTED FOR ENTITLEMENT (1) 109K SF 6.9M SF 4.2M SF REAGAN NATIONAL AIRPORT 9 10 3 7 10 6 5 to Grade UNDER CONSTRUCTION ASSETS (381K SF) FUTURE DEVELOPMENT PIPELINE (6.9M SF) KEY 1800 SOUTH BELL STREET LAND AMAZON LEASING TO DATE AMAZON LAND SALE INFRASTRUCTURE /EDUCATION (STATE & LOCAL FUNDED) OPERATING ASSETS DEVELOPMENT OPPORTUNITIES 1CENTRAL DISTRICT RETAIL 2 1770 CRYSTAL DRIVE 8 9 101 12TH STREET 10 POTOMAC YARD 4 4 2300 CRYSTAL DRIVE (1) Excludes 4.1M SF of Estimated Potential Development Density that Amazon has agreed to purchase from JBG SMITH, subject to customary closing conditions. 14 4.2M SF SUBMITTED FOR ENTITLEMENT, AWAITING APPROVAL: 31900 CRYSTAL DRIVE 4 RIVERHOUSE LAND 52000 AND 2001 SOUTH BELL STREET 6223 23RD STREET AND 72525 CRYSTAL DRIVE Route One Virginia Tech Innovation Campus 8 New Rail Station and Airport Pedestrian Bridge New Metro Entrance New Metro Entrance

2019 UPDATES: CAPITAL RECYCLING SOLD OR RECAPITALIZED $337M OF ASSETS YEAR-TO-DATE(1) $999M Reduced DC Commodity Class A Office exposure from 7.3% to 3.4% since the inception of JBG SMITH 1 $1,000 $900 $800 Continued focus on DC office dispositions and monetizing land; market conditions evolving 2 00M) $700 $600 $500 Currently in the market with $375M of 3 $400 2019 Goal ($400M) $300 $200 Under contract to acquire F1RST Residences in a like-kind exchange with Metropolitan Park, the first phase of Amazon land sales 4 $100 2018 2019 YTD (1) Includes $294 million of assets that are under firm contract, but remain subject to customary closing conditions. 15 Sales ($M) 2018 Goal ($7 $337M DC Office Suburban/ Non-Core Office DC Office Non-Income Producing Land Non-Income Producing Land

2019 UPDATES: COMMERCIAL PERFORMANCE AND TRENDS FOCUS ON RISK MITIGATION IN DC AND POSITIONING PORTFOLIO FOR GROWTH IN NATIONAL LANDING COMMERCIAL PORTFOLIO MIX(1) Under Construction Generated $231.5M of Annualized NOI in Q3 2019 versus $286.5M in Q3 2018 Capital recycling and early blend-and-extend renewals, used to de-risk our DC commercial assets, impacted NOI We expect positive same store NOI growth to resume in 2020, as free rent burns off • 7% Trophy 8% • • Class A 15% Well positioned in the face of 4.5M SF of new supply in DC proper through 2024 • Class B 70% LEASE EXPIRATION SCHEDULE(2) COMMERCIAL NOI BY REGION DC 24% VA 72% 1,500 1,000 MD 4% 500 - 2019 2020 2021 2022 2023 2024 (1) Based on Operating and Under Construction SF. (2) Excludes lease extension options, except where reasonably certain. 16 Square Feet (Thousands) National Landing DC Commodity A Other Weighted Average Annual % Expiring Over Next 5 Years– 9.6% Weighted Average Lease Term – 6.0 years
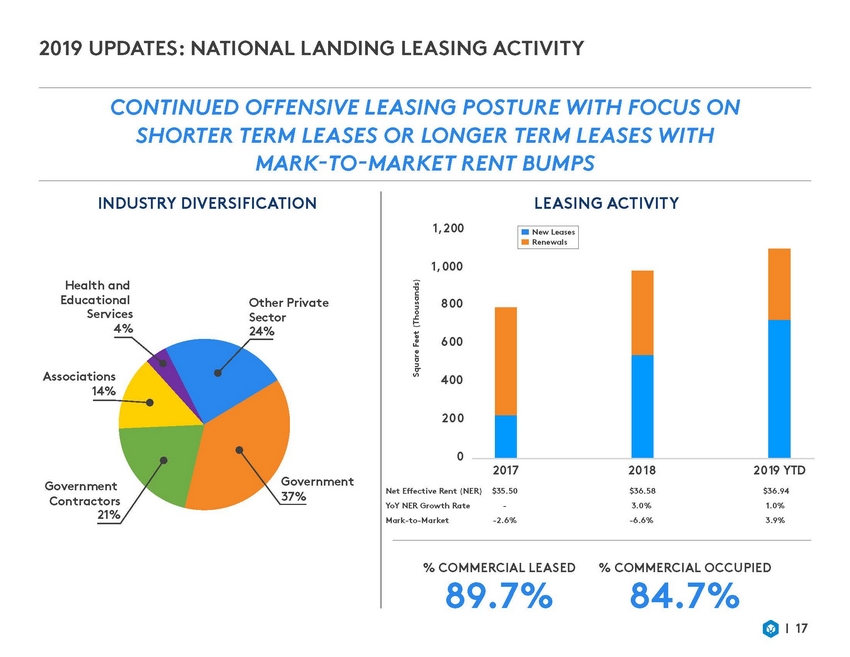
2019 UPDATES: NATIONAL LANDING LEASING ACTIVITY CONTINUED OFFENSIVE LEASING POSTURE WITH FOCUS ON SHORTER TERM LEASES OR LONGER TERM LEASES WITH MARK-TO-MARKET RENT BUMPS INDUSTRY DIVERSIFICATION LEASING ACTIVITY 1,200 1,000 Health and Educational Services 4% Other Private Sector 24% 800 6 00 Associations 14% 400 200 0 2017 $35.50 - -2.6% 2018 $36.58 3.0% -6.6% 2019 YTD $36.94 1.0% 3.9% Government 37% Government Contractors 21% Net Effective Rent (NER) YoY NER Growth Rate Mark-to-Market % COMMERCIAL LEASED 89.7% % COMMERCIAL OCCUPIED 84.7% 17 Square Feet (Thousands) New Leases Renewals

2019 UPDATES: NATIONAL LANDING LEASE EXPIRATIONS NATIONAL LANDING LEASE EXPIRATIONS ALIGN WITH THE AMAZON HIRING FORECASTS NATIONAL LANDING LEASE EXPIRATIONS(1) GSA leases 2.0M SF across 47 leases in our National Landing portfolio 1 1,00 0 9 00 12,000 Retained 82% of expiring GSA tenants since 2017, totaling 488K SF 10,00 0 2 8 00 700 6 00 8,0 00 50 0 4 00 6,0 00 4,0 00 Only 87K SF of GSA leased SF 30 0 (1.6% of occupied operating SF in National Landing) scheduled to expire in the next 5 years is subject to prospectus rent caps 200 100 2,000 3 - - 2019 2020 2021 2022 2023 2024 % of Total Portfolio SF Expiring 3.2% 6.6% 6.2% 9.4% 4.8% 7.2% (1) Excludes lease extension options, except where reasonably certain. (2) Minimum new Amazon jobs as outlined in the Memorandum of Understanding between Amazon and the Commonwealth of Virginia, executed 11/12/2018. 18 Square Feet (Thousands) Expected New Phase One Amazon Hires(2) National Landing GSA National Landing Private Sector(2) Expected New Amazon Jobs(2) Weighted Average Annual % Expiring Over Next 5 Years–11.1% Weighted Average Lease Term – 4.9 years
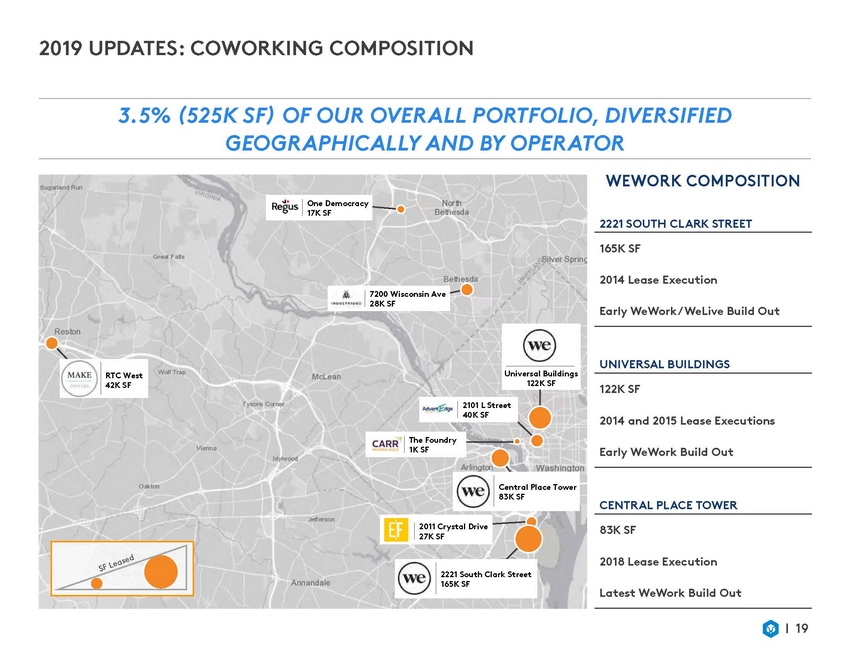
2019 UPDATES: COWORKING COMPOSITION 3.5% (525K SF) OF OUR OVERALL PORTFOLIO, DIVERSIFIED GEOGRAPHICALLY AND BY OPERATOR WEWORK COMPOSITION One Democracy 17K SF 2221 SOUTH CLARK STREET 165K SF 2014 Lease Execution WeWork 7200 Wisconsin Ave 28K SF Early WeWork/ WeLive Build Out UNIVERSAL BUILDINGS Universal Buildings 122K SF RTC West 42K SF 122K SF Commercial Po rtfo lio 2101 L Street 40K SF 2(N01o4n-aCnodw2o0rk1i5ngL)ease Executions The Foundry 1K SF Early WeWork Build Out Central Place Tower 83K SF CENTRAL PLACE TOWER Other Cow orki ng 83(KNSoFn-WeWork) 2011 Crystal Drive 27K SF 2018 Lease Execution 2221 South Clark Street 165K SF Latest WeWork Build Out 19

2019 UPDATES: MULTIFAMILY PERFORMANCE AND TRENDS GREW MULTIFAMILY NOI AND MAINTAINED HIGH LEVEL OF OCCUPANCY Generated $81.7M of Annualized NOI in Q3 2019 versus $78.5M in Q3 2018 • MULTIFAMILY PORTFOLIO MIX(1) Class B 34% Under Construction 22% 94.9% occupied • West Half completed Q3 2019, 22.4% leased(2) • Weighted average portfolio Walk Score is 85 versus 64 for public peer average(3) • Class A 44% MULTIFAMILY NOI MD 8% BY REGION DC 32% CUSTOMER SERVICE SCORE JBG SMITH PROPERTY SCORE +23% ABOVE THE REPUTATION.COM INDUSTRY AVERAGE VA 60% (1) Based on Operating and Under Construction SF. (2) Percent leased includes both multifamily and retail as of 10/31/19. (3) Includes DC area operating and under construction assets for EQR, AVB, UDR, CPT, MAA, and WRE. 20

2019 UPDATES: UNDER CONSTRUCTION ASSETS ALL EIGHT UNDER CONSTRUCTIONASSETS ARE ON SCHEDULE AND ON BUDGET, WITH GUARANTEED MAXIMUM PRICE CONTRACTS IN PLACE COMMERCIAL ASSETS 4 SQUARE FEET 821K MULTIFAMILY ASSETS 4 UNITS 1,298 COMMERCIAL PRE-LEASED 85.2% West Half ESTIMATED INCREMENTAL INVESTMENT $284M WEIGHTED AVERAGE TARGETED NOI YIELD ON ESTIMATED TOTAL PROJECT COST 6.4% ESTIMATED STABILIZED NOI $70.8M COMMERCIAL 46% MULTIFAMILY 54% 21

2019 UPDATES: UNDER CONSTRUCTION PIPELINE EXPECTED TO DELIVER STRONG NEAR-TERM GROWTH SINCE THE INCEPTION OF JBG SMITH, 5 DELIVERIES, ALL AHEAD OF SCHEDULE AND BELOW BUDGET WEIGHTED AVERAGE COMPLETION DATE WEIGHTED AVERAGE STABILIZATION DATE Q2 2020 Q3 2021 2019 2020 2021 Q4 Q4 Q2 Q3 Q4 Q2 Q2 4747 Bethesda Avenue Atlantic Plumbing C 7900 Wisconsin Avenue 965 Florida Avenue 1770 Crystal Drive Central District Retail 1900 N Street USE: SUBMARKET: BUILDING SIZE: PRE-LEASED %: OWNERSHIP: Commercial Bethesda CBD 291,414 SF 84.4% 100% Multifamily U Street/Shaw 256 Units N/A 100% Commercial CBD 271,433 SF 73.0% 55.0% Multifamily Bethesda CBD 322 Units N/A 50.0% Multifamily U Street/Shaw 433 Units N/A 96.1% (2) Commercial Commercial National Landing National Landing 271,572 SF 97.8%(1) 100% 108,825 SF 72.8% 100% Note: Building size data is shown at 100%. (1) Includes Amazon’s lease of 258,299 SF at 1770 Crystal Drive. (2) Ownership percentage reflects expected dilution of JBG SMITH’s real estate venture partner asset. As of September 30, 2019, JBG SMITH’s ownership share was 94.2%. as contributions are funded during construction of the 22 TWO QUARTERS AHEAD OF SCHEDULE Q3 West Half Multifamily Ballpark/Southeast 465 Units N/A 100% TWO QUARTERS AHEAD OF SCHEDULE Q1 500 L’Enfant Plaza Commercial Southwest 215,194 SF 79.3% 49.0%

2019 UPDATES: FUTURE DEVELOPMENT PIPELINE STAGE OF ENTITLEMENT ACTIVELY ADVANCING ENTITLEMENTS THROUGHOUT THE PORTFOLIO Actively advancing entitlements for 8.8M SF 1 Submitted entitlement applications for 4.2M SF in National Landing 2 National Landing Submitted for Entitlement, Awaiting Approval Active entitlements outside of National Landing are focused on sites in emerging growth submarkets 3 Not yet Submitted for Entitlement Total Future Development Pipeline (1) Includes 4.1M SF of Estimated Potential Development Density that Amazon has agreed to purchase from JBG SMITH, subject to customary closing conditions. (2) Excludes 4.1M SF of Estimated Potential Development Density that Amazon has agreed to purchase from JBG SMITH, subject to customary closing conditions. 23 4.2M SF 2.7M SF 6.9M SF(2) 3.6M SF 4.1M SF 8.8M SF 2.2M SF Fully Entitled Amazon Purchase Requiring Final Entitlements Encumbered/Not Ready for Development 18.7M SF(1)

2019 UPDATES: ADVANCED ENTITLEMENT OF 1900 CRYSTAL DRIVE FILLS CRITICAL RETAIL AND ACTIVITY GAP ON CRYSTAL DRIVE 750 UNITS OF MULTIFAMILY IN TWO BUILDINGS 30K SQUARE FEET OF RETAIL $362M 2020 OF ESTIMATED INCREMENTAL INVESTMENT CONSTRUCTION START 24 Illustrative 1900 Crystal Drive Retail and Public Plaza Illustrative 1900 Crystal Drive (Multifamily) – South Tower in Foreground

2019 UPDATES: ADVANCING ADDITIONAL ENTITLEMENTS IN NATIONAL LANDING SUBMITTED ENTITLEMENT APPLICATIONS FOR 4.2M SF 25 Illustrative 223 23rd Street (Multifamily) Illustrative RiverHouse Apartments (Multifamily) Illustrative 2525 Crystal Drive (Multifamily) Illustrative 2300 Crystal Drive (Commercial) Illustrative 2001 South Bell Street (Multifamily) Illustrative 2000 South Bell Street (Multifamily)

[LOGO]

2019 UPDATES: WASHINGTON HOUSING INITIATIVE (WHI) LAUNCHED THE WASHINGTON HOUSING INITIATIVE TO PRODUCE OR MAINTAIN AFFORDABLE WORKFORCE HOUSING IN HIGH-IMPACT LOCATIONS • Produce or maintain up to 3,000 units of affordable workforce housing over 10 years • Impact pool funded by third-party capital to provide mezzanine financing • Targeted size of $150M with JBG SMITH commitment of $10M Housing Conservancy Pool • Targeted 7% net return (Community Reinvestment Act eligible) • Raised $93.7M for the WHI Impact Pool to date • Build a replicable model that can be used by other communities • Sustain and strengthen inclusive communities Note: The Washington Housing Conservancy and the Impact Pool are separate legal entities from JBG SMITH. While the manager of the Impact Pool is controlled by JBG SMITH, an investment in the Impact Pool is not an investment in JBG SMITH. 27 WASHINGTON HOUSING INITIATIVE Local | Innovative | Impact Washington Impact Acquire & Own Sponsor Private Acquisition &Track & Report Real EstateActivity BondsDevelopment LoansImpact Support forInvest in High-Impact Neighborhood ServicesLocations Triple Bottom Line Financial SocialEnvironmental

STATE OF THE MARKET 28

STATE OF THE MARKET: DC ECONOMY NORMALIZING JOB GROWTH THROUGH FIRST HALF OF THE LARGELY CONCENTRATED IN NORTHERN VIRGINIA YEAR: 80.0 AVERAGE ANNUAL JOB GROWTH (THOUSANDS) 60.0 40.0 20.0 0.0 -20.0 -40.0 -60.0 2009 2010 2011 2012 2013 2014 2015 2016 2017 2018 2019 YTD RECOVERY BRAC + SEQUESTRATION Source: BLS 29 Employment Growth (Thousands) Northern Virginia DC Metro Region 10-Year Avg. Growth
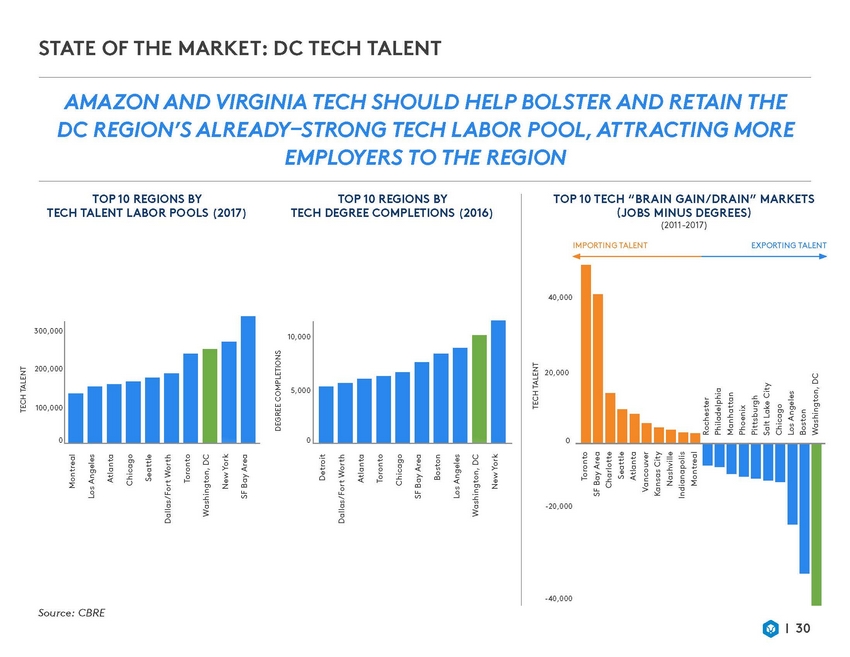
STATE OF THE MARKET: DC TECH TALENT AMAZON AND VIRGINIA TECH SHOULD HELP BOLSTER AND RETAIN THE DC REGION’S ALREADY–STRONG TECH LABOR POOL, ATTRACTING MORE EMPLOYERS TO THE REGION TOP 10 REGIONS BY TECH TALENT LABOR POOLS (2017) TOP 10 REGIONS BY TECH DEGREE COMPLETIONS TOP 10 TECH “BRAIN GAIN/DRAIN” MARKETS (JOBS MINUS DEGREES) (2011-2017) (2016) IMPORTING TALENT EXPORTING TALENT 40,000 300,000 10,000 200,000 20,000 5,000 100,000 0 0 0 -20,000 -40,000 Source: CBRE 30 TECH TALENT Montreal Los Angeles Atlanta Chicago Seattle Dallas/Fort Worth Toronto Washington, DC New York SF Bay Area DEGREE COMPLETIONS Detroit Dallas/Fort Worth Atlanta Toronto Chicago SF Bay Area Boston Los Angeles Washington, DC New York TECH TALENT Toronto SF Bay Area Charlotte Seattle Atlanta Vancouver Kansas City Nashville Indianapolis Montreal Rochester Philadelphia Manhattan Phoenix Pittsburgh Salt Lake City Chicago Los Angeles Boston Washington, DC

STATE OF THE MARKET: FEDERAL GOVERNMENT CLOUD AWARDS OVER THE NEXT 24 MONTHS, THE FEDERAL GOVERNMENT PLANS TO AWARD AN ADDITIONAL $14.5B IN MAJOR CLOUD COMPUTING CONTRACTS C2E Commercial Cloud Enterprise DIA $10.0B Multiple Q2 2020 NMITS NOAA Mission IT Services NOAA $2.5B Single Q2 2020 CMDCO Cloud Migration and Data Center Optimization DHS $2.0B Single Q2 2020 Source: JLL 31 POTENTIALSINGLE ORESTIMATED VALUEMULTIPLE AWARDAWARD DATE AWARD ANNOUNCED DEOSDefense Enterprise Office SolutionGSA$8.0BSingleQ3 2019 JEDIJoint Enterprise Defense InfrastructureDOD$10.0BSingleQ4 2019
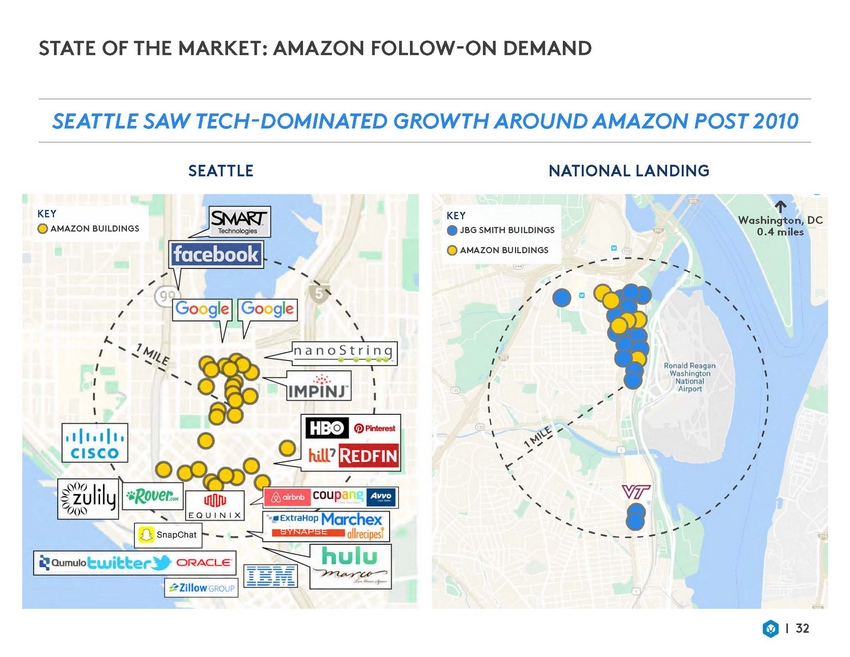
STATE OF THE MARKET: AMAZON FOLLOW-ON DEMAND SEATTLE SAW TECH-DOMINATED GROWTH AROUND AMAZON POST 2010 SEATTLE NATIONAL LANDING KEY AMAZON BUILDINGS KEY JBG SMITH BUILDINGS Washington, DC 0.4 miles AMAZON BUILDINGS 32
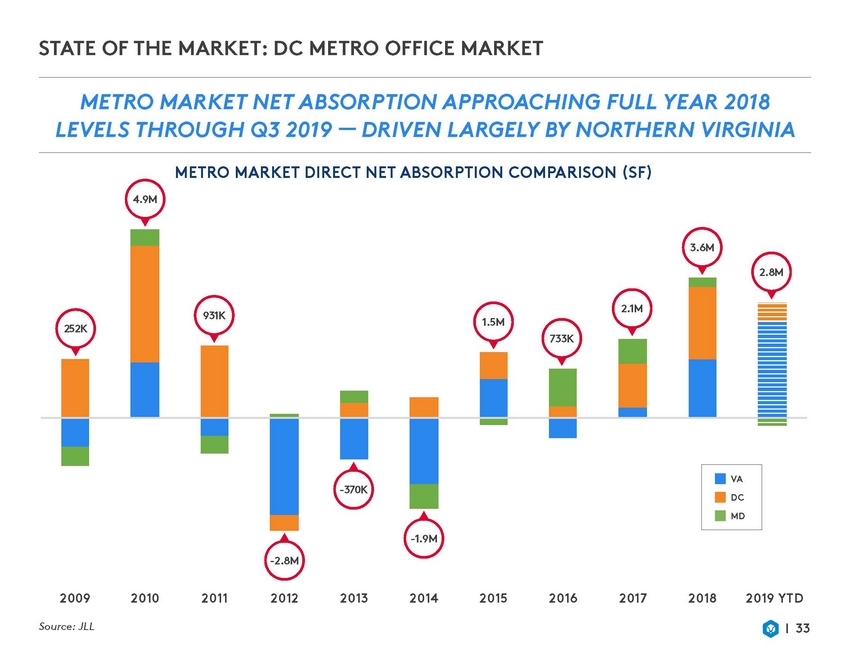
STATE OF THE MARKET: DC METRO OFFICE MARKET METRO MARKET NET ABSORPTION APPROACHING FULL YEAR 2018 LEVELS THROUGH Q3 2019 — DRIVEN LARGELY BY NORTHERN VIRGINIA METRO MARKET DIRECT NET ABSORPTION COMPARISON (SF) 4.9M 3.6M 2.8M 931K 1.5M -370K -1.9M -2.8M 2009 2010 2011 2012 2013 2014 2015 2016 2017 2018 2019 YTD Source: JLL 33 252K 2.1M 733K VA DC MD

STATE OF THE MARKET: DC PROPER OFFICE MARKET DC PROPER PIPELINE REMAINS ELEVATED, LIKELY PUTTING ADDITIONAL PRESSURE ON COMMODITY A AND CLASS B SECTORS DC PROPER OFFICE PIPELINE 7.0 6.0 5.0 4.0 3.0 2.0 1.0 0 2009 2010 2011 2012 2013 2014 2015 2016 2017 2018 2019 2020 2021 2022 Estimated Source: JLL (1) Defined as “Proposed Short-Term” by JLL, as of Q3 2019. 34 Square Feet (M) Delivered Under Construction Potential Starts (1)
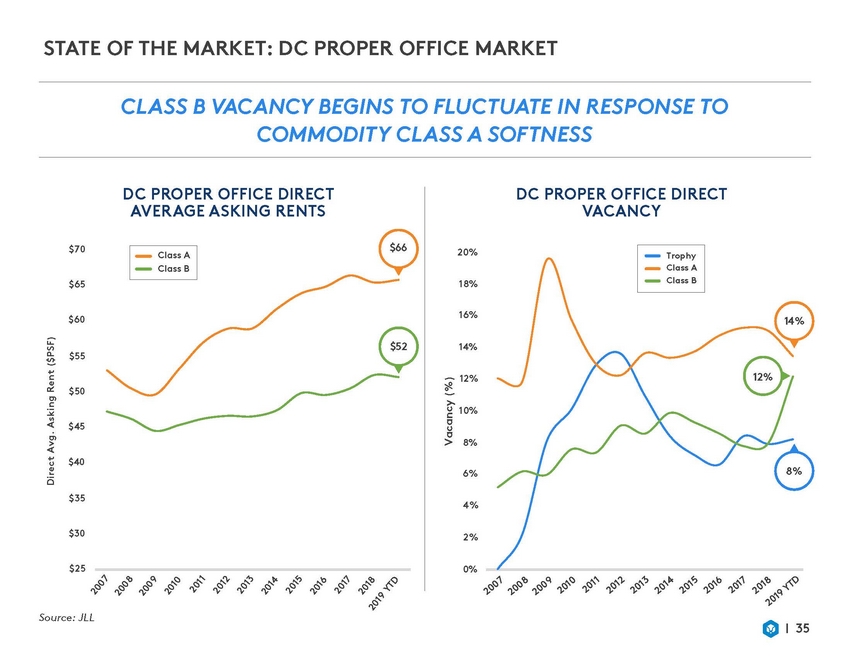
STATE OF THE MARKET: DC PROPER OFFICE MARKET CLASS B VACANCY BEGINS TO FLUCTUATE IN RESPONSE TO COMMODITY CLASS A SOFTNESS DC PROPER OFFICE DIRECT DC PROPER OFFICE DIRECT VACANCY AVERAGE ASKING RENTS $66 $70 20% $65 18% 16% $60 14% $52 14% $55 12% 12% $50 10% $45 8% $40 8% 6% $35 4% $30 2% $25 0% Source: JLL 35 Direct Avg. Asking Rent ($PSF) Vacancy (%) Trophy Class A Class B Class A Class B

STATE OF THE MARKET: DC PROPER OFFICE MARKET POST-AMAZON, NATIONAL LANDING RENTS HAVE GROWN CLOSER TO HISTORIC PARITY WITH RB CORRIDOR, WHILE A SIGNIFICANT SPREAD STILL EXISTS WITH DC PROPER DIRECT AVERAGE ASKING RENT (OFFICE) DIRECDTCVOACfAicNeCVYa(cOaFnFcIyCE) 25% National Landing $65 23% $59 21% $60 19% 19% $55 17% 15% $50 16% $46 13% $45 11% $44 9% 17% Growth $40 from Q4 2018 7% $35 5% Source: JLL (1) National Landing includes JLL submarkets of Crystal City and Pentagon City. 36 Direct Avg. Asking Rent ($PSF) Direct Vacancy (%) DC Proper RB Corridor National Landing(1) RB Corridor (1)
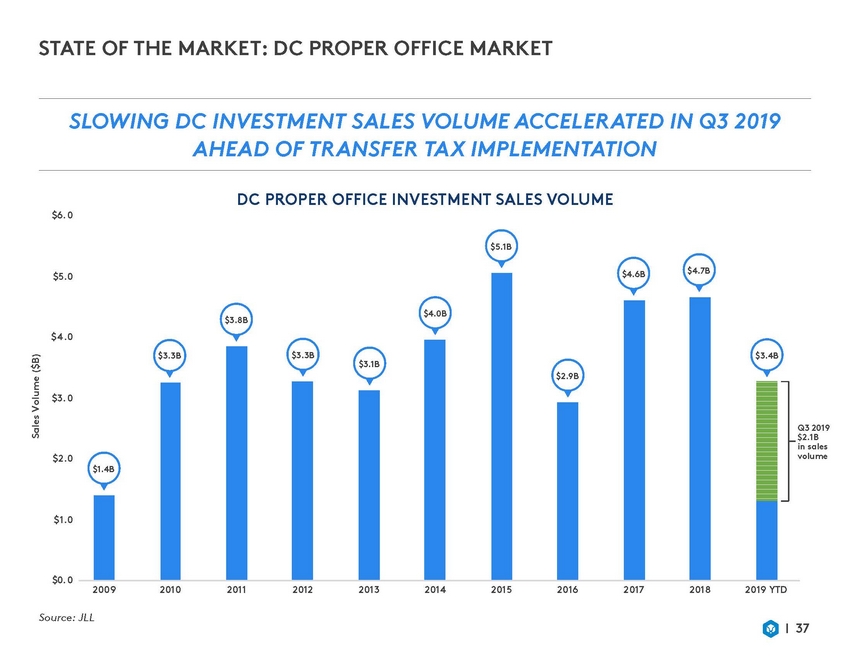
STATE OF THE MARKET: DC PROPER OFFICE MARKET SLOWING DC INVESTMENT SALES VOLUME ACCELERATED IN AHEAD OF TRANSFER TAX IMPLEMENTATION Q3 2019 DC PROPER OFFICE INVESTMENT SALES VOLUME $6. 0 $5.1B $4.7B $4.6B $5.0 $3.8B $4.0 $3.1B $3. 0 Q3 2019 $2.1B in sales volume $2.0 $1.0 $0. 0 200 9 2010 2011 2012 2013 2014 2015 2016 2017 2018 2019 YTD Source: JLL 37 Sales Volume ($B) $4.0B $3.4B $2.9B $3.3B $3.3B $1.4B
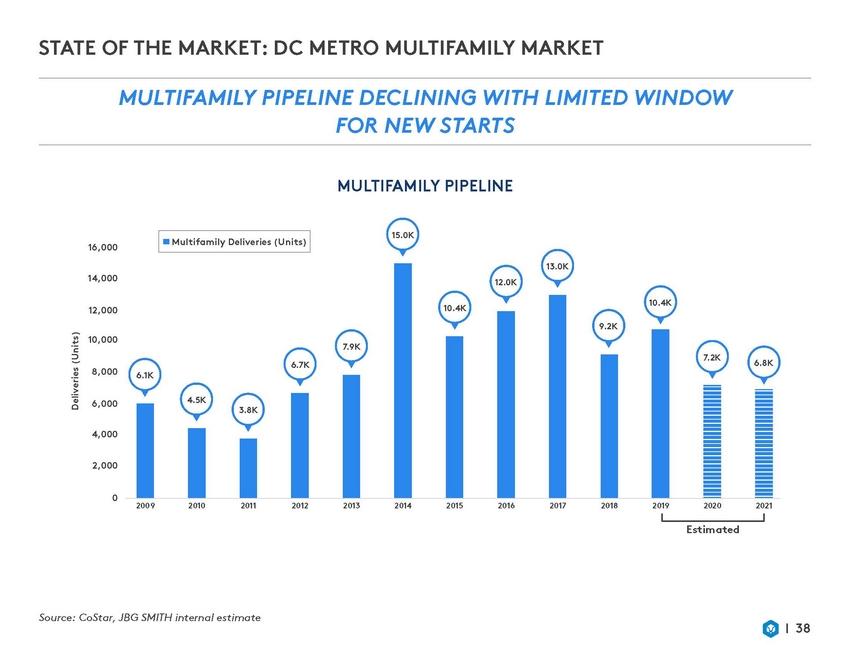
STATE OF THE MARKET: DC METRO MULTIFAMILY MARKET MULTIFAMILY PIPELINE DECLINING WITH FOR NEW STARTS LIMITED WINDOW MULTIFAMILY PIPELINE 15.0K 16,000 13.0K 14,000 12.0K 10.4K 12,000 9.2K 10,000 7.2K 6.8K 8,000 6,000 4,000 2,000 0 200 9 2010 2011 2012 2013 2014 2015 2016 2017 2018 2019 2020 2021 Estimated Source: CoStar, JBG SMITH internal estimate 38 Deliveries (Units) Rent ($/SF) 7.9K 6.7K 6.1K 4.5K 3.8K 10.4K Multifamily Deliveries (Units)

STATE OF THE MARKET: DC METRO MULTIFAMILY MARKET EMERGING MARKET RENTS CONTINUE TO CONVERGE WITH STILL-GROWING MATURE MARKETS, DRIVEN BY STRONG CONSUMER DEMAND DC EMERGING MARKET GROWTH TRAJECTORY AVERAGE MONTHS TO STABILIZATION (ASSETS DELIVERED 2015) 20.0 Q4 2018 Q3 2019 25.0 $5.00 $4.80 20.0 $4.60 6% $4.40 9% 15.0 $4.20 $4.00 10.0 $3.80 $3.60 $3. 40 5.0 GING $3.20 $3.00 - Union Market/ NoMa/ H Street Ballpark U Street/Shaw West End-Dupo nt Circle Emerging Markets(1) Full-Market Source: CoStar (1) Emerging markets include: Union Market/NoMa/H Street, Ballpark, U Street/Shaw. 39 Rent ($/SF) Months to Stabilization 30 26 % % 29 25 % T MA GING T % EMER T GING T EMER EMER 15.6

STATE OF THE MARKET: DC METRO OFFICE MARKET LITTLE MOVEMENT IN OFFICE CAP RATES IN ARLINGTON OR DC DESPITE SLOWING VOLUME IN CORE DC AND PROSPECTIVE EFFECT IN ARLINGTON AMAZON 2016-2019 YTD AVG. OFFICE CAP RATE Q4 2018 Q3 2019 6. 6% 6. 4% 6.1% 6.0% 6. 2% 6. 0% 5.8% 5.6 % 5.4% 5.2% 5.0% 4.8% Arlington Class A(1) DC Proper Class A Source: JLL (1) September sale of 2000 N 15th St excluded due to outlier cap rate (9.82% cap) driven by impending full-building vacancy. 40 Cap Rate (%) Presidential Tower (5.9% Cap) 5.4% 5.4%
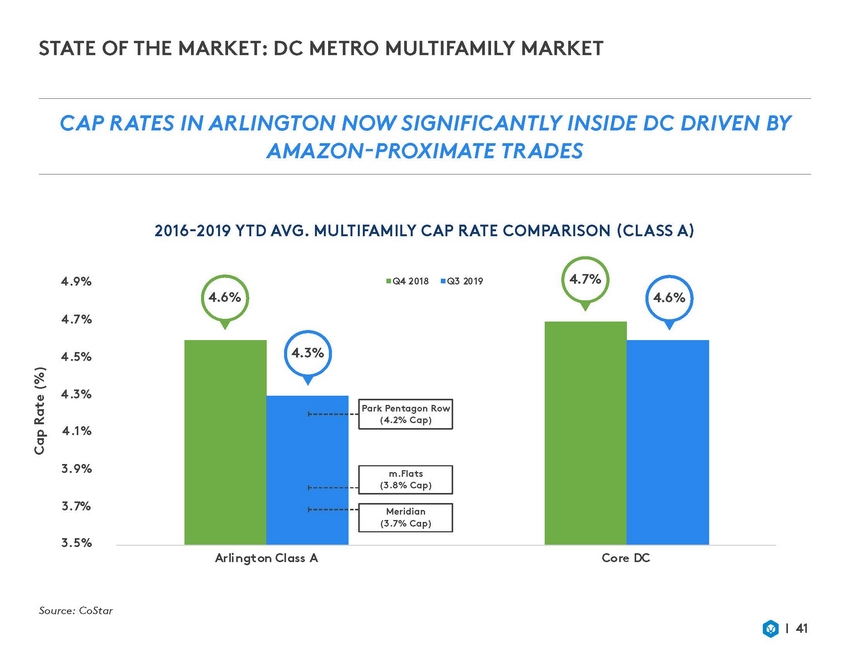
STATE OF THE MARKET: DC METRO MULTIFAMILY MARKET CAP RATES IN ARLINGTON NOW SIGNIFICANTLY INSIDE DC DRIVEN AMAZON-PROXIMATE TRADES BY 2016-2019 YTD AVG. MULTIFAMILY CAP RATE COMPARISON (CLASS A) 4.7% 4.9% Q4 2018 Q3 2019 4.6% 4.6% 4.7% 4.5% 4.3% 4.1% 3.9% 3.7% 3. 5% Arlington Class A Co re DC Source: CoStar 41 Cap Rate (%) 4.3% Park Pentagon Row (4.2% Cap) m.Flats (3.8% Cap) Meridian (3.7% Cap)

GROWTH AND CAPITALIZATION 42

GROWTH AND CAPITALIZATION: ESTIMATED NOI BRIDGE EXCLUDES ADDITIONAL POTENTIAL VALUE CREATION FROM MONETIZATION OF 14.8M SF(1) FUTURE DEVELOPMENT PIPELINE NOI Bridge 5.3% CAGR: -3.0% Market on Office Rents: 93.0% Occupancy: 95.0% Occupancy: NOI GROWTH IS BACK-END WEIGHTED Note: This is a hypothetical presentation of potential near-term NOI from the delivery and stabilization of our Under Construction assets and the stabilization of our Operating Portfolio and is dependent on numerous assumptions, which may not be accurate. Actual future NOI may differ materially from this hypothetical potential near-term NOI. Please see the forward-looking statements disclaimer in this presentation for a discussion of the risks that could cause actual results to differ materially from any projected or estimated results. (1) Excludes 4.1M SF of Estimated Potential Development Density that Amazon has agreed to purchase from JBG SMITH, subject to customary closing conditions, and approximately 750 units related to 1900 Crystal Drive. (2) (3) Excludes $22M of Q4 2018 annualized NOI from disposed assets. Includes nine assets under construction as of Q4 2018 and 1900 Crystal Drive. 43 ASSUMPTIONS Total Portfolio NOI CAGR:9.4% Operating Portfolio NOI Weighted Average Mark-to-Operating Commercial Operating Multifamily $342M $99M$15M$550M $116M $320M Q4 2018 Annualized NOI Q4 2018Growth from Growth from Growth from Q4 2024 Adjusted Operating Portfolio Under Construction Acquisitions Annualized NOI Annualized NOI(2) Assets(3) ASSUMES $33M from lease up $83M from 3% rental revenue growth

GROWTH AND CAPITALIZATION: STRONG BALANCE SHEET TO FUND FUTURE GROWTH ACCESS TO MULTIPLE SOURCES OF CAPITAL WITH OVER $2B OF LIQUIDITY NET DEBT/ TOTAL ENTERPRISE VALUE: 22.9%(2) 1 Secured and unsecured debt Secured Debt 19.4% 2 Opportunistic capital recycling Term Loan 3.5% 3 Select joint ventures Equity 77.1% 4 Efficient access to equity market when conditions warrant (1) Estimated multifamily asset borrowing capacity is based on a 9% debt yield after Under Construction multifamily assets deliver and stabilize. (2) Total Enterprise Value is based on the closing price per share of $39.21 as of September 30, 2019. 44 MULTIFAMILY ASSET BORROWING CAPACITY Unencumbered multifamily assets with expected borrowing capacity of over $750M(1) LEVERAGE METRICS Net Debt/Annualized Adjusted EBITDA: 5.3x Fixed Rate Debt: 87.8% Secured Debt: 84.9%

GROWTH AND CAPITALIZATION: EXPECTED LEVERAGE PROFILE 1 Our long-term leverage targets remain unchanged: • 25% to 35% Net Debt/ Total Enterprise Value • 6x to 7x Net Debt/Adjusted EBITDA, with peak levels in the mid-8x’s during periods of more active development 2 We expect a temporary increase in leverage following the closing of F1RST Residences (December 2019), which will happen prior to the first Amazon land sale (expected in 1H 2020) 3 We believe our planned multifamily developments in National Landing are not dependent upon any further asset sales or capital transactions (public or private) DEBT MATURITY SCHEDULE 2019 2020 2021 2022 2023 2024 2025 2026 + 45 $36 M $500 M $100 M $200 M $4 M $331 M $100 M $6 M $250 M $191 M $195 M $135 M $78 M Secured D ebt P ro Rata Share In-P lace Co nstruction Loan Availability Drawn Term Loans Term Lo an Availability + $1B Undrawn Credit Facility

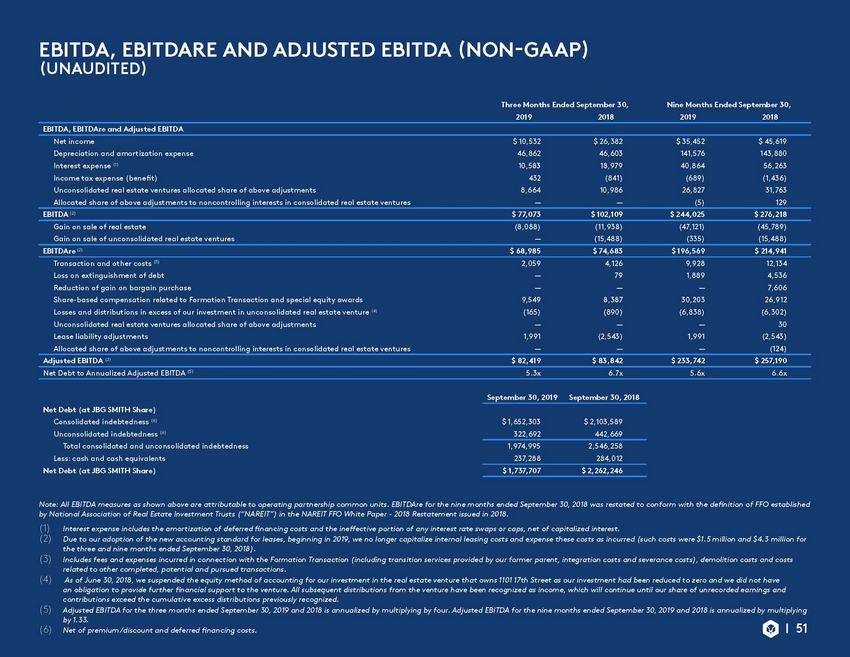
DEFINITIONS ANNUALIZED RENT “Annualized rent” is defined as (i) for commercial assets, or the retail component of a mixed-use asset, the in-place monthly base rent before free rent, plus tenant reimbursements as of September 30, 2019, multiplied by 12, with triple net leases converted to a gross basis by adding estimated tenant reimbursements to monthly base rent, and (ii) for multifamily assets, or the multifamily component of a mixed-use asset, the in-place monthly base rent before free rent as of September 30, 2019, multiplied by 12. Annualized rent excludes rent from signed but not yet commenced leases. ANNUALIZED RENT PER SQUARE FOOT “Annualized rent per square foot” is defined as (i) for commercial assets, annualized office rent divided by occupied office square feet and annualized retail rent divided by occupied retail square feet; and (ii) for multifamily assets, monthly multifamily rent divided by occupied multifamily square feet; annualized retail rent and retail square feet are excluded from this metric. Occupied square footage may differ from leased square footage because leased square footage includes leases that have been signed but have not yet commenced. EARNINGS BEFORE INTEREST, TAXES, DEPRECIATION AND AMORTIZATION (“EBITDA”), EBITDA FOR REAL ESTATE (“EBITDARE”) AND ADJUSTED EBITDA Management uses EBITDA and EBITDAre, non-GAAP financial measures, as supplemental operating performance measures and believes they help investors and lenders meaningfully evaluate and compare our operating performance from period-to-period by removing from our operating results the impact of our capital structure (primarily interest charges from our outstanding debt and the impact of our interest rate swaps) and certain non-cash expenses (primarily depreciation and amortization on our assets). EBITDAre is computed in accordance with the definition established by NAREIT. NAREIT defines EBITDAre as GAAP net income (loss) adjusted to exclude interest expense, income taxes, depreciation and amortization expenses, gains on sales of real estate and impairment losses of real estate, including our share of such adjustments of unconsolidated real estate ventures. These supplemental measures may help investors and lenders understand our ability to incur and service debt and to make capital expenditures. EBITDA and EBITDAre are not substitutes for net income (loss) (computed in accordance with GAAP) and may not be comparable to similarly titled measures used by other companies. “Adjusted EBITDA,” a non-GAAP financial measure, represents EBITDAre adjusted for items we believe are not representative of ongoing operating results, such as transaction and other costs, gain (loss) on the extinguishment of debt, distributions in excess of our investment in unconsolidated real estate ventures, gain on the bargain purchase of a business, lease liability adjustments and share-based compensation expense related to the Formation Transaction and special equity awards. We believe that adjusting such items not considered part of our comparable operations, provides a meaningful measure to evaluate and compare our performance from period-to-period. Because EBITDA, EBITDAre and Adjusted EBITDA have limitations as analytical tools, we use EBITDA, EBITDAre and Adjusted EBITDA to supplement GAAP financial measures. Additionally, we believe that users of these measures should consider EBITDA, EBITDAre and Adjusted EBITDA in conjunction with net income (loss) and other GAAP measures in understanding our operating results. A reconciliation of net income (loss) to EBITDA, EBITDAre and Adjusted EBITDA is presented on page 51. ESTIMATED POTENTIAL DEVELOPMENT DENSITY ‘‘Estimated potential development density’’ reflects management’s estimate of developable gross square feet based on our current business plans with respect to real estate owned or controlled as of September 30, 2019. Our current business plans may contemplate development of less than the maximum potential development density for individual assets. As market conditions change, our business plans, and therefore, the Estimated Potential Development Density, could change accordingly. Given timing, zoning requirements and other factors, we make no assurance that estimated potential development density amounts will become actual density to the extent we complete development of assets for which we have made such estimates. FREE RENT ‘‘Free rent’’ means the amount of base rent and tenant reimbursements that are abated according to the applicable lease agreement(s). 46

DEFINITIONS FUNDS FROM OPERATIONS (“FFO”), CORE FFO AND FUNDS AVAILABLE FOR DISTRIBUTION (“FAD”) FFO is a non-GAAP financial measure computed in accordance with the definition established by NAREIT in the NAREIT FFO White Paper - 2018 Restatement issued in 2018. NAREIT defines FFO as “net income (computed in accordance with GAAP), excluding depreciation and amortization related to real estate, gains and losses from the sale of certain real estate assets, gains and losses from change in control and impairment write-downs of certain real estate assets and investments in entities when the impairment is directly attributable to decreases in the value of depreciable real estate held by the entity.” “Core FFO” represents FFO adjusted to exclude items (net of tax) which we believe are not representative of ongoing operating results, such as transaction and other costs, gains (or losses) on extinguishment of debt, gain on the bargain purchase of a business, distributions in excess of our investment in unconsolidated real estate ventures, share-based compensation expense related to the Formation Transaction and special equity awards, lease liability adjustments, amortization of the management contracts intangible and the mark-to-market of derivative instruments. “FAD” is a non-GAAP financial measure and represents FFO less recurring tenant improvements, leasing commissions and other capital expenditures, net deferred rent activity, third-party lease liability assumption payments, recurring share-based compensation expense, accretion of acquired below-market leases, net of amortization of acquired above-market leases, amortization of debt issuance costs and other non-cash income and charges. FAD is presented solely as a supplemental disclosure that management believes provides useful information as it relates to our ability to fund dividends. We believe FFO, Core FFO and FAD are meaningful non GAAP financial measures useful in comparing our levered operating performance from period-to-period and as compared to similar real estate companies because these non GAAP measures exclude real estate depreciation and amortization expense and other non-comparable income and expenses, which implicitly assumes that the value of real estate diminishes predictably over time rather than fluctuating based on market conditions. FFO, Core FFO and FAD do not represent cash generated from operating activities and are not necessarily indicative of cash available to fund cash requirements and should not be considered as an alternative to net income (loss) (computed in accordance with GAAP) as a performance measure or cash flow as a liquidity measure. FFO, Core FFO and FAD may not be comparable to similarly titled measures used by other companies. FUTURE DEVELOPMENT “Future development” refers to assets that are development opportunities on which we do not intend to commence construction within 18 months of September 30, 2019 where we (i) own land or control the land through a ground lease or (ii) are under a long-term conditional contract to purchase, or enter into a leasehold interest with respect to land. HISTORICAL COST, ESTIMATED INCREMENTAL INVESTMENT, ESTIMATED TOTAL INVESTMENT AND ESTIMATED TOTAL PROJECT COST “Historical cost” is a non-GAAP measure which includes the total historical cost incurred by JBG SMITH with respect to the development of an asset, including any acquisition costs, hard costs, soft costs, tenant improvements (excluding free rent converted to tenant improvement allowances), leasing costs and other similar costs, but excluding any financing costs, ground rent expenses and capitalized payroll costs incurred as of September 30, 2019. “Estimated incremental investment” means management’s estimate of the remaining cost to be incurred in connection with the development of an asset as of September 30, 2019, including all remaining acquisition costs, hard costs, soft costs, tenant improvements (excluding free rent converted to tenant improvement allowances), leasing costs and other similar costs to develop and stabilize the asset but excluding any financing costs, ground rent expenses and capitalized payroll costs. “Estimated total investment” means, with respect to the development of an asset, the sum of the historical cost in such asset and the estimated incremental investment for such asset. “Estimated total project cost” is estimated total investment excluding purchase price allocation adjustments recognized as a result of the Formation Transaction. Actual incremental investment, actual total investment and actual total project cost may differ substantially from our estimates due to numerous factors, including unanticipated expenses, delays in the estimated start and/or completion date, changes in design and other contingencies. 47
DEFINITIONS IN SERVICE ‘‘In service’’ refers to commercial or multifamily assets that are at or above 90% leased or have been operating and collecting rent for more than 12 months as of September 30, 2019. METRO-SERVED “Metro-served” means locations, submarkets or assets that are generally nearby and within walking distance of a Metro station, defined as being within 0.5 miles of an existing or planned Metro station. MONTHLY RENT PER UNIT For multifamily assets, represents multifamily rent for the month ended September 30, 2019 divided by occupied units; retail rent is excluded from this metric. NEAR-TERM DEVELOPMENT ‘‘Near-term development’’ refers to assets that have substantially completed the entitlement process and on which we intend to commence construction within 18 months following September 30, 2019, subject to market conditions. NET OPERATING INCOME (“NOI”), ADJUSTED ANNUALIZED NOI, ESTIMATED STABILIZED NOI AND PROJECTED NOI YIELD “NOI” is a non-GAAP financial measure management uses to measure the operating performance of our assets and consists of property-related revenue (which includes base rent, tenant reimbursements and other operating revenue, net of free rent and payments associated with assumed lease liabilities) less operating expenses and ground rent, if applicable. NOI also excludes deferred rent, related party management fees, interest expense, and certain other non-cash adjustments, including the accretion of acquired below-market leases and amortization of acquired above-market leases and below-market ground lease intangibles. Annualized NOI, for all assets except Crystal City Marriott, represents NOI for the three months ended September 30, 2019 multiplied by four. Due to seasonality in the hospitality business, annualized NOI for Crystal City Marriott represents the trailing 12-month NOI as of September 30, 2019. Management believes Annualized NOI provides useful information in understanding our financial performance over a 12-month period, however, investors and other users are cautioned against attributing undue certainty to our calculation of Annualized NOI. Actual NOI for any 12-month period will depend on a number of factors beyond our ability to control or predict, including general capital markets and economic conditions, any bankruptcy, insolvency, default or other failure to pay rent by one or more of our tenants and the destruction of one or more of our assets due to terrorist attack, natural disaster or other casualty, among others. We do not undertake any obligation to update our calculation to reflect events or circumstances occurring after the date of this Investor Package. There can be no assurance that the annualized NOI shown will reflect our actual results of operations over any 12-month period. We also report adjusted annualized NOI which includes signed but not yet commenced leases and incremental revenue from recently delivered assets assuming stabilization. While we believe adjusted annualized NOI provides useful information regarding potential future NOI from our assets, it does not account for any decrease in NOI for lease terminations, defaults or other negative events that could affect NOI and therefore, should not be relied upon as indicative of future NOI. This Investor Package also contains management’s estimate of stabilized NOI and projections of NOI yield for under construction and near-term development assets, which are based on management’s estimates of property-related revenue and operating expenses for each asset. These estimates are inherently uncertain and represent management’s plans, expectations and beliefs and are subject to numerous assumptions, risks and uncertainties. The property-related revenues and operating expenses for our assets may differ materially from the estimates included in this Investor Package. Management’s projections of NOI yield are not projections of our overall financial performance or cash flow, and there can be no assurance that the projected NOI yield set forth in this Investor Package will be achieved. “Projected NOI yield” means our estimated stabilized NOI reported as a percentage of (i) estimated total project costs, (ii) estimated total investment and (iii) estimated incremental investment. Actual initial full year stabilized NOI yield may vary from the projected NOI yield based on the actual incremental investment to complete the asset and its actual initial full year stabilized NOI, and there can be no assurance that we will achieve the projected NOI yields described in this Investor Package. 48
DEFINITIONS The Company does not provide reconciliations for non-GAAP estimates on a future basis, including adjusted annualized NOI and estimated stabilized NOI because it is unable to provide a meaningful or accurate calculation or estimate of reconciling items and the information is not available without unreasonable effort. This inability is due to the inherent difficulty of forecasting the timing and/or amounts of various items that would impact net income. Additionally, no reconciliation of projected NOI yield to the most directly comparable GAAP measure is included in this Investor Package because we are unable to quantify certain amounts that would be required to be included in the comparable GAAP financial measures without unreasonable efforts because such data is not currently available or cannot be currently estimated with confidence. Accordingly, we believe such reconciliations would imply a degree of precision that would be confusing or misleading to investors. Management uses each of these measures as supplemental performance measures for its assets and believes they provide useful information to investors because they reflect only those revenue and expense items that are incurred at the asset level, excluding non-cash items. In addition, NOI is considered by many in the real estate industry to be a useful starting point for determining the value of a real estate asset or group of assets. However, because NOI excludes depreciation and amortization and captures neither the changes in the value of our assets that result from use or market conditions, nor the level of capital expenditures and capitalized leasing commissions necessary to maintain the operating performance of our assets, all of which have real economic effect and could materially impact the financial performance of our assets, the utility of NOI as a measure of the operating performance of our assets is limited. Moreover, our method of calculating NOI may differ from other real estate companies and, accordingly, may not be comparable. NOI should be considered only as a supplement to net operating income (loss) (computed in accordance with GAAP) as a measure of the operating performance of our assets. PERCENT LEASED ‘‘Percent leased’’ is based on leases signed as of September 30, 2019, and is calculated as total rentable square feet less rentable square feet available for lease divided by total rentable square feet expressed as a percentage. Out-of-service square feet are excluded from this calculation. PERCENT PRE-LEASED ‘‘Percent pre-leased’’ is based on leases signed as of September 30, 2019, and is calculated as the estimated rentable square feet leased divided by estimated total rentable square feet expressed as a percentage. PERCENT OCCUPIED ‘‘Percent occupied’’ is based on occupied rentable square feet /units as of September 30, 2019, and is calculated as (i) for office and retail space, total rentable square feet less unoccupied square feet divided by total rentable square feet, (ii) for multifamily space, total units less unoccupied units divided by total units, expressed as a percentage. Out-of-service square feet are excluded from this calculation. PRO RATA ADJUSTED GENERAL AND ADMINISTRATIVE (“G&A”) EXPENSES “Pro Rata Adjusted G&A expenses”, a non-GAAP financial measure, represents G&A expenses adjusted for share-based compensation expense related to the Formation Transaction and special equity awards and the G&A expenses of our third-party asset management and real estate services business that are directly reimbursed. We believe that adjusting such items not considered part of our comparable operations provides a meaningful measure to assess our G&A expenses as compared to similar real estate companies and in general. 49

DEFINITIONS RECENTLY DELIVERED “Recently delivered” refers to commercial and multifamily assets that are below 90% leased and have been delivered within the 12 months ended September 30, 2019. Same Store and Non-Same Store “Same store” refers to the pool of assets that were in service for the entirety of both periods being compared, except for assets for which significant redevelopment, renovation, or repositioning occurred during either of the periods being compared. “Non-same store” refers to all operating assets excluded from the same store pool. SECOND GENERATION LEASE “Second generation lease” is a lease on space that had been vacant for less than nine months. SIGNED BUT NOT YET COMMENCED LEASES “Signed but not yet commenced leases” means leases for assets in JBG SMITH’s portfolio that, as of September 30, 2019, have been executed but for which no rental payments had yet been charged to the tenant. SQUARE FEET ‘‘Square feet’’ or ‘‘SF’’ refers to the area that can be rented to tenants, defined as (i) for commercial assets, rentable square footage defined in the current lease and for vacant space the rentable square footage defined in the previous lease for that space, (ii) for multifamily assets, management’s estimate of approximate rentable square feet, (iii) for assets under construction and near-term development assets, management’s estimate of approximate rentable square feet based on current design plans as of September 30, 2019, or (iv) for future development assets, management’s estimate of developable gross square feet based on its current business plans with respect to real estate owned or controlled as of September 30, 2019. TRANSACTION AND OTHER COSTS Transaction and other costs include amounts incurred for transition services provided by our former parent, integration costs, severance costs, costs incurred in connection with recapitalization transactions and disposition costs and costs related to other completed, potential and pursued transactions. UNDER CONSTRUCTION ‘‘Under construction’’ refers to assets that were under construction during the three months ended September 30, 2019. 50
[LOGO]

[LOGO]

[LOGO]