Exhibit 99.2
1770 Crystal Drive and Crystal Drive Retail Repositioning INVESTOR PRESENTATION FEBRUARY 2021 |
DISCLOSURES FORWARD-LOOKING STATEMENTS Certain statements contained herein may constitute “forward-looking statements” as such term is defined in Section 27A of the Securities Act of 1933, as amended, and Section 21E of the Securities Exchange Act of 1934, as amended. Forward-looking statements are not guarantees of performance. They represent our intentions, plans, expectations and beliefs and are subject to numerous assumptions, risks and uncertainties. Consequently, the future results of JBG SMITH Properties (“JBG SMITH”, the “Company”, "we", "us", "our" or similar terms) may differ materially from those expressed in these forward-looking statements. You can find many of these statements by looking for words such as “approximate”, "hypothetical", "potential", “believes”, “expects”, “anticipates”, “estimates”, “intends”, “plans”, “would”, “may” or similar expressions in this Investor Presentation. Currently, one of the most significant factors that could cause actual outcomes to differ materially from our forward-looking statements is the adverse effect of the current pandemic of the novel coronavirus, or COVID-19, on our financial condition, results of operations, cash flows, liquidity, performance, tenants, the real estate market and the global economy and financial markets. The extent to which the COVID-19 pandemic continues to impact us and our tenants depends on future developments, many of which are highly uncertain and cannot be predicted with confidence, including the scope, severity, and duration of the pandemic, the actions taken to contain the pandemic or mitigate its impact, and the direct and indirect economic effects of the pandemic and containment measures, and whether the residential market in the Washington, DC region and any of our properties will be materially impacted by the expiration of various moratoriums on residential evictions, among others. Moreover, investors are cautioned to interpret many of the risks identified under the section titled “Risk Factors” in our Annual Report on Form 10-K for the fiscal year ended December 31, 2020 as being heightened as a result of the ongoing and numerous adverse impacts of the COVID-19 pandemic. We also note the following may impact our forward looking statements: the impact of COVID-19 and the ensuing economic turmoil on our Company, net operating income, same store net operating income, net asset value, stock price, occupancy rates, revenue from our multifamily and commercial portfolios, operating costs, deferrals of rent, uncollectable operating lease receivables, parking revenue, and burn-off of rent abatement; the impact of disruptions to the credit and capital markets on our ability to access capital, including refinancing maturing debt; changes to the amount and manner in which tenants use space; whether we will harvest the anticipated value of our development pipeline; whether we incur additional costs or make additional concessions or offer other incentives to existing or prospective tenants to reconfigure space; whether the Washington, DC region will be more resilient than other parts of the country in any recession resulting from COVID-19 and whether DC metro asking rents will be more resilient than those in other gateway markets; our annual dividend per share and dividend yield; annualized net operating income; whether our future capital recycling efforts will be successful and will be at or above NAV; in the case of our under-construction assets, estimated square feet, estimated number of units and in the case of our near-term and future development assets, estimated potential development density; expected key Amazon.com, Inc. ("Amazon") transaction terms and timeframes for closing any Amazon transactions not yet closed; the amount and timing of planned infrastructure and education improvements related to Amazon’s additional headquarters and the Virginia Tech Innovation Campus; the economic impact and job growth of Amazon’s additional headquarters on the DC region and National Landing; the impact of our role as the exclusive developer, property manager and retail leasing agent in connection with Amazon’s new headquarters; our development plans related to Amazon’s additional headquarters; whether our plans related to our investment in 5G wireless spectrum across National Landing will be a significant demand catalyst; whether our target markets continue to be fast growing; whether future supply or construction delays will inhibit our ability to time new multifamily deliveries to meet market demand; whether Amazon will have a similar growth impact on National Landing as in Seattle; and whether National Landing will experience the 'Major Milestones' on the timing discussed or at all; whether anticipated near-term net operating income contributions, anticipated resiliency of the DC area and our contemplated shift to multifamily will be realized and, if realized, will have a positive impact on our stock price; whether any of our tenants succeed in obtaining government assistance under the CARES Act and other programs and use any resulting proceeds to make lease payments owed to us; whether we can access agency debt secured by our currently-unencumbered multifamily assets timely, in the amounts we estimate, on reasonable terms or at all; whether estimates of the amounts management believes to be the impact of COVID-19 on our NOI and Adjusted EBITDA are correct; whether the delay in our planned 2020 discretionary operating asset capital expenditures will have any negative impact on our properties or our ability to generate revenue; and the allocation of capital to our share repurchase plan may not have any impact on our share price. Many of the factors that will determine the outcome of these and our other forward-looking statements are beyond our ability to control or predict. These factors include, among others: adverse economic conditions in the Washington, DC metropolitan area, including in relation to COVID-19, the timing of and costs associated with development and property improvements, financing commitments, and general competitive factors. For further discussion of factors that could materially affect the outcome of our forward-looking statements and other risks and uncertainties, see “Risk Factors,” “Management’s Discussion and Analysis of Financial Condition and Results of Operations” and the Cautionary Statement Concerning Forward-Looking Statements in the Company’s Annual Report on Form 10-K for the year ended December 31, 2020 and other periodic reports the Company files with the Securities and Exchange Commission. For these statements, we claim the protection of the safe harbor for forward-looking statements contained in the Private Securities Litigation Reform Act of 1995. You are cautioned not to place undue reliance on our forward-looking statements. All subsequent written and oral forward-looking statements attributable to us or any person acting on our behalf are expressly qualified in their entirety by the cautionary statements contained or referred to in this section. We do not undertake any obligation to release publicly any revisions to our forward-looking statements to reflect events or circumstances occurring after the date hereof. 2 |
DISCLOSURES PRO RATA INFORMATION We present certain financial information and metrics in this release “at JBG SMITH Share,” which refers to our ownership percentage of consolidated and unconsolidated assets and liabilities owned through real estate ventures (collectively, “real estate ventures”) as applied to these financial measures and metrics. Financial information “at JBG SMITH Share” is calculated on an asset-by-asset basis by applying our percentage economic interest to each applicable line item of that asset’s financial information. “At JBG SMITH Share” information, which we also refer to as being “at share,” “our pro rata share” or “our share,” is not, and is not intended to be, a presentation in accordance with GAAP. Given that a substantial portion of our assets are held through real estate ventures, we believe this form of presentation, which presents our economic interests in the partially owned entities, provides investors valuable information regarding a significant component of our portfolio, its composition, performance and capitalization. We do not control the unconsolidated real estate ventures and do not have a legal claim to our co-venturers’ share of assets, liabilities, revenue and expenses. The operating agreements of the unconsolidated real estate ventures generally allow each co-venturer to receive cash distributions to the extent there is available cash from operations. The amount of cash each investor receives is based upon specific provisions of each operating agreement and varies depending on certain factors including the amount of capital contributed by each investor and whether any investors are entitled to preferential distributions. With respect to any such third-party arrangement, we would not be in a position to exercise sole decision-making authority regarding the property, real estate venture or other entity, and may, under certain circumstances, be exposed to economic risks not present were a third-party not involved. We and our respective co-venturers may each have the right to trigger a buy-sell or forced sale arrangement, which could cause us to sell our interest, or acquire our co-venturers’ interests, or to sell the underlying asset, either on unfavorable terms or at a time when we otherwise would not have initiated such a transaction. Our real estate ventures may be subject to debt, and the repayment or refinancing of such debt may require equity capital calls. To the extent our co-venturers do not meet their obligations to us or our real estate ventures or they act inconsistent with the interests of the real estate venture, we may be adversely affected. Because of these limitations, the non-GAAP “at JBG SMITH Share” financial information should not be considered in isolation or as a substitute for our financial statements as reported under GAAP. MARKET DATA Market data and industry forecasts are used in this Investor Presentation, including data obtained from publicly available sources. These sources generally state that the information they provide has been obtained from sources believed to be the reliable, but the accuracy and completeness of the information is not assured. The Company has not independently verified any such information. AMAZON In November 2018, Amazon announced it had selected sites that we own in National Landing as the location of an additional headquarters. In connection with Amazon's new headquarters in National Landing, in February 2019 the Commonwealth of Virginia enacted an incentives bill, which provides tax incentives to Amazon to create a minimum of 25,000 new full-time jobs and potentially 37,850 full-time jobs with average annual wage targets for each calendar year, starting with $150,000 in 2019, and escalating 1.5% per year, in National Landing. Led by state and local governments, we expect more than $5.5 billion of infrastructure and education investments directly benefitting National Landing. These investments include: two new Metro entrances (Crystal Drive and Potomac Yard); a pedestrian bridge to Reagan National Airport; a new commuter rail station located between two of our Crystal Drive office assets; lowering of elevated sections of U.S. Route 1 that currently divide parts of National Landing to create better multimodal access and walkability; and funding for an innovation campus anchored by Virginia Tech. In addition to government infrastructure investments, we expect at least an additional $5.5 billion of investments, including investments by Amazon, JBG SMITH, and Virginia Tech. To date, we have executed leases with Amazon totaling approximately 857,000 square feet at five office buildings in our National Landing portfolio. In March 2019, we executed purchase and sale agreements with Amazon for two of our National Landing development sites, Metropolitan Park and Pen Place, which will serve as the initial phase of new construction associated with Amazon's new headquarters at National Landing. Subject to customary closing conditions, Amazon contracted to acquire these two development sites for an estimated aggregate $293.9 million, or $72.00 per square foot, based on their combined estimated potential development density of up to approximately 4.1 million square feet. In December 2019, Arlington County approved the plans submitted by Amazon to construct two new office buildings, totaling 2.1 million square feet, inclusive of over 50,000 square feet of street-level retail with new shops and restaurants, on the Metropolitan Park land sites. In January 2020, we sold Metropolitan Park to Amazon for $155.0 million, which represented an $11.0 million increase over our previously 3 |
DISCLOSURES estimated contract value resulting from an increase in the approved development density on the site. The sale of Pen Place to Amazon for approximately $149.9 million is expected to close in 2021, subject to customary closing conditions. We are the developer, property manager and retail leasing agent for Amazon's new headquarters at National Landing. In September 2020, Amazon purchased the Residence Inn by Marriott in Pentagon City, immediately adjacent to Pen Place in National Landing from a third-party. We include certain statistics in the following slides as outlined in the Memorandum of Understanding (MOU) between Amazon and the Commonwealth of Virginia, executed on 11/12/2018, and that identify the proximity of our portfolio to National Landing: specifically 81% of our portfolio is within a 20-minute commute of National Landing, as calculated on a pre-COVID-19 Monday morning. Approximately 2.1 million square feet of estimated potential development density at Pen Place has been excluded from the JBG SMITH portfolio statistics included in this presentation. DEFINITIONS AND RECONCILIATIONS For certain definitions and reconciliations see pages 36-41. IMPACT OF COVID-19 ON OUR NOI AND ADJUSTED EBITDA This presentation includes estimates of the amounts management believes are attributable to the impact of COVID-19 on our NOI and Adjusted EBITDA. Though certain elements of such estimates are quantifiable, these estimates are inherently subjective and we can provide no assurance that such estimates reflect the actual impact of COVID-19 on the measures or that these measures, after such adjustments, reflect what our actual results would have been in the absence of COVID-19. 4 |
KEY UPDATES 5 Acquired future development asset adjacent to Amazon HQ2 (up to 550K SF of new development density) Submitted entitlements for the second phase of Amazon's new headquarters (2.8M SF of office + The Helix) AMAZON HQ2 ESG VIRGINIA TECH INNOVATION CAMPUS ACQUISITIONS Secured final entitlements for the first phase of the Innovation Campus at Potomac Yard JBG SMITH-managed WHI Impact Pool partnered with Amazon to finance non-profit's acquisition of Crystal House (825 units) Completed 1770 Crystal Drive ahead of schedule and below budget (office is 100% leased to Amazon) Received a 5-Star GRESB rating and attained Global Sector Leader status |
6 WHO WE ARE: JBG SMITH OVERVIEW MIXED-USE OWNER AND OPERATOR FOCUSED ON HIGH-GROWTH, AMENITY-RICH SUBMARKETS IN THE DC METRO AREA SIGNIFICANT DEMAND CATALYSTS IN NATIONAL LANDING SUBSTANTIAL NOI AND LONG-TERM NAV/SHARE GROWTH OPPORTUNITY leased across our In-Service operating portfolio 89.2% assets delivered since Q4 2019 currently in lease-up 7 New home to Amazon’s 4M+ SF new headquarters with 38K+ planned new jobs HQ2 of our portfolio is concentrated in National Landing (Operating assets + Development Pipeline) 53% of our portfolio is located in amenity-rich, high-growth submarkets within a 20-minute commute of Amazon HQ2 and the Virginia Tech Innovation Campus 81% connectivity across National Landing is expected to make it among the first 5G-operable submarkets in the nation 5G Development Pipeline - 76% multifamily 15.6M SF of liquidity to execute on growth pipeline $1.7B |
WHO WE ARE: CONCENTRATED IN HIGH-GROWTH SUBMARKETS 7 MD VA Washington, DC 20MINUTE COMMUTE TO NATIONAL LANDING Bethesda CBD Reston (O Map) DC Mature RB Corridor National Landing Amazon HQ2 Virginia Tech Innovation Campus Downtown Silver Spring Other MD (O Map) DC Emerging Note: Size of sphere based on square footage and includes Operating, Under-Construction, and Development Pipeline square footage. Target submarkets represent the primary focus of new JBGS investment: National Landing, DC Emerging, Reston Town Center, the Rosslyn-Ballston Corridor (RB Corridor), and Bethesda CBD. 81% OF OUR PORTFOLIO IS WITHIN A 20-MINUTE COMMUTE OF NATIONAL LANDING 4% RB CORRIDOR 53% NATIONAL LANDING 10% RESTON NORTHERN VIRGINIA 2% BETHESDA CBD 6% OTHER MD MARYLAND 20% DC EMERGING 5% DC MATURE WASHINGTON, DC OUR TARGET MARKETS ARE FAST GROWING AND AMENITY-RICH, REPRESENTING APPROXIMATELY 18% OF THE DC METRO MARKET |
RECESSION RESILIENCE VS OTHER GATEWAY MARKETS 8 -5.0% -4.0% -3.0% -2.0% -1.0% -10.0% -9.0% -8.0% -7.0% -6.0% 0.0% 1.0% 2.0% 3.0% Washington, DC Gateway Markets Employment Change (%) 2008-2009 Great Recession 2001-2002 Tech Crash 1990-1992 Recession 2020 COVID-19(1) (Preliminary) LIKE IN PAST DOWNTURNS, EMPLOYMENT IN THE DC METRO DURING THE PANDEMIC HAS BEEN MORE STABLE THAN IN OTHER GATEWAY MARKETS Source: Bureau of Labor Statistics Note: Gateway Markets comprise the New York City Metro, Boston Metro, and San Francisco Metro areas. (1) Reflects non-farm employment between February 2020 and November 2020 (preliminary data as of Dec. 2020). -1.7% -4.2% 0.3% -1.3% -4.0% -8.2% -3.3% -2.4% |
OUT-OF-CITY MIGRATION TREND VERSUS OTHER GATEWAY MARKETS 9 120.0% 0.0% 20.0% 40.0% 60.0% 80.0% 100.0% Manhattan, NY San Franscico, CA Washington, DC Boston, MA Increase in Out-of-City Change of Address Requests (%) OUT-OF-CITY MIGRATION INCREASE(1) (2019-2020) 20.3% 106.9% 78.5% 16.8% Source: Goldman Sachs, USPS (1) Out-of-city migration is defined by the month over month change in USPS change of address requests (March through November) from 2019 to 2020. Data reflects moves from the urban core to outside of the area. Data includes both individual and family permanent requests. THE RATE OF MIGRATION OUT OF MANHATTAN AND SAN FRANCISCO HAS INCREASED SIGNIFICANTLY MORE THAN IN WASHINGTON, DC DURING THE PANDEMIC |
MULTIFAMILY RESILIENCE VS OTHER GATEWAY MARKETS 10 Rent Growth (%) Occupancy Change (%) -8.0% -6.0% -4.0% -2.0% -- 2.0% 4.0% Multifamily -15.0% -10.0% -5.0% -- 5.0% 10.0% Oce Washington, DC Gateway Markets Washington, DC Gateway Markets(1) Rent Growth (%) Occupancy Change (%) -8.0% -6.0% -4.0% -2.0% -- 2.0% 4.0% Multifamily -15.0% -10.0% -5.0% -- 5.0% 10.0% Oce Washington, DC Gateway Markets Washington, DC Gateway Markets(1) ASKING RENT GROWTH 4Q19 - 4Q20 (COVID-19) 4Q19 - 4Q20 (COVID-19) OCCUPANCY CHANGE -7.7% -1.2% -10.5% -1.2% Source: Apartment List Note: Gateway Markets comprise the New York City Metro, Boston Metro, and San Francisco Metro areas. Statistics representative of entire MSA in each market - for submarkets relevant to JBGS holdings, see slide 32, which reflects a narrowed selection of submarkets with same-store building sets comparable to JBGS holdings. RELATIVE AFFORDABILITY AND INSULATION AGAINST URBAN FLIGHT LED TO LOWER RENT DECLINES IN THE DC MARKET RELATIVE TO OTHER GATEWAY MARKETS |
OFFICE RESILIENCE VS OTHER GATEWAY MARKETS 11 Rent Growth (%) Occupancy Change (%) Multifamily -10.0% -8.0% -6.0% -4.0% -2.0% 0.0% Oce Washington, DC Gateway Markets -10.0% -8.0% -6.0% -4.0% -2.0% 0.0% Washington, DC Gateway Markets Rent Growth (%) Occupancy Change (%) Multifamily -10.0% -8.0% -6.0% -4.0% -2.0% 0.0% Oce Washington, DC Gateway Markets -10.0% -8.0% -6.0% -4.0% -2.0% 0.0% Washington, DC Gateway Markets ASKING RENT GROWTH OCCUPANCY CHANGE 0.0% -2.4% -0.8% -4.5% Source: JLL Note: Gateway Markets comprise the New York City Metro, Boston Metro, and San Francisco Metro areas. GOVERNMENT TENANTS, A RESILIENT ECONOMY, AND LOW URBAN DENSITY HELPED THE DC OFFICE MARKET RELATIVE TO OTHER GATEWAY MARKETS 4Q19 - 4Q20 (COVID-19) 4Q19 - 4Q20 (COVID-19) |
DEMAND CATALYSTS IN NATIONAL LANDING: AMAZON HQ2 AND VIRGINIA TECH 12 AMAZON HIRING EXPECTATION INCREASE IN DAYTIME POPULATION TOTAL PUBLIC AND PRIVATE INVESTMENT JBGS DEVELOPMENT PIPELINE 38K+ JOBS 70% $11B 7.8M SF New Metro Entrance New Metro Station Route One to Grade New Rail Station and Airport Pedestrian Bridge Virginia Tech Innovation Campus REAGAN NATIONAL AIRPORT ARLINGTON ALEXANDRIA WASHINGTON HOUSING CONSERVANCY + AMAZON AMAZON HQ2 JBGS OPERATING JBGS DEVELOPMENT PIPELINE NATIONAL LANDING INFRASTRUCTURE/EDUCATION (STATE & LOCAL FUNDED) |
DEMAND CATALYSTS IN NATIONAL LANDING: GROWTH TIMELINE 13 AMAZON JOB GROWTH AND MAJOR MILESTONES(1) Amazon Hiring Expectation (Cumulative) Year End 0 5,000 10,000 15,000 20,000 25,000 30,000 35,000 40,000 2019 2020 2018 2021 2022 2023 2024 2025 2026 2027 2028 2029 2030 2031 2032 2033 2034 POTENTIAL TO START UP TO 3,100 NEW MULTIFAMILY UNITS OVER THE NEXT THREE YEARS TO MEET MARKET DEMAND (1) Dates reflect JBG SMITH’s estimate of third-party investment in National Landing. (2) The office component of 1770 Crystal Drive is 100% leased to Amazon. Amazon HQ2 Virginia Tech Innovation Campus Infrastructure Investments Potential JBG SMITH Multifamily Development Initial occupancy of leased assets Delivery of Metropolitan Park (2.1M SF of office) Campus opened in temporary space Construction start of new VRE station and Route 1 at grade Construction start of Pedestrian Bridge to DCA Construction start 12/31/20 Construction start of new Metro entrance at Crystal Drive Construction start of 1900 Crystal Drive (810 Units) 1st leased new delivery (1770 Crystal Drive)(2) Pen Place entitlement submission (2.8M SF of office + The Helix) Potential development of 3,100 multifamily units, including 1900 Crystal Drive |
DEMAND CATALYSTS IN NATIONAL LANDING: SEATTLE CASE STUDY 14 AMAZON DROVE SIGNIFICANT OFFICE AND RESIDENTIAL DEMAND NEAR ITS SEATTLE HEADQUARTERS OFFICE DEMAND 40K Amazon jobs created from 2010 - 2018, 5.5M+ SF of follow-on technology demand KEY AMAZON BUILDINGS KEY MULTIFAMILY DEVELOPMENTS MULTIFAMILY DEMAND 15,000+ apartments built around Amazon from 2011-2019 with 4%+ growth in starting rents for new buildings Source: Eastdil, CoStar |
15 DEMAND CATALYSTS IN NATIONAL LANDING: VIRGINIA TECH INNOVATION CAMPUS FIRST VIRTUAL CLASSES COMMENCED CONSTRUCTION ANTICIPATED VIRGINIA TECH INVESTMENT AT BUILDOUT INITIAL SF DEDICATED TO VIRGINIA TECH EXPECTED ANNUAL STEM MASTER'S DEGREES 2020 Q1 2021 $1B 675K SF 750 Virginia Tech Innovation Campus Potomac Yard Landbay G and H 1.9M SF Potomac River REAGAN NATIONAL AIRPORT New Metro Station ARLINGTON ALEXANDRIA AMAZON HQ2 JBGS DEVELOPMENT PIPELINE (POTOMAC YARD) |
DEMAND CATALYSTS IN NATIONAL LANDING: SMART CITY INITIATIVE 16 ACCELERATE 5G ROLLOUT AND OTHER CONNECTIVITY ENHANCEMENTS WITH BEST-IN-CLASS TECHNICAL PARTNERS |
SUBSTANTIAL GROWTH OPPORTUNITY: OPERATING PORTFOLIO 17 EXISTING OPERATING PORTFOLIO EXPECTED TO BENEFIT FROM NATIONAL LANDING GROWTH CATALYSTS OPERATING PORTFOLIO HIGHLIGHTS commercial portfolio 11.1M SF multifamily portfolio 5,999 units weighted average lease term (5.1 years in National Landing) 6.1 years leased across our In-Service portfolio 89.2% annualized NOI in Q4 2020 ($60.4M annualized COVID-19 impact)(1) $288.2M (1) Represents $15.1M decline in NOI for the three months ended December 31, 2020 that management believes to be attributable to the COVID-19 pandemic multiplied by four. Primarily driven by rent deferrals and reserves for credit losses, declines in same store multifamily NOI, parking revenue, and the Crystal City Marriott. Other VA 15% National Landing (VA) 57% DC 24% MD 4% Commercial 80% Multifamily 20% National Landing 57% Q4 2020 NOI BY REGION Q4 2020 NOI BY USE Other VA 15% National Landing (VA) 57% DC 24% MD 4% Commercial 80% Multifamily 20% National Landing 57% |
SUBSTANTIAL GROWTH OPPORTUNITY: RECENT DELIVERIES 18 1770 Crystal Drive Commercial National Landing Q4 2020 100% 98.3%(1) (1) Office portion of 1770 Crystal Drive is 100% leased to Amazon. USE: SUBMARKET: COMPLETION: OWNERSHIP: LEASED %: 7900 Wisconsin Avenue Multifamily Bethesda CBD Q1 2021 50.0% N/A 900 and 901 W Street Multifamily U Street/Shaw Q4 2019 100% 33.1% 1900 N Street Commercial DC CBD Q4 2019 55.0% 74.1% The Wren Multifamily U Street/Shaw Q2 2020 96.1% 55.6% 4747 Bethesda Avenue Commercial Bethesda CBD Q4 2019 100% 90.9% 5 RECENTLY DELIVERED 2 UNDER-CONSTRUCTION + Multifamily like-kind exchange with Pen Place land sale ($150M), which is expected to close in 2021 SIGNIFICANT NEAR-TERM NOI GROWTH DRIVEN BY DELIVERY AND STABILIZATION OF 7 NEW ASSETS |
SUBSTANTIAL GROWTH OPPORTUNITY: DEVELOPMENT PIPELINE 19 EXTENSIVE 15.6M SF DEVELOPMENT PIPELINE - 76% MULTIFAMILY IN ADDITION TO DEVELOPMENT, WE MAY UNLOCK VALUE THROUGH OPPORTUNISTIC ASSET SALES, GROUND LEASES, AND RECAPITALIZATIONS Oce 24% Near-Term Development 5.6M SF Multifamily 76% DEVELOPMENT PIPELINE COMPOSITION HOW ARE WE HARVESTING VALUE? Near-Term Development Pipeline could commence construction in the next three years 5.6M SF at 1900 Crystal Drive expected to commence construction in Q1 2021 810 units in National Landing will be sequenced to meet Amazon-driven demand 2,300 units Future Development Pipeline, for which we are furthering entitlements 10.0M SF |
SUBSTANTIAL GROWTH OPPORTUNITY: SHIFTING PORTFOLIO MIX 20 - 2,000,000 4,000,000 6,000,000 8,000,000 10,000,000 12,000,000 14,000,000 16,000,000 18,000,000 July 2017 Q3 2020 Square Footage Operating Commercial Operating Multifamily OPPORTUNISTICALLY SHIFT PORTFOLIO TO MAJORITY MULTIFAMILY OVER TIME 3 Acquire new multifamily units or development opportunities in target high-growth submarkets 1 Sell or recapitalize at least $1.5B of non-core assets 2 Embedded growth via our 15.6M SF Development Pipeline, of which 76% is multifamily HOW DO WE INTEND TO ACHIEVE THIS GOAL? PORTFOLIO MIX Q3 2017 2017 2020 77% 69% 23% 31% Q4 2020 2017 2020 77% 69% 23% 31% FUTURE 2017 future 77% 23% <50% At least 50% |
CAPITAL ALLOCATION 21 SINCE ITS INCEPTION, JBG SMITH HAS SOLD OR RECAPITALIZED NEARLY $1.6B OF ASSETS AT OR ABOVE NAV 3 New investments will be balanced with maintaining liquidity and prudent leverage Continued focus on office dispositions and monetizing land through ground leases to third-parties 2 1 Planned capital recycling of at least $1.5B of non-core assets CAPITAL RECYCLING ACTIVITY FUTURE CAPITAL RECYCLING EFFORTS Sales ($M) Spin - Q3 2020 - 200 400 600 800 1,000 1,200 1,400 1,600 1,800 $1.6B DC Office Suburban/ Non-Core Office Non-Income Producing Land(1) (1) Includes $150M related to land held for sale (Pen Place). |
ROBUST BALANCE SHEET 22 $1.7B OF LIQUIDITY TO WITHSTAND HEADWINDS AND CAPITALIZE ON INVESTMENT OPPORTUNITIES (1) Total Enterprise Value is based on the closing price per share of $31.27 as of December 31, 2020. (2) Adjusting for estimates of the amounts management believes to be attributable to the COVID-19 pandemic, we believe our Net Debt/Annualized Adjusted EBITDA would have been 6.5x. On a trailing 12-month basis, our Net Debt/Adjusted EBITDA was 8.4x. DEBT MATURITY SCHEDULE TOTAL ENTERPRISE VALUE Net Debt/Total Enterprise Value: 32.0%(1) Net Debt/Annualized Adjusted EBITDA: 9.2x(2) Fixed Rate Debt: 58.5% Secured Debt: 83.4% LEVERAGE METRICS balance sheet Secured Debt 26.6% Term Loan 5.4% Equity 68.0% Cash: $241.1M Undrawn Credit Facility: $1B Estimated Multifamily Borrowing Capacity: $503M TOTAL LIQUIDITY OF $1.7B Secured Debt Term Loans $237M $178M $131M $679M $36M $253M $200M $200M $103M 2021 2022 2023 2024 2025 2026 2027 $385M 2028 + Weighted Avg. Cost of Debt: 3.2% |
ATTRACTIVE ENTRY POINT INTO JBG SMITH 23 -19.1% -31.3% -0.2% Performance vs. O ce Sector and Multifamily Sector Peers From November 13, 2018 – October 30, 2020 Cumulative Performance vs. O ce and Multifamily Peers Notes: 1. Includes BXP, DEI, ESRT, KRC, PGRE, SLG, VNO, WRE 2. Includes AVB, CPT, EQR, MAA, UDR -50.0% -30.0% -10.0% 10.0% 30.0% Nov-18 Apr-19 Sep-19 Feb-20 Jul-20 JBGS O ce Peers Multifamily Peers Dec-20 (1) (2) Source: SNL Financial 2/21/2020: COVID-19 continues to spread outside of China triggering sharp global equity market declines 4/15/2019: JBGS completes follow-on equity oŸering for $472M ($42/share) 11/13/2018: Amazon announces its HQ2 will be located in National Landing SIGNIFICANT UPSIDE POTENTIAL FROM NEAR-TERM NOI GROWTH, RECESSION- RESISTANT DEMAND CATALYSTS, AND SHIFTING PORTFOLIO MIX TO MULTIFAMILY Source: SNL Financial (through 12/31/20) (1) Includes BXP, DEI, ESRT, KRC, PGRE, SLG, VNO, WRE. (2) Includes AVB, CPT, EQR, MAA, UDR. JBG SMITH SHARE PRICE PERFORMANCE VS. OFFICE SECTOR AND MULTIFAMILY SECTOR PEERS |
APPENDIX |
JBG SMITH AT A GLANCE 25 1900 N Street 11.1M 274K 5.6M SF 5,999 161 COMMERCIAL SF COMMERCIAL SF MULTIFAMILY UNITS MULTIFAMILY UNITS OPERATING PORTFOLIO UNDER-CONSTRUCTION NEAR-TERM DEVELOPMENT 10.0M SF FUTURE DEVELOPMENT PIPELINE 83 9.2x NET DEBT/ANNUALIZED ADJUSTED EBITDA(2) WALK SCORE 97% 32.0% NET DEBT/TOTAL ENTERPRISE VALUE(1) METRO-SERVED $6.7B TOTAL ENTERPRISE VALUE(1) 6.1 YEARS WEIGHTED AVERAGE LEASE TERM (1) Total Enterprise Value is based on the closing price per share of $31.27 as of December 31, 2020. (2) Adjusting for estimates of the amounts management believes to be attributable to the COVID-19 pandemic, we believe our Net Debt/Annualized Adjusted EBITDA would have been 6.5x. On a trailing 12-month basis,our Net Debt/Adjusted EBITDA was 8.4x. |
Q4 2020 OPERATING COMMERCIAL PORTFOLIO PERFORMANCE 26 COVID-19 DRIVEN INCOME STREAM DECLINES PARTIALLY OFFSET BY THE BURN OFF OF FREE RENT LEASE EXPIRATION SCHEDULE(1) Q4 2020 PERFORMANCE COMMERCIAL PORTFOLIO MIX(2) (1) Excludes lease extension options, except where reasonably certain. (2) Based on Operating and Under-Construction SF. COMMERCIAL NOI BY REGION Weighted Average Annual % Expiring Over Next 5 Years– 9.6% Weighted Average Lease Term – 6.1 years DC 4% Under-Construction 2% Trophy 10% Class A 16% Class B 72% DC 12% MD 3% DC 21% VA 76% National Landing DC Commodity A Other - 500 1,000 1,500 2,000 2,500 3,000 3,500 2021 2022 2023 2024 2025 2026 2027 2028 Thereafter Square Feet (Thousands) · Generated $231.6M of Annualized NOI in Q4 2020 versus $245.8M in Q4 2019 · Decline primarily due to rent deferrals and reserves for credit losses, decline in parking revenue, and decline in NOI from the Crystal City Marriott · Partially offset by the burn off of free rent across the commercial portfolio · 88.1% leased and 87.7% occupied · Rent collections of 98.6% for office and 72.6% for retail, consistent with Q3 2020 |
Q4 2020 OPERATING MULTIFAMILY PORTFOLIO PERFORMANCE 27 WHILE MARKET DEMAND REMAINS BELOW PRE-PANDEMIC LEVELS, RECOGNIZED OCCUPANCY GAINS IN Q4 2020 · Generated $56.6M of Annualized NOI in Q4 2020 versus $82.4M in Q4 2019 · Decline primarily due to lower occupancy, lower net effective rents, higher operating expenses, and retail rent deferrals and reserves for credit losses · 86.5% leased and 81.1% occupied; excluding recently delivered multifamily assets, 91.3% leased and 87.8% occupied · Excluding West Half (49.2% occupied at year end), the In-Service portfolio is 91.5% occupied, up 340 bps from Q3 2020 · Rent collections of 98.7%, consistent with Q3 2020 · Weighted average portfolio Walk Score is 86 versus 66 for public peer average(1) MULTIFAMILY NOI BY REGION DC 36% VA 55% MD 9% Q4 2018 Multifamily NOI by Region (1) Walk Score includes DC area Operating and Under-Construction assets for EQR, AVB, UDR, CPT, MAA, and WRE. (2) Based on Operating and Under-Construction SF. MULTIFAMILY PORTFOLIO MIX(2) Under-Construction 3% Class A 65% Class B 32% Q4 2020 PERFORMANCE |
4Q20 OFFICE MARKET DELIVERY PIPELINE 28 Total Under Construction: 6.1M 3.0M 3.1M 0.0 1.0 2.0 3.0 4.0 5.0 6.0 2014 2015 2016 2017 2018 2019 2020 2021 2022 Square Feet (M) Delivered as of Q4 2020 Under Construction as of Q4 2020 OFFICE DELIVERIES ARE SLOWING IN THE NEAR-TERM, WITH NO NEW STARTS IN Q4 2020 Source: JLL OFFICE NEW CONSTRUCTION PIPELINE 3.7M 1.2M 1.8M 3.2M 5.0M 3.6M 3.9M 3.0M 3.1M |
OFFICE FUNDAMENTALS – 4Q19 VS. 4Q20 29 VACANCY HAS INCREASED IN ALL JURSIDCTIONS THROUGHOUT 2020, RESULTING IN METRO-WIDE NEGATIVE ABSORPTION OF 5.2M SF Source: JLL (1) Reflects "direct" metrics (excludes subleased space). (2) Total Vacancy includes sublease and direct vacancy. -414 -1,281 -462 -1,507 -998 -2,427 -5,215 -1,874 -2,500 -2,000 -1,500 -1,000 -500 0 Q4 2020 2020 YTD Absorption (Thousands SF) DC MD NoVa DC MD NoVa 0.3% 0.0% -0.2% 0.3% -0.2% 0.4% -1.0% -0.5% 0.0% 0.5% 1.0% 1.5% 2.0% Q3 2020 - Q4 2020 Q4 2019 - Q4 2020 Rent Growth (%) 0.8% 0.6% 2.9% 2.5% 1.1% 0.9% 2.4% 1.9% 0.0% 0.5% 1.0% 1.5% 3.0% 2.0% 2.5% Q3 2020 - Q4 2020 Q4 2019 - Q4 2020 Vacancy Change (%) DC MD NoVa Total Vacancy(2) 0.9% 0.8% 2.2% 1.7% -4,000 -3,500 -3,000 -5,000 -4,500 -6,000 -5,500 OFFICE VACANCY CHANGE(1) OFFICE TOTAL NET ABSORPTION OFFICE RENT GROWTH(1) |
OFFICE INVESTMENT SALES 30 WHILE SALES VOLUME WAS DOWN SIGNIFICANTLY, TRANSACTIONS WERE EVENLY DISTRIBUTED THROUGHOUT 2020 Source: JLL $4.0 $5.1 $2.9 $4.6 $4.6 $4.1 $1.7 $0.3 $0.7 $1.9 $1.2 $0.9 $1.5 $0.5 $2.0 $3.1 $2.0 $3.2 $2.5 $3.1 $2.0 $0.0 $1.0 $2.0 $3.0 $4.0 $5.0 $6.0 $7.0 $8.0 $9.0 $10.0 2014 2015 2016 2017 2018 2019 2020 YTD Sales Volume ($B) DC Total Sales MD Total Sales NoVa Total Sales $6.2B $8.8B $6.8B $9.0B $8.1B $8.8B $4.2B DC METRO OFFICE SALES VOLUME 20% of Volume Transacted in Q4 2020 |
MULTIFAMILY PIPELINE 31 WITH UNDER 800 UNITS COMMENCING CONSTRUCTION IN Q4 2020, THE SHRINKING PIPELINE HAS BEEN COMPOUNDED BY PANDEMIC-DRIVEN DELAYS MULTIFAMILY DELIVERY PIPELINE 0 2,000 4,000 6,000 8,000 10,000 12,000 14,000 16,000 2017 2018 2019 2020 2021 2022 2023 Units Delivered as of Q4 2020 Under Construction as of Q4 2020 New Starts as of Q4 2020 12,985 9,041 10,205 9,414 6,339 435 6,708 69 4,285 270 6,774 6,777 4,555 Source: CoStar |
MULTIFAMILY FUNDAMENTALS – 4Q19 VS. 4Q20 32 CONTINUED DECLINES IN BOTH CLASS A AND CLASS B OCCUPANCIES ARE DRIVING MARKET-WIDE DECLINES IN ASKING RENTS Class A Class B -9.0% -8.0% -7.0% -6.0% -5.0% -4.0% -3.0% -2.0% -1.0% 0.0% Q2 2020 - Q4 2020 Q4 2019 - Q4 2020 Q2 2020 - Q4 2020 Q4 2019 - Q4 2020 Occupancy Change (%) Class A Class B -9.0% -8.0% -7.0% -6.0% -5.0% -4.0% -3.0% -2.0% -1.0% 0.0% Rent Growth (%) SAME STORE AVG. OCCUPANCY CHANGE SAME STORE AVG. ASKING RENT GROWTH -0.2% -3.0% -1.4% -9.0% -7.7% -1.6% -3.4% -0.8% Source: CoStar Note: Same Store submarkets include U St-Shaw-Howard U-LC, Bethesda-Chevy Chase, Silver Spring, Rockville-North Bethesda, Crystal City-Pentagon City, RTC, Reston, Navy Yard-Capitol Riverfront, H St-Eck-NoMa-UM-Near NE, West End-Dupont Circle, Takoma-Brookland-Brightwood-FT, SW/Wharf, RB Corridor, Old Town, Tysons Corner, and Potomac Yard. Outlier asset (The Sedgewick) removed from analysis (rent growth of 30%). |
MULTIFAMILY INVESTMENT SALES 33 DESPITE THE PANDEMIC, SALES VOLUME WAS LARGELY CONSISTENT WITH LEVELS PRIOR TO 2019, A PARTICULARLY STRONG YEAR FOR SALES Source: CoStar DC Total Sales MD Total Sales NoVa Total Sales $0.9 $1.1 $0.3 $0.5 $0.5 $0.9 $0.3 $1.0 $1.9 $2.1 $0.8 $1.2 $2.1 $0.8 $0.9 $4.1 $1.3 $3.3 $2.3 $4.0 $2.6 $0.0 $1.0 $2.0 $3.0 $4.0 $5.0 $6.0 $7.0 $8.0 2014 2015 2016 2017 2018 2019 2020 YTD Sales Volume ($B) $2.8B $7.2B $3.7B $4.5B $4.0B $7.0B $3.7B DC METRO MULTIFAMILY SALES VOLUME 55% of Volume Transacted in Q4 2020 |
COMMITMENT TO ESG BEST PRACTICES 34 4 Built a replicable model that can be used by other communities 1 Launched the Washington Housing Initiative (WHI) in 2018 to build or maintain up to 3,000 units of affordable workforce housing ALIGNED BUSINESS PRACTICES WITH RESPONSIBLE DEVELOPMENT AND SUSTAINABLE GROWTH AFFORDABLE HOUSING SUSTAINABILITY 2020 GLOBAL SECTOR LEADER Diversified Office Residential 5–STAR Rating 3 Financed the acquisition of Crystal House (825 units) in December 2020, through WHI in partnership with Amazon Raised $114M for the WHI Impact Pool to date, which has financed approximately 1,150 units of affordable workforce housing 2 |
MANAGEMENT AND BOARD OF TRUSTEES UPDATE PHYLLIS CALDWELL Independent Trustee 35 WE ARE PLEASED TO ANNOUNCE THREE PROMOTIONS TO OUR LEADERSHIP TEAM AND WELCOME A NEW TRUSTEE TO OUR BOARD MOINA BANERJEE Chief Financial Officer GEORGE XANDERS Chief Investment Officer CAREY GOLDBERG Chief Human Resources Officer Note: Executive promotions to our leadership team occurred on January 1, 2021. Ms. Caldwell will join JBG SMITH's Board of Trustees effective March 1, 2021. |
DISCLOSURES 36 DEFINITIONS DEVELOPMENT PIPELINE "Development pipeline" refers to the near-term development pipeline and future development pipeline. EARNINGS BEFORE INTEREST, TAXES, DEPRECIATION AND AMORTIZATION ("EBITDA"), EBITDA FOR REAL ESTATE ("EBITDARE") AND "ADJUSTED EBITDA" Earnings Before Interest, Taxes, Depreciation and Amortization ("EBITDA"), EBITDA for Real Estate ("EBITDAre") and "Adjusted EBITA" are non-GAAP financial measures. EBITDA and EBITDAre are used by management as supplemental operating performance measures, which we believe help investors and lenders meaningfully evaluate and compare our operating performance from period-to-period by removing from our operating results the impact of our capital structure (primarily interest charges from our outstanding debt and the impact of our interest rate swaps) and certain non-cash expenses (primarily depreciation and amortization on our assets). EBITDAre is computed in accordance with the definition established by NAREIT. NAREIT defines EBITDAre as GAAP net income (loss) adjusted to exclude interest expense, income taxes, depreciation and amortization expenses, gains and losses on sales of real estate and impairment write-downs of certain real estate assets and investments in entities when the impairment is directly attributable to decreases in the value of depreciable real estate held by the entity, including our share of such adjustments of unconsolidated real estate ventures. These supplemental measures may help investors and lenders understand our ability to incur and service debt and to make capital expenditures. EBITDA and EBITDAre are not substitutes for net income (loss) (computed in accordance with GAAP) and may not be comparable to similarly titled measures used by other companies. Adjusted EBITDA represents EBITDAre adjusted for items we believe are not representative of ongoing operating results, such as transaction and other costs, impairment write-downs of right-of-use assets associated with leases in which we are a lessee, gain (loss) on the extinguishment of debt, distributions in excess of our investment in unconsolidated real estate ventures, lease liability adjustments and share-based compensation expense related to the Formation Transaction and special equity awards. We believe that adjusting such items not considered part of our comparable operations, provides a meaningful measure to evaluate and compare our performance from period-to-period. Because EBITDA, EBITDAre and Adjusted EBITDA have limitations as analytical tools, we use EBITDA, EBITDAre and Adjusted EBITDA to supplement GAAP financial measures. Additionally, we believe that users of these measures should consider EBITDA, EBITDAre and Adjusted EBITDA in conjunction with net income (loss) and other GAAP measures in understanding our operating results. A reconciliation of net income (loss) to EBITDA, EBITDAre and Adjusted EBITDA is presented on page 40. ESTIMATED POTENTIAL DEVELOPMENT DENSITY "Estimated potential development density" reflects management's estimate of developable gross square feet based on our current business plans with respect to real estate owned or controlled as of December 31, 2020. Our current business plans may contemplate development of less than the maximum potential development density for individual assets. As market conditions change, our business plans, and therefore, the Estimated Potential Development Density, could change accordingly. Given timing, zoning requirements and other factors, we make no assurance that estimated potential development density amounts will become actual density to the extent we complete development of assets for which we have made such estimates. FORMATION TRANSACTION "Formation Transaction" refers collectively to the spin-off on July 17, 2017 of substantially all of the assets and liabilities of Vornado Realty Trust's Washington, DC segment, which operated as Vornado / Charles E. Smith, and the acquisition of the management business and certain assets and liabilities of The JBG Companies. FREE RENT "Free rent" means the amount of base rent and tenant reimbursements that are abated according to the applicable lease agreement(s). FUTURE DEVELOPMENT PIPELINE "Future development pipeline" refers to assets that are development opportunities on which we do not intend to commence construction within the next three years where we (i) own land or control the land through a ground lease or (ii) are under a long-term conditional contract to purchase, or enter into a leasehold interest with respect to land. |
DISCLOSURES 37 DEFINITIONS GAAP "GAAP" means United States generally accepted accounting principles. IN-SERVICE "In-service" refers to commercial or multifamily assets that are at or above 90% leased or have been operating and collecting rent for more than 12 months as of December 31, 2020. JBG SMITH SHARE "JBG SMITH share" refers to our ownership percentage of consolidated and unconsolidated assets in real estate ventures. METRO-SERVED "Metro-served" means locations, submarkets or assets that are within walking distance of a Metro station, defined as being within 0.5 miles of an existing or planned Metro station. NEAR-TERM DEVELOPMENT PIPELINE "Near-term development pipeline" refers to select assets that have the potential to commence construction over the next three years, subject to receipt of full entitlements, completion of design and market conditions. NET OPERATING INCOME ("NOI"), "ANNUALIZED NOI", "ADJUSTED ANNUALIZED NOI", "ESTIMATED STABILIZED NOI" AND "PROJECTED NOI YIELD" Net Operating Income ("NOI"), "Annualized NOI", "Adjusted Annualized NOI", "Estimated Stabilized NOI" and "Projected NOI Yield" are non-GAAP financial measures management uses to assess a segment's performance. The most directly comparable GAAP measure is net income (loss) attributable to common shareholders. We use NOI internally as a performance measure and believe NOI provides useful information to investors regarding our financial condition and results of operations because it reflects only property related revenue (which includes base rent, tenant reimbursements and other operating revenue, net of free rent and payments associated with assumed lease liabilities) less operating expenses and ground rent, if applicable. NOI also excludes deferred rent, related party management fees, interest expense, and certain other non-cash adjustments, including the accretion of acquired below-market leases and amortization of acquired above-market leases and below-market ground lease intangibles. Management uses NOI as a supplemental performance measure for our assets and believes it provides useful information to investors because it reflects only those revenue and expense items that are incurred at the asset level, excluding non-cash items. In addition, NOI is considered by many in the real estate industry to be a useful starting point for determining the value of a real estate asset or group of assets. However, because NOI excludes depreciation and amortization and captures neither the changes in the value of our assets that result from use or market conditions, nor the level of capital expenditures and capitalized leasing commissions necessary to maintain the operating performance of our assets, all of which have real economic effect and could materially impact the financial performance of our assets, the utility of NOI as a measure of the operating performance of our assets is limited. NOI presented by us may not be comparable to NOI reported by other REITs that define these measures differently. We believe that to facilitate a clear understanding of our operating results, NOI should be examined in conjunction with net income (loss) attributable to common shareholders as presented in our financial statements. NOI should not be considered as an alternative to net income (loss) attributable to common shareholders as an indication of our performance or to cash flows as a measure of liquidity or our ability to make distributions. Annualized NOI, for all assets except Crystal City Marriott, represents NOI for the three months ended December 31, 2020 multiplied by four. Due to seasonality in the hospitality business, annualized NOI for Crystal City Marriott represents the trailing 12 month NOI as of December 31, 2020. Management believes Annualized NOI provides useful information in understanding our financial performance over a 12 month period, however, investors and other users are cautioned against attributing undue certainty to our calculation of Annualized NOI. Actual NOI for any 12 month period will depend on a number of factors beyond our ability to control or predict, including general capital markets and economic conditions, any bankruptcy, insolvency, default or other failure to pay rent by one or more of our tenants and the destruction of one or more of our assets due to terrorist attack, natural disaster or other casualty, among others. We do not undertake any obligation to update our calculation to reflect events or circumstances occurring after the date of this earnings release. There can be no assurance that the annualized NOI shown will reflect our actual results of operations over any 12 month period. |
DEFINITIONS 38 We also report adjusted annualized NOI which includes signed but not yet commenced leases and incremental revenue from recently delivered assets assuming stabilization. While we believe adjusted annualized NOI provides useful information regarding potential future NOI from our assets, it does not account for any decrease in NOI for lease terminations, defaults or other negative events that could affect NOI and therefore, should not be relied upon as indicative of future NOI. This Investor Package also contains management's estimate of stabilized NOI and projections of NOI yield for under-construction and near-term development pipeline assets, which are based on management's estimates of property-related revenue and operating expenses for each asset. These estimates are inherently uncertain and represent management's plans, expectations and beliefs and are subject to numerous assumptions, risks and uncertainties. The property-related revenues and operating expenses for our assets may differ materially from the estimates included in this Investor Package. Management's projections of NOI yield are not projections of our overall financial performance or cash flow, and there can be no assurance that the projected NOI yield set forth in this Investor Package will be achieved. Projected NOI yield means our estimated stabilized NOI reported as a percentage of (i) estimated total project costs, (ii) estimated total investment and (iii) estimated incremental investment. Actual initial full year stabilized NOI yield may vary from the projected NOI yield based on the actual incremental investment to complete the asset and its actual initial full year stabilized NOI, and there can be no assurance that we will achieve the projected NOI yields described in this Investor Package. We do not provide reconciliations for non-GAAP estimates on a future basis, including adjusted annualized NOI and estimated stabilized NOI because it is unable to provide a meaningful or accurate calculation or estimate of reconciling items and the information is not available without unreasonable effort. This inability is due to the inherent difficulty of forecasting the timing and/or amounts of various items that would impact net income (loss). Additionally, no reconciliation of projected NOI yield to the most directly comparable GAAP measure is included in this Investor Package because we are unable to quantify certain amounts that would be required to be included in the comparable GAAP financial measures without unreasonable efforts because such data is not currently available or cannot be currently estimated with confidence. Accordingly, we believe such reconciliations would imply a degree of precision that would be confusing or misleading to investors. NON-SAME STORE "Non-same store" refers to all operating assets excluded from the same store pool. PERCENT LEASED "Percent leased" is based on leases signed as of December 31, 2020, and is calculated as total rentable square feet less rentable square feet available for lease divided by total rentable square feet expressed as a percentage. Out-of-service square feet are excluded from this calculation. PERCENT PRE-LEASED "Percent pre-leased" is based on leases signed as of December 31, 2020, and is calculated as the estimated rentable square feet leased divided by estimated total rentable square feet expressed as a percentage. PERCENT OCCUPIED "Percent occupied" is based on occupied rentable square feet/units as of December 31, 2020, and is calculated as (i) for office and retail space, total rentable square feet less unoccupied square feet divided by total rentable square feet, (ii) for multifamily space, total units less unoccupied units divided by total units, expressed as a percentage. Out-of-service square feet and units are excluded from this calculation. RECENTLY DELIVERED "Recently delivered" refers to commercial and multifamily assets that are below 90% leased and have been delivered within the 12 months ended December 31, 2020. SAME STORE "Same store" refers to the pool of assets that were in-service for the entirety of both periods being compared, except for assets for which significant redevelopment, renovation, or repositioning occurred during either of the periods being compared. |
DEFINITIONS 39 SQUARE FEET OR "SF" "Square feet" or "SF" refers to the area that can be rented to tenants, defined as (i) for commercial assets, rentable square footage defined in the current lease and for vacant space the rentable square footage defined in the previous lease for that space, (ii) for multifamily assets, management's estimate of approximate rentable square feet, (iii) for under-construction assets management's estimate of approximate rentable square feet based on current design plans as of December 31, 2020, and (iv) for near-term and future development pipeline assets, management's estimate of developable gross square feet based on its current business plans with respect to real estate owned or controlled as of December 31, 2020. TRANSACTION AND OTHER COSTS "Transaction and other costs" include fees and expenses incurred for the relocation of our corporate headquarters, demolition costs, integration and severance costs, pursuit costs related to other completed, potential and pursued transactions, as well as other expenses. UNDER-CONSTRUCTION "Under-construction" refers to assets that were under construction during the three months ended December 31, 2020. |
DISCLOSURES 40 EBITDA, EBITDAre AND ADJUSTED EBITDA (NON-GAAP) (UNAUDITED) Note: All EBITDA measures as shown above are attributable to common limited partnership units (“OP Units”). (1) Interest expense includes the amortization of deferred financing costs and the ineffective portion of any interest rate swaps or caps, net of capitalized interest. (2) In connection with the preparation and review of our 2020 annual financial statements, we determined that a commercial asset was impaired due to a decline in the fair value of the asset and recorded an impairment loss of $10.2 million, of which $7.8 million was related to real estate. The remaining $2.4 million of the impairment loss was attributable to the right-of-use asset associated with the property’s ground lease. (3) During the second quarter of 2020, we determined that our investment in the venture that owns The Marriott Wardman Park hotel was impaired due to a decline in the fair value of the underlying asset and recorded an impairment charge of $6.5 million, which reduced the net book value of our investment to zero, and we suspended equity loss recognition for the venture after June 30, 2020. On October 1, 2020, we transferred our interest in this venture to our former venture partner. (4) Includes demolition costs, integration and severance costs, pursuit costs related to other completed, potential and pursued transactions, as well as other expenses. For the year ended December 31, 2020, includes a charitable commitment of $4.0 million to the Washington Housing Conservancy, a non-profit that acquires and owns affordable workforce housing in the Washington DC metropolitan region. (5) During the year ended December 31, 2019, we received distributions of $6.4 million from 1101 17th Street. (6) Quarterly adjusted EBITDA is annualized by multiplying by four calculated using Net Debt below. (7) During the fourth quarter, Adjusted EBITDA decreased 25.3% to $58.0 million as compared to the fourth quarter of 2019. Adjusted EBITDA was negatively impacted by an estimated $24.0 million that management believes to be attributable to the COVID-19 pandemic, which includes the $15.1 million decline in NOI noted on page 41 and $8.9 million of straight-line rent reserves, partially offset by income associated with certain lease guarantees. Adjusting for the impact of COVID-19, we believe our Net Debt to Annualized Adjusted EBITDA would have been 6.5x. (8) Net of premium/discount and deferred financing costs. dollars in thousands Three Months Ended December 31, Year Ended December 31, 2020 2019 2020 2019 EBITDA, EBITDAre and Adjusted EBITDA Net income (loss) $ (50,168) $ 38,692 $ (67,261) $ 74,144 Depreciation and amortization expense 64,170 50,004 221,756 191,580 Interest expense (1) 17,661 11,831 62,321 52,695 Income tax benefit (544) (613) (4,265) (1,302) Unconsolidated real estate ventures allocated share of above adjustments 10,072 10,050 41,588 36,877 EBITDA attributable to noncontrolling interests in consolidated real estate ventures (2) (2) (9) (7) EBITDA $ 41,189 $ 109,962 $ 254,130 $ 353,987 Gain on sale of real estate — (57,870) (59,477) (104,991) (Gain) loss on sale of unconsolidated real estate assets (826) — 2,126 (335) Real estate impairment loss (2) 7,805 — 7,805 — Impairment of investment in unconsolidated real estate venture (3) — — 6,522 — EBITDAre $ 48,168 $ 52,092 $ 211,106 $ 248,661 Transaction and other costs (4) 1,144 13,307 8,670 23,235 Impairment loss (2) 2,427 — 2,427 Loss on extinguishment of debt 29 3,916 62 5,805 Share-based compensation related to Formation Transaction and special equity awards 6,246 11,959 31,678 42,162 Losses and distributions in excess of our investment in unconsolidated real estate venture (5) (152) (518) (459) (7,356) Lease liability adjustments — (1,829) — 162 Unconsolidated real estate ventures allocated share of above adjustments 90 (1,345) 1,555 (1,345) Adjusted EBITDA $ 57,952 $ 77,582 $ 255,039 $ 311,324 Net Debt to Annualized Adjusted EBITDA (6) (7) 9.2 x 5.8x 8.4 x 5.8x December 31, 2020 December 31, 2019 Net Debt (at JBG SMITH Share) Consolidated indebtedness (8) $ 1,985,061 $ 1,620,001 Unconsolidated indebtedness (8) 395,550 329,056 Total consolidated and unconsolidated indebtedness 2,380,611 1,949,057 Less: cash and cash equivalents 241,066 136,200 Net Debt (at JBG SMITH Share) $ 2,139,545 $ 1,812,857 |
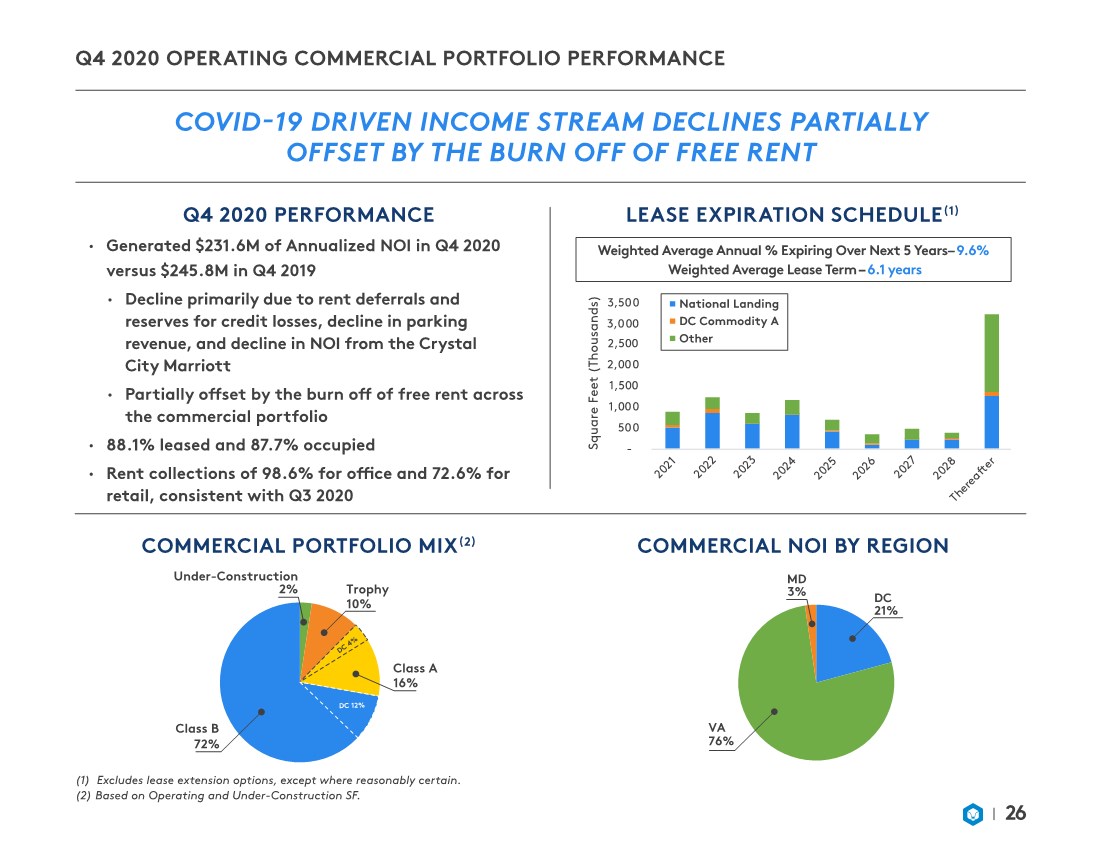
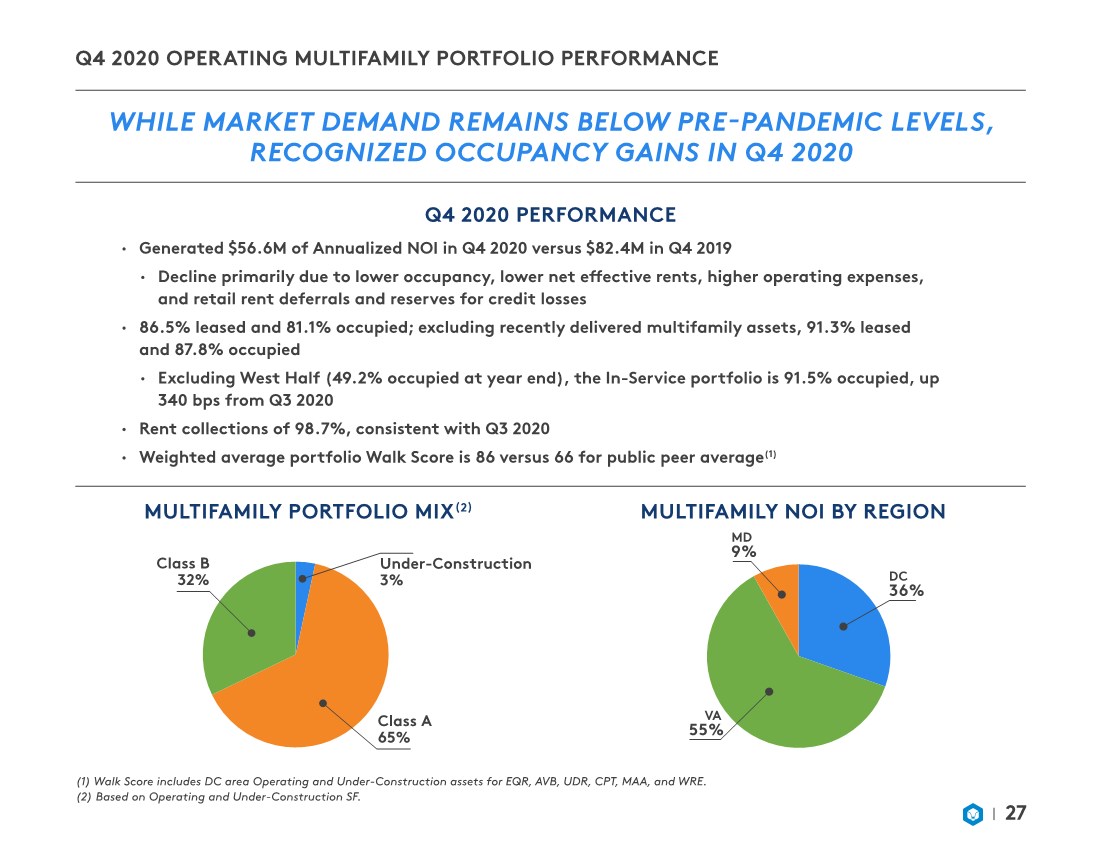
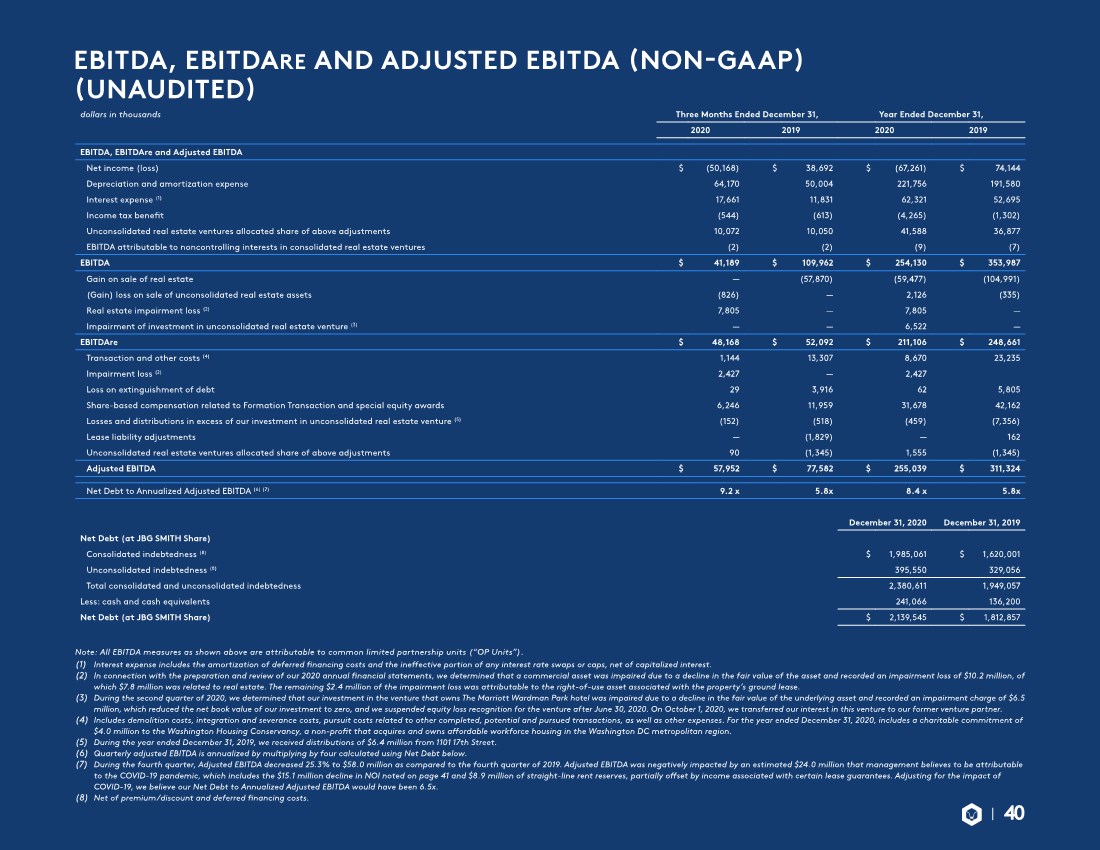
DISCLOSURES 41 NOI RECONCILIATIONS (NON-GAAP) (UNAUDITED) (1) Adjustment to exclude straight-line rent, above/below market lease amortization and lease incentive amortization. (2) Adjustment to include other revenue and payments associated with assumed lease liabilities related to operating properties and to exclude commercial lease termination revenue and allocated corporate general and administrative expenses to operating properties. (3) Includes the results of our Under-Construction assets, and Near-Term and Future Development Pipelines. (4) During the fourth quarter, NOI for our operating portfolio decreased 13.1% to $71.8 million as compared to the fourth quarter of 2019. NOI was negatively impacted by an estimated $15.1 million that management believes to be attributable to the COVID-19 pandemic, comprising $3.7 million of reserves and rent deferrals for office and retail tenants, a $5.8 million decline in NOI in our same store multifamily assets, a $3.9 million decline in parking revenue, and a $1.7 million decline in NOI from the Crystal City Marriott. The $3.7 million of reserves and rent deferrals for office and retail tenants that impacted NOI include (i) $2.1 million of rent deferrals, (ii) $1.8 million of rent deferrals from expected lease modifications, and (iii) $1.2 million of other reserves, partially offset by $1.4 million we collected from Parking Management Inc, a parking operator who filed for bankruptcy protection during the second quarter of 2020. (5) Includes the results of properties that were not in-service for the entirety of both periods being compared and properties for which significant redevelopment, renovation or repositioning occurred during either of the periods being compared. (6) Includes the results of properties that are owned, operated and in-service for the entirety of both periods being compared except for properties that are being phased out of service for future development. dollars in thousands Three Months Ended December 31, Year Ended December 31, 2020 2019 2020 2019 Net income (loss) attributable to common shareholders $ (45,655) $ 34,390 $ (62,303) $ 65,571 Add: Depreciation and amortization expense 64,170 50,004 221,756 191,580 General and administrative expense: Corporate and other 9,156 11,934 46,634 46,822 Third-party real estate services 28,569 26,910 114,829 113,495 Share-based compensation related to Formation Transaction and special equity awards 6,246 11,959 31,678 42,162 Transaction and other costs 1,144 13,307 8,670 23,235 Interest expense 17,661 11,831 62,321 52,695 Loss on extinguishment of debt 29 3,916 62 5,805 Impairment loss 10,232 — 10,232 — Income tax benefit (544) (613) (4,265) (1,302) Net income (loss) attributable to redeemable noncontrolling interests (4,513) 4,302 (4,958) 8,573 Less: Third-party real estate services, including reimbursements revenue 30,069 29,121 113,939 120,886 Other revenue 9,934 1,686 15,372 7,638 Loss from unconsolidated real estate ventures, net (3,194) (2,042) (20,336) (1,395) Interest and other income (loss), net (1,646) 3,022 (625) 5,385 Gain on sale of real estate — 57,870 59,477 104,991 Consolidated NOI 51,332 78,283 256,829 311,131 NOI attributable to unconsolidated real estate ventures at our share 7,521 6,052 27,693 21,797 Non-cash rent adjustments (1) 15,433 (8,465) 5,535 (34,359) Other adjustments (2) (3,284) 3,913 6,058 13,979 Total adjustments 19,670 1,500 39,286 1,417 NOI $ 71,002 $ 79,783 $ 296,115 $ 312,548 Less: out-of-service NOI loss (3) (801) (2,817) (5,789) (7,013) Operating Portfolio NOI (4) $ 71,803 $ 82,600 $ 301,904 $ 319,561 Non-same store NOI (5) 1,174 3,635 14,028 18,706 Same store NOI (6) $ 70,629 $ 78,965 $ 287,876 $ 300,855 Change in same store NOI (10.6)% (4.3)% Number of properties in same store pool 54 52 |