Exhibit 99.2
| Investor presentation August 2021 2001 South Bell Street Rendering |

| disclosures Forward-Looking Statements Certain statements contained herein may constitute “forward-looking statements” as such term is defined in Section 27A of the Securities Act of 1933, as amended, and Section 21E of the Securities Exchange Act of 1934, as amended. Forward-looking statements are not guarantees of performance. They represent our intentions, plans, expectations and beliefs and are subject to numerous assumptions, risks and uncertainties. Consequently, the future results of JBG SMITH Properties (“JBG SMITH”, the “Company”, “we”, “us”, “our” or similar terms) may differ materially from those expressed in these forward-looking statements. You can find many of these statements by looking for words such as “approximate”, “hypothetical”, “potential”, “believes”, “expects”, “anticipates”, “estimates”, “intends”, “plans”, “would”, “may” or similar expressions in this Investor Presentation. Currently, one of the most significant factors that could cause actual outcomes to differ materially from our forward-looking statements is the adverse effect of the current pandemic of the novel coronavirus, or COVID-19, on our financial condition, results of operations, cash flows, liquidity, performance, tenants, the real estate market and the global economy and financial markets. The extent to which the COVID-19 pandemic continues to impact us and our tenants depends on future developments, many of which are highly uncertain and cannot be predicted with confidence, including the scope, severity, and duration of the pandemic, the actions taken to contain the pandemic or mitigate its impact, the direct and indirect economic effects of the pandemic and containment measures, and whether the residential market in the Washington, DC region and any of our properties will be materially impacted by the expiration of various moratoriums on residential evictions, among others. Moreover, investors are cautioned to interpret many of the risks identified under the section titled “Risk Factors” in our Annual Report on Form 10-K for the fiscal year ended December 31, 2020 as being heightened as a result of the ongoing and numerous adverse impacts of the COVID-19 pandemic. We also note the following may impact our forward-looking statements: the impact of COVID-19 and the ensuing economic turmoil on our Company, net operating income, same store net operating income, net asset value, stock price, occupancy rates, revenue from our multifamily and commercial portfolios, operating costs, deferrals of rent, uncollectable operating lease receivables, parking revenue, and burn-off of rent abatement; the impact of disruptions to the credit and capital markets on our ability to access capital, including refinancing maturing debt; changes to the amount and manner in which tenants use space; whether we will harvest the anticipated value of our development pipeline; whether we incur additional costs or make additional concessions or offer other incentives to existing or prospective tenants to reconfigure space; whether the Washington, DC region will be more resilient than other parts of the country in any recession resulting from COVID-19 and whether DC metro asking rents will be more resilient than those in other gateway markets; our annual dividend per share and dividend yield; annualized net operating income; whether our future capital recycling efforts will be successful and will be at or above NAV; whether in the case of our under-construction assets, estimated square feet, estimated number of units and in the case of our near-term and future development assets, estimated potential development density are accurate; expected key Amazon.com, Inc. (“Amazon“) transaction terms and timeframes for closing any Amazon transactions not yet closed; the amount and timing of planned infrastructure and educational improvements related to Amazon’s additional headquarters and the Virginia Tech Innovation Campus; the economic impact, job growth and related demand for multifamily and commercial properties of Amazon’s additional headquarters on the DC region and National Landing and the speed with which such impact occurs and Amazon’s plans for accelerated hiring and in-person work requirements; the impact of our role as the exclusive developer, property manager and retail leasing agent in connection with Amazon’s new headquarters; our development plans related to Amazon’s additional headquarters; whether our plans related to our investment in 5G wireless spectrum across National Landing will be a significant demand catalyst; whether we will be successful in negotiating definitive documentation with AT&T; whether our target markets continue to be fast-growing; whether future supply or construction delays will inhibit our ability to time new multifamily deliveries to meet market demand; whether Amazon will have a similar growth impact on National Landing as in Seattle; whether National Landing will experience the “Major Milestones“ on the timing discussed or at all; whether anticipated near-term net operating income contributions, anticipated resiliency of the DC area and our contemplated shift to multifamily will be realized and, if realized, will have a positive impact on our stock price; whether any of our tenants succeed in obtaining government assistance under the CARES Act and other programs and use any resulting proceeds to make lease payments owed to us; whether we can access agency debt secured by our currently unencumbered multifamily assets in a timely manner, in the amounts we estimate, on reasonable terms or at all; whether estimates of the amounts management believes to be the impact of COVID-19 on our NOI and Adjusted EBITDA are correct; whether the delay in our planned 2020 discretionary operating asset capital expenditures will have any negative impact on our properties or our ability to generate revenue; and whether the allocation of capital to our share repurchase plan has any impact on our share price. Many of the factors that will determine the outcome of these and our other forward-looking statements are beyond our ability to control or predict. These factors include, among others: adverse economic conditions in the Washington, DC metropolitan area, including in relation to COVID-19, the timing of and costs associated with development and property improvements, financing commitments, and general competitive factors. For further discussion of factors that could materially affect the outcome of our forward-looking statements and other risks and uncertainties, see “Risk Factors,” “Management’s Discussion and Analysis of Financial Condition and Results of Operations” and the Cautionary Statement Concerning Forward-Looking Statements in the Company’s Annual Report on Form 10-K for the year ended December 31, 2020 and other periodic reports the Company files with the Securities and Exchange Commission. For these statements, we claim the protection of the safe harbor for forward-looking statements contained in the Private Securities Litigation Reform Act of 1995. You are cautioned not to place undue reliance on our forward-looking statements. All subsequent written and oral forward-looking statements attributable to us or any person acting on our behalf are expressly qualified in their entirety by the cautionary statements contained or referred to in this section. We do not undertake any obligation to release publicly any revisions to our forward-looking statements to reflect events or circumstances occurring after the date hereof. 2 |
| disclosures Pro Rata Information We present certain financial information and metrics in this release "at JBG SMITH Share," which refers to our ownership percentage of consolidated and unconsolidated assets in real estate ventures (collectively, "real estate ventures") as applied to these financial measures and metrics. Financial information "at JBG SMITH Share" is calculated on an asset-by-asset basis by applying our percentage economic interest to each applicable line item of that asset's financial information. "At JBG SMITH Share" information, which we also refer to as being "at share," "our pro rata share" or "our share," is not, and is not intended to be, a presentation in accordance with GAAP. Given that a substantial portion of our assets are held through real estate ventures, we believe this form of presentation, which presents our economic interests in the partially owned entities, provides investors valuable information regarding a significant component of our portfolio, its composition, performance and capitalization. We do not control the unconsolidated real estate ventures and do not have a legal claim to our co-venturers' share of assets, liabilities, revenue and expenses. The operating agreements of the unconsolidated real estate ventures generally allow each co-venturer to receive cash distributions to the extent there is available cash from operations. The amount of cash each investor receives is based upon specific provisions of each operating agreement and varies depending on certain factors including the amount of capital contributed by each investor and whether any investors are entitled to preferential distributions. With respect to any such third-party arrangement, we would not be in a position to exercise sole decision-making authority regarding the property, real estate venture or other entity, and may, under certain circumstances, be exposed to economic risks not present were a third-party not involved. We and our respective co-venturers may each have the right to trigger a buy-sell or forced sale arrangement, which could cause us to sell our interest, or acquire our co-venturers' interests, or to sell the underlying asset, either on unfavorable terms or at a time when we otherwise would not have initiated such a transaction. Our real estate ventures may be subject to debt, and the repayment or refinancing of such debt may require equity capital calls. To the extent our co-venturers do not meet their obligations to us or our real estate ventures or they act inconsistent with the interests of the real estate venture, we may be adversely affected. Because of these limitations, the non-GAAP "at JBG SMITH Share" financial information should not be considered in isolation or as a substitute for our financial statements as reported under GAAP. Market Data Market data and industry forecasts are used in this Investor Presentation, including data obtained from publicly available sources. These sources generally state that the information they provide has been obtained from sources believed to be reliable, but the accuracy and completeness of the information is not assured. We have not independently verified any such information. Amazon In November 2018, Amazon announced it had selected sites that we own in National Landing as the location of an additional headquarters. In connection with Amazon's new headquarters in National Landing, in February 2019 the Commonwealth of Virginia enacted an incentives bill, which provides tax incentives to Amazon to create a minimum of 25,000 new full-time jobs and potentially 37,850 full-time jobs with average annual wage targets for each calendar year, starting with $150,000 in 2019, and escalating 1.5% per year, in National Landing. Led by state and local governments, we expect more than $5.6 billion of infrastructure and education investments directly benefitting National Landing. These investments include: two new Metro entrances (Crystal Drive and Potomac Yard); a pedestrian bridge to Reagan National Airport; a new commuter rail station located between two of our Crystal Drive office assets; lowering of elevated sections of US Route 1 that currently divide parts of National Landing to create better multimodal access and walkability; and funding for an innovation campus anchored by Virginia Tech. In addition to government infrastructure investments, we expect at least an additional $6.8 billion of investments, including investments by Amazon, JBG SMITH, and Virginia Tech. To date, we have executed leases with Amazon totaling approximately 1.0 million square feet at six office buildings in our National Landing portfolio. In March 2019, we executed purchase and sale agreements with Amazon for two of our National Landing development sites, Metropolitan Park and Pen Place, which will serve as the initial phase of new construction associated with Amazon's new headquarters at National Landing. Subject to customary closing conditions, Amazon contracted to acquire these two development sites for an estimated aggregate $293.9 million, or $72.00 per square foot, based on their combined estimated potential development density xxx 3 |
| disclosures of up to approximately 4.1 million square feet. In December 2019, Arlington County approved the plans submitted by Amazon to construct two new office buildings, totaling 2.1 million square feet, inclusive of over 50,000 square feet of street-level retail with new shops and restaurants, on the Metropolitan Park land sites. In January 2020, we sold Metropolitan Park to Amazon for $155.0 million, which represented an $11.0 million increase over our previously estimated contract value resulting from an increase in the approved development density on the site. In February 2021, Amazon submitted for entitlement approvals the second phase of its new headquarters at Pen Place (2.8 million square feet of office, along with an iconic structure, known as The Helix). We are the developer, property manager and retail leasing agent for Amazon's new headquarters at National Landing. In September 2020, Amazon purchased the Residence Inn by Marriott in Pentagon City, immediately adjacent to Pen Place in National Landing from a third party. We include certain statistics in the following slides as outlined in the Memorandum of Understanding (MOU) between Amazon and the Commonwealth of Virginia, executed on November 12, 2018, and that identify the proximity of our portfolio to National Landing: specifically, 81% of our portfolio is within a 20-minute commute of National Landing, as calculated on a pre-COVID-19 Monday morning. Approximately 2.1 million square feet of estimated potential development density at Pen Place has been excluded from our portfolio statistics included in this presentation. JOINT VENTURE IN POTOMAC YARD In April 2021, we entered into a real estate venture with institutional investors advised by J.P. Morgan Global Alternatives to design, develop, manage and own approximately 2.0 million square feet of new mixed-use development (1.1 million square feet of office and 900,000 square feet of multifamily) located in Potomac Yard, the southern portion of National Landing. Our venture partner contributed a land site that is entitled for 1.3 million square feet of development it controlled at Potomac Yard Landbay F, while we contributed the adjacent land with over 700,000 square feet of estimated development capacity at Potomac Yard Landbay G. In addition to our 50.0% ownership in the venture, we will act as pre-developer, developer, property manager and leasing agent for all future commercial and residential properties on the site. As a result of this transaction, we increased our at share ownership of development rights in the southern portion of National Landing by over 285,000 square feet, increasing our economic ownership interest in this emerging-growth submarket to approximately 79%. We have updated portfolio statistics in this presentation to reflect the impact of this transaction. Definitions and Reconciliations For certain definitions and reconciliations see pages 23–28. IMPACT OF COVID-19 ON OUR NOI AND ADJUSTED EBITDA This presentation includes estimates of the amounts management believes are attributable to the impact of COVID-19 on our NOI and Adjusted EBITDA. Though certain elements of such estimates are quantifiable, these estimates are inherently subjective and we can provide no assurance that such estimates reflect the actual impact of COVID-19 on the measures or that these measures, after such adjustments, reflect what our actual results would have been in the absence of COVID-19. 4 |
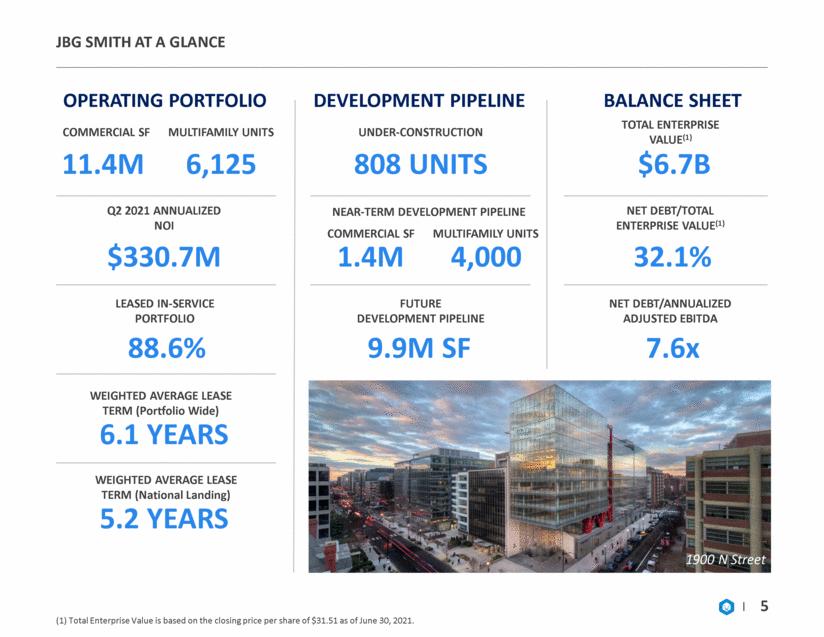
| JBG SMITH AT A GLANCE (1) Total Enterprise Value is based on the closing price per share of $31.51 as of June 30, 2021. 5 OPERATING PORTFOLIO COMMERCIAL SF MULTIFAMILY UNITS 11.4M 6,125 Q2 2021 ANNUALIZED NOI $330.7M LEASED IN-SERVICE PORTFOLIO 88.6% WEIGHTED AVERAGE LEASE TERM (Portfolio Wide) 6.1 YEARS DEVELOPMENT PIPELINE UNDER-CONSTRUCTION 808 UNITS NEAR-TERM DEVELOPMENT PIPELINE 1.4M FUTURE DEVELOPMENT PIPELINE 9.9M SF BALANCE SHEET TOTAL ENTERPRISE VALUE(1) $6.7B NET DEBT/TOTAL ENTERPRISE VALUE(1) 32.1% NET DEBT/ANNUALIZED ADJUSTED EBITDA 7.6x 1900 N Street WEIGHTED AVERAGE LEASE TERM (National Landing) 5.2 YEARS 4,000 COMMERCIAL SF MULTIFAMILY UNITS |
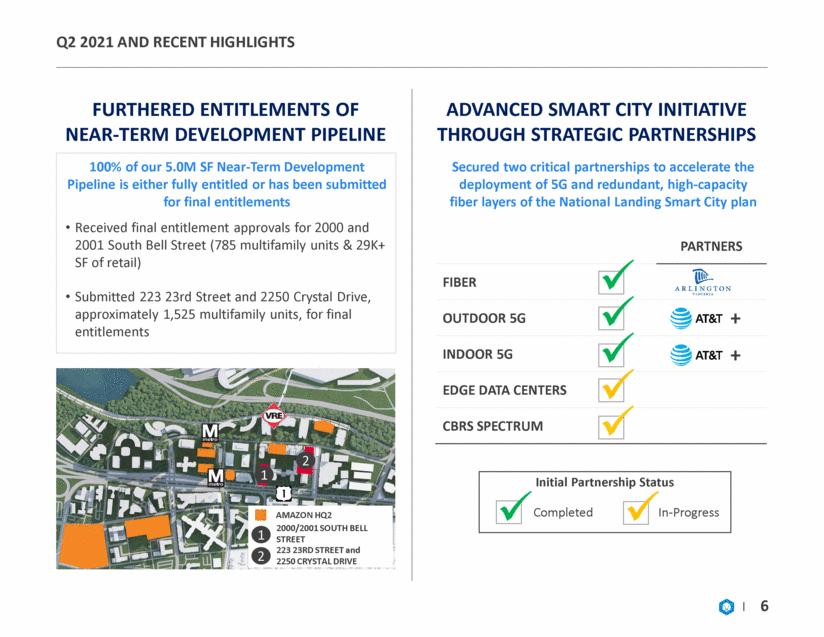
| PARTNERS FIBER OUTDOOR 5G INDOOR 5G EDGE DATA CENTERS CBRS SPECTRUM q2 2021 and recent highlights 6 FURTHERED ENTITLEMENTS OF NEAR-TERM DEVELOPMENT PIPELINE ADVANCED SMART CITY INITIATIVE THROUGH STRATEGIC PARTNERSHIPS 100% of our 5.0M SF Near-Term Development Pipeline is either fully entitled or has been submitted for final entitlements Received final entitlement approvals for 2000 and 2001 South Bell Street (785 multifamily units & 29K+ SF of retail) Submitted 223 23rd Street and 2250 Crystal Drive, approximately 1,525 multifamily units, for final entitlements AMAZON HQ2 2000/2001 SOUTH BELL STREET 223 23RD STREET and 2250 CRYSTAL DRIVE Secured two critical partnerships to accelerate the deployment of 5G and redundant, high-capacity fiber layers of the National Landing Smart City plan + 2 1 1 2 Completed In-Progress Initial Partnership Status + |
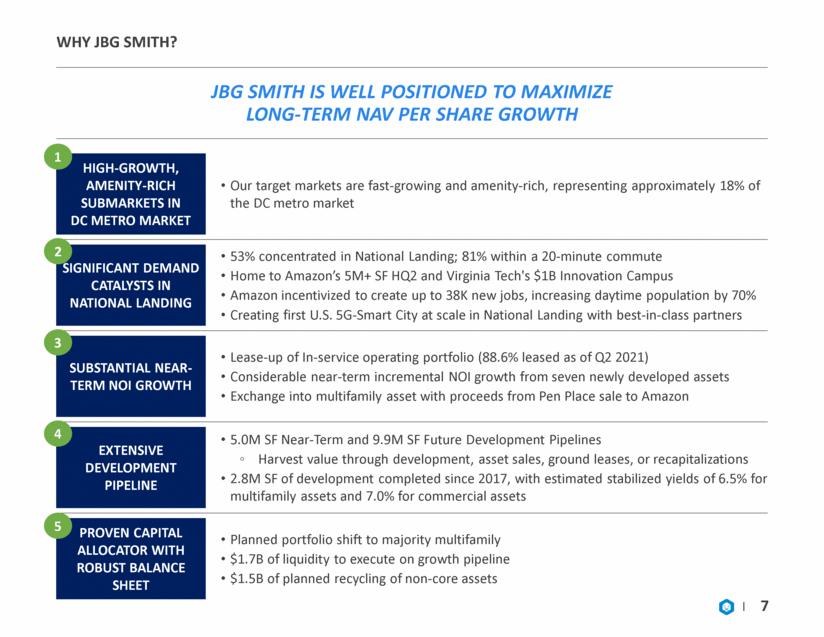
| Why jbg smith? jbg smith is well positioned to maximize long-term nav per share growth 7 HIGH-GROWTH, AMENITY-RICH SUBMARKETS IN DC METRO MARKET Our target markets are fast-growing and amenity-rich, representing approximately 18% of the DC metro market SIGNIFICANT DEMAND CATALYSTS IN NATIONAL LANDING 53% concentrated in National Landing; 81% within a 20-minute commute Home to Amazon’s 5M+ SF HQ2 and Virginia Tech's $1B Innovation Campus Amazon incentivized to create up to 38K new jobs, increasing daytime population by 70% Creating first U.S. 5G-Smart City at scale in National Landing with best-in-class partners SUBSTANTIAL NEAR-TERM NOI GROWTH Lease-up of In-service operating portfolio (88.6% leased as of Q2 2021) Considerable near-term incremental NOI growth from seven newly developed assets Exchange into multifamily asset with proceeds from Pen Place sale to Amazon EXTENSIVE DEVELOPMENT PIPELINE 5.0M SF Near-Term and 9.9M SF Future Development Pipelines Harvest value through development, asset sales, ground leases, or recapitalizations 2.8M SF of development completed since 2017, with estimated stabilized yields of 6.5% for multifamily assets and 7.0% for commercial assets PROVEN CAPITAL ALLOCATOR WITH ROBUST BALANCE SHEET Planned portfolio shift to majority multifamily $1.7B of liquidity to execute on growth pipeline $1.5B of planned recycling of non-core assets 1 2 3 4 5 |
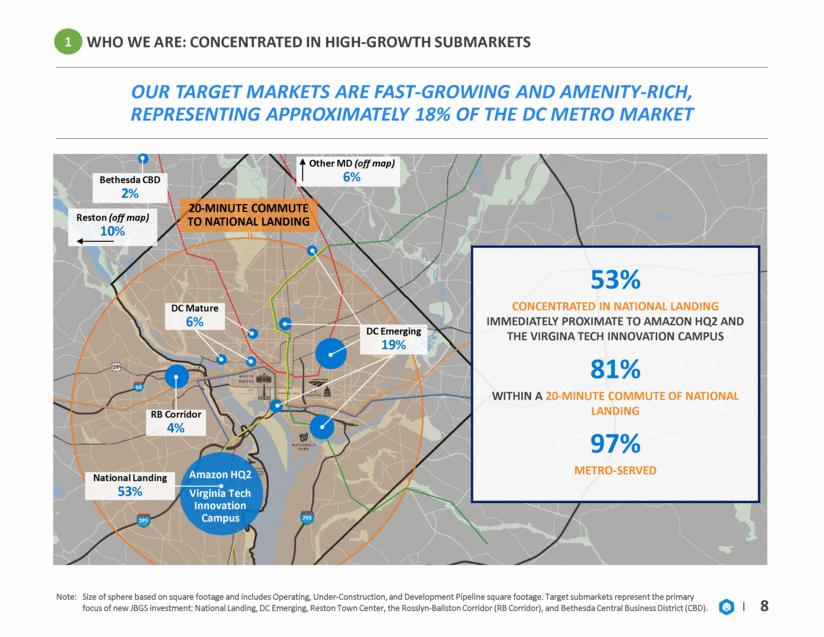
| Other MD (off map) 6% Bethesda CBD 2% Reston (off map) 10% RB Corridor 4% DC Mature 6% National Landing 53% 20-MINUTE COMMUTE TO NATIONAL LANDING WHO WE ARE: CONCENTRATED IN HIGH-GROWTH SUBMARKETS OUR TARGET MARKETS ARE FAST-GROWING AND AMENITY-RICH, REPRESENTING APPROXIMATELY 18% OF THE DC METRO MARKET Note: Size of sphere based on square footage and includes Operating, Under-Construction, and Development Pipeline square footage. Target submarkets represent the primary focus of new JBGS investment: National Landing, DC Emerging, Reston Town Center, the Rosslyn-Ballston Corridor (RB Corridor), and Bethesda Central Business District (CBD). 8 53% CONCENTRATED IN NATIONAL LANDING IMMEDIATELY PROXIMATE TO AMAZON HQ2 AND THE VIRGINA TECH INNOVATION CAMPUS 81% WITHIN A 20-MINUTE COMMUTE OF NATIONAL LANDING 97% METRO-SERVED 1 Amazon HQ2 Virginia Tech Innovation Campus DC Emerging 19% |
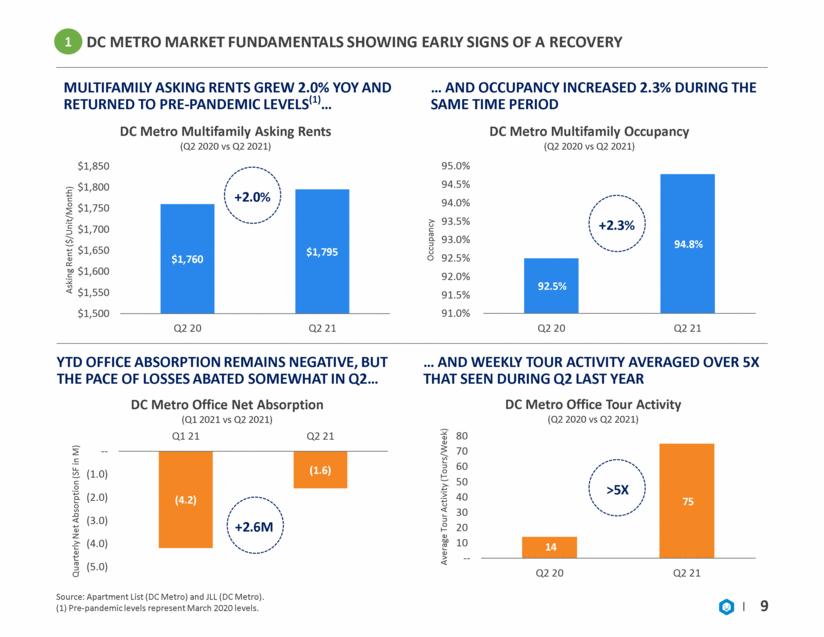
| dc metro market fundamentals SHOWING EARLY SIGNS OF A RECOVERY Source: Apartment List (DC Metro) and JLL (DC Metro). (1) Pre-pandemic levels represent March 2020 levels. 9 1 MULTIFAMILY ASKING RENTS GREW 2.0% YOY AND RETURNED TO PRE-PANDEMIC LEVELS(1) AND OCCUPANCY INCREASED 2.3% DURING THE SAME TIME PERIOD YTD OFFICE ABSORPTION REMAINS NEGATIVE, BUT THE PACE OF LOSSES ABATED SOMEWHAT IN Q2 +2.0% +2.3% +2.6M AND WEEKLY TOUR ACTIVITY AVERAGED OVER 5X THAT SEEN DURING Q2 LAST YEAR >5X (4.2) (1.6) (5.0) (4.0) (3.0) (2.0) (1.0) -- Q1 21 Q2 21 Quarterly Net Absorption (SF in M) DC Metro Office Net Absorption (Q1 2021 vs Q2 2021) 92.5% 94.8% 91.0% 91.5% 92.0% 92.5% 93.0% 93.5% 94.0% 94.5% 95.0% Q2 20 Q2 21 Occupancy DC Metro Multifamily Occupancy (Q2 2020 vs Q2 2021) $1,760 $1,795 $1,500 $1,550 $1,600 $1,650 $1,700 $1,750 $1,800 $1,850 Q2 20 Q2 21 Asking Rent ($/Unit/Month) DC Metro Multifamily Asking Rents (Q2 2020 vs Q2 2021) 14 75 -- 10 20 30 40 50 60 70 80 Q2 20 Q2 21 Average Tour Activity (Tours/Week) DC Metro Office Tour Activity (Q2 2020 vs Q2 2021) |
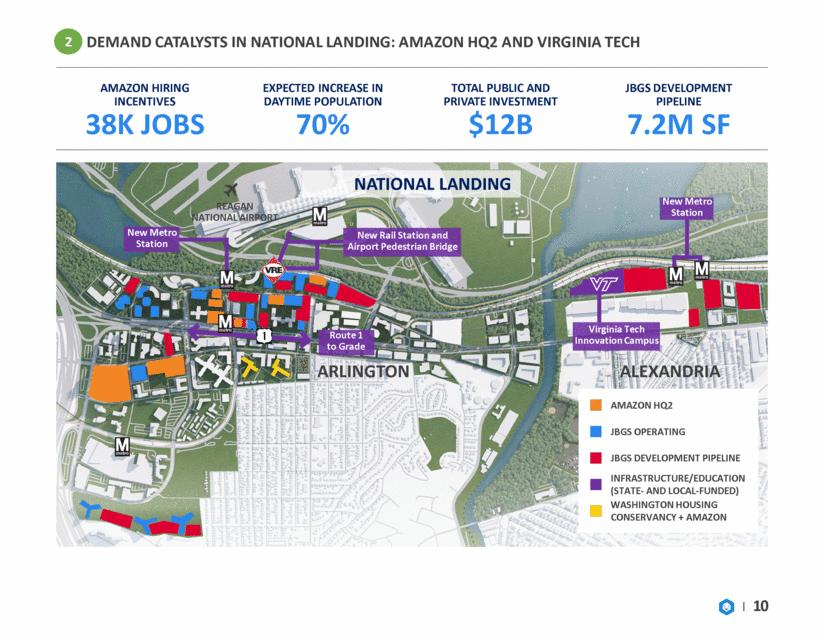
| DEMAND CATALYSTS IN NATIONAL LANDING: AMAZON HQ2 AND VIRGINIA TECH AMAZON HIRING INCENTIVES 38K JOBS EXPECTED INCREASE IN DAYTIME POPULATION 70% TOTAL PUBLIC AND PRIVATE INVESTMENT $12B JBGS DEVELOPMENT PIPELINE 7.2M SF 10 AMAZON HQ2 JBGS OPERATING JBGS DEVELOPMENT PIPELINE INFRASTRUCTURE/EDUCATION (STATE- AND LOCAL-FUNDED) WASHINGTON HOUSING CONSERVANCY + AMAZON ARLINGTON Route 1 to Grade ALEXANDRIA Virginia Tech Innovation Campus New Metro Station New Rail Station and Airport Pedestrian Bridge REAGAN NATIONAL AIRPORT New Metro Station NATIONAL LANDING 2 |
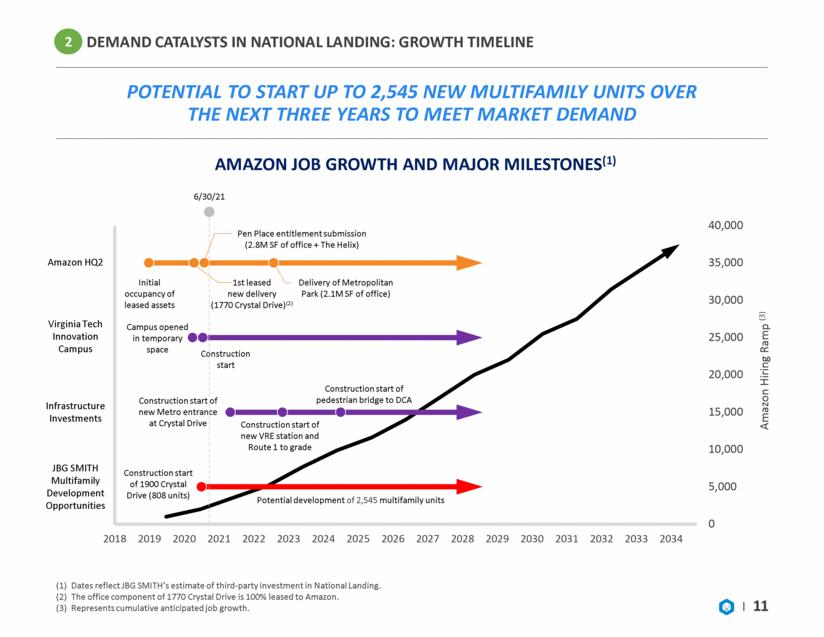
| DEMAND CATALYSTS IN NATIONAL LANDING: GROWTH TIMELINE Potential to start up to 2,545 new multifamily units over the next three years to meet market demand (1) Dates reflect JBG SMITH’s estimate of third-party investment in National Landing. (2) The office component of 1770 Crystal Drive is 100% leased to Amazon. (3) Represents cumulative anticipated job growth. 11 AMAZON JOB GROWTH AND MAJOR MILESTONES(1) Construction start of new VRE station and Route 1 to grade Potential development of 2,545 multifamily units Construction start of 1900 Crystal Drive (808 units) Construction start of pedestrian bridge to DCA Construction start of new Metro entrance at Crystal Drive Construction start Campus opened in temporary space Initial occupancy of leased assets 1st leased new delivery (1770 Crystal Drive)(2) Delivery of Metropolitan Park (2.1M SF of office) Pen Place entitlement submission (2.8M SF of office + The Helix) 6/30/21 Amazon Hiring Ramp (3) Amazon HQ2 Virginia Tech Innovation Campus Infrastructure Investments JBG SMITH Multifamily Development Opportunities 2 |
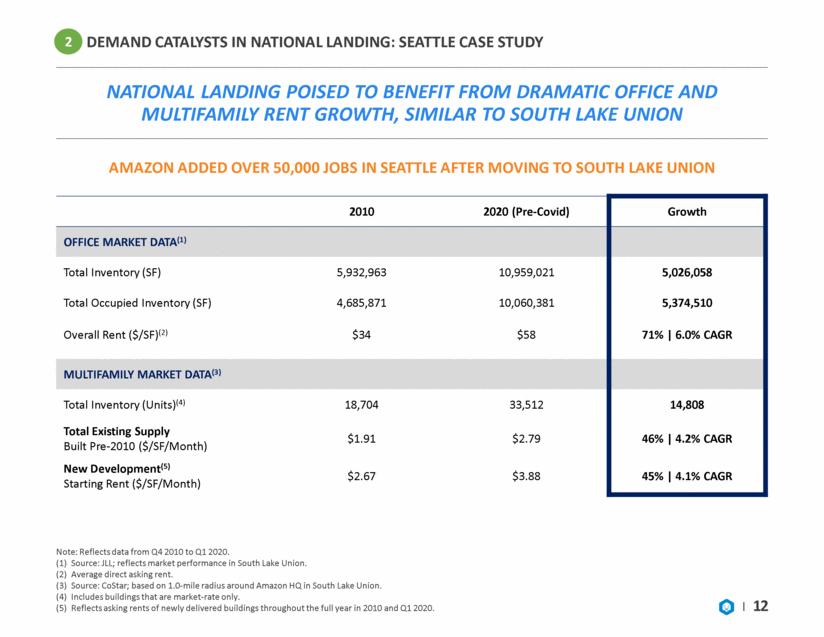
| DEMAND CATALYSTS IN NATIONAL LANDING: SEATTLE CASE STUDY National Landing poised to benefit from dramatic office and multifamily rent growth, similar to South Lake Union Note: Reflects data from Q4 2010 to Q1 2020. (1) Source: JLL; reflects market performance in South Lake Union. (2) Average direct asking rent. (3) Source: CoStar; based on 1.0-mile radius around Amazon HQ in South Lake Union. (4) Includes buildings that are market-rate only. (5) Reflects asking rents of newly delivered buildings throughout the full year in 2010 and Q1 2020. 12 2010 2020 (Pre-Covid) Growth OFFICE MARKET DATA(1) Total Inventory (SF) 5,932,963 10,959,021 5,026,058 Total Occupied Inventory (SF) 4,685,871 10,060,381 5,374,510 Overall Rent ($/SF)(2) $34 $58 71% 6.0% CAGR MULTIFAMILY MARKET DATA(3) Total Inventory (Units)(4) 18,704 33,512 14,808 Total Existing Supply Built Pre-2010 ($/SF/Month) $1.91 $2.79 46% 4.2% CAGR New Development(5) Starting Rent ($/SF/Month) $2.67 $3.88 45% 4.1% CAGR AMAZON ADDED OVER 50,000 JOBS IN SEATTLE AFTER MOVING TO SOUTH LAKE UNION 2 |
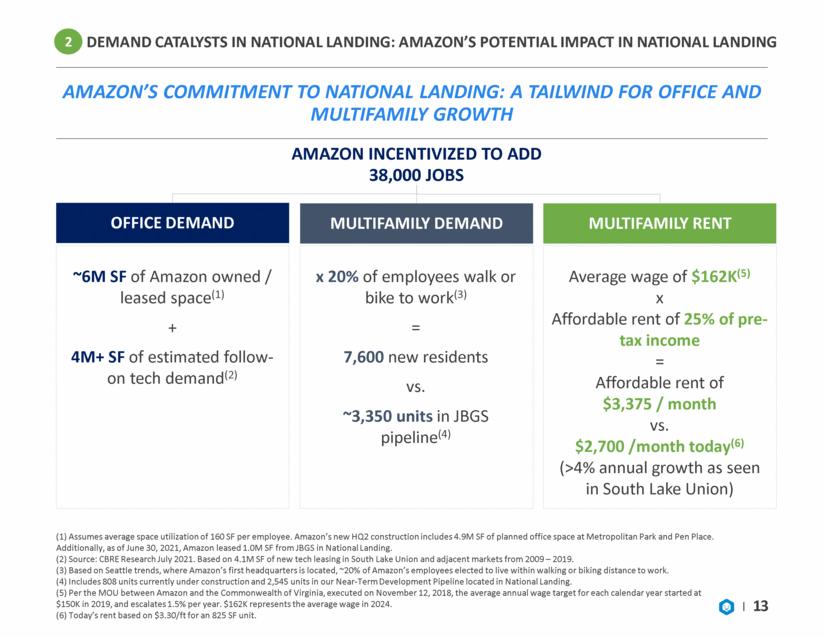
| ~6M SF of Amazon owned / leased space(1) + 4M+ SF of estimated follow-on tech demand(2) x 20% of employees walk or bike to work(3) = 7,600 new residents vs. ~3,350 units in JBGS pipeline(4) Average wage of $162K(5) x Affordable rent of 25% of pre-tax income = Affordable rent of $3,375 / month vs. $2,700 /month today(6) (>4% annual growth as seen in South Lake Union) DEMAND CATALYSTS IN NATIONAL LANDING: Amazon’s potential impact in national landing Amazon’s commitment to national landing: a tailwind for office and multifamily growth (1) Assumes average space utilization of 160 SF per employee. Amazon’s new HQ2 construction includes 4.9M SF of planned office space at Metropolitan Park and Pen Place. Additionally, as of June 30, 2021, Amazon leased 1.0M SF from JBGS in National Landing. (2) Source: CBRE Research July 2021. Based on 4.1M SF of new tech leasing in South Lake Union and adjacent markets from 2009 – 2019. (3) Based on Seattle trends, where Amazon’s first headquarters is located, ~20% of Amazon’s employees elected to live within walking or biking distance to work. (4) Includes 808 units currently under construction and 2,545 units in our Near-Term Development Pipeline located in National Landing. (5) Per the MOU between Amazon and the Commonwealth of Virginia, executed on November 12, 2018, the average annual wage target for each calendar year started at $150K in 2019, and escalates 1.5% per year. $162K represents the average wage in 2024. (6) Today’s rent based on $3.30/ft for an 825 SF unit. 13 2 OFFICE DEMAND MULTIFAMILY RENT AMAZON INCENTIVIZED TO ADD 38,000 JOBS MULTIFAMILY DEMAND |
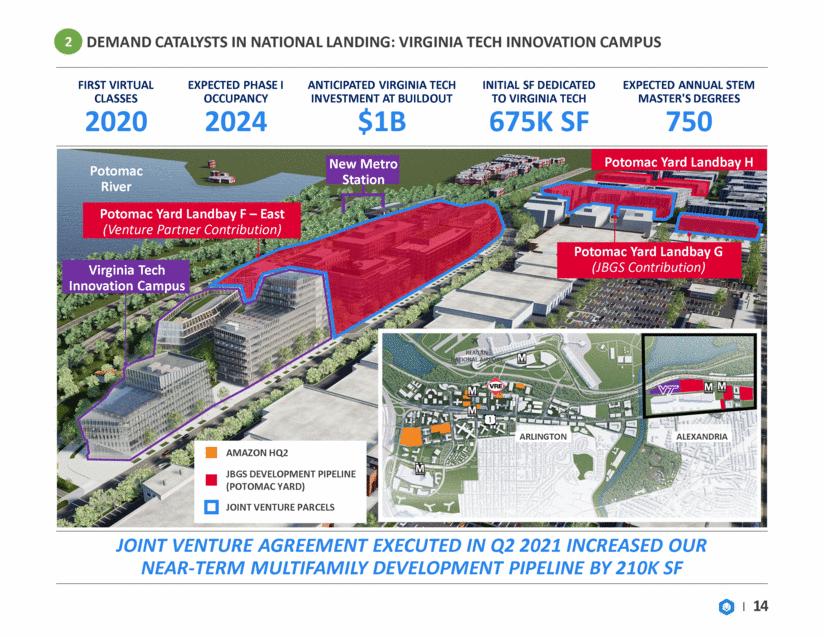
| DEMAND CATALYSTS IN NATIONAL LANDING: VIRGINIA TECH INNOVATION Campus FIRST VIRTUAL CLASSES 2020 EXPECTED PHASE I OCCUPANCY 2024 ANTICIPATED VIRGINIA TECH INVESTMENT AT BUILDOUT $1B INITIAL SF DEDICATED TO VIRGINIA TECH 675K SF EXPECTED ANNUAL STEM MASTER'S DEGREES 750 14 2 JOINT VENTURE AGREEMENT EXECUTED IN Q2 2021 INCREASED OUR NEAR-TERM MULTIFAMILY DEVELOPMENT PIPELINE BY 210K SF ARLINGTON ALEXANDRIA REAGAN NATIONAL AIRPORT AMAZON HQ2 JBGS DEVELOPMENT PIPELINE (POTOMAC YARD) Potomac River Potomac Yard Landbay F – East (Venture Partner Contribution) Virginia Tech Innovation Campus Potomac Yard Landbay G (JBGS Contribution) New Metro Station Potomac Yard Landbay H JOINT VENTURE PARCELS |
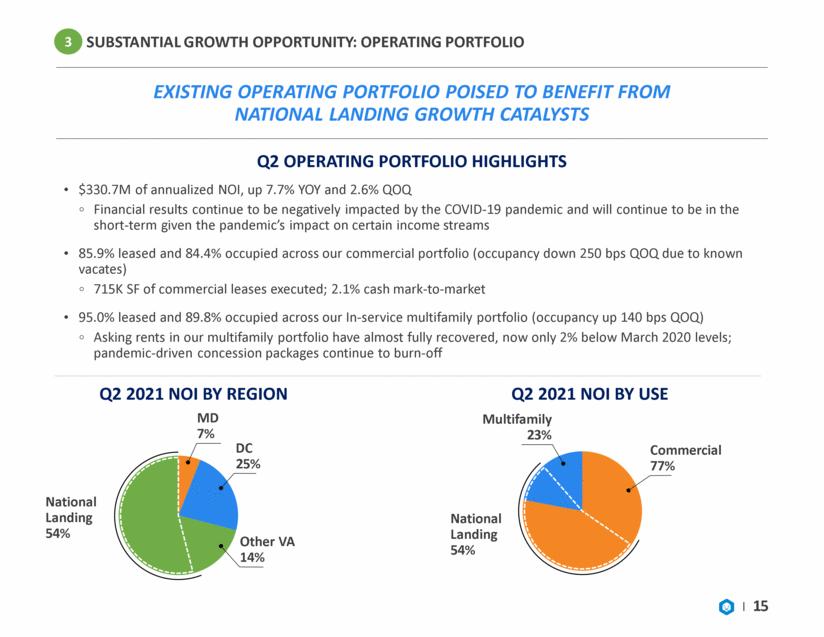
| SUBSTANTIAL GROWTH OPPORTUNITY: OPERATING PORTFOLIO EXISTING OPERATING PORTFOLIO poised TO BENEFIT FROM national landing growth catalysts 15 MD 7% DC 25% Other VA 14% National Landing 54% National Landing 54% Commercial 77% Multifamily 23% Q2 2021 NOI BY REGION Q2 2021 NOI BY USE 3 Q2 OPERATING PORTFOLIO HIGHLIGHTS $330.7M of annualized NOI, up 7.7% YOY and 2.6% QOQ Financial results continue to be negatively impacted by the COVID-19 pandemic and will continue to be in the short-term given the pandemic’s impact on certain income streams 85.9% leased and 84.4% occupied across our commercial portfolio (occupancy down 250 bps QOQ due to known vacates) 715K SF of commercial leases executed; 2.1% cash mark-to-market 95.0% leased and 89.8% occupied across our In-service multifamily portfolio (occupancy up 140 bps QOQ) Asking rents in our multifamily portfolio have almost fully recovered, now only 2% below March 2020 levels; pandemic-driven concession packages continue to burn-off |
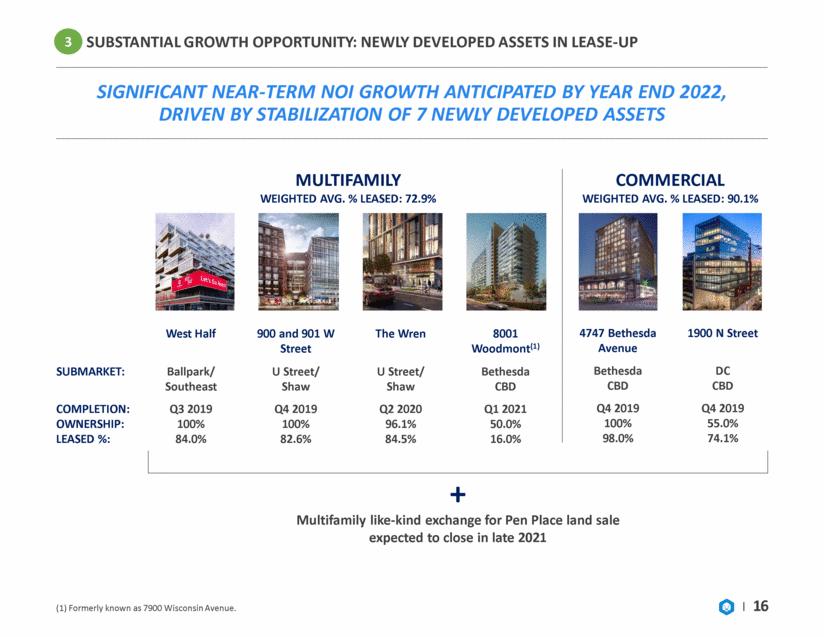
| SUBSTANTIAL GROWTH OPPORTUNITY: NEWLY DEVELOPED ASSETS IN LEASE-UP SIGNIFICANT NEAR-TERM NOI GROWTH ANTICIPATED BY Year end 2022, DRIVEN BY STABILIZATION OF 7 NEWLY DEVELOPED ASSETS (1) Formerly known as 7900 Wisconsin Avenue. 16 MULTIFAMILY WEIGHTED AVG. % LEASED: 72.9% West Half 900 and 901 W Street The Wren 8001 Woodmont(1) SUBMARKET: Ballpark/ Southeast U Street/ Shaw U Street/ Shaw Bethesda CBD COMPLETION: OWNERSHIP: LEASED %: Q3 2019 100% 84.0% Q4 2019 100% 82.6% Q2 2020 96.1% 84.5% Q1 2021 50.0% 16.0% COMMERCIAL WEIGHTED AVG. % LEASED: 90.1% 4747 Bethesda Avenue 1900 N Street Bethesda CBD DC CBD Q4 2019 100% 98.0% Q4 2019 55.0% 74.1% + Multifamily like-kind exchange for Pen Place land sale expected to close in late 2021 3 |
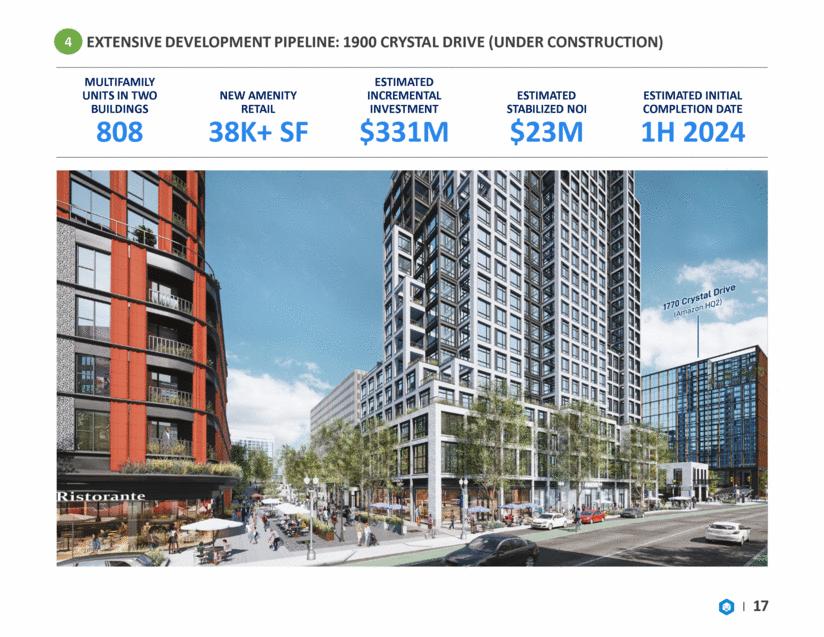
| EXTENSIVE DEVELOPMENT PIPELINE: 1900 CRYSTAL DRIVE (UNDER CONSTRUCTION) 17 MULTIFAMILY UNITS IN TWO BUILDINGS NEW AMENITY RETAIL ESTIMATED INCREMENTAL INVESTMENT ESTIMATED STABILIZED NOI ESTIMATED INITIAL COMPLETION DATE 808 38K+ SF $331M $23M 1H 2024 4 |
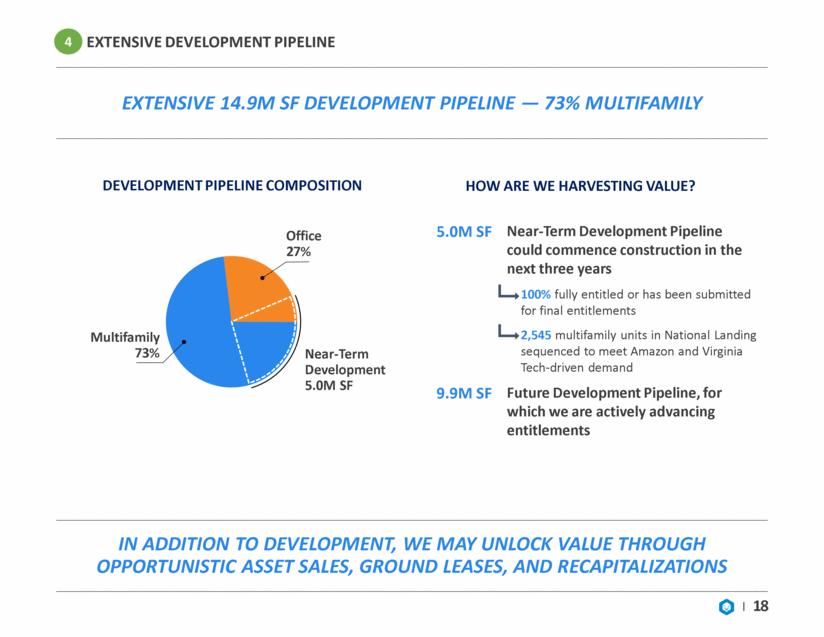
| EXTENSIVE DEVELOPMENT PIPELINE EXTENSIVE 14.9M SF DEVELOPMENT PIPELINE — 73% MULTIFAMILY 18 IN ADDITION TO DEVELOPMENT, WE MAY UNLOCK VALUE THROUGH OPPORTUNISTIC ASSET SALES, GROUND LEASES, AND RECAPITALIZATIONS DEVELOPMENT PIPELINE COMPOSITION HOW ARE WE HARVESTING VALUE? 5.0M SF Near-Term Development Pipeline could commence construction in the next three years 100% fully entitled or has been submitted for final entitlements 2,545 multifamily units in National Landing sequenced to meet Amazon and Virginia Tech-driven demand 9.9M SF Future Development Pipeline, for which we are actively advancing entitlements Near-Term Development 5.0M SF Office 27% Multifamily 73% 4 |
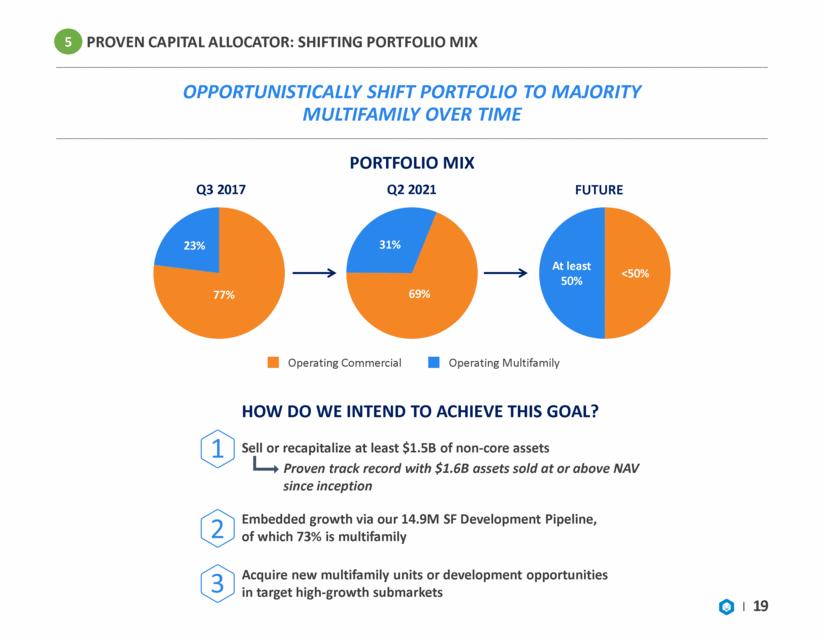
| PROVEN CAPITAL ALLOCATOR: SHIFTING PORTFOLIO MIX Opportunistically shift portfolio to majority Multifamily over time 19 Sell or recapitalize at least $1.5B of non-core assets Proven track record with $1.6B assets sold at or above NAV since inception Embedded growth via our 14.9M SF Development Pipeline, of which 73% is multifamily Acquire new multifamily units or development opportunities in target high-growth submarkets At least 50% <50% 69% 31% 77% 23% Q3 2017 Q2 2021 FUTURE Operating Commercial Operating Multifamily HOW DO WE INTEND TO ACHIEVE THIS GOAL? 1 2 3 PORTFOLIO MIX 5 |
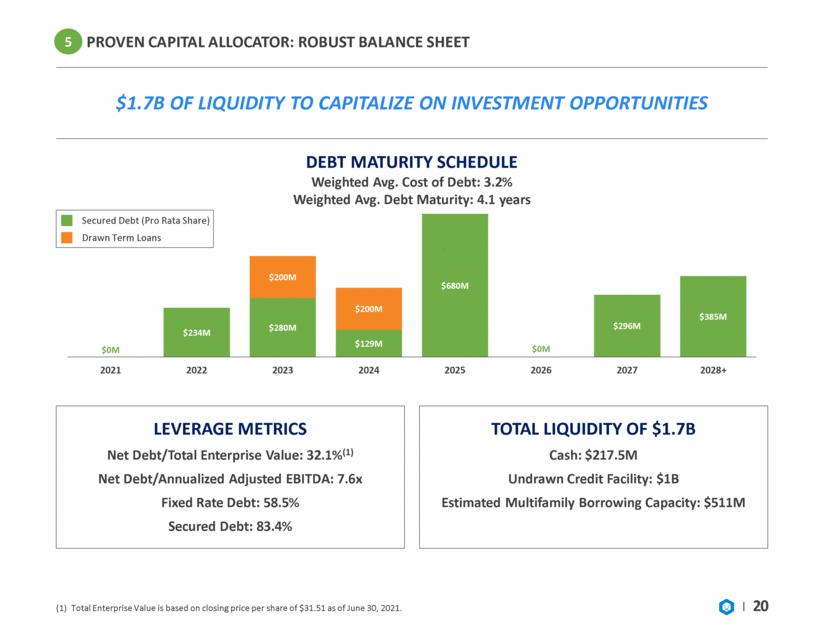
| PROVEN CAPITAL ALLOCATOR: ROBUST BALANCE SHEET $1.7B of liquidity TO CAPITALIZE ON INVESTMENT OPPORTUNITIES (1) Total Enterprise Value is based on closing price per share of $31.51 as of June 30, 2021. 20 DEBT MATURITY SCHEDULE Weighted Avg. Cost of Debt: 3.2% Weighted Avg. Debt Maturity: 4.1 years LEVERAGE METRICS Net Debt/Total Enterprise Value: 32.1%(1) Net Debt/Annualized Adjusted EBITDA: 7.6x Fixed Rate Debt: 58.5% Secured Debt: 83.4% TOTAL LIQUIDITY OF $1.7B Cash: $217.5M Undrawn Credit Facility: $1B Estimated Multifamily Borrowing Capacity: $511M Drawn Term Loans Secured Debt (Pro Rata Share) 5 $0M $234M $280M $129M $680M $0M $296M $385M $200M $200M 2021 2022 2023 2024 2025 2026 2027 2028+ |
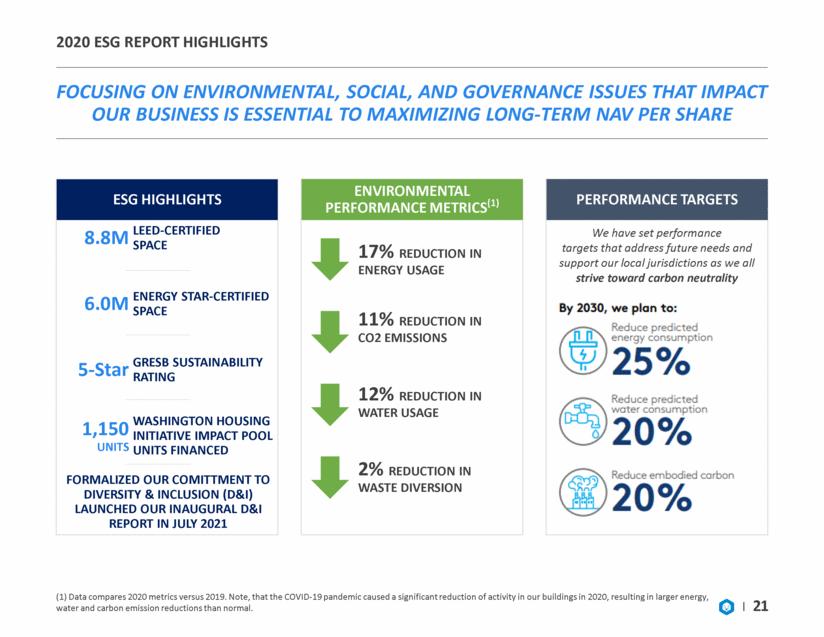
| 2020 Esg report highlights focusing on environmental, social, and governance issues that impact our business IS ESSENTIAL TO maximizing long-term NAV per share (1) Data compares 2020 metrics versus 2019. Note, that the COVID-19 pandemic caused a significant reduction of activity in our buildings in 2020, resulting in larger energy, water and carbon emission reductions than normal. 21 17% REDUCTION IN ENERGY USAGE 11% REDUCTION IN CO2 EMISSIONS 12% REDUCTION IN WATER USAGE 2% REDUCTION IN WASTE DIVERSION ESG HIGHLIGHTS 8.8M LEED-CERTIFIED SPACE 6.0M ENERGY STAR-CERTIFIED SPACE 5-Star GRESB SUSTAINABILITY RATING 1,150 UNITS WASHINGTON HOUSING INITIATIVE IMPACT POOL UNITS FINANCED FORMALIZED OUR COMITTMENT TO DIVERSITY & INCLUSION (D&I) LAUNCHED OUR INAUGURAL D&I REPORT IN JULY 2021 BOARD COMPOSITION ENVIRONMENTAL PERFORMANCE METRICS(1) PERFORMANCE TARGETS We have set performance targets that address future needs and support our local jurisdictions as we all strive toward carbon neutrality |
| Appendix |
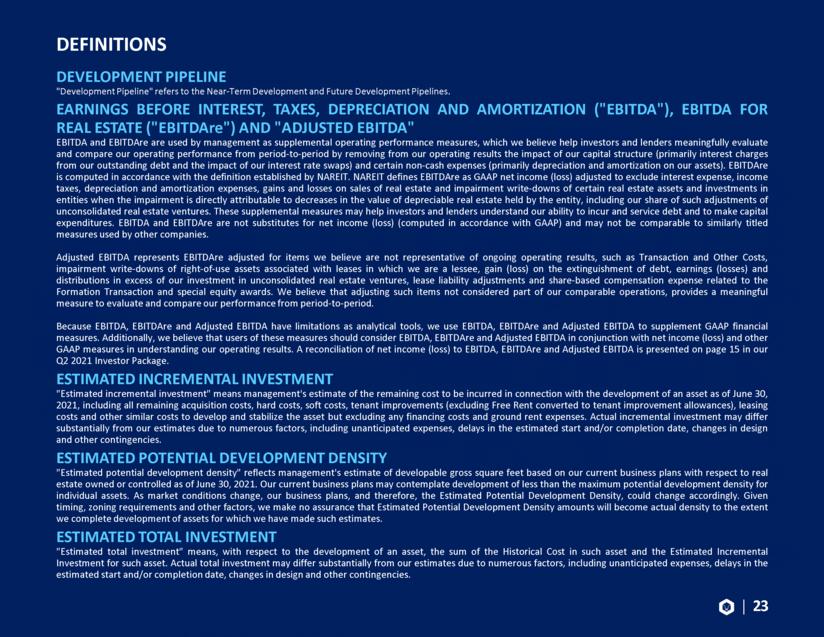
| definitions Development pipeline "Development Pipeline" refers to the Near-Term Development and Future Development Pipelines. EARNINGS BEFORE INTEREST, TAXES, DEPRECIATION AND AMORTIZATION ("EBITDA"), EBITDA FOR REAL ESTATE ("EBITDAre") AND "ADJUSTED EBITDA" EBITDA and EBITDAre are used by management as supplemental operating performance measures, which we believe help investors and lenders meaningfully evaluate and compare our operating performance from period-to-period by removing from our operating results the impact of our capital structure (primarily interest charges from our outstanding debt and the impact of our interest rate swaps) and certain non-cash expenses (primarily depreciation and amortization on our assets). EBITDAre is computed in accordance with the definition established by NAREIT. NAREIT defines EBITDAre as GAAP net income (loss) adjusted to exclude interest expense, income taxes, depreciation and amortization expenses, gains and losses on sales of real estate and impairment write-downs of certain real estate assets and investments in entities when the impairment is directly attributable to decreases in the value of depreciable real estate held by the entity, including our share of such adjustments of unconsolidated real estate ventures. These supplemental measures may help investors and lenders understand our ability to incur and service debt and to make capital expenditures. EBITDA and EBITDAre are not substitutes for net income (loss) (computed in accordance with GAAP) and may not be comparable to similarly titled measures used by other companies. Adjusted EBITDA represents EBITDAre adjusted for items we believe are not representative of ongoing operating results, such as Transaction and Other Costs, impairment write-downs of right-of-use assets associated with leases in which we are a lessee, gain (loss) on the extinguishment of debt, earnings (losses) and distributions in excess of our investment in unconsolidated real estate ventures, lease liability adjustments and share-based compensation expense related to the Formation Transaction and special equity awards. We believe that adjusting such items not considered part of our comparable operations, provides a meaningful measure to evaluate and compare our performance from period-to-period. Because EBITDA, EBITDAre and Adjusted EBITDA have limitations as analytical tools, we use EBITDA, EBITDAre and Adjusted EBITDA to supplement GAAP financial measures. Additionally, we believe that users of these measures should consider EBITDA, EBITDAre and Adjusted EBITDA in conjunction with net income (loss) and other GAAP measures in understanding our operating results. A reconciliation of net income (loss) to EBITDA, EBITDAre and Adjusted EBITDA is presented on page 15 in our Q2 2021 Investor Package. ESTIMATED INCREMENTAL INVESTMENT "Estimated incremental investment" means management's estimate of the remaining cost to be incurred in connection with the development of an asset as of June 30, 2021, including all remaining acquisition costs, hard costs, soft costs, tenant improvements (excluding Free Rent converted to tenant improvement allowances), leasing costs and other similar costs to develop and stabilize the asset but excluding any financing costs and ground rent expenses. Actual incremental investment may differ substantially from our estimates due to numerous factors, including unanticipated expenses, delays in the estimated start and/or completion date, changes in design and other contingencies. Estimated potential development density "Estimated potential development density" reflects management's estimate of developable gross square feet based on our current business plans with respect to real estate owned or controlled as of June 30, 2021. Our current business plans may contemplate development of less than the maximum potential development density for individual assets. As market conditions change, our business plans, and therefore, the Estimated Potential Development Density, could change accordingly. Given timing, zoning requirements and other factors, we make no assurance that Estimated Potential Development Density amounts will become actual density to the extent we complete development of assets for which we have made such estimates. ESTIMATED TOTAL INVESTMENT "Estimated total investment" means, with respect to the development of an asset, the sum of the Historical Cost in such asset and the Estimated Incremental Investment for such asset. Actual total investment may differ substantially from our estimates due to numerous factors, including unanticipated expenses, delays in the estimated start and/or completion date, changes in design and other contingencies. 23 |
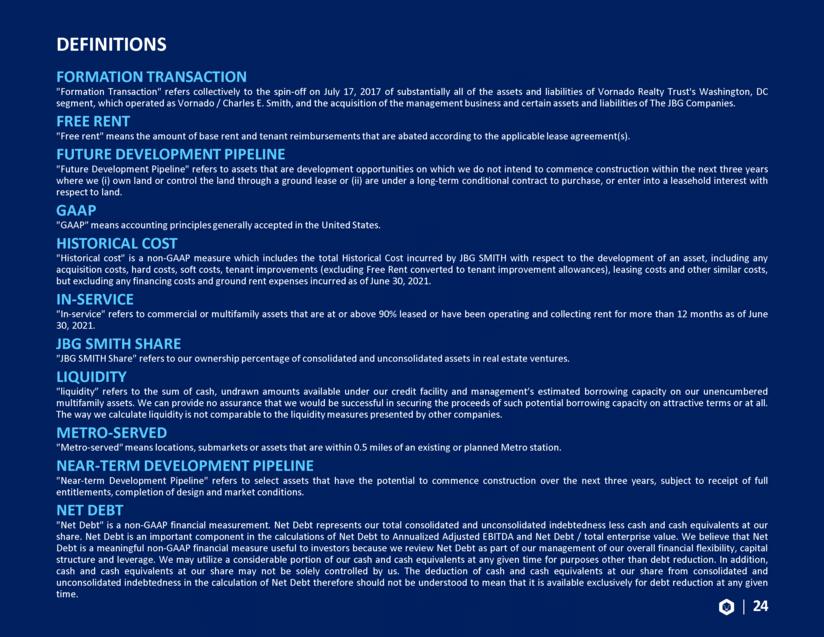
| definitions Formation Transaction "Formation Transaction" refers collectively to the spin-off on July 17, 2017 of substantially all of the assets and liabilities of Vornado Realty Trust's Washington, DC segment, which operated as Vornado / Charles E. Smith, and the acquisition of the management business and certain assets and liabilities of The JBG Companies. Free rent "Free rent" means the amount of base rent and tenant reimbursements that are abated according to the applicable lease agreement(s). Future development pipeline "Future Development Pipeline" refers to assets that are development opportunities on which we do not intend to commence construction within the next three years where we (i) own land or control the land through a ground lease or (ii) are under a long-term conditional contract to purchase, or enter into a leasehold interest with respect to land. GAAP "GAAP" means accounting principles generally accepted in the United States. HISTORICAL COST "Historical cost" is a non-GAAP measure which includes the total Historical Cost incurred by JBG SMITH with respect to the development of an asset, including any acquisition costs, hard costs, soft costs, tenant improvements (excluding Free Rent converted to tenant improvement allowances), leasing costs and other similar costs, but excluding any financing costs and ground rent expenses incurred as of June 30, 2021. In-service "In-service" refers to commercial or multifamily assets that are at or above 90% leased or have been operating and collecting rent for more than 12 months as of June 30, 2021. JBG SMITH share "JBG SMITH Share" refers to our ownership percentage of consolidated and unconsolidated assets in real estate ventures. LIQUIDITY "liquidity” refers to the sum of cash, undrawn amounts available under our credit facility and management’s estimated borrowing capacity on our unencumbered multifamily assets. We can provide no assurance that we would be successful in securing the proceeds of such potential borrowing capacity on attractive terms or at all. The way we calculate liquidity is not comparable to the liquidity measures presented by other companies. Metro-served "Metro-served" means locations, submarkets or assets that are within 0.5 miles of an existing or planned Metro station. Near-term development pipeline "Near-term Development Pipeline" refers to select assets that have the potential to commence construction over the next three years, subject to receipt of full entitlements, completion of design and market conditions. NET DEBT "Net Debt" is a non-GAAP financial measurement. Net Debt represents our total consolidated and unconsolidated indebtedness less cash and cash equivalents at our share. Net Debt is an important component in the calculations of Net Debt to Annualized Adjusted EBITDA and Net Debt / total enterprise value. We believe that Net Debt is a meaningful non-GAAP financial measure useful to investors because we review Net Debt as part of our management of our overall financial flexibility, capital structure and leverage. We may utilize a considerable portion of our cash and cash equivalents at any given time for purposes other than debt reduction. In addition, cash and cash equivalents at our share may not be solely controlled by us. The deduction of cash and cash equivalents at our share from consolidated and unconsolidated indebtedness in the calculation of Net Debt therefore should not be understood to mean that it is available exclusively for debt reduction at any given time. 24 |
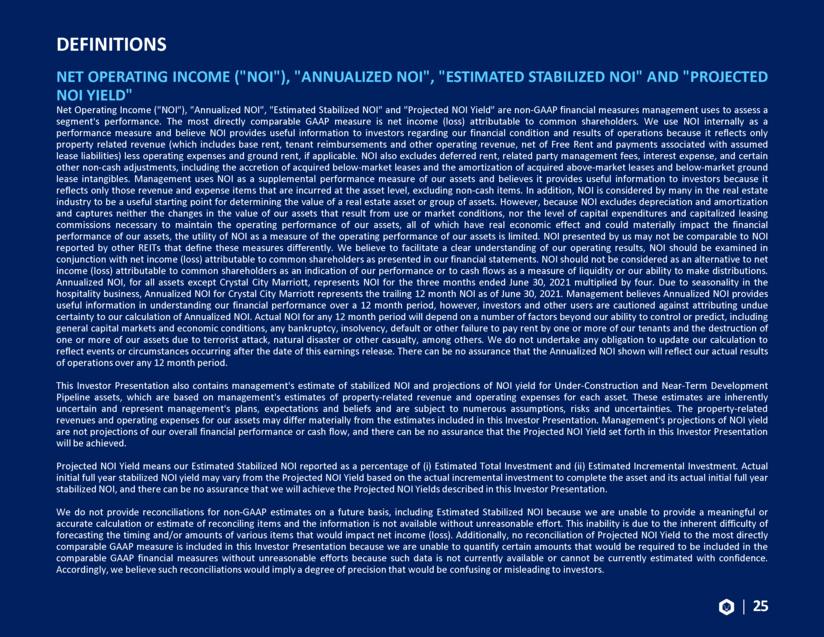
| definitions NET OPERATING INCOME ("NOI"), "ANNUALIZED NOI", "ESTIMATED STABILIZED NOI" AND "PROJECTED NOI YIELD" Net Operating Income ("NOI"), "Annualized NOI", "Estimated Stabilized NOI" and "Projected NOI Yield" are non-GAAP financial measures management uses to assess a segment's performance. The most directly comparable GAAP measure is net income (loss) attributable to common shareholders. We use NOI internally as a performance measure and believe NOI provides useful information to investors regarding our financial condition and results of operations because it reflects only property related revenue (which includes base rent, tenant reimbursements and other operating revenue, net of Free Rent and payments associated with assumed lease liabilities) less operating expenses and ground rent, if applicable. NOI also excludes deferred rent, related party management fees, interest expense, and certain other non-cash adjustments, including the accretion of acquired below-market leases and the amortization of acquired above-market leases and below-market ground lease intangibles. Management uses NOI as a supplemental performance measure of our assets and believes it provides useful information to investors because it reflects only those revenue and expense items that are incurred at the asset level, excluding non-cash items. In addition, NOI is considered by many in the real estate industry to be a useful starting point for determining the value of a real estate asset or group of assets. However, because NOI excludes depreciation and amortization and captures neither the changes in the value of our assets that result from use or market conditions, nor the level of capital expenditures and capitalized leasing commissions necessary to maintain the operating performance of our assets, all of which have real economic effect and could materially impact the financial performance of our assets, the utility of NOI as a measure of the operating performance of our assets is limited. NOI presented by us may not be comparable to NOI reported by other REITs that define these measures differently. We believe to facilitate a clear understanding of our operating results, NOI should be examined in conjunction with net income (loss) attributable to common shareholders as presented in our financial statements. NOI should not be considered as an alternative to net income (loss) attributable to common shareholders as an indication of our performance or to cash flows as a measure of liquidity or our ability to make distributions. Annualized NOI, for all assets except Crystal City Marriott, represents NOI for the three months ended June 30, 2021 multiplied by four. Due to seasonality in the hospitality business, Annualized NOI for Crystal City Marriott represents the trailing 12 month NOI as of June 30, 2021. Management believes Annualized NOI provides useful information in understanding our financial performance over a 12 month period, however, investors and other users are cautioned against attributing undue certainty to our calculation of Annualized NOI. Actual NOI for any 12 month period will depend on a number of factors beyond our ability to control or predict, including general capital markets and economic conditions, any bankruptcy, insolvency, default or other failure to pay rent by one or more of our tenants and the destruction of one or more of our assets due to terrorist attack, natural disaster or other casualty, among others. We do not undertake any obligation to update our calculation to reflect events or circumstances occurring after the date of this earnings release. There can be no assurance that the Annualized NOI shown will reflect our actual results of operations over any 12 month period. This Investor Presentation also contains management's estimate of stabilized NOI and projections of NOI yield for Under-Construction and Near-Term Development Pipeline assets, which are based on management's estimates of property-related revenue and operating expenses for each asset. These estimates are inherently uncertain and represent management's plans, expectations and beliefs and are subject to numerous assumptions, risks and uncertainties. The property-related revenues and operating expenses for our assets may differ materially from the estimates included in this Investor Presentation. Management's projections of NOI yield are not projections of our overall financial performance or cash flow, and there can be no assurance that the Projected NOI Yield set forth in this Investor Presentation will be achieved. Projected NOI Yield means our Estimated Stabilized NOI reported as a percentage of (i) Estimated Total Investment and (ii) Estimated Incremental Investment. Actual initial full year stabilized NOI yield may vary from the Projected NOI Yield based on the actual incremental investment to complete the asset and its actual initial full year stabilized NOI, and there can be no assurance that we will achieve the Projected NOI Yields described in this Investor Presentation. We do not provide reconciliations for non-GAAP estimates on a future basis, including Estimated Stabilized NOI because we are unable to provide a meaningful or accurate calculation or estimate of reconciling items and the information is not available without unreasonable effort. This inability is due to the inherent difficulty of forecasting the timing and/or amounts of various items that would impact net income (loss). Additionally, no reconciliation of Projected NOI Yield to the most directly comparable GAAP measure is included in this Investor Presentation because we are unable to quantify certain amounts that would be required to be included in the comparable GAAP financial measures without unreasonable efforts because such data is not currently available or cannot be currently estimated with confidence. Accordingly, we believe such reconciliations would imply a degree of precision that would be confusing or misleading to investors. 25 |
| definitions Non-same store “Non-same store” refers to all operating assets excluded from the same store pool. Percent leased "Percent leased" is based on leases signed as of June 30, 2021, and is calculated as total rentable square feet less rentable square feet available for lease divided by total rentable square feet expressed as a percentage. Out-of-service square feet are excluded from this calculation. Percent occupied "Percent occupied" is based on occupied rentable square feet/units as of June 30, 2021, and is calculated as (i) for office and retail space, total rentable square feet less unoccupied square feet divided by total rentable square feet, (ii) for multifamily space, total units less unoccupied units divided by total units, expressed as a percentage. Out-of-service square feet and units are excluded from this calculation. Recently delivered "Recently delivered" refers to commercial and multifamily assets that are below 90% leased and have been delivered within the 12 months ended June 30, 2021. Same store "Same store" refers to the pool of assets that were In-Service for the entirety of both periods being compared, except for assets for which significant redevelopment, renovation, or repositioning occurred during either of the periods being compared. Square feet or "SF" "Square feet" or "SF" refers to the area that can be rented to tenants, defined as (i) for commercial assets, rentable square footage defined in the current lease and for vacant space the rentable square footage defined in the previous lease for that space, (ii) for multifamily assets, management's estimate of approximate rentable square feet, (iii) for Under-Construction assets, management's estimate of approximate rentable square feet based on current design plans as of June 30, 2021, and (iv) for Near-Term and Future Development Pipeline assets, management's estimate of developable gross square feet based on its current business plans with respect to real estate owned or controlled as of June 30, 2021. Transaction and other costs "Transaction and other costs" include demolition costs, integration and severance costs, pursuit costs related to other completed, potential and pursued transactions, as well as other expenses. Under-construction "Under-construction" refers to assets that were under construction during the three months ended June 30, 2021. 26 |
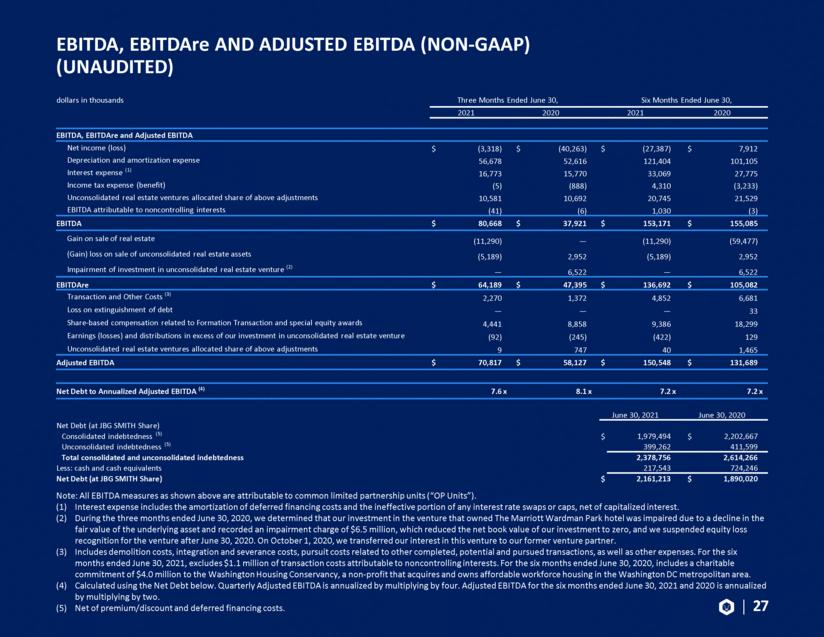
| EBITDA, EBITDAre AND ADJUSTED EBITDA (NON-GAAP) (Unaudited) Note: All EBITDA measures as shown above are attributable to common limited partnership units (“OP Units”). Interest expense includes the amortization of deferred financing costs and the ineffective portion of any interest rate swaps or caps, net of capitalized interest. During the three months ended June 30, 2020, we determined that our investment in the venture that owned The Marriott Wardman Park hotel was impaired due to a decline in the fair value of the underlying asset and recorded an impairment charge of $6.5 million, which reduced the net book value of our investment to zero, and we suspended equity loss recognition for the venture after June 30, 2020. On October 1, 2020, we transferred our interest in this venture to our former venture partner. Includes demolition costs, integration and severance costs, pursuit costs related to other completed, potential and pursued transactions, as well as other expenses. For the six months ended June 30, 2021, excludes $1.1 million of transaction costs attributable to noncontrolling interests. For the six months ended June 30, 2020, includes a charitable commitment of $4.0 million to the Washington Housing Conservancy, a non-profit that acquires and owns affordable workforce housing in the Washington DC metropolitan area. Calculated using the Net Debt below. Quarterly Adjusted EBITDA is annualized by multiplying by four. Adjusted EBITDA for the six months ended June 30, 2021 and 2020 is annualized by multiplying by two. Net of premium/discount and deferred financing costs. 27 dollars in thousands Three Months Ended June 30, Six Months Ended June 30, 2021 2020 2021 2020 EBITDA, EBITDAre and Adjusted EBITDA Net income (loss) $ (3,318) $ (40,263) $ (27,387) $ 7,912 Depreciation and amortization expense 56,678 52,616 121,404 101,105 Interest expense (1) 16,773 15,770 33,069 27,775 Income tax expense (benefit) (5) (888) 4,310 (3,233) Unconsolidated real estate ventures allocated share of above adjustments 10,581 10,692 20,745 21,529 EBITDA attributable to noncontrolling interests (41) (6) 1,030 (3) EBITDA $ 80,668 $ 37,921 $ 153,171 $ 155,085 Gain on sale of real estate (11,290) — (11,290) (59,477) (Gain) loss on sale of unconsolidated real estate assets (5,189) 2,952 (5,189) 2,952 Impairment of investment in unconsolidated real estate venture (2) — 6,522 — 6,522 EBITDAre $ 64,189 $ 47,395 $ 136,692 $ 105,082 Transaction and Other Costs (3) 2,270 1,372 4,852 6,681 Loss on extinguishment of debt — — — 33 Share-based compensation related to Formation Transaction and special equity awards 4,441 8,858 9,386 18,299 Earnings (losses) and distributions in excess of our investment in unconsolidated real estate venture (92) (245) (422) 129 Unconsolidated real estate ventures allocated share of above adjustments 9 747 40 1,465 Adjusted EBITDA $ 70,817 $ 58,127 $ 150,548 $ 131,689 Net Debt to Annualized Adjusted EBITDA (4) 7.6 x 8.1 x 7.2 x 7.2 x June 30, 2021 June 30, 2020 Net Debt (at JBG SMITH Share) Consolidated indebtedness (5) $ 1,979,494 $ 2,202,667 Unconsolidated indebtedness (5) 399,262 411,599 Total consolidated and unconsolidated indebtedness 2,378,756 2,614,266 Less: cash and cash equivalents 217,543 724,246 Net Debt (at JBG SMITH Share) $ 2,161,213 $ 1,890,020 |
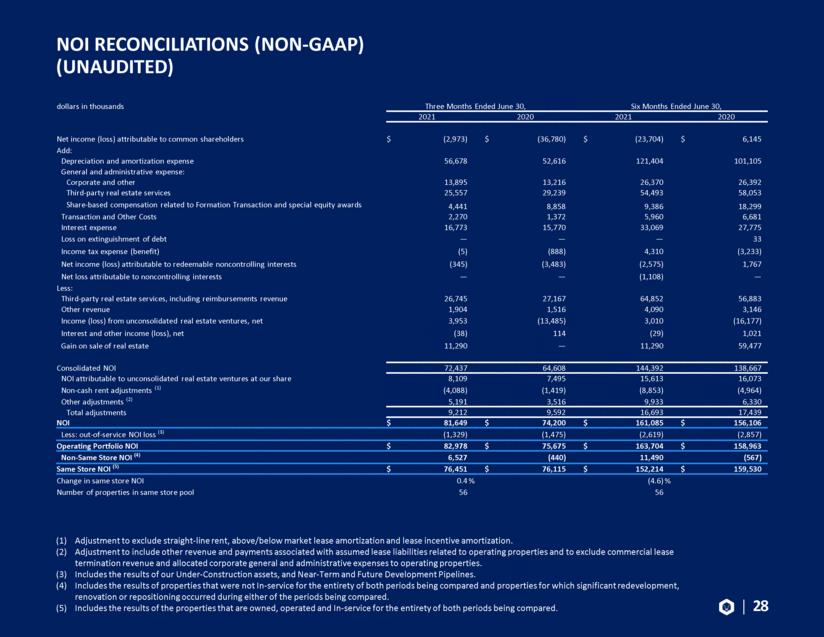
| NOI RECONCILIATIONS (NON-GAAP) (Unaudited) Adjustment to exclude straight-line rent, above/below market lease amortization and lease incentive amortization. Adjustment to include other revenue and payments associated with assumed lease liabilities related to operating properties and to exclude commercial lease termination revenue and allocated corporate general and administrative expenses to operating properties. Includes the results of our Under-Construction assets, and Near-Term and Future Development Pipelines. Includes the results of properties that were not In-service for the entirety of both periods being compared and properties for which significant redevelopment, renovation or repositioning occurred during either of the periods being compared. Includes the results of the properties that are owned, operated and In-service for the entirety of both periods being compared. 28 dollars in thousands Three Months Ended June 30, Six Months Ended June 30, 2021 2020 2021 2020 Net income (loss) attributable to common shareholders $ (2,973) $ (36,780) $ (23,704) $ 6,145 Add: Depreciation and amortization expense 56,678 52,616 121,404 101,105 General and administrative expense: Corporate and other 13,895 13,216 26,370 26,392 Third-party real estate services 25,557 29,239 54,493 58,053 Share-based compensation related to Formation Transaction and special equity awards 4,441 8,858 9,386 18,299 Transaction and Other Costs 2,270 1,372 5,960 6,681 Interest expense 16,773 15,770 33,069 27,775 Loss on extinguishment of debt — — — 33 Income tax expense (benefit) (5) (888) 4,310 (3,233) Net income (loss) attributable to redeemable noncontrolling interests (345) (3,483) (2,575) 1,767 Net loss attributable to noncontrolling interests — — (1,108) — Less: Third-party real estate services, including reimbursements revenue 26,745 27,167 64,852 56,883 Other revenue 1,904 1,516 4,090 3,146 Income (loss) from unconsolidated real estate ventures, net 3,953 (13,485) 3,010 (16,177) Interest and other income (loss), net (38) 114 (29) 1,021 Gain on sale of real estate 11,290 — 11,290 59,477 Consolidated NOI 72,437 64,608 144,392 138,667 NOI attributable to unconsolidated real estate ventures at our share 8,109 7,495 15,613 16,073 Non-cash rent adjustments (1) (4,088) (1,419) (8,853) (4,964) Other adjustments (2) 5,191 3,516 9,933 6,330 Total adjustments 9,212 9,592 16,693 17,439 NOI $ 81,649 $ 74,200 $ 161,085 $ 156,106 Less: out-of-service NOI loss (3) (1,329) (1,475) (2,619) (2,857) Operating Portfolio NOI $ 82,978 $ 75,675 $ 163,704 $ 158,963 Non-Same Store NOI (4) 6,527 (440) 11,490 (567) Same Store NOI (5) $ 76,451 $ 76,115 $ 152,214 $ 159,530 Change in same store NOI 0.4 % (4.6) % Number of properties in same store pool 56 56 |
| [LOGO] |