Exhibit 99.1
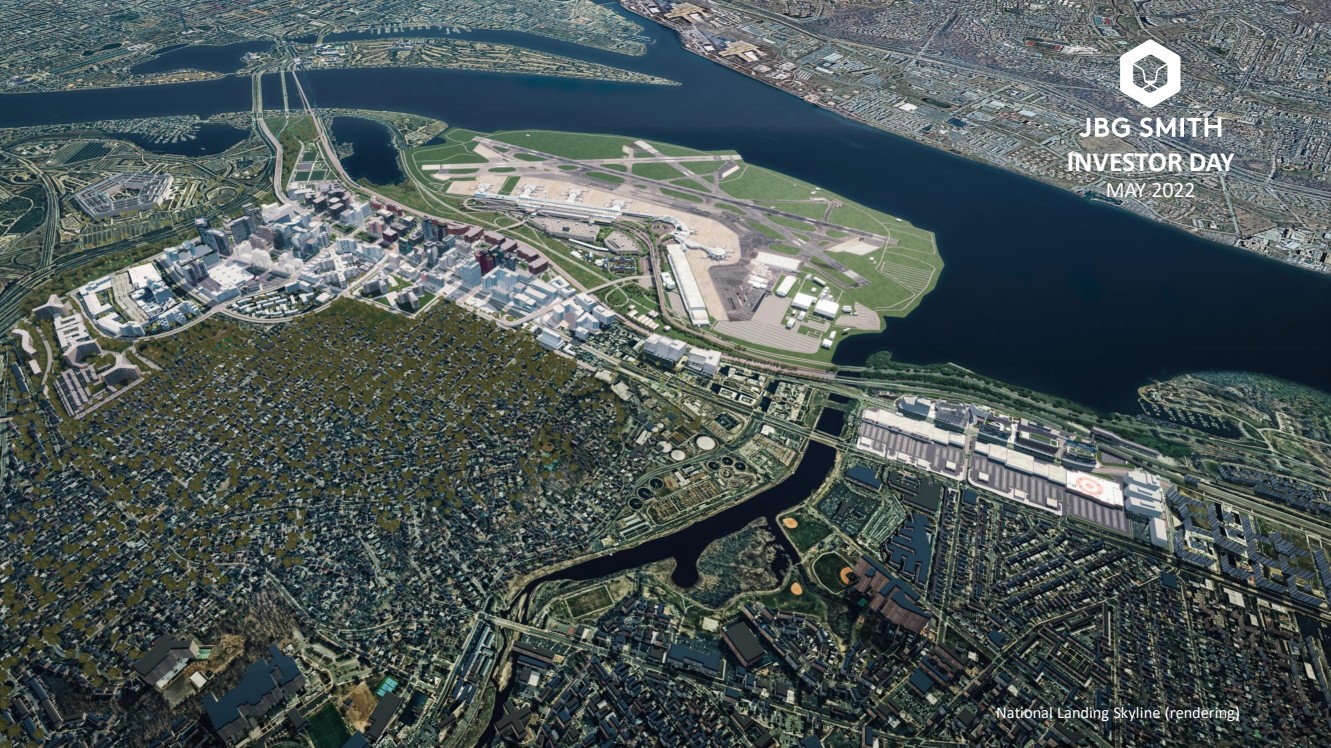
| National Landing Skyline (rendering) 1 INVESTOR DAY MAY 2022 |
| DISCLOSURES FORWARD - LOOKING STATEMENTS Certain statements contained herein may constitute “forward - looking statements” as such term is defined in Section 27 A of the Securities Act of 1933 , as amended, and Section 21 E of the Securities Exchange Act of 1934 , as amended .. Forward - looking statements are not guarantees of performance .. They represent our intentions, plans, expectations and beliefs and are subject to numerous assumptions, risks and uncertainties .. Consequently, the future results of JBG SMITH Properties (“JBG SMITH”, the “Company”, “we”, “us”, “our” or similar terms) may differ materially from those expressed in these forward - looking statements .. You can find many of these statements by looking for words such as “approximate”, “hypothetical”, “potential”, “believes”, “expects”, “anticipates”, “estimates”, “intends”, “plans”, “would”, “may” or similar expressions in this Investor Presentation .. Currently, one of the most significant factors that could cause actual outcomes to differ materially from our forward - looking statements is the adverse effect of the current pandemic of the novel coronavirus, or COVID - 19 , on our financial condition, results of operations, cash flows, Liquidity, performance, tenants, the real estate market and the global economy and financial markets .. The extent to which the COVID - 19 pandemic continues to impact us and our tenants depends on future developments, many of which are highly uncertain and cannot be predicted with confidence, including the scope, severity, and duration of the pandemic, the actions taken to contain the pandemic or mitigate its impact, the direct and indirect economic effects of the pandemic and containment measures, and whether the residential market in the Washington, DC region and any of our properties will be materially impacted by the expiration of various moratoriums on residential evictions, among others .. Moreover, investors are cautioned to interpret many of the risks identified under the section titled “Risk Factors” in our Annual Report on Form 10 - K for the fiscal year ended December 31 , 2021 as being heightened as a result of the ongoing and numerous adverse impacts of the COVID - 19 pandemic .. We also note the following may impact our forward - looking statements : the risks associated with the failure to enter into and/or complete contemplated acquisitions or dispositions within the price ranges anticipated and on the terms and timing anticipated, or at all ; the impact of COVID - 19 and the ensuing economic turmoil on our Company, net operating income, same store net operating income, net asset value, stock price, occupancy rates, revenue from our multifamily and commercial portfolios, operating costs, deferrals of rent, uncollectible operating lease receivables, parking revenue, and burn - off of rent abatement ; whether the recent decline in demand for office space will continue or accelerate and the impact of such decline on our ability to renew or lease - up expiring office space ; whether the assumptions on which our “Estimated NOI Bridge” is based will be realized ; whether we would be successful in securing the proceeds of our estimated potential multifamily borrowing capacity on attractive terms or at all ; the impact of disruptions to the credit and capital markets on our ability to access capital, including refinancing maturing debt ; changes to the amount and manner in which tenants use space ; whether we will harvest the anticipated value of our development pipeline ; whether we incur additional costs or make additional concessions or offer other incentives to existing or prospective tenants to reconfigure space ; whether the Washington, DC region will be more resilient than other parts of the country in any recession and whether DC metro asking rents will be more resilient than those in other gateway markets ; our annual dividend per share and dividend yield ; annualized net operating income ; whether in the case of our multifamily portfolio, our anticipated incremental annualized net operating income will be realized ; whether our future capital recycling efforts will be successful and will be at or above NAV ; whether in the case of our under - construction assets, estimated square feet, estimated number of units and in the case of our near - term and future development assets, estimated potential development density are accurate ; expected key Amazon .. com, Inc .. (“Amazon“) transaction terms and timeframes for closing the Pen Place sale ; the amount and timing of planned infrastructure and educational improvements in National Landing related to Amazon’s additional headquarters and the Virginia Tech Innovation Campus ; the economic impact, job growth and related demand for multifamily and commercial properties of Amazon’s additional headquarters on the DC region and National Landing and the speed with which such impact occurs and Amazon’s plans for accelerated hiring and in - person work requirements ; the impact of our role as the exclusive developer, property manager and retail leasing agent in connection with Amazon’s new headquarters ; our development plans related to Amazon’s additional headquarters ; whether National Landing will benefit economically from its proximity to the Department of Defense and elevated defense spending ; whether our plans related to our investment in 5 G wireless spectrum across National Landing will be a significant demand catalyst ; whether our target markets continue to be fast - growing ; whether future supply or construction delays will inhibit our ability to time new multifamily deliveries to meet market demand ; whether Amazon will have a similar growth impact on National Landing as in Seattle ; whether Seattle’s South Lake Union region pre - pandemic will prove to be an appropriate comparison to National Landing post - pandemic including respective resident preferences regarding housing, office location and commuting ; whether National Landing will experience the “Major Milestones“ on the timing discussed or at all ; whether anticipated near - term net operating income contributions, anticipated resiliency of the DC area and our contemplated shift to multifamily will be realized and, if realized, will have a positive impact on our share price ; in the case of our Under Construction and Near - Term Development Pipeline, the estimated completion date, stabilization date, estimated incremental investment, total investment, projected NOI, targeted NOI yield, estimated stabilized value and estimated value creation ; whether we will shift to majority multifamily on the timing anticipated or at all ; whether we can access agency debt secured by our currently unencumbered multifamily assets in a timely manner, in the amounts we estimate, on reasonable terms or at all ; whether our contemplated like - kind exchange of The Batley will occur ; whether 1900 Crystal Drive and 2000 and 2001 South Bell Street will generate the stabilized annualized NOI anticipated ; whether our newly delivered assets will stabilize on the timing anticipated and deliver the expected annualized NOI ; whether we will succeed in our contemplated recycling of disposition proceeds into acquisitions yielding the anticipated stabilized capitalization rates ; and whether the allocation of capital to our share repurchase plan has any impact on our share price .. 2 |
| DISCLOSURES Many of the factors that will determine the outcome of these and our other forward - looking statements are beyond our ability to control or predict .. These factors include, among others : adverse economic conditions in the Washington, DC metropolitan area, including in relation to COVID - 19 , the timing of and costs associated with development and property improvements, financing commitments, and general competitive factors .. For further discussion of factors that could materially affect the outcome of our forward - looking statements and other risks and uncertainties, see “Risk Factors,” “Management’s Discussion and Analysis of Financial Condition and Results of Operations” and the Cautionary Statement Concerning Forward - Looking Statements in the Company’s Annual Report on Form 10 - K for the year ended December 31 , 2021 and other periodic reports the Company files with the Securities and Exchange Commission .. For these statements, we claim the protection of the safe harbor for forward - looking statements contained in the Private Securities Litigation Reform Act of 1995 .. You are cautioned not to place undue reliance on our forward - looking statements .. All subsequent written and oral forward - looking statements attributable to us or any person acting on our behalf are expressly qualified in their entirety by the cautionary statements contained or referred to in this section .. We do not undertake any obligation to release publicly any revisions to our forward - looking statements to reflect events or circumstances occurring after the date hereof .. PRO RATA INFORMATION We present certain financial information and metrics in this release "at JBG SMITH Share," which refers to our ownership percentage of consolidated and unconsolidated assets in real estate ventures (collectively, "real estate ventures") as applied to these financial measures and metrics .. Financial information "at JBG SMITH Share" is calculated on an asset - by - asset basis by applying our percentage economic interest to each applicable line item of that asset's financial information .. "At JBG SMITH Share" information, which we also refer to as being "at share," "our pro rata share" or "our share," is not, and is not intended to be, a presentation in accordance with GAAP .. Given that a substantial portion of our assets are held through real estate ventures, we believe this form of presentation, which presents our economic interests in the partially owned entities, provides investors valuable information regarding a significant component of our portfolio, its composition, performance and capitalization .. We do not control the unconsolidated real estate ventures and do not have a legal claim to our co - venturers' share of assets, liabilities, revenue and expenses .. The operating agreements of the unconsolidated real estate ventures generally allow each co - venturer to receive cash distributions to the extent there is available cash from operations .. The amount of cash each investor receives is based upon specific provisions of each operating agreement and varies depending on certain factors including the amount of capital contributed by each investor and whether any investors are entitled to preferential distributions .. With respect to any such third - party arrangement, we would not be in a position to exercise sole decision - making authority regarding the property, real estate venture or other entity, and may, under certain circumstances, be exposed to economic risks not present were a third - party not involved .. We and our respective co - venturers may each have the right to trigger a buy - sell or forced sale arrangement, which could cause us to sell our interest, or acquire our co - venturers' interests, or to sell the underlying asset, either on unfavorable terms or at a time when we otherwise would not have initiated such a transaction .. Our real estate ventures may be subject to debt, and the repayment or refinancing of such debt may require equity capital calls .. To the extent our co - venturers do not meet their obligations to us or our real estate ventures or they act inconsistent with the interests of the real estate venture, we may be adversely affected .. Because of these limitations, the non - GAAP "at JBG SMITH Share" financial information should not be considered in isolation or as a substitute for our financial statements as reported under GAAP .. MARKET DATA Market data and industry forecasts are used in this Investor Presentation, including data obtained from publicly available sources .. These sources generally state that the information they provide has been obtained from sources believed to be reliable, but the accuracy and completeness of the information is not assured .. We have not independently verified any such information .. 3 |
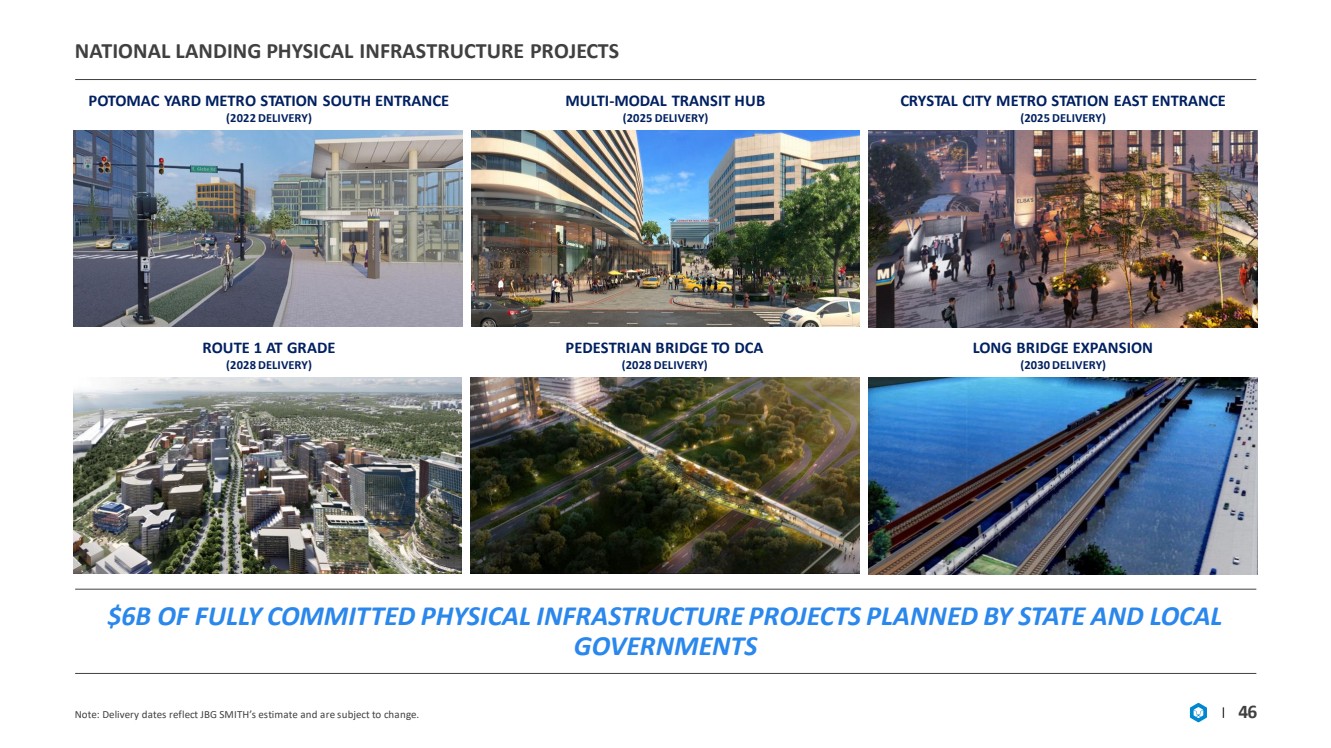
| DISCLOSURES AMAZON In November 2018 , Amazon announced it had selected sites in National Landing as the location of its new headquarters .. We currently have leases with Amazon totaling 1 .. 0 million square feet at six office buildings in National Landing .. In March 2019 , we executed purchase and sale agreements with Amazon for two of our National Landing development sites, Metropolitan Park and Pen Place, on which Amazon is constructing its new headquarters .. We are currently constructing two new office buildings for Amazon on Metropolitan Park, totaling 2 .. 1 million square feet, inclusive of over 50 , 000 square feet of street - level retail with new shops and restaurants .. In December 2021 , we finalized the agreement for the sale of Pen Place to Amazon for $ 198 .. 0 million, which represents a $ 48 .. 1 million increase over the previously estimated contract value .. The sale of Pen Place to Amazon is expected to close, subject to customary closing conditions, during the second quarter of 2022 .. We are the developer, property manager and retail leasing agent for Amazon's new headquarters at National Landing .. In connection with Amazon's new headquarters in National Landing, the Commonwealth of Virginia enacted an incentives bill, which provides tax incentives to Amazon to create a minimum of 25 , 000 new full - time jobs and potentially 37 , 850 full - time jobs in National Landing with average annual wage targets for each calendar year, starting with $ 150 , 000 in 2019 , and escalating 1 .. 5 % per year .. JBG SMITH, alongside Amazon, Virginia Tech, and federal, state and local governments plan to invest more than $ 12 .. 4 billion, including infrastructure investments, that will directly benefit National Landing .. This includes approximately $ 6 billion of infrastructure investments planned by state and local governments, which is fully committed, including : lowering of elevated sections of U .. S .. Route 1 that currently divide parts of National Landing to create better multimodal access and walkability ; two new Metro entrances (Crystal Drive and Potomac Yard) ; a pedestrian bridge to Reagan National Airport ; a new commuter rail station located between two of our Crystal Drive office assets ; and Long Bridge, the planned two - track rail connection between Washington, DC and National Landing .. We include certain statistics in the following slides as outlined in the Memorandum of Understanding (MOU) between Amazon and the Commonwealth of Virginia, executed on November 12 , 2018 , and that identify the proximity of our portfolio to National Landing : specifically, 96 % of our portfolio, excluding non - core assets, is within a 20 - minute commute of National Landing, as calculated on a pre - COVID - 19 Monday morning .. We include references to the percentage of Amazon employees who elected to live within walking or biking distance to Amazon’s headquarters in Seattle, as well as the percentage of our portfolio that is within a 20 - minute commute of National Landing .. These percentages are based on pre - COVID - 19 data .. Due to Amazon’s recently announced policies regarding remote work, the pre - pandemic nature of the Seattle data and other factors, we can make no assurance that these data will be comparable for employees who work at Amazon’s HQ 2 in National Landing .. VIRGINIA TECH In the fall of 2020 , Virginia Tech virtually launched the inaugural academic year of its currently under construction $ 1 billion Innovation Campus in National Landing .. This expected powerful demand driver sits adjacent to 2 .. 0 million square feet of development density we own in National Landing and a new, under - construction Potomac Yard Metro station, all approximately one mile south of Amazon's new headquarters .. The campus is part of a 20 - acre innovation district, of which the fully entitled first phase encompasses approximately 1 .. 7 million square feet of space, including four office towers and two residential buildings, with ground - level retail .. On this campus, Virginia Tech intends to create an innovation ecosystem by co - locating academic and private sector uses to accelerate research and development spending, as well as the commercialization of technology .. When the Innovation Campus is fully operational, Virginia Tech plans to annually graduate approximately 750 master students and 150 PhD students in STEM fields .. Virginia Tech, which is expected to occupy 675 , 000 square feet in the Innovation Campus, is also attracting funding from STEM employers (technology, defense and aerospace), including over $ 65 million publicly announced to date from Amazon, Boeing and Northrop Grumman .. 4 |
| DISCLOSURES DISPOSITION AND RECAPITALIZATION ACTIVITY SUBSEQUENT TO MARCH 31 , 2022 – ADJUSTMENT OF CALCULATIONS On April 1 , 2022 , we sold the Universal Buildings, commercial assets located in Washington DC, for $ 228 .. 0 million .. On April 13 , 2022 , we formed an unconsolidated real estate venture with affiliates of Fortress Investment Group LLC (“Fortress”) to recapitalize a 1 .. 6 million square foot office portfolio and land parcels valued at $ 580 .. 0 million comprising four wholly owned commercial assets ( 7200 Wisconsin Avenue, 1730 M Street, RTC - West/RTC - West Trophy Office/RTC - West Land and Courthouse Plaza 1 and 2 ), which were classified as assets held for sale as of March 31 , 2022 .. Fortress contributed $ 131 .. 0 million for a 66 .. 5 % interest in the venture .. In connection with the transaction, the real estate venture obtained mortgage loans totaling $ 458 .. 0 million secured by the properties, of which $ 402 .. 0 million was drawn at closing .. We will provide asset management, property management and leasing services to the venture .. Because our interest in the venture is subordinated to a 15 % preferred return to Fortress, we do not anticipate receiving any near - term cash flow distributions from it .. Where noted and going forward, these assets will be excluded from the occupancy, non - GAAP financial measures, and leverage metrics presented in our presentation .. On April 29 , 2022 , we sold a 99 - year term leasehold interest in a future development asset located in Reston, VA .. DEFINITIONS AND RECONCILIATIONS For certain definitions and reconciliations see pages 52 – 58 .. 5 |
| AGENDA 6 1 2 3 4 5 JBG SMITH TRANSFORMATION OPERATING PORTFOLIO HIGHLIGHTS GROWTH AND CAPITALIZATION NOI BRIDGE AND LIQUIDITY Q&A 6 APPENDIX |
| JBG SMITH TRANSFORMATION |
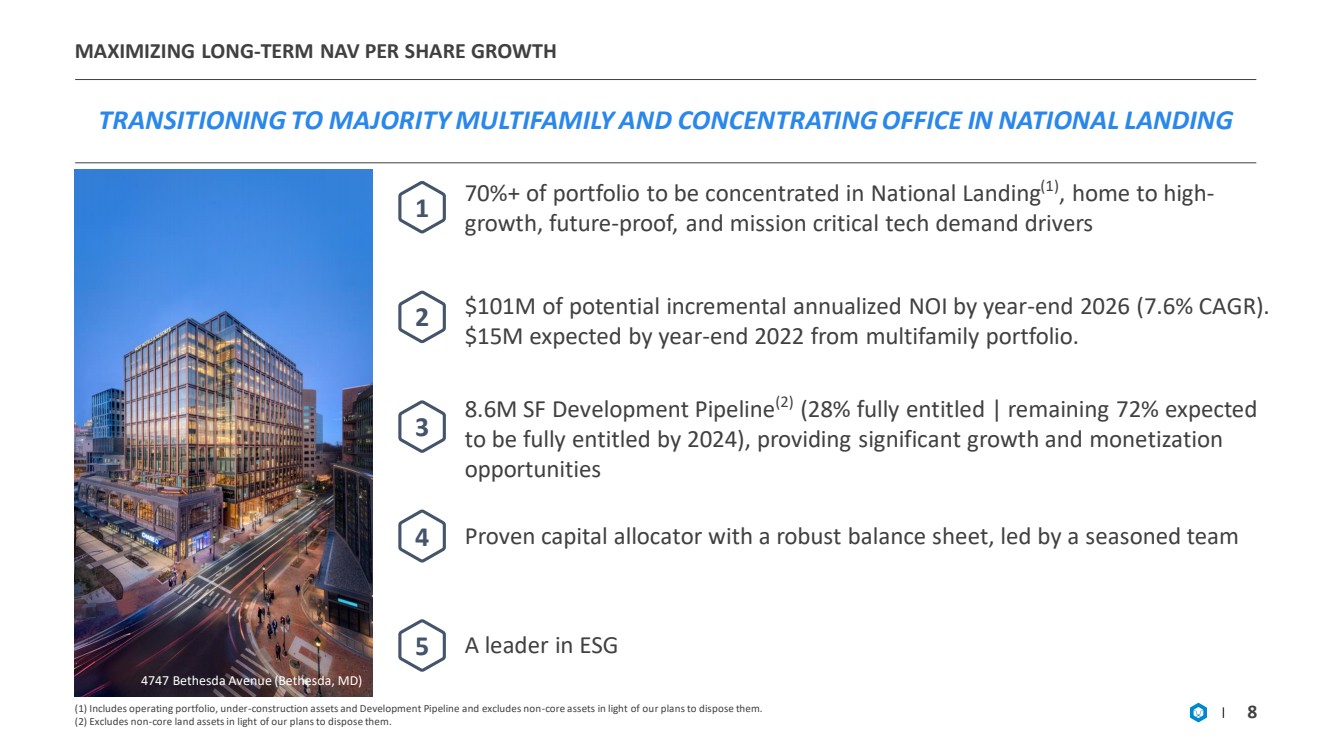
| MAXIMIZING LONG - TERM NAV PER SHARE GROWTH TRANSITIONING TO MAJORITY MULTIFAMILY AND CONCENTRATING OFFICE I N NATIONAL LANDING (1) Includes operating portfolio, under - construction assets and Development Pipeline and excludes non - core assets in light of ou r plans to dispose them. (2) Excludes non - core land assets in light of our plans to dispose them. 8 70%+ of portfolio to be concentrated in National Landing (1) , home to high - growth, future - proof, and mission critical tech demand drivers 1 2 3 4 8.6M SF Development Pipeline (2) (28% fully entitled | remaining 72% expected to be fully entitled by 2024), providing significant growth and monetization opportunities $101M of potential incremental annualized NOI by year - end 2026 (7.6% CAGR). $15M expected by year - end 2022 from multifamily portfolio. Proven capital allocator with a robust balance sheet, led by a seasoned team 4747 Bethesda Avenue (Bethesda, MD) 5 A leader in ESG |
| LEADING ON ESG 9 • Achieved Carbon Neutral operations • 5 - star rating (2020 - 2021) • Global Sector Leader (2021) • Leader in the Light Award (2021) • Fitwel Viral Response Certification • Fitwel Champion • “Best ESG Investment Fund: Real Estate” by ESG Investing (2022) • JBGS - managed Impact Pool financed 1,750 affordable workforce housing units • Published inaugural D&I report • Founding member of Nareit’s Dividends Through Diversity, Equity & Inclusion CEO council • Diverse Board of Trustees • Newsweek’s America’s Most Responsible Companies (2020 - 2022) • The Washington Post Top Workplaces (2020) DIVERSITY & INCLUSION |
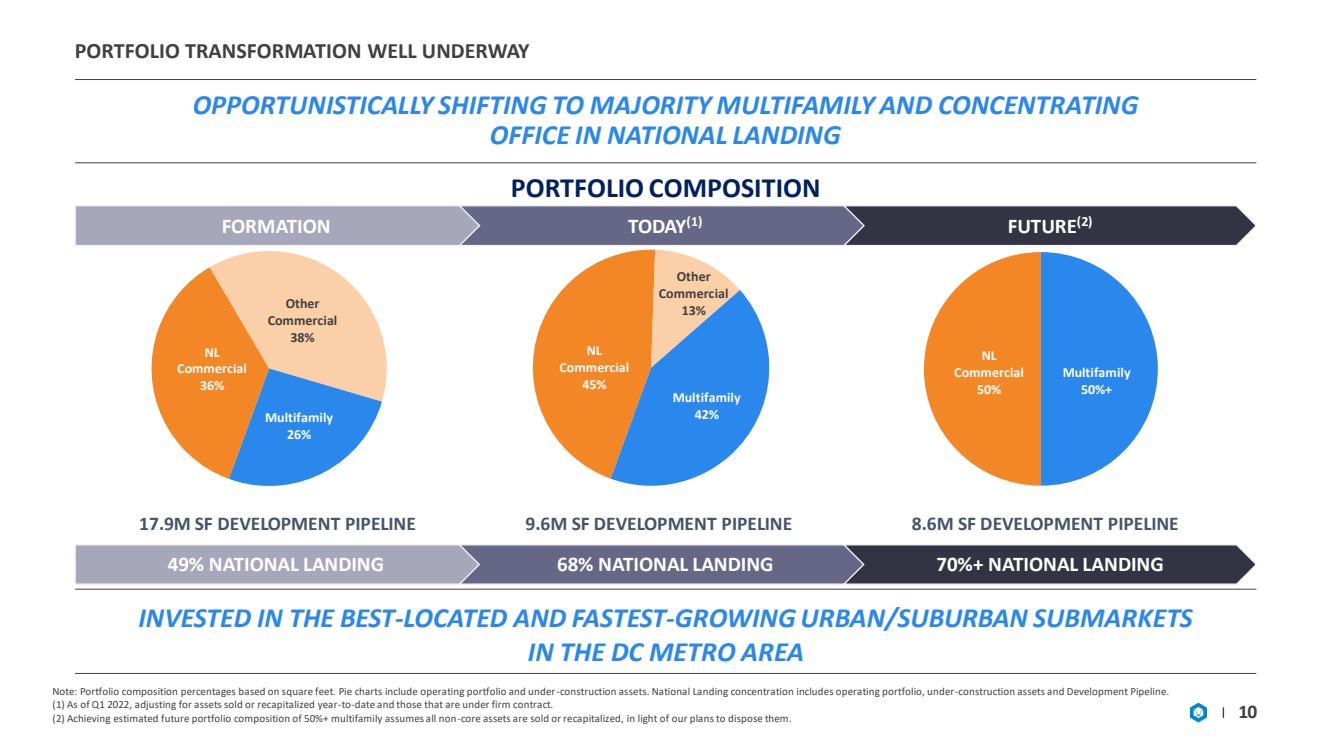
| PORTFOLIO TRANSFORMATION WELL UNDERWAY OPPORTUNISTICALLY SHIFTING TO MAJORITY MULTIFAMILY AND CONCENTRA TING OFFICE IN NATIONAL LANDING 10 PORTFOLIO COMPOSITION FORMATION TODAY (1) FUTURE (2) INVESTED IN THE BEST - LOCATED AND FASTEST - GROWING URBAN/SUBURBAN SUBMARKETS IN THE DC METRO AREA Note: Portfolio composition percentages based on square feet. Pie charts include operating portfolio and under - construction asse ts. National Landing concentration includes operating portfolio, under - construction assets and Development Pipeline. (1) As of Q1 2022, adjusting for assets sold or recapitalized year - to - date and those that are under firm contract. (2) Achieving estimated future portfolio composition of 50%+ multifamily assumes all non - core assets are sold or recapitalized, in light of our plans to dispose them. NL Commercial 36% Other Commercial 38% Multifamily 26% NL Commercial 45% Other Commercial 13% Multifamily 42% NL Commercial 50% Multifamily 50% + 49% NATIONAL LANDING 68% NATIONAL LANDING 70%+ NATIONAL LANDING 17.9M SF DEVELOPMENT PIPELINE 9.6M SF DEVELOPMENT PIPELINE 8.6M SF DEVELOPMENT PIPELINE |
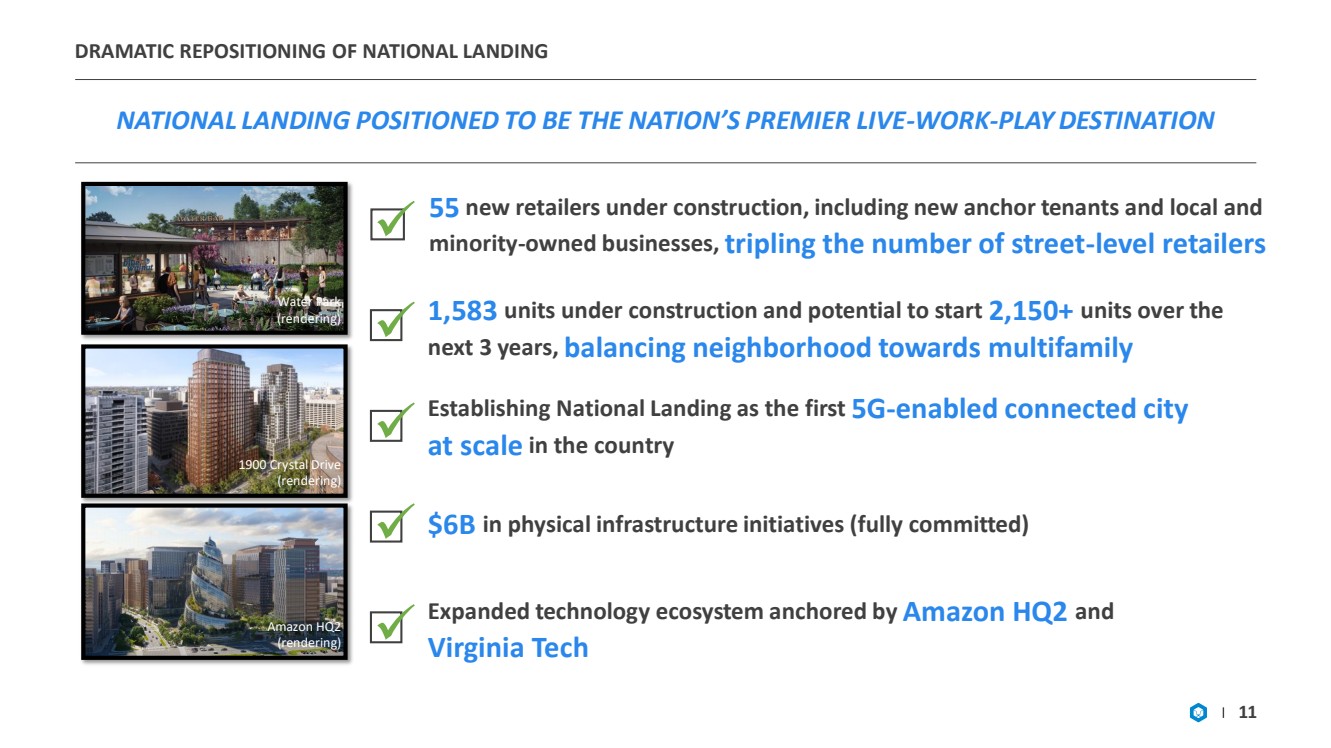
| DRAMATIC REPOSITIONING OF NATIONAL LANDING NATIONAL LANDING POSITIONED TO BE THE NATION’S PREMIER LIVE - WORK - PLAY DESTINATION 11 1,583 units under construction and potential to start 2,150+ units over the next 3 years, balancing neighborhood towards multifamily ✓ 55 new retailers under construction, including new anchor tenants and local and minority - owned businesses, tripling the number of street - level retailers ✓ Establishing National Landing as the first 5G - enabled connected city at scale in the country ✓ ✓ $6B in physical infrastructure initiatives (fully committed) ✓ Expanded technology ecosystem anchored by Amazon HQ2 and Virginia Tech Water Park (rendering) 1900 Crystal Drive (rendering) Amazon HQ2 (rendering) |
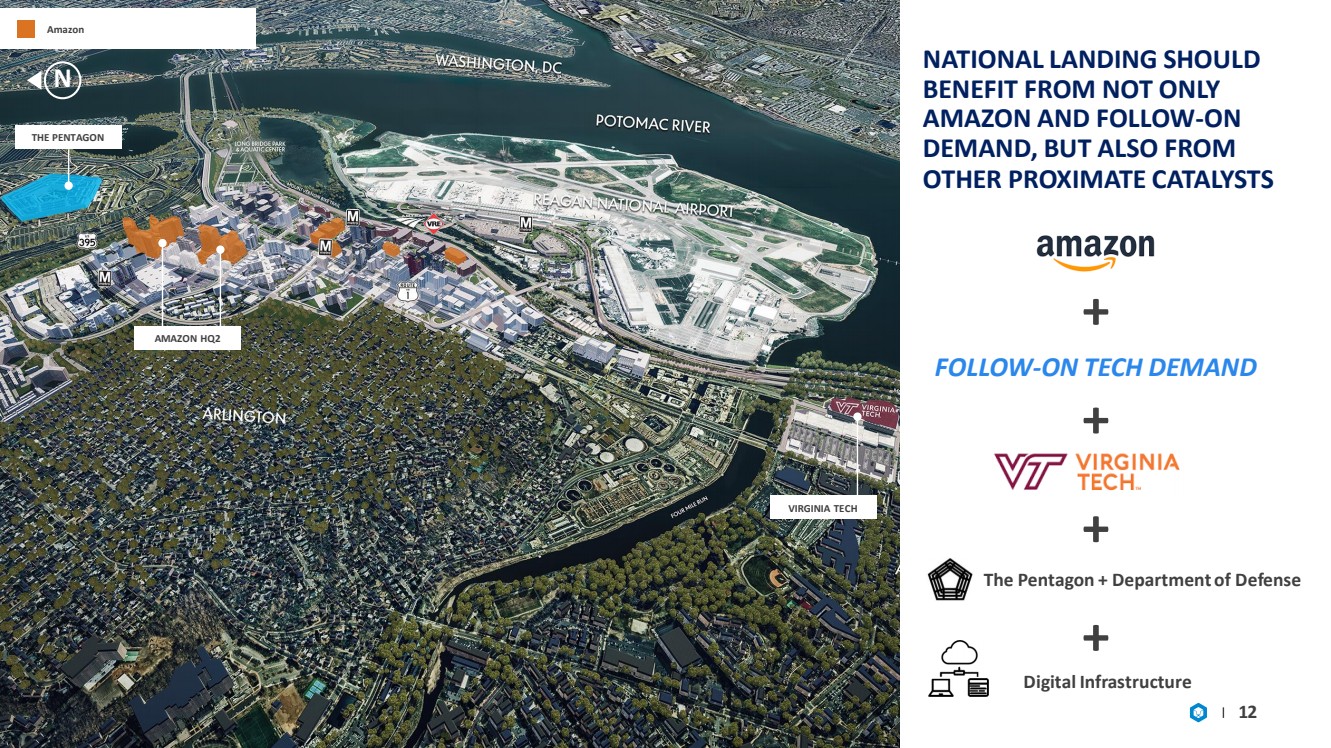
| 12 NATIONAL LANDING SHOULD BENEFIT FROM NOT ONLY AMAZON AND FOLLOW - ON DEMAND, BUT ALSO FROM OTHER PROXIMATE CATALYSTS FOLLOW - ON TECH DEMAND Digital Infrastructure + 1 MI. RADIUS 1 MILE RADIUS THE PENTAGON AMAZON HQ2 VIRGINIA TECH + + The Pentagon + Department of Defense + N Amazon |
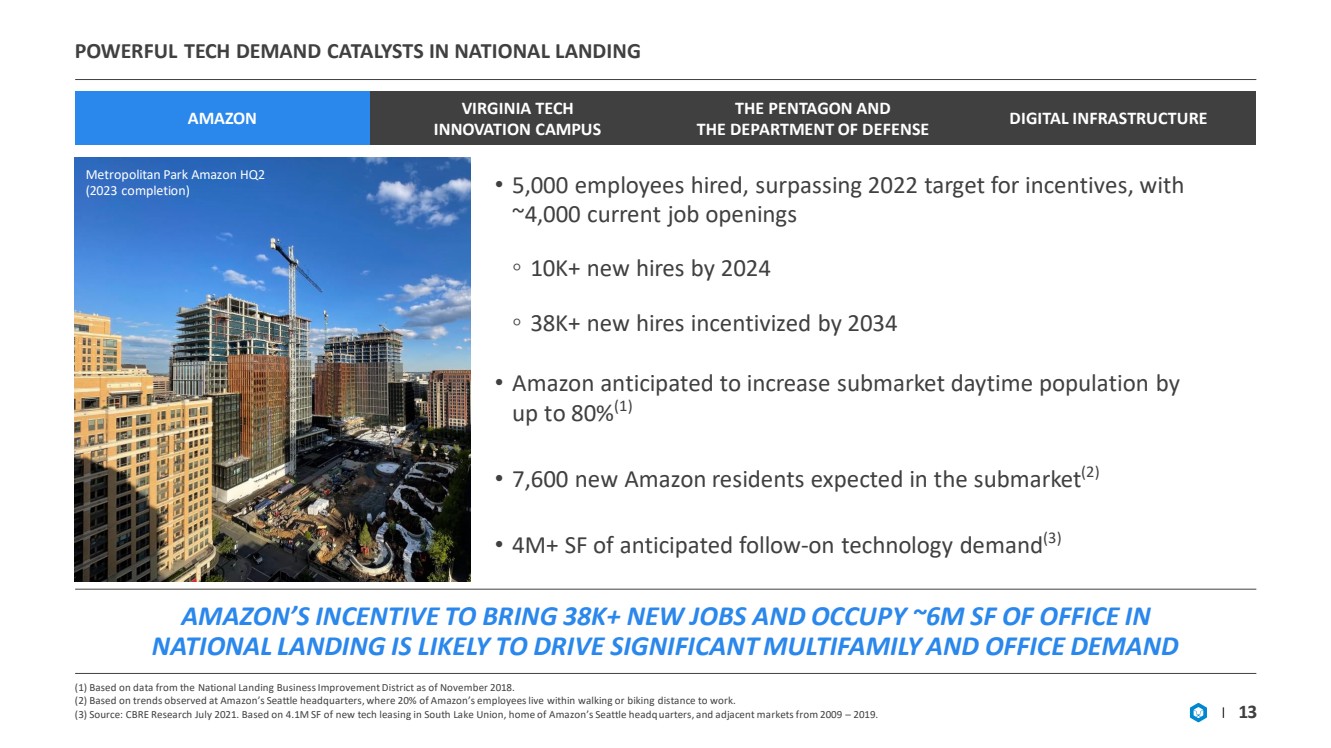
| POWERFUL TECH DEMAND CATALYSTS IN NATIONAL LANDING (1) Based on data from the National Landing Business Improvement District as of November 2018. (2) Based on trends observed at Amazon’s Seattle headquarters, where 20% of Amazon’s employees live within walking or biking dis tance to work. (3) Source: CBRE Research July 2021. Based on 4.1M SF of new tech leasing in South Lake Union, home of Amazon’s Seattle headq uar ters, and adjacent markets from 2009 – 2019. 13 • 5,000 employees hired, surpassing 2022 target for incentives, with ~4,000 current job openings ◦ 10K+ new hires by 2024 ◦ 38K+ new hires incentivized by 2034 • Amazon anticipated to increase submarket daytime population by up to 80% (1) • 7,600 new Amazon residents expected in the submarket (2) • 4M+ SF of anticipated follow - on technology demand (3) Metropolitan Park Amazon HQ2 (2023 completion) AMAZON VIRGINIA TECH INNOVATION CAMPUS THE PENTAGON AND THE DEPARTMENT OF DEFENSE DIGITAL INFRASTRUCTURE AMAZON’S INCENTIVE TO BRING 38K+ NEW JOBS AND OCCUPY ~6M SF OF OFFICE IN NATIONAL LANDING IS LIKELY TO DRIVE SIGNIFICANT MULTIFAMILY AND OFFICE DEMAND |
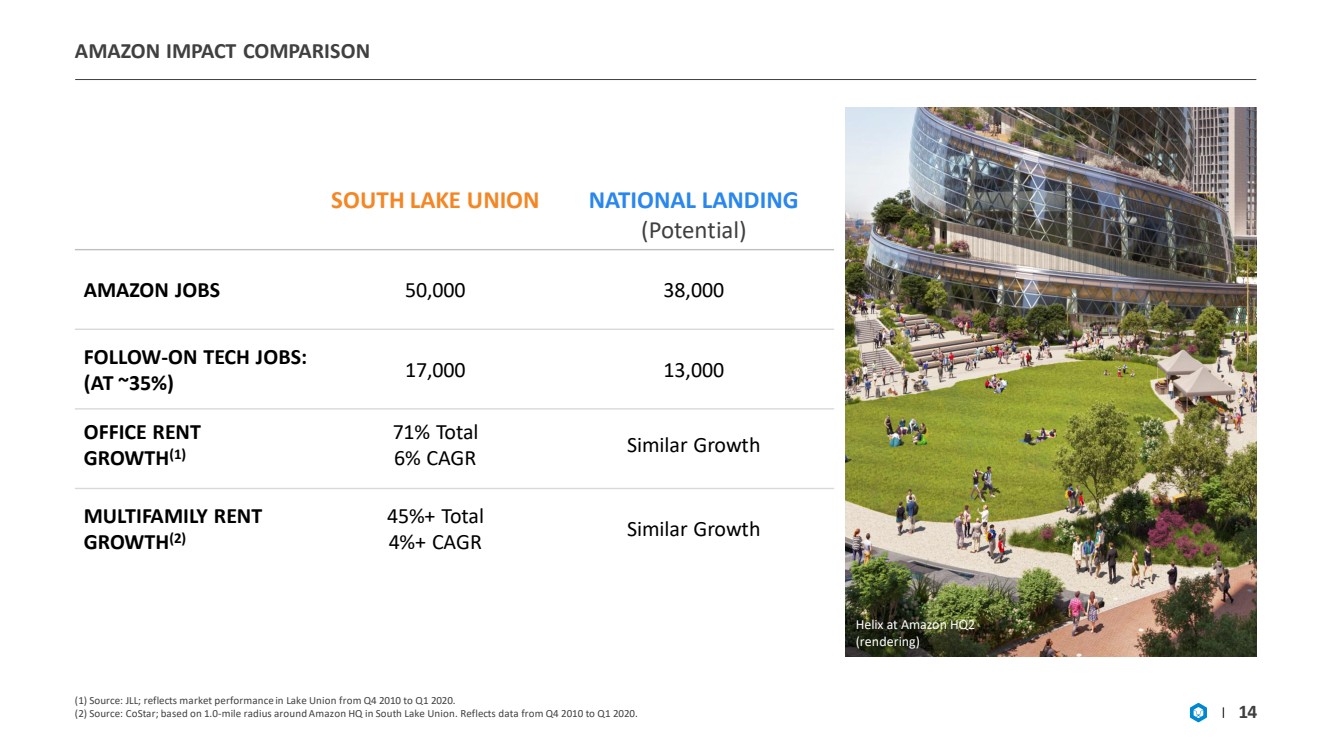
| AMAZON IMPACT COMPARISON (1) Source: JLL; reflects market performance in Lake Union from Q4 2010 to Q1 2020. (2) Source: CoStar; based on 1.0 - mile radius around Amazon HQ in South Lake Union. Reflects data from Q4 2010 to Q1 2020. 14 SOUTH LAKE UNION NATIONAL LANDING (Potential) AMAZON JOBS 50,000 38,000 FOLLOW - ON TECH JOBS: (AT ~35%) 17,000 13,000 OFFICE RENT GROWTH (1) 71% Total 6% CAGR Similar Growth MULTIFAMILY RENT GROWTH (2) 45%+ Total 4%+ CAGR Similar Growth Helix at Amazon HQ2 (rendering) |
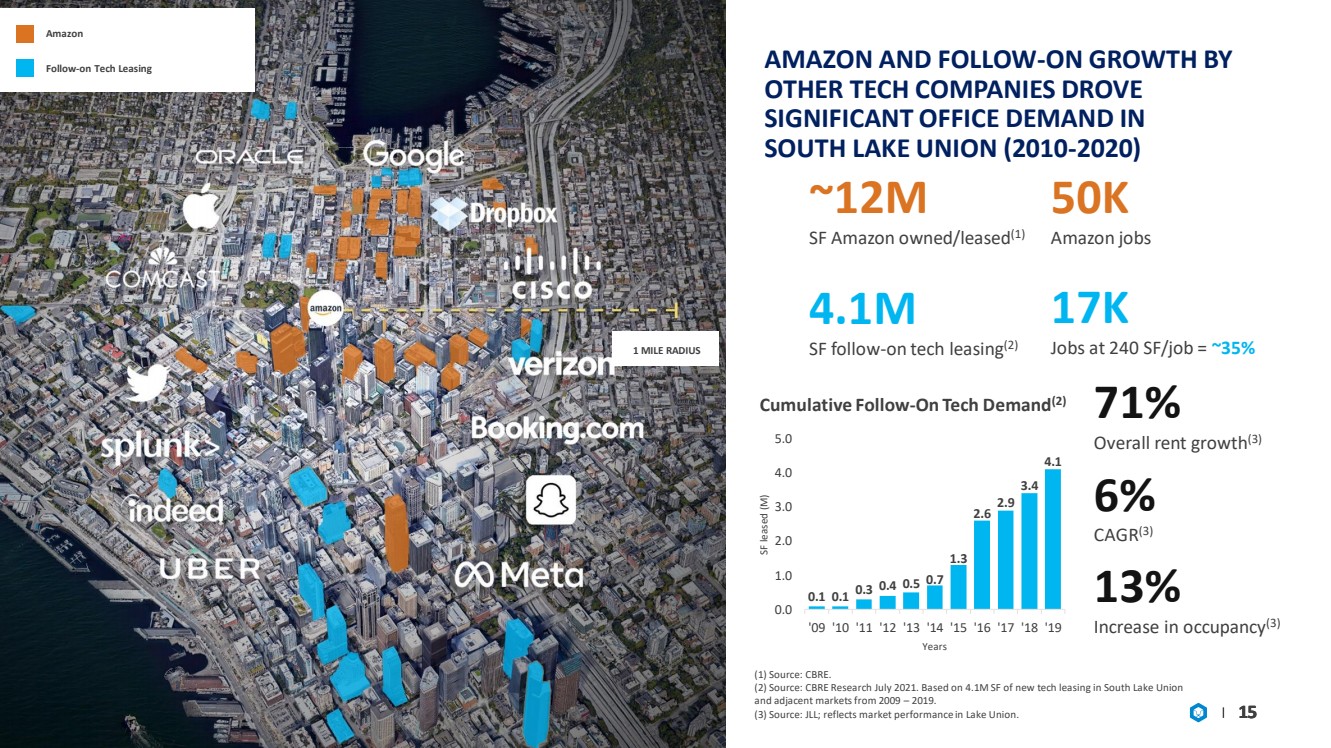
| 15 17K Jobs at 240 SF/job = ~35% AMAZON AND FOLLOW - ON GROWTH BY OTHER TECH COMPANIES DROVE SIGNIFICANT OFFICE DEMAND IN SOUTH LAKE UNION (2010 - 2020) 15 Cumulative Follow - On Tech Demand (2) 15 71% Overall rent growth (3) 6% CAGR (3) 13% Increase in occupancy (3) 0.1 0.1 0.3 0.4 0.5 0.7 1.3 2.6 2.9 3.4 4.1 0.0 1.0 2.0 3.0 4.0 5.0 '09 '10 '11 '12 '13 '14 '15 '16 '17 '18 '19 SF leased (M) Years 50K Amazon jobs (1) Source: CBRE. (2) Source: CBRE Research July 2021. Based on 4.1M SF of new tech leasing in South Lake Union and adjacent markets from 2009 – 2019. (3) Source: JLL; reflects market performance in Lake Union. 4.1M SF follow - on tech leasing (2) ~12M SF Amazon owned/leased (1) Amazon Follow - on Tech Leasing 1 MILE RADIUS |
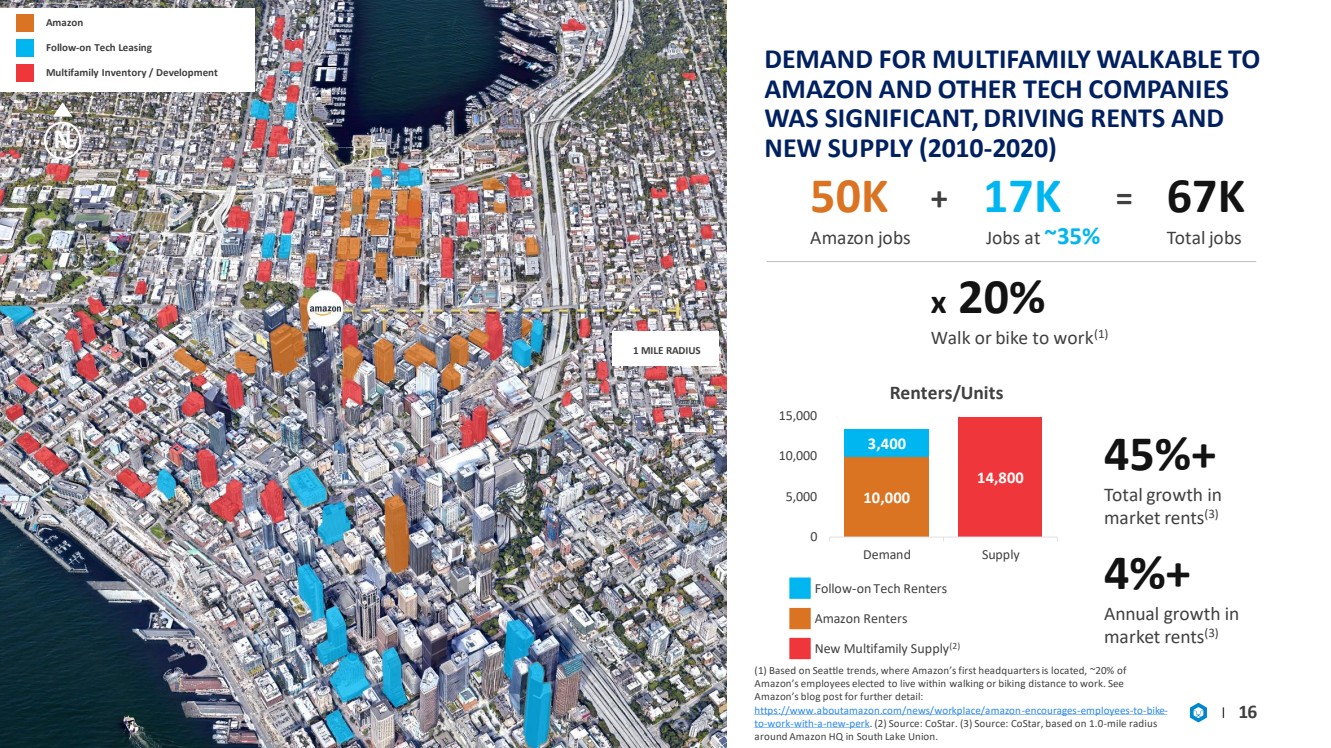
| 16 DEMAND FOR MULTIFAMILY WALKABLE TO AMAZON AND OTHER TECH COMPANIES WAS SIGNIFICANT, DRIVING RENTS AND NEW SUPPLY (2010 - 2020) 10,000 14,800 3,400 0 5,000 10,000 15,000 Demand Supply Renters/Units 45%+ Total growth in market rents (3) 4%+ Annual growth in market rents (3) 50K 67K 17K + = Amazon jobs Jobs at ~35% Total jobs x 20% Walk or bike to work (1) New Multifamily Supply (2) Follow - on Tech Renters Amazon Renters (1) Based on Seattle trends, where Amazon’s first headquarters is located, ~20% of Amazon’s employees elected to live within walking or biking distance to work. See Amazon’s blog post for further detail: https://www.aboutamazon.com/news/workplace/amazon - encourages - employees - to - bike - to - work - with - a - new - perk .. (2) Source: CoStar. (3) Source: CoStar, based on 1.0 - mile radius around Amazon HQ in South Lake Union. N Amazon Follow - on Tech Leasing Multifamily Inventory / Development 1 MILE RADIUS |
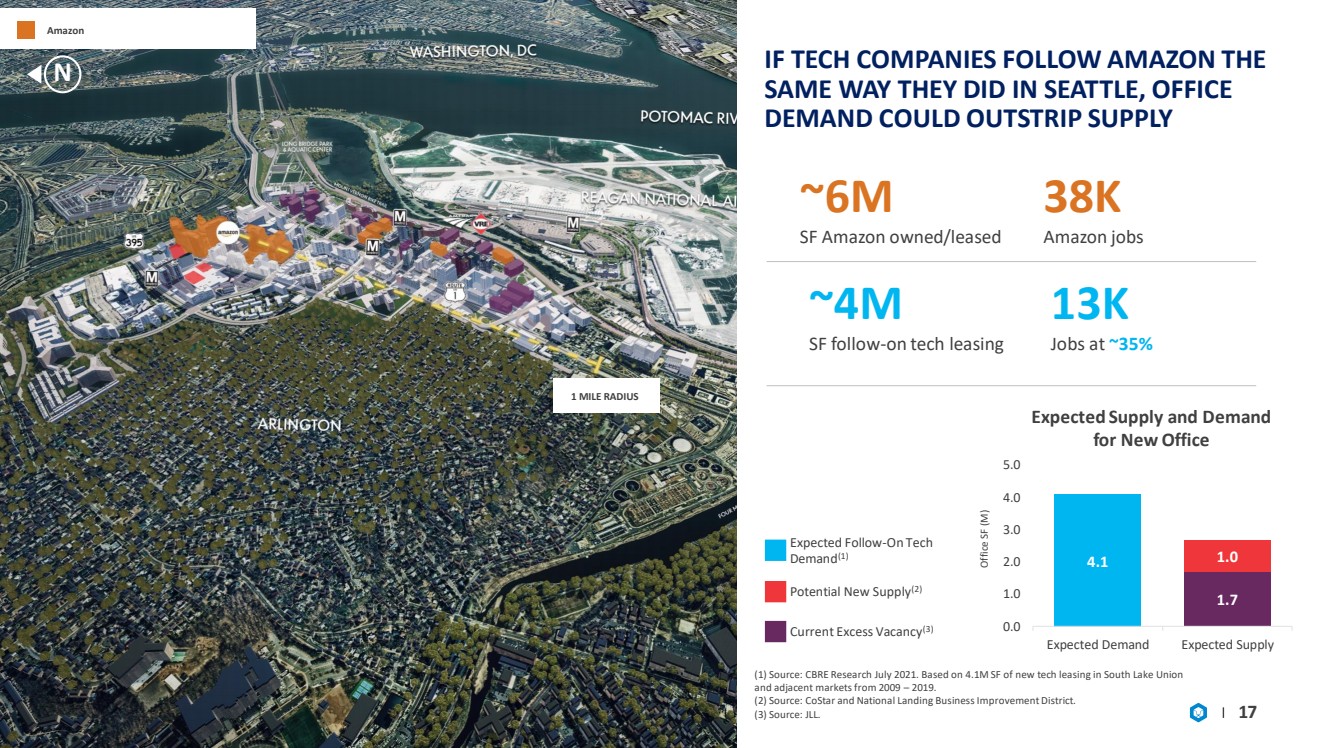
| 17 4.1 1.7 1 ..0 0.0 1.0 2.0 3.0 4.0 5.0 Expected Demand Expected Supply Office SF (M) Expected Supply and Demand for New Office ~6M SF Amazon owned/leased 38K Amazon jobs IF TECH COMPANIES FOLLOW AMAZON THE SAME WAY THEY DID IN SEATTLE, OFFICE DEMAND COULD OUTSTRIP SUPPLY ~4M SF follow - on tech leasing 13K Jobs at ~35% Potential New Supply (2) Current Excess Vacancy (3) Expected Follow - On Tech Demand (1) (1) Source: CBRE Research July 2021. Based on 4.1M SF of new tech leasing in South Lake Union and adjacent markets from 2009 – 2019. (2) Source: CoStar and National Landing Business Improvement District. (3) Source: JLL. N Amazon 1 MILE RADIUS |
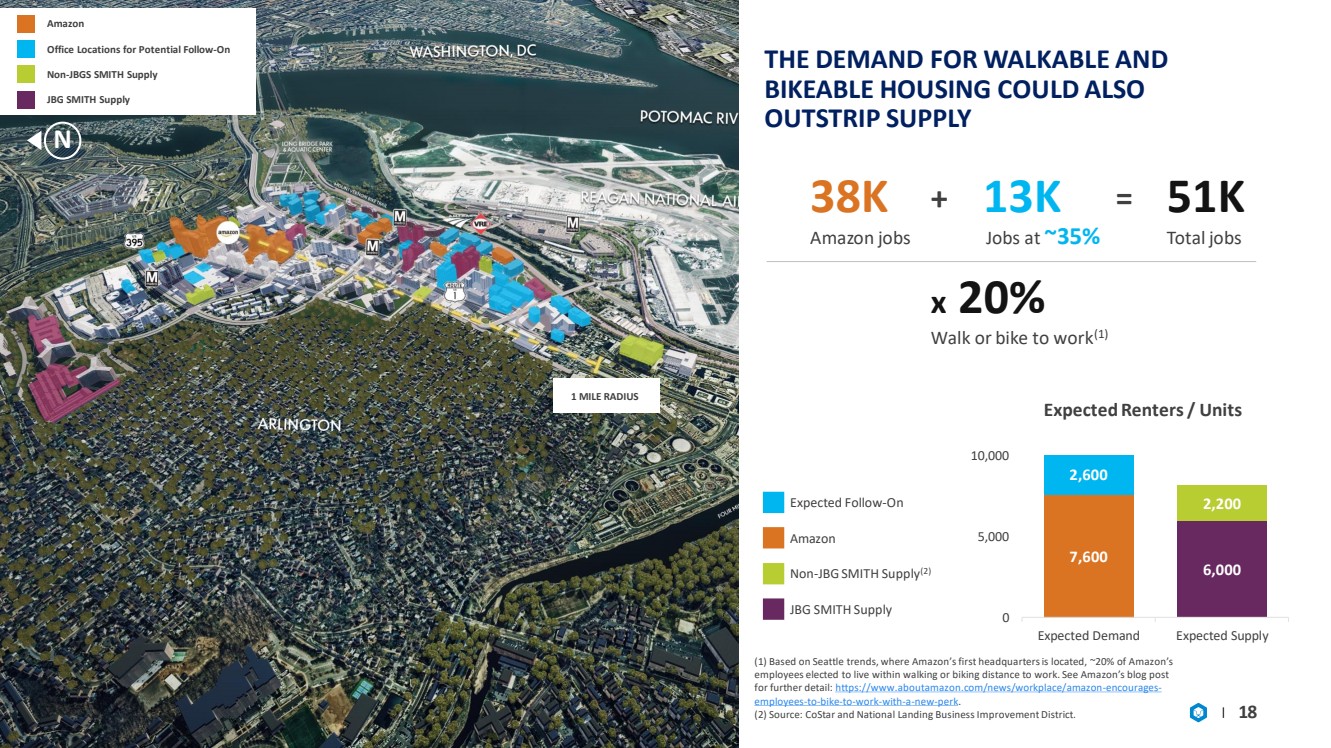
| 18 7,600 6,000 2,600 2,200 0 5,000 10,000 Expected Demand Expected Supply Expected Renters / Units THE DEMAND FOR WALKABLE AND BIKEABLE HOUSING COULD ALSO OUTSTRIP SUPPLY 38K 51K 13K + = Amazon jobs Jobs at ~35% Total jobs JBG SMITH Supply Expected Follow - On Amazon Non - JBG SMITH Supply (2) x 20% Walk or bike to work (1) (1) Based on Seattle trends, where Amazon’s first headquarters is located, ~20% of Amazon’s employees elected to live within walking or biking distance to work. See Amazon’s blog post for further detail: https://www.aboutamazon.com/news/workplace/amazon - encourages - employees - to - bike - to - work - with - a - new - perk .. (2) Source: CoStar and National Landing Business Improvement District. N Amazon Office Locations for Potential Follow - On Non - JBGS SMITH Supply JBG SMITH Supply 1 MILE RADIUS |
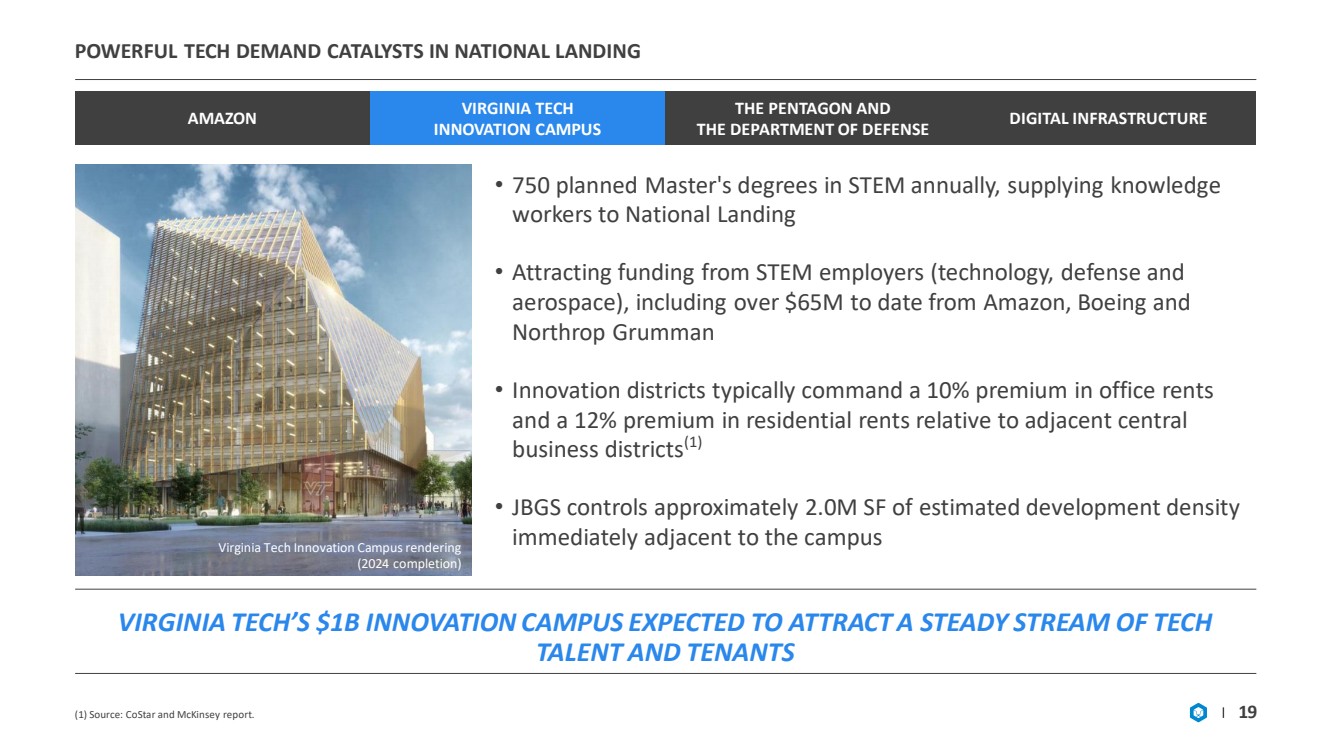
| POWERFUL TECH DEMAND CATALYSTS IN NATIONAL LANDING (1) Source: CoStar and McKinsey report. 19 • 750 planned Master's degrees in STEM annually, supplying knowledge workers to National Landing • Attracting funding from STEM employers (technology, defense and aerospace), including over $65M to date from Amazon, Boeing and Northrop Grumman • Innovation districts typically command a 10% premium in office rents and a 12% premium in residential rents relative to adjacent central business districts (1) • JBGS controls approximately 2.0M SF of estimated development density immediately adjacent to the campus Virginia Tech Innovation Campus rendering (2024 completion) VIRGINIA TECH’S $1B INNOVATION CAMPUS EXPECTED TO ATTRACT A STEADY STREAM OF TECH TALENT AND TENANTS AMAZON VIRGINIA TECH INNOVATION CAMPUS THE PENTAGON AND THE DEPARTMENT OF DEFENSE DIGITAL INFRASTRUCTURE |
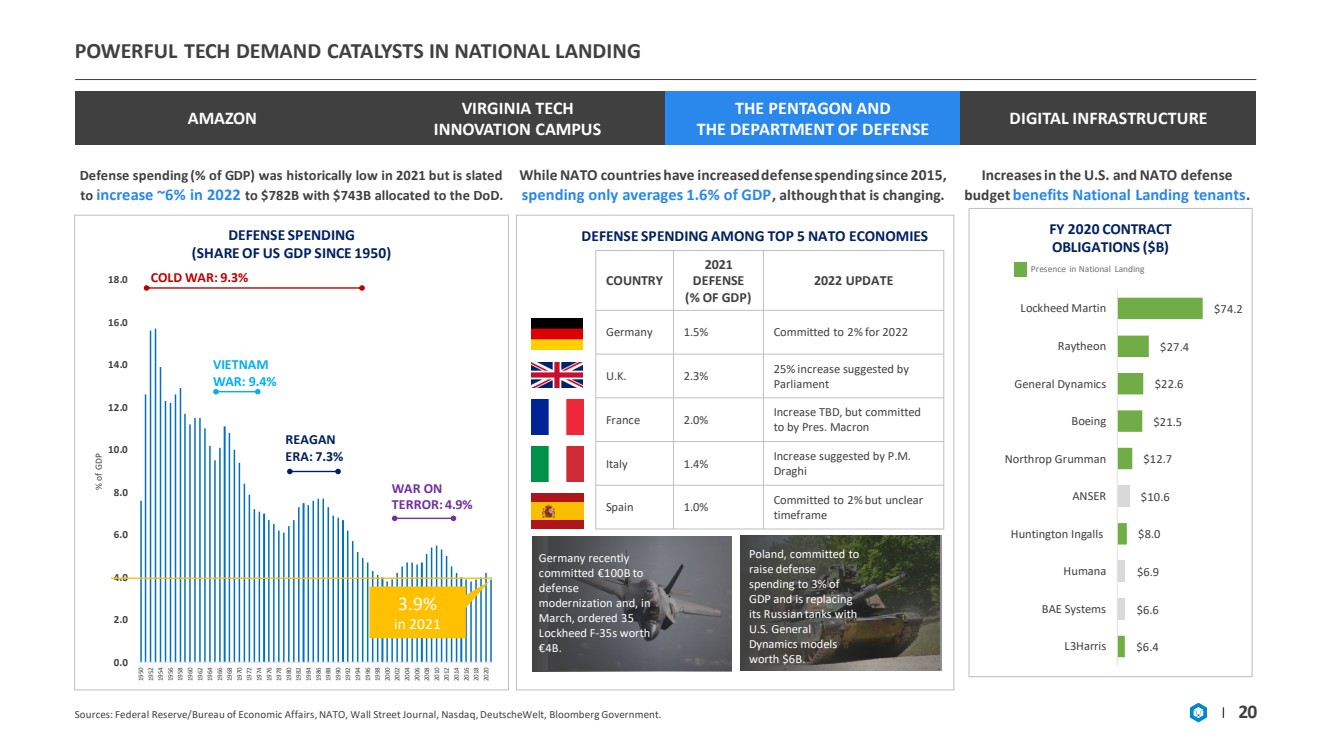
| $6.4 $6.6 $6.9 $8.0 $10.6 $12.7 $21.5 $22.6 $27.4 $74.2 L3Harris BAE Systems Humana Huntington Ingalls ANSER Northrop Grumman Boeing General Dynamics Raytheon Lockheed Martin FY 2020 CONTRACT OBLIGATIONS ($B) POWERFUL TECH DEMAND CATALYSTS IN NATIONAL LANDING Sources: Federal Reserve/Bureau of Economic Affairs, NATO, Wall Street Journal, Nasdaq, DeutscheWelt, Bloomberg Government. 20 AMAZON VIRGINIA TECH INNOVATION CAMPUS THE PENTAGON AND THE DEPARTMENT OF DEFENSE DIGITAL INFRASTRUCTURE 0.0 2.0 4.0 6.0 8.0 10.0 12.0 14.0 16.0 18.0 1950 1952 1954 1956 1958 1960 1962 1964 1966 1968 1970 1972 1974 1976 1978 1980 1982 1984 1986 1988 1990 1992 1994 1996 1998 2000 2002 2004 2006 2008 2010 2012 2014 2016 2018 2020 % of GDP DEFENSE SPENDING (SHARE OF US GDP SINCE 1950) 3.9% in 2021 COLD WAR: 9.3% VIETNAM WAR: 9.4% WAR ON TERROR: 4.9% REAGAN ERA: 7.3% Defense spending (% of GDP) was historically low in 2021 but is slated to increase ~6% in 2022 to $782B with $743B allocated to the DoD. While NATO countries have increased defense spending since 2015, spending only averages 1.6% of GDP , although that is changing. Presence in National Landing Increases in the U.S. and NATO defense budget benefits National Landing tenants .. COUNTRY 2021 DEFENSE (% OF GDP) 2022 UPDATE Germany 1.5% Committed to 2% for 2022 U.K. 2.3% 25% increase suggested by Parliament France 2.0% Increase TBD, but committed to by Pres. Macron Italy 1.4% Increase suggested by P.M. Draghi Spain 1.0% Committed to 2% but unclear timeframe DEFENSE SPENDING AMONG TOP 5 NATO ECONOMIES Germany recently committed €100B to defense modernization and, in March, ordered 35 Lockheed F - 35s worth €4B. Poland, committed to raise defense spending to 3% of GDP and is replacing its Russian tanks with U.S. General Dynamics models worth $6B. |
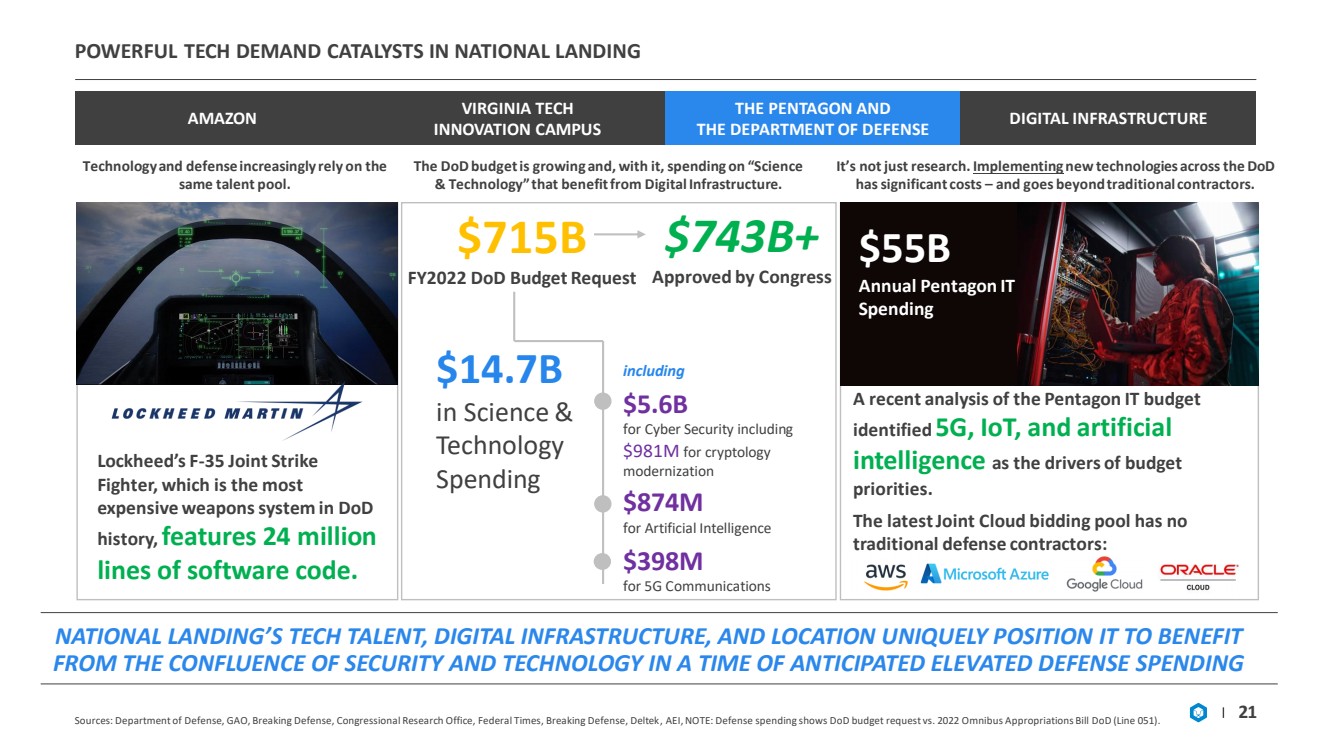
| POWERFUL TECH DEMAND CATALYSTS IN NATIONAL LANDING Sources: Department of Defense, GAO, Breaking Defense, Congressional Research Office, Federal Times, Breaking Defense, Deltek , A EI, NOTE: Defense spending shows DoD budget request vs. 2022 Omnibus Appropriations Bill DoD (Line 051). 21 AMAZON VIRGINIA TECH INNOVATION CAMPUS THE PENTAGON AND THE DEPARTMENT OF DEFENSE DIGITAL INFRASTRUCTURE NATIONAL LANDING’S TECH TALENT, DIGITAL INFRASTRUCTURE, AND LOCATION UNIQUELY POSITION IT TO BENEFIT FROM THE CONFLUENCE OF SECURITY AND TECHNOLOGY IN A TIME OF ANTICIPATED ELEVATED DEFENSE SPENDING Technology and defense increasingly rely on the same talent pool. Lockheed’s F - 35 Joint Strike Fighter, which is the most expensive weapons system in DoD history, features 24 million lines of software code. The DoD budget is growing and, with it, spending on “Science & Technology” that benefit from Digital Infrastructure. $715B FY2022 DoD Budget Request $743B+ Approved by Congress $14.7B in Science & Technology Spending $5.6B for Cyber Security including $981M for cryptology modernization $874M for Artificial Intelligence $398M for 5G Communications including It’s not just research. Implementing new technologies across the DoD has significant costs – and goes beyond traditional contractors. $55B Annual Pentagon IT Spending A recent analysis of the Pentagon IT budget identified 5G, IoT, and artificial intelligence as the drivers of budget priorities. The latest Joint Cloud bidding pool has no traditional defense contractors: |
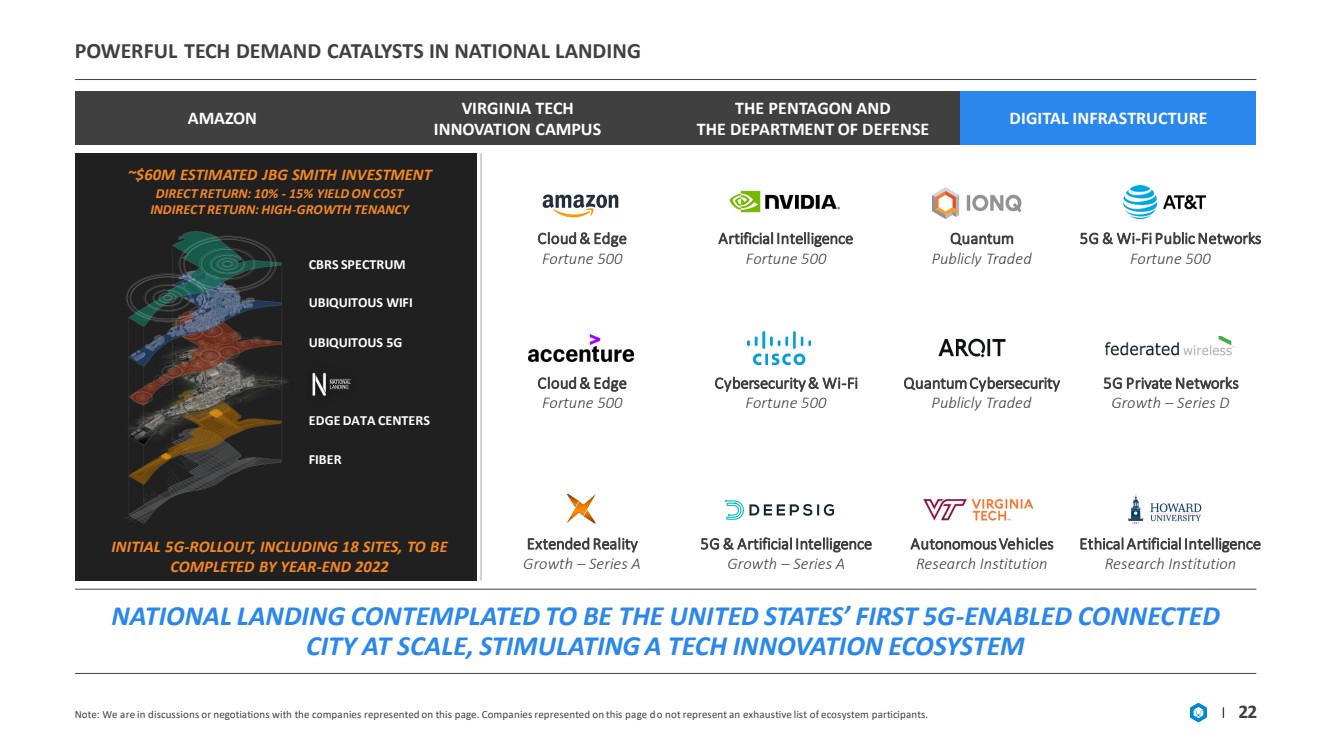
| POWERFUL TECH DEMAND CATALYSTS IN NATIONAL LANDING 22 AMAZON VIRGINIA TECH INNOVATION CAMPUS THE PENTAGON AND THE DEPARTMENT OF DEFENSE DIGITAL INFRASTRUCTURE Cloud & Edge Fortune 500 Artificial Intelligence Fortune 500 Quantum Publicly Traded 5G & Wi - Fi Public Networks Fortune 500 Cloud & Edge Fortune 500 Cybersecurity & Wi - Fi Fortune 500 5G Private Networks Growth – Series D Quantum Cybersecurity Publicly Traded Extended Reality Growth – Series A 5G & Artificial Intelligence Growth – Series A Autonomous Vehicles Research Institution Ethical Artificial Intelligence Research Institution Note: We are in discussions or negotiations with the companies represented on this page. Companies represented on this page d o n ot represent an exhaustive list of ecosystem participants. NATIONAL LANDING CONTEMPLATED TO BE THE UNITED STATES’ FIRST 5G - ENABLED CONNECTED CITY AT SCALE, STIMULATING A TECH INNOVATION ECOSYSTEM INITIAL 5G - ROLLOUT, INCLUDING 18 SITES, TO BE COMPLETED BY YEAR - END 2022 CBRS SPECTRUM UBIQUITOUS WIFI UBIQUITOUS 5G EDGE DATA CENTERS FIBER ~$60M ESTIMATED JBG SMITH INVESTMENT DIRECT RETURN: 10% - 15% YIELD ON COST INDIRECT RETURN: HIGH - GROWTH TENANCY |
| OPERATING PORTFOLIO HIGHLIGHTS |

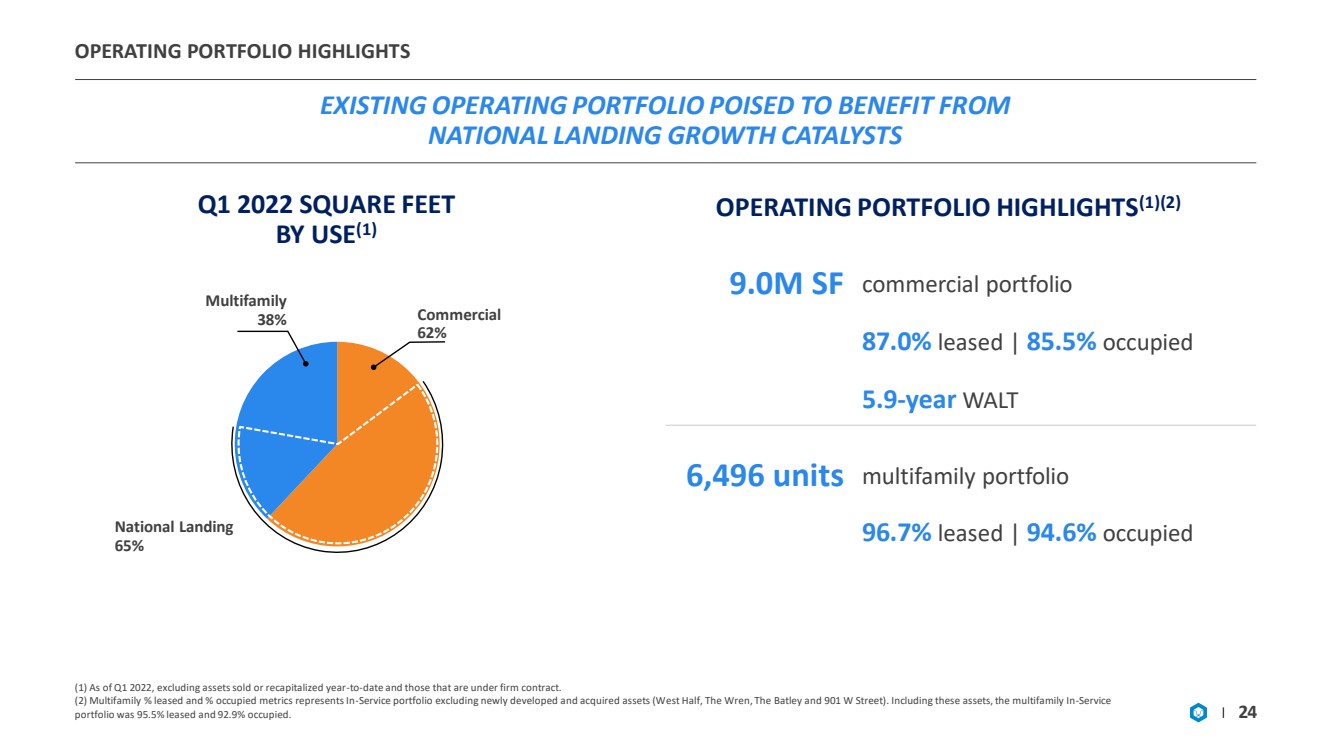
| OPERATING PORTFOLIO HIGHLIGHTS EXISTING OPERATING PORTFOLIO POISED TO BENEFIT FROM NATIONAL LANDING GROWTH CATALYSTS (1) As of Q1 2022, excluding assets sold or recapitalized year - to - date and those that are under firm contract. (2) Multifamily % leased and % occupied metrics represents In - Service portfolio excluding newly developed and acquired assets (W est Half, The Wren, The Batley and 901 W Street). Including these assets, the multifamily In - Service portfolio was 95.5% leased and 92.9% occupied. 24 National Landing 65% Commercial 62% Multifamily 38% Q1 2022 SQUARE FEET BY USE (1) 9.0M SF commercial portfolio 87.0% leased | 85.5% occupied 5.9 - year WALT OPERATING PORTFOLIO HIGHLIGHTS (1)(2) 6,496 units multifamily portfolio 96.7% leased | 94.6% occupied |
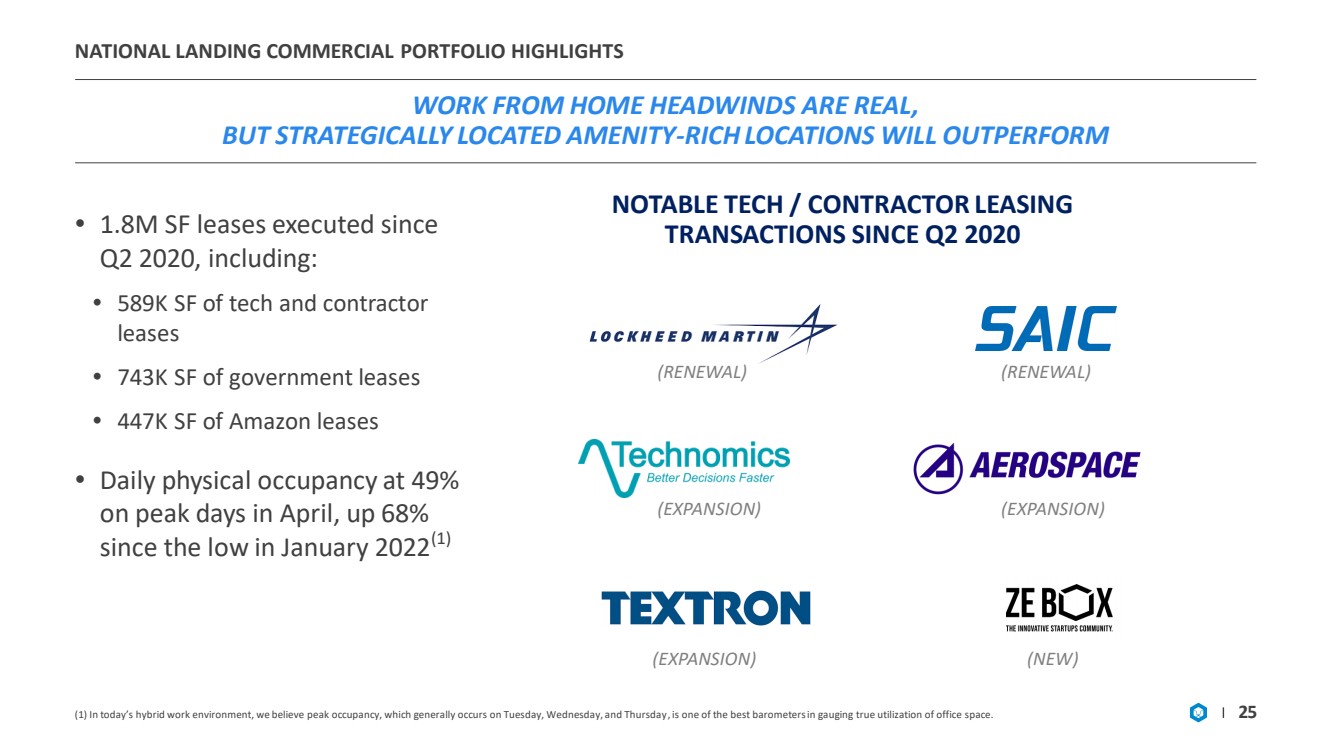
| NATIONAL LANDING COMMERCIAL PORTFOLIO HIGHLIGHTS WORK FROM HOME HEADWINDS ARE REAL, BUT STRATEGICALLY LOCATED AMENITY - RICH LOCATIONS WILL OUTPERFORM 25 NOTABLE TECH / CONTRACTOR LEASING TRANSACTIONS SINCE Q2 2020 • 1.8M SF leases executed since Q2 2020, including: • 589K SF of tech and contractor leases • 743K SF of government leases • 447K SF of Amazon leases • Daily physical occupancy at 49% on peak days in April, up 68% since the low in January 2022 (1) (RENEWAL) (RENEWAL) (EXPANSION) (EXPANSION) (EXPANSION) (1) In today’s hybrid work environment, we believe peak occupancy, which generally occurs on Tuesday, Wednesday, and Thursday , i s one of the best barometers in gauging true utilization of office space. (NEW) |
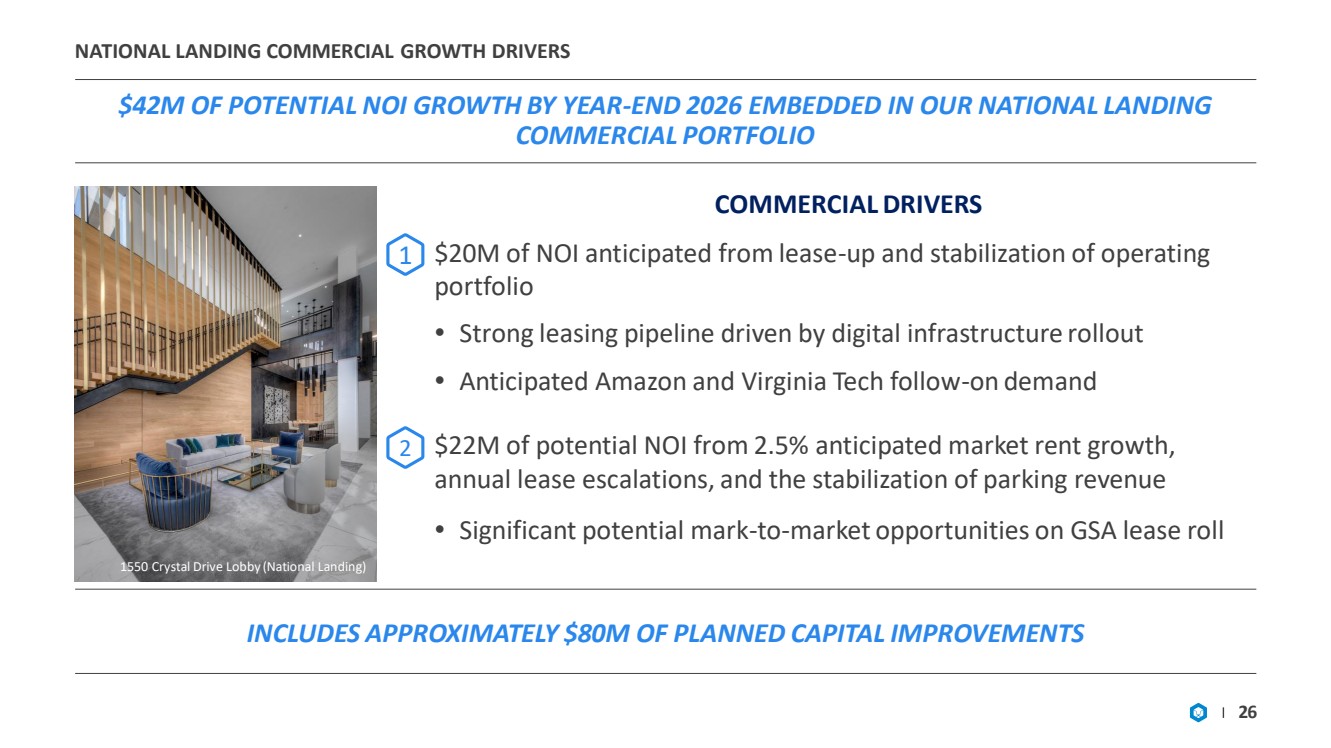
| NATIONAL LANDING COMMERCIAL GROWTH DRIVERS $42M OF POTENTIAL NOI GROWTH BY YEAR - END 2026 EMBEDDED IN OUR NATIONAL LANDING COMMERCIAL PORTFOLIO 26 COMMERCIAL DRIVERS $20M of NOI anticipated from lease - up and stabilization of operating portfolio • Strong leasing pipeline driven by digital infrastructure rollout • Anticipated Amazon and Virginia Tech follow - on demand $22M of potential NOI from 2.5% anticipated market rent growth, annual lease escalations, and the stabilization of parking revenue • Significant potential mark - to - market opportunities on GSA lease roll 2 1 1550 Crystal Drive Lobby (National Landing) INCLUDES APPROXIMATELY $80M OF PLANNED CAPITAL IMPROVEMENTS |
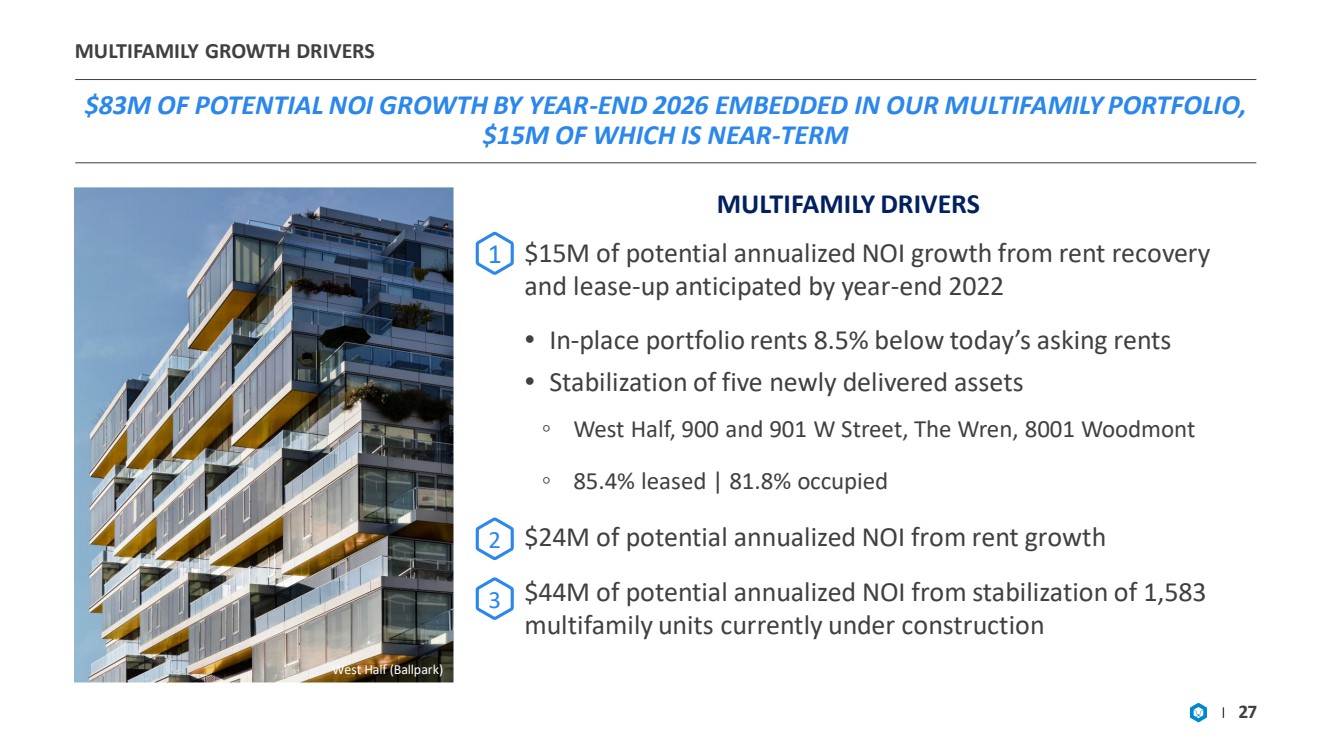
| MULTIFAMILY GROWTH DRIVERS $83M OF POTENTIAL NOI GROWTH BY YEAR - END 2026 EMBEDDED IN OUR MU LTIFAMILY PORTFOLIO, $15M OF WHICH IS NEAR - TERM 27 MULTIFAMILY DRIVERS $15M of potential annualized NOI growth from rent recovery and lease - up anticipated by year - end 2022 • In - place portfolio rents 8.5% below today’s asking rents • Stabilization of five newly delivered assets ◦ West Half, 900 and 901 W Street, The Wren, 8001 Woodmont ◦ 85.4% leased | 81.8% occupied $24M of potential annualized NOI from rent growth $44M of potential annualized NOI from stabilization of 1,583 multifamily units currently under construction West Half (Ballpark) 2 1 3 |
| GROWTH AND CAPITALIZATION |

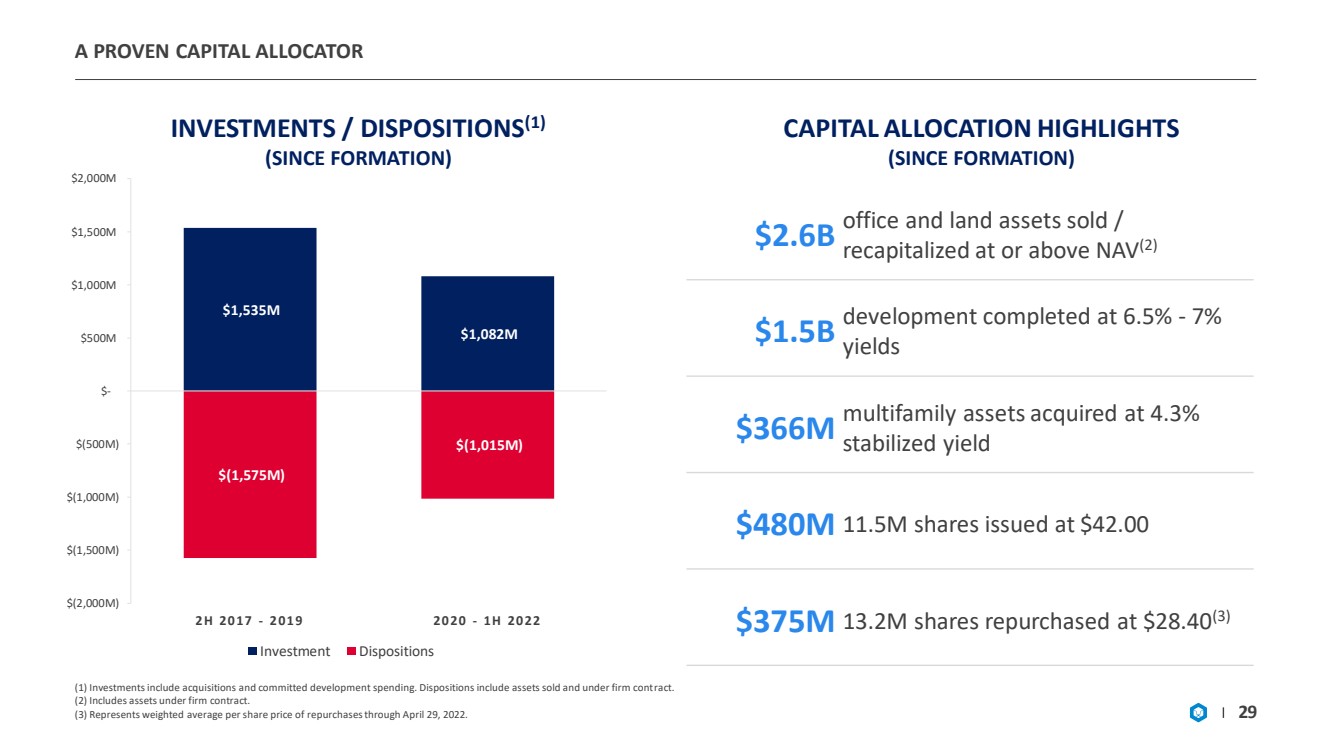
| A PROVEN CAPITAL ALLOCATOR (1) Investments include acquisitions and committed development spending. Dispositions include assets sold and under firm cont rac t. (2) Includes assets under firm contract. (3) Represents weighted average per share price of repurchases through April 29, 2022. 29 INVESTMENTS / DISPOSITIONS (1) (SINCE FORMATION) $2.6B office and land assets sold / recapitalized at or above NAV (2) $1.5B development completed at 6.5% - 7% yields $366M multifamily assets acquired at 4.3% stabilized yield $480M 11.5M shares issued at $42.00 $375M 13.2M shares repurchased at $28.40 (3) CAPITAL ALLOCATION HIGHLIGHTS (SINCE FORMATION) $1,535M $1,082M $(1,575M) $(1,015M) $(2,000M) $(1,500M) $(1,000M) $(500M) $- $500M $1,000M $1,500M $2,000M 2H 2017 - 2019 2020 - 1H 2022 Investment Dispositions |
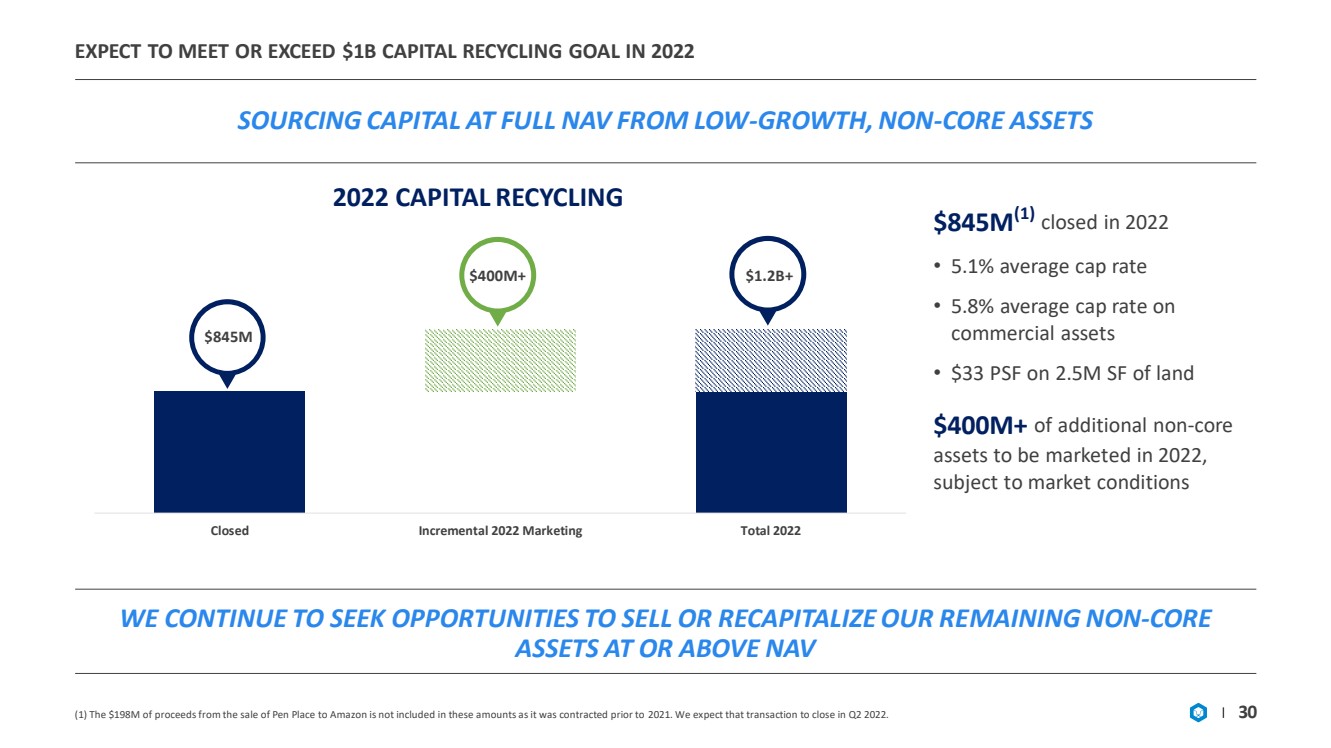
| Closed Incremental 2022 Marketing Total 2022 EXPECT TO MEET OR EXCEED $1B CAPITAL RECYCLING GOAL IN 2022 SOURCING CAPITAL AT FULL NAV FROM LOW - GROWTH, NON - CORE ASSETS 30 2022 CAPITAL RECYCLING $845M WE CONTINUE TO SEEK OPPORTUNITIES TO SELL OR RECAPITALIZE OUR RE MAINING NON - CORE ASSETS AT OR ABOVE NAV $845M (1) closed in 2022 • 5.1% average cap rate • 5.8% average cap rate on commercial assets • $33 PSF on 2.5M SF of land $400M+ of additional non - core assets to be marketed in 2022, subject to market conditions $1.2B+ $400M+ (1) The $198M of proceeds from the sale of Pen Place to Amazon is not included in these amounts as it was contracted prior to 20 21. We expect that transaction to close in Q2 2022. |
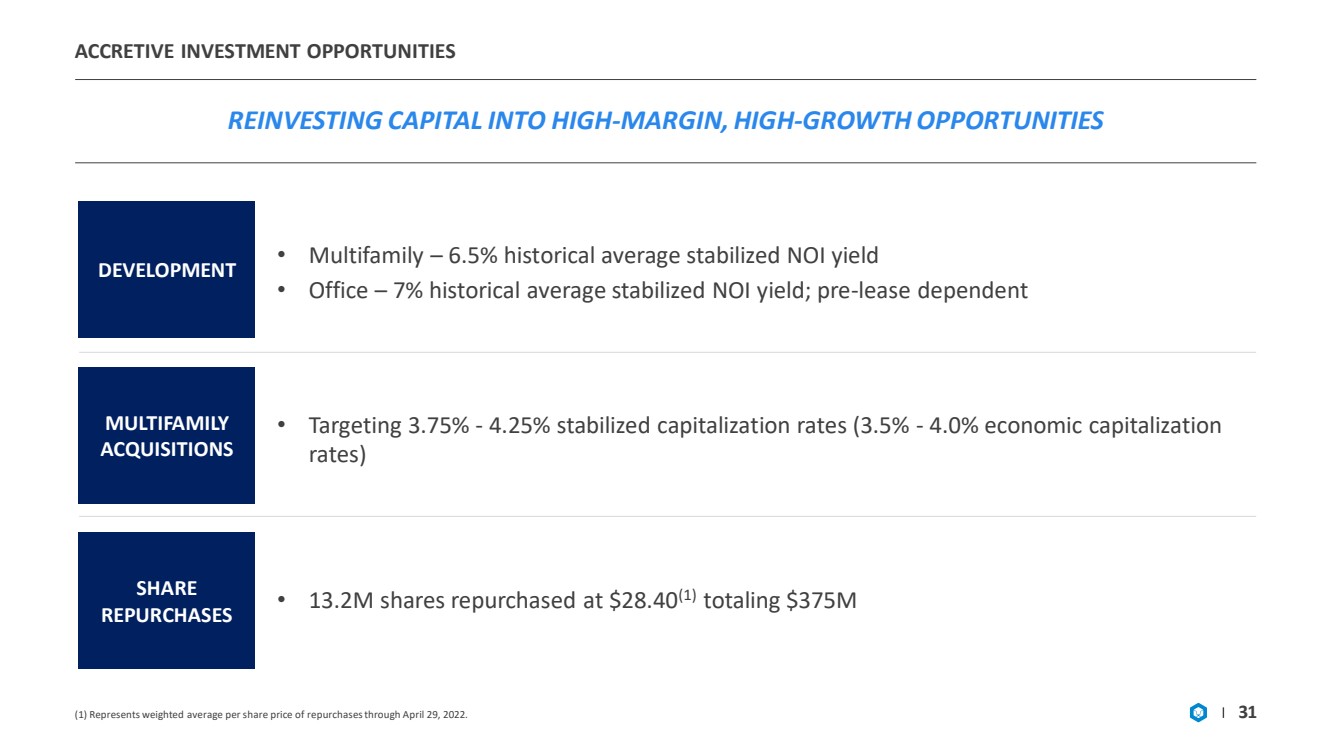
| ACCRETIVE INVESTMENT OPPORTUNITIES REINVESTING CAPITAL INTO HIGH - MARGIN, HIGH - GROWTH OPPORTUNITIES (1) Represents weighted average per share price of repurchases through April 29, 2022. 31 DEVELOPMENT MULTIFAMILY ACQUISITIONS SHARE REPURCHASES • Multifamily – 6.5% historical average stabilized NOI yield • Office – 7% historical average stabilized NOI yield; pre - lease dependent • 13.2M shares repurchased at $28.40 (1) totaling $375M • Targeting 3.75% - 4.25% stabilized capitalization rates (3.5% - 4.0% economic capitalization rates) |
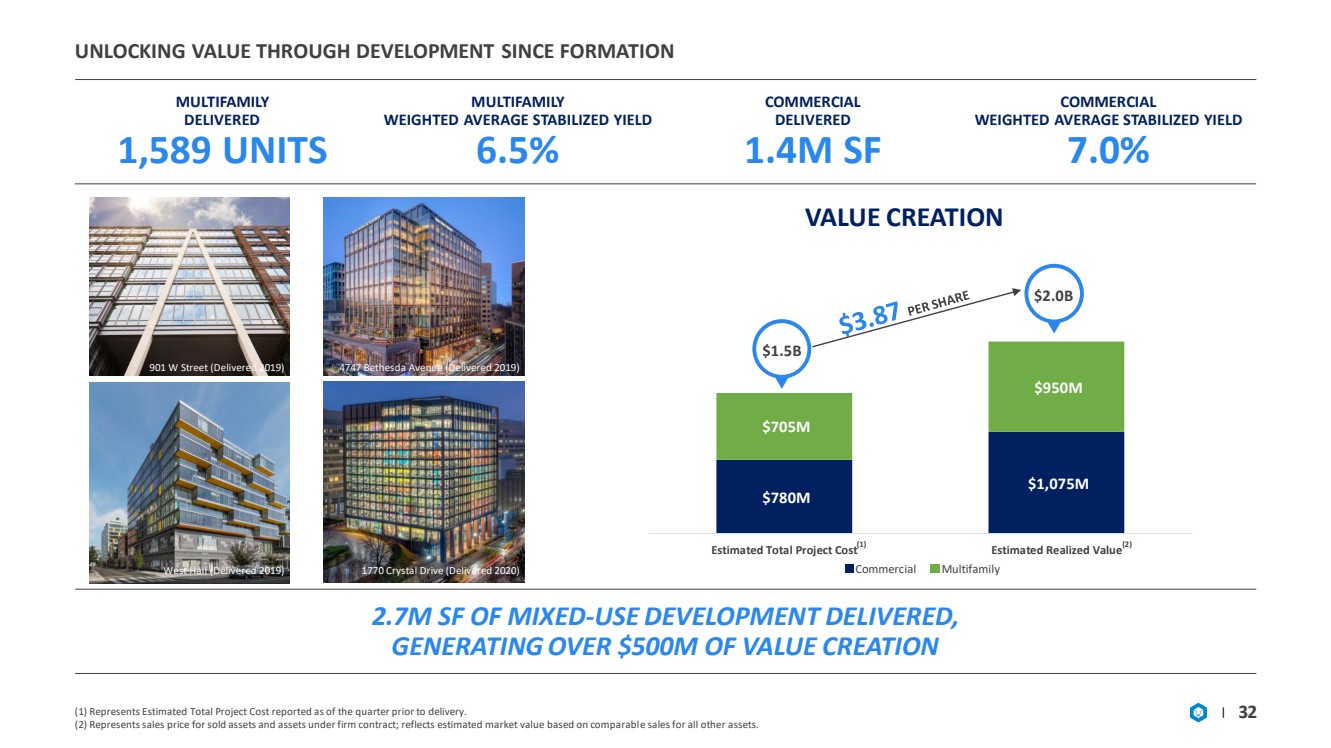
| $780M $1,075M $705M $950M Estimated Total Project Cost Estimated Realized Value UNLOCKING VALUE THROUGH DEVELOPMENT SINCE FORMATION MULTIFAMILY DELIVERED 1,589 UNITS MULTIFAMILY WEIGHTED AVERAGE STABILIZED YIELD 6.5% COMMERCIAL DELIVERED 1.4M SF COMMERCIAL WEIGHTED AVERAGE STABILIZED YIELD 7.0% (1) Represents Estimated Total Project Cost reported as of the quarter prior to delivery. (2) Represents sales price for sold assets and assets under firm contract; reflects estimated market value based on comparabl e s ales for all other assets. 32 2.7M SF OF MIXED - USE DEVELOPMENT DELIVERED, GENERATING OVER $500M OF VALUE CREATION $1.5B Commercial Multifamily (1) (2) $2.0B 4747 Bethesda Avenue (Delivered 2019) 1770 Crystal Drive (Delivered 2020) 901 W Street (Delivered 2019) West Half (Delivered 2019) VALUE CREATION |
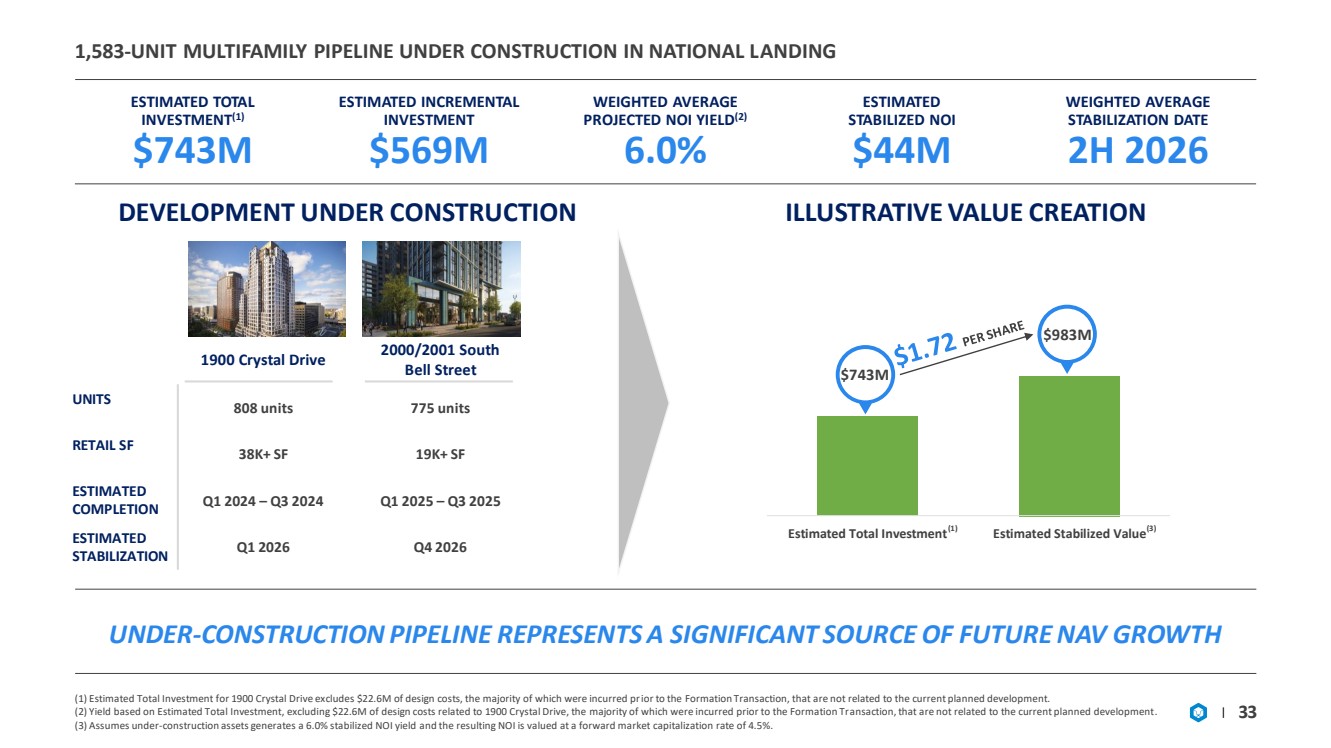
| 1,583 - UNIT MULTIFAMILY PIPELINE UNDER CONSTRUCTION IN NATIONAL L ANDING ESTIMATED TOTAL INVESTMENT (1) $743M ESTIMATED INCREMENTAL INVESTMENT $569M WEIGHTED AVERAGE PROJECTED NOI YIELD (2) 6.0% ESTIMATED STABILIZED NOI $44M WEIGHTED AVERAGE STABILIZATION DATE 2H 2026 (1) Estimated Total Investment for 1900 Crystal Drive excludes $22.6M of design costs, the majority of which were incurred pr ior to the Formation Transaction, that are not related to the current planned development. (2) Yield based on Estimated Total Investment, excluding $22.6M of design costs related to 1900 Crystal Drive, the majority of which were incurred prior to the Formation Tr ans action, that are not related to the current planned development .. (3) Assumes under - construction assets generates a 6.0% stabilized NOI yield and the resulting NOI is valued at a forward market capitalization rate of 4.5%. 33 1900 Crystal Drive 2000/2001 South Bell Street UNITS 808 units 775 units RETAIL SF 38K+ SF 19K+ SF ESTIMATED COMPLETION Q1 2024 – Q3 2024 Q1 2025 – Q3 2025 ESTIMATED STABILIZATION Q1 2026 Q4 2026 UNDER - CONSTRUCTION PIPELINE REPRESENTS A SIGNIFICANT SOURCE OF FUTURE NAV GROWTH Estimated Total Investment Estimated Stabilized Value $743M $983M DEVELOPMENT UNDER CONSTRUCTION ILLUSTRATIVE VALUE CREATION (1) (3) |
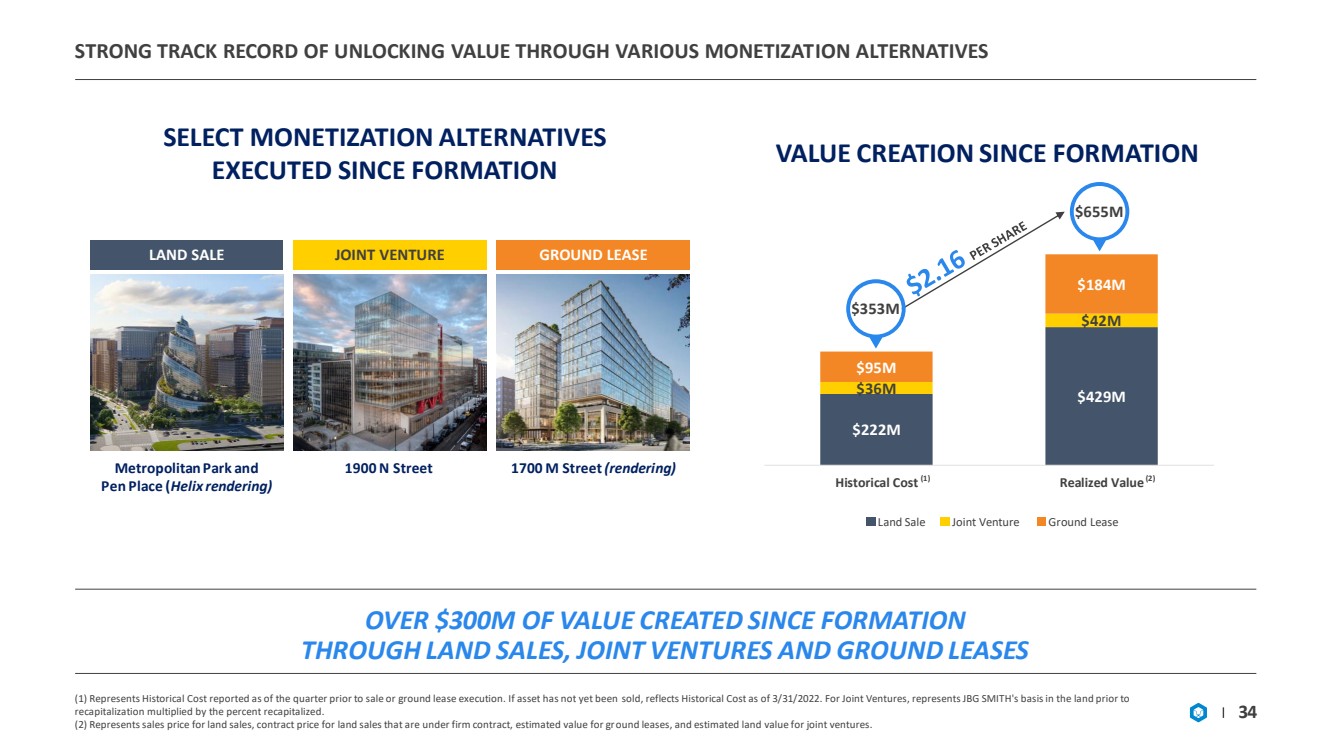
| STRONG TRACK RECORD OF UNLOCKING VALUE THROUGH VARIOUS MONETIZAT ION ALTERNATIVES (1) Represents Historical Cost reported as of the quarter prior to sale or ground lease execution. If asset has not yet been sol d, reflects Historical Cost as of 3/31/2022. For Joint Ventures, represents JBG SMITH's basis in the land prior to recapitalization multiplied by the percent recapitalized. (2) Represents sales price for land sales, contract price for land sales that are under firm contract, estimated value for gr oun d leases, and estimated land value for joint ventures. 34 VALUE CREATION SINCE FORMATION $222M $429M $36M $42M $95M $184M Historical Cost Realized Value (1) (2) Land Sale Joint Venture Ground Lease $353M $655M Metropolitan Park and Pen Place ( Helix rendering) 1900 N Street 1700 M Street (rendering) LAND SALE JOINT VENTURE GROUND LEASE SELECT MONETIZATION ALTERNATIVES EXECUTED SINCE FORMATION OVER $300M OF VALUE CREATED SINCE FORMATION THROUGH LAND SALES, JOINT VENTURES AND GROUND LEASES |
| ADVANCING THE ENTITLEMENTS OF OUR DEVELOPMENT PIPELINE IS CRITIC AL TO UNLOCKING AND MONETIZING VALUE 35 IN ADDITION TO DEVELOPMENT, WE CAN MONETIZE OUR LAND BANK THROUGH OPPORTUNISTIC LAND SALES, GROUND LEASES AND/OR RECAPITALIZATIONS Note: Excludes non - core land assets in light of our plans to dispose them .. (1) We expect our Development Pipeline to be 100% entitled by 2024. TOTAL DENSITY 8.6M SF NATIONAL LANDING DENSITY 6.5M SF MULTIFAMILY CONCENTRATION 84% % ENTITLED BY 2024 (1) 100% Near - Term Development 3.5M SF Office 16% Multifamily 84% DEVELOPMENT PIPELINE COMPOSITION DEVELOPMENT PIPELINE ENTITLEMENT STATUS Fully Entitled 28% Entitlement in Process 72% |

| NOI BRIDGE AND LIQUIDITY |

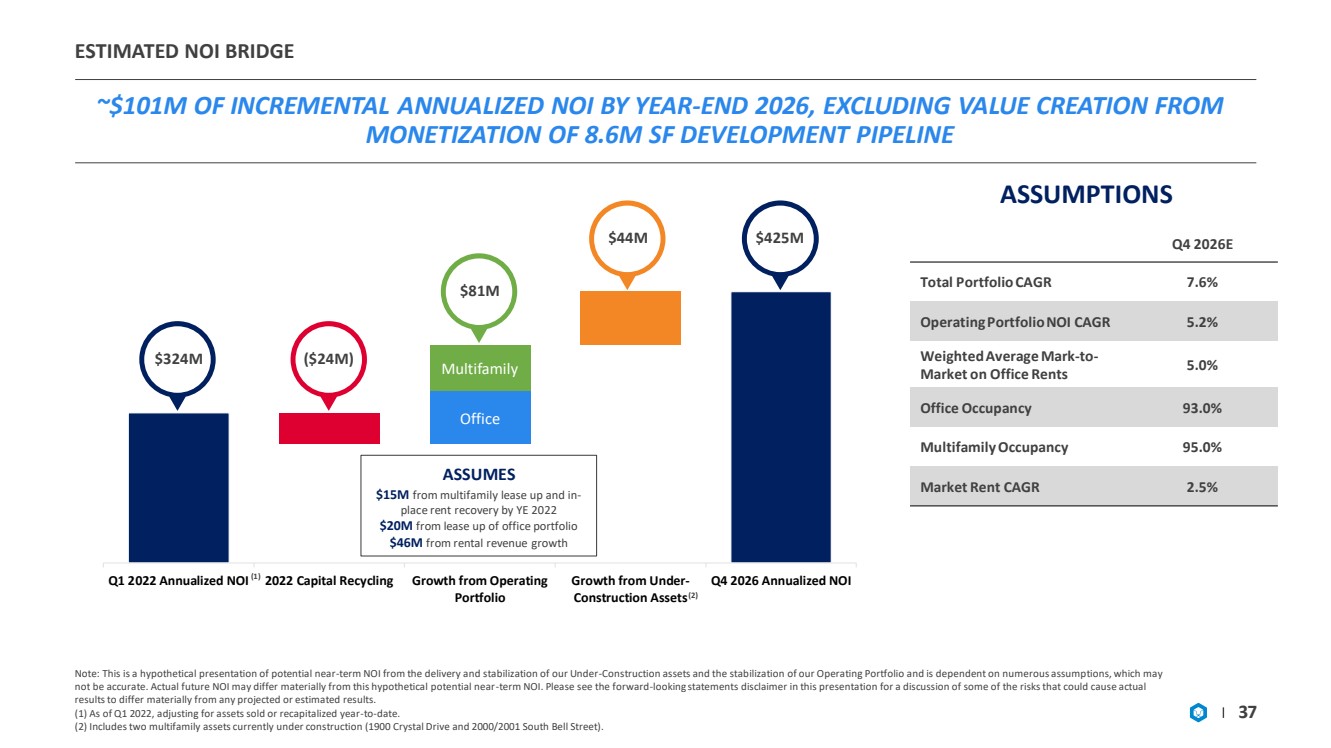
| Q1 2022 Annualized NOI 2022 Capital Recycling Growth from Operating Portfolio Growth from Under- Construction Assets Q4 2026 Annualized NOI ESTIMATED NOI BRIDGE ~$101M OF INCREMENTAL ANNUALIZED NOI BY YEAR - END 2026, EXCLUDING VALUE CREATION FROM MONETIZATION OF 8.6M SF DEVELOPMENT PIPELINE Note: This is a hypothetical presentation of potential near - term NOI from the delivery and stabilization of our Under - Constructi on assets and the stabilization of our Operating Portfolio and is dependent on numerous assumptions, which may not be accurate. Actual future NOI may differ materially from this hypothetical potential near - term NOI. Please see the forward - looking statements disclaimer in this presentation for a discussion of some of the risks that could cause actual results to differ materially from any projected or estimated results. (1) As of Q1 2022, adjusting for assets sold or recapitalized year - to - date. (2) Includes two multifamily assets currently under construction (1900 Crystal Drive and 2000/2001 South Bell Street). 37 Q4 2026E Total Portfolio CAGR 7.6% Operating Portfolio NOI CAGR 5.2% Weighted Average Mark - to - Market on Office Rents 5.0% Office Occupancy 93.0% Multifamily Occupancy 95.0% Market Rent CAGR 2.5% ASSUMPTIONS (1) (2) ASSUMES $15M from multifamily lease up and in - place rent recovery by YE 2022 $20M from lease up of office portfolio $46M from rental revenue growth $324M ($24M) $81M $44M $425M Multifamily Office |
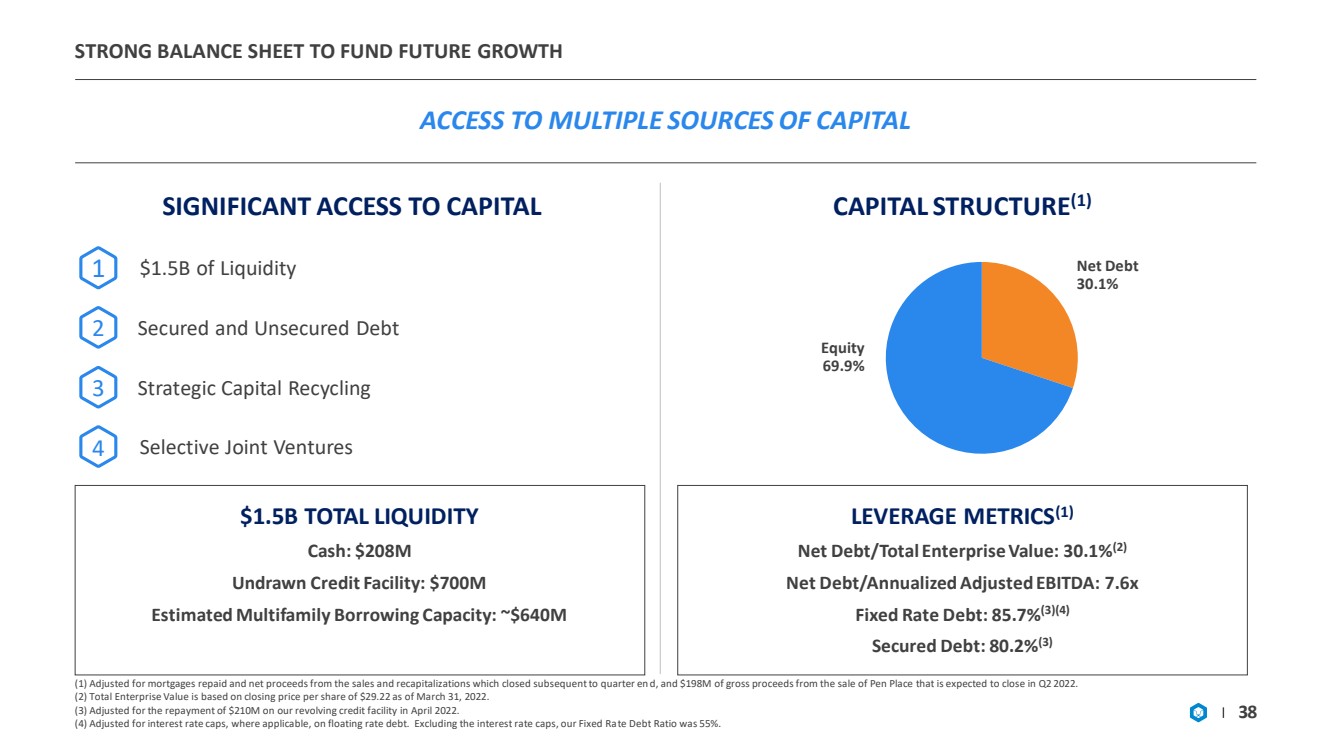
| STRONG BALANCE SHEET TO FUND FUTURE GROWTH ACCESS TO MULTIPLE SOURCES OF CAPITAL (1) Adjusted for mortgages repaid and net proceeds from the sales and recapitalizations which closed subsequent to quarter en d, and $198M of gross proceeds from the sale of Pen Place that is expected to close in Q2 2022. (2) Total Enterprise Value is based on closing price per share of $29.22 as of March 31, 2022. (3) Adjusted for the repayment of $210M on our revolving credit facility in April 2022. (4) Adjusted for interest rate caps, where applicable, on floating rate debt. Excluding the interest rate caps, our Fixed Ra te Debt Ratio was 55%. 38 SIGNIFICANT ACCESS TO CAPITAL 2 Secured and Unsecured Debt 3 Strategic Capital Recycling 4 Selective Joint Ventures $1.5B of Liquidity 1 Net Debt 30.1% Equity 69.9% LEVERAGE METRICS (1) Net Debt/Total Enterprise Value: 30.1% (2) Net Debt/Annualized Adjusted EBITDA: 7.6x Fixed Rate Debt: 85.7% (3)(4) Secured Debt: 80.2% (3) $1.5B TOTAL LIQUIDITY Cash: $208M Undrawn Credit Facility: $700M Estimated Multifamily Borrowing Capacity: ~$640M CAPITAL STRUCTURE (1) |
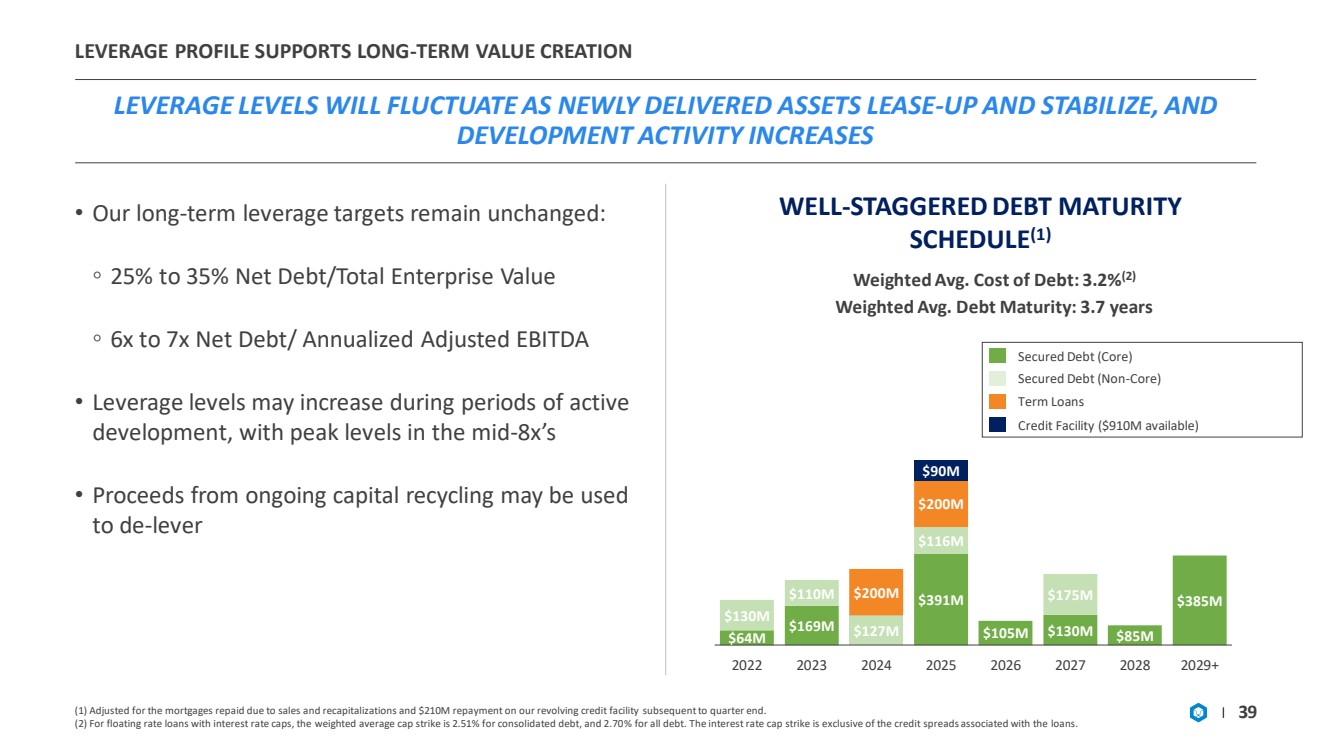
| $64M $169M $127M $391M $105M $130M $85M $385M $130M $110M $116M $175M $200M $200M $90M 2022 2023 2024 2025 2026 2027 2028 2029+ LEVERAGE PROFILE SUPPORTS LONG - TERM VALUE CREATION LEVERAGE LEVELS WILL FLUCTUATE AS NEWLY DELIVERED ASSETS LEASE - U P AND STABILIZE, AND DEVELOPMENT ACTIVITY INCREASES (1) Adjusted for the mortgages repaid due to sales and recapitalizations and $210M repayment on our revolving credit facility su bsequent to quarter end. (2) For floating rate loans with interest rate caps, the weighted average cap strike is 2.51% for consolidated debt, and 2.70 % f or all debt. The interest rate cap strike is exclusive of the credit spreads associated with the loans. 39 WELL - STAGGERED DEBT MATURITY SCHEDULE (1) Secured Debt (Non - Core) Secured Debt (Core) Term Loans Weighted Avg. Cost of Debt: 3.2% (2) Weighted Avg. Debt Maturity: 3.7 years • Our long - term leverage targets remain unchanged: ◦ 25% to 35% Net Debt/Total Enterprise Value ◦ 6x to 7x Net Debt/ Annualized Adjusted EBITDA • Leverage levels may increase during periods of active development, with peak levels in the mid - 8x’s • Proceeds from ongoing capital recycling may be used to de - lever Credit Facility ($910M available) |
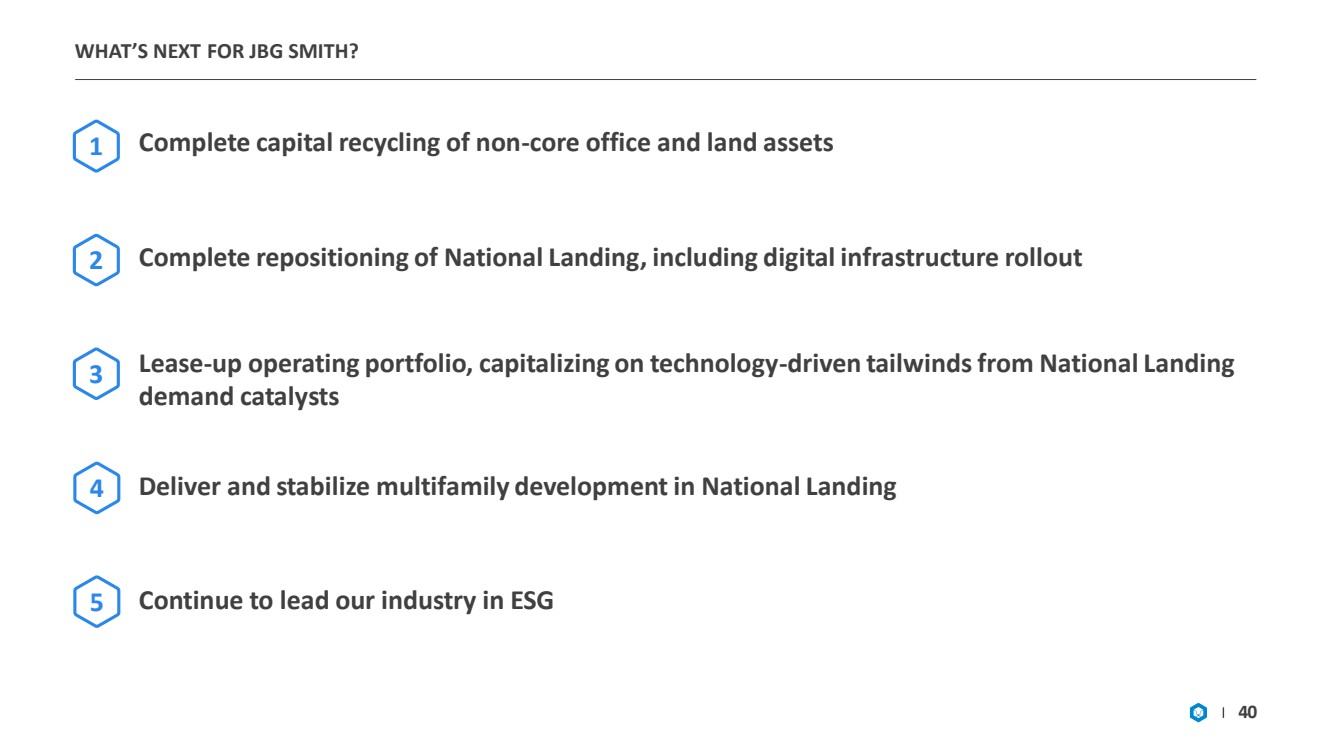
| WHAT’S NEXT FOR JBG SMITH? 40 Complete capital recycling of non - core office and land assets 1 2 4 5 Complete repositioning of National Landing, including digital infrastructure rollout 3 Lease - up operating portfolio, capitalizing on technology - driven tailwinds from National Landing demand catalysts Deliver and stabilize multifamily development in National Landing Continue to lead our industry in ESG |
| APPENDIX |

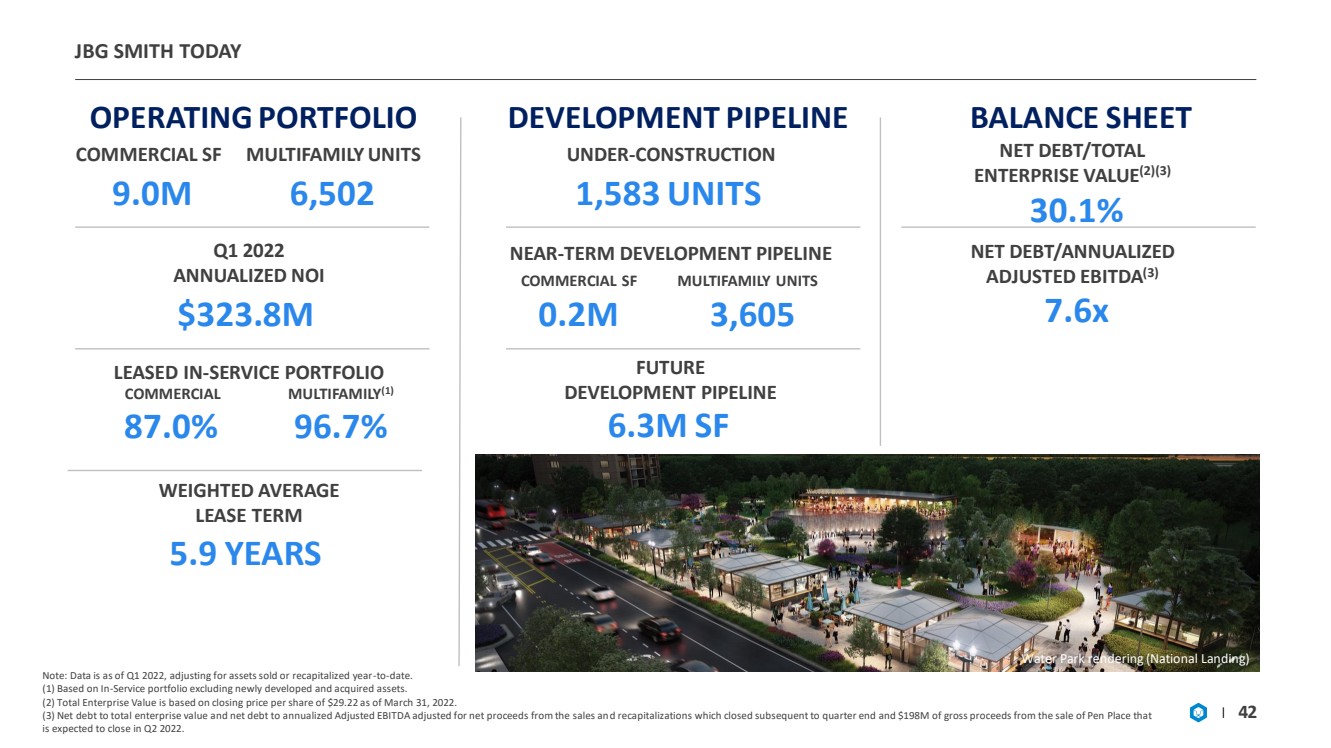
| JBG SMITH TODAY Note: Data is as of Q1 2022, adjusting for assets sold or recapitalized year - to - date. (1) Based on In - Service portfolio excluding newly developed and acquired assets. (2) Total Enterprise Value is based on closing price per share of $29.22 as of March 31, 2022. (3) Net debt to total enterprise value and net debt to annualized Adjusted EBITDA adjusted for net proceeds from the sales an d r ecapitalizations which closed subsequent to quarter end and $198M of gross proceeds from the sale of Pen Place that is expected to close in Q2 2022. 42 OPERATING PORTFOLIO COMMERCIAL SF MULTIFAMILY UNITS 9.0M 6,502 Q1 2022 ANNUALIZED NOI $323.8M LEASED IN - SERVICE PORTFOLIO DEVELOPMENT PIPELINE UNDER - CONSTRUCTION 1,583 UNITS NEAR - TERM DEVELOPMENT PIPELINE 0.2M FUTURE DEVELOPMENT PIPELINE 6.3M SF 3,605 COMMERCIAL SF MULTIFAMILY UNITS BALANCE SHEET NET DEBT/TOTAL ENTERPRISE VALUE (2)(3) 30.1% Water Park rendering (National Landing) 96.7% WEIGHTED AVERAGE LEASE TERM 5.9 YEARS NET DEBT/ANNUALIZED ADJUSTED EBITDA (3) 7.6x COMMERCIAL MULTIFAMILY (1) 87.0% |
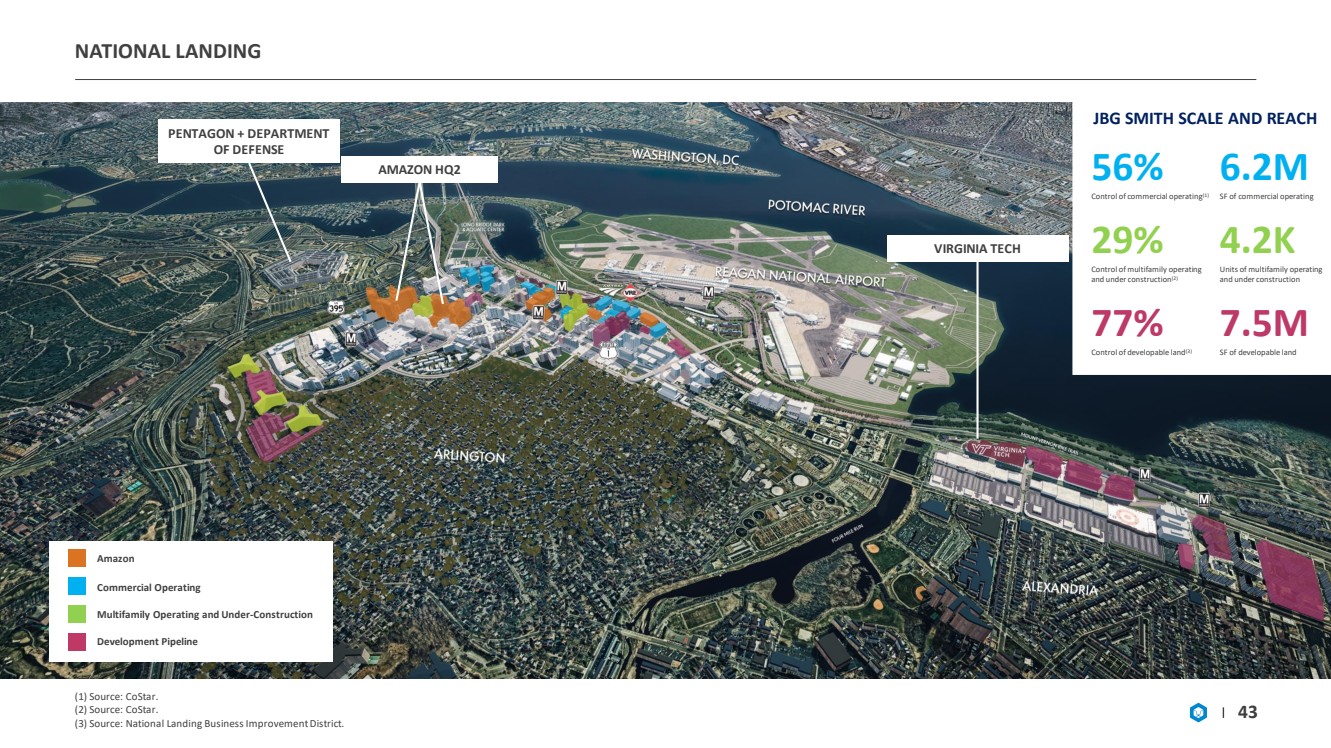
| NATIONAL LANDING Amazon Commercial Operating Development Pipeline Multifamily Operating and Under - Construction PENTAGON + DEPARTMENT OF DEFENSE VIRGINIA TECH AMAZON HQ2 56% Control of commercial operating (1) 6.2M SF of commercial operating 29% Control of multifamily operating and under construction (2) 4.2K Units of multifamily operating and under construction 77% Control of developable land (3) 7.5M SF of developable land JBG SMITH SCALE AND REACH (1) Source: CoStar. (2) Source: CoStar. (3) Source: National Landing Business Improvement District. 43 |
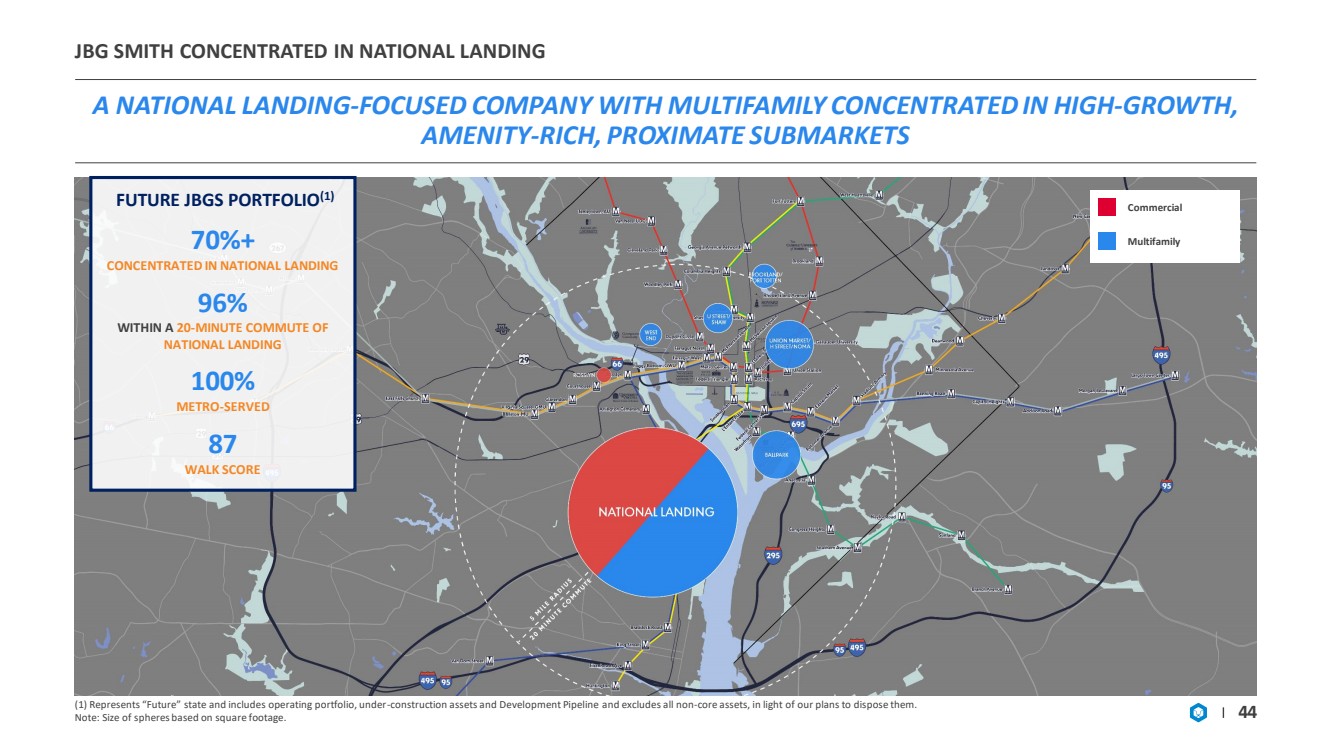
| JBG SMITH CONCENTRATED IN NATIONAL LANDING A NATIONAL LANDING - FOCUSED COMPANY WITH MULTIFAMILY CONCENTRATED IN HIGH - GROWTH, AMENITY - RICH, PROXIMATE SUBMARKETS 44 (1) Represents “Future” state and includes operating portfolio, under - construction assets and Development Pipeline and excludes all non - core assets, in light of our plans to dispose them. Note: Size of spheres based on square footage. FUTURE JBGS PORTFOLIO (1) 70%+ CONCENTRATED IN NATIONAL LANDING 96% WITHIN A 20 - MINUTE COMMUTE OF NATIONAL LANDING 100% METRO - SERVED 87 WALK SCORE Multifamily Commercial |
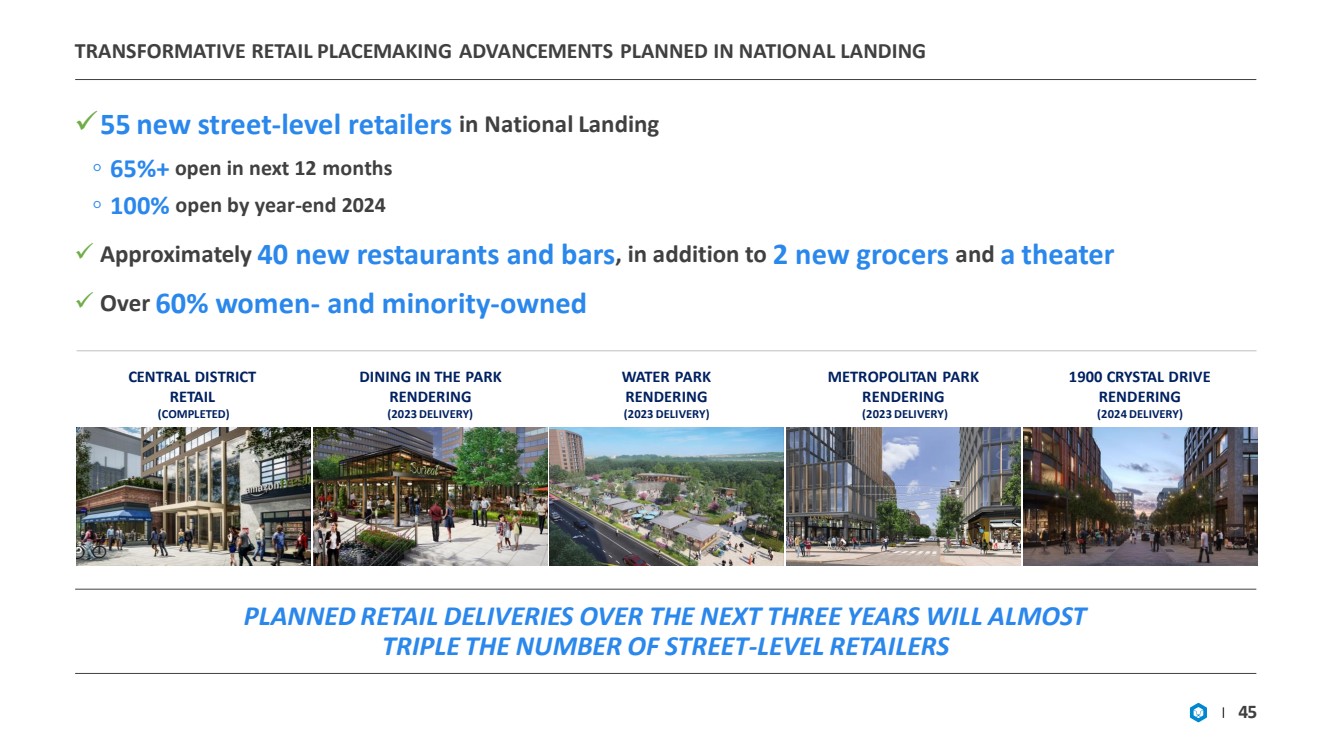
| TRANSFORMATIVE RETAIL PLACEMAKING ADVANCEMENTS PLANNED IN NATION AL LANDING 45 PLANNED RETAIL DELIVERIES OVER THE NEXT THREE YEARS WILL ALMOST TRIPLE THE NUMBER OF STREET - LEVEL RETAILERS ✓ 55 new street - level retailers in National Landing ◦ 65%+ open in next 12 months ◦ 100% open by year - end 2024 ✓ Approximately 40 new restaurants and bars , in addition to 2 new grocers and a theater ✓ Over 60% women - and minority - owned CENTRAL DISTRICT RETAIL (COMPLETED) DINING IN THE PARK RENDERING (2023 DELIVERY) WATER PARK RENDERING (2023 DELIVERY) 1900 CRYSTAL DRIVE RENDERING (2024 DELIVERY) METROPOLITAN PARK RENDERING (2023 DELIVERY) |
| NATIONAL LANDING PHYSICAL INFRASTRUCTURE PROJECTS Note: Delivery dates reflect JBG SMITH’s estimate and are subject to change. 46 $6B OF FULLY COMMITTED PHYSICAL INFRASTRUCTURE PROJECTS PLANNED BY STATE AND LOCAL GOVERNMENTS MULTI - MODAL TRANSIT HUB (2025 DELIVERY) ROUTE 1 AT GRADE (2028 DELIVERY) POTOMAC YARD METRO STATION SOUTH ENTRANCE (2022 DELIVERY) LONG BRIDGE EXPANSION (2030 DELIVERY) CRYSTAL CITY METRO STATION EAST ENTRANCE (2025 DELIVERY) PEDESTRIAN BRIDGE TO DCA (2028 DELIVERY) |
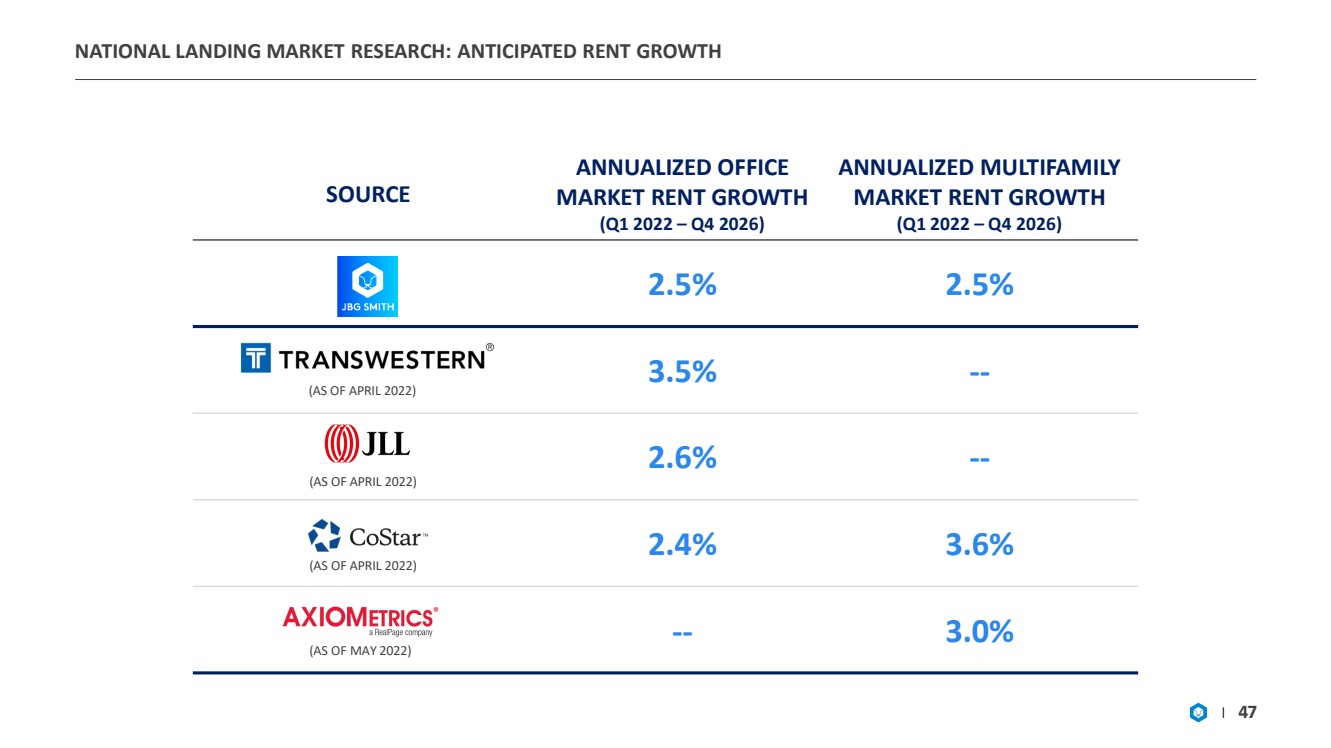
| NATIONAL LANDING MARKET RESEARCH: ANTICIPATED RENT GROWTH 47 (AS OF APRIL 2022) (AS OF APRIL 2022) (AS OF APRIL 2022) (AS OF MAY 2022) SOURCE ANNUALIZED OFFICE MARKET RENT GROWTH (Q1 2022 – Q4 2026) ANNUALIZED MULTIFAMILY MARKET RENT GROWTH (Q1 2022 – Q4 2026) 2.5% 2.5% 3.5% -- 2.6% -- 2.4% 3.6% -- 3.0% |
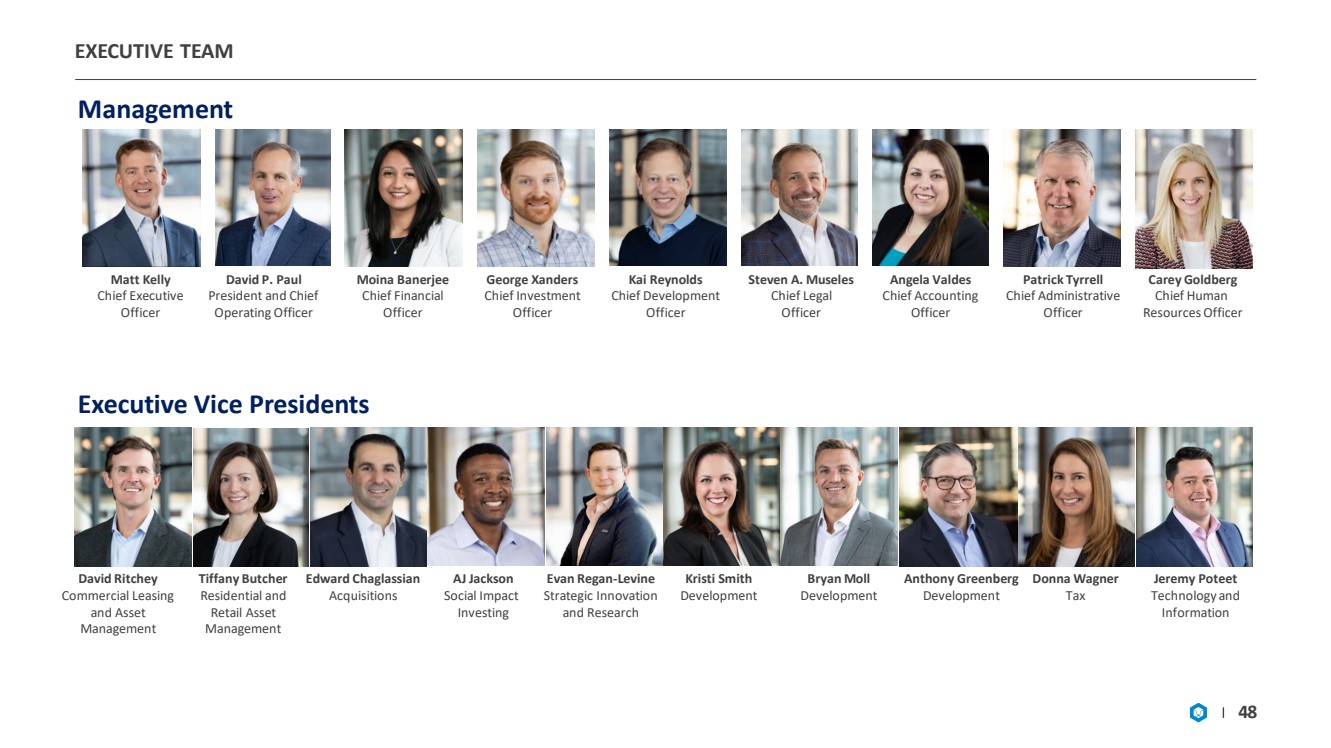
| EXECUTIVE TEAM 48 Executive Vice Presidents Management Tiffany Butcher Residential and Retail Asset Management Bryan Moll Development Evan Regan - Levine Strategic Innovation and Research Donna Wagner Tax AJ Jackson Social Impact Investing Edward Chaglassian Acquisitions Anthony Greenberg Development David Ritchey Commercial Leasing and Asset Management Jeremy Poteet Technology and Information David P. Paul President and Chief Operating Officer Matt Kelly Chief Executive Officer Kai Reynolds Chief Development Officer Moina Banerjee Chief Financial Officer Steven A. Museles Chief Legal Officer George Xanders Chief Investment Officer Patrick Tyrrell Chief Administrative Officer Angela Valdes Chief Accounting Officer Carey Goldberg Chief Human Resources Officer Kristi Smith Development |
| NATIONAL LANDING DEVELOPMENT PIPELINE |

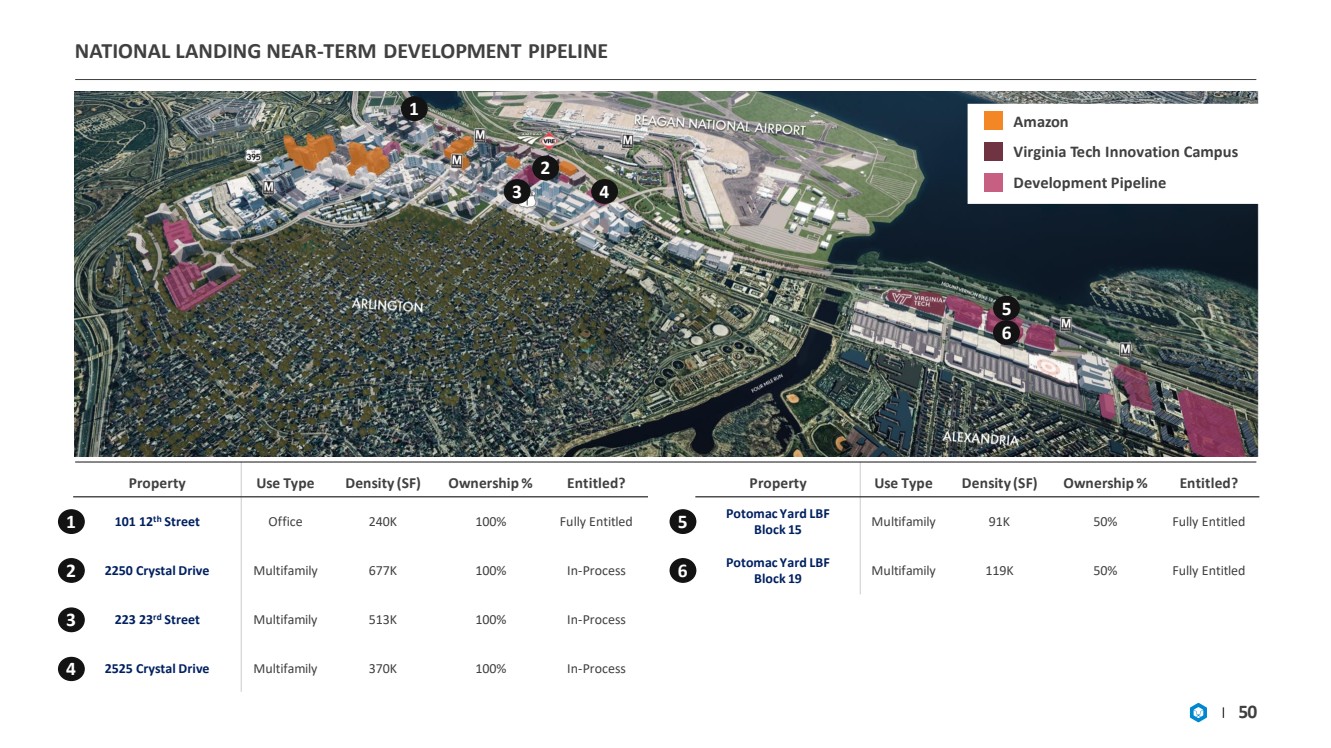
| NATIONAL LANDING NEAR - TERM DEVELOPMENT PIPELINE Amazon Virginia Tech Innovation Campus Development Pipeline 5 6 2 3 4 1 Property Use Type Density (SF) Ownership % Entitled? 101 12 th Street Office 240K 100% Fully Entitled 2250 Crystal Drive Multifamily 677K 100% In - Process 223 23 rd Street Multifamily 513K 100% In - Process 2525 Crystal Drive Multifamily 370K 100% In - Process 1 2 3 4 Property Use Type Density (SF) Ownership % Entitled? Potomac Yard LBF Block 15 Multifamily 91K 50% Fully Entitled Potomac Yard LBF Block 19 Multifamily 119K 50% Fully Entitled 5 6 50 |
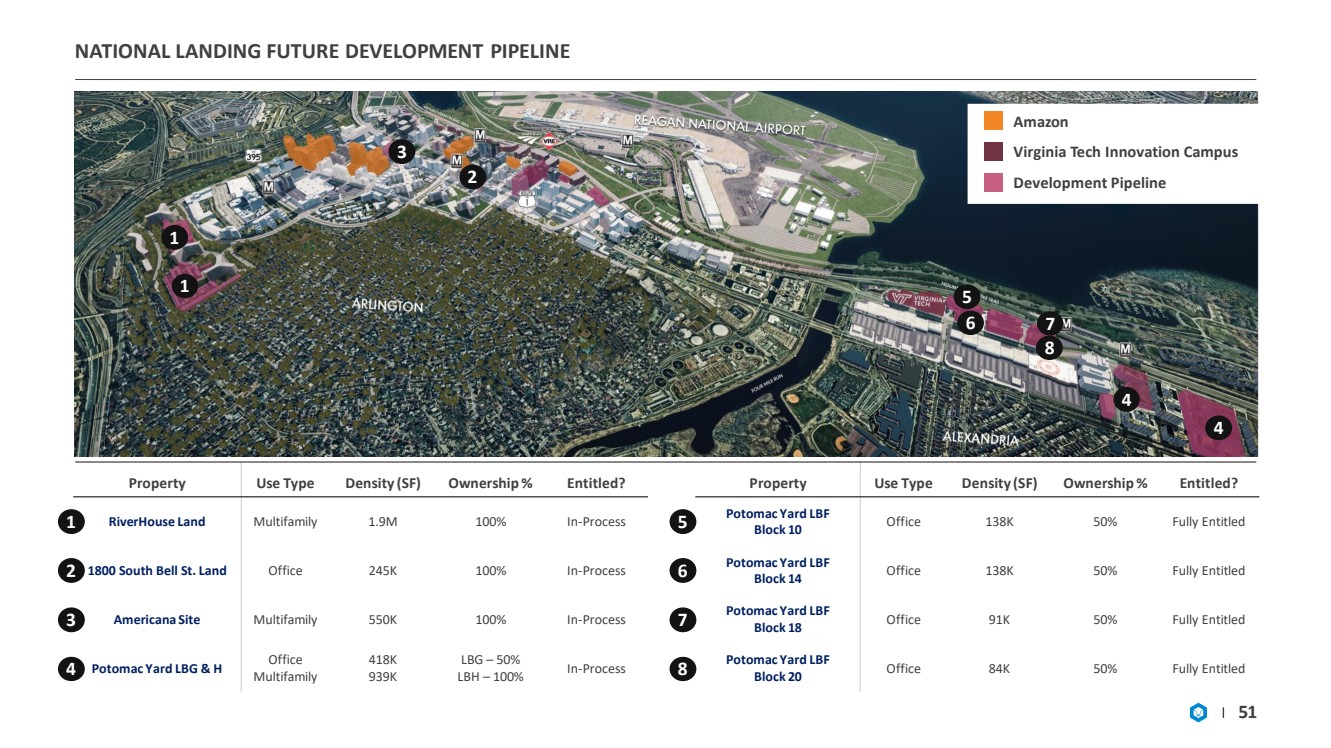
| NATIONAL LANDING FUTURE DEVELOPMENT PIPELINE Amazon Virginia Tech Innovation Campus Development Pipeline 1 1 2 3 4 5 6 7 8 4 Property Use Type Density (SF) Ownership % Entitled? RiverHouse Land Multifamily 1.9M 100% In - Process 1800 South Bell St. Land Office 245K 100% In - Process Americana Site Multifamily 550K 100% In - Process Potomac Yard LBG & H Office Multifamily 418K 939K LBG – 50% LBH – 100% In - Process 1 2 3 4 Property Use Type Density (SF) Ownership % Entitled? Potomac Yard LBF Block 10 Office 138K 50% Fully Entitled Potomac Yard LBF Block 14 Office 138K 50% Fully Entitled Potomac Yard LBF Block 18 Office 91K 50% Fully Entitled Potomac Yard LBF Block 20 Office 84K 50% Fully Entitled 5 6 7 8 51 |
| DEFINITIONS CARBON NEUTRAL “Carbon Neutral” means that any Scope 1 or Scope 2 carbon emissions released into the atmosphere from JBG SMITH’s building op era tions is balanced by an equivalent amount being removed. Scope 1 emissions represent natural gas consumed on - site by operating assets. Scope 2 emissions represent purchased electricity consumed on - site by operating assets. To date, our Carbon Neutral achievement has been met via verified carbon offsets and Green - e Certified renewable energy credits purchased and retired. DEVELOPMENT PIPELINE "Development Pipeline" refers collectively to the Near - Term Development and Future Development Pipelines. EARNINGS BEFORE INTEREST, TAXES, DEPRECIATION AND AMORTIZATION ( "EBITDA"), EBITDA FOR REAL ESTATE ("EBITDARE") AND "ADJUSTED EBITDA" Earnings Before Interest, Taxes, Depreciation and Amortization ("EBITDA"), EBITDA for Real Estate ("EBITDAre") and "Adjusted EBITDA" are non - GAAP financial measures .. EBITDA and EBITDAre are used by management as supplemental operating performance measures, which we believe help investors and lenders meaningfully evaluate and compare our operating performance from period - to - period by removing from our operating results the impact of our capital structure (primarily interest charges from our outstanding debt and the impact of our interest rate swaps) and certain non - cash expenses (primarily depreciation and amortization on our assets) .. EBITDAre is computed in accordance with the definition established by Nareit .. Nareit defines EBITDAre as GAAP net income (loss) adjusted to exclude interest expense, income taxes, depreciation and amortization expenses, gains and losses on sales of real estate and impairment write - downs of certain real estate assets and investments in entities when the impairment is directly attributable to decreases in the value of depreciable real estate held by the entity, including our share of such adjustments of unconsolidated real estate ventures .. These supplemental measures may help investors and lenders understand our ability to incur and service debt and to make capital expenditures .. EBITDA and EBITDAre are not substitutes for net income (loss) (computed in accordance with GAAP) and may not be comparable to similarly titled measures used by other companies .. Adjusted EBITDA represents EBITDAre adjusted for items we believe are not representative of ongoing operating results, such as Transaction and Other Costs, impairment write - downs of right - of - use assets associated with leases in which we are a lessee, gain (loss) on the extinguishment of debt, earnings (losses) and distributions in excess of our investment in unconsolidated real estate ventures, lease liability adjustments, income from investments, business interruption insurance proceeds and share - based compensation expense related to the Formation Transaction and special equity awards .. We believe that adjusting such items not considered part of our comparable operations, provides a meaningful measure to evaluate and compare our performance from period - to - period .. Because EBITDA, EBITDAre and Adjusted EBITDA have limitations as analytical tools, we use EBITDA, EBITDAre and Adjusted EBITDA to supplement GAAP financial measures .. Additionally, we believe that users of these measures should consider EBITDA, EBITDAre and Adjusted EBITDA in conjunction with net income (loss) and other GAAP measures in understanding our operating results .. A reconciliation of net income (loss) to EBITDA, EBITDAre and Adjusted EBITDA is presented on page 57 .. ESTIMATED INCREMENTAL INVESTMENT "Estimated Incremental Investment" means management's estimate of the remaining cost to be incurred in connection with the development of an asset as of March 31 , 2022 , including all remaining acquisition costs, hard costs, soft costs, tenant improvements (excluding Free Rent converted to tenant improvement allowances), leasing costs and other similar costs to develop and stabilize the asset but excluding any financing costs and ground rent expenses .. Actual incremental investment may differ substantially from our estimates due to numerous factors, including unanticipated expenses, delays in the estimated start and/or completion date, changes in design and other contingencies .. ESTIMATED POTENTIAL DEVELOPMENT DENSITY "Estimated Potential Development Density" reflects management's estimate of developable gross square feet based on our current business plans with respect to real estate owned or controlled as of March 31 , 2022 .. Our current business plans may contemplate development of less than the maximum potential development density for individual assets .. As market conditions change, our business plans, and therefore, the Estimated Potential Development Density, could change accordingly .. Given timing, zoning requirements and other factors, we make no assurance that Estimated Potential Development Density amounts will become actual density to the extent we complete development of assets for which we have made such estimates .. 52 |
| DEFINITIONS ESTIMATED TOTAL INVESTMENT "Estimated Total Investment" means, with respect to the development of an asset, the sum of the Historical Cost in such asset and the Estimated Incremental Investment for such asset .. Actual total investment may differ substantially from our estimates due to numerous factors, including unanticipated expenses, delays in the estimated start and/or completion date, changes in design and other contingencies .. For Future Development assets, Estimated Total Investment represents historical cost plus incremental costs to access the Estimated Potential Development Density, but does not include potential entitlement costs or infrastructure costs .. ESTIMATED TOTAL PROJECT COST "Estimated Total Project Cost" is estimated total investment excluding purchase price allocation adjustments recognized as a res ult of the Formation Transaction. Actual Total Project Cost may differ substantially from our estimates due to numerous factors, including unanticipated expenses, delays in the estimated start and /or completion date, changes in design and other contingencies. FORMATION TRANSACTION "Formation Transaction" refers collectively to the spin - off on July 17, 2017 of substantially all of the assets and liabilities of Vornado Realty Trust's Washington, DC segment, which operated as Vornado / Charles E. Smith, and the acquisition of the management business and certain assets and liabilities of The JBG Companies. FREE RENT “Free rent” means the amount of base rent and tenant reimbursements that are abated according to the applicable lease agreeme nt( s). FUTURE DEVELOPMENT PIPELINE "Future Development Pipeline" refers to assets that are development opportunities on which we do not intend to commence const ruc tion within the next three years where we (i) own land or control the land through a ground lease or (ii) are under a long - term conditional contract to purchase, or enter into, a leasehold interest with respect to land. GAAP "GAAP" means accounting principles generally accepted in the United States. HISTORICAL COST "Historical Cost" is a non - GAAP measure which includes the total Historical Cost incurred by JBG SMITH with respect to the devel opment of an asset, including any acquisition costs, hard costs, soft costs, tenant improvements (excluding Free Rent converted to tenant improvement allowances), leasing costs and other similar costs, but exc lud ing any financing costs and ground rent expenses incurred as of March 31, 2022. IN - SERVICE "In - Service" refers to commercial or multifamily operating assets that are at or above 90% leased or have been operating and col lecting rent for more than 12 months as of March 31, 2022. JBG SMITH SHARE "JBG SMITH Share" or "our share" refers to our ownership percentage of consolidated and unconsolidated assets in real estate ven tures. 53 |
| DEFINITIONS LIQUIDITY “Liquidity” refers to the sum of cash, undrawn amounts available under our credit facility and management’s estimated borrowing capacity on our unencumbered multifamily assets .. We can provide no assurance that we would be successful in securing the proceeds of such potential borrowing capacity on attractive terms or at all .. The way we calculate liquidity is not comparable to the liquidity measures presented by other companies .. METRO - SERVED "Metro - Served" means locations, submarkets or assets that are within 0.5 miles of an existing or planned Metro station. NEAR - TERM DEVELOPMENT PIPELINE "Near - Term Development Pipeline" refers to select assets that have the potential to commence construction over the next three years, subject to receipt of full entitlements, completion of design and market conditions .. NET DEBT "Net Debt" is a non - GAAP financial measurement .. Net Debt represents our total consolidated and unconsolidated indebtedness less cash and cash equivalents at our share .. Net Debt is an important component in the calculations of Net Debt to Annualized Adjusted EBITDA and Net Debt / total enterprise value .. We believe that Net Debt is a meaningful non - GAAP financial measure useful to investors because we review Net Debt as part of the management of our overall financial flexibility, capital structure and leverage .. We may utilize a considerable portion of our cash and cash equivalents at any given time for purposes other than debt reduction .. In addition, cash and cash equivalents at our share may not be solely controlled by us .. The deduction of cash and cash equivalents at our share from consolidated and unconsolidated indebtedness in the calculation of Net Debt, therefore, should not be understood to mean that it is available exclusively for debt reduction at any given time .. See “Disposition and Recapitalization Activity Subsequent to March 31 , 2022 – Adjustment of Calculations” for an explanation of a current adjustment to our Net Debt calculation .. 54 |
| DEFINITIONS NET OPERATING INCOME ("NOI"), "ANNUALIZED NOI", "ESTIMATED STABI LIZED NOI" AND "PROJECTED NOI YIELD" Net Operating Income ("NOI"), "Annualized NOI", "Estimated Stabilized NOI" and "Projected NOI Yield" are non - GAAP financial measures management uses to assess a segment's performance .. The most directly comparable GAAP measure is net income (loss) attributable to common shareholders .. We use NOI internally as a performance measure and believe NOI provides useful information to investors regarding our financial condition and results of operations because it reflects only property related revenue (which includes base rent, tenant reimbursements and other operating revenue, net of Free Rent and payments associated with assumed lease liabilities) less operating expenses and ground rent for operating leases, if applicable .. NOI also excludes deferred rent, related party management fees, interest expense, and certain other non - cash adjustments, including the accretion of acquired below - market leases and the amortization of acquired above - market leases and below - market ground lease intangibles .. Management uses NOI as a supplemental performance measure of our assets and believes it provides useful information to investors because it reflects only those revenue and expense items that are incurred at the asset level, excluding non - cash items .. In addition, NOI is considered by many in the real estate industry to be a useful starting point for determining the value of a real estate asset or group of assets .. However, because NOI excludes depreciation and amortization and captures neither the changes in the value of our assets that result from use or market conditions, nor the level of capital expenditures and capitalized leasing commissions necessary to maintain the operating performance of our assets, all of which have real economic effect and could materially impact the financial performance of our assets, the utility of NOI as a measure of the operating performance of our assets is limited .. NOI presented by us may not be comparable to NOI reported by other REITs that define these measures differently .. We believe to facilitate a clear understanding of our operating results, NOI should be examined in conjunction with net income (loss) attributable to common shareholders as presented in our financial statements .. NOI should not be considered as an alternative to net income (loss) attributable to common shareholders as an indication of our performance or to cash flows as a measure of liquidity or our ability to make distributions .. Annualized NOI, for all assets except Crystal City Marriott, represents NOI for the three months ended March 31 , 2022 multiplied by four .. Due to seasonality in the hospitality business, Annualized NOI for Crystal City Marriott represents the trailing 12 - month NOI as of March 31 , 2022 .. Management believes Annualized NOI provides useful information in understanding our financial performance over a 12 - month period, however, investors and other users are cautioned against attributing undue certainty to our calculation of Annualized NOI .. Actual NOI for any 12 - month period will depend on a number of factors beyond our ability to control or predict, including general capital markets and economic conditions, any bankruptcy, insolvency, default or other failure to pay rent by one or more of our tenants and the destruction of one or more of our assets due to terrorist attack, natural disaster or other casualty, among others .. We do not undertake any obligation to update our calculation to reflect events or circumstances occurring after the date of this earnings release .. There can be no assurance that the Annualized NOI shown will reflect our actual results of operations over any 12 - month period .. This Investor Presentation also contains management's estimate of stabilized NOI and projections of NOI yield for Under - Construction and Near - Term Development Pipeline assets, which are based on management's estimates of property - related revenue and operating expenses for each asset .. These estimates are inherently uncertain and represent management's plans, expectations and beliefs and are subject to numerous assumptions, risks and uncertainties .. The property - related revenues and operating expenses for our assets may differ materially from the estimates included in this Investor Presentation .. Management's projections of NOI yield are not projections of our overall financial performance or cash flow, and there can be no assurance that the Projected NOI Yield set forth in this Investor Presentation will be achieved .. Projected NOI Yield means our Estimated Stabilized NOI reported as a percentage of (i) Estimated Total Investment and (ii) Estimated Incremental Investment .. Actual initial full year stabilized NOI yield may vary from the Projected NOI Yield based on the actual incremental investment to complete the asset and its actual initial full year stabilized NOI, and there can be no assurance that we will achieve the Projected NOI Yields described in this Investor Presentation .. We do not provide reconciliations for non - GAAP estimates on a future basis, including Estimated Stabilized NOI and expected annualized NOI because we are unable to provide a meaningful or accurate calculation or estimate of reconciling items and the information is not available without unreasonable effort .. This inability is due to the inherent difficulty of forecasting the timing and/or amounts of various items that would impact net income (loss) .. Additionally, no reconciliation of Projected NOI Yield to the most directly comparable GAAP measure is included in this Investor Presentation because we are unable to quantify certain amounts that would be required to be included in the comparable GAAP financial measures without unreasonable efforts because such data is not currently available or cannot be currently estimated with confidence .. Accordingly, we believe such reconciliations would imply a degree of precision that would be confusing or misleading to investors .. NON - SAME STORE “Non - same store” refers to all operating assets excluded from the same store pool. 55 |
| DEFINITIONS PERCENT LEASED "Percent Leased" is based on leases signed as of March 31 , 2022 , and is calculated as total rentable square feet less rentable square feet available for lease divided by total rentable square feet expressed as a percentage .. Out - of - service square feet are excluded from this calculation .. PERCENT OCCUPIED "Percent Occupied" is based on occupied rentable square feet/units as of March 31 , 2022 , and is calculated as (i) for office and retail space, total rentable square feet less unoccupied square feet divided by total rentable square feet, (ii) for multifamily space, total units less unoccupied units divided by total units, expressed as a percentage .. Out - of - service square feet and units are excluded from this calculation .. RECENTLY DELIVERED "Recently Delivered" refers to commercial and multifamily assets that are below 90% leased and have been delivered within the 12 months ended March 31, 2022. SAME STORE "Same Store" refers to the pool of assets that were In - Service for the entirety of both periods being compared, except for assets for which significant redevelopment, renovation, or repositioning occurred during either of the periods being compared .. SQUARE FEET OR "SF" "Square Feet" or "SF" refers to the area that can be rented to tenants, defined as (i) for commercial assets, rentable square footage defined in the current lease and for vacant space the rentable square footage defined in the previous lease for that space, (ii) for multifamily assets, management's estimate of approximate rentable square feet, (iii) for Under - Construction assets, management's estimate of approximate rentable square feet based on current design plans as of March 31 , 2022 , and (iv) for Near - Term and Future Development Pipeline assets, management's estimate of developable gross square feet based on current business plans with respect to real estate owned or controlled as of March 31 , 2022 .. TRANSACTION AND OTHER COSTS "Transaction and Other Costs" include demolition costs, integration and severance costs, pursuit costs related to other completed, potential and pursued transactions, as well as other expenses .. UNDER - CONSTRUCTION "Under - Construction" refers to assets that were under construction during the three months ended March 31, 2022. WEIGHTED AVERAGE MARK - TO - MARKET “Weighted Average Mark - to - Market” represents the expected increase in base rent plus tenant reimbursements from second generatio n leases signed during the period over the base rent plus tenant reimbursements from the recently expired lease on that space. 56 |
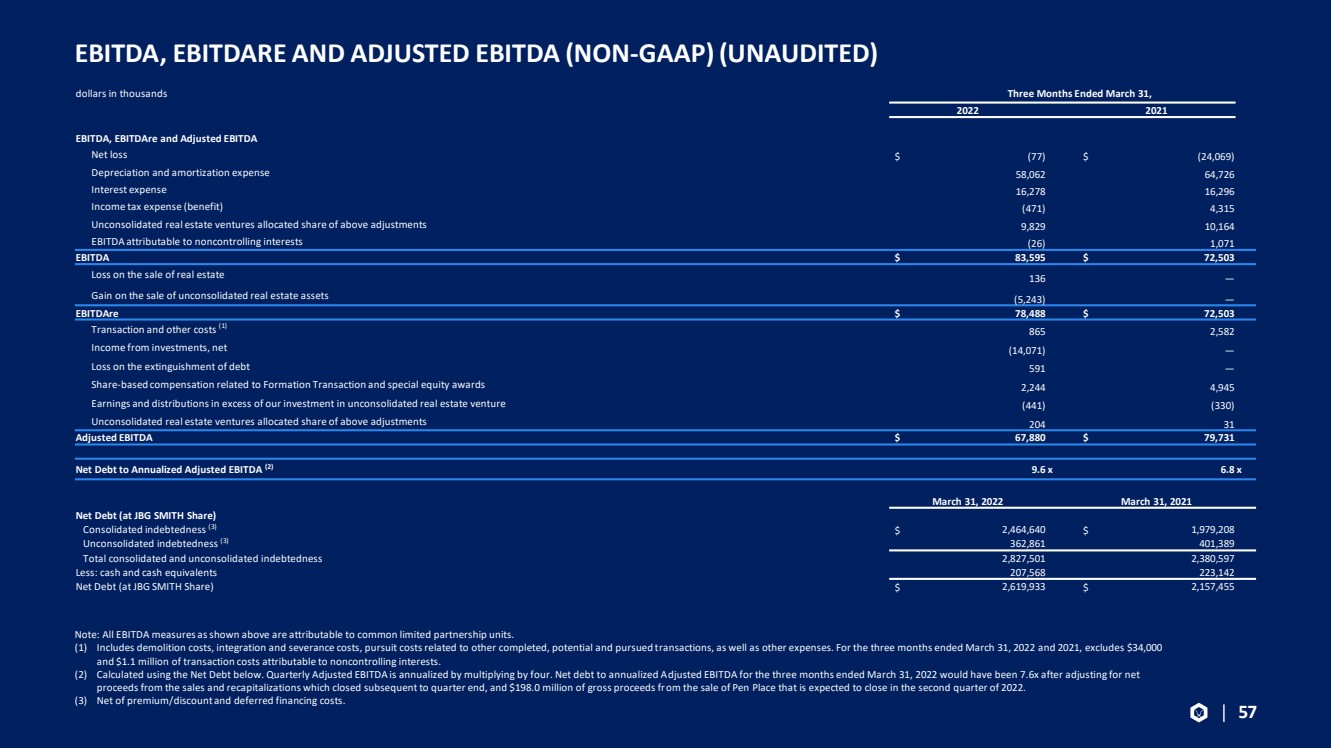
| EBITDA, EBITDARE AND ADJUSTED EBITDA (NON - GAAP) (UNAUDITED) Note: All EBITDA measures as shown above are attributable to common limited partnership units. (1) Includes demolition costs, integration and severance costs, pursuit costs related to other completed, potential and pursued t ran sactions, as well as other expenses. For the three months ended March 31, 2022 and 2021, excludes $34,000 and $1.1 million of transaction costs attributable to noncontrolling interests. (2) Calculated using the Net Debt below. Quarterly Adjusted EBITDA is annualized by multiplying by four. Net debt to annualized A dju sted EBITDA for the three months ended March 31, 2022 would have been 7.6x after adjusting for net proceeds from the sales and recapitalizations which closed subsequent to quarter end, and $198.0 million of gross proceeds fr om the sale of Pen Place that is expected to close in the second quarter of 2022. (3) Net of premium/discount and deferred financing costs. 57 dollars in thousands Three Months Ended March 31, 2022 2021 EBITDA, EBITDAre and Adjusted EBITDA Net loss $ (77) $ (24,069) Depreciation and amortization expense 58,062 64,726 Interest expense 16,278 16,296 Income tax expense (benefit) (471) 4,315 Unconsolidated real estate ventures allocated share of above adjustments 9,829 10,164 EBITDA attributable to noncontrolling interests (26) 1,071 EBITDA $ 83,595 $ 72,503 Loss on the sale of real estate 136 — Gain on the sale of unconsolidated real estate assets (5,243) — EBITDAre $ 78,488 $ 72,503 Transaction and other costs (1) 865 2,582 Income from investments, net (14,071) — Loss on the extinguishment of debt 591 — Share - based compensation related to Formation Transaction and special equity awards 2,244 4,945 Earnings and distributions in excess of our investment in unconsolidated real estate venture (441) (330) Unconsolidated real estate ventures allocated share of above adjustments 204 31 Adjusted EBITDA $ 67,880 $ 79,731 Net Debt to Annualized Adjusted EBITDA (2) 9.6 x 6.8 x March 31, 2022 March 31, 2021 Net Debt (at JBG SMITH Share) Consolidated indebtedness (3) $ 2,464,640 $ 1,979,208 Unconsolidated indebtedness (3) 362,861 401,389 Total consolidated and unconsolidated indebtedness 2,827,501 2,380,597 Less: cash and cash equivalents 207,568 223,142 Net Debt (at JBG SMITH Share) $ 2,619,933 $ 2,157,455 |
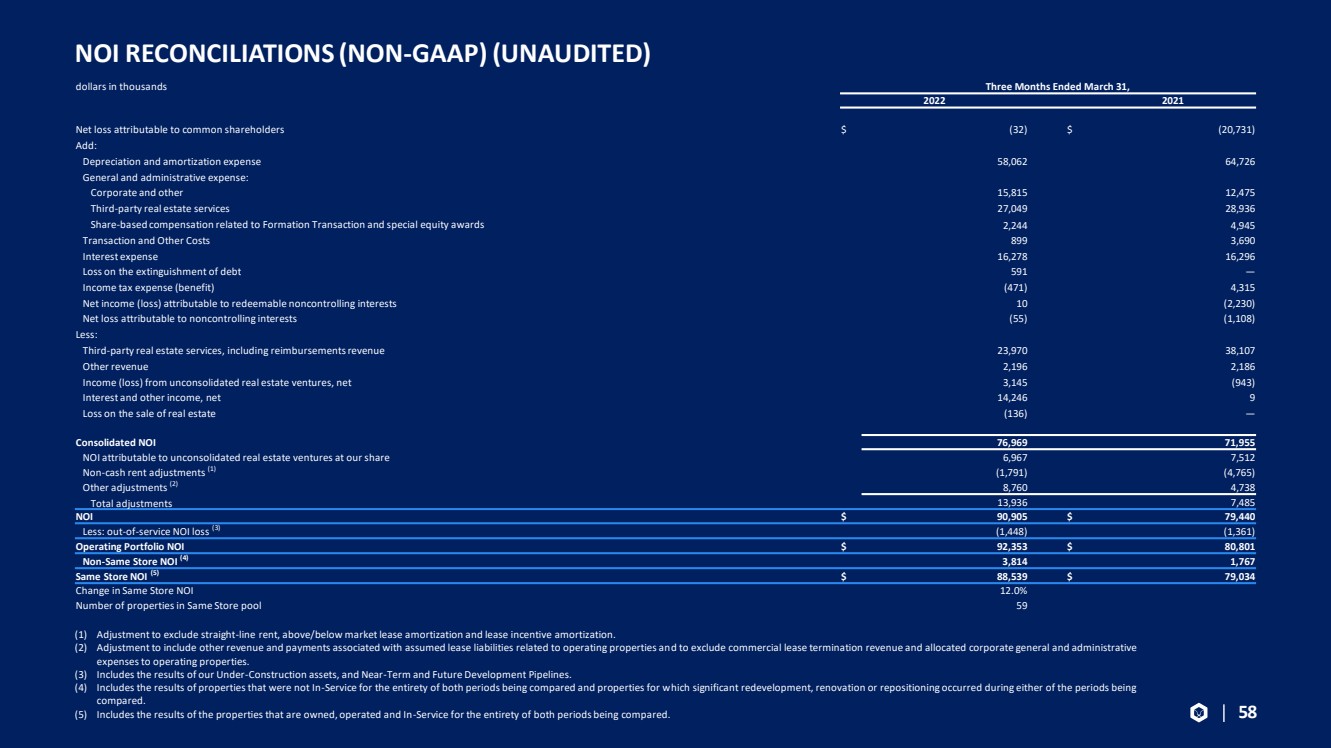
| NOI RECONCILIATIONS (NON - GAAP) (UNAUDITED) (1) Adjustment to exclude straight - line rent, above/below market lease amortization and lease incentive amortization. (2) Adjustment to include other revenue and payments associated with assumed lease liabilities related to operating properties an d t o exclude commercial lease termination revenue and allocated corporate general and administrative expenses to operating properties. (3) Includes the results of our Under - Construction assets, and Near - Term and Future Development Pipelines. (4) Includes the results of properties that were not In - Service for the entirety of both periods being compared and properties for w hich significant redevelopment, renovation or repositioning occurred during either of the periods being compared. (5) Includes the results of the properties that are owned, operated and In - Service for the entirety of both periods being compared. 58 dollars in thousands Three Months Ended March 31, 2022 2021 Net loss attributable to common shareholders $ (32) $ (20,731) Add: Depreciation and amortization expense 58,062 64,726 General and administrative expense: Corporate and other 15,815 12,475 Third - party real estate services 27,049 28,936 Share - based compensation related to Formation Transaction and special equity awards 2,244 4,945 Transaction and Other Costs 899 3,690 Interest expense 16,278 16,296 Loss on the extinguishment of debt 591 — Income tax expense (benefit) (471) 4,315 Net income (loss) attributable to redeemable noncontrolling interests 10 (2,230) Net loss attributable to noncontrolling interests (55) (1,108) Less: Third - party real estate services, including reimbursements revenue 23,970 38,107 Other revenue 2,196 2,186 Income (loss) from unconsolidated real estate ventures, net 3,145 (943) Interest and other income, net 14,246 9 Loss on the sale of real estate (136) — Consolidated NOI 76,969 71,955 NOI attributable to unconsolidated real estate ventures at our share 6,967 7,512 Non - cash rent adjustments (1) (1,791) (4,765) Other adjustments (2) 8,760 4,738 Total adjustments 13,936 7,485 NOI $ 90,905 $ 79,440 Less: out - of - service NOI loss (3) (1,448) (1,361) Operating Portfolio NOI $ 92,353 $ 80,801 Non - Same Store NOI (4) 3,814 1,767 Same Store NOI (5) $ 88,539 $ 79,034 Change in Same Store NOI 12.0% Number of properties in Same Store pool 59 |
|