Exhibit 99.1
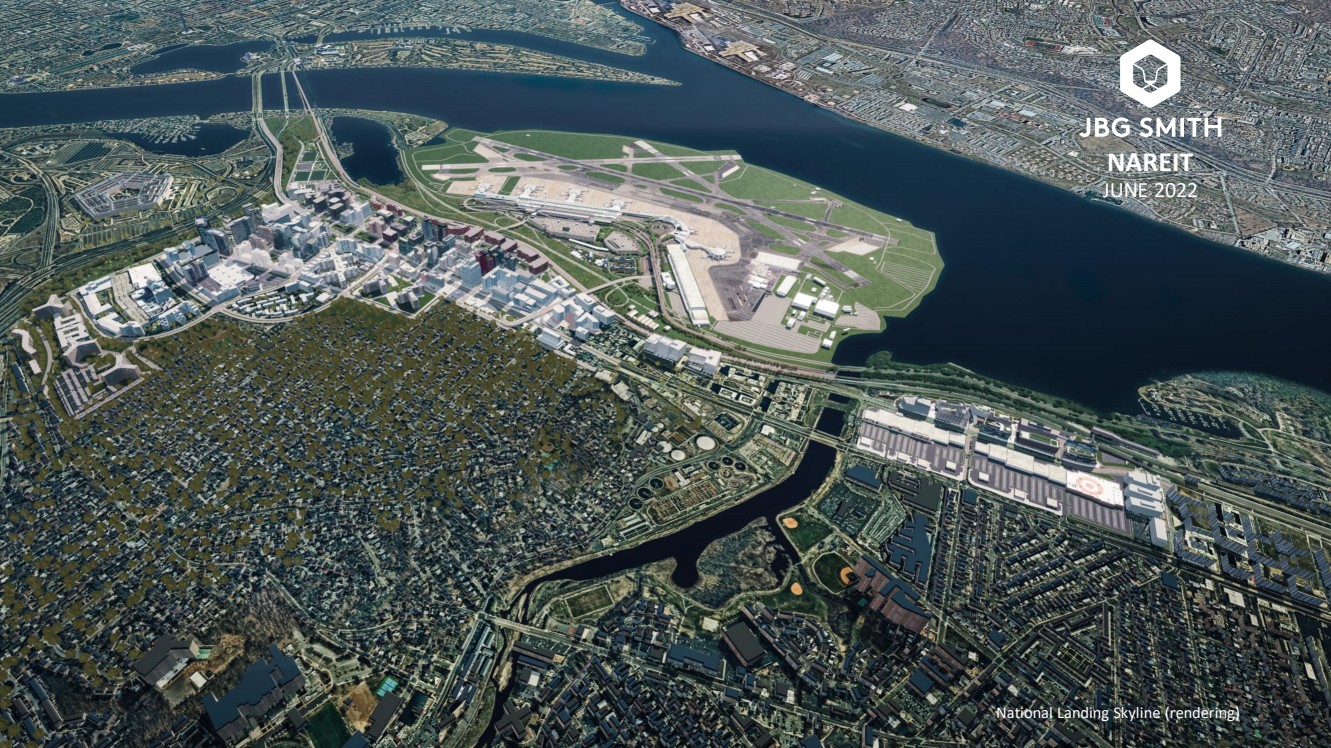
| National Landing Skyline (rendering) 1 NAREIT JUNE 2022 |
| DISCLOSURES ABOUT THIS UPDATED PRESENTATION We are providing this updated presentation to reflect that a number of transactions originally presented as under contract ha ve now closed and we undertake no obligation to provide future updates. FORWARD - LOOKING STATEMENTS Certain statements contained herein may constitute “forward - looking statements” as such term is defined in Section 27 A of the Securities Act of 1933 , as amended, and Section 21 E of the Securities Exchange Act of 1934 , as amended .. Forward - looking statements are not guarantees of performance .. They represent our intentions, plans, expectations and beliefs and are subject to numerous assumptions, risks and uncertainties .. Consequently, the future results of JBG SMITH Properties (“JBG SMITH”, the “Company”, “we”, “us”, “our” or similar terms) may differ materially from those expressed in these forward - looking statements .. You can find many of these statements by looking for words such as “approximate”, “hypothetical”, “potential”, “believes”, “expects”, “anticipates”, “estimates”, “intends”, “plans”, “would”, “may” or similar expressions in this Investor Presentation .. Currently, one of the most significant factors that could cause actual outcomes to differ materially from our forward - looking statements is the adverse effect of the current pandemic of the novel coronavirus, or COVID - 19 , on our financial condition, results of operations, cash flows, Liquidity, performance, tenants, the real estate market and the global economy and financial markets .. The extent to which the COVID - 19 pandemic continues to impact us and our tenants depends on future developments, many of which are highly uncertain and cannot be predicted with confidence, including the scope, severity, and duration of the pandemic, the actions taken to contain the pandemic or mitigate its impact, the direct and indirect economic effects of the pandemic and containment measures, and whether the residential market in the Washington, DC region and any of our properties will be materially impacted by the expiration of various moratoriums on residential evictions, among others .. Moreover, investors are cautioned to interpret many of the risks identified under the section titled “Risk Factors” in our Annual Report on Form 10 - K for the fiscal year ended December 31 , 2021 as being heightened as a result of the ongoing and numerous adverse impacts of the COVID - 19 pandemic .. We also note the following may impact our forward - looking statements : the risks associated with the failure to enter into and/or complete contemplated acquisitions or dispositions within the price ranges anticipated and on the terms and timing anticipated, or at all ; the impact of COVID - 19 and the ensuing economic turmoil on our Company, net operating income, same store net operating income, net asset value, stock price, occupancy rates, revenue from our multifamily and commercial portfolios, operating costs, deferrals of rent, uncollectible operating lease receivables, parking revenue, and burn - off of rent abatement ; whether the recent decline in demand for office space will continue or accelerate and the impact of such decline on our ability to renew or lease - up expiring office space ; whether the assumed capitalization rates for components of our portfolio are accurate ; whether our National Landing office portfolio is significantly undervalued to the extent that our assumptions suggest or at all ; whether the assumptions on which our “Estimated NOI Bridge” is based will be realized ; whether we would be successful in securing the proceeds of our estimated potential multifamily borrowing capacity on attractive terms or at all ; the impact of disruptions to the credit and capital markets on our ability to access capital, including refinancing maturing debt ; changes to the amount and manner in which tenants use space ; whether we will harvest the anticipated value of our development pipeline ; whether we incur additional costs or make additional concessions or offer other incentives to existing or prospective tenants to reconfigure space ; whether the Washington, DC region will be more resilient than other parts of the country in any recession and whether DC metro asking rents will be more resilient than those in other gateway markets ; our annual dividend per share and dividend yield ; annualized net operating income ; whether in the case of our multifamily portfolio, our anticipated incremental annualized net operating income will be realized ; whether our future capital recycling efforts will be successful and will be at or above NAV ; whether in the case of our under - construction assets, estimated square feet, estimated number of units and in the case of our near - term and future development assets, estimated potential development density are accurate ; the amount and timing of planned infrastructure and educational improvements in National Landing related to Amazon .. com, Inc .. ’s (“Amazon”) additional headquarters and the Virginia Tech Innovation Campus ; the economic impact, job growth and related demand for multifamily and commercial properties of Amazon’s additional headquarters on the DC region and National Landing and the speed with which such impact occurs and Amazon’s plans for accelerated hiring and in - person work requirements ; the impact of our role as the exclusive developer, property manager and retail leasing agent in connection with Amazon’s new headquarters ; our development plans related to Amazon’s additional headquarters ; whether National Landing will benefit economically from its proximity to the Department of Defense and elevated defense spending ; whether our plans related to our investment in 5 G wireless spectrum across National Landing will be a significant demand catalyst ; whether our target markets continue to be fast - growing ; whether future supply or construction delays will inhibit our ability to time new multifamily deliveries to meet market demand ; whether Amazon will have a similar growth impact on National Landing as in Seattle ; whether Seattle’s South Lake Union region pre - pandemic will prove to be an appropriate comparison to National Landing post - pandemic including respective resident preferences regarding housing, office location and commuting ; whether National Landing will experience the “Major Milestones“ on the timing discussed or at all ; whether anticipated near - term net operating income contributions, anticipated resiliency of the DC area and our contemplated shift to multifamily will be realized and, if realized, will have a positive impact on our share price ; in the case of our Under Construction and Near - Term Development Pipeline, the estimated completion date, stabilization date, estimated incremental investment, total investment, projected NOI, targeted NOI yield, estimated stabilized value and estimated value creation ; whether we will shift to majority multifamily on the timing anticipated or at all ; whether we can access agency debt secured by our currently unencumbered multifamily assets in a timely manner, in the amounts we estimate, on reasonable terms or at all ; whether our newly delivered assets and the assets in our Development Pipeline will generate the stabilized annualized NOI anticipated ; whether our newly delivered assets will stabilize on the timing anticipated and deliver the expected annualized NOI ; whether we will succeed in our contemplated recycling of disposition proceeds into acquisitions yielding the anticipated stabilized capitalization rates ; and whether the allocation of capital to our share repurchase plan has any impact on our share price .. 2 |
| DISCLOSURES Many of the factors that will determine the outcome of these and our other forward - looking statements are beyond our ability to control or predict .. These factors include, among others : adverse economic conditions in the Washington, DC metropolitan area, including in relation to COVID - 19 , the timing of and costs associated with development and property improvements, financing commitments, and general competitive factors .. For further discussion of factors that could materially affect the outcome of our forward - looking statements and other risks and uncertainties, see “Risk Factors,” “Management’s Discussion and Analysis of Financial Condition and Results of Operations” and the Cautionary Statement Concerning Forward - Looking Statements in the Company’s Annual Report on Form 10 - K for the year ended December 31 , 2021 and other periodic reports the Company files with the Securities and Exchange Commission .. For these statements, we claim the protection of the safe harbor for forward - looking statements contained in the Private Securities Litigation Reform Act of 1995 .. You are cautioned not to place undue reliance on our forward - looking statements .. All subsequent written and oral forward - looking statements attributable to us or any person acting on our behalf are expressly qualified in their entirety by the cautionary statements contained or referred to in this section .. We do not undertake any obligation to release publicly any revisions to our forward - looking statements to reflect events or circumstances occurring after the date hereof .. PRO RATA INFORMATION We present certain financial information and metrics in this release "at JBG SMITH Share," which refers to our ownership percentage of consolidated and unconsolidated assets in real estate ventures (collectively, "real estate ventures") as applied to these financial measures and metrics .. Financial information "at JBG SMITH Share" is calculated on an asset - by - asset basis by applying our percentage economic interest to each applicable line item of that asset's financial information .. "At JBG SMITH Share" information, which we also refer to as being "at share," "our pro rata share" or "our share," is not, and is not intended to be, a presentation in accordance with GAAP .. Given that a substantial portion of our assets are held through real estate ventures, we believe this form of presentation, which presents our economic interests in the partially owned entities, provides investors valuable information regarding a significant component of our portfolio, its composition, performance and capitalization .. We do not control the unconsolidated real estate ventures and do not have a legal claim to our co - venturers' share of assets, liabilities, revenue and expenses .. The operating agreements of the unconsolidated real estate ventures generally allow each co - venturer to receive cash distributions to the extent there is available cash from operations .. The amount of cash each investor receives is based upon specific provisions of each operating agreement and varies depending on certain factors including the amount of capital contributed by each investor and whether any investors are entitled to preferential distributions .. With respect to any such third - party arrangement, we would not be in a position to exercise sole decision - making authority regarding the property, real estate venture or other entity, and may, under certain circumstances, be exposed to economic risks not present were a third - party not involved .. We and our respective co - venturers may each have the right to trigger a buy - sell or forced sale arrangement, which could cause us to sell our interest, or acquire our co - venturers' interests, or to sell the underlying asset, either on unfavorable terms or at a time when we otherwise would not have initiated such a transaction .. Our real estate ventures may be subject to debt, and the repayment or refinancing of such debt may require equity capital calls .. To the extent our co - venturers do not meet their obligations to us or our real estate ventures or they act inconsistent with the interests of the real estate venture, we may be adversely affected .. Because of these limitations, the non - GAAP "at JBG SMITH Share" financial information should not be considered in isolation or as a substitute for our financial statements as reported under GAAP .. MARKET DATA Market data and industry forecasts are used in this Investor Presentation, including data obtained from publicly available sources .. These sources generally state that the information they provide has been obtained from sources believed to be reliable, but the accuracy and completeness of the information is not assured .. We have not independently verified any such information .. 3 |
| DISCLOSURES AMAZON In November 2018 , Amazon announced it had selected sites in National Landing as the location of its new headquarters .. We currently have leases with Amazon totaling 1 .. 0 million square feet at six office buildings in National Landing .. In March 2019 , we executed purchase and sale agreements with Amazon for two of our National Landing development sites, Metropolitan Park and Pen Place, on which Amazon is constructing its new headquarters .. We are currently constructing two new office buildings for Amazon on Metropolitan Park, totaling 2 .. 1 million square feet, inclusive of over 50 , 000 square feet of street - level retail with new shops and restaurants .. In December 2021 , we finalized the agreement for the sale of Pen Place to Amazon for $ 198 .. 0 million, which represents a $ 48 .. 1 million increase over the previously estimated contract value .. The sale of Pen Place to Amazon closed during the second quarter of 2022 .. We are the developer, property manager and retail leasing agent for Amazon's new headquarters at National Landing .. In connection with Amazon's new headquarters in National Landing, the Commonwealth of Virginia enacted an incentives bill, which provides tax incentives to Amazon to create a minimum of 25 , 000 new full - time jobs and potentially 37 , 850 full - time jobs in National Landing with average annual wage targets for each calendar year, starting with $ 150 , 000 in 2019 , and escalating 1 .. 5 % per year .. JBG SMITH, alongside Amazon, Virginia Tech, and federal, state and local governments plan to invest more than $ 12 .. 4 billion, including infrastructure investments, that will directly benefit National Landing .. This includes approximately $ 6 billion of infrastructure investments planned by state and local governments, which is fully committed, including : lowering of elevated sections of U .. S .. Route 1 that currently divide parts of National Landing to create better multimodal access and walkability ; two new Metro entrances (Crystal Drive and Potomac Yard) ; a pedestrian bridge to Reagan National Airport ; a new commuter rail station located between two of our Crystal Drive office assets ; and Long Bridge, the planned two - track rail connection between Washington, DC and National Landing .. We include certain statistics in the following slides as outlined in the Memorandum of Understanding (MOU) between Amazon and the Commonwealth of Virginia, executed on November 12 , 2018 , and that identify the proximity of our portfolio to National Landing : specifically, 96 % of our portfolio, excluding non - core assets, is within a 20 - minute commute of National Landing, as calculated on a pre - COVID - 19 Monday morning .. We include references to the percentage of Amazon employees who elected to live within walking or biking distance to Amazon’s headquarters in Seattle, as well as the percentage of our portfolio that is within a 20 - minute commute of National Landing .. These percentages are based on pre - COVID - 19 data .. Due to Amazon’s recently announced policies regarding remote work, the pre - pandemic nature of the Seattle data and other factors, we can make no assurance that these data will be comparable for employees who work at Amazon’s HQ 2 in National Landing .. VIRGINIA TECH In the fall of 2020 , Virginia Tech virtually launched the inaugural academic year of its currently under construction $ 1 billion Innovation Campus in National Landing .. This expected powerful demand driver sits adjacent to 2 .. 0 million square feet of development density we own in National Landing and a new, under - construction Potomac Yard Metro station, all approximately one mile south of Amazon's new headquarters .. The campus is part of a 20 - acre innovation district, of which the fully entitled first phase encompasses approximately 1 .. 7 million square feet of space, including four office towers and two residential buildings, with ground - level retail .. On this campus, Virginia Tech intends to create an innovation ecosystem by co - locating academic and private sector uses to accelerate research and development spending, as well as the commercialization of technology .. When the Innovation Campus is fully operational, Virginia Tech plans to annually graduate approximately 750 master students and 150 PhD students in STEM fields .. Virginia Tech, which is expected to occupy 675 , 000 square feet in the Innovation Campus, is also attracting funding from STEM employers (technology, defense and aerospace), including over $ 65 million publicly announced to date from Amazon, Boeing and Northrop Grumman .. 4 |
| DISCLOSURES DISPOSITION AND RECAPITALIZATION ACTIVITY SUBSEQUENT TO MARCH 31 , 2022 – ADJUSTMENT OF CALCULATIONS On April 1 , 2022 , we sold the Universal Buildings, commercial assets located in Washington DC, for $ 228 .. 0 million .. On April 13 , 2022 , we formed an unconsolidated real estate venture with affiliates of Fortress Investment Group LLC (“Fortress”) to recapitalize a 1 .. 6 million square foot office portfolio and land parcels valued at $ 580 .. 0 million comprising four wholly owned commercial assets ( 7200 Wisconsin Avenue, 1730 M Street, RTC - West/RTC - West Trophy Office/RTC - West Land and Courthouse Plaza 1 and 2 ), which were classified as assets held for sale as of March 31 , 2022 .. Fortress contributed $ 131 .. 0 million for a 66 .. 5 % interest in the venture .. In connection with the transaction, the real estate venture obtained mortgage loans totaling $ 458 .. 0 million secured by the properties, of which $ 402 .. 0 million was drawn at closing .. We will provide asset management, property management and leasing services to the venture .. Because our interest in the venture is subordinated to a 15 % preferred return to Fortress, we do not anticipate receiving any near - term cash flow distributions from it .. Where noted and going forward, these assets will be excluded from the occupancy, non - GAAP financial measures, and leverage metrics presented in our presentation .. On April 29 , 2022 , we sold a 99 - year term leasehold interest in a future development asset located in Reston, VA .. On June 1 , 2022 , our unconsolidated real estate venture sold 1900 N Street, a 270 , 000 square feet commercial asset in Washington DC owned through a partnership between JBG SMITH ( 55 % ) and Canadian Pension Plan Investment Board ( 45 % ), for $ 265 million .. DEFINITIONS AND RECONCILIATIONS For certain definitions and reconciliations see pages 13 – 19 .. 5 |
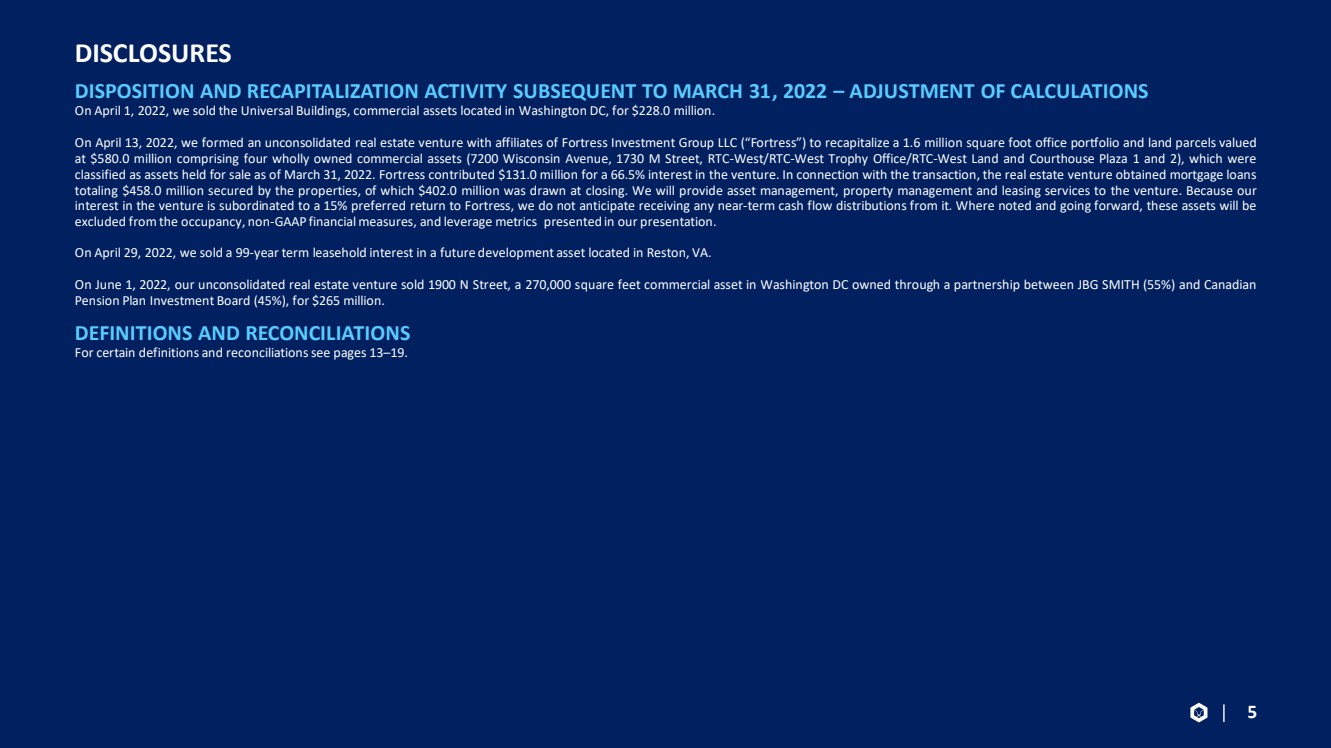
| MAXIMIZING LONG - TERM NAV PER SHARE GROWTH TRANSITIONING TO MAJORITY MULTIFAMILY AND CONCENTRATING OFFICE I N NATIONAL LANDING (1) Includes operating portfolio, under - construction assets and Development Pipeline and excludes non - core assets in light of ou r plans to dispose of them. (2) Excludes non - core land assets in light of our plans to dispose of them. 6 70%+ of portfolio to be concentrated in National Landing (1) , home to high - growth, future - proof, and mission critical tech demand drivers 1 2 3 4 8.6M SF Development Pipeline (2) (28% fully entitled | remaining 72% expected to be fully entitled by 2024), providing significant growth and monetization opportunities $425M of estimated annualized NOI by year - end 2026 (7.6% CAGR). $15M expected by year - end 2022 from multifamily portfolio. Proven capital allocator with a robust balance sheet, led by a seasoned team 4747 Bethesda Avenue (Bethesda, MD) 5 A leader in ESG |
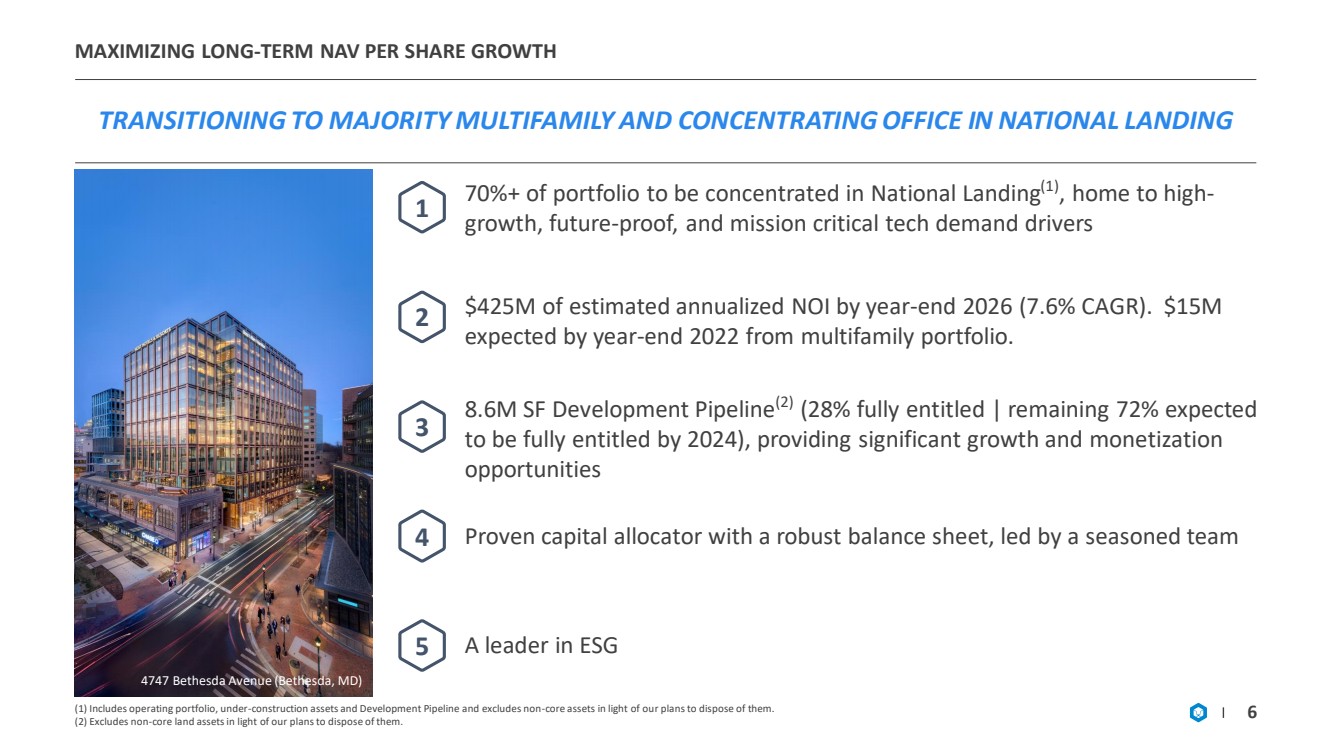
| JBG SMITH CONCENTRATED IN NATIONAL LANDING A NATIONAL LANDING - FOCUSED COMPANY WITH MULTIFAMILY CONCENTRATED IN HIGH - GROWTH, AMENITY - RICH, PROXIMATE SUBMARKETS 7 (1) Represents “Future” state and includes operating portfolio, under - construction assets and Development Pipeline and excludes all non - core assets, in light of our plans to dispose of them. Note: Size of spheres based on square footage. FUTURE JBGS PORTFOLIO (1) 70%+ CONCENTRATED IN NATIONAL LANDING 96% WITHIN A 20 - MINUTE COMMUTE OF NATIONAL LANDING 100% METRO - SERVED 87 WALK SCORE Multifamily Commercial |
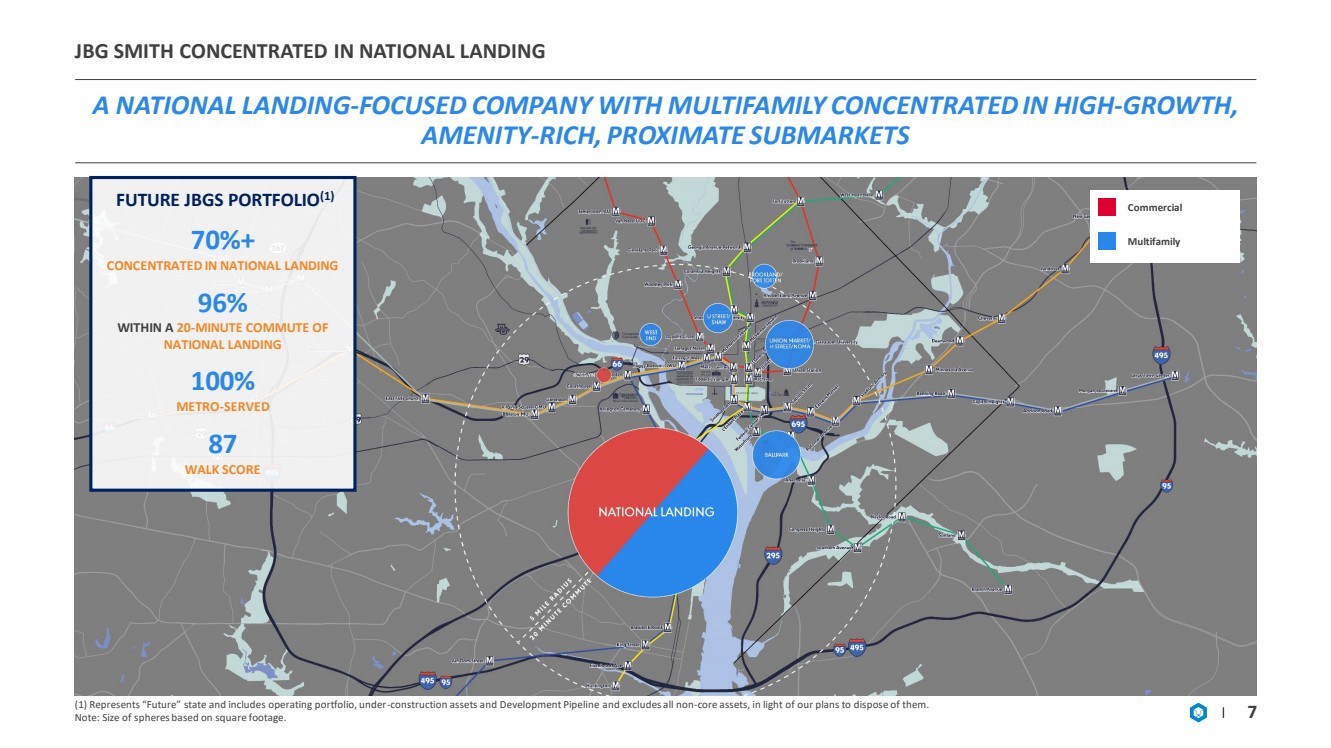
| DRAMATIC REPOSITIONING OF NATIONAL LANDING NATIONAL LANDING POSITIONED TO BE THE NATION’S PREMIER LIVE - WORK - PLAY DESTINATION 8 1,583 units under construction and potential to start 2,150+ units over the next 3 years, balancing neighborhood towards multifamily ✓ 55 new retailers under construction, including new anchor tenants and local and minority - owned businesses, tripling the number of street - level retailers ✓ Establishing National Landing as the first 5G - enabled connected city at scale in the country ✓ ✓ $6B in physical infrastructure initiatives (fully committed) ✓ Expanded technology ecosystem anchored by Amazon HQ2 and Virginia Tech Water Park (rendering) 1900 Crystal Drive (rendering) Amazon HQ2 (rendering) |
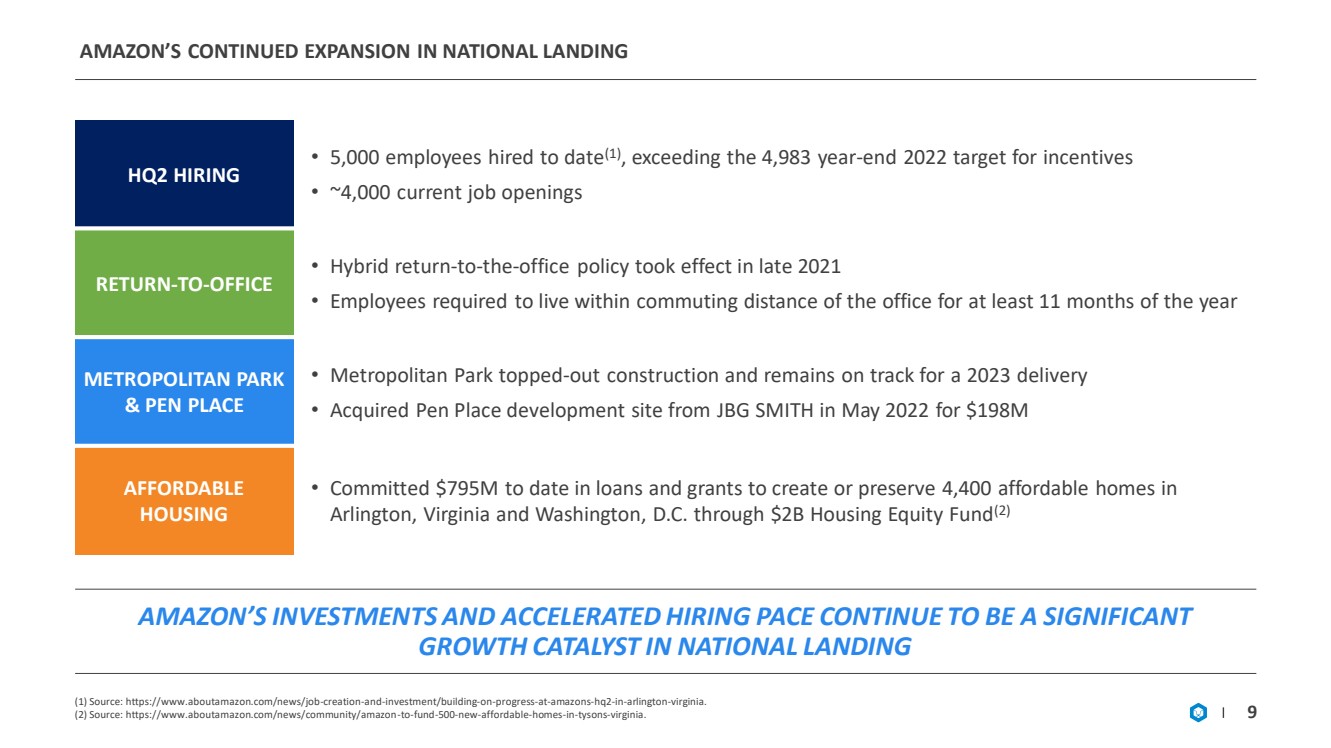
| AMAZON’S CONTINUED EXPANSION IN NATIONAL LANDING (1) Source: https://www.aboutamazon.com/news/job - creation - and - investment/building - on - progress - at - amazons - hq2 - in - arlington - virgin ia. (2) Source: https://www.aboutamazon.com/news/community/amazon - to - fund - 500 - new - affordable - homes - in - tysons - virginia. 9 AMAZON’S INVESTMENTS AND ACCELERATED HIRING PACE CONTINUE TO BE A SIGNIFICANT GROWTH CATALYST IN NATIONAL LANDING HQ2 HIRING • 5,000 employees hired to date (1) , exceeding the 4,983 year - end 2022 target for incentives • ~4,000 current job openings RETURN - TO - OFFICE • Hybrid return - to - the - office policy took effect in late 2021 • Employees required to live within commuting distance of the office for at least 11 months of the year METROPOLITAN PARK & PEN PLACE • Metropolitan Park topped - out construction and remains on track for a 2023 delivery • Acquired Pen Place development site from JBG SMITH in May 2022 for $198M AFFORDABLE HOUSING • Committed $795M to date in loans and grants to create or preserve 4,400 affordable homes in Arlington, Virginia and Washington, D.C. through $2B Housing Equity Fund (2) |
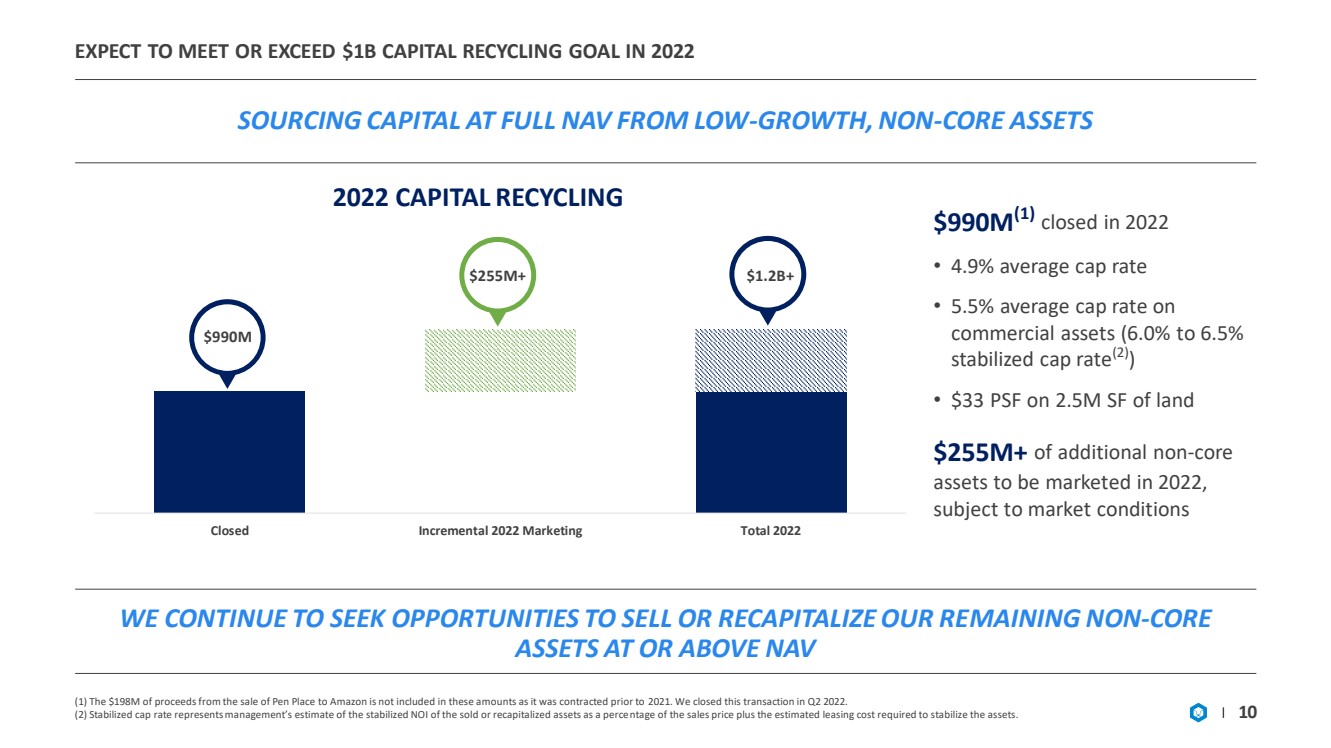
| Closed Incremental 2022 Marketing Total 2022 EXPECT TO MEET OR EXCEED $1B CAPITAL RECYCLING GOAL IN 2022 SOURCING CAPITAL AT FULL NAV FROM LOW - GROWTH, NON - CORE ASSETS 10 2022 CAPITAL RECYCLING $990M WE CONTINUE TO SEEK OPPORTUNITIES TO SELL OR RECAPITALIZE OUR RE MAINING NON - CORE ASSETS AT OR ABOVE NAV $990M (1) closed in 2022 • 4.9% average cap rate • 5.5% average cap rate on commercial assets (6.0% to 6.5% stabilized cap rate (2) ) • $33 PSF on 2.5M SF of land $255M+ of additional non - core assets to be marketed in 2022, subject to market conditions $1.2B+ $255M+ (1) The $198M of proceeds from the sale of Pen Place to Amazon is not included in these amounts as it was contracted prior to 20 21. We closed this transaction in Q2 2022. (2) Stabilized cap rate represents management’s estimate of the stabilized NOI of the sold or recapitalized assets as a perce nta ge of the sales price plus the estimated leasing cost required to stabilize the assets. |
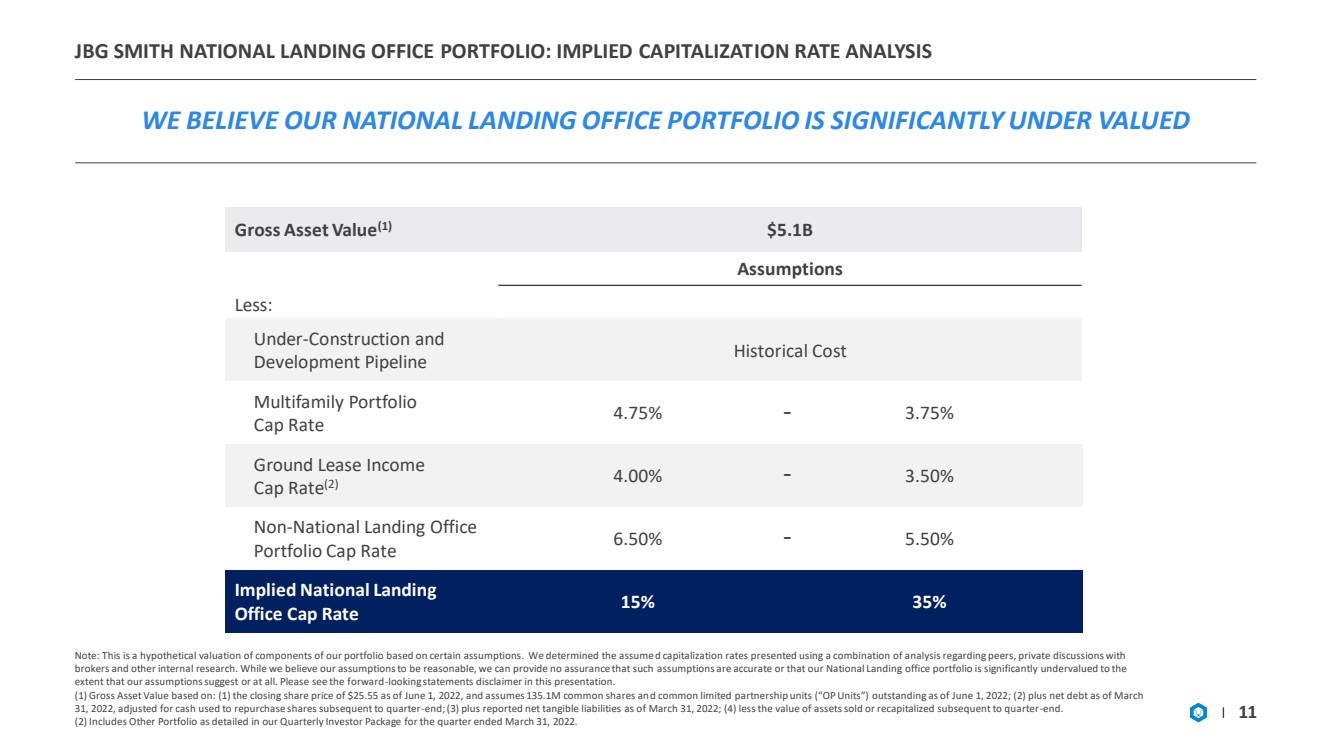
| JBG SMITH NATIONAL LANDING OFFICE PORTFOLIO: IMPLIED CAPITALIZAT ION RATE ANALYSIS WE BELIEVE OUR NATIONAL LANDING OFFICE PORTFOLIO IS SIGNIFICANTL Y UNDER VALUED Note: This is a hypothetical valuation of components of our portfolio based on certain assumptions. We determined the assume d c apitalization rates presented using a combination of analysis regarding peers, private discussions with brokers and other internal research. While we believe our assumptions to be reasonable, we can provide no assurance that such as sumptions are accurate or that our National Landing office portfolio is significantly undervalued to the extent that our assumptions suggest or at all. Please see the forward - looking statements disclaimer in this presentation. (1) Gross Asset Value based on: (1) the closing share price of $25.55 as of June 1, 2022, and assumes 135.1M common shares an d c ommon limited partnership units (“OP Units”) outstanding as of June 1, 2022; (2) plus net debt as of March 31, 2022, adjusted for cash used to repurchase shares subsequent to quarter - end; (3) plus reported net tangible liabilities as o f March 31, 2022; (4) less the value of assets sold or recapitalized subsequent to quarter - end. (2) Includes Other Portfolio as detailed in our Quarterly Investor Package for the quarter ended March 31, 2022. 11 Gross Asset Value (1) $5.1B Assumptions Less: Under - Construction and Development Pipeline Historical Cost Multifamily Portfolio Cap Rate 4.75% 3.75% Ground Lease Income Cap Rate (2) 4.00% 3.50% Non - National Landing Office Portfolio Cap Rate 6.50% 5.50% Implied National Landing Office Cap Rate 15% 35% - - - |
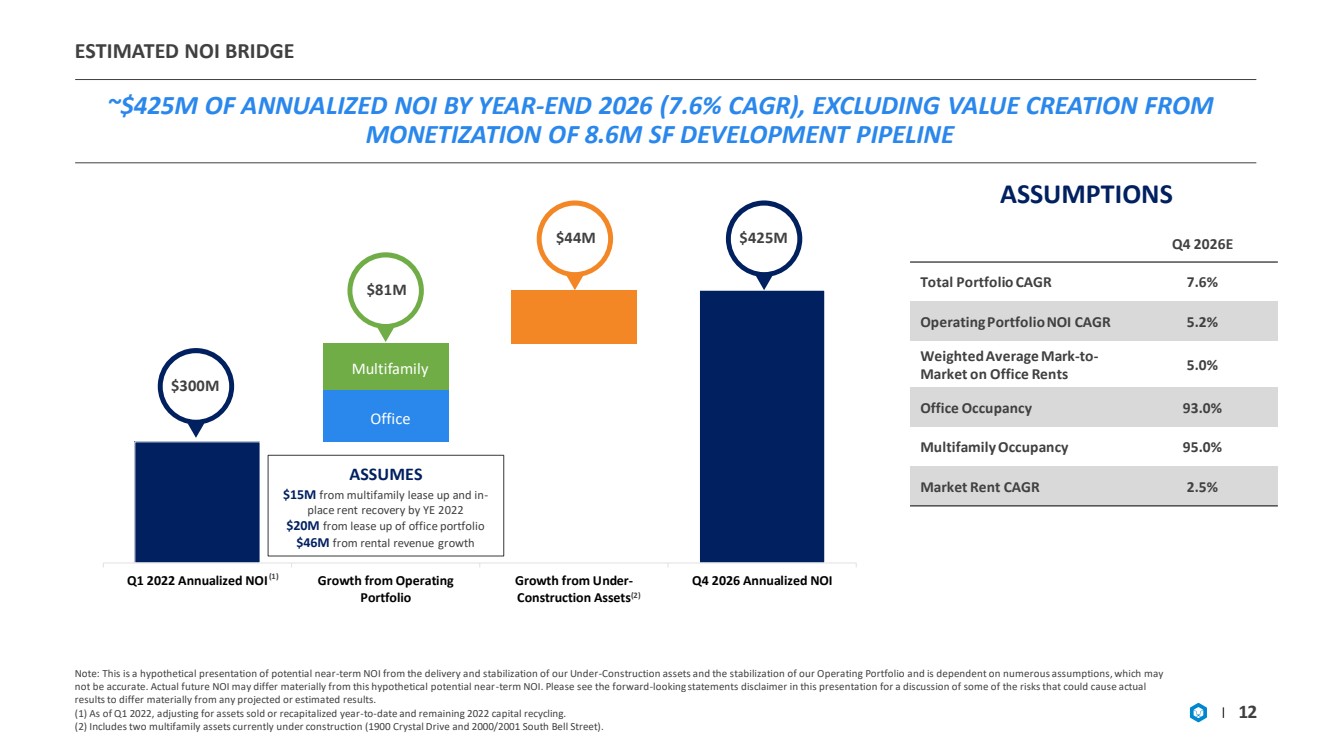
| Q1 2022 Annualized NOI Growth from Operating Portfolio Growth from Under- Construction Assets Q4 2026 Annualized NOI ESTIMATED NOI BRIDGE ~$425M OF ANNUALIZED NOI BY YEAR - END 2026 (7.6% CAGR), EXCLUDING VALUE CREATION FROM MONETIZATION OF 8.6M SF DEVELOPMENT PIPELINE Note: This is a hypothetical presentation of potential near - term NOI from the delivery and stabilization of our Under - Constructi on assets and the stabilization of our Operating Portfolio and is dependent on numerous assumptions, which may not be accurate. Actual future NOI may differ materially from this hypothetical potential near - term NOI. Please see the forward - looking statements disclaimer in this presentation for a discussion of some of the risks that could cause actual results to differ materially from any projected or estimated results. (1) As of Q1 2022, adjusting for assets sold or recapitalized year - to - date and remaining 2022 capital recycling. (2) Includes two multifamily assets currently under construction (1900 Crystal Drive and 2000/2001 South Bell Street). 12 Q4 2026E Total Portfolio CAGR 7.6% Operating Portfolio NOI CAGR 5.2% Weighted Average Mark - to - Market on Office Rents 5.0% Office Occupancy 93.0% Multifamily Occupancy 95.0% Market Rent CAGR 2.5% ASSUMPTIONS (1) (2) ASSUMES $15M from multifamily lease up and in - place rent recovery by YE 2022 $20M from lease up of office portfolio $46M from rental revenue growth $300M $81M $44M $425M Multifamily Office |
| DEFINITIONS DEVELOPMENT PIPELINE "Development Pipeline" refers collectively to the Near - Term Development and Future Development Pipelines. EARNINGS BEFORE INTEREST, TAXES, DEPRECIATION AND AMORTIZATION ( "EBITDA"), EBITDA FOR REAL ESTATE ("EBITDARE") AND "ADJUSTED EBITDA" Earnings Before Interest, Taxes, Depreciation and Amortization ("EBITDA"), EBITDA for Real Estate ("EBITDAre") and "Adjusted EBITDA" are non - GAAP financial measures .. EBITDA and EBITDAre are used by management as supplemental operating performance measures, which we believe help investors and lenders meaningfully evaluate and compare our operating performance from period - to - period by removing from our operating results the impact of our capital structure (primarily interest charges from our outstanding debt and the impact of our interest rate swaps) and certain non - cash expenses (primarily depreciation and amortization on our assets) .. EBITDAre is computed in accordance with the definition established by Nareit .. Nareit defines EBITDAre as GAAP net income (loss) adjusted to exclude interest expense, income taxes, depreciation and amortization expenses, gains and losses on sales of real estate and impairment write - downs of certain real estate assets and investments in entities when the impairment is directly attributable to decreases in the value of depreciable real estate held by the entity, including our share of such adjustments of unconsolidated real estate ventures .. These supplemental measures may help investors and lenders understand our ability to incur and service debt and to make capital expenditures .. EBITDA and EBITDAre are not substitutes for net income (loss) (computed in accordance with GAAP) and may not be comparable to similarly titled measures used by other companies .. Adjusted EBITDA represents EBITDAre adjusted for items we believe are not representative of ongoing operating results, such as Transaction and Other Costs, impairment write - downs of right - of - use assets associated with leases in which we are a lessee, gain (loss) on the extinguishment of debt, earnings (losses) and distributions in excess of our investment in unconsolidated real estate ventures, lease liability adjustments, income from investments, business interruption insurance proceeds and share - based compensation expense related to the Formation Transaction and special equity awards .. We believe that adjusting such items not considered part of our comparable operations, provides a meaningful measure to evaluate and compare our performance from period - to - period .. Because EBITDA, EBITDAre and Adjusted EBITDA have limitations as analytical tools, we use EBITDA, EBITDAre and Adjusted EBITDA to supplement GAAP financial measures .. Additionally, we believe that users of these measures should consider EBITDA, EBITDAre and Adjusted EBITDA in conjunction with net income (loss) and other GAAP measures in understanding our operating results .. A reconciliation of net income (loss) to EBITDA, EBITDAre and Adjusted EBITDA is presented on page 18 .. ESTIMATED INCREMENTAL INVESTMENT "Estimated Incremental Investment" means management's estimate of the remaining cost to be incurred in connection with the development of an asset as of March 31 , 2022 , including all remaining acquisition costs, hard costs, soft costs, tenant improvements (excluding Free Rent converted to tenant improvement allowances), leasing costs and other similar costs to develop and stabilize the asset but excluding any financing costs and ground rent expenses .. Actual incremental investment may differ substantially from our estimates due to numerous factors, including unanticipated expenses, delays in the estimated start and/or completion date, changes in design and other contingencies .. ESTIMATED POTENTIAL DEVELOPMENT DENSITY "Estimated Potential Development Density" reflects management's estimate of developable gross square feet based on our current business plans with respect to real estate owned or controlled as of March 31 , 2022 .. Our current business plans may contemplate development of less than the maximum potential development density for individual assets .. As market conditions change, our business plans, and therefore, the Estimated Potential Development Density, could change accordingly .. Given timing, zoning requirements and other factors, we make no assurance that Estimated Potential Development Density amounts will become actual density to the extent we complete development of assets for which we have made such estimates .. 13 |
| DEFINITIONS ESTIMATED TOTAL INVESTMENT "Estimated Total Investment" means, with respect to the development of an asset, the sum of the Historical Cost in such asset and the Estimated Incremental Investment for such asset .. Actual total investment may differ substantially from our estimates due to numerous factors, including unanticipated expenses, delays in the estimated start and/or completion date, changes in design and other contingencies .. For Future Development assets, Estimated Total Investment represents historical cost plus incremental costs to access the Estimated Potential Development Density, but does not include potential entitlement costs or infrastructure costs .. ESTIMATED TOTAL PROJECT COST "Estimated Total Project Cost" is estimated total investment excluding purchase price allocation adjustments recognized as a res ult of the Formation Transaction. Actual Total Project Cost may differ substantially from our estimates due to numerous factors, including unanticipated expenses, delays in the estimated start and /or completion date, changes in design and other contingencies. FORMATION TRANSACTION "Formation Transaction" refers collectively to the spin - off on July 17, 2017 of substantially all of the assets and liabilities of Vornado Realty Trust's Washington, DC segment, which operated as Vornado / Charles E. Smith, and the acquisition of the management business and certain assets and liabilities of The JBG Companies. FREE RENT “Free rent” means the amount of base rent and tenant reimbursements that are abated according to the applicable lease agreeme nt( s). FUTURE DEVELOPMENT PIPELINE "Future Development Pipeline" refers to assets that are development opportunities on which we do not intend to commence const ruc tion within the next three years where we (i) own land or control the land through a ground lease or (ii) are under a long - term conditional contract to purchase, or enter into, a leasehold interest with respect to land. GAAP "GAAP" means accounting principles generally accepted in the United States. HISTORICAL COST "Historical Cost" is a non - GAAP measure which includes the total Historical Cost incurred by JBG SMITH with respect to the devel opment of an asset, including any acquisition costs, hard costs, soft costs, tenant improvements (excluding Free Rent converted to tenant improvement allowances), leasing costs and other similar costs, but exc lud ing any financing costs and ground rent expenses incurred as of March 31, 2022. IN - SERVICE "In - Service" refers to commercial or multifamily operating assets that are at or above 90% leased or have been operating and col lecting rent for more than 12 months as of March 31, 2022. JBG SMITH SHARE "JBG SMITH Share" or "our share" refers to our ownership percentage of consolidated and unconsolidated assets in real estate ven tures. 14 |
| DEFINITIONS METRO - SERVED "Metro - Served" means locations, submarkets or assets that are within 0.5 miles of an existing or planned Metro station. NEAR - TERM DEVELOPMENT PIPELINE "Near - Term Development Pipeline" refers to select assets that have the potential to commence construction over the next three years, subject to receipt of full entitlements, completion of design and market conditions .. NET DEBT "Net Debt" is a non - GAAP financial measurement .. Net Debt represents our total consolidated and unconsolidated indebtedness less cash and cash equivalents at our share .. Net Debt is an important component in the calculations of Net Debt to Annualized Adjusted EBITDA and Net Debt / total enterprise value .. We believe that Net Debt is a meaningful non - GAAP financial measure useful to investors because we review Net Debt as part of the management of our overall financial flexibility, capital structure and leverage .. We may utilize a considerable portion of our cash and cash equivalents at any given time for purposes other than debt reduction .. In addition, cash and cash equivalents at our share may not be solely controlled by us .. The deduction of cash and cash equivalents at our share from consolidated and unconsolidated indebtedness in the calculation of Net Debt, therefore, should not be understood to mean that it is available exclusively for debt reduction at any given time .. See “Disposition and Recapitalization Activity Subsequent to March 31 , 2022 – Adjustment of Calculations” for an explanation of a current adjustment to our Net Debt calculation .. 15 |
| DEFINITIONS NET OPERATING INCOME ("NOI"), "ANNUALIZED NOI", "ESTIMATED STABI LIZED NOI" AND "PROJECTED NOI YIELD" Net Operating Income ("NOI"), "Annualized NOI", "Estimated Stabilized NOI" and "Projected NOI Yield" are non - GAAP financial measures management uses to assess a segment's performance .. The most directly comparable GAAP measure is net income (loss) attributable to common shareholders .. We use NOI internally as a performance measure and believe NOI provides useful information to investors regarding our financial condition and results of operations because it reflects only property related revenue (which includes base rent, tenant reimbursements and other operating revenue, net of Free Rent and payments associated with assumed lease liabilities) less operating expenses and ground rent for operating leases, if applicable .. NOI also excludes deferred rent, related party management fees, interest expense, and certain other non - cash adjustments, including the accretion of acquired below - market leases and the amortization of acquired above - market leases and below - market ground lease intangibles .. Management uses NOI as a supplemental performance measure of our assets and believes it provides useful information to investors because it reflects only those revenue and expense items that are incurred at the asset level, excluding non - cash items .. In addition, NOI is considered by many in the real estate industry to be a useful starting point for determining the value of a real estate asset or group of assets .. However, because NOI excludes depreciation and amortization and captures neither the changes in the value of our assets that result from use or market conditions, nor the level of capital expenditures and capitalized leasing commissions necessary to maintain the operating performance of our assets, all of which have real economic effect and could materially impact the financial performance of our assets, the utility of NOI as a measure of the operating performance of our assets is limited .. NOI presented by us may not be comparable to NOI reported by other REITs that define these measures differently .. We believe to facilitate a clear understanding of our operating results, NOI should be examined in conjunction with net income (loss) attributable to common shareholders as presented in our financial statements .. NOI should not be considered as an alternative to net income (loss) attributable to common shareholders as an indication of our performance or to cash flows as a measure of liquidity or our ability to make distributions .. Annualized NOI, for all assets except Crystal City Marriott, represents NOI for the three months ended March 31 , 2022 multiplied by four .. Due to seasonality in the hospitality business, Annualized NOI for Crystal City Marriott represents the trailing 12 - month NOI as of March 31 , 2022 .. Management believes Annualized NOI provides useful information in understanding our financial performance over a 12 - month period, however, investors and other users are cautioned against attributing undue certainty to our calculation of Annualized NOI .. Actual NOI for any 12 - month period will depend on a number of factors beyond our ability to control or predict, including general capital markets and economic conditions, any bankruptcy, insolvency, default or other failure to pay rent by one or more of our tenants and the destruction of one or more of our assets due to terrorist attack, natural disaster or other casualty, among others .. We do not undertake any obligation to update our calculation to reflect events or circumstances occurring after the date of this earnings release .. There can be no assurance that the Annualized NOI shown will reflect our actual results of operations over any 12 - month period .. This Investor Presentation also contains management's estimate of stabilized NOI and projections of NOI yield for Under - Construction and Near - Term Development Pipeline assets, which are based on management's estimates of property - related revenue and operating expenses for each asset .. These estimates are inherently uncertain and represent management's plans, expectations and beliefs and are subject to numerous assumptions, risks and uncertainties .. The property - related revenues and operating expenses for our assets may differ materially from the estimates included in this Investor Presentation .. Management's projections of NOI yield are not projections of our overall financial performance or cash flow, and there can be no assurance that the Projected NOI Yield set forth in this Investor Presentation will be achieved .. Projected NOI Yield means our Estimated Stabilized NOI reported as a percentage of (i) Estimated Total Investment and (ii) Estimated Incremental Investment .. Actual initial full year stabilized NOI yield may vary from the Projected NOI Yield based on the actual incremental investment to complete the asset and its actual initial full year stabilized NOI, and there can be no assurance that we will achieve the Projected NOI Yields described in this Investor Presentation .. We do not provide reconciliations for non - GAAP estimates on a future basis, including Estimated Stabilized NOI and expected annualized NOI because we are unable to provide a meaningful or accurate calculation or estimate of reconciling items and the information is not available without unreasonable effort .. This inability is due to the inherent difficulty of forecasting the timing and/or amounts of various items that would impact net income (loss) .. Additionally, no reconciliation of Projected NOI Yield to the most directly comparable GAAP measure is included in this Investor Presentation because we are unable to quantify certain amounts that would be required to be included in the comparable GAAP financial measures without unreasonable efforts because such data is not currently available or cannot be currently estimated with confidence .. Accordingly, we believe such reconciliations would imply a degree of precision that would be confusing or misleading to investors .. NON - SAME STORE “Non - same store” refers to all operating assets excluded from the same store pool. RECENTLY DELIVERED "Recently Delivered" refers to commercial and multifamily assets that are below 90% leased and have been delivered within the 12 months ended March 31, 2022. 16 |
| DEFINITIONS SAME STORE "Same Store" refers to the pool of assets that were In - Service for the entirety of both periods being compared, except for assets for which significant redevelopment, renovation, or repositioning occurred during either of the periods being compared .. SQUARE FEET OR "SF" "Square Feet" or "SF" refers to the area that can be rented to tenants, defined as (i) for commercial assets, rentable square footage defined in the current lease and for vacant space the rentable square footage defined in the previous lease for that space, (ii) for multifamily assets, management's estimate of approximate rentable square feet, (iii) for Under - Construction assets, management's estimate of approximate rentable square feet based on current design plans as of March 31 , 2022 , and (iv) for Near - Term and Future Development Pipeline assets, management's estimate of developable gross square feet based on current business plans with respect to real estate owned or controlled as of March 31 , 2022 .. TRANSACTION AND OTHER COSTS "Transaction and Other Costs" include demolition costs, integration and severance costs, pursuit costs related to other completed, potential and pursued transactions, as well as other expenses .. UNDER - CONSTRUCTION "Under - Construction" refers to assets that were under construction during the three months ended March 31, 2022. WEIGHTED AVERAGE MARK - TO - MARKET “Weighted Average Mark - to - Market” represents the expected increase in base rent plus tenant reimbursements from second generatio n leases signed during the period over the base rent plus tenant reimbursements from the recently expired lease on that space. 17 |
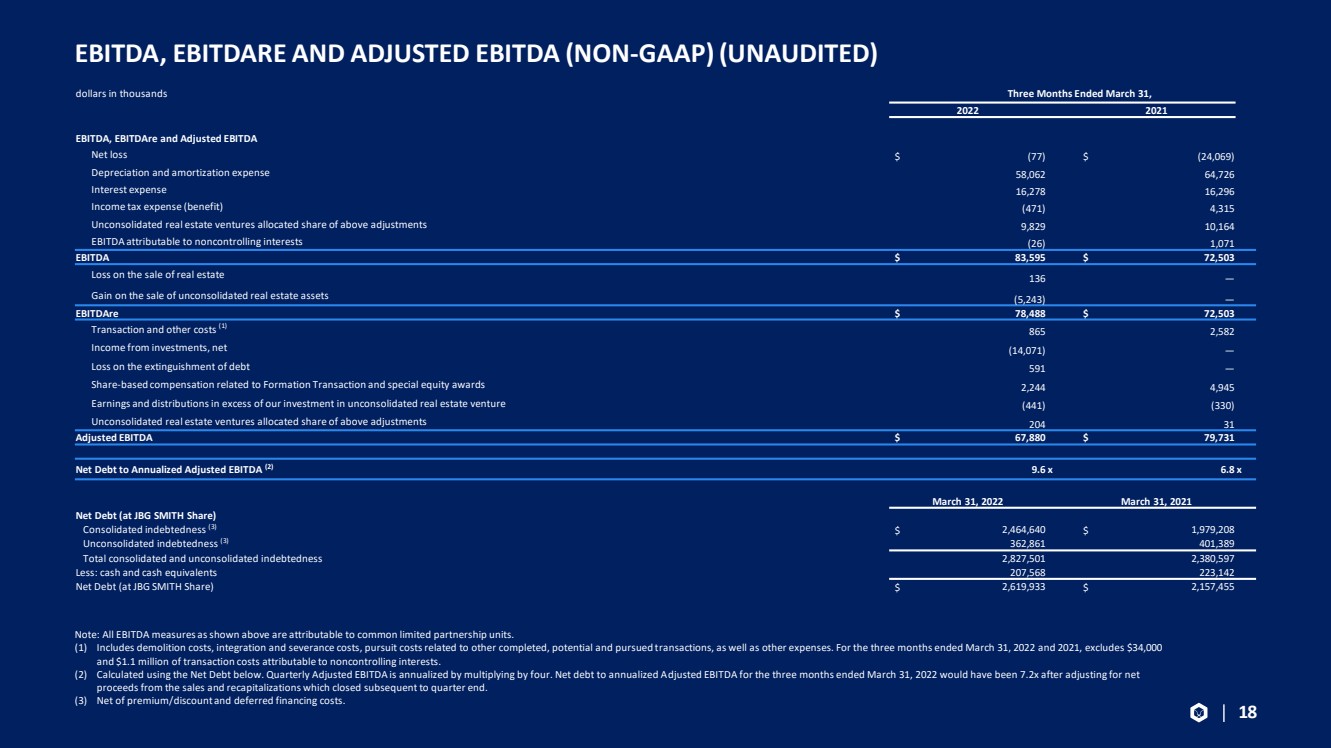
| EBITDA, EBITDARE AND ADJUSTED EBITDA (NON - GAAP) (UNAUDITED) Note: All EBITDA measures as shown above are attributable to common limited partnership units. (1) Includes demolition costs, integration and severance costs, pursuit costs related to other completed, potential and pursued t ran sactions, as well as other expenses. For the three months ended March 31, 2022 and 2021, excludes $34,000 and $1.1 million of transaction costs attributable to noncontrolling interests. (2) Calculated using the Net Debt below. Quarterly Adjusted EBITDA is annualized by multiplying by four. Net debt to annualized A dju sted EBITDA for the three months ended March 31, 2022 would have been 7.2x after adjusting for net proceeds from the sales and recapitalizations which closed subsequent to quarter end. (3) Net of premium/discount and deferred financing costs. 18 dollars in thousands Three Months Ended March 31, 2022 2021 EBITDA, EBITDAre and Adjusted EBITDA Net loss $ (77) $ (24,069) Depreciation and amortization expense 58,062 64,726 Interest expense 16,278 16,296 Income tax expense (benefit) (471) 4,315 Unconsolidated real estate ventures allocated share of above adjustments 9,829 10,164 EBITDA attributable to noncontrolling interests (26) 1,071 EBITDA $ 83,595 $ 72,503 Loss on the sale of real estate 136 — Gain on the sale of unconsolidated real estate assets (5,243) — EBITDAre $ 78,488 $ 72,503 Transaction and other costs (1) 865 2,582 Income from investments, net (14,071) — Loss on the extinguishment of debt 591 — Share - based compensation related to Formation Transaction and special equity awards 2,244 4,945 Earnings and distributions in excess of our investment in unconsolidated real estate venture (441) (330) Unconsolidated real estate ventures allocated share of above adjustments 204 31 Adjusted EBITDA $ 67,880 $ 79,731 Net Debt to Annualized Adjusted EBITDA (2) 9.6 x 6.8 x March 31, 2022 March 31, 2021 Net Debt (at JBG SMITH Share) Consolidated indebtedness (3) $ 2,464,640 $ 1,979,208 Unconsolidated indebtedness (3) 362,861 401,389 Total consolidated and unconsolidated indebtedness 2,827,501 2,380,597 Less: cash and cash equivalents 207,568 223,142 Net Debt (at JBG SMITH Share) $ 2,619,933 $ 2,157,455 |
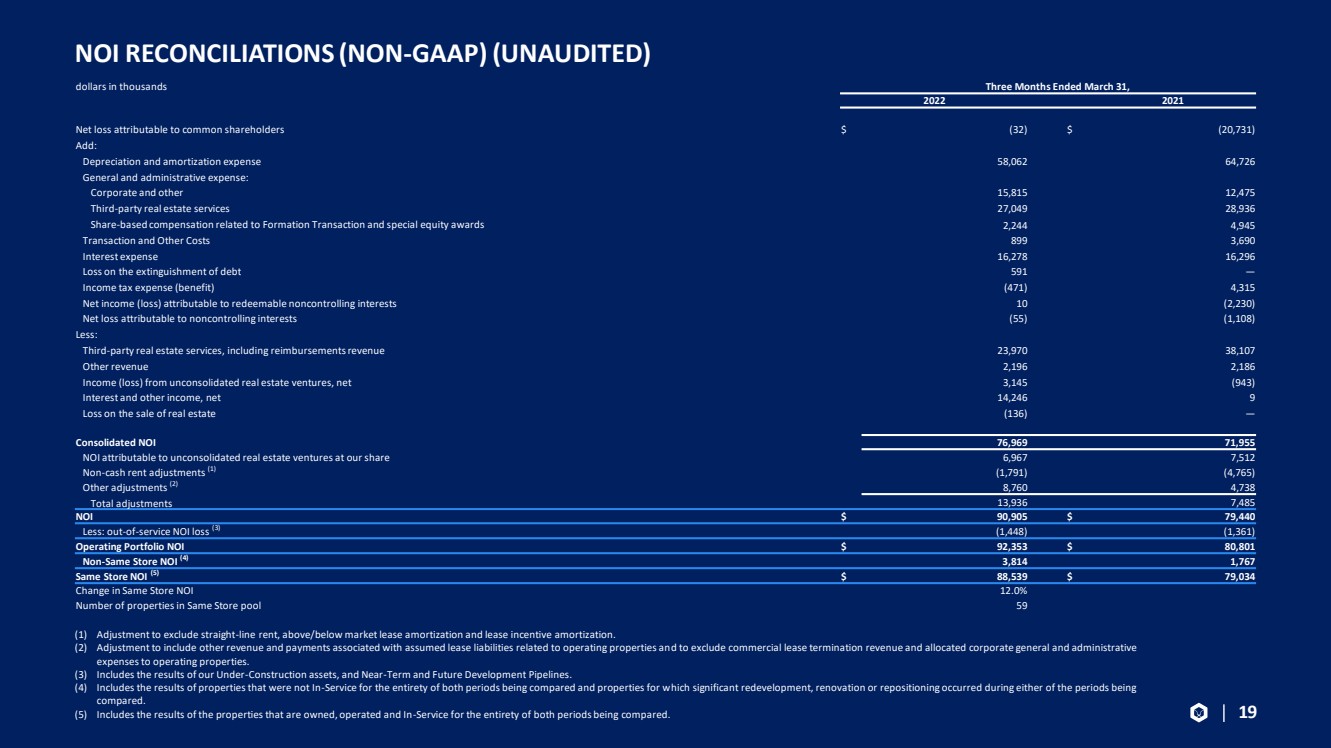
| NOI RECONCILIATIONS (NON - GAAP) (UNAUDITED) (1) Adjustment to exclude straight - line rent, above/below market lease amortization and lease incentive amortization. (2) Adjustment to include other revenue and payments associated with assumed lease liabilities related to operating properties an d t o exclude commercial lease termination revenue and allocated corporate general and administrative expenses to operating properties. (3) Includes the results of our Under - Construction assets, and Near - Term and Future Development Pipelines. (4) Includes the results of properties that were not In - Service for the entirety of both periods being compared and properties for w hich significant redevelopment, renovation or repositioning occurred during either of the periods being compared. (5) Includes the results of the properties that are owned, operated and In - Service for the entirety of both periods being compared. 19 dollars in thousands Three Months Ended March 31, 2022 2021 Net loss attributable to common shareholders $ (32) $ (20,731) Add: Depreciation and amortization expense 58,062 64,726 General and administrative expense: Corporate and other 15,815 12,475 Third - party real estate services 27,049 28,936 Share - based compensation related to Formation Transaction and special equity awards 2,244 4,945 Transaction and Other Costs 899 3,690 Interest expense 16,278 16,296 Loss on the extinguishment of debt 591 — Income tax expense (benefit) (471) 4,315 Net income (loss) attributable to redeemable noncontrolling interests 10 (2,230) Net loss attributable to noncontrolling interests (55) (1,108) Less: Third - party real estate services, including reimbursements revenue 23,970 38,107 Other revenue 2,196 2,186 Income (loss) from unconsolidated real estate ventures, net 3,145 (943) Interest and other income, net 14,246 9 Loss on the sale of real estate (136) — Consolidated NOI 76,969 71,955 NOI attributable to unconsolidated real estate ventures at our share 6,967 7,512 Non - cash rent adjustments (1) (1,791) (4,765) Other adjustments (2) 8,760 4,738 Total adjustments 13,936 7,485 NOI $ 90,905 $ 79,440 Less: out - of - service NOI loss (3) (1,448) (1,361) Operating Portfolio NOI $ 92,353 $ 80,801 Non - Same Store NOI (4) 3,814 1,767 Same Store NOI (5) $ 88,539 $ 79,034 Change in Same Store NOI 12.0% Number of properties in Same Store pool 59 |
|