urf
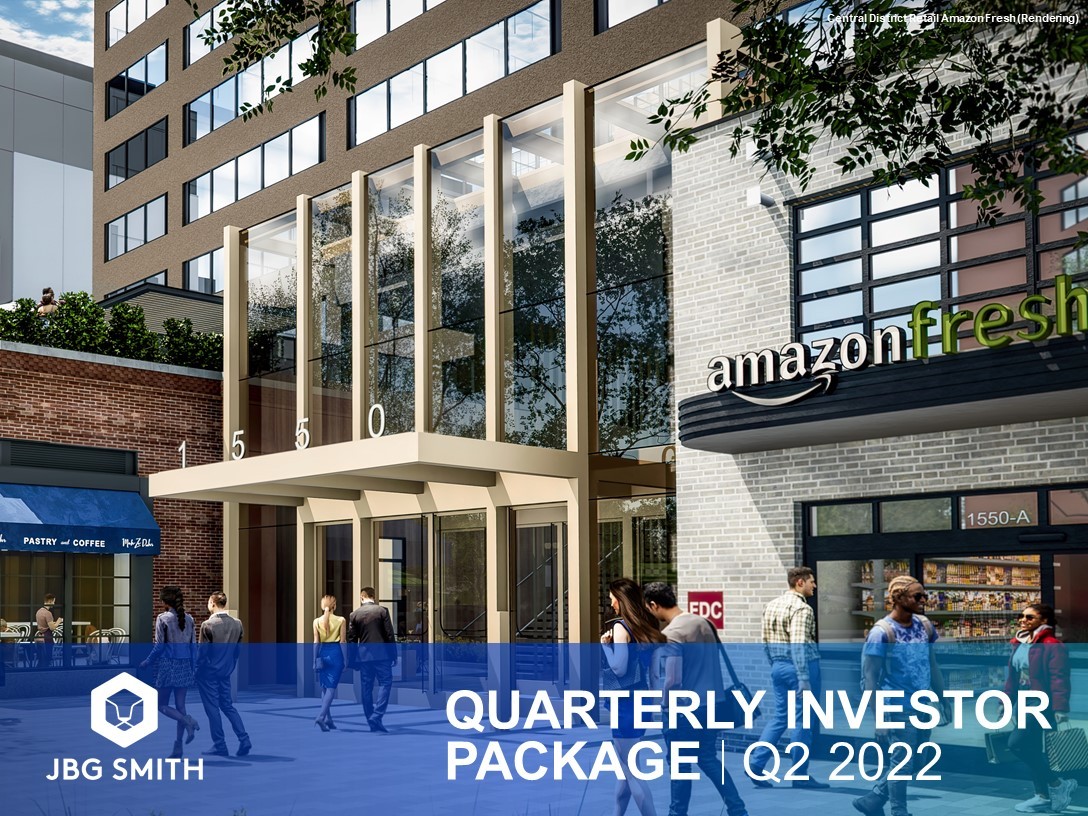
Quarterly Investor Package

JBGS Divider

Management Letter
August 2, 2022
Despite significant volatility in the capital markets, rising interest rates and high inflation, we continue to advance our strategy, and our operating results continue to improve. We are pleased to have substantially completed our entire 2022 recycling goal in the first half of the year. Given the flash freeze unfolding in the credit markets, the timing of our execution was especially fortunate. As urbanites return from their walkabouts and employers struggle to navigate the tension between a tight job market and the desire to convene their people in person, we see strong signs (and results!) of a return to higher-density, in-person living and working. In National Landing, a palpable buzz has returned, reflected in rising daily physical occupancy, as companies continue to bring their employees back to the office. And the recent headquarters relocations by Boeing and Raytheon further highlight the National Landing area’s appeal to tech-oriented, globally scaled corporations, particularly those in the defense sector. We provide detail on highlights from the quarter below.
Amazon closed on land purchase for Phase II of HQ2. In the second quarter, we closed on the sale of Pen Place to Amazon for $198 million. Plans for the 12-acre site call for 3.2 million square feet of office space, including the iconic Helix building, 100,000 square feet of retail, and approximately 2.75 acres of public open space. Phase I, located at the adjacent Metropolitan Park, remains on track for a 2023 delivery, with eight additional local small business retail leases announced over the last three months. To date, Amazon, in partnership with JBG SMITH, has announced 10 retail leasing transactions at Metropolitan Park totaling 38,000 square feet. In the second quarter Amazon also announced 5,000 employees hired at HQ2 with nearly 4,000 current job openings, already surpassing its year-end 2022 hiring commitment to the Commonwealth of Virginia.
Same Store NOI increased 13.8% year-over-year for our operating portfolio. Our multifamily portfolio exhibited quarter-over-quarter occupancy growth, significant rent bumps upon renewals and reduced concession packages. In our commercial portfolio, second quarter renewal leasing remained strong with tenants who renewed retaining 100% of their expiring square footage. Parking income trended upward to 74% of pre-pandemic levels, while physical occupancy increased slightly to 51% on peak days in June.
We have closed on $993 million of capital recycling transactions year-to-date, representing an average capitalization rate of 4.9%. This recycling includes the recent sale of 1900 N Street, a 270,000 square foot trophy office asset located in Washington, DC, for $265 million ($145.8 million at share). We used the proceeds to deleverage our balance sheet and create capacity for accretive investments, including share repurchases. The $198 million from the sale of Pen Place to Amazon in May is not included in these amounts as it was contracted prior to 2021. In light of recent market volatility, we are especially pleased with our transaction volume through the first half of the year.
We upsized our Credit Facility Term Loan by $200 million, with no material change to our spread at SOFR plus 125 basis points. The incremental $200 million includes a one-year delayed draw feature, which was undrawn as of the date of this release. The maturity date of the Term Loan A-2 was also extended by 3.5 years to January 2028.
1
JBG SMITH Overview
We own and operate urban mixed-use properties concentrated in what we believe are the highest growth submarkets of the historically recession-resilient Washington, DC metro area.
Our concentration in these submarkets, our substantial portfolio of operating and development opportunities, and our market-leading platform position us to capitalize on the significant growth we anticipate in our target submarkets.
68% of our holdings are located directly across the Potomac River from Washington, DC in Northern Virginia’s National Landing submarket, where Amazon’s new 5 million+ square foot headquarters and Virginia Tech’s $1 billion Innovation Campus are under construction.
The Commonwealth of Virginia has incentivized Amazon to bring up to 38,000 new jobs to National Landing, which, based on data from the National Landing Business Improvement District provided in November 2018, would increase the daytime population in the submarket from approximately 50,000 people to nearly 90,000 people in the future, representing dramatic growth of nearly 80%. Additionally, in late 2021, Amazon announced its hybrid return-to-the-office policy, requiring employees to live locally and within commuting distance of the office for at least 11 months of the year. This policy aligns well with Amazon’s aggressive hiring in the current competitive job market.
At its Seattle headquarters, approximately 20% of Amazon’s employees live within walking or biking distance to work, and Amazon provides $350 monthly stipends to employees who bike to HQ2. Using Amazon’s Seattle employee patterns and preferences as proxies for behaviors that might be expected at HQ2, 20% of employees, or up to 7,600 Amazon employees, could be expected to live within the National Landing submarket. This potential influx of demand for additional multifamily units aligns well with our plans to deliver new multifamily supply to the submarket. In addition to the 1,583 units currently under construction in National Landing, our Near-Term Development Pipeline could add as many as 2,150 new multifamily units to National Landing.
While we control most of the existing office supply and unencumbered development density in National Landing, the balance of our portfolio is concentrated in what we believe are the highest growth submarkets in the Washington, DC metro region, the majority of which are within a 20-minute commute of the growing technology ecosystem in National Landing.
We believe the strong technology sector tailwinds created by Amazon, the Virginia Tech Innovation Campus, national/international defense and security needs, and our National Landing digital infrastructure initiatives, including our 5G rollout and other connectivity enhancements with best-in-class partners, will drive substantial long-term net asset value per share growth.
Our successful track record and well-established platform position us to maximize the value of our Development Pipeline through development, opportunistic land sales, ground leases, and/or recapitalizations with private investors.
As of the end of the second quarter, we had two multifamily developments under construction in National Landing – 1900 Crystal Drive (808 units) and 2000/2001 South Bell Street (775 units). Since our formation in 2017, we have successfully delivered 2.8 million square feet of mixed-use development, with estimated stabilized yields of 6.5% for multifamily assets and 7.0% for commercial assets.
Over the past year, we advanced the design and entitlement of 100% of our Development Pipeline, over 70% of which is in National Landing. Our 8.6 million square foot Development Pipeline (excluding non-core assets), 84% of
2
which is multifamily, includes both a 3.5 million square foot Near-Term Development Pipeline and a 5.1 million square foot Future Development Pipeline. Our Near-Term Development Pipeline comprises what we believe to be the most accretive and strategic development opportunities in our growth pipeline – those which have the potential to commence construction over the next 36 months, subject to receipt of final entitlements, completion of design, and market conditions. Within our Future Development Pipeline, we have fully entitled 0.5 million square feet and are actively advancing design and entitlement on an additional 4.6 million square feet. We believe that advancing entitlement and design of these assets is the best way to maximize optionality and value, either through internal development, land sales, ground lease structures, and/or recapitalizations with third parties.
Our capital allocation strategy is to shift the majority of our portfolio to multifamily and concentrate our office portfolio in National Landing.
We expect our portfolio shift to majority multifamily will occur through a combination of investing in multifamily assets (existing and development) and opportunistically divesting non-core office and land assets. Since our formation, we have sold $2.7 billion of non-core assets and invested $423 million into multifamily acquisitions, $829 million into the development of multifamily assets, and committed an additional $529 million to new assets currently under construction.
Our capital allocation strategy is grounded in our primary goal of maximizing long-term net asset value per share. This strategy entails two key elements: repositioning our portfolio to concentrate our office in National Landing; and transitioning to a majority multifamily portfolio that continues to expand in high-growth, amenity-rich DC metro submarkets through acquisitions and development. Opportunistic dispositions of income-producing office assets outside of National Landing, as well as the sale, ground lease, or joint venture of non-core land holdings, serve as important sources of NAV-priced capital to fund our strategy. Allocating capital away from non-core office and land uses allows us to invest in higher growth opportunities, including multifamily acquisitions and development, and to return capital through share repurchases, especially when our shares trade at a material discount to NAV.
We set a goal to market $1 billion of non-core office and land assets in 2022 and have substantially completed this goal with $993 million closed year-to-date, representing an average capitalization rate of approximately 4.9% and approximately 5.5% on the income-producing office assets (6.0% to 6.5% stabilized). This amount includes the previously announced sale of 1900 N Street, an 11-story, 270,000 square foot trophy office asset in Washington, DC, for $265 million ($145.8 million at share). The $198 million from the sale of Pen Place to Amazon is not included in these amounts as it was contracted prior to 2021. While we are pleased to have accomplished substantially all of our 2022 recycling goal in the first half of the year, volatile market conditions may impact the timing and execution of any additional transactions.
This quarter we invested approximately $40 million in under-construction projects, including 1900 Crystal Drive and 2000/2001 South Bell Street, representing 1,583 new multifamily units being developed to an expected 6% yield on cost. As with all our development projects, these assets have guaranteed maximum price contracts that were priced during the height of the pandemic, which yielded construction costs below 2019 levels and pre-dated recent inflationary cost increases. With costs having increased as much as 20% over the last year, today’s inflated construction pricing is not favorable for new development. With over 3,600 units in our Near-Term Development Pipeline, we continue to monitor construction costs and overall market conditions to ensure that we maintain our disciplined capital allocation standards.
Finally, our capital allocation strategy demands that we seek investment opportunities with the highest potential risk-adjusted returns, including share repurchases. When our shares trade at a material discount to NAV, share
3
repurchases are one of the most accretive uses of capital available to us. In the second quarter, our Board of Trustees increased our common share repurchase authorization by $500 million to $1 billion. Accordingly, in the second quarter, we repurchased 8.5 million shares at a weighted average price per share of $25.15, totaling $213.9 million. Since the inception of our share repurchase program in 2020, we have repurchased 22.5 million shares, or 15% of shares outstanding as of December 31, 2019, at a weighted average price per share of $26.90.
Financial and Operating Metrics
For the three months ended June 30, 2022, we reported Core FFO attributable to common shareholders of $37.1 million, or $0.31 per diluted share. Same Store NOI for the quarter increased 13.8% year-over-year to $79.3 million. Our multifamily portfolio ended the quarter at 95.7% leased and 92.3% occupied. Our office portfolio ended the second quarter at 87.3% leased and 86.1% occupied. For second generation leases, the rental rate mark-to-market was negative 16.0%. When we exclude non-core office assets intended for recycling, our mark-to-market in National Landing was negative 2%. As we have previously mentioned, our mark-to-market will vary from quarter-to-quarter depending on the leases signed.
Net Debt/Annualized Adjusted EBITDA would have been 7.6x in Q2 2022 and Net Debt/Total Enterprise Value
would have been 38.1%, after adjusting for sales and recapitalizations. In July, we upsized our Term Loan A-2 to $400 million. The incremental $200 million includes a one-year delayed draw feature, which was undrawn as of the date of this release. The maturity date of the Term Loan A-2 was extended by 3.5 years to January 2028, with no material change in our spread at SOFR plus 125 basis points.
Operating Portfolio
Fundamentals across our multifamily portfolio continued to improve throughout the second quarter. Our portfolio ended the quarter at 95.7% leased and 92.3% occupied, up 160 basis points and 70 basis points quarter-over-quarter. Excluding our newly delivered and acquired assets (8001 Woodmont, West Half, The Wren, and The Batley), our portfolio ended the quarter at 97.7% leased and 94.7% occupied. Strong market rent growth has left us with in-place rents at 11% below asking rents, supporting an embedded growth opportunity from the expiration of several jurisdictional restrictions on rent increases as leases roll to market during our prime summer leasing season. Of note, for second quarter lease expirations, we increased average renewal rents by approximately 8.6% while achieving a 54.8% renewal rate across our portfolio. We expect this trend to continue through the summer months. As for concessions, there is a continued burn-down in pandemic-related concession packages, with zero concessions being offered in many of our key submarkets.
Market-Wide Trends (based on CoStar, UrbanTurf and Apartment List data)
Fundamentals in our multifamily market have improved over the last year. Apartment List reported strong occupancy across the DC metro which drove asking rent growth of 10.8% from June 2021 through June 2022. Rents have now reached their post-pandemic peak of 9.7% above pre-COVID (Q1 2020) levels. Below-average multifamily deliveries are projected over the next three years with approximately 6,300 units expected to be delivered per year from 2022-2024 in our tracked submarkets, based on data from CoStar and UrbanTurf. This amount represents an approximately 30% decrease from the more than 9,000 units per year delivered, on average, from 2010-2019. More recently, rising construction costs and interest rates have impacted developers’ abilities to start new projects. Data show an approximately 44% decrease in the number of new units started in Q2 2022 compared to Q2 2021.
Rising interest rates are expected to contribute to an overall cooling in the multifamily investment sales market which has already resulted in many multifamily deals being pulled from the market or re-priced as local broker commentary suggests an approximately 100 basis points spread in cap rates between seller and buyer pricing
4
expectations. Prior to heightened concerns around interest rates among levered buyers, CoStar data showed strong growth in both transaction volume (32%) and $/sf pricing (26%) from 1H 2021 to 1H 2022, largely based on deals negotiated prior to changes in rates, signaling confidence among investors in the underlying fundamentals of multifamily. Re-pricing and a thinning buyer pool in an elevated rate environment could create a buying opportunity for us, particularly if fundamentals remain positive.
Our office portfolio ended the second quarter at 87.3% leased and 86.1% occupied, up 20 basis points and 40 basis points quarter-over-quarter when excluding sold and recapitalized assets. Commercial parking revenue continues to improve as more tenants return to the office, reaching 74% of pre-pandemic levels on an annualized basis. We executed 326,000 square feet of leases, the majority of which comprised renewals, headlined by two sizable leases executed in non-core office assets to facilitate future recycling. These two leases total 226,000 square feet with a weighted average lease term of 10.1 years.
Turning to National Landing, we continue to focus on our new leasing strategy, anchored by four powerful demand catalysts: Amazon HQ2, Virginia Tech’s Innovation Campus, the Pentagon, and our digital infrastructure investments. Tour activity in National Landing gained significant momentum in the second quarter, with the number of tours surpassing any other quarter since the onset of the pandemic. This trend was primarily driven by defense contractors and digital infrastructure-related tenant prospects interested in establishing a presence in National Landing proximate to the Pentagon and the Department of Defense, as well as the digital amenities currently being rolled out in the submarket. We believe that defense will be a robust driver of demand, with preliminary discussions in the Senate Appropriations Committee indicating that spending on defense may rise to $850 billion in the upcoming budget — more than was requested by the White House. This is in addition to robust foreign defense spending with top U.S. contractors, the majority of which have a presence in National Landing.
With the National Landing transformation well underway, we are also fielding significant inbound interest at rising market rental rates for our retail portfolio. We remain on track to open 55 new retailers by year-end 2024.
Market-Wide Trends (based on Kastle Systems, JLL and CoStar Q2 2022 reporting)
While office occupancy relative to pre-pandemic levels has increased over the last year from 27.4% in June 2021 to 40.2% in June 2022, it has essentially remained static at that level for most of the first half of 2022, based on data from Kastle Systems. The modest increase in physical occupancy has reduced the pace of tenant space givebacks, with JLL showing negative 650,000 square feet of net absorption year-to-date compared to negative 5.9 million square feet in the first half of 2021; however, market-wide return to positive absorption territory has yet to be seen. Lingering uncertainty surrounding hybrid and remote work remain a drag on the arrival of new demand as many large occupiers stay on the sidelines or pause new requirements to re-think the design of space. The ultimate result of these changes on utilization of space per job remains unclear but will be crucial to future demand.
As the second quarter progressed, go-forward liquidity in the office investment sales market decreased as levered buyers either sought to avoid interest rate risk prior to closing or could not find positive leverage. Prior to rising interest rate concerns, data from CoStar reported office transaction volume increased 78% from the first half of 2021 to the first half of 2022. This increase suggests that the recent slowdown is less a function of decreasing investor demand and more a function of concerns related to further episodic uncertainty in interest rates.
Environmental, Social, and Governance
In July, JBG SMITH was ranked 7th on LinkedIn’s 2022 Top Companies in Real Estate list. The ranking is based on workplace practices that support the development and advancement of all employees, as well as representation of women. Additionally, in June, JBG SMITH was named one of The Washington Post’s 2022 Top Workplaces. JBG
5
SMITH earned four out of five Culture Excellence Awards, including Leadership, Innovation, Compensation & Benefits, and Purpose & Values. Now in its ninth year, The Washington Post’s Top Workplaces highlights the companies that are leaders in the Washington, DC area as chosen by their own employees through an anonymous third-party survey.
In May, the Washington Housing Initiative (WHI) Impact Pool released its Annual Report, outlining its 2021 achievements which can be found here: WHI Impact Report. Since inception in 2018, the WHI Impact Pool has provided a total of $40 million in financing for the creation and preservation of approximately 1,750 affordable workforce housing units, including 825 units with Amazon, at total capitalization of approximately $560 million. This satisfies almost 60% of our goal to finance 3,000 units by 2028. WHI properties now span five jurisdictions and are all managed by JBG SMITH.
* * *
As we head into the second half of 2022, we are fortunate to see nearly all our non-core asset recycling in the rear-view mirror. Having reduced our DC office exposure by 71%, or 2.3 million square feet, since our formation we are well positioned to focus on growth and transformation, especially in National Landing. Before the end of next year, this submarket will see us nearly triple the number of street-level retailers that so many of our customers demand and bring online the first 5G enabled smart city at scale in the country. Our physical and digital placemaking coupled with record increases in defense spending and the exponential growth of players like Amazon and Virginia Tech in our market constitute a compelling set of demand drivers at a time when growth across the economy is increasingly uncertain. The Washington Metro Area’s historical resilience during recessions appears poised for an encore performance and with our strong balance sheet and substantial growth pipeline we are incredibly well-positioned to capitalize on that strength.
We appreciate your strong support of our strategic transformation and are especially thankful to those of you who attended our Investor Day in May.
Thank you for your continued trust and confidence.
Sincerely,

W. Matthew Kelly
Chief Executive Officer
6
Section Two – Earnings Release
FOR IMMEDIATE RELEASE |
|
|
| |
Earnings Release
CONTACT
Barbat Rodgers
Senior Vice President, Investor Relations
(240) 333-3805
brodgers@jbgsmith.com
JBG SMITH ANNOUNCES SECOND QUARTER 2022 RESULTS
Bethesda, MD (August 2, 2022) - JBG SMITH (NYSE: JBGS), a leading owner and developer of high-quality, mixed-use properties in the Washington, DC market, today filed its Form 10-Q for the quarter ended June 30, 2022 and reported its financial results.
Additional information regarding our results of operations, properties and tenants can be found in our Second Quarter 2022 Investor Package, which is posted in the Investor Relations section of our website at www.jbgsmith.com. We encourage investors to consider the information presented here with the information in that document.
Second Quarter 2022 Highlights
| ● | For the three and six months ended June 30, 2022, net income (loss), Funds From Operations ("FFO") and Core FFO attributable to common shareholders were: |
| | | | | | | | | | | | | | | | | | | | | |
| | SECOND QUARTER AND FULL YEAR COMPARISON | |||||||||||||||||||
in millions, except per share amounts | | Three Months Ended | | Six Months Ended | |||||||||||||||||
| | | June 30, 2022 | | June 30, 2021 | | June 30, 2022 | | June 30, 2021 | ||||||||||||
| | | Amount | Per Diluted Share | | Amount | Per Diluted Share | | Amount | Per Diluted Share | | Amount | Per Diluted Share | ||||||||
| Net income (loss) | | $ | 123.3 | $ | 1.02 | | $ | (3.0) | $ | (0.03) | | $ | 123.2 | $ | 0.99 | | $ | (23.7) | $ | (0.19) |
| FFO | | $ | 33.6 | $ | 0.28 | | $ | 37.9 | $ | 0.29 | | $ | 84.9 | $ | 0.68 | | $ | 80.2 | $ | 0.61 |
| Core FFO | | $ | 37.1 | $ | 0.31 | | $ | 44.8 | $ | 0.34 | | $ | 79.8 | $ | 0.64 | | $ | 94.5 | $ | 0.72 |
| ● | Annualized Net Operating Income ("NOI") for the three months ended June 30, 2022 was $337.1 million, compared to $370.7 million for the three months ended March 31, 2022, at our share. (Excluding the assets that were sold or recapitalized, Annualized NOI for the three months ended June 30, 2022 was $328.9 million, compared to $320.9 million for the three months ended March 31, 2022, at our share.) |
| ● | Same Store NOI ("SSNOI") at our share increased 13.8% year-over-year to $79.3 million for the three months ended June 30, 2022. SSNOI at our share increased 13.9% year-over-year to $155.4 million for the six months ended June 30, 2022. |
2
| o | The increase in SSNOI was substantially attributable to (i) higher occupancy and rents, and lower concessions and bad debt reserves in our multifamily portfolio, (ii) higher occupancy and average daily rates at the Crystal City Marriott, (iii) an increase in parking revenue in our commercial portfolio and (iv) the burn-off of rent abatement in our commercial portfolio. |
Operating Portfolio
| ● | The operating commercial portfolio was 87.3% leased and 86.1% occupied as of June 30, 2022, compared to 85.2% and 83.3% as of March 31, 2022, at our share. (Excluding the assets that were sold or recapitalized, the operating commercial portfolio was 87.1% leased and 85.7% occupied as of March 31, 2022, at our share.) |
| ● | The operating multifamily portfolio was 95.7% leased and 92.3% occupied as of June 30, 2022, compared to 94.1% and 91.6% as of March 31, 2022, at our share. Our multifamily portfolio in-service assets were 96.6% leased and 93.1% occupied as of June 30, 2022, compared to 95.5% and 92.9% as of March 31, 2022, at our share. (Excluding our newly delivered and acquired assets (8001 Woodmont, West Half, The Wren and The Batley), our portfolio ended the quarter at 97.7% leased and 94.7% occupied.) |
| ● | Executed approximately 326,000 square feet of office leases at our share during the three months ended June 30, 2022, comprising approximately 28,000 square feet of first-generation leases and approximately 298,000 square feet of second-generation leases, which generated an 18.7% rental rate decrease on a GAAP basis and a 16.0% rental rate decrease on a cash basis. When we exclude non-core office assets intended for recycling, our mark-to-market in National Landing was negative 2.0%. |
| ● | Executed approximately 536,000 square feet of office leases at our share during the six months ended June 30, 2022, comprising approximately 50,000 square feet of first-generation leases and approximately 486,000 square feet of second-generation leases, which generated a 7.4% rental rate decrease on a GAAP basis and a 9.7% rental rate decrease on a cash basis. |
Development Portfolio
Under-Construction
| ● | As of June 30, 2022, we had two multifamily assets under construction consisting of 1,583 units at our share. |
Near-Term Development Pipeline
| ● | As of June 30, 2022, we had eight near-term development pipeline assets consisting of 3.5 million square feet of estimated potential development density at our share. |
Future Development Pipeline
| ● | As of June 30, 2022, we had 16 future development pipeline assets consisting of 6.3 million square feet of estimated potential development density at our share. |
Third-Party Asset Management and Real Estate Services Business
| ● | For the three months ended June 30, 2022, revenue from third-party real estate services, including reimbursements, was $22.2 million. Excluding reimbursements and service revenue from our interests in consolidated and unconsolidated real estate ventures, revenue from our third-party asset management and real |
3
| estate services business was $11.9 million, primarily driven by $6.0 million of property and asset management fees, $3.6 million of development fees, $1.3 million of other service revenue and $1.0 million of leasing fees. |
Balance Sheet
| ● | As of June 30, 2022, our total enterprise value was approximately $5.2 billion, comprising 131.1 million common shares and units valued at $3.1 billion, and debt (net of premium / (discount) and deferred financing costs) at our share of $2.3 billion, less cash and cash equivalents at our share of $181.9 million. |
| ● | As of June 30, 2022, we had $162.3 million of cash and cash equivalents ($181.9 million of cash and cash equivalents at our share), and $999.5 million of capacity under our credit facility. |
| ● | Net Debt to annualized Adjusted EBITDA at our share for the three months ended June 30, 2022 was 8.1x and our Net Debt / total enterprise value was 40.4% as of June 30, 2022. Net Debt to annualized Adjusted EBITDA would have been 7.6x for the three months ended June 30, 2022, and Net Debt / total enterprise value would have been 38.1% as of June 30, 2022 after including the net proceeds from the sales and recapitalizations that are held in escrow at a qualified intermediary to facilitate a potential like-kind exchange and removing the Adjusted EBITDA generated during the quarter from assets that were sold or recapitalized. |
Investing and Financing Activities
| ● | On June 1, 2022, our unconsolidated real estate venture between us (55%) and Canadian Pension Plan Investment Board (45%) sold 1900 N Street, a 270,000 square feet commercial asset in Washington, DC, for $145.8 million at our share. |
| ● | On May 25, 2022, we sold Pen Place to Amazon for $198.0 million. |
| ● | On April 29, 2022, we sold a 99-year term leasehold interest in a future development asset located in Reston, VA. |
| ● | On April 13, 2022, we formed an unconsolidated real estate venture with affiliates of Fortress Investment Group LLC ("Fortress") to recapitalize a 1.6 million square foot office portfolio and land parcels valued at $580.0 million comprising four wholly owned commercial assets (7200 Wisconsin Avenue, 1730 M Street, RTC-West/RTC-West Trophy Office/RTC-West Land and Courthouse Plaza 1 and 2). Fortress contributed $131.0 million for a 66.5% interest in the venture. In connection with the transaction, the venture obtained mortgage loans totaling $458.0 million secured by the properties, of which $402.0 million was drawn at closing. We provide asset management, property management and leasing services to the venture. |
| ● | On April 1, 2022, we sold the Universal Buildings, commercial assets located in Washington, DC, for $228.0 million. |
| ● | We repaid the outstanding balance on our revolving credit facility totaling $300.0 million. |
| ● | We repurchased and retired 8.5 million common shares for $213.9 million, a weighted average purchase price per share of $25.15. In June 2022, our Board of Trustees increased our common share repurchase authorization by $500 million to $1 billion. |
Subsequent to June 30, 2022:
| ● | In July 2022, we borrowed $100.0 million under our revolving credit facility. |
| ● | In July 2022, our Tranche A‑2 Term Loan was amended to increase its borrowing capacity by $200.0 million. The incremental $200.0 million includes a one-year delayed draw feature, which was undrawn as of the date of |
4
| this release. The amendment extends the maturity date of the term loan from July 2024 to January 2028 and amends the interest rate to SOFR plus 1.25% per annum based on our current leverage level with a resulting all-in interest rate of 2.59%, including our current interest rate swaps, as of the date of this release. We also entered into two forward-starting interest rate swaps with an effective date of July 2024 and a total notional value of $200.0 million, which will effectively fix SOFR at a weighted average interest rate of 2.25% through the maturity date, resulting in an all-in interest rate of 3.50% beginning in July 2024 based on our current leverage level. |
| ● | On August 1, 2022, we acquired the remaining 36.0% ownership interest in Atlantic Plumbing, a multifamily asset owned by an unconsolidated real estate venture, for $19.7 million. |
| ● | In July 2022, we repurchased and retired 1.5 million common shares for $36.0 million, a weighted average purchase price per share of $23.92. |
Dividends
| ● | On July 29, 2022, our Board of Trustees declared a quarterly dividend of $0.225 per common share, payable on August 26, 2022 to shareholders of record as of August 12, 2022. |
About JBG SMITH
JBG SMITH owns, operates, invests in and develops a dynamic portfolio of mixed-use properties in the high growth and high barrier-to-entry submarkets in and around Washington, DC. Through an intense focus on placemaking, JBG SMITH cultivates vibrant, amenity-rich, walkable neighborhoods throughout the Washington, DC metropolitan area. Over half of JBG SMITH’s holdings are in the National Landing submarket in Northern Virginia, where it serves as the developer for Amazon’s new headquarters, and where Virginia Tech’s $1 billion Innovation Campus is under construction. JBG SMITH's portfolio currently comprises 15.5 million square feet of high-growth office, multifamily and retail assets at share, 98% of which are metro-served. It also maintains a development pipeline encompassing 9.8 million square feet of mixed-use development opportunities. JBG SMITH is committed to the operation and development of green, smart, and healthy buildings and plans to maintain carbon neutral operations annually. For more information on JBG SMITH please visit www.jbgsmith.com.
Forward-Looking Statements
Certain statements contained herein may constitute "forward-looking statements" as such term is defined in Section 27A of the Securities Act of 1933, as amended, and Section 21E of the Securities Exchange Act of 1934, as amended. Forward-looking statements are not guarantees of performance. They represent our intentions, plans, expectations and beliefs and are subject to numerous assumptions, risks and uncertainties. Consequently, the future results, financial condition and business of JBG SMITH Properties ("JBG SMITH", the "Company", "we", "us", "our" or similar terms) may differ materially from those expressed in these forward-looking statements. You can find many of these statements by looking for words such as "approximate", "hypothetical", "potential", "believes", "expects", "anticipates", "estimates", "intends", "plans", "would", "may" or similar expressions in this earnings release. One of the most significant factors that could cause actual outcomes to differ materially from our forward-looking statements is the adverse effect of the current pandemic of the novel coronavirus, or COVID-19, and the ensuing economic turmoil on the Company, our financial condition, results of operations, cash flows, performance, our tenants, the real estate market, and the global economy and financial markets. The extent to which COVID-19
5
continues to impact us and our tenants depends on future developments, many of which are highly uncertain and cannot be predicted with confidence. These developments include: the continued severity, duration, transmission rate and geographic spread of COVID-19 in the United States, the duration of associated immunity and vaccine efficacy against variants of COVID-19, the extent and effectiveness of other containment measures taken, and the response of the overall economy, the financial markets and the population (including the potential effects of inflation), particularly in areas in which we operate, and whether the residential market in the Washington, DC area and any of our properties will be materially impacted by the various moratoriums on residential evictions, among others. Moreover, investors are cautioned to interpret many of the risks identified under the section titled "Risk Factors" in our Annual Report on Form 10-K for the fiscal year ended December 31, 2021 as being heightened as a result of the ongoing and numerous adverse impacts of the COVID-19 pandemic. We also note the following forward-looking statements: the impact of COVID-19 and the ensuing economic turmoil on our Company, NOI, SSNOI, net asset value, share price, occupancy rates, revenue from our multifamily and commercial portfolios, operating costs, deferrals of rent, uncollectible operating lease receivables, parking revenue, and burn-off of rent abatement; the impact of disruptions to the credit and capital markets on our ability to access capital, including refinancing maturing debt; changes to the amount and manner in which tenants use space; whether we incur additional costs or make additional concessions or offer other incentives to existing or prospective tenants to reconfigure space; whether the Washington, DC area will be more resilient than other parts of the country in any recession resulting from COVID-19; whether we will recognize currently estimated unrecognized development fee revenue on the anticipated timing or at all; our annual dividend per share and dividend yield; whether in the case of our under-construction and near-term development pipeline assets, estimated square feet, estimated number of units and in the case of our future development pipeline assets, estimated potential development density are accurate; expected key Amazon transaction terms and timeframes for closing any Amazon transactions not yet closed; planned infrastructure and educational improvements related to Amazon's additional headquarters and the Virginia Tech Innovation Campus; the economic impact, job growth, expansion of public transportation and related demand for multifamily and commercial properties of Amazon's additional headquarters on the DC area and National Landing and the speed with which such impact occurs and Amazon’s plans for accelerated hiring and in-person work requirements; the impact of our role as the developer, property manager and retail leasing agent in connection with Amazon's new headquarters; our development plans related to National Landing; our ability to satisfy environmental, social or governance standards set by various constituencies; whether we can access agency debt secured by our currently unencumbered multifamily assets timely, on reasonable terms or at all; and whether the allocation of capital to our share repurchase plan has any impact on our share price.
Many of the factors that will determine the outcome of these and our other forward-looking statements are beyond our ability to control or predict. These factors include, among others: adverse economic conditions in the Washington, DC metropolitan area, including in relation to COVID-19, the timing of and costs associated with development and property improvements, financing commitments, and general competitive factors. For further discussion of factors that could materially affect the outcome of our forward-looking statements and other risks and uncertainties, see "Risk Factors," "Management's Discussion and Analysis of Financial Condition and Results of Operations" and the Cautionary Statement Concerning Forward-Looking Statements in the Company's Annual Report on Form 10-K for the year ended December 31, 2021 and other periodic reports the Company files with the Securities and Exchange Commission. For these statements, we claim the protection of the safe harbor for forward-looking statements contained in the Private Securities Litigation Reform Act of 1995. You are cautioned not to place undue reliance on our forward-looking statements. All subsequent written and oral forward-looking statements
6
attributable to us or any person acting on our behalf are expressly qualified in their entirety by the cautionary statements contained or referred to in this section. We do not undertake any obligation to release publicly any revisions to our forward-looking statements to reflect events or circumstances occurring after the date hereof.
Pro Rata Information
We present certain financial information and metrics in this release "at JBG SMITH Share," which refers to our ownership percentage of consolidated and unconsolidated assets in real estate ventures (collectively, "real estate ventures") as applied to these financial measures and metrics. Financial information "at JBG SMITH Share" is calculated on an asset-by-asset basis by applying our percentage economic interest to each applicable line item of that asset's financial information. "At JBG SMITH Share" information, which we also refer to as being "at share," "our pro rata share" or "our share," is not, and is not intended to be, a presentation in accordance with GAAP. Given that a substantial portion of our assets are held through real estate ventures, we believe this form of presentation, which presents our economic interests in the partially owned entities, provides investors valuable information regarding a significant component of our portfolio, its composition, performance and capitalization.
We do not control the unconsolidated real estate ventures and do not have a legal claim to our co-venturers' share of assets, liabilities, revenue and expenses. The operating agreements of the unconsolidated real estate ventures generally allow each co-venturer to receive cash distributions to the extent there is available cash from operations. The amount of cash each investor receives is based upon specific provisions of each operating agreement and varies depending on certain factors including the amount of capital contributed by each investor and whether any investors are entitled to preferential distributions.
With respect to any such third-party arrangement, we would not be in a position to exercise sole decision-making authority regarding the property, real estate venture or other entity, and may, under certain circumstances, be exposed to economic risks not present were a third-party not involved. We and our respective co-venturers may each have the right to trigger a buy-sell or forced sale arrangement, which could cause us to sell our interest, or acquire our co-venturers' interests, or to sell the underlying asset, either on unfavorable terms or at a time when we otherwise would not have initiated such a transaction. Our real estate ventures may be subject to debt, and the repayment or refinancing of such debt may require equity capital calls. To the extent our co-venturers do not meet their obligations to us or our real estate ventures or they act inconsistent with the interests of the real estate venture, we may be adversely affected. Because of these limitations, the non-GAAP "at JBG SMITH Share" financial information should not be considered in isolation or as a substitute for our financial statements as reported under GAAP.
Occupancy, non-GAAP financial measures and leverage metrics presented in our investor package exclude our 10.0% subordinated interest in one commercial building and our 33.5% subordinated interest in four commercial buildings, as well as the associated non-recourse mortgages payable, held through unconsolidated real estate ventures, as our investment in each real estate venture is zero, we do not anticipate receiving any near-term cash flow distributions from the real estate ventures and have not guaranteed their obligations or otherwise committed to providing financial support.
7
Non-GAAP Financial Measures
This release includes non-GAAP financial measures. For these measures, we have provided an explanation of how these non-GAAP measures are calculated and why JBG SMITH's management believes that the presentation of these measures provides useful information to investors regarding JBG SMITH's financial condition and results of operations. Reconciliations of certain non-GAAP measures to the most directly comparable GAAP financial measure are included in this earnings release. Our presentation of non-GAAP financial measures may not be comparable to similar non-GAAP measures used by other companies. In addition to "at share" financial information, the following non-GAAP measures are included in this release:
Earnings Before Interest, Taxes, Depreciation and Amortization ("EBITDA"), EBITDA for Real Estate ("EBITDAre") and "Adjusted EBITDA" are non-GAAP financial measures. EBITDA and EBITDAre are used by management as supplemental operating performance measures, which we believe help investors and lenders meaningfully evaluate and compare our operating performance from period-to-period by removing from our operating results the impact of our capital structure (primarily interest charges from our outstanding debt and the impact of our interest rate swaps) and certain non-cash expenses (primarily depreciation and amortization on our assets). EBITDAre is computed in accordance with the definition established by the National Association of Real Estate Investment Trusts ("Nareit"). Nareit defines EBITDAre as GAAP net income (loss) adjusted to exclude interest expense, income taxes, depreciation and amortization expenses, gains and losses on sales of real estate and impairment write-downs of certain real estate assets and investments in entities when the impairment is directly attributable to decreases in the value of depreciable real estate held by the entity, including our share of such adjustments of unconsolidated real estate ventures. These supplemental measures may help investors and lenders understand our ability to incur and service debt and to make capital expenditures. EBITDA and EBITDAre are not substitutes for net income (loss) (computed in accordance with GAAP) and may not be comparable to similarly titled measures used by other companies.
Adjusted EBITDA represents EBITDAre adjusted for items we believe are not representative of ongoing operating results, such as Transaction and Other Costs, impairment write-downs of right-of-use assets associated with leases in which we are a lessee, gain (loss) on the extinguishment of debt, earnings (losses) and distributions in excess of our investment in unconsolidated real estate ventures, lease liability adjustments, income from investments, business interruption insurance proceeds and share-based compensation expense related to the Formation Transaction and special equity awards. We believe that adjusting such items not considered part of our comparable operations, provides a meaningful measure to evaluate and compare our performance from period-to-period.
Because EBITDA, EBITDAre and Adjusted EBITDA have limitations as analytical tools, we use EBITDA, EBITDAre and Adjusted EBITDA to supplement GAAP financial measures. Additionally, we believe that users of these measures should consider EBITDA, EBITDAre and Adjusted EBITDA in conjunction with net income (loss) and other GAAP measures in understanding our operating results.
Funds from Operations ("FFO"), "Core FFO" and Funds Available for Distribution ("FAD") are non-GAAP financial measures. FFO is computed in accordance with the definition established by Nareit in the Nareit FFO White Paper - 2018 Restatement. Nareit defines FFO as net income (loss) (computed in accordance with GAAP), excluding depreciation and amortization related to real estate, gains and losses from the sale of certain real estate assets, gains and losses from change in control and impairment write-downs of certain real estate assets and
8
investments in entities when the impairment is directly attributable to decreases in the value of depreciable real estate held by the entity, including our share of such adjustments for unconsolidated real estate ventures.
Core FFO represents FFO adjusted to exclude items (net of tax) which we believe are not representative of ongoing operating results, such as Transaction and Other Costs, impairment write-downs of right-of-use assets associated with leases in which we are a lessee, gains (or losses) on the extinguishment of debt, earnings (losses) and distributions in excess of our investment in unconsolidated real estate ventures, share-based compensation expense related to the Formation Transaction and special equity awards, lease liability adjustments, income from investments, business interruption insurance proceeds, amortization of the management contracts intangible and the mark-to-market of derivative instruments including our share of such adjustments for unconsolidated real estate ventures.
FAD represents Core FFO less recurring tenant improvements, leasing commissions and other capital expenditures, net deferred rent activity, third-party lease liability assumption payments, recurring share-based compensation expense, accretion of acquired below-market leases, net of amortization of acquired above-market leases, amortization of debt issuance costs and other non-cash income and charges, including our share of such adjustments for unconsolidated real estate ventures. FAD is presented solely as a supplemental disclosure that management believes provides useful information as it relates to our ability to fund dividends.
We believe FFO, Core FFO and FAD are meaningful non-GAAP financial measures useful in comparing our levered operating performance from period-to-period and as compared to similar real estate companies because these non-GAAP measures exclude real estate depreciation and amortization expense and other non-comparable income and expenses, which implicitly assumes that the value of real estate diminishes predictably over time rather than fluctuating based on market conditions. FFO, Core FFO and FAD do not represent cash generated from operating activities and are not necessarily indicative of cash available to fund cash requirements and should not be considered as an alternative to net income (loss) (computed in accordance with GAAP) as a performance measure or cash flow as a liquidity measure. FFO, Core FFO and FAD may not be comparable to similarly titled measures used by other companies.
"Net Debt" is a non-GAAP financial measurement. Net Debt represents our total consolidated and unconsolidated indebtedness less cash and cash equivalents at our share. Net Debt is an important component in the calculations of Net Debt to Annualized Adjusted EBITDA and Net Debt / total enterprise value. We believe that Net Debt is a meaningful non-GAAP financial measure useful to investors because we review Net Debt as part of the management of our overall financial flexibility, capital structure and leverage. We may utilize a considerable portion of our cash and cash equivalents at any given time for purposes other than debt reduction. In addition, cash and cash equivalents at our share may not be solely controlled by us. The deduction of cash and cash equivalents at our share from consolidated and unconsolidated indebtedness in the calculation of Net Debt, therefore, should not be understood to mean that it is available exclusively for debt reduction at any given time.
Net Operating Income ("NOI") and "Annualized NOI" are non-GAAP financial measures management uses to assess a segment's performance. The most directly comparable GAAP measure is net income (loss) attributable to common shareholders. We use NOI internally as a performance measure and believe NOI provides useful information to investors regarding our financial condition and results of operations because it reflects only property related revenue (which includes base rent, tenant reimbursements and other operating revenue, net of Free Rent and payments associated with assumed lease liabilities) less operating expenses and ground rent for operating
9
leases, if applicable. NOI also excludes deferred rent, related party management fees, interest expense, and certain other non-cash adjustments, including the accretion of acquired below-market leases and the amortization of acquired above-market leases and below-market ground lease intangibles. Management uses NOI as a supplemental performance measure of our assets and believes it provides useful information to investors because it reflects only those revenue and expense items that are incurred at the asset level, excluding non-cash items. In addition, NOI is considered by many in the real estate industry to be a useful starting point for determining the value of a real estate asset or group of assets. However, because NOI excludes depreciation and amortization and captures neither the changes in the value of our assets that result from use or market conditions, nor the level of capital expenditures and capitalized leasing commissions necessary to maintain the operating performance of our assets, all of which have real economic effect and could materially impact the financial performance of our assets, the utility of NOI as a measure of the operating performance of our assets is limited. NOI presented by us may not be comparable to NOI reported by other REITs that define these measures differently. We believe to facilitate a clear understanding of our operating results, NOI should be examined in conjunction with net income (loss) attributable to common shareholders as presented in our financial statements. NOI should not be considered as an alternative to net income (loss) attributable to common shareholders as an indication of our performance or to cash flows as a measure of liquidity or our ability to make distributions. Annualized NOI, for all assets except Crystal City Marriott, represents NOI for the three months ended June 30, 2022 multiplied by four. Due to seasonality in the hospitality business, Annualized NOI for Crystal City Marriott represents the trailing 12-month NOI as of June 30, 2022. Management believes Annualized NOI provides useful information in understanding our financial performance over a 12-month period, however, investors and other users are cautioned against attributing undue certainty to our calculation of Annualized NOI. Actual NOI for any 12-month period will depend on a number of factors beyond our ability to control or predict, including general capital markets and economic conditions, any bankruptcy, insolvency, default or other failure to pay rent by one or more of our tenants and the destruction of one or more of our assets due to terrorist attack, natural disaster or other casualty, among others. We do not undertake any obligation to update our calculation to reflect events or circumstances occurring after the date of this earnings release. There can be no assurance that the Annualized NOI shown will reflect our actual results of operations over any 12-month period.
"Non-Same Store" refers to all operating assets excluded from the same store pool.
"Same Store" refers to the pool of assets that were in-service for the entirety of both periods being compared, which excludes assets for which significant redevelopment, renovation, or repositioning occurred during either of the periods being compared.
Definitions
"Estimated Potential Development Density" reflects management's estimate of developable gross square feet based on our current business plans with respect to real estate owned or controlled as of June 30, 2022. Our current business plans may contemplate development of less than the maximum potential development density for individual assets. As market conditions change, our business plans, and therefore, the Estimated Potential Development Density, could change accordingly. Given timing, zoning requirements and other factors, we make no assurance that Estimated Potential Development Density amounts will become actual density to the extent we complete development of assets for which we have made such estimates.
10
"First-generation" is a lease on space that had been vacant for at least nine months or a lease on newly delivered space.
"Formation Transaction" refers collectively to the spin-off on July 17, 2017 of substantially all of the assets and liabilities of Vornado Realty Trust's Washington, DC segment, which operated as Vornado / Charles E. Smith, and the acquisition of the management business and certain assets and liabilities of The JBG Companies.
"Free Rent" means the amount of base rent and tenant reimbursements that are abated according to the applicable lease agreement(s).
"Future Development Pipeline" refers to assets that are development opportunities on which we do not intend to commence construction within the next three years where we (i) own land or control the land through a ground lease or (ii) are under a long-term conditional contract to purchase, or enter into, a leasehold interest with respect to land.
"GAAP" refers to accounting principles generally accepted in the United States of America.
"In-Service" refers to commercial or multifamily assets that are at or above 90% leased or have been operating and collecting rent for more than 12 months as of June 30, 2022.
"Near-Term Development Pipeline" refers to select assets that have the potential to commence construction over the next three years, subject to receipt of full entitlements, completion of design and market conditions.
"Second-generation" is a lease on space that had been vacant for less than nine months.
"Transaction and Other Costs" include demolition costs, integration and severance costs, pursuit costs related to other completed, potential and pursued transactions, as well as other expenses.
"Under-Construction" refers to assets that were under construction during the three months ended June 30, 2022.
11
CONDENSED CONSOLIDATED BALANCE SHEETS
(Unaudited)
| | | | | | | | |
| in thousands | | June 30, 2022 | | December 31, 2021 |
| ||
| | | | | | | |
|
| ASSETS | | | | | | |
|
| Real estate, at cost: |
| |
|
| |
| |
| Land and improvements | | $ | 1,217,216 | | $ | 1,378,218 | |
| Buildings and improvements | |
| 4,004,286 | |
| 4,513,606 | |
| Construction in progress, including land | |
| 385,085 | |
| 344,652 | |
| | |
| 5,606,587 | |
| 6,236,476 | |
| Less: accumulated depreciation | |
| (1,257,871) | |
| (1,368,003) | |
| Real estate, net | |
| 4,348,716 | |
| 4,868,473 | |
| Cash and cash equivalents | |
| 162,270 | |
| 264,356 | |
| Restricted cash | |
| 212,848 | |
| 37,739 | |
| Tenant and other receivables | |
| 46,605 | |
| 44,496 | |
| Deferred rent receivable | |
| 154,487 | |
| 192,265 | |
| Investments in unconsolidated real estate ventures | |
| 414,349 | |
| 462,885 | |
| Intangible assets, net | | | 157,819 | | | 201,956 | |
| Other assets, net | |
| 82,808 | |
| 240,160 | |
| Assets held for sale | |
| — | |
| 73,876 | |
| TOTAL ASSETS | | $ | 5,579,902 | | $ | 6,386,206 | |
| | | | | | | | |
| LIABILITIES, REDEEMABLE NONCONTROLLING INTERESTS AND EQUITY | |
|
| |
|
| |
| Liabilities: | |
|
| |
|
| |
| Mortgages payable, net | | $ | 1,612,169 | | $ | 1,777,699 | |
| Revolving credit facility | |
| — | |
| 300,000 | |
| Unsecured term loans, net | |
| 398,500 | |
| 398,664 | |
| Accounts payable and accrued expenses | |
| 112,784 | |
| 106,136 | |
| Other liabilities, net | |
| 111,852 | |
| 342,565 | |
| Total liabilities | |
| 2,235,305 | |
| 2,925,064 | |
| Commitments and contingencies | |
|
| |
|
| |
| Redeemable noncontrolling interests | |
| 521,392 | |
| 522,725 | |
| Total equity | |
| 2,823,205 | |
| 2,938,417 | |
| TOTAL LIABILITIES, REDEEMABLE NONCONTROLLING INTERESTS AND EQUITY | | $ | 5,579,902 | | $ | 6,386,206 | |
Note: For complete financial statements, please refer to our Quarterly Report on Form 10-Q for the quarter ended June 30, 2022.
12
CONDENSED CONSOLIDATED STATEMENTS OF OPERATIONS
(Unaudited)
| | | | | | | | | | | | |
in thousands, except per share data | | Three Months Ended June 30, | | Six Months Ended June 30, | ||||||||
| | 2022 | | 2021 | | 2022 | | 2021 | ||||
REVENUE | | | | | | | | | | | | |
Property rental |
| $ | 117,036 |
| $ | 122,819 | | $ | 248,634 |
| $ | 245,060 |
Third-party real estate services, including reimbursements | |
| 22,157 | |
| 26,745 | |
| 46,127 | |
| 64,852 |
Other revenue | |
| 6,312 | |
| 5,080 | |
| 12,709 | |
| 10,021 |
Total revenue | |
| 145,505 | |
| 154,644 | |
| 307,470 | |
| 319,933 |
EXPENSES | |
|
| |
|
| |
|
| |
|
|
Depreciation and amortization | |
| 49,479 | |
| 56,678 | |
| 107,541 | |
| 121,404 |
Property operating | |
| 35,445 | |
| 35,000 | |
| 76,089 | |
| 69,731 |
Real estate taxes | |
| 14,946 | |
| 18,558 | |
| 33,132 | |
| 36,868 |
General and administrative: | |
|
| |
|
| |
| | |
|
|
Corporate and other | |
| 14,782 | |
| 13,895 | |
| 30,597 | |
| 26,370 |
Third-party real estate services | |
| 24,143 | |
| 25,557 | |
| 51,192 | |
| 54,493 |
Share-based compensation related to Formation Transaction and special equity awards | |
| 1,577 | |
| 4,441 | |
| 3,821 | |
| 9,386 |
Transaction and other costs | |
| 1,987 | |
| 2,270 | |
| 2,886 | |
| 5,960 |
Total expenses | |
| 142,359 | |
| 156,399 | |
| 305,258 | |
| 324,212 |
OTHER INCOME (EXPENSE) | |
|
| |
|
| |
|
| |
|
|
Income (loss) from unconsolidated real estate ventures, net | |
| (2,107) | |
| 3,953 | |
| 1,038 | |
| 3,010 |
Interest and other income (loss), net | |
| 1,672 | |
| (38) | |
| 15,918 | |
| (29) |
Interest expense | |
| (16,041) | |
| (16,773) | |
| (32,319) | |
| (33,069) |
Gain on the sale of real estate, net | |
| 158,767 | |
| 11,290 | |
| 158,631 | |
| 11,290 |
Loss on the extinguishment of debt | |
| (1,038) | |
| — | |
| (1,629) | |
| — |
Total other income (expense) | |
| 141,253 | |
| (1,568) | |
| 141,639 | |
| (18,798) |
INCOME (LOSS) BEFORE INCOME TAX (EXPENSE) BENEFIT | |
| 144,399 | |
| (3,323) | |
| 143,851 | |
| (23,077) |
Income tax (expense) benefit | |
| (2,905) | |
| 5 | |
| (2,434) | |
| (4,310) |
NET INCOME (LOSS) | |
| 141,494 | |
| (3,318) | |
| 141,417 | |
| (27,387) |
Net (income) loss attributable to redeemable noncontrolling interests | |
| (18,248) | |
| 345 | |
| (18,258) | |
| 2,575 |
Net loss attributable to noncontrolling interests | | | 29 | |
| — | | | 84 | | | 1,108 |
NET INCOME (LOSS) ATTRIBUTABLE TO COMMON SHAREHOLDERS | | $ | 123,275 | | $ | (2,973) | | $ | 123,243 | | $ | (23,704) |
EARNINGS (LOSS) PER COMMON SHARE - BASIC AND DILUTED | | $ | 1.02 | | $ | (0.03) | | $ | 0.99 | | $ | (0.19) |
WEIGHTED AVERAGE NUMBER OF COMMON SHARES OUTSTANDING - BASIC AND DILUTED | |
| 121,316 | |
| 131,480 | |
| 123,984 | |
| 131,510 |
Note: For complete financial statements, please refer to our Quarterly Report on Form 10-Q for the quarter ended June 30, 2022.
13
EBITDA, EBITDAre AND ADJUSTED EBITDA RECONCILIATIONS (NON-GAAP)
(Unaudited)
| | | | | | | | | | | | | | |
| dollars in thousands |
| Three Months Ended June 30, | | Six Months Ended June 30, |
| ||||||||
| | | 2022 | | 2021 | | 2022 | | 2021 |
| ||||
| | | | | | | | | | | | | |
|
| EBITDA, EBITDAre and Adjusted EBITDA |
| | | | | | | |
| | |
| |
| Net income (loss) | | $ | 141,494 | | $ | (3,318) | | $ | 141,417 | | $ | (27,387) | |
| Depreciation and amortization expense | | | 49,479 | | | 56,678 | | | 107,541 | | | 121,404 | |
| Interest expense | | | 16,041 | | | 16,773 | | | 32,319 | | | 33,069 | |
| Income tax expense (benefit) | | | 2,905 | | | (5) | | | 2,434 | | | 4,310 | |
| Unconsolidated real estate ventures allocated share of above adjustments | | | 9,494 | | | 10,581 | | | 19,323 | | | 20,745 | |
| EBITDA attributable to noncontrolling interests | | | (47) | | | (41) | | | (73) | | | 1,030 | |
| EBITDA | | $ | 219,366 | | $ | 80,668 | | $ | 302,961 | | $ | 153,171 | |
| Gain on the sale of real estate, net | | | (158,767) | | | (11,290) | | | (158,631) | | | (11,290) | |
| Gain on the sale of unconsolidated real estate assets | | | (936) | | | (5,189) | | | (6,179) | | | (5,189) | |
| | | | | | | | | | | | | | |
| EBITDAre | | $ | 59,663 | | $ | 64,189 | | $ | 138,151 | | $ | 136,692 | |
| Transaction and other costs (1) | | | 1,987 | | | 2,270 | | | 2,852 | | | 4,852 | |
| Income from investments, net | | | (1,217) | | | — | | | (15,288) | | | — | |
| Loss on the extinguishment of debt | | | 1,038 | | | — | | | 1,629 | | | — | |
| Share-based compensation related to Formation Transaction and special equity awards | | | 1,577 | | | 4,441 | | | 3,821 | | | 9,386 | |
| Earnings and distributions in excess of our investment in unconsolidated real estate venture | | | (124) | | | (92) | | | (565) | | | (422) | |
| Unconsolidated real estate ventures allocated share of above adjustments | | | 1,841 | | | 9 | | | 2,045 | | | 40 | |
| | | | | | | | | | | | | | |
| Adjusted EBITDA | | $ | 64,765 | | $ | 70,817 | | $ | 132,645 | | $ | 150,548 | |
| | | | | | | | | | | | | | |
| Net Debt to Annualized Adjusted EBITDA (2) | | | 8.1 | x | | 7.6 | x | | 7.9 | x | | 7.2 | x |
| | | | | | | | | | | | | | |
| | | | | | | | | June 30, 2022 | | June 30, 2021 | | ||
| Net Debt (at JBG SMITH Share) | | | | | | | | |
| | |
| |
| Consolidated indebtedness (3) | | | | | | | | $ | 2,000,762 | | $ | 1,979,494 | |
| Unconsolidated indebtedness (3) | | | | | | | | | 279,534 | | | 399,262 | |
| Total consolidated and unconsolidated indebtedness | | | | | | | | | 2,280,296 | | | 2,378,756 | |
| Less: cash and cash equivalents | | | | | | | | | 181,882 | | | 217,543 | |
| Net Debt (at JBG SMITH Share) | | | | | | | | $ | 2,098,414 | | $ | 2,161,213 | |
Note: All EBITDA measures as shown above are attributable to common limited partnership units ("OP Units").
| (1) | Includes demolition costs, integration and severance costs, pursuit costs related to other completed, potential and pursued transactions, as well as other expenses. For the six months ended June 30, 2022 and 2021, excludes $34,000 and $1.1 million of transaction costs attributable to noncontrolling interests. |
| (2) | Calculated using the Net Debt below. Quarterly Adjusted EBITDA is annualized by multiplying by four. Adjusted EBITDA for the six months ended June 30, 2022 and 2021 is annualized by multiplying by two. Net Debt to annualized Adjusted EBITDA would have been 7.6x and 8.0x for the three and six months ended June 30, 2022, after including the net proceeds from the sales and recapitalizations that are held in escrow at a qualified intermediary to facilitate a potential like-kind exchange and removing the Adjusted EBITDA generated during the quarter from assets that were sold or recapitalized. |
| (3) | Net of premium/discount and deferred financing costs. |
14
FFO, CORE FFO AND FAD RECONCILIATIONS (NON-GAAP)
(Unaudited)
| | | | | | | | | | | | | | |
| in thousands, except per share data | | Three Months Ended June 30, | | Six Months Ended June 30, |
| ||||||||
| |
| 2022 |
| 2021 | XX | 2022 |
| 2021 | | ||||
| | | | | | | | | | | | | | |
| FFO and Core FFO | | | | | | | | | | | | | |
| Net income (loss) attributable to common shareholders | | $ | 123,275 |
| $ | (2,973) | | $ | 123,243 |
| $ | (23,704) | |
| Net income (loss) attributable to redeemable noncontrolling interests | |
| 18,248 |
| | (345) | |
| 18,258 |
| | (2,575) | |
| Net loss attributable to noncontrolling interests | |
| (29) |
| | — | |
| (84) |
| | (1,108) | |
| Net income (loss) | |
| 141,494 |
| | (3,318) | |
| 141,417 |
| | (27,387) | |
| Gain on the sale of real estate, net of tax | |
| (155,642) |
| | (11,290) | |
| (155,506) |
| | (11,290) | |
| Gain on the sale of unconsolidated real estate assets | |
| (936) |
| | (5,189) | |
| (6,179) |
| | (5,189) | |
| Real estate depreciation and amortization | |
| 47,242 |
| | 54,475 | |
| 102,759 |
| | 116,975 | |
| Pro rata share of real estate depreciation and amortization from unconsolidated real estate ventures | |
| 6,416 |
| | 7,277 | |
| 13,286 |
| | 14,588 | |
| FFO attributable to noncontrolling interests | |
| (47) |
| | (41) | |
| (73) |
| | 1,030 | |
| FFO Attributable to OP Units | | $ | 38,527 |
| $ | 41,914 | | $ | 95,704 |
| $ | 88,727 | |
| FFO attributable to redeemable noncontrolling interests | |
| (4,966) |
| | (4,054) | |
| (10,843) |
| | (8,539) | |
| FFO Attributable to Common Shareholders | | $ | 33,561 |
| $ | 37,860 | | $ | 84,861 |
| $ | 80,188 | |
| | | | | | | | | | | | | | |
| FFO attributable to OP Units | | $ | 38,527 |
| $ | 41,914 | | $ | 95,704 |
| $ | 88,727 | |
| Transaction and other costs, net of tax (1) | |
| 1,892 |
| | 2,241 | |
| 2,735 |
| | 4,793 | |
| Income from investments, net | | | (957) | | | — | | | (11,495) | | | — | |
| (Gain) loss from mark-to-market on derivative instruments | |
| (2,027) |
| | 46 | |
| (5,394) |
| | (87) | |
| Loss on the extinguishment of debt | |
| 1,038 |
| | — | |
| 1,629 |
| | — | |
| Earnings and distributions in excess of our investment in unconsolidated real estate venture | |
| (124) |
| | (92) | |
| (565) |
| | (422) | |
| Share-based compensation related to Formation Transaction and special equity awards | |
| 1,577 |
| | 4,441 | |
| 3,821 |
| | 9,386 | |
| Amortization of management contracts intangible, net of tax | |
| 1,106 |
| | 1,073 | |
| 2,211 |
| | 2,145 | |
| Unconsolidated real estate ventures allocated share of above adjustments | |
| 1,593 |
| | 6 | |
| 1,545 |
| | (4) | |
| Core FFO Attributable to OP Units | | $ | 42,625 |
| $ | 49,629 | | $ | 90,191 |
| $ | 104,538 | |
| Core FFO attributable to redeemable noncontrolling interests | |
| (5,494) |
| | (4,800) | |
| (10,383) |
| | (10,060) | |
| Core FFO Attributable to Common Shareholders | | $ | 37,131 |
| $ | 44,829 | | $ | 79,808 |
| $ | 94,478 | |
| FFO per common share - diluted | | $ | 0.28 |
| $ | 0.29 | | $ | 0.68 |
| $ | 0.61 | |
| Core FFO per common share - diluted | | $ | 0.31 |
| $ | 0.34 | | $ | 0.64 |
| $ | 0.72 | |
| Weighted average shares - diluted (FFO and Core FFO) | |
| 121,327 |
| | 131,485 | |
| 123,990 |
| | 131,513 | |
See footnotes on page 16.
15
FFO, CORE FFO AND FAD RECONCILIATIONS (NON-GAAP)
(Unaudited)
| | | | | | | | | | | | | | |
| in thousands, except per share data | | Three Months Ended June 30, | | Six Months Ended June 30, |
| ||||||||
| |
| 2022 |
| 2021 | | 2022 |
| 2021 | | ||||
| | | | | | | | | | | | | | |
| FAD | | | | | | | | | | | | | |
| Core FFO attributable to OP Units |
| $ | 42,625 |
| $ | 49,629 | | $ | 90,191 |
| $ | 104,538 | |
| Recurring capital expenditures and Second-generation tenant improvements and leasing commissions (2) | |
| (13,300) | |
| (12,226) | |
| (27,002) | |
| (22,657) | |
| Straight-line and other rent adjustments (3) | |
| (1,978) | |
| (4,088) | |
| (3,769) | |
| (8,853) | |
| Third-party lease liability assumption payments | |
| (25) | |
| (703) | |
| (25) | |
| (1,381) | |
| Share-based compensation expense | |
| 10,171 | |
| 9,045 | |
| 20,664 | |
| 17,115 | |
| Amortization of debt issuance costs | |
| 1,135 | |
| 1,096 | |
| 2,311 | |
| 2,201 | |
| Unconsolidated real estate ventures allocated share of above adjustments | |
| (289) | |
| (1,333) | |
| (937) | |
| (2,659) | |
| Non-real estate depreciation and amortization | |
| 760 | |
| 727 | |
| 1,828 | |
| 1,477 | |
| FAD available to OP Units (A) | | $ | 39,099 | | $ | 42,147 | | $ | 83,261 | | $ | 89,781 | |
| Distributions to common shareholders and unitholders (B) | | $ | 31,768 | | $ | 33,511 | | $ | 64,371 | | $ | 68,946 | |
| FAD Payout Ratio (B÷A) (4) | |
| 81.3 | % |
| 79.5 | % |
| 77.3 | % |
| 76.8 | % |
| | | | | | | | | | | | | | |
| Capital Expenditures | | | | | | | | | | | | | |
| Maintenance and recurring capital expenditures | | $ | 6,091 | | $ | 4,376 | | $ | 10,911 | | $ | 8,302 | |
| Share of maintenance and recurring capital expenditures from unconsolidated real estate ventures | |
| 312 | |
| 324 | |
| 394 | |
| 371 | |
| Second-generation tenant improvements and leasing commissions | |
| 6,713 | |
| 7,454 | |
| 15,307 | |
| 13,518 | |
| Share of Second-generation tenant improvements and leasing commissions from unconsolidated real estate ventures | |
| 184 | |
| 72 | |
| 390 | |
| 466 | |
| Recurring capital expenditures and Second-generation tenant improvements and leasing commissions | |
| 13,300 | |
| 12,226 | |
| 27,002 | |
| 22,657 | |
| Non-recurring capital expenditures | |
| 13,552 | |
| 4,352 | |
| 26,362 | |
| 7,188 | |
| Share of non-recurring capital expenditures from unconsolidated real estate ventures | |
| 37 | |
| 56 | |
| 49 | |
| 107 | |
| First-generation tenant improvements and leasing commissions | |
| 4,197 | |
| 1,703 | |
| 8,647 | |
| 2,538 | |
| Share of First-generation tenant improvements and leasing commissions from unconsolidated real estate ventures | |
| 244 | |
| 199 | |
| 717 | |
| 1,391 | |
| Non-recurring capital expenditures | |
| 18,030 | |
| 6,310 | |
| 35,775 | |
| 11,224 | |
| Total JBG SMITH Share of Capital Expenditures | | $ | 31,330 | | $ | 18,536 | | $ | 62,777 | | $ | 33,881 | |
| (1) | Includes demolition costs, integration and severance costs, pursuit costs related to other completed, potential and pursued transactions, as well as other expenses. For the six months ended June 30, 2022 and 2021, excludes $34,000 and $1.1 million of transaction costs attributable to noncontrolling interests. |
| (2) | Includes amounts, at JBG SMITH Share, related to unconsolidated real estate ventures. |
| (3) | Includes straight-line rent, above/below market lease amortization and lease incentive amortization. |
| (4) | The quarterly FAD payout ratio is not necessarily indicative of an amount for the full year due to fluctuation in the timing of capital expenditures, the commencement of new leases and the seasonality of our operations. |
16
NOI RECONCILIATIONS (NON-GAAP)
(Unaudited)
| | | | | | | | | | | | | | |
| dollars in thousands | | Three Months Ended June 30, | | Six Months Ended June 30, |
| ||||||||
| | | 2022 | | 2021 | | 2022 | | 2021 | | ||||
| | | | | | | | | | | | | | |
| Net income (loss) attributable to common shareholders |
| $ | 123,275 |
| $ | (2,973) | | $ | 123,243 |
| $ | (23,704) | |
| Add: | |
|
| |
|
| |
|
| |
|
| |
| Depreciation and amortization expense | |
| 49,479 | |
| 56,678 | |
| 107,541 | |
| 121,404 | |
| General and administrative expense: | |
|
| |
|
| |
|
| |
|
| |
| Corporate and other | |
| 14,782 | |
| 13,895 | |
| 30,597 | |
| 26,370 | |
| Third-party real estate services | |
| 24,143 | |
| 25,557 | |
| 51,192 | |
| 54,493 | |
| Share-based compensation related to Formation Transaction and special equity awards | |
| 1,577 | |
| 4,441 | |
| 3,821 | |
| 9,386 | |
| Transaction and other costs | |
| 1,987 | |
| 2,270 | |
| 2,886 | |
| 5,960 | |
| Interest expense | |
| 16,041 | |
| 16,773 | |
| 32,319 | |
| 33,069 | |
| Loss on the extinguishment of debt | |
| 1,038 | |
| — | |
| 1,629 | |
| — | |
| Income tax expense (benefit) | |
| 2,905 | |
| (5) | |
| 2,434 | |
| 4,310 | |
| Net income (loss) attributable to redeemable noncontrolling interests | |
| 18,248 | |
| (345) | |
| 18,258 | |
| (2,575) | |
| Net loss attributable to noncontrolling interests | | | (29) | |
| — | | | (84) | | | (1,108) | |
| Less: | |
|
| |
|
| |
|
| |
|
| |
| Third-party real estate services, including reimbursements revenue | |
| 22,157 | |
| 26,745 | |
| 46,127 | |
| 64,852 | |
| Other revenue | |
| 1,798 | |
| 1,904 | |
| 3,994 | |
| 4,090 | |
| Income (loss) from unconsolidated real estate ventures, net | |
| (2,107) | |
| 3,953 | |
| 1,038 | |
| 3,010 | |
| Interest and other income (loss), net | |
| 1,672 | |
| (38) | |
| 15,918 | |
| (29) | |
| Gain on the sale of real estate, net | |
| 158,767 | |
| 11,290 | |
| 158,631 | |
| 11,290 | |
| | | | | | | | | | | | | | |
| Consolidated NOI | |
| 71,159 | |
| 72,437 | |
| 148,128 | |
| 144,392 | |
| NOI attributable to unconsolidated real estate ventures at our share | |
| 8,321 | |
| 8,109 | |
| 15,268 | |
| 15,613 | |
| Non-cash rent adjustments (1) | |
| (1,978) | |
| (4,088) | |
| (3,769) | |
| (8,853) | |
| Other adjustments (2) | |
| 5,695 | |
| 5,191 | |
| 14,443 | |
| 9,933 | |
| Total adjustments | |
| 12,038 | |
| 9,212 | |
| 25,942 | |
| 16,693 | |
| NOI | | $ | 83,197 | | $ | 81,649 | | $ | 174,070 | | $ | 161,085 | |
| Less: out-of-service NOI loss (3) | |
| (2,046) | |
| (1,329) | |
| (3,498) | |
| (2,619) | |
| Operating Portfolio NOI | | $ | 85,243 | | $ | 82,978 | | $ | 177,568 | | $ | 163,704 | |
| Non-Same Store NOI (4) | |
| 5,915 | |
| 13,257 | |
| 22,152 | |
| 27,226 | |
| Same Store NOI (5) | | $ | 79,328 | | $ | 69,721 | | $ | 155,416 | | $ | 136,478 | |
| | | | | | | | | | | | | | |
| Change in Same Store NOI | | | 13.8 | % | | | |
| 13.9 | % |
| | |
| Number of properties in Same Store pool | | | 52 | | | | |
| 52 | |
|
| |
| (1) | Adjustment to exclude straight-line rent, above/below market lease amortization and lease incentive amortization. |
| (2) | Adjustment to include other revenue and payments associated with assumed lease liabilities related to operating properties and to exclude commercial lease termination revenue and allocated corporate general and administrative expenses to operating properties. |
| (3) | Includes the results of our Under-Construction assets, and Near-Term and Future Development Pipelines. |
| (4) | Includes the results of properties that were not In-Service for the entirety of both periods being compared and properties for which significant redevelopment, renovation or repositioning occurred during either of the periods being compared. |
| (5) | Includes the results of the properties that are owned, operated and In-Service for the entirety of both periods being compared. |
17

SEP | |
TABLE OF CONTENTS | JUNE 30, 2022 |
Table of Contents
| Page |
Overview | |
3-5 | |
6 | |
7 | |
8-9 | |
10 | |
Financial Information | |
11 | |
12 | |
Unconsolidated Real Estate Ventures - Balance Sheet and Operating Information | 13 |
14 | |
EBITDA, EBITDAre and Adjusted EBITDA Reconciliations (Non-GAAP) | 15 |
16-17 | |
Third-Party Asset Management and Real Estate Services Business (Non-GAAP) | 18 |
Pro Rata Adjusted General and Administrative Expenses (Non-GAAP) | 19 |
20 | |
22-22 | |
23 | |
24 | |
25 | |
26 | |
Leasing Activity | |
27 | |
28 | |
29 | |
30 | |
31 | |
32 | |
Property Data | |
33 | |
Property Tables: | |
34-37 | |
38-40 | |
41 | |
42 | |
43 | |
44 | |
Debt | |
45 | |
46-47 | |
Real Estate Ventures | |
48-49 | |
50-54 | |
Appendices – Transaction and Other Costs, and Reconciliations of Non-GAAP Financial Measures | 55-59 |
| | Page 2 |

Disclosures
Certain statements contained herein may constitute "forward-looking statements" as such term is defined in Section 27A of the Securities Act of 1933, as amended, and Section 21E of the Securities Exchange Act of 1934, as amended. Forward-looking statements are not guarantees of performance. They represent our intentions, plans, expectations and beliefs and are subject to numerous assumptions, risks and uncertainties. Consequently, the future results, financial condition and business of JBG SMITH Properties ("JBG SMITH", the "Company", "we", "us", "our" or similar terms) may differ materially from those expressed in these forward-looking statements. You can find many of these statements by looking for words such as "approximate", "hypothetical", "potential", "believes", "expects", "anticipates", "estimates", "intends", "plans", "would", "may" or similar expressions in this Investor Package. One of the most significant factors that could cause actual outcomes to differ materially from our forward-looking statements is the adverse effect of the current pandemic of the novel coronavirus, or COVID-19, and the ensuing economic turmoil on the Company, our financial condition, results of operations, cash flows, performance, our tenants, the real estate market and the global economy and financial markets. The extent to which COVID-19 continues to impact us and our tenants depends on future developments, many of which are highly uncertain and cannot be predicted with confidence. These developments include: the continued severity, duration, transmission rate and geographic spread of COVID-19 in the United States, the duration of associated immunity and vaccine efficacy against variants of COVID-19, the extent and effectiveness of other containment measures taken, and the response of the overall economy, the financial markets and the population (including the potential effects of inflation), particularly in areas in which we operate, and whether the residential market in the Washington, DC area and any of our properties will be materially impacted by the various moratoriums on residential evictions, among others. Moreover, investors are cautioned to interpret many of the risks identified under the section titled "Risk Factors" in our Annual Report on Form 10-K for the fiscal year ended December 31, 2021 as being heightened as a result of the ongoing and numerous adverse impacts of the COVID-19 pandemic. We also note the following forward-looking statements: the impact of COVID-19 and the ensuing economic turmoil on our Company, Net Operating Income, Same Store Net Operating Income, net asset value, share price, liquidity, occupancy rates, property rental revenue, operating costs, deferrals of rent, uncollectible operating lease receivables, parking revenue, burn-off of rent abatement, construction costs, the timing of disposition of assets in the JBG Legacy Funds, demand for new office space and potential bias of multifamily leasing to renewals; the impact of disruptions to the credit and capital markets on our ability to access capital, including refinancing maturing debt; potential Net Operating Income growth and the assumptions on which such growth is premised, our estimated future leverage (Net Debt/Annualized Adjusted EBITDA and Net Debt/Total Enterprise Value) profile, the economic impact, job growth, expansion of public transportation and related demand for multifamily and commercial properties of Amazon.com, Inc.’s ("Amazon") additional headquarters on the Washington, DC metropolitan area and National Landing and the speed with which such impact occurs and Amazon’s plans for accelerated hiring and in-person work requirements; changes to the amount and manner in which tenants use space; whether we incur additional costs or make additional concessions or offer other incentives to existing or prospective tenants to reconfigure space; long-term trends in demand for housing (including multifamily) within major urban employment centers; whether the Washington, DC area will be more resilient than other parts of the country in any recession resulting from COVID-19; whether we will recognize currently estimated unrecognized development fee revenue on the anticipated timing or at all; potential countercyclical growth caused by the concentration in the Washington, DC area of Amazon, the federal government, government contractors, and the Virginia Tech Innovation campus; whether National Landing will benefit economically from its proximity to the Department of Defense and elevated defense spending; the anticipated growth of our target submarkets; the economic impact of DC's diversification into technology; our anticipated acquisitions and dispositions and the ability to identify associated like-kind exchanges; our annual dividend per share and dividend yield; annualized Net Operating Income; adjusted annualized Net Operating Income; expected key Amazon transaction terms and timeframes for closing any Amazon transactions not yet closed; planned infrastructure and educational improvements related to Amazon's additional headquarters; the impact of our role as the developer, property manager and retail leasing agent in connection with Amazon's new headquarters; our development plans related to National Landing; the impact on our net asset value of the Amazon transactions; in the case of any further Amazon lease transactions and our new development opportunities in National Landing, the total square feet to be leased to Amazon and the expected net effective rent; the impact of increases in government spending on increases in agency and contractor spending locally; whether we can access agency debt secured by our currently unencumbered multifamily assets timely, on reasonable terms or at all; whether we will succeed in our contemplated recycling of disposition proceeds into acquisitions yielding the anticipated stabilized capitalization rates; whether we are able to renew at or above our historical retention rates on rolling leases; whether the allocation of capital to our share repurchase plan has any impact on our share price; whether our rent estimates are accurate; whether in the case of our Under-Construction and Near-Term Development Pipeline assets, estimated square feet, estimated number of units, estimated construction start, occupancy stabilization dates, the estimated completion date, estimated stabilization date, Estimated Incremental Investment, Estimated Total Investment, Projected NOI Yield, weighted average Projected NOI Yield, NOI yield or Estimated Total Project Cost, estimated total NOI weighted average completion date, weighted average stabilization date, intended type of asset use and potential tenants, Estimated Potential Development Density, and Estimated Stabilized NOI are accurate; whether our Under-Construction assets will deliver the Annualized NOI that we anticipate; our ability to satisfy environmental, social or governance standards set by various constituencies; whether our plans related to our investment in 5G wireless spectrum across National Landing will be a significant demand catalyst; whether the anticipated placemaking in National Landing will be realized; whether Amazon will have a similar growth impact on National Landing as in Seattle; whether Seattle’s South Lake Union region pre-pandemic will prove to be an appropriate comparison to National Landing post-pandemic including respective resident preferences regarding housing, office location and commuting; whether Amazon’s return-to-the-office policy will continue to require that employees live within commuting distance of their office; whether we will be able to successfully shift the majority of our portfolio to multifamily and concentrate our office portfolio in National Landing, and in the case of our Future
| | Page 3 |
Development Pipeline opportunities, estimated commercial SF/multifamily units to be replaced, estimated remaining acquisition cost, estimated capitalized cost, Estimated Total Investment, Estimated Potential Development Density and the potential for delays in the entitlement process.
Many of the factors that will determine the outcome of these and our other forward-looking statements are beyond our ability to control or predict. These factors include, among others: adverse economic conditions in the Washington, DC metropolitan area, including in relation to COVID-19, the timing of and costs associated with development and property improvements, financing commitments, and general competitive factors. For further discussion of factors that could materially affect the outcome of our forward-looking statements and other risks and uncertainties, see "Risk Factors," "Management's Discussion and Analysis of Financial Condition and Results of Operations" and the Cautionary Statement Concerning Forward-Looking Statements in the Company's Annual Report on Form 10-K for the year ended December 31, 2021 and other periodic reports the Company files with the Securities and Exchange Commission. For these statements, we claim the protection of the safe harbor for forward-looking statements contained in the Private Securities Litigation Reform Act of 1995. You are cautioned not to place undue reliance on our forward-looking statements. All subsequent written and oral forward-looking statements attributable to us or any person acting on our behalf are expressly qualified in their entirety by the cautionary statements contained or referred to in this section. We do not undertake any obligation to release publicly any revisions to our forward-looking statements to reflect events or circumstances occurring after the date hereof.
Organization and Basis of Presentation
JBG SMITH Properties ("JBG SMITH") was organized as a Maryland real estate investment trust ("REIT") for the purpose of receiving, via the spin-off on July 17, 2017 (the "Separation"), substantially all of the assets and liabilities of Vornado Realty Trust's Washington, DC segment. On July 18, 2017, JBG SMITH acquired the management business and certain assets and liabilities of The JBG Companies ("JBG") (the "Combination"). The Separation and the Combination are collectively referred to as the "Formation Transaction."
The information contained in this Investor Package does not purport to disclose all items required by the accounting principles generally accepted in the United States of America ("GAAP") and is unaudited information, unless otherwise indicated.
Pro Rata Information
We present certain financial information and metrics in this Investor Package "at JBG SMITH Share," which refers to our ownership percentage of consolidated and unconsolidated assets in real estate ventures (collectively, "real estate ventures") as applied to these financial measures and metrics. Financial information "at JBG SMITH Share" is calculated on an asset-by-asset basis by applying our percentage economic interest to each applicable line item of that asset's financial information. "At JBG SMITH Share" information, which we also refer to as being "at share," "our pro rata share" or "our share," is not, and is not intended to be, a presentation in accordance with GAAP. Given that a substantial portion of our assets are held through real estate ventures, we believe this form of presentation, which presents our economic interests in the partially owned entities, provides investors valuable information regarding a significant component of our portfolio, its composition, performance and capitalization.
We do not control the unconsolidated real estate ventures and do not have a legal claim to our co-venturers' share of assets, liabilities, revenue and expenses. The operating agreements of the unconsolidated real estate ventures generally allow each co-venturer to receive cash distributions to the extent there is available cash from operations. The amount of cash each investor receives is based upon specific provisions of each operating agreement and varies depending on certain factors including the amount of capital contributed by each investor and whether any investors are entitled to preferential distributions.
With respect to any such third-party arrangement, we would not be in a position to exercise sole decision-making authority regarding the property, real estate venture or other entity, and may, under certain circumstances, be exposed to economic risks not present were a third-party not involved. We and our respective co-venturers may each have the right to trigger a buy-sell or forced sale arrangement, which could cause us to sell our interest, or acquire our co-venturers' interests, or to sell the underlying asset, either on unfavorable terms or at a time when we otherwise would not have initiated such a transaction. Our real estate ventures may be subject to debt, and the repayment or refinancing of such debt may require equity capital calls. To the extent our co-venturers do not meet their obligations to us or our real estate ventures or they act inconsistent with the interests of the real estate venture, we may be adversely affected. Because of these limitations, the non-GAAP "at JBG SMITH Share" financial information should not be considered in isolation or as a substitute for our financial statements as reported under GAAP.
Occupancy, non-GAAP financial measures and leverage metrics presented in our investor package exclude our 10.0% subordinated interest in one commercial building and our 33.5% subordinated interest in four commercial buildings, as well as the associated non-recourse mortgages payable, held through unconsolidated real estate ventures, as our investment in each real estate venture is zero, we do not anticipate receiving any near-term cash flow distributions from the real estate ventures and have not guaranteed their obligations or otherwise committed to providing financial support.
| | Page 4 |
Definitions
See pages 50-54 for definitions of terms used in this Investor Package.
Information herein with respect to the proposed transactions with Amazon is based on executed leases and a purchase and sale agreement between us and Amazon. Closing under this agreement is subject to customary closing conditions.
Non-GAAP Measures
This Investor Package includes non-GAAP measures. For these measures, we have provided an explanation of how these non-GAAP measures are calculated and why our management believes that the presentation of these measures provides useful information to investors regarding our financial condition and results of operations. Reconciliations of certain non-GAAP measures to the most directly comparable GAAP financial measure are included in this Investor Package. Our presentation of non-GAAP financial measures may not be comparable to similar non-GAAP measures used by other companies.
In addition to "at share" financial information, the following non-GAAP measures are included in this Investor Package:
| ● | Earnings Before Interest, Taxes, Depreciation and Amortization ("EBITDA") |
| ● | EBITDA for Real Estate ("EBITDAre") |
| ● | Adjusted EBITDA |
| ● | Funds from Operations ("FFO") |
| ● | Core FFO |
| ● | Funds Available for Distribution ("FAD") |
| ● | Third-Party Asset Management and Real Estate Services Business |
| ● | Net Operating Income ("NOI") |
| ● | Annualized NOI |
| ● | Estimated Stabilized NOI |
| ● | Projected NOI Yield |
| ● | Same Store NOI |
| ● | Consolidated and Unconsolidated Indebtedness |
| ● | Net Debt |
| ● | Pro Rata Adjusted General and Administrative Expenses |
| | Page 5 |
| |
COMPANY PROFILE | JUNE 30, 2022 |
| | | | | | | | | |
Executive Officers | | Company Snapshot as of June 30, 2022 | |||||||
| | | | | | | | | |
W. Matthew Kelly |
| Chief Executive Officer and Trustee |
| | Exchange/ticker |
| | NYSE: JBGS | |
David P. Paul |
| President and Chief Operating Officer |
| | Indicated annual dividend per share | | $ | 0.90 | |
M. Moina Banerjee |
| Chief Financial Officer |
| | Dividend yield | |
| 3.8 | % |
Kevin P. Reynolds |
| Chief Development Officer |
| |
| |
|
| |
George L. Xanders | | Chief Investment Officer |
| | Total Enterprise Value (dollars in billions, except share price) | |
|
| |
Steven A. Museles |
| Chief Legal Officer |
| | Common share price | | $ | 23.64 | |
| | |
| | Common shares and common limited partnership units ("OP Units") | |
| 131.13 | |
| | |
| | Total market capitalization | | $ | 3.10 | |
| | |
| | Total consolidated and unconsolidated indebtedness at JBG SMITH Share | |
| 2.28 | |
| | |
| | Less: cash and cash equivalents at JBG SMITH Share | |
| (0.18) | |
| | |
| | Net Debt | | $ | 2.10 | |
| | |
| | Total Enterprise Value | | $ | 5.20 | |
| | | | | | | | | |
|
|
|
| | Net Debt / Total Enterprise Value (2) | |
| 40.4 | % |
| | | | | | | | | |
| (1) | Includes certain fully-vested incentive equity awards that are convertible into OP Units. |
| (2) | Net Debt to total enterprise value would have been 38.1% as of June 30, 2022 after including the net proceeds from the sales and recapitalizations that are held in escrow at a qualified intermediary to facilitate a potential like-kind exchange. |
| | Page 6 |
| |
FINANCIAL HIGHLIGHTS | JUNE 30, 2022 |
| | | | | | | | | |
| dollars in thousands, except per share data |
| Three Months Ended | | | Six Months Ended | | ||
| | | June 30, 2022 | | | June 30, 2022 | | ||
| | | | | | | | | |
| Summary Financial Results | | | | | | | | |
| Total revenue | | $ | 145,505 | | | $ | 307,470 | |
| Net income attributable to common shareholders | | $ | 123,275 | | | $ | 123,243 | |
| Per diluted common share | | $ | 1.02 | | | $ | 0.99 | |
| Operating portfolio NOI | | $ | 85,243 | | | $ | 177,568 | |
| FFO (1) | | $ | 38,527 | | | $ | 95,704 | |
| Per OP Unit | | $ | 0.28 | | | $ | 0.68 | |
| Core FFO (1) | | $ | 42,625 | | | $ | 90,191 | |
| Per OP Unit | | $ | 0.31 | | | $ | 0.64 | |
| FAD (1) | | $ | 39,099 | | | $ | 83,261 | |
| FAD payout ratio | |
| 81.3 | % | |
| 77.3 | % |
| EBITDA (1) | | $ | 219,366 | | | $ | 302,961 | |
| EBITDAre (1) | | $ | 59,663 | | | $ | 138,151 | |
| Adjusted EBITDA (1) | | $ | 64,765 | | | $ | 132,645 | |
| Net Debt / total enterprise value (2) | |
| 40.4 | % | |
| 40.4 | % |
| Net Debt to annualized Adjusted EBITDA (2) | |
| 8.1 | x | |
| 7.9 | x |
| | | | | | | | | |
| | | | | | | June 30, 2022 | | |
| | | | | | | | | |
| Debt Summary and Key Ratios (at JBG SMITH Share) | | | | | |
|
| |
| Total consolidated indebtedness (3) | | | | | | $ | 2,000,762 | |
| Total consolidated and unconsolidated indebtedness (3) | | | | | | $ | 2,280,296 | |
| Weighted average interest rates: | | | | | |
|
| |
| Variable rate debt (4) | | | | | |
| 3.88 | % |
| Fixed rate debt | | | | | |
| 3.85 | % |
| Total debt | | | | | |
| 3.86 | % |
| Cash and cash equivalents | | | | | | $ | 181,882 | |
| (1) | Attributable to OP Units, which include units owned by JBG SMITH. |
| (2) | Net Debt to total enterprise value would have been 38.1% as of June 30, 2022, and Net Debt to annualized Adjusted EBITDA would have been 7.6x and 8.0x for the three and six months ended June 30, 2022, after including net proceeds from the sales and recapitalizations that are held in escrow at a qualified intermediary to facilitate a potential like-kind exchange and removing the Adjusted EBITDA generated during the quarter from assets that were sold or recapitalized. |
| (3) | Net of premium/discount and deferred financing costs. |
| (4) | For floating rate loans with interest rate caps, the weighted average cap strike is 2.51% for consolidated debt, and 2.60% for all debt. The interest rate cap strike is exclusive of the credit spreads associated with the loans. |
| | Page 7 |
| |
FINANCIAL HIGHLIGHTS – TRENDS | JUNE 30, 2022 |
| | | | | | | | | | | | | | | | | |
| | | Three Months Ended |
| |||||||||||||
| dollars in thousands, except per share data, at JBG SMITH Share |
| Q2 2022 |
| Q1 2022 |
| Q4 2021 |
| Q3 2021 |
| Q2 2021 | | |||||
| Commercial NOI | | $ | 57,437 | | $ | 64,919 | | $ | 62,300 | | $ | 61,889 | | $ | 63,849 | |
| Multifamily NOI | |
| 27,338 | |
| 26,887 | |
| 24,061 | |
| 19,107 | |
| 18,644 | |
| Ground Leases and Other NOI | | | 468 | | | 547 | | | 475 | | | 496 | | | 485 | |
| Operating portfolio NOI | | $ | 85,243 | | $ | 92,353 | | $ | 86,836 | | $ | 81,492 | | $ | 82,978 | |
| Total Annualized NOI | | $ | 337,093 | | $ | 370,691 | | $ | 345,763 | | $ | 324,001 | | $ | 330,682 | |
| | | | | | | | | | | | | | | | | |
| Net income (loss) attributable to common shareholders | | $ | 123,275 | | $ | (32) | | $ | (56,446) | | $ | 893 | | $ | (2,973) | |
| Per diluted common share | | $ | 1.02 | | $ | — | | $ | (0.45) | | $ | — | | $ | (0.03) | |
| FFO (1) | | $ | 38,527 | | $ | 57,177 | | $ | 47,924 | | $ | 40,734 | | $ | 41,914 | |
| Per OP Unit | | $ | 0.28 | | $ | 0.40 | | $ | 0.33 | | $ | 0.27 | | $ | 0.29 | |
| Core FFO (1) | | $ | 42,625 | | $ | 47,566 | | $ | 44,943 | | $ | 48,083 | | $ | 49,629 | |
| Per OP Unit | | $ | 0.31 | | $ | 0.34 | | $ | 0.31 | | $ | 0.32 | | $ | 0.34 | |
| FAD (1) | | $ | 39,099 | | $ | 44,162 | | $ | 30,453 | | $ | 39,992 | | $ | 42,147 | |
| FAD payout ratio | |
| 81.3 | % |
| 73.8 | % |
| 108.8 | % |
| 84.2 | % |
| 79.5 | % |
| EBITDA (1) | | $ | 219,366 | | $ | 83,595 | | $ | 21,744 | | $ | 85,275 | | $ | 80,668 | |
| EBITDAre (1) | | $ | 59,663 | | $ | 78,488 | | $ | 70,771 | | $ | 63,518 | | $ | 64,189 | |
| Adjusted EBITDA (1) | | $ | 64,765 | | $ | 67,880 | | $ | 66,169 | | $ | 69,799 | | $ | 70,817 | |
| Net Debt / total enterprise value (2) | |
| 40.4 | % |
| 39.1 | % |
| 38.5 | % |
| 34.3 | % |
| 32.1 | % |
| Net Debt to annualized Adjusted EBITDA (2) | |
| 8.1 | x |
| 9.6 | x |
| 9.6 | x |
| 7.9 | x |
| 7.6 | x |
| | | | | | | | | | | | | | | | | |
| | | Q2 2022 | | Q1 2022 | | Q4 2021 | | Q3 2021 | | Q2 2021 | | |||||
| | | | | | | | | | | | | | | | | |
| Number of Operating Assets | |
|
| |
|
| |
|
| |
|
| |
|
| |
| Commercial | |
| 35 | |
| 41 | |
| 41 | |
| 41 | |
| 42 | |
| Multifamily | |
| 19 | |
| 20 | |
| 22 | |
| 21 | |
| 21 | |
| Ground Leases and Other | | | 2 | | | 1 | | | 1 | | | 1 | | | 1 | |
| Total | |
| 56 | |
| 62 | |
| 64 | |
| 63 | |
| 64 | |
| | | | | | | | | | | | | | | | | |
| Operating Portfolio % Leased | |
|
| |
|
| |
|
| |
|
| |
|
| |
| Commercial (3) | |
| 87.3 | % |
| 85.2 | % |
| 84.9 | % |
| 84.9 | % |
| 85.9 | % |
| Multifamily (4) | |
| 95.7 | % |
| 94.1 | % |
| 93.6 | % |
| 94.0 | % |
| 92.8 | % |
| Weighted Average | |
| 90.5 | % |
| 88.1 | % |
| 87.7 | % |
| 87.7 | % |
| 88.0 | % |
| | | | | | | | | | | | | | | | | |
| Operating Portfolio % Occupied (5) | |
|
| |
|
| |
|
| |
|
| |
|
| |
| Commercial (3) | |
| 86.1 | % |
| 83.3 | % |
| 82.9 | % |
| 82.6 | % |
| 84.4 | % |
| Multifamily (4) | |
| 92.3 | % |
| 91.6 | % |
| 91.8 | % |
| 92.4 | % |
| 88.7 | % |
| Weighted Average | |
| 88.4 | % |
| 86.0 | % |
| 85.8 | % |
| 85.7 | % |
| 85.7 | % |
See footnotes on page 9.
| | Page 8 |
| |
FINANCIAL HIGHLIGHTS – TRENDS | JUNE 30, 2022 |
Footnotes
Note: See appendices for reconciliations of non-GAAP financial measures to their respective comparable GAAP financial measures.
| (1) | Attributable to OP Units, which include units owned by JBG SMITH. |
| (2) | Net Debt to total enterprise value would have been 38.1% as of June 30, 2022, and Net Debt to annualized Adjusted EBITDA would have been 7.6x for the three months ended June 30, 2022, after including the net proceeds from the sales and recapitalizations that are held in escrow at a qualified intermediary to facilitate a potential like-kind exchange and removing the Adjusted EBITDA generated during the quarter from assets that were sold or recapitalized. |
| (3) | Crystal City Marriott is excluded from the Percent Leased and the Percent Occupied metrics. |
| (4) | Includes Recently Delivered assets. In-Service assets were 96.6% leased and 93.1% occupied as of Q2 2022, 95.5% leased and 92.9% occupied as of Q1 2022, 95.4% leased and 93.4% occupied as of Q4 2021, 96.3% leased and 94.5% occupied as of Q3 2021, and 96.4% leased and 92.7% occupied as of Q2 2021. 2221 S. Clark Street - Residential and 900 W Street are excluded from the Percent Leased and the Percent Occupied metrics as they are operated as short-term rental properties. |
| (5) | Percent Occupied excludes occupied retail SF. |
| | Page 9 |
| |
PORTFOLIO OVERVIEW | JUNE 30, 2022 |
| | | | | | | | | | | | | | | | | | | | | |
| | | | | 100% Share | | At JBG SMITH Share |
| |||||||||||||
| | | | | | | | | | | | | | | Annualized Rent | | | | | ||
| | | | | | | | | | | | | Annualized | | per Square Foot/ | | |
| |||
| | | Number of | | Square Feet/ | | Square Feet/ | | % | | | | Rent | | Monthly Rent | | Annualized NOI (3) | | |||
| | | Assets | | Units | | Units | | Leased | | % Occupied (1) | | (in thousands) | | Per Unit (2) | | (in thousands) |
| |||
| | | | | | | | | | | | | | | | | | | | | |
| Operating | | | | | | | | | | | | | | | | | | | | |
| Commercial (4) | | | | | | | | | | | | | | | | | | | | |
| National Landing | | 23 | | 7,337,206 | | 7,061,402 | | 87.2% | | 87.1% | | $ | 258,753 | | $ | 44.66 | | $ | 174,777 | |
| Other VA | | 4 | | 1,057,388 | | 398,972 | | 94.5% | | 95.4% | | | 17,620 | | | 49.15 | | | 12,096 | |
| DC | | 6 | | 1,629,309 | | 913,383 | | 81.2% | | 70.3% | | | 36,371 | | | 57.01 | | | 20,448 | |
| MD | | 2 | | 513,430 | | 513,430 | | 93.4% | | 93.2% | | | 26,695 | | | 53.62 | | | 18,548 | |
| Commercial - total / weighted average |
| 35 |
| 10,537,333 |
| 8,887,187 |
| 87.3% | | 86.1% | | $ | 339,439 |
| $ | 46.51 |
| $ | 225,869 | |
| Multifamily (5) |
|
|
|
|
|
|
|
|
|
| |
|
| |
|
| |
|
| |
| National Landing | | 4 | | 2,856 | | 2,856 | | 98.3% | | 95.5% | | $ | 65,285 | | $ | 2,101 | | $ | 43,936 | |
| DC | | 12 | | 3,743 | | 3,041 | | 94.6% | | 90.3% | | | 86,930 | | | 2,363 | | | 58,752 | |
| MD | | 2 | | 438 | | 438 | | 99.8% | | 97.7% | | | 8,343 | | | 1,624 | | | 5,776 | |
| In-Service |
| 18 |
| 7,037 | | 6,335 |
| 96.6% | | 93.1% | | | 160,558 | | | 2,189 | | | 108,464 | |
| Recently Delivered |
| 1 |
| 322 |
| 161 |
| 71.5% | | 60.6% | |
| 4,148 | |
| 3,109 | |
| 888 | |
| Multifamily – total / weighted average |
| 19 |
| 7,359 |
| 6,496 |
| 95.7% | | 92.3% | | $ | 164,706 | | $ | 2,205 | | $ | 109,352 | |
| | | | | | | | | | | | | | | | | | | | | |
| Ground Leases and Other (6) | | | | | | | | | | | | | | | | | | | | |
| Other VA | | 1 | | — | | — | | — | | — | | | — | | | — | | | (92) | |
| DC | | 1 | | — | | — | | — | | — | | | — | | | — | | | 1,964 | |
| | | 2 | | — | | — | | — | | — | | | — | | | — | | | 1,872 | |
| |
| | | | | | | | | | | | | | | | | | | |
| Operating - Total / Weighted Average |
| 56 |
| 10,537,333 SF/ 7,359 Units |
| 8,887,187 SF/ 6,496 Units |
| 90.5% | | 88.4% | | $ | 504,145 | | | $46.51 per SF/ | | $ | 337,093 | |
| | | | | | | | | | | | | | | | | | | | | |
| Development (7) |
|
|
|
|
|
|
|
|
|
| |
|
| |
|
| |
|
| |
| | | | | | | | | | | | | | | | | | | | | |
| Under-Construction |
| 2 |
| 1,583 Units |
| 1,583 Units |
| | |
| |
| | |
| | |
|
| |
| | | | | | | | | | | | | | | | | | | | | |
| Near-Term Development |
| 8 |
| 3,742,300 |
| 3,532,700 |
|
|
|
| |
|
| |
| | |
|
| |
| | | | | | | | | | | | | | | | | | | | | |
| Future Development |
| 16 |
| 8,799,800 |
| 6,273,700 |
|
|
|
| |
|
| |
| | |
|
| |
| (1) | Percent Occupied excludes retail SF. |
| (2) | For commercial assets, represents annualized office rent divided by occupied office SF; annualized retail rent and retail SF are excluded from this metric. For multifamily assets, represents monthly multifamily rent divided by occupied units; retail rent is excluded from this metric. Annualized Rent and Annualized Rent per Square Foot exclude percentage rent and the square footage of office tenants that only pay percentage rent. Occupied square footage may differ from leased square footage because leased square footage includes space for leases that have been signed but the tenant has not yet taken occupancy (not yet included in Percent Occupied metrics). |
| (3) | Annualized NOI includes $8.2 million from sold or recapitalized commercial assets and $0.1 million from sold multifamily assets. |
| (4) | Crystal City Marriott is excluded from Percent Leased, Percent Occupied, Annualized Rent and Annualized Rent per Square Foot metrics. |
| (5) | 2221 S. Clark Street - Residential and 900 W Street are excluded from Percent Leased, Percent Occupied, Annualized Rent and Monthly Rent Per Unit metrics. |
| (6) | 1700 M Street and 1831/1861 Wiehle Avenue (for which we are the ground lessor) are excluded from Percent Leased, Percent Occupied, Annualized Rent and Annualized Rent per Square Foot metrics. See footnote (8) on page 23 for more information. |
| (7) | Refer to pages 41- 43 for detail on Under-Construction assets, and Near-Term and Future Development Pipelines. |
| | |
| | Page 10 |
| |
CONDENSED CONSOLIDATED BALANCE SHEETS | JUNE 30, 2022 |
Condensed Consolidated Balance Sheets
| | | | | | | | |
| in thousands | | June 30, 2022 | | December 31, 2021 |
| ||
| | | | | | | |
|
| ASSETS | | | | | | | |
| Real estate, at cost: |
| |
|
| |
| |
| Land and improvements | | $ | 1,217,216 | | $ | 1,378,218 | |
| Buildings and improvements | |
| 4,004,286 | |
| 4,513,606 | |
| Construction in progress, including land | |
| 385,085 | |
| 344,652 | |
| | |
| 5,606,587 | |
| 6,236,476 | |
| Less: accumulated depreciation | |
| (1,257,871) | |
| (1,368,003) | |
| Real estate, net | |
| 4,348,716 | |
| 4,868,473 | |
| Cash and cash equivalents | |
| 162,270 | |
| 264,356 | |
| Restricted cash | |
| 212,848 | |
| 37,739 | |
| Tenant and other receivables | |
| 46,605 | |
| 44,496 | |
| Deferred rent receivable | |
| 154,487 | |
| 192,265 | |
| Investments in unconsolidated real estate ventures | |
| 414,349 | |
| 462,885 | |
| Intangible assets, net | | | 157,819 | | | 201,956 | |
| Other assets, net | |
| 82,808 | |
| 240,160 | |
| Assets held for sale | |
| — | |
| 73,876 | |
| TOTAL ASSETS | | $ | 5,579,902 | | $ | 6,386,206 | |
| | | | | | | | |
| LIABILITIES, REDEEMABLE NONCONTROLLING INTERESTS AND EQUITY | |
|
| |
|
| |
| Liabilities: | |
|
| |
|
| |
| Mortgages payable, net | | $ | 1,612,169 | | $ | 1,777,699 | |
| Revolving credit facility | |
| — | |
| 300,000 | |
| Unsecured term loans, net | |
| 398,500 | |
| 398,664 | |
| Accounts payable and accrued expenses | |
| 112,784 | |
| 106,136 | |
| Other liabilities, net | |
| 111,852 | |
| 342,565 | |
| Total liabilities | |
| 2,235,305 | |
| 2,925,064 | |
| Commitments and contingencies | |
|
| |
|
| |
| Redeemable noncontrolling interests | |
| 521,392 | |
| 522,725 | |
| Total equity | |
| 2,823,205 | |
| 2,938,417 | |
| TOTAL LIABILITIES, REDEEMABLE NONCONTROLLING INTERESTS AND EQUITY | | $ | 5,579,902 | | $ | 6,386,206 | |
Note: For complete financial statements, please refer to our Quarterly Report on Form 10-Q for the quarter ended June 30, 2022.
| | |
| | Page 11 |
| |
CONDENSED CONSOLIDATED STATEMENTS OF OPERATIONS | JUNE 30, 2022 |
Condensed Consolidated Statements of Operations
| | | | | | | | | | | | | | |
| in thousands, except per share data | | Three Months Ended June 30, | | Six Months Ended June 30, |
| ||||||||
| | | 2022 | | 2021 | | 2022 | | 2021 |
| ||||
| REVENUE | | | | | | | | | | | | | |
| Property rental |
| $ | 117,036 |
| $ | 122,819 | | $ | 248,634 |
| $ | 245,060 | |
| Third-party real estate services, including reimbursements | |
| 22,157 | |
| 26,745 | |
| 46,127 | |
| 64,852 | |
| Other revenue | |
| 6,312 | |
| 5,080 | |
| 12,709 | |
| 10,021 | |
| Total revenue | |
| 145,505 | |
| 154,644 | |
| 307,470 | |
| 319,933 | |
| EXPENSES | |
|
| |
|
| |
|
| |
|
| |
| Depreciation and amortization | |
| 49,479 | |
| 56,678 | |
| 107,541 | |
| 121,404 | |
| Property operating | |
| 35,445 | |
| 35,000 | |
| 76,089 | |
| 69,731 | |
| Real estate taxes | |
| 14,946 | |
| 18,558 | |
| 33,132 | |
| 36,868 | |
| General and administrative: | |
| | |
| | |
| | |
| | |
| Corporate and other | |
| 14,782 | |
| 13,895 | |
| 30,597 | |
| 26,370 | |
| Third-party real estate services | |
| 24,143 | |
| 25,557 | |
| 51,192 | |
| 54,493 | |
| Share-based compensation related to Formation Transaction and special equity awards | |
| 1,577 | |
| 4,441 | |
| 3,821 | |
| 9,386 | |
| Transaction and Other Costs | |
| 1,987 | |
| 2,270 | |
| 2,886 | |
| 5,960 | |
| Total expenses | |
| 142,359 | |
| 156,399 | |
| 305,258 | |
| 324,212 | |
| OTHER INCOME (EXPENSE) | |
|
| |
|
| |
|
| |
|
| |
| Income (loss) from unconsolidated real estate ventures, net | |
| (2,107) | |
| 3,953 | |
| 1,038 | |
| 3,010 | |
| Interest and other income (loss), net | |
| 1,672 | |
| (38) | |
| 15,918 | |
| (29) | |
| Interest expense | |
| (16,041) | |
| (16,773) | |
| (32,319) | |
| (33,069) | |
| Gain on the sale of real estate, net | |
| 158,767 | |
| 11,290 | |
| 158,631 | |
| 11,290 | |
| Loss on the extinguishment of debt | |
| (1,038) | |
| — | |
| (1,629) | |
| — | |
| Total other income (expense) | |
| 141,253 | |
| (1,568) | |
| 141,639 | |
| (18,798) | |
| INCOME (LOSS) BEFORE INCOME TAX (EXPENSE) BENEFIT | |
| 144,399 | |
| (3,323) | |
| 143,851 | |
| (23,077) | |
| Income tax (expense) benefit | |
| (2,905) | |
| 5 | |
| (2,434) | |
| (4,310) | |
| NET INCOME (LOSS) | |
| 141,494 | |
| (3,318) | |
| 141,417 | |
| (27,387) | |
| Net (income) loss attributable to redeemable noncontrolling interests | |
| (18,248) | |
| 345 | |
| (18,258) | |
| 2,575 | |
| Net loss attributable to noncontrolling interests | | | 29 | | | — | | | 84 | |
| 1,108 | |
| NET INCOME (LOSS) ATTRIBUTABLE TO COMMON SHAREHOLDERS | | $ | 123,275 | | $ | (2,973) | | $ | 123,243 | | $ | (23,704) | |
| EARNINGS (LOSS) PER COMMON SHARE - BASIC AND DILUTED | | $ | 1.02 | | $ | (0.03) | | $ | 0.99 | | $ | (0.19) | |
| WEIGHTED AVERAGE NUMBER OF COMMON SHARES OUTSTANDING - BASIC AND DILUTED | |
| 121,316 | |
| 131,480 | |
| 123,984 | |
| 131,510 | |
Note: For complete financial statements, please refer to our Quarterly Report on Form 10-Q for the quarter ended June 30, 2022.
| | |
| | Page 12 |
nconsolidated Real Estate Ventures
| | | | | |
| in thousands, at JBG SMITH Share |
| | |
|
| BALANCE SHEET INFORMATION | | June 30, 2022 |
| |
| | | | | |
| Total real estate, at cost | | $ | 684,770 | |
| Less: accumulated depreciation | |
| (53,384) | |
| Real estate, net | |
| 631,386 | |
| Cash and cash equivalents | |
| 19,681 | |
| Other assets, net | |
| 66,632 | |
| Total assets | | $ | 717,699 | |
| Borrowings, net | | $ | 279,534 | |
| Other liabilities, net | |
| 36,463 | |
| Total liabilities | | $ | 315,997 | |
| | | | | | | | |
| |
| Three Months Ended | | Six Months Ended |
| ||
| OPERATING INFORMATION | | June 30, 2022 | | June 30, 2022 |
| ||
| Total revenue | | $ | 15,767 | | $ | 30,933 | |
| Expenses: | |
|
| |
|
| |
| Depreciation and amortization | |
| 6,287 | |
| 13,021 | |
| Property operating | |
| 5,205 | |
| 10,631 | |
| Real estate taxes | |
| 2,556 | |
| 5,060 | |
| Total expenses | |
| 14,048 | |
| 28,712 | |
| Other income (expense): | |
|
| |
|
| |
| Interest expense | |
| (3,073) | |
| (6,032) | |
| Gain on the sale of real estate | |
| 936 | |
| 6,179 | |
| Loss on the extinguishment of debt | | | (1,820) | | | (1,950) | |
| Interest and other income, net | |
| 11 | |
| 14 | |
| | | | | | | | |
| Net income (loss) | | $ | (2,227) | | $ | 432 | |
| Earnings and distributions in excess of our investment in unconsolidated real estate venture | |
| 124 | |
| 565 | |
| Other | |
| (3) | |
| 41 | |
| Income (loss) from unconsolidated real estate ventures, net | | $ | (2,107) | | $ | 1,038 | |
| | |
| | Page 13 |
| |
OTHER TANGIBLE ASSETS AND LIABILITIES | JUNE 30, 2022 |
Other Tangible Assets and Liabilities
| | | | | |
| in thousands, at JBG SMITH Share |
| June 30, 2022 |
| |
| | | | | |
| Other Tangible Assets, Net (1) | | | | |
| Restricted cash (2) | | $ | 221,962 | |
| Tenant and other receivables, net | |
| 49,575 | |
| Other assets, net | |
| 93,257 | |
| Total Other Tangible Assets, Net | | $ | 364,794 | |
| | | | | |
| Other Tangible Liabilities, Net | |
|
| |
| Accounts payable and accrued liabilities | | $ | 126,697 | |
| Other liabilities, net | |
| 119,725 | |
| Total Other Tangible Liabilities, Net | | $ | 246,422 | |
| (1) | Excludes cash and cash equivalents |
| (2) | Includes net proceeds from certain sales and recapitalizations that are held in escrow at a qualified intermediary to facilitate a potential like-kind exchange. |
| | |
| | Page 14 |
| |
EBITDA, EBITDAre AND ADJUSTED EBITDA RECONCILIATIONS (NON-GAAP) | JUNE 30, 2022 |
EBITDA, EBITDAre and Adjusted EBITDA
| | | | | | | | | | | | | | |
| dollars in thousands |
| Three Months Ended June 30, | | Six Months Ended June 30, |
| ||||||||
| | | 2022 | | 2021 | | 2022 | | 2021 |
| ||||
| | | | | | | | | | | | | |
|
| EBITDA, EBITDAre and Adjusted EBITDA |
| | | | | | | |
| | |
| |
| Net income (loss) | | $ | 141,494 | | $ | (3,318) | | $ | 141,417 | | $ | (27,387) | |
| Depreciation and amortization expense | | | 49,479 | | | 56,678 | | | 107,541 | | | 121,404 | |
| Interest expense | | | 16,041 | | | 16,773 | | | 32,319 | | | 33,069 | |
| Income tax expense (benefit) | | | 2,905 | | | (5) | | | 2,434 | | | 4,310 | |
| Unconsolidated real estate ventures allocated share of above adjustments | | | 9,494 | | | 10,581 | | | 19,323 | | | 20,745 | |
| EBITDA attributable to noncontrolling interests | | | (47) | | | (41) | | | (73) | | | 1,030 | |
| EBITDA | | $ | 219,366 | | $ | 80,668 | | $ | 302,961 | | $ | 153,171 | |
| Gain on the sale of real estate, net | | | (158,767) | | | (11,290) | | | (158,631) | | | (11,290) | |
| Gain on the sale of unconsolidated real estate assets | | | (936) | | | (5,189) | | | (6,179) | | | (5,189) | |
| | | | | | | | | | | | | | |
| EBITDAre | | $ | 59,663 | | $ | 64,189 | | $ | 138,151 | | $ | 136,692 | |
| Transaction and Other Costs (1) | | | 1,987 | | | 2,270 | | | 2,852 | | | 4,852 | |
| Income from investments, net | | | (1,217) | | | — | | | (15,288) | | | — | |
| Loss on the extinguishment of debt | | | 1,038 | | | — | | | 1,629 | | | — | |
| Share-based compensation related to Formation Transaction and special equity awards | | | 1,577 | | | 4,441 | | | 3,821 | | | 9,386 | |
| Earnings and distributions in excess of our investment in unconsolidated real estate venture | | | (124) | | | (92) | | | (565) | | | (422) | |
| Unconsolidated real estate ventures allocated share of above adjustments | | | 1,841 | | | 9 | | | 2,045 | | | 40 | |
| | | | | | | | | | | | | | |
| Adjusted EBITDA | | $ | 64,765 | | $ | 70,817 | | $ | 132,645 | | $ | 150,548 | |
| | | | | | | | | | | | | | |
| Net Debt to Annualized Adjusted EBITDA (2) | | | 8.1 | x | | 7.6 | x | | 7.9 | x | | 7.2 | x |
| | | | | | | | | | | | | | |
| Net Debt (at JBG SMITH Share) | | | | | | | | June 30, 2022 | | June 30, 2021 | | ||
| Consolidated indebtedness (3) | | | | | | | | $ | 2,000,762 | | $ | 1,979,494 | |
| Unconsolidated indebtedness (3) | | | | | | | | | 279,534 | | | 399,262 | |
| Total consolidated and unconsolidated indebtedness | | | | | | | | | 2,280,296 | | | 2,378,756 | |
| Less: cash and cash equivalents | | | | | | | | | 181,882 | | | 217,543 | |
| Net Debt (at JBG SMITH Share) | | | | | | | | $ | 2,098,414 | | $ | 2,161,213 | |
Note: All EBITDA measures as shown above are attributable to OP Units.
| (1) | See page 55 for the components of Transaction and Other Costs. For the six months ended June 30, 2022 and 2021 excludes $34,000 and $1.1 million of transaction costs attributable to noncontrolling interests. |
| (2) | Calculated using the Net Debt below. Quarterly Adjusted EBITDA is annualized by multiplying by four. Adjusted EBITDA for the six months ended June 30, 2022 and 2021 is annualized by multiplying by two. Net Debt to annualized Adjusted EBITDA would have been 7.6x and 8.0x for the three and six months ended June 30, 2022, after including net proceeds from the sales and recapitalizations that are held in escrow at a qualified intermediary to facilitate a potential like-kind exchange and removing the Adjusted EBITDA generated during the quarter from assets that were sold or recapitalized. |
| (3) | Net of premium/discount and deferred financing costs. |
| | |
| | Page 15 |
| |
FFO, CORE FFO AND FAD RECONCILIATIONS (NON-GAAP) | JUNE 30, 2022 |
| | | | | | | | | | | | | | |
| in thousands, except per share data | | Three Months Ended June 30, | | Six Months Ended June 30, | | ||||||||
| |
| 2022 |
| 2021 | | 2022 |
| 2021 | | ||||
| | | | | | | | | | | | | |
|
| FFO and Core FFO | | | | | | | | | | | | | |
| Net income (loss) attributable to common shareholders | | $ | 123,275 |
| $ | (2,973) | | $ | 123,243 |
| $ | (23,704) | |
| Net income (loss) attributable to redeemable noncontrolling interests | |
| 18,248 |
| | (345) | |
| 18,258 |
| | (2,575) | |
| Net loss attributable to noncontrolling interests | |
| (29) |
| | — | |
| (84) |
| | (1,108) | |
| Net income (loss) | |
| 141,494 |
| | (3,318) | |
| 141,417 |
| | (27,387) | |
| Gain on the sale of real estate, net of tax | |
| (155,642) |
| | (11,290) | |
| (155,506) |
| | (11,290) | |
| Gain on the sale of unconsolidated real estate assets | |
| (936) |
| | (5,189) | |
| (6,179) |
| | (5,189) | |
| Real estate depreciation and amortization | |
| 47,242 |
| | 54,475 | |
| 102,759 |
| | 116,975 | |
| Pro rata share of real estate depreciation and amortization from unconsolidated real estate ventures | |
| 6,416 |
| | 7,277 | |
| 13,286 |
| | 14,588 | |
| FFO attributable to noncontrolling interests | |
| (47) |
| | (41) | |
| (73) |
| | 1,030 | |
| FFO Attributable to OP Units | | $ | 38,527 |
| $ | 41,914 | | $ | 95,704 |
| $ | 88,727 | |
| FFO attributable to redeemable noncontrolling interests | |
| (4,966) |
| | (4,054) | |
| (10,843) |
| | (8,539) | |
| FFO Attributable to Common Shareholders | | $ | 33,561 |
| $ | 37,860 | | $ | 84,861 |
| $ | 80,188 | |
| | | | | | | | | | | | | | |
| FFO attributable to OP Units | | $ | 38,527 |
| $ | 41,914 | | $ | 95,704 |
| $ | 88,727 | |
| Transaction and Other Costs, net of tax (1) | |
| 1,892 |
| | 2,241 | |
| 2,735 |
| | 4,793 | |
| Income from investments, net | | | (957) |
| | — | |
| (11,495) |
| | — | |
| (Gain) loss from mark-to-market on derivative instruments | |
| (2,027) |
| | 46 | |
| (5,394) |
| | (87) | |
| Loss on the extinguishment of debt | |
| 1,038 |
| | — | |
| 1,629 |
| | — | |
| Earnings and distributions in excess of our investment in unconsolidated real estate venture | |
| (124) |
| | (92) | |
| (565) |
| | (422) | |
| Share-based compensation related to Formation Transaction and special equity awards | |
| 1,577 |
| | 4,441 | |
| 3,821 |
| | 9,386 | |
| Amortization of management contracts intangible, net of tax | |
| 1,106 |
| | 1,073 | |
| 2,211 |
| | 2,145 | |
| Unconsolidated real estate ventures allocated share of above adjustments | |
| 1,593 |
| | 6 | |
| 1,545 |
| | (4) | |
| Core FFO Attributable to OP Units | | $ | 42,625 |
| $ | 49,629 | | $ | 90,191 |
| $ | 104,538 | |
| Core FFO attributable to redeemable noncontrolling interests | |
| (5,494) |
| | (4,800) | |
| (10,383) |
| | (10,060) | |
| Core FFO Attributable to Common Shareholders | | $ | 37,131 |
| $ | 44,829 | | $ | 79,808 |
| $ | 94,478 | |
| FFO per common share - diluted | | $ | 0.28 |
| | 0.29 | | $ | 0.68 |
| | 0.61 | |
| Core FFO per common share - diluted | | $ | 0.31 |
| | 0.34 | | $ | 0.64 |
| | 0.72 | |
| Weighted average shares - diluted (FFO and Core FFO) | |
| 121,327 |
| | 131,485 | |
| 123,990 |
| | 131,513 | |
See footnotes on page 17.
| | |
| | Page 16 |
| |
FFO, CORE FFO AND FAD RECONCILIATIONS (NON-GAAP) | JUNE 30, 2022 |
| | | | | | | | | | | | | | |
| in thousands, except per share data | | Three Months Ended June 30, | | Six Months Ended June 30, |
| ||||||||
| | | 2022 | | 2021 | | 2022 | | 2021 | | ||||
| | | | | | | | | | | | | | |
| FAD | | | | | | | | | | | | | |
| Core FFO attributable to OP Units |
| $ | 42,625 |
| $ | 49,629 | | $ | 90,191 |
| $ | 104,538 | |
| Recurring capital expenditures and Second-generation tenant improvements and leasing commissions (2) | |
| (13,300) | |
| (12,226) | |
| (27,002) | |
| (22,657) | |
| Straight-line and other rent adjustments (3) | |
| (1,978) | |
| (4,088) | |
| (3,769) | |
| (8,853) | |
| Third-party lease liability assumption payments | |
| (25) | |
| (703) | |
| (25) | |
| (1,381) | |
| Share-based compensation expense | |
| 10,171 | |
| 9,045 | |
| 20,664 | |
| 17,115 | |
| Amortization of debt issuance costs | |
| 1,135 | |
| 1,096 | |
| 2,311 | |
| 2,201 | |
| Unconsolidated real estate ventures allocated share of above adjustments | |
| (289) | |
| (1,333) | |
| (937) | |
| (2,659) | |
| Non-real estate depreciation and amortization | |
| 760 | |
| 727 | |
| 1,828 | |
| 1,477 | |
| FAD available to OP Units (A) | | $ | 39,099 | | $ | 42,147 | | $ | 83,261 | | $ | 89,781 | |
| Distributions to common shareholders and unitholders (B) | | $ | 31,768 | | $ | 33,511 | | $ | 64,371 | | $ | 68,946 | |
| FAD Payout Ratio (B÷A) (4) | |
| 81.3 | % |
| 79.5 | % |
| 77.3 | % |
| 76.8 | % |
| | | | | | | | | | | | | | |
| Capital Expenditures | | | | | | | | | | | | | |
| Maintenance and recurring capital expenditures | | $ | 6,091 | | $ | 4,376 | | $ | 10,911 | | $ | 8,302 | |
| Share of maintenance and recurring capital expenditures from unconsolidated real estate ventures | |
| 312 | |
| 324 | |
| 394 | |
| 371 | |
| Second-generation tenant improvements and leasing commissions | |
| 6,713 | |
| 7,454 | |
| 15,307 | |
| 13,518 | |
| Share of Second-generation tenant improvements and leasing commissions from unconsolidated real estate ventures | |
| 184 | |
| 72 | |
| 390 | |
| 466 | |
| Recurring capital expenditures and Second-generation tenant improvements and leasing commissions | |
| 13,300 | |
| 12,226 | |
| 27,002 | |
| 22,657 | |
| Non-recurring capital expenditures | |
| 13,552 | |
| 4,352 | |
| 26,362 | |
| 7,188 | |
| Share of non-recurring capital expenditures from unconsolidated real estate ventures | |
| 37 | |
| 56 | |
| 49 | |
| 107 | |
| First-generation tenant improvements and leasing commissions | |
| 4,197 | |
| 1,703 | |
| 8,647 | |
| 2,538 | |
| Share of First-generation tenant improvements and leasing commissions from unconsolidated real estate ventures | |
| 244 | |
| 199 | |
| 717 | |
| 1,391 | |
| Non-recurring capital expenditures | |
| 18,030 | |
| 6,310 | |
| 35,775 | |
| 11,224 | |
| Total JBG SMITH Share of Capital Expenditures | | $ | 31,330 | | $ | 18,536 | | $ | 62,777 | | $ | 33,881 | |
| (1) | See page 55 for the components of Transaction and Other Costs. For the six months ended June 30, 2022 and 2021, excludes $34,000 and $1.1 million of transaction costs attributable to noncontrolling interests. |
| (2) | Includes amounts, at JBG SMITH Share, related to unconsolidated real estate ventures. |
| (3) | Includes straight-line rent, above/below market lease amortization and lease incentive amortization. |
| (4) | The quarterly FAD payout ratio is not necessarily indicative of an amount for the full year due to fluctuation in the timing of capital expenditures, the commencement of new leases and the seasonality of our operations. |
| | |
| | Page 17 |
| |
THIRD-PARTY ASSET MANAGEMENT AND REAL ESTATE SERVICES BUSINESS (NON-GAAP) | JUNE 30, 2022 |
Third-Party Asset Mgmt and Real Estate Services Business
| | | | | | | | | | | | | | |
| in thousands, at JBG SMITH Share | | Three Months Ended June 30, 2022 |
| ||||||||||
| | | Source of Revenue | | | |
| |||||||
| | | Third-Party | | JBG SMITH | | JBG Legacy | | | |
| |||
| | | Management | | JV Partner (1) | | Funds | | Total |
| ||||
| | | | | | | | | | | | | | |
| Service Revenue | | | | | | | | | | | | | |
| Property management fees |
| $ | 2,669 |
| $ | 1,253 |
| $ | 619 |
| $ | 4,541 | |
| Asset management fees | |
| — | |
| 392 | |
| 1,073 | |
| 1,465 | |
| Development fees | |
| 3,280 | |
| 236 | |
| 70 | |
| 3,586 | |
| Leasing fees | |
| 776 | |
| 177 | |
| 85 | |
| 1,038 | |
| Construction management fees | |
| 29 | |
| 7 | |
| — | |
| 36 | |
| Other service revenue | |
| 554 | |
| 566 | |
| 148 | |
| 1,268 | |
| Total Revenue (2) | | $ | 7,308 | | $ | 2,631 | | $ | 1,995 | | $ | 11,934 | |
| Pro rata adjusted general and administrative expense: third-party real estate services (3) | |
| | |
|
| |
|
| |
| (12,000) | |
| Total Services Revenue Less Allocated General and Administrative Expenses (4) | | | | |
| | |
| | | $ | (66) | |
| (1) | Service revenues from joint ventures are calculated on an asset-by-asset basis by applying our real estate venture partners' respective economic interests to the fees we earned from each consolidated and unconsolidated real estate venture. |
| (2) | Included in "Third-party real estate services, including reimbursements" in our consolidated statement of operations are $10.9 million of reimbursement revenue and $0.7 million of service revenue from our economic interest in consolidated and unconsolidated real estate ventures that are excluded from this table. |
| (3) | Our personnel perform services for wholly owned properties and properties we manage on behalf of third parties, real estate ventures and JBG Legacy Funds. |
We allocate personnel and other costs to wholly owned properties (included in "Property operating expenses" and "General and administrative expense: corporate and other" in our consolidated statement of operations) and to properties owned by the third parties, real estate ventures and JBG Legacy Funds (included in "General and administrative expense: third-party real estate services" in our consolidated statement of operations) using estimates of the time spent performing services related to properties in the respective portfolios and other allocation methodologies.
Allocated general and administrative expenses related to real estate ventures are calculated on an asset-by-asset basis by applying our real estate venture partners' respective economic interests to the total general and administrative expenses allocated to each asset. See "Pro Rata Adjusted General and Administrative Expenses" on the next page for a reconciliation of "General and administrative expenses: third-party real estate services" to "Pro Rata Adjusted General and Administrative Expenses."
| (4) | Services revenue, excluding reimbursement revenue and service revenue from our economic interest in consolidated and unconsolidated real estate ventures, less allocated general and administrative expenses. Management uses this measure as a supplemental performance measure for its third-party asset management and real estate services business and believes it provides useful information to investors because it reflects only those revenue and expense items incurred by us and can be used to assess the profitability of the third-party asset management and real estate services business. |
| | |
| | Page 18 |
| |
PRO RATA ADJUSTED GENERAL AND ADMINISTRATIVE EXPENSES | JUNE 30, 2022 |
| | | | | | | | | | | | | | | | | |
| in thousands | | Three Months Ended June 30, 2022 |
| |||||||||||||
| | | | | | Adjustments (1) | | | |
| |||||||
| | | Per Statement | | | | | | | | | | | Pro Rata |
| ||
| | | of Operations | | A | | B | | C | | Adjusted |
| |||||
| | | | | | | | | | | | | | | | | |
| General and Administrative Expenses | | | | | | | | | | | | | | | | |
| Corporate and other |
| $ | 14,782 |
| $ | — |
| $ | — |
| $ | 1,197 |
| $ | 15,979 | |
| Third-party real estate services | |
| 24,143 | |
| — | |
| (10,946) | |
| (1,197) | |
| 12,000 | |
| Share-based compensation related to Formation Transaction and special equity awards | |
| 1,577 | |
| (1,577) | |
| — | |
| — | |
| — | |
| | | | | | | | | | | | | | | | | |
| Total | | $ | 40,502 | | $ | (1,577) | | $ | (10,946) | | $ | — | | $ | 27,979 | |
| (1) | Adjustments: |
A - Removes share-based compensation related to the Formation Transaction and special equity awards.
B - Removes $10.9 million of general and administrative expenses reimbursed by third-party owners of real estate we manage related to revenue which has been excluded from Service Revenue on page 18. Revenue from reimbursements is included in "Third-party real estate services, including reimbursements" in our consolidated statement of operations.
C - Reflects an adjustment to allocate our share of general and administrative expenses of unconsolidated real estate ventures from "Third-party real estate services" to "Corporate and other" and our consolidated real estate venture partners' share of general and administrative expenses from "Corporate and other" to "Third-party real estate services."
| | |
| | Page 19 |
| |
OPERATING ASSETS | JUNE 30, 2022 |
| | | | | | | | | | | | | | | | | | | | |
| dollars in thousands, at JBG SMITH Share |
| |
| | | |
| | |
| Plus: Signed |
| Plus: Incremental |
| | |
| ||
| | | | | | Q2 2022 | | | | | But Not Yet | | NOI from Assets | | Adjusted |
| ||||
| | | | | | Operating | | Annualized | | Commenced | | in Initial | | Annualized |
| |||||
| | | % Occupied | | | Portfolio NOI | | NOI | | Leases | | Lease-up (1) | | NOI |
| |||||
| | | | | | | | | | | | | | | | | | | | |
| Commercial (2) | | | | | | | | | | | | | | | | | | | |
| National Landing | | 87.1 | % | | $ | 44,664 | | $ | 174,777 | | $ | 5,264 | | $ | 332 | | $ | 180,373 | |
| Other VA | | 95.4 | % | | | 3,024 | | | 12,096 | | | 112 | | | - | | | 12,208 | |
| DC |
| 70.3 | % | | | 5,112 | | | 20,448 | | | 5,080 | | | — | | | 25,528 | |
| MD |
| 93.2 | % | |
| 4,637 | |
| 18,548 | |
| 364 | |
| 1,604 | |
| 20,516 | |
| Total / weighted average |
| 86.1 | % | | $ | 57,437 | | $ | 225,869 | | $ | 10,820 | | $ | 1,936 | | $ | 238,625 | |
| | | | | | | | | | | | | | | | | | | | |
| Multifamily (3) |
|
| | |
|
| |
|
| |
|
| |
|
| |
|
| |
| National Landing |
| 95.5 | % | | $ | 10,984 | | $ | 43,936 | | $ | — | | $ | — | | $ | 43,936 | |
| DC |
| 90.3 | % | | | 14,688 | | | 58,752 | | | 1,216 | | | 2,225 | | | 62,193 | |
| MD |
| 87.7 | % | |
| 1,666 | |
| 6,664 | |
| 32 | |
| 2,069 | |
| 8,765 | |
| Total / weighted average |
| 92.3 | % | | $ | 27,338 | | $ | 109,352 | | $ | 1,248 | | $ | 4,294 | | $ | 114,894 | |
| | | | | | | | | | | | | | | | | | | | |
| Ground Leases and Other (4) |
|
| | |
|
| |
|
| |
|
| |
|
| |
|
| |
| Other VA | | — | | | $ | (23) | | $ | (92) | | $ | — | | $ | — | | $ | (92) | |
| DC | | — | | | | 491 | | | 1,964 | | | — | | | — | | | 1,964 | |
| | | — | | | $ | 468 | | $ | 1,872 | | $ | — | | $ | — | | $ | 1,872 | |
| | | | | | | | | | | | | | | | | | | | |
| Total / Weighted Average |
| 88.4 | % | | $ | 85,243 | | $ | 337,093 | | $ | 12,068 | | $ | 6,230 | | $ | 355,391 | |
| (1) | Incremental revenue from commercial assets represents the burn-off of Free Rent and is calculated as Free Rent incurred at assets in their initial lease-up for the three months ended June 30, 2022 multiplied by four. Incremental revenue from multifamily assets in their initial lease-up is calculated as the product of units available for occupancy up to 95.0% occupancy and the weighted average monthly in-place rent per unit as of June 30, 2022, multiplied by 12, and assumes no rent growth. Excludes potential revenue from vacant retail space in multifamily assets in their initial lease-up. Average in-place rents were 10.9% below asking rents as of June 30, 2022. See page 39 for more detail. |
| (2) | Crystal City Marriott is excluded from the Percent Occupied metric. |
| (3) | 2221 S. Clark Street - Residential and 900 W Street are excluded from the Percent Occupied metric. |
| (4) | 1700 M Street and 1831/1861 Wiehle Avenue (for which we are the ground lessor) are excluded from the Percent Occupied metric. |
| | |
| | Page 20 |
| |
SUMMARY & SAME STORE NOI (NON-GAAP) | JUNE 30, 2022 |
| | | | | | | | | | | | | | | | | | | | |
| dollars in thousands | | | | 100% Share | | At JBG SMITH Share | | ||||||||||||
| | | | | | | | | | | | | NOI for the Three Months Ended June 30, |
| ||||||
| | | Number of | | Square Feet/ | | Square Feet/ | | % | | % | | | | | | | | | |
| | | Assets | | Units | | Units | | Leased (1) | | Occupied (1) | | 2022 | | 2021 | | % Change | | ||
| Same Store (2) | | | | | | | | | | | | | | | | | | | |
| National Landing | | 27 | | 7,337,206 SF/ | | 7,061,402 SF/ | | 90.0 | % | 89.3 | % | $ | 52,399 | | $ | 45,346 | | 15.6 | % |
| Other VA | | 4 | | 1,057,388 SF | | 398,972 SF | | 94.5 | % | 95.4 | % | | 5,413 | | | 6,507 | | (16.8) | % |
| DC |
| 17 |
| 1,629,309 SF/ |
| 913,383 SF/ |
| 90.4 | % | 83.7 | % | | 15,633 |
| | 13,435 |
| 16.4 | % |
| MD |
| 4 |
| 513,430 SF/ |
| 513,430 SF/ |
| 95.9 | % | 95.0 | % |
| 5,883 | |
| 4,433 |
| 32.7 | % |
| Total / weighted average |
| 52 |
| 10,537,333 SF/ |
| 8,887,187 SF/ |
| 90.6 | % | 88.7 | % | $ | 79,328 | | $ | 69,721 |
| 13.8 | % |
| | | | | | | | | | | | | | | | | | | | |
| Non-Same Store |
|
|
| |
| |
|
|
|
| |
|
| |
|
|
|
| |
| National Landing |
| — |
| — |
| — |
| — | | — | | $ | — | | $ | — |
| — | |
| Other VA | | 1 | | — | | — | | — | | — | | | 837 | | | 4,986 | | (83.2) | % |
| DC |
| 2 |
| 865 Units |
| 848 Units |
| 93.9 | % | 90.0 | % | | 4,658 | | | 6,761 |
| (31.1) | % |
| MD |
| 1 |
| 322 Units |
| 161 Units |
| 71.5 | % | 60.6 | % |
| 420 | |
| 1,511 |
| (72.2) | % |
| Total / weighted average |
| 4 |
| 1,187 Units |
| 1,009 Units |
| 88.8 | % | 83.2 | % | $ | 5,915 | | $ | 13,258 |
| (55.4) | % |
| | | | | | | | | | | | | | | | | | | | |
| Total Operating Portfolio |
|
|
| |
| |
|
|
|
| |
|
| |
|
|
|
| |
| National Landing | | 27 | | 7,337,206 SF/ | | 7,061,402 SF/ | | 90.0 | % | 89.3 | % | $ | 52,399 | | $ | 45,346 | | 15.6 | % |
| Other VA | | 5 | | 1,057,388 SF | | 398,972 SF | | 94.5 | % | 95.4 | % | | 6,250 | | | 11,493 | | (45.6) | % |
| DC |
| 19 |
| 1,629,309 SF/ |
| 913,383 SF/ |
| 91.0 | % | 84.9 | % | | 20,291 | | | 20,196 |
| 0.5 | % |
| MD |
| 5 |
| 513,430 SF/ |
| 513,430 SF/ |
| 91.6 | % | 89.1 | % |
| 6,303 | |
| 5,944 |
| 6.0 | % |
| Operating Portfolio - |
| 56 |
| 10,537,333 SF/ |
| 8,887,187 SF/ |
| 90.5 | % | 88.4 | % | $ | 85,243 | | $ | 82,979 |
| 2.7 | % |
| (1) | Crystal City Marriott, 2221 S. Clark Street - Residential, 900 W Street, and assets for which we are the ground lessor (1700 M Street and 1831/1861 Wiehle Avenue) are excluded from the Percent Leased and Percent Occupied metrics. |
| (2) | Same Store refers to the pool of assets that were In-Service for the entirety of both periods being compared, which excludes assets for which significant redevelopment, renovation, or repositioning occurred during either of the periods being compared. |
| | |
| | Page 21 |
| |
SUMMARY & SAME STORE NOI (NON-GAAP) | JUNE 30, 2022 |
| | | | | | | | | | | | | | | | | | | | |
| dollars in thousands | | | | 100% Share | | At JBG SMITH Share | | ||||||||||||
| | | | | | | | | | | | | NOI for the Six Months Ended June 30, |
| ||||||
| | | Number of | | Square Feet/ | | Square Feet/ | | % | | % | | | | | | | | | |
| | | Assets | | Units | | Units | | Leased (1) | | Occupied (1) | | 2022 | | 2021 | | % Change | | ||
| Same Store (2) | | | | | | | | | | | | | | | | | | | |
| National Landing | | 27 | | 7,337,206 SF/ | | 7,061,402 SF/ | | 90.0 | % | 89.3 | % | $ | 102,284 | | $ | 90,820 | | 12.6 | % |
| Other VA | | 4 | | 1,057,388 SF | | 398,972 SF | | 94.5 | % | 95.4 | % | | 11,590 | | | 12,728 | | (8.9) | % |
| DC |
| 17 |
| 1,629,309 SF/ |
| 913,383 SF/ |
| 90.4 | % | 83.7 | % | | 30,776 |
| | 24,795 |
| 24.1 | % |
| MD |
| 4 |
| 513,430 SF/ |
| 513,430 SF/ |
| 95.9 | % | 95.0 | % |
| 10,766 | |
| 8,135 |
| 32.3 | % |
| Total / weighted average |
| 52 |
| 10,537,333 SF/ |
| 8,887,187 SF/ |
| 90.6 | % | 88.7 | % | $ | 155,416 | | $ | 136,478 |
| 13.9 | % |
| | | | | | | | | | | | | | | | | | | | |
| Non-Same Store |
|
|
| |
| |
|
|
|
| |
|
| |
|
|
|
| |
| National Landing |
| — |
| — |
| — |
| — | | — | | $ | — | | $ | — |
| — | |
| Other VA | | 1 | | — | | — | | — | | — | | | 7,338 | | | 10,282 | | (28.6) | % |
| DC |
| 2 |
| 865 Units |
| 848 Units |
| 93.9 | % | 90.0 | % | | 13,249 | | | 14,132 |
| (6.2) | % |
| MD |
| 1 |
| 322 Units |
| 161 Units |
| 71.5 | % | 60.6 | % |
| 1,565 | |
| 2,812 |
| (44.3) | % |
| Total / weighted average |
| 4 |
| 1,187 Units |
| 1,009 Units |
| 88.8 | % | 83.2 | % | $ | 22,152 | | $ | 27,226 |
| (18.6) | % |
| | | | | | | | | | | | | | | | | | | | |
| Total Operating Portfolio |
|
|
| |
| |
|
|
|
| |
|
| |
|
|
|
| |
| National Landing | | 27 | | 7,337,206 SF/ | | 7,061,402 SF/ | | 90.0 | % | 89.3 | % | $ | 102,284 | | $ | 90,820 | | 12.6 | % |
| Other VA | | 5 | | 1,057,388 SF | | 398,972 SF | | 94.5 | % | 95.4 | % | | 18,928 | | | 23,010 | | (17.7) | % |
| DC |
| 19 |
| 1,629,309 SF/ |
| 913,383 SF/ |
| 91.0 | % | 84.9 | % | | 44,025 | | | 38,927 |
| 13.1 | % |
| MD |
| 5 |
| 513,430 SF/ |
| 513,430 SF/ |
| 91.6 | % | 89.1 | % |
| 12,331 | |
| 10,947 |
| 12.6 | % |
| Operating Portfolio - |
| 56 |
| 10,537,333 SF/ |
| 8,887,187 SF/ |
| 90.5 | % | 88.4 | % | $ | 177,568 | | $ | 163,704 |
| 8.5 | % |
| | |
| | Page 22 |
| |
SUMMARY NOI (NON-GAAP) | JUNE 30, 2022 |
| | | | | | | | | | | | | | | | | | | | |
| dollars in thousands | | NOI for the Three Months Ended June 30, 2022 at JBG SMITH Share |
| ||||||||||||||||
| | | Consolidated | | Unconsolidated | | Commercial | | Multifamily | | Ground Leases and Other (9) | | Total |
| ||||||
| Number of operating assets |
| | 44 |
| | 12 |
| | 35 |
| | 19 |
| | 2 |
| | 56 | |
| Property rental (1) | | $ | 104,448 | | $ | 12,480 | | $ | 75,208 | | $ | 41,220 | | $ | 500 | | $ | 116,928 | |
| Tenant expense reimbursement |
|
| 6,509 |
|
| 895 |
|
| 6,258 |
|
| 1,037 |
|
| 109 |
|
| 7,404 | |
| Other revenue (2) | |
| 11,395 | |
| 1,807 | |
| 8,852 | |
| 4,350 | |
| — | |
| 13,202 | |
| Total revenue | |
| 122,352 | |
| 15,182 | |
| 90,318 | |
| 46,607 | |
| 609 | |
| 137,534 | |
| | | | | | | | | | | | | | | | | | | | |
| Operating expenses | |
| (45,365) | |
| (6,641) | |
| (32,596) | |
| (19,269) | |
| (141) | |
| (52,006) | |
| Ground rent expense | |
| (259) | |
| (26) | |
| (285) | |
| — | |
| — | |
| (285) | |
| Total expenses | |
| (45,624) | |
| (6,667) | |
| (32,881) | |
| (19,269) | |
| (141) | |
| (52,291) | |
| | | | | | | | | | | | | | | | | | | | |
| Operating Portfolio NOI (3) | | $ | 76,728 | | $ | 8,515 | | $ | 57,437 | | $ | 27,338 | | $ | 468 | | $ | 85,243 | |
| | | | | | | | | | | | | | | | | | | | |
| Annualized NOI (4) | | $ | 303,033 | | $ | 34,060 | | $ | 225,869 | | $ | 109,352 | | $ | 1,872 | | $ | 337,093 | |
| Additional Information | |
|
| |
|
| |
|
| |
|
| |
|
| |
|
| |
| Free Rent (at 100% share) | | $ | 4,355 | | $ | 1,753 | | $ | 4,825 | | $ | 1,283 | | $ | — | | $ | 6,108 | |
| Free Rent (at JBG SMITH Share) | | $ | 4,351 | | $ | 678 | | $ | 4,027 | | $ | 1,002 | | $ | — | | $ | 5,029 | |
| Annualized Free Rent (at JBG SMITH Share) (5) | | $ | 17,404 | | $ | 2,712 | | $ | 16,108 | | $ | 4,008 | | $ | — | | $ | 20,116 | |
| Payments associated with assumed lease liabilities (at 100% share) | | $ | 25 | | $ | — | | $ | 25 | | $ | — | | $ | — | | $ | 25 | |
| Payments associated with assumed lease liabilities (at JBG SMITH Share) | | $ | 25 | | $ | — | | $ | 25 | | $ | — | | $ | — | | $ | 25 | |
| Annualized payments associated with assumed lease liabilities (at JBG SMITH Share) (6) | | $ | 100 | | $ | — | | $ | 100 | | $ | — | | $ | — | | $ | 100 | |
| % occupied (at JBG SMITH Share) (7) | |
| 89.0 | % |
| 82.1 | % |
| 86.1 | % |
| 92.3 | % |
| — | |
| 88.4 | % |
| Annualized base rent of signed leases, not commenced (at 100% share) (8) | | $ | 11,652 | | $ | 1,396 | | $ | 11,768 | | $ | 1,280 | | $ | — | | $ | 13,048 | |
| Annualized base rent of signed leases, not commenced (at JBG SMITH Share) (8) | | $ | 11,652 | | $ | 416 | | $ | 10,820 | | $ | 1,248 | | $ | — | | $ | 12,068 | |
| (1) | Property rental revenue excludes straight-line rent adjustments and other GAAP adjustments, and includes payments associated with assumed lease liabilities. |
| (2) | Includes $6.4 million of parking revenue at JBG SMITH Share. |
| (3) | NOI excludes $3.9 million of related party management fees at JBG SMITH Share. See definition of NOI on page 52. |
| (4) | Annualized NOI includes $8.2 million from sold or recapitalized commercial assets and $0.1 million from sold multifamily assets. |
| (5) | Represents JBG SMITH's share of Free Rent for the three months ended June 30, 2022 multiplied by four. |
| (6) | Represents JBG SMITH's share of payments associated with assumed lease liabilities for the three months ended June 30, 2022 multiplied by four. |
| (7) | Crystal City Marriott, 2221 S. Clark Street - Residential, 900 W Street, and assets for which we are the ground lessor (1700 M Street and 1831/1861 Wiehle Avenue) are excluded from the Percent Leased and Percent Occupied metrics. |
| (8) | Represents monthly base rent before Free Rent and straight-line rent adjustments, plus estimated tenant reimbursements for the month in which the lease commences, multiplied by 12. Includes only leases for office and retail spaces for which rent had not yet commenced as of June 30, 2022. |
| (9) | Includes 1700 M Street and 1831/1861 Wiehle Avenue for which we are the ground lessor. In 2021, the 1700 M Street ground lessee commenced construction on the site and provided us with a completion guarantee. The ground rent is currently $2.0 million per annum payable in equal quarterly installments. The ground rent will increase to $4.95 million per annum upon substantial completion of the ground lessee’s construction but no later than December 4, 2023 and includes market escalations and CPI resets. The ground lease expires on December 4, 2117. In April 2022, we sold the leasehold interest in 1831/1861 Wiehle Avenue. Ground rent commenced on July 1, 2022 and is currently $500,000 per annum payable in equal monthly installments. The ground lease expires on April 29, 2121. |
| | |
| | Page 23 |
| |
SUMMARY NOI - COMMERCIAL (NON-GAAP) | JUNE 30, 2022 |
| | | | | | | | | | | | | | | | | | | | | | | |
| dollars in thousands | | NOI for the Three Months Ended June 30, 2022 at JBG SMITH Share |
| |||||||||||||||||||
| |
| Consolidated |
| Unconsolidated |
| National Landing | | Other VA | | DC |
| MD |
| Total |
| |||||||
| Number of operating assets |
| | 26 |
| | 9 |
| | 23 | | | 4 | | | 6 |
| | 2 |
| | 35 | |
| Property rental (1) | | $ | 64,969 | | $ | 10,239 | | $ | 57,825 | | $ | 4,063 | | $ | 7,040 | | $ | 6,280 | | $ | 75,208 | |
| Tenant expense reimbursement | |
| 5,399 | |
| 859 | |
| 3,696 | |
| 844 | |
| 1,484 | |
| 234 | |
| 6,258 | |
| Other revenue (2) | |
| 7,114 | |
| 1,738 | |
| 5,227 | |
| 98 | |
| 2,819 | |
| 708 | |
| 8,852 | |
| Total revenue | |
| 77,482 | |
| 12,836 | |
| 66,748 | |
| 5,005 | |
| 11,343 | |
| 7,222 | |
| 90,318 | |
| | | | | | | | | | | | | | | | | | | | | | | |
| Operating expenses | |
| (27,203) | |
| (5,393) | |
| (22,084) | |
| (1,981) | |
| (6,205) | |
| (2,326) | |
| (32,596) | |
| Ground rent expense | |
| (259) | |
| (26) | |
| — | |
| — | |
| (26) | |
| (259) | |
| (285) | |
| Total expenses | |
| (27,462) | |
| (5,419) | |
| (22,084) | |
| (1,981) | |
| (6,231) | |
| (2,585) | |
| (32,881) | |
| | | | | | | | | | | | | | | | | | | | | | | |
| Operating Portfolio NOI (3) | | $ | 50,020 | | $ | 7,417 | | $ | 44,664 | | $ | 3,024 | | $ | 5,112 | | $ | 4,637 | | $ | 57,437 | |
| | | | | | | | | | | | | | | | | | | | | | | |
| Annualized NOI (4) | | $ | 196,201 | | $ | 29,668 | | $ | 174,777 | | $ | 12,096 | | $ | 20,448 | | $ | 18,548 | | $ | 225,869 | |
| Additional Information | |
|
| |
|
| |
| | |
| | |
|
| |
|
| |
|
| |
| Free Rent (at 100% share) | | $ | 3,583 | | $ | 1,242 | | $ | 2,280 | | $ | 573 | | $ | 1,509 | | $ | 463 | | $ | 4,825 | |
| Free Rent (at JBG SMITH Share) | | $ | 3,583 | | $ | 444 | | $ | 2,197 | | $ | 417 | | $ | 950 | | $ | 463 | | $ | 4,027 | |
| Annualized Free Rent (at JBG SMITH Share) (5) | | $ | 14,332 | | $ | 1,776 | | $ | 8,788 | | $ | 1,668 | | $ | 3,800 | | $ | 1,852 | | $ | 16,108 | |
| Payments associated with assumed lease liabilities (at 100% share) | | $ | 25 | | $ | — | | $ | 25 | | $ | — | | $ | — | | $ | — | | $ | 25 | |
| Payments associated with assumed lease liabilities (at JBG SMITH Share) | | $ | 25 | | $ | — | | $ | 25 | | $ | — | | $ | — | | $ | — | | $ | 25 | |
| Annualized payments associated with assumed lease liabilities (at JBG SMITH Share) (6) | | $ | 100 | | $ | — | | $ | 100 | | $ | — | | $ | — | | $ | — | | $ | 100 | |
| % occupied (at JBG SMITH Share) (7) | |
| 86.4 | % |
| 83.0 | % |
| 87.1 | % |
| 95.4 | % | | 70.3 | % |
| 93.2 | % |
| 86.1 | % |
| Annualized base rent of signed leases, not commenced (at 100% share) (8) | | $ | 10,436 | | $ | 1,332 | | $ | 5,264 | | $ | 832 | | $ | 5,308 | | $ | 364 | | $ | 11,768 | |
| Annualized base rent of signed leases, not commenced (at JBG SMITH Share) (8) | | $ | 10,436 | | $ | 384 | | $ | 5,264 | | $ | 112 | | $ | 5,080 | | $ | 364 | | $ | 10,820 | |
| (1) | Property rental revenue excludes straight-line rent adjustments and other GAAP adjustments, and includes payments associated with assumed lease liabilities. |
| (2) | Includes $4.8 million of parking revenue at JBG SMITH Share. Parking revenue in our commercial portfolio during the quarter was approximately 74% of pre-pandemic levels of approximately $25 million annually. |
| (3) | NOI excludes $2.4 million of related party management fees at JBG SMITH Share. See definition of NOI on page 52. |
| (4) | Annualized NOI includes $8.2 million from sold or recapitalized assets. |
| (5) | Represents JBG SMITH's share of Free Rent for the three months ended June 30, 2022 multiplied by four. |
| (6) | Represents JBG SMITH's share of payments associated with assumed lease liabilities for the three months ended June 30, 2022 multiplied by four. |
| (7) | Crystal City Marriott is excluded from the Percent Occupied metric. |
| (8) | Represents monthly base rent before Free Rent and straight-line rent adjustments, plus estimated tenant reimbursements for the month in which the lease commences, multiplied by 12. Includes only leases for office and retail spaces for which rent had not yet commenced as of June 30, 2022. |
| | |
| | Page 24 |
| |
SUMMARY NOI - MULTIFAMILY (NON-GAAP) | JUNE 30, 2022 |
| | | | | | | | | | | | | | | | | | | | |
| dollars in thousands | | NOI for the Three Months Ended June 30, 2022 at JBG SMITH Share |
| ||||||||||||||||
| |
| Consolidated |
| Unconsolidated | | National Landing |
| DC |
| MD |
| Total |
| ||||||
| Number of operating assets |
| | 16 |
| | 3 | | | 4 |
| | 12 |
| | 3 |
| | 19 | |
| Property rental (1) | | $ | 38,979 | | $ | 2,241 | | $ | 16,912 | | $ | 21,546 | | $ | 2,762 | | $ | 41,220 | |
| Tenant expense reimbursement | |
| 1,001 | |
| 36 | |
| 81 | |
| 940 | |
| 16 | |
| 1,037 | |
| Other revenue (2) | |
| 4,281 | |
| 69 | |
| 1,989 | |
| 2,102 | |
| 259 | |
| 4,350 | |
| Total revenue | |
| 44,261 | |
| 2,346 | |
| 18,982 | |
| 24,588 | |
| 3,037 | |
| 46,607 | |
| | | | | | | | | | | | | | | | | | | | |
| Operating expenses | |
| (18,021) | |
| (1,248) | |
| (7,998) | |
| (9,900) | |
| (1,371) | |
| (19,269) | |
| Ground rent expense | |
| — | |
| — | |
| — | |
| — | |
| — | |
| — | |
| Total expenses | |
| (18,021) | |
| (1,248) | |
| (7,998) | |
| (9,900) | |
| (1,371) | |
| (19,269) | |
| | | | | | | | | | | | | | | | | | | | |
| Operating Portfolio NOI (3) | | $ | 26,240 | | $ | 1,098 | | $ | 10,984 | | $ | 14,688 | | $ | 1,666 | | $ | 27,338 | |
| | | | | | | | | | | | | | | | | | | | |
| Annualized NOI (4) | | $ | 104,960 | | $ | 4,392 | | $ | 43,936 | | $ | 58,752 | | $ | 6,664 | | $ | 109,352 | |
| Additional Information | |
|
| |
|
| |
|
| |
|
| |
|
| |
|
| |
| Free Rent (at 100% share) | | $ | 772 | | $ | 511 | | $ | 269 | | $ | 646 | | $ | 368 | | $ | 1,283 | |
| Free Rent (at JBG SMITH Share) | | $ | 768 | | $ | 234 | | $ | 269 | | $ | 551 | | $ | 182 | | $ | 1,002 | |
| Annualized Free Rent (at JBG SMITH Share) (5) | | $ | 3,072 | | $ | 936 | | $ | 1,076 | | $ | 2,204 | | $ | 728 | | $ | 4,008 | |
| % occupied (at JBG SMITH Share) (6) | |
| 93.1 | % |
| 80.1 | % |
| 95.5 | % |
| 90.3 | % |
| 87.7 | % |
| 92.3 | % |
| Annualized base rent of signed leases, not commenced (at 100% share) (7) | | $ | 1,216 | | $ | 64 | | $ | — | | $ | 1,216 | | $ | 64 | | $ | 1,280 | |
| Annualized base rent of signed leases, not commenced (at JBG SMITH Share) (7) | | $ | 1,216 | | $ | 32 | | $ | — | | $ | 1,216 | | $ | 32 | | $ | 1,248 | |
| (1) | Property rental revenue excludes straight-line rent adjustments and other GAAP adjustments, and includes payments associated with assumed lease liabilities. Average in-place rents were 10.9% below asking rents as of June 30, 2022. |
| (2) | Includes $1.6 million of parking revenue at JBG SMITH Share |
| (3) | NOI excludes $1.5 million of related party management fees at JBG SMITH Share. See definition of NOI on page 52. |
| (4) | Annualized NOI includes $0.1 million from sold assets. |
| (5) | Represents JBG SMITH's share of Free Rent for the three months ended June 30, 2022 multiplied by four. |
| (6) | 2221 S. Clark Street – Residential and 900 W Street are excluded from the Percent Occupied metric. |
| (7) | Represents monthly base rent before Free Rent and straight-line rent adjustments, plus estimated tenant reimbursements for the month in which the lease commences, multiplied by 12. Includes only leases for retail spaces for which rent had not yet commenced as of June 30, 2022. |
| | |
| | Page 25 |
| |
NOI RECONCILIATIONS (NON-GAAP) | JUNE 30, 2022 |
| | | | | | | | | | | | | | |
| dollars in thousands | | Three Months Ended June 30, | | Six Months Ended June 30, |
| ||||||||
| |
| 2022 |
| 2021 | | 2022 |
| 2021 | | ||||
| Net income (loss) attributable to common shareholders | | $ | 123,275 | | $ | (2,973) | | $ | 123,243 | | $ | (23,704) | |
| Add: | | |
| | |
| | |
| | |
| |
| Depreciation and amortization expense | | | 49,479 | | | 56,678 | | | 107,541 | | | 121,404 | |
| General and administrative expense: | | |
| | |
| | |
| | |
| |
| Corporate and other | | | 14,782 | | | 13,895 | | | 30,597 | | | 26,370 | |
| Third-party real estate services | | | 24,143 | | | 25,557 | | | 51,192 | | | 54,493 | |
| Share-based compensation related to Formation Transaction and special equity awards | | | 1,577 | | | 4,441 | | | 3,821 | | | 9,386 | |
| Transaction and Other Costs | | | 1,987 | | | 2,270 | | | 2,886 | | | 5,960 | |
| Interest expense | | | 16,041 | | | 16,773 | | | 32,319 | | | 33,069 | |
| Loss on the extinguishment of debt | | | 1,038 | | | — | | | 1,629 | | | — | |
| Income tax expense (benefit) | | | 2,905 | | | (5) | | | 2,434 | | | 4,310 | |
| Net income (loss) attributable to redeemable noncontrolling interests | | | 18,248 | | | (345) | | | 18,258 | | | (2,575) | |
| Net loss attributable to noncontrolling interests | | | (29) | | | — | | | (84) | | | (1,108) | |
| Less: | | |
| | |
| | |
| | |
| |
| Third-party real estate services, including reimbursements revenue | | | 22,157 | | | 26,745 | | | 46,127 | | | 64,852 | |
| Other revenue | | | 1,798 | | | 1,904 | | | 3,994 | | | 4,090 | |
| Income (loss) from unconsolidated real estate ventures, net | | | (2,107) | | | 3,953 | | | 1,038 | | | 3,010 | |
| Interest and other income (loss), net | | | 1,672 | | | (38) | | | 15,918 | | | (29) | |
| Loss on the sale of real estate | | | 158,767 | | | 11,290 | | | 158,631 | | | 11,290 | |
| Consolidated NOI | | | 71,159 | | | 72,437 | | | 148,128 | | | 144,392 | |
| NOI attributable to unconsolidated real estate ventures at our share | | | 8,321 | | | 8,109 | | | 15,268 | | | 15,613 | |
| Non-cash rent adjustments (1) | | | (1,978) | | | (4,088) | | | (3,769) | | | (8,853) | |
| Other adjustments (2) | | | 5,695 | | | 5,191 | | | 14,443 | | | 9,933 | |
| Total adjustments | | | 12,038 | | | 9,212 | | | 25,942 | | | 16,693 | |
| NOI | | $ | 83,197 | | $ | 81,649 | | $ | 174,070 | | $ | 161,085 | |
| Less: out-of-service NOI loss (3) | | | (2,046) | | | (1,329) | | | (3,498) | | | (2,619) | |
| Operating Portfolio NOI | | $ | 85,243 | | $ | 82,978 | | $ | 177,568 | | $ | 163,704 | |
| Non-Same Store NOI (4) | | | 5,915 | | | 13,257 | | | 22,152 | | | 27,226 | |
| Same Store NOI (5) | | $ | 79,328 | | $ | 69,721 | | $ | 155,416 | | $ | 136,478 | |
| | | | | | | | | | | | | | |
| Change in Same Store NOI | | | 13.8 | % | | | | | 13.9 | % | | | |
| Number of properties in Same Store pool | | | 52 | | | | | | 52 | | | | |
| (1) | Adjustment to exclude straight-line rent, above/below market lease amortization and lease incentive amortization. |
| (2) | Adjustment to include other revenue and payments associated with assumed lease liabilities related to operating properties and to exclude commercial lease termination revenue and allocated corporate general and administrative expenses to operating properties. |
| (3) | Includes the results of our Under-Construction assets, and Near-Term and Future Development Pipelines. |
| (4) | Includes the results of properties that were not In-Service for the entirety of both periods being compared and properties for which significant redevelopment, renovation or repositioning occurred during either of the periods being compared. |
| (5) | Includes the results of the assets that are owned, operated and In-Service for the entirety of both periods being compared. |
| | |
| | Page 26 |
| |
LEASING ACTIVITY - OFFICE | JUNE 30, 2022 |
| | | | | | | | | |
| square feet in thousands |
| Three Months Ended | | | Six Months Ended |
| ||
| | | June 30, 2022 | | | June 30, 2022 |
| ||
| Square feet leased: |
| | | | | |
| |
| At 100% share |
| | 365 | | | | 590 | |
| At JBG SMITH Share |
| | 326 | | | | 536 | |
| First-generation space: New | | | 28 | | | | 50 | |
| Second-generation space: New | | | 24 | | | | 95 | |
| Second-generation space: Renewal | | | 274 | | | | 391 | |
| Initial rent (1) | | $ | 40.34 | | | $ | 45.62 | |
| Straight-line rent (2) | | $ | 38.43 | | | $ | 44.34 | |
| Weighted average lease term (years) | |
| 8.0 | | |
| 7.1 | |
| Weighted average Free Rent period (months) | |
| 7.1 | | |
| 8.2 | |
| Second-generation space: | |
| | | |
| | |
| Square feet | |
| 298 | | |
| 486 | |
| Cash basis: | |
|
| | |
|
| |
| Initial rent (1) | | $ | 39.78 | | | $ | 45.60 | |
| Prior escalated rent | | $ | 47.38 | | | $ | 50.50 | |
| % change | |
| (16.0) | % | |
| (9.7) | % |
| GAAP basis: | |
|
| | |
|
| |
| Straight-line rent (2) | | $ | 37.11 | | | $ | 43.81 | |
| Prior straight-line rent | | $ | 45.64 | | | $ | 47.31 | |
| % change | |
| (18.7) | % | |
| (7.4) | % |
| Tenant improvements: | |
|
| | |
|
| |
| Per square foot | | $ | 34.12 | | | $ | 45.12 | |
| Per square foot per annum | | $ | 4.24 | | | $ | 6.31 | |
| % of initial rent | |
| 10.5 | % | |
| 13.8 | % |
| Leasing commissions: | |
|
| | |
|
| |
| Per square foot | | $ | 10.94 | | | $ | 11.77 | |
| Per square foot per annum | | $ | 1.36 | | | $ | 1.65 | |
| % of initial rent | |
| 3.4 | % | |
| 3.6 | % |
Note: At JBG SMITH Share, unless otherwise indicated. The leasing activity and related statistics are based on leases signed during the period and are not intended to coincide with the commencement of property rental revenue in accordance with GAAP. Second-generation space represents square footage that was vacant for less than nine months. Weighted average lease term is weighted by SF and weighted average Free Rent period is weighted by Annualized Rent. When we exclude non-core office assets intended for recycling, our mark-to-market in National Landing was negative 2.0% for the three months ended June 30, 2022.
| (1) | Represents the cash basis weighted average starting rent per square foot, which is generally indicative of market rents. Triple net leases are converted to a gross basis by adding estimated tenant reimbursements to monthly base rent. Most leases include Free Rent and periodic step-ups in rent which are not included in the initial cash basis rent per square foot but are included in the GAAP basis rent per square foot. |
| (2) | Represents the GAAP basis weighted average rent per square foot that is recognized over the term of the respective leases, including the effect of Free Rent and fixed step-ups in rent. |
| | |
| | Page 27 |
| |
NET EFFECTIVE RENT - OFFICE | JUNE 30, 2022 |
| | | | | | | | | | | | | | | | | | | | |
| square feet in thousands, dollars per square feet, at JBG SMITH Share | | Three Months Ended |
| ||||||||||||||||
| |
| Five Quarter |
| June 30, 2022 |
| March 31, 2022 |
| December 31, 2021 |
| September 30, 2021 |
| June 30, 2021 |
| ||||||
| Square feet |
| | 369 |
| | 326 |
| | 210 |
| | 468 |
| | 126 |
| | 715 | |
| Weighted average lease term (years) |
| | 6.1 |
| | 8.0 |
| | 5.8 |
| | 8.0 |
| | 5.4 |
| | 4.2 | |
| Initial rent (1) | | $ | 45.00 | | $ | 40.34 | | $ | 53.78 | | $ | 44.41 | | $ | 44.82 | | $ | 44.96 | |
| Base rent per annum (2) | | $ | 49.16 | | $ | 41.22 | | $ | 65.64 | | $ | 46.32 | | $ | 45.78 | | $ | 50.38 | |
| Tenant improvements per annum | |
| (5.23) | |
| (4.24) | |
| (10.80) | |
| (3.00) | |
| (4.68) | |
| (5.60) | |
| Leasing commissions per annum | |
| (1.50) | |
| (1.36) | |
| (2.27) | |
| (1.51) | |
| (0.90) | |
| (1.43) | |
| Free Rent per annum | |
| (4.67) | |
| (2.96) | |
| (7.31) | |
| (4.79) | |
| (3.60) | |
| (4.79) | |
| Net Effective Rent | | $ | 37.76 | | $ | 32.66 | | $ | 45.26 | | $ | 37.02 | | $ | 36.60 | | $ | 38.56 | |
| | | | | | | | | | | | | | | | | | | | |
| National Landing | |
|
| |
|
| |
|
| |
|
| |
|
| |
|
| |
| Square feet | |
| 250 | |
| 52 | |
| 133 | |
| 337 | |
| 89 | |
| 639 | |
| Initial rent (1) | | $ | 44.33 | | $ | 48.00 | | $ | 48.65 | | $ | 43.58 | | $ | 44.85 | | $ | 43.46 | |
| Net effective rent | | $ | 36.13 | | $ | 35.01 | | $ | 40.06 | | $ | 35.64 | | $ | 35.36 | | $ | 35.77 | |
| | | | | | | | | | | | | | | | | | | | |
| Other VA | |
|
| |
|
| |
|
| |
|
| |
|
| |
|
| |
| Square feet | |
| 45 | |
| 123 | |
| 12 | |
| 60 | |
| 16 | |
| 12 | |
| Initial rent (1) | | $ | 44.88 | | $ | 48.49 | | $ | 41.83 | | $ | 38.05 | | $ | 42.95 | | $ | 47.77 | |
| Net effective rent | | $ | 36.76 | | $ | 38.46 | | $ | 31.52 | | $ | 33.53 | | $ | 40.43 | | $ | 35.75 | |
| | | | | | | | | | | | | | | | | | | | |
| DC | |
|
| |
|
| |
|
| |
|
| |
|
| |
|
| |
| Square feet | |
| 35 | |
| 24 | |
| 66 | |
| 32 | |
| 9 | |
| 45 | |
| Initial rent (1) | | $ | 61.18 | | $ | 47.34 | | $ | 66.20 | | $ | 62.30 | | $ | 50.75 | | $ | 62.54 | |
| Net effective rent | | $ | 49.01 | | $ | 41.04 | | $ | 49.02 | | $ | 52.86 | | $ | 43.86 | | $ | 51.57 | |
| | | | | | | | | | | | | | | | | | | | |
| MD | |
|
| |
|
| |
|
| |
|
| |
|
| |
|
| |
| Square feet | |
| 39 | |
| 127 | |
| — | |
| 38 | |
| 11 | |
| 19 | |
| Initial rent (1) | | $ | 34.85 | | $ | 27.95 | | $ | — | | $ | 46.74 | | $ | 42.27 | | $ | 52.57 | |
| Net effective rent | | $ | 30.12 | | $ | 26.61 | | $ | — | | $ | 36.08 | | $ | 32.33 | | $ | 40.17 | |
Note: Leasing activity and related statistics are based on leases signed during the period and are not intended to coincide with the recognition of property rental revenue in accordance with GAAP. Weighted average lease term is weighted by SF and weighted average Free Rent period is weighted by Annualized Rent.
| (1) | Represents the cash basis weighted average starting rent per square foot, which is generally indicative of market rents. Triple net leases are converted to a gross basis by adding estimated tenant reimbursements to monthly base rent. Most leases include Free Rent and periodic step-ups in rent which are not included in the initial cash basis rent per square foot. |
| (2) | Represents the weighted average base rent before Free Rent, plus estimated tenant reimbursements recognized over the term of the respective leases, including the effect of fixed step-ups in rent, divided by SF, and divided by years of lease term. Triple net leases are converted to a gross basis by adding estimated tenant reimbursements to base rent. Tenant reimbursements are estimated by escalating tenant reimbursements as of the respective reporting period, or management's estimate thereof, by 2.75% annually through the lease expiration year. |
| | |
| | Page 28 |
| |
LEASE EXPIRATIONS | JUNE 30, 2022 |
| | | | | | | | | | | | | | | | | | | |
| | | | | At JBG SMITH Share | | |||||||||||||
| |
| |
| |
| |
| | |
| |
| | |
| Estimated |
| |
| | | | | | | | | | | | % of | | | | | Annualized |
| |
| | | | | | | % of | | Annualized | | Total | | Annualized | | Rent Per |
| |||
| | | Number | | | | Total | | Rent (1) | | Annualized | | Rent Per | | Square Foot at |
| |||
| Year of Lease Expiration | | of Leases | | Square Feet | | Square Feet | | (in thousands) | | Rent | | Square Foot (1) | | Expiration (1) (2) |
| |||
| Month-to-Month |
| 40 |
| 65,604 |
| 0.8 | % | $ | 1,048 |
| 0.3 | % | $ | 15.97 | | $ | 15.97 | |
| 2022 |
| 44 |
| 387,514 |
| 5.0 | % |
| 16,364 |
| 4.6 | % |
| 42.23 | |
| 42.28 | |
| 2023 |
| 108 |
| 896,765 |
| 11.5 | % |
| 39,406 |
| 11.2 | % |
| 43.94 | |
| 45.08 | |
| 2024 |
| 77 |
| 1,314,748 |
| 16.9 | % |
| 60,222 |
| 17.1 | % |
| 45.81 | |
| 47.06 | |
| 2025 |
| 77 |
| 823,698 |
| 10.6 | % |
| 36,899 |
| 10.4 | % |
| 44.80 | |
| 47.33 | |
| 2026 |
| 60 |
| 251,833 |
| 3.2 | % |
| 12,204 |
| 3.5 | % |
| 48.46 | |
| 52.72 | |
| 2027 |
| 43 |
| 521,470 |
| 6.7 | % |
| 24,660 |
| 7.0 | % |
| 47.29 | |
| 52.35 | |
| 2028 |
| 51 |
| 410,633 |
| 5.3 | % |
| 19,454 |
| 5.5 | % |
| 47.38 | |
| 54.86 | |
| 2029 |
| 23 |
| 143,104 |
| 1.8 | % |
| 6,736 |
| 1.9 | % |
| 47.07 | |
| 54.64 | |
| 2030 |
| 26 |
| 390,075 |
| 5.0 | % |
| 21,681 |
| 6.1 | % |
| 55.58 | |
| 67.38 | |
| Thereafter |
| 105 |
| 2,564,993 |
| 33.2 | % |
| 114,429 |
| 32.4 | % |
| 45.30 | |
| 56.42 | |
| Total / Weighted Average |
| 654 |
| 7,770,437 |
| 100.0 | % | $ | 353,103 |
| 100.0 | % | $ | 45.67 | | $ | 51.54 | |
Note: Includes all in-place leases as of June 30, 2022 for office and retail space within our operating portfolio and assuming no exercise of renewal options or early termination rights. The weighted average remaining lease term for the entire portfolio is 5.9 years.
| (1) | Annualized Rent and Annualized Rent per Square Foot exclude percentage rent and the square footage of tenants that only pay percentage rent. |
| (2) | Represents monthly base rent before Free Rent, plus tenant reimbursements, as of lease expiration multiplied by 12 and divided by SF. Triple net leases are converted to a gross basis by adding tenant reimbursements to monthly base rent. Tenant reimbursements at lease expiration are estimated by escalating tenant reimbursements as of June 30, 2022, or management’s estimate thereof, by 2.75% annually through the lease expiration year. |
| | |
| | Page 29 |
| |
SIGNED BUT NOT YET COMMENCED LEASES | JUNE 30, 2022 |
Signed But Not Yet Commenced Leases
| | | | | | | | | | | | | | | | | | | | | | | | | |
| in thousands, at JBG SMITH Share | | Total | | | | | | | | | | | | | | | | | | |
| |||
| | | | | Annualized | | | | | | | | | | | | | | | | | | | | |
| | | | | Estimated | | Estimated Rent (1) for the Quarter Ending | | |||||||||||||||||
| Assets |
| C/U (2) |
| Rent (3) |
| September 30, 2022 |
| December 31, 2022 |
| March 31, 2023 |
| June 30, 2023 |
| September 30, 2023 |
| December 31, 2023 |
| |||||||
| | | | | | | | | | | | | | | | | | | | | | | | |
|
| Commercial |
|
|
| |
|
| |
|
| |
|
| |
|
| |
|
| |
|
| |
| |
| Operating |
| C | | $ | 10,436 | | $ | 1,184 | | $ | 1,386 | | $ | 1,520 | | $ | 1,597 | | $ | 2,241 | | $ | 2,580 | |
| Operating |
| U | |
| 384 | |
| 30 | |
| 84 | |
| 84 | |
| 95 | |
| 96 | |
| 96 | |
| Total | | | | $ | 10,820 | | $ | 1,214 | | $ | 1,470 | | $ | 1,604 | | $ | 1,692 | | $ | 2,337 | | $ | 2,676 | |
| | | | | | | | | | | | | | | | | | | | | | | | | |
| Multifamily | |
| |
|
| |
|
| |
|
| |
|
| |
|
| |
|
| |
|
| |
| Operating | | C | | $ | 1,216 | | $ | 117 | | $ | 169 | | $ | 169 | | $ | 265 | | $ | 303 | | $ | 304 | |
| Operating | | U | |
| 32 | |
| — | |
| 3 | |
| 8 | |
| 8 | |
| 8 | |
| 8 | |
| Under construction | | C | |
| 436 | |
| — | |
| — | |
| — | |
| — | |
| — | |
| — | |
| Total | | | | $ | 1,684 | | $ | 117 | | $ | 172 | | $ | 177 | | $ | 273 | | $ | 311 | | $ | 312 | |
| | | | | | | | | | | | | | | | | | | | | | | | | |
| Total | | | | $ | 12,504 | | $ | 1,331 | | $ | 1,642 | | $ | 1,781 | | $ | 1,965 | | $ | 2,648 | | $ | 2,988 | |
Note: Includes only leases for office and retail spaces for which rent had not yet commenced as of June 30, 2022.
| (1) | Represents contractual monthly base rent before Free Rent, plus estimated tenant reimbursements for the month in which the lease is estimated to commence, multiplied by the applicable number of months for each quarter based on the lease's estimated commencement date. |
| (2) | "C" denotes a consolidated interest. "U" denotes an unconsolidated interest. |
| (3) | Represents contractual monthly base rent before Free Rent, plus estimated tenant reimbursements for the month in which the lease is expected to commence, multiplied by 12. |
| | |
| | Page 30 |
| |
TENANT CONCENTRATION | JUNE 30, 2022 |
| | | | | | | | | | | | | | |
dollars in thousands |
|
|
| At JBG SMITH Share |
| |||||||||
| | Tenant | | Number of Leases | | Square Feet | | % of Total Square Feet | | Annualized | | % of Total Annualized Rent |
| |
1 | | U.S. Government (GSA) | | 53 | | 2,127,926 | | 27.4 | % | $ | 86,467 | | 24.5 | % |
2 |
| Amazon | | 8 | | 1,035,347 |
| 13.3 | % | | 44,807 |
| 12.7 | % |
3 |
| Gartner, Inc | | 1 | | 174,424 |
| 2.2 | % | | 12,397 |
| 3.5 | % |
4 |
| Lockheed Martin Corporation | | 2 | | 232,598 |
| 3.0 | % | | 11,616 |
| 3.3 | % |
5 |
| Booz Allen Hamilton Inc | | 3 | | 159,610 |
| 2.1 | % | | 7,838 |
| 2.2 | % |
6 |
| Greenberg Traurig LLP | | 1 | | 101,602 |
| 1.3 | % | | 7,196 |
| 2.0 | % |
7 |
| Accenture LLP | | 2 | | 116,736 |
| 1.5 | % | | 5,987 |
| 1.7 | % |
8 |
| Public Broadcasting Service | | 1 | | 120,328 |
| 1.5 | % | | 4,737 |
| 1.3 | % |
9 |
| Evolent Health LLC | | 1 | | 90,905 |
| 1.2 | % | | 4,615 |
| 1.3 | % |
10 |
| The International Justice Mission | | 1 | | 74,833 |
| 1.0 | % | | 4,329 |
| 1.2 | % |
11 |
| Host Hotels & Resorts LP | | 1 | | 55,009 |
| 0.7 | % | | 4,127 |
| 1.2 | % |
12 |
| American Diabetes Association | | 1 | | 80,998 |
| 1.0 | % | | 3,599 |
| 1.0 | % |
13 | | Willis Towers Watson US LLC | | 1 | | 61,653 | | 0.8 | % | | 3,152 | | 0.9 | % |
14 |
| National Consumer Cooperative | | 1 | | 65,736 |
| 0.8 | % | | 3,141 |
| 0.9 | % |
15 |
| WeWork | | 1 | | 41,647 |
| 0.5 | % | | 2,909 |
| 0.8 | % |
16 |
| Management System Intl Inc | | 1 | | 50,069 |
| 0.6 | % | | 2,816 |
| 0.8 | % |
17 |
| Whole Foods Market Group Inc | | 2 | | 79,875 |
| 1.0 | % | | 2,620 |
| 0.7 | % |
18 |
| Cushman & Wakefield U.S. Inc | | 1 | | 38,008 |
| 0.5 | % | | 2,471 |
| 0.7 | % |
19 |
| The District of Columbia | | 4 | | 52,134 |
| 0.7 | % | | 2,447 |
| 0.7 | % |
20 |
| Food Marketing Institute | | 1 | | 44,196 |
| 0.6 | % | | 2,318 |
| 0.7 | % |
|
| Other (1) | | 567 | | 2,966,803 |
| 38.3 | % | | 133,514 |
| 37.9 | % |
|
| Total | | 654 | | 7,770,437 |
| 100.0 | % | $ | 353,103 |
| 100.0 | % |
Note: Includes all leases as of June 30, 2022 for which a tenant has taken occupancy for office and retail space within our operating portfolio.
| (1) | Includes JBG SMITH's lease for approximately 84,400 SF at 4747 Bethesda Avenue. |
| | |
| | Page 31 |
| |
INDUSTRY DIVERSITY | JUNE 30, 2022 |
| | | | | | | | | | | | | | |
dollars in thousands | | | | At JBG SMITH Share |
| |||||||||
|
| |
| Number of |
| |
| % of Total |
| Annualized |
| % of Total |
| |
| | Industry | | Leases | | Square Feet | | Square Feet | | Rent | | Annualized Rent |
| |
1 |
| Government |
| 61 |
| 2,187,287 |
| 28.1 | % | $ | 89,257 |
| 25.3 | % |
2 |
| Business Services |
| 90 |
| 1,842,941 |
| 23.7 | % |
| 88,010 |
| 24.9 | % |
3 |
| Government Contractors |
| 51 |
| 963,042 |
| 12.4 | % |
| 44,650 |
| 12.6 | % |
4 |
| Member Organizations |
| 41 |
| 597,261 |
| 7.7 | % |
| 29,491 |
| 8.4 | % |
5 |
| Real Estate |
| 34 |
| 330,465 |
| 4.3 | % |
| 16,393 |
| 4.6 | % |
6 |
| Health Services |
| 31 |
| 270,520 |
| 3.5 | % |
| 10,809 |
| 3.1 | % |
7 |
| Food and Beverage |
| 83 |
| 176,593 |
| 2.3 | % |
| 10,088 |
| 2.9 | % |
8 |
| Legal Services |
| 20 |
| 149,094 |
| 1.9 | % |
| 10,010 |
| 2.8 | % |
9 |
| Communications |
| 6 |
| 127,612 |
| 1.6 | % |
| 5,086 |
| 1.4 | % |
10 |
| Educational Services |
| 12 |
| 81,279 |
| 1.0 | % |
| 3,722 |
| 1.1 | % |
|
| Other |
| 225 |
| 1,044,343 |
| 13.5 | % |
| 45,587 |
| 12.9 | % |
|
| Total |
| 654 |
| 7,770,437 |
| 100.0 | % | $ | 353,103 |
| 100.0 | % |
Note: Includes all in-place leases as of June 30, 2022 for office and retail space within our operating portfolio.
| | |
| | Page 32 |
| |
PORTFOLIO SUMMARY | JUNE 30, 2022 |
| | | | | | | | | | |
| | | | | | | | | Potential |
|
| | | Number | | Rentable | | Number of | | Development |
|
| | | of Assets | | Square Feet | | Units (1) | | Density (2) |
|
| | | | | | | | | | |
| Wholly Owned |
|
|
|
|
|
|
|
| |
| Operating |
| 43 |
| 12,721,599 |
| 5,691 |
| — | |
| Under-Construction (3) |
| 2 |
| 1,214,951 |
| 1,583 |
| — | |
| Near-Term Development | | 6 | | — | | — | | 3,322,900 | |
| Future Development |
| 8 |
| — |
| — |
| 5,129,200 | |
| Total (4) |
| 59 |
| 13,936,550 |
| 7,274 |
| 8,452,100 | |
| | | | | | | | | | |
| Real Estate Ventures |
|
|
|
|
|
|
|
| |
| Operating |
| 13 |
| 3,968,099 |
| 1,668 |
| — | |
| Under-Construction | | — | | — | | — | | | |
| Near-Term Development |
| 2 |
| — |
| — |
| 419,400 | |
| Future Development |
| 8 |
| — |
| — |
| 3,670,600 | |
| Total |
| 23 |
| 3,968,099 |
| 1,668 |
| 4,090,000 | |
| | | | | | | | | | |
| Total Portfolio | | 82 |
| 17,904,649 |
| 8,942 |
| 12,542,100 | |
| | | | | | | | | | |
| Total Portfolio (at JBG SMITH Share) | | 82 |
| 15,527,539 |
| 8,079 |
| 9,806,400 | |
Note: At 100% share, unless otherwise indicated.
| (1) | For Under-Construction assets, represents estimated number of units based on current design plans. |
| (2) | Includes estimated potential office, multifamily and retail development density. |
| (3) | See footnotes (3) and (4) on page 41. |
| | |
| | Page 33 |
| |
PROPERTY TABLE - COMMERCIAL | JUNE 30, 2022 |
| | | | | | | | | | | | | | | | | | | | | | | | | | | | | | | | |
|
| |
| |
| |
| |
| |
| |
| |
| |
| |
| |
| |
| | |
| Office |
| | |
| |
| | | | | | | | | | | | | | | | | | | | | | | | | | | Annualized | | Retail |
| ||
| | | | | | | | Same Store (2): | | | | | | | | | | | | | | | | Annualized | | Rent Per | | Annualized |
| |||
| | | | % | | | Q2 2021‑2022 / | | Year Built / | | Total | | Office | | Retail | | % | | Office % | | Retail % | | Rent | | Square | | Rent Per |
| ||||
Commercial Assets | | Submarket | | Ownership | | C/U (1) | | YTD 2021 - 2022 | | Renovated | | Square Feet | | Square Feet | | Square Feet | | Leased | | Occupied | | Occupied | | (in thousands) | | Foot (3) | | Square Foot (4) |
| |||
| | | | | | | | | | | | | | | | | | | | | | | | | | | | | | | | |
National Landing |
|
|
|
|
|
|
|
|
| |
| |
| | | | | | | | | | |
| | |
| | |
| | |
1550 Crystal Drive (5) | | National Landing |
| 100.0 | % | C |
| Y / Y |
| 1980 / 2020 |
| 550,184 |
| 449,719 | | 100,465 | | 96.6% | | 96.1% | | 98.5% | | $ | 22,864 | | $ | 42.37 | | $ | 45.97 | |
2121 Crystal Drive |
| National Landing |
| 100.0 | % | C |
| Y / Y |
| 1985 / 2006 |
| 505,349 |
| 505,349 | | — | | 71.3% | | 71.3% | | — | |
| 17,239 | |
| 47.84 | |
| — | |
2345 Crystal Drive |
| National Landing |
| 100.0 | % | C |
| Y / Y |
| 1988 / 2019 |
| 499,663 |
| 491,771 | | 7,892 | | 87.3% | | 87.1% | | 100.0% | |
| 20,815 | |
| 48.32 | |
| 16.17 | |
2231 Crystal Drive |
| National Landing |
| 100.0 | % | C |
| Y / Y |
| 1987 / 2009 |
| 468,906 |
| 416,979 | | 51,927 | | 88.0% | | 86.2% | | 97.4% | |
| 17,835 | |
| 44.24 | |
| 38.17 | |
2011 Crystal Drive |
| National Landing |
| 100.0 | % | C |
| Y / Y |
| 1984 / 2006 |
| 440,996 |
| 434,234 | | 6,762 | | 58.5% | | 58.6% | | 50.3% | |
| 12,035 | |
| 46.78 | |
| 38.33 | |
2451 Crystal Drive |
| National Landing |
| 100.0 | % | C |
| Y / Y |
| 1990 / 2019 |
| 401,902 |
| 389,845 | | 12,057 | | 76.9% | | 76.4% | | 92.6% | |
| 12,779 | |
| 47.69 | |
| 39.75 | |
1235 S. Clark Street |
| National Landing |
| 100.0 | % | C |
| Y / Y |
| 1981 / 2007 |
| 384,777 |
| 336,431 | | 48,346 | | 96.9% | | 95.9% | | 97.2% | |
| 15,635 | |
| 44.95 | |
| 23.97 | |
241 18th Street S. |
| National Landing |
| 100.0 | % | C |
| Y / Y |
| 1977 / 2013 |
| 362,219 |
| 333,911 | | 28,308 | | 97.4% | | 97.5% | | 84.5% | |
| 13,787 | |
| 40.86 | |
| 19.95 | |
251 18th Street S. (5) |
| National Landing |
| 100.0 | % | C |
| Y / Y |
| 1975 / 2013 |
| 337,886 |
| 293,818 | | 44,068 | | 90.3% | | 99.0% | | 32.7% | |
| 13,478 | |
| 44.00 | |
| 47.50 | |
1215 S. Clark Street |
| National Landing |
| 100.0 | % | C |
| Y / Y |
| 1983 / 2016 |
| 336,159 |
| 333,546 | | 2,613 | | 100.0% | | 100.0% | | 100.0% | |
| 11,379 | |
| 33.84 | |
| 35.42 | |
201 12th Street S. |
| National Landing |
| 100.0 | % | C |
| Y / Y |
| 1987 / 2014 |
| 329,607 |
| 317,394 | | 12,213 | | 98.0% | | 97.9% | | 100.0% | |
| 12,235 | |
| 37.71 | |
| 42.04 | |
2200 Crystal Drive |
| National Landing |
| 100.0 | % | C |
| Y / Y |
| 1968 / 2006 |
| 283,608 |
| 283,608 | | — | | 57.0% | | 57.0% | | — | |
| 7,435 | |
| 45.99 | |
| — | |
1225 S. Clark Street |
| National Landing |
| 100.0 | % | C |
| Y / Y |
| 1982 / 2013 |
| 276,155 |
| 263,305 | | 12,850 | | 97.1% | | 94.1% | | 100.0% | |
| 10,255 | |
| 40.15 | |
| 24.12 | |
1901 South Bell Street (5) |
| National Landing |
| 100.0 | % | C |
| Y / Y |
| 1968 / 2008 |
| 274,912 |
| 274,912 | | — | | 92.1% | | 92.1% | | — | |
| 10,397 | |
| 41.05 | |
| — | |
1770 Crystal Drive | | National Landing | | 100.0 | % | C | | Y / Y | | 2020 / N/A | | 273,650 | | 259,651 | | 13,999 | | 98.4% | | 100.0% | | 68.5% | | | 11,805 | | | 43.29 | | | 59.05 | |
Crystal City Marriott (345 Rooms) (6) |
| National Landing |
| 100.0 | % | C |
| Y / Y |
| 1968 / 2019 |
| 266,000 |
| — | | — | | — | | — | | — | |
| — | |
| — | |
| — | |
2100 Crystal Drive |
| National Landing |
| 100.0 | % | C |
| Y / Y |
| 1968 / 2006 |
| 253,437 |
| 253,437 | | — | | 100.0% | | 100.0% | | — | |
| 10,785 | |
| 42.55 | |
| — | |
1800 South Bell Street |
| National Landing |
| 100.0 | % | C |
| Y / Y |
| 1969 / 2019 |
| 206,186 |
| 190,984 | | 15,202 | | 99.2% | | 100.0% | | 88.8% | | | 8,402 | | | 43.67 | | | 4.55 | |
200 12th Street S. |
| National Landing |
| 100.0 | % | C |
| Y / Y |
| 1985 / 2013 |
| 202,708 |
| 202,708 | | — | | 79.5% | | 79.5% | | — | |
| 7,734 | |
| 47.97 | |
| — | |
Crystal City Shops at 2100 (5) |
| National Landing |
| 100.0 | % | C |
| Y / Y |
| 1968 / 2006 |
| 53,174 |
| — | | 53,174 | | 81.3% | | — | | 81.3% | |
| 519 | |
| — | |
| 12.00 | |
Crystal Drive Retail (5) |
| National Landing |
| 100.0 | % | C |
| Y / Y |
| 2003 / 2004 |
| 42,938 |
| — | | 42,938 | | 100.0% | | — | | 100.0% | |
| 2,729 | |
| — | |
| 63.55 | |
2221 S. Clark Street-Office | | National Landing | | 100.0 | % | C |
| Y / Y | | 1964 / 2016 | | 35,182 | | 26,238 | | 8,944 | | — | | — | | — | | | — | | | — | | | — | |
Central Place Tower (7) | | Rosslyn | | 50.0 | % | U | | Y / Y | | 2018 / N/A | | 551,608 | | 524,330 | | 27,278 | | 99.3% | | 99.2% | | 100.0% | | | 37,226 | | | 70.00 | | | 29.79 | |
| | | | | | | | | | | | | | | | | | | | | | | | | | | | | | | | |
Other VA |
|
|
|
|
|
|
|
|
| |
| |
| | | | | | | | | | |
| | |
| | |
| | |
800 North Glebe Road |
| Ballston |
| 100.0 | % | C |
| Y / Y |
| 2012 / N/A |
| 303,644 |
| 277,397 | | 26,247 | | 98.5% | | 100.0% | | 82.3% | | $ | 15,062 | | $ | 50.59 | | $ | 47.60 | |
Stonebridge at Potomac Town |
| Prince William County |
| 10.0 | % | U |
| Y / Y |
| 2012 / N/A |
| 504,327 |
| — | | 504,327 | | 97.1% | | — | | 96.4% | |
| 15,936 | |
| — | |
| 32.79 | |
Rosslyn Gateway-North |
| Rosslyn |
| 18.0 | % | U |
| Y / Y |
| 1996 / 2014 |
| 146,068 |
| 133,314 | | 12,754 | | 63.4% | | 58.5% | | 72.3% | |
| 3,600 | |
| 42.12 | |
| 34.29 | |
Rosslyn Gateway-South |
| Rosslyn |
| 18.0 | % | U |
| Y / Y |
| 1961 / N/A |
| 103,349 |
| 95,765 | | 7,584 | | 67.4% | | 72.7% | | — | |
| 1,756 | |
| 25.22 | |
| — | |
| | |
| | Page 34 |
| |
PROPERTY TABLE - COMMERCIAL | JUNE 30, 2022 |
| | | | | | | | | | | | | | | | | | | | | | | | | | | | | | | | |
|
| |
| |
| |
| |
| |
| |
| |
| |
| |
| |
| |
| | |
| | Office |
| | |
|
| | | | | | | | | | | | | | | | | | | | | | | | | | | | Annualized | | | Retail |
|
| | | | | | | | Same Store (2): | | | | | | | | | | | | | | | | | Annualized | | | Rent Per | | | Annualized |
|
| | | | % | | | | Q2 2021‑2022 / | | Year Built / | | Total | | Office | | Retail | | % | | Office % | | Retail % | | | Rent | | | Square | | | Rent Per |
|
Commercial Assets | | Submarket | | Ownership | | C/U (1) | | YTD 2021 - 2022 | | Renovated | | Square Feet | | Square Feet | | Square Feet | | Leased | | Occupied | | Occupied | | | (in thousands) | | | Foot (3) | | | Square Foot (4) |
|
| | | | | | | | | | | | | | | | | | | | | | | | | | | | | | | | |
DC |
|
|
|
|
|
|
|
|
|
|
|
|
|
|
|
|
|
|
|
|
|
|
| |
|
| |
|
| |
| |
2101 L Street |
| CBD |
| 100.0 | % | C |
| Y / Y |
| 1975 / 2007 |
| 375,466 |
| 344,146 | | 31,320 | | 84.6% | | 63.0% | | 92.6% | | $ | 16,313 | | $ | 67.60 | | $ | 56.83 | |
L’Enfant Plaza Office-East (7) |
| Southwest |
| 49.0 | % | U |
| Y / Y |
| 1972 / 2012 |
| 399,163 |
| 399,163 | | — | | 71.1% | | 63.2% | | — | |
| 12,706 | |
| 50.34 | |
| — | |
L’Enfant Plaza Office-North |
| Southwest |
| 49.0 | % | U |
| Y / Y |
| 1969 / 2014 |
| 298,788 |
| 277,464 | | 21,324 | | 86.7% | | 85.2% | | 87.1% | |
| 11,734 | |
| 47.93 | |
| 22.07 | |
L’Enfant Plaza Retail (7) |
| Southwest |
| 49.0 | % | U |
| Y / Y |
| 1968 / 2014 |
| 119,291 |
| 16,596 | | 102,695 | | 68.5% | | 100.0% | | 63.4% | |
| 3,737 | |
| 47.91 | |
| 45.16 | |
The Foundry |
| Georgetown |
| 9.9 | % | U |
| Y / Y |
| 1973 / 2017 |
| 227,493 |
| 220,639 | | 6,854 | | 79.4% | | 78.8% | | 100.0% | |
| 9,032 | |
| 50.37 | |
| 40.72 | |
1101 17th Street |
| CBD |
| 55.0 | % | U |
| Y / Y |
| 1964 / 1999 |
| 209,108 |
| 199,354 | | 9,754 | | 87.3% | | 83.3% | | 100.0% | |
| 9,744 | |
| 54.48 | |
| 71.78 | |
| | | | | | | | | | | | | | | | | | | | | | | | | | | | | | | | |
MD |
|
|
|
|
|
|
|
|
| |
| |
| | | | | | | | | | |
| | |
| | |
| | |
4747 Bethesda Avenue (9) | | Bethesda CBD | | 100.0 | % | C | | Y / Y | | 2019 / N/A | | 300,508 | | 286,199 | | 14,309 | | 98.0% | | 97.9% | | 100.0% | | $ | 20,669 | | $ | 67.37 | | $ | 125.83 | |
One Democracy Plaza (7) (8) |
| Bethesda- Rock Spring |
| 100.0 | % | C |
| Y / Y |
| 1987 / 2013 |
| 212,922 |
| 210,784 | | 2,138 | | 86.9% | | 86.8% | | 100.0% | |
| 6,026 | |
| 32.57 | |
| 32.16 | |
| | | | | | | | | | | | | | | | | | | | | | | | | | | | | | | | |
Operating - Total / Weighted Average |
|
|
|
|
|
|
|
|
| 10,537,333 |
| 9,042,991 | | 1,228,342 | | 87.0% | | 85.3% | | 88.3% | | $ | 403,683 | | $ | 47.36 | | $ | 37.08 | | ||
| | | | | | | | | | | | | | | | | | | | | | | | | | | | | | | | |
| | | | | | | | | | | | | | | | | | | | | | | | | | | | | | | | |
Total at JBG SMITH Share |
|
|
|
|
|
|
|
|
|
|
|
|
|
|
|
|
|
|
|
|
|
|
| |
|
| |
|
| |
| |
National Landing |
|
|
|
|
|
|
|
|
|
|
| 7,061,402 |
| 6,320,005 | | 475,397 | | 87.2% | | 87.1% | | 85.8% | | $ | 258,753 | | $ | 44.66 | | $ | 35.96 | |
Other VA | | | | | | | | | | | | 398,972 | | 318,631 | | 80,341 | | 94.5% | | 95.4% | | 89.4% | | | 17,620 | | | 49.15 | | | 37.27 | |
DC | | | | | | | | | | | | 913,383 | | 815,257 | | 98,126 | | 81.2% | | 70.3% | | 77.5% | | | 36,371 | | | 57.01 | | | 48.68 | |
MD |
|
|
|
|
|
|
|
|
|
|
| 513,430 |
| 496,983 | | 16,447 | | 93.4% | | 93.2% | | 100.0% | | | 26,695 | | | 53.62 | | | 113.64 | |
Operating - Total / Weighted Average |
|
|
|
|
|
|
|
|
| 8,887,187 |
| 7,950,876 | | 670,311 | | 87.3% | | 86.1% | | 85.4% | | $ | 339,439 | | $ | 46.51 | | $ | 40.05 | | ||
| | | | | | | | | | | | | | | | | | | | | | | | | | | | | | | | |
| | |
| | Page 35 |
| |
PROPERTY TABLE - COMMERCIAL | JUNE 30, 2022 |
| | | | | | | | |
| Number of Assets and Total Square Feet Reconciliation | | | | |
| ||
| |
| Number of |
| At 100% Share |
| At JBG SMITH Share |
|
| Operating Assets | | Assets | | Square Feet | | Square Feet |
|
| Q1 2022 |
| 41 |
| 13,043,081 |
| 11,273,218 | |
| Placed into service |
| — |
| — |
| — | |
| Dispositions/recapitalizations (10) |
| (6) |
| (2,507,518) |
| (2,386,243) | |
| Out-of-service adjustment |
| — |
| — |
| — | |
| Portfolio reclassification | | — | | — | | — | |
| Building re-measurements |
| — |
| 1,770 |
| 212 | |
| | | | | | | | |
| Q2 2022 |
| 35 |
| 10,537,333 |
| 8,887,187 | |
See footnotes on page 37.
| | |
| | Page 36 |
| |
PROPERTY TABLE - COMMERCIAL | JUNE 30, 2022 |
Footnotes
Note: At 100% share, unless otherwise noted.
| (1) | "C" denotes a consolidated interest. "U" denotes an unconsolidated interest. |
| (2) | "Y" denotes an asset as Same Store and "N" denotes an asset as Non-Same Store. |
| (3) | Represents annualized office rent divided by occupied office SF; annualized retail rent and retail SF are excluded from this metric. Annualized Rent and Annualized Rent per Square Foot exclude percentage rent and the square footage of tenants that only pay percentage rent. Occupied office square footage may differ from leased office square footage because leased office square footage includes space for leases that have been signed but the tenant has not yet taken occupancy (not yet included in Percent Occupied metrics). |
| (4) | Represents annualized retail rent divided by occupied retail SF. Occupied retail square footage may differ from leased retail square footage because leased retail square footage includes space for leases that have been signed but the tenant has not yet taken occupancy (not yet included in Percent Occupied metrics). |
| (5) | The following assets contain space that is held for development or not otherwise available for lease. This out-of-service square footage is excluded from Square Feet, leased and occupancy metrics. |
| | | | | | |
| | | | | Not Available | |
| Commercial Asset |
| In-Service |
| for Lease |
|
| 1550 Crystal Drive | | 550,184 | | 1,721 | |
| 251 18th Street S. | | 337,886 | | 1,480 | |
| 1901 South Bell Street | | 274,912 | | 1,924 | |
| Crystal City Shops at 2100 | | 53,174 | | 19,041 | |
| Crystal Drive Retail | | 42,938 | | 14,027 | |
| (6) | Under the current management agreement, JBG SMITH receives 50% of the net cash flows from the hotel. Upon expiration on July 31, 2025, JBG SMITH expects to receive 100% of the cash flows. The Crystal City Marriott generated $1.9 million of Annualized NOI at JBG SMITH’s share for the three months ended June 30, 2022. The Crystal City Marriott generated $1.8 million of NOI at JBG SMITH’s share in 2019 while undergoing a rooms renovation and $3.5 million of NOI at JBG SMITH’s share in 2018 before the renovation began. |
| (7) | The following assets are subject to ground leases: |
| | | | |
| |
| Ground Lease | |
| Commercial Asset | | Expiration Date |
|
| Central Place Tower (a)(b) |
| 6/2/2102 | |
| L'Enfant Plaza Office - East |
| 11/23/2064 | |
| L'Enfant Plaza Retail |
| 11/23/2064 | |
| One Democracy Plaza |
| 11/17/2084 | |
| (a) | The ground lease is recorded as a financing lease for accounting purposes; therefore, any expense is recorded as interest expense and excluded from NOI. |
| (b) | We have an option to purchase the ground lease at a fixed price |
| (8) | Not Metro-Served. |
| (9) | Includes JBG SMITH's share for approximately 84,400 SF. |
| (10) | See "Disposition and Recapitalization Activity" on page 44. |
| | |
| | Page 37 |
| |
PROPERTY TABLE - MULTIFAMILY | JUNE 30, 2022 |
| | | | | | | | | | | | | | | | | | | | | | | | | | | | | | | | | |
|
| |
| |
| |
| |
| |
| |
| |
| |
| |
| |
| |
| |
| | |
| | |
| | |
| | | | | | | | | | | | | | | | | | | | | | | | | | | | | | Monthly | | | Monthly |
| | | | | | | | Same Store (2): | | | | Number | | Total | | Multifamily | | Retail | | | | Multifamily | | Retail | | | Annualized | | | Rent | | | Rent Per |
| | | | % | | | | Q2 2021‑2022 / | | Year Built / | | of | | Square | | Square | | Square | | | | % | | % | | | Rent | | | Per | | | Square |
Multifamily Assets | | Submarket | | Ownership | | C/U (1) | | YTD 2021 - 2022 | | Renovated | | Units | | Feet | | Feet | | Feet | | % Leased | | Occupied | | Occupied | | | (in thousands) | | | Unit (3) (4) | | | Foot (4) (5) |
| | | | | | | | | | | | | | | | | | | | | | | | | | | | | | | | | |
National Landing |
|
|
|
|
|
|
|
|
|
|
| |
| |
| |
| |
| | | | | | |
| | |
| | |
| |
RiverHouse Apartments |
| National Landing |
| 100.0 | % | C |
| Y / Y |
| 1960 / 2014 |
| 1,676 |
| 1,327,551 |
| 1,324,889 |
| 2,662 |
| 98.4% | | 95.9% | | 100.0% | | $ | 34,471 | | $ | 1,784 | | $ | 2.26 |
The Bartlett |
| National Landing |
| 100.0 | % | C |
| Y / Y |
| 2016 / N/A |
| 699 |
| 619,372 |
| 577,295 |
| 42,077 |
| 98.0% | | 94.3% | | 100.0% | |
| 22,831 | |
| 2,688 | |
| 3.26 |
220 20th Street |
| National Landing |
| 100.0 | % | C |
| Y / Y |
| 2009 / N/A |
| 265 |
| 271,476 |
| 269,913 |
| 1,563 |
| 98.9% | | 96.6% | | 100.0% | |
| 7,983 | |
| 2,581 | |
| 2.54 |
2221 S. Clark Street- |
| National Landing |
| 100.0 | % | C |
| Y / Y |
| 1964 / 2016 |
| 216 |
| 96,948 |
| 96,948 |
| — |
| 98.4% | | 96.4% | | — | |
| 5,048 | |
| 2,020 | |
| 4.50 |
| | | | | | | | | | | | | | | | | | | | | | | | | | | | | | | | | |
DC | |
|
|
|
|
|
|
|
|
|
| |
| |
| |
| |
| | | |
| |
| | |
| | |
| | |
West Half |
| Ballpark |
| 100.0 | % | C |
| Y / Y |
| 2019 / N/A |
| 465 |
| 385,368 |
| 343,089 |
| 42,279 |
| 89.1% | | 83.7% | | 84.5% | | $ | 13,415 | | $ | 2,368 | | $ | 3.38 |
Fort Totten Square |
| Brookland/Fort Totten |
| 100.0 | % | C |
| Y / Y |
| 2015 / N/A |
| 345 |
| 384,956 |
| 254,292 |
| 130,664 |
| 97.5% | | 92.2% | | 100.0% | | | 9,343 | | | 1,821 | | | 2.48 |
The Wren | | U Street/Shaw | | 96.0 | % | C | | N / N | | 2020 / N/A | | 433 | | 332,682 | | 289,686 | | 42,996 | | 92.8% | | 88.5% | | 100.0% | | | 11,486 | | | 2,221 | | | 3.28 |
The Batley | | Union Market/NoMa/H Street | | 100.0 | % | C | | N / N | | 2019 / N/A | | 432 | | 300,388 | | 300,388 | | — | | 95.1% | | 91.4% | | — | | | 11,119 | | | 2,346 | | | 3.40 |
WestEnd25 |
| West End |
| 100.0 | % | C |
| Y / Y |
| 2009 / N/A |
| 283 |
| 273,264 |
| 273,264 |
| — |
| 96.5% | | 89.0% | | — | |
| 10,274 | |
| 3,397 | |
| 3.54 |
F1RST Residences |
| Ballpark |
| 100.0 | % | C |
| Y / Y |
| 2017 / N/A |
| 325 |
| 270,928 |
| 249,456 |
| 21,472 |
| 96.3% | | 91.7% | | 100.0% | |
| 9,775 | |
| 2,300 | |
| 3.00 |
1221 Van Street |
| Ballpark |
| 100.0 | % | C |
| Y / Y |
| 2018 / N/A |
| 291 |
| 225,530 |
| 202,715 |
| 22,815 |
| 95.7% | | 93.5% | | 100.0% | |
| 8,468 | |
| 2,203 | |
| 3.18 |
901 W Street | | U Street/Shaw | | 100.0 | % | C | | Y / Y | | 2019 / N/A | | 161 | | 154,378 | | 135,499 | | 18,879 | | 94.3% | | 96.3% | | 57.9% | | | 5,386 | | | 2,528 | | | 3.05 |
900 W Street (6) | | U Street/Shaw | | 100.0 | % | C | | Y / Y | | 2019 / N/A | | 95 | | 71,050 | | 71,050 | | — | | 100.0% | | 93.7% | | — | | | 5,039 | | | 4,718 | | | 6.23 |
North End Retail |
| U Street/Shaw |
| 100.0 | % | C |
| Y / Y |
| 2015 / N/A |
| — |
| 27,355 |
| — |
| 27,355 |
| 91.6% | | — | | 85.3% | |
| 1,473 | |
| — | |
| — |
The Gale Eckington |
| Union Market/NoMa/H Street |
| 5.0 | % | U |
| Y / Y |
| 2013/ N/A |
| 603 |
| 466,716 |
| 465,516 |
| 1,200 |
| 97.7% | | 91.7% | | 100.0% | |
| 13,351 | |
| 2,005 | |
| 2.61 |
Atlantic Plumbing (7) |
| U Street/Shaw |
| 64.0 | % | U |
| Y / Y |
| 2015 / N/A |
| 310 |
| 245,527 |
| 221,788 |
| 23,739 |
| 95.5% | | 94.2% | | 80.5% | |
| 9,343 | |
| 2,442 | |
| 3.42 |
| | | | | | | | | | | | | | | | | | | | | | | | | | | | | | | | | |
MD |
|
|
|
|
|
|
|
|
|
|
| |
| |
| |
| |
| | | | | | |
| | |
| | |
| |
Falkland Chase-South & West |
| Downtown Silver Spring |
| 100.0 | % | C |
| Y / Y |
| 1938 / 2011 |
| 268 |
| 222,754 |
| 222,754 |
| — |
| 99.6% | | 97.0% | | — | | $ | 5,475 | | $ | 1,755 | | $ | 2.12 |
Falkland Chase-North |
| Downtown Silver Spring |
| 100.0 | % | C |
| Y / Y |
| 1938 / 1986 |
| 170 |
| 112,143 |
| 112,143 |
| — |
| 100.0% | | 98.8% | | — | |
| 2,869 | |
| 1,423 | |
| 2.16 |
| | | | | | | | | | | | | | | | | | | | | | | | | | | | | | | | | |
Total / Weighted Average (6) |
|
|
|
|
|
|
|
|
|
|
| 7,037 |
| 5,788,386 |
| 5,410,685 |
| 377,701 |
| 96.6% | | 93.0% | | 93.9% | | $ | 177,062 | | $ | 2,178 | | $ | 2.81 |
| | | | | | | | | | | | | | | | | | | | | | | | | | | | | | | | | |
Recently Delivered |
|
|
|
|
|
|
|
|
|
|
|
|
|
|
|
|
|
|
|
|
|
| |
| |
|
| |
|
| |
|
|
| | | | | | | | | | | | | | | | | | | | | | | | | | | | | | | | | |
MD | | | | | | | | | | | | | | | | | | | | | | | | | | | | | | | | | |
8001 Woodmont | | Bethesda CBD | | 50.0 | % | U | | N/N | | 2021 / N/A | | 322 | | 363,979 | | 344,405 | | 19,574 | | 71.5% | | 60.6% | | 95.1% | | $ | 8,295 | | $ | 3,109 | | $ | 3.09 |
| | | | | | | | | | | | | | | | | | | | | | | | | | | | | | | | | |
Operating - Total / Weighted Average (6) |
|
|
|
|
|
|
|
|
| 7,359 |
| 6,152,365 |
| 5,755,090 |
| 397,275 |
| 95.1% | | 91.5% | | 93.9% | | $ | 185,357 | | $ | 2,206 | | $ | 2.82 | ||
| | | | | | | | | | | | | | | | | | | | | | | | | | | | | | | | | |
Under-Construction |
|
|
|
|
|
|
|
|
|
|
|
|
|
|
|
|
|
|
|
|
|
|
|
| |
|
| |
|
| |
|
|
| | | | | | | | | | | | | | | | | | | | | | | | | | | | | | | | | |
National Landing |
|
|
|
|
|
|
|
|
|
|
|
|
|
|
|
|
|
| | | | | | | | | | | | | | | |
1900 Crystal Drive (8) |
| National Landing |
| — | | C |
|
|
|
|
| 808 |
| 633,985 |
| 595,315 |
| 38,670 | | | | | | | | | | | | | | | |
2000/2001 South Bell Street (8) | | National Landing | | — | | C | | | | | | 775 | | 580,966 | | 561,961 | | 19,005 | | | | | | | | | | | | | | | |
| | | | | | | | | | | | | | | | | | | | | | | | | | | | | | | | | |
Under-Construction - Total |
|
|
|
|
|
|
|
|
|
|
| 1,583 |
| 1,214,951 |
| 1,157,276 |
| 57,675 |
|
|
|
|
|
|
| |
|
| |
|
| |
|
| | | | | | | | | | | | | | | | | | | | | | | | | | | | | | | | | |
Total |
|
|
|
|
|
|
|
|
|
|
| 8,942 |
| 7,367,316 |
| 6,912,366 |
| 454,950 |
|
|
|
|
|
|
| |
|
| |
|
| |
|
| | |
| | Page 38 |
| |
PROPERTY TABLE - MULTIFAMILY | JUNE 30, 2022 |
| | | | | | | | | | | | | | | | | | | | | | | | | | | | | | | | | |
|
| |
| |
| |
| |
| |
| |
| |
| |
| |
| |
| |
| |
| | |
| | |
| | |
| | | | | | | | | | | | | | | | | | | | | | | | | | | | | Monthly | | Monthly | ||
| | | | | | | | Same Store (2): | | | | Number | | Total | | Multifamily | | Retail | | | | Multifamily | | Retail | | Annualized | | Rent | | Rent Per | |||
| | | | % | | | | Q2 2021‑2022 / | | Year Built / | | of | | Square | | Square | | Square | | | | % | | % | | Rent | | Per | | Square | |||
Multifamily Assets | | Submarket | | Ownership | | C/U (1) | | YTD 2021 - 2022 | | Renovated | | Units | | Feet | | Feet | | Feet | | % Leased | | Occupied | | Occupied | | (in thousands) | | Unit (3) (4) | | Foot (4) (5) | |||
| | | | | | | | | | | | | | | | | | | | | | | | | | | | | | | | | |
Totals at JBG SMITH Share (6) |
|
|
|
|
|
|
|
|
|
|
|
|
|
|
|
|
|
|
|
|
|
|
|
|
| |
|
| |
|
| |
|
| | | | | | | | | | | | | | | | | | | | | | | | | | | | | | | | | |
National Landing | | | | | | | | | | | | 2,856 | | 2,315,347 | | 2,269,045 | | 46,302 | | 98.3% | | 95.5% | | 100.0% | | $ | 65,285 | | $ | 2,101 | | $ | 2.56 |
DC | | | | | | | | | | | | 3,041 | | 2,593,167 | | 2,273,161 | | 320,006 | | 94.6% | | 90.3% | | 93.3% | | | 86,930 | | | 2,363 | | | 3.19 |
MD | | | | | | | | | | | | 438 | | 334,897 | | 334,897 | | — | | 99.8% | | 97.7% | | — | | | 8,343 | | | 1,624 | | | 2.13 |
In-Service assets |
|
|
|
|
|
|
|
|
|
|
| 6,335 |
| 5,243,411 |
| 4,877,103 |
| 366,308 |
| 96.6% | | 93.1% | | 94.1% | | $ | 160,558 | | $ | 2,189 | | $ | 2.81 |
Recently Delivered assets |
|
|
|
|
|
|
|
|
|
|
| 161 |
| 181,990 |
| 172,203 |
| 9,787 |
| 71.5% | | 60.6% | | 95.1% | |
| 4,148 | |
| 3,109 | |
| 3.09 |
Operating - Total/Weighted Average |
|
|
|
|
|
|
|
|
| 6,496 |
| 5,425,401 |
| 5,049,306 |
| 376,095 |
| 95.7% | | 92.3% | | 94.2% | | $ | 164,706 | | $ | 2,205 | | $ | 2.82 | ||
In-Service excluding newly developed and acquired assets (9) | | | | | | | | | | 4,712 | | 4,070,180 | | 3,787,440 | | 282,739 | | 97.7% | | 94.7% | | 94.7% | | $ | 124,995 | | $ | 2,157 | | $ | 2.69 | ||
Under-Construction assets |
|
|
|
|
|
|
|
|
|
|
| 1,583 |
| 1,214,951 |
| 1,157,276 |
| 57,675 |
| | | |
|
| |
|
| |
|
| |
|
|
| | | | | | | | |
| Number of Assets and Total Square Feet/Units Reconciliation |
| ||||||
| | | Number of | | At 100% Share | | At JBG SMITH Share |
|
| Operating Assets |
| Assets |
| Square Feet/Units |
| Square Feet/Units |
|
| Q1 2022 |
| 20 |
| 6,541,275 SF/ |
| 5,431,043 SF/ | |
| Acquisitions |
| — |
| — |
| — | |
| Placed into service |
| — |
| — |
| — | |
| Dispositions (10) | | (1) | | (390,293) SF/ |
| (7,025) SF/ | |
| Out-of-service adjustment | | — |
| — |
| — | |
| Portfolio reclassification | | — | | — | | — | |
| Building re-measurements | | — |
| 1,383 SF |
| 1,383 SF | |
| | | | | | | | |
| Q2 2022 |
| 19 |
| 6,152,365 SF/ |
| 5,425,401 SF/ | |
| | | | | | | | | | | | | | | | | | | | | | | | | | | |
Quarterly Rental Revenue and Occupancy Changes - Same Store Multifamily Assets | | | | | | | | | | | | | | | | | | |
| ||||||||
|
|
|
|
|
| Monthly Rent Per Unit (3) |
| Multifamily % Occupied |
| Annualized Rent (in thousands) |
| ||||||||||||||||
| | Number of Assets | | Number of Units | | | Q2 2022 | | | Q2 2021 | | % Change | | Q2 2022 | | Q2 2021 | | % Change | | | Q2 2022 | | | Q2 2021 | | % Change |
|
National Landing |
| 3 |
| 2,640 | | $ | 2,101 | | $ | 1,978 |
| 6.2% | | 95.5% | | 94.6% | | 0.9% | | $ | 63,590 | | $ | 59,288 |
| 7.3% | |
DC | | 8 |
| 2,099 | | | 2,394 | | | 2,311 |
| 3.6% | | 90.5% | | 90.0% | | 0.5% | | | 54,537 | | | 52,365 |
| 4.1% | |
MD |
| 2 |
| 438 | |
| 1,624 | |
| 1,542 |
| 5.3% | | 97.7% | | 94.1% | | 3.6% | |
| 8,343 | |
| 7,624 |
| 9.4% | |
Total / Weighted Average |
| 13 |
| 5,177 | | $ | 2,174 | | $ | 2,072 |
| 4.9% | | 93.7% | | 92.7% | | 1.0% | | $ | 126,470 | | $ | 119,277 |
| 6.0% | |
Note: At JBG SMITH Share. Includes assets placed In-Service prior to April 1, 2021. Excludes North End Retail and 2221 S. Clark Street - Residential and 900 W Street as they are operated as a short-term rental property.
See footnotes on page 40.
| | |
| | Page 39 |
| |
PROPERTY TABLE - MULTIFAMILY | JUNE 30, 2022 |
Note: At 100% share, unless otherwise noted.
| (1) | "C" denotes a consolidated interest. "U" denotes an unconsolidated interest. |
| (2) | "Y" denotes an asset as Same Store and "N" denotes an asset as Non-Same Store. |
| (3) | Represents multifamily rent divided by occupied multifamily units; retail rent is excluded from this metric. Occupied units may differ from leased units because leased units include leases that have been signed but the tenant has not yet taken occupancy (not yet included in Percent Occupied metrics). |
| (4) | Excludes North End Retail. |
| (5) | Represents multifamily rent divided by occupied multifamily SF; retail rent and retail SF are excluded from this metric. Occupied multifamily square footage may differ from leased multifamily square footage because leased multifamily square footage includes space for leases that have been signed but the tenant has not yet taken occupancy (not yet included in Percent Occupied metrics). |
| (6) | 2221 S. Clark Street - Residential and 900 W Street are excluded from Percent Leased, Percent Occupied, Annualized Rent, Monthly Rent Per Unit and Monthly Rent per Square Foot metrics as they are operated as short-term rental properties. |
| (7) | On August 1, 2022, we acquired the remaining 36.0% ownership interest for $19.7 million. |
| (8) | See footnotes (3) and (4) on page 41. |
| (9) | Excludes West Half, The Wren and The Batley. |
| (10) | See "Disposition and Recapitalization Activity" on page 44. |
| | |
| | Page 40 |
| |
PROPERTY TABLE – UNDER-CONSTRUCTION | JUNE 30, 2022 |
Property Table – Under Construction
| | | | | | | | | | | | | | | | | | | | | | | | | | |
| dollars in thousands, except per square foot data | | | | | | | | | | | | | | | | | | | | |
| ||||
| | | | | | | | | | | Schedule (1) | | At JBG SMITH Share | | ||||||||||||
| | | | | | | Estimated | | Estimated | | | | Estimated | | | | | | | Estimated | | Estimated |
| |||
| | | | | % | | Square | | Number of | | Construction | | Completion | | Estimated | | Historical | | Incremental | | Total |
| ||||
| Asset |
| Submarket |
| Ownership | | Feet | | Units | | Start Date | | Date | | Stabilization Date |
| Cost (2) | | Investment | | Investment | | ||||
| | | | | | | | | | | | | | | | | | | | | | | | | | |
| Multifamily | | | | | | | | | | | | | | | | | | | | | | | | | |
| National Landing |
|
|
|
|
|
|
|
|
|
|
| |
|
|
| |
|
| |
|
| |
|
| |
| 1900 Crystal Drive (3) |
| National Landing |
| — | | 633,985 |
| 808 |
| Q1 2021 |
| | Q1 2024 - Q3 2024 |
| Q1 2026 | | $ | 192,122 | | $ | 230,069 | | $ | 422,191 | |
| 2000/2001 South Bell Street (4) | | National Landing | | — | | 580,966 | | 775 | | Q1 2022 | | | Q1 2025 - Q3 2025 | | Q4 2026 | | | 44,979 | | | 298,456 | | | 343,435 | |
| | | | | | | | | | | | | | | | | | | | | | | | | | |
| Under-Construction - Total / Weighted Average | 1,214,951 |
| 1,583 |
| | | | | | | | | | | | | | | | | |||||
| | | | | | | | | | | | | | | | | | | | | | | | | | |
| Under-Construction - Total / Weighted Average at JBG SMITH Share | 1,214,951 |
| 1,583 |
| Q3 2021 | | | Q3 2024 - Q1 2025 | | Q3 2026 | | $ | 237,101 | | $ | 528,525 | | $ | 765,626 | | |||||
| | | | |
Weighted average Projected NOI Yield at JBG SMITH Share: |
| Multifamily |
| |
Estimated Total Investment (5) |
| | 5.8 | % |
Estimated Incremental Investment |
| | 8.4 | % |
Estimated Stabilized NOI at JBG SMITH Share (dollars in millions) | | $ | 44.2 | |
Note: At 100% share, unless otherwise noted.
| (1) | Average dates are weighted by JBG SMITH Share of estimated SF. |
| (2) | Historical Cost excludes certain GAAP adjustments, interest and ground lease costs. See definition of Historical Cost on page 52. |
| (3) | We leased the land underlying 1900 Crystal Drive to a lessee, which is constructing a multifamily asset comprising two towers with ground floor retail. The ground lessee has engaged us to be the development manager for the construction of 1900 Crystal Drive, and separately, we are the lessee in a master lease of the asset. We have an option to acquire the asset until a specified period after completion. In March 2021, the ground lessee entered into a mortgage loan collateralized by the leasehold interest with a maximum principal balance of $227.0 million and an interest rate of LIBOR plus 3.0% per annum. As of June 30, 2022, no proceeds had been received from the mortgage loan. The ground lessee was obligated to invest $17.5 million of equity funding, all of which was funded, and JBG SMITH is obligated to provide the additional project funding through a mezzanine loan to the ground lessee. We determined that 1900 Crystal Drive is a variable interest entity ("VIE") and that we are the primary beneficiary of the VIE. Accordingly, we consolidated the VIE with the lessee's ownership interest shown as "Noncontrolling interests" in our condensed consolidated balance sheets. The ground lease, the mezzanine loan and the master lease described above are eliminated in consolidation. 1900 Crystal Drive’s full cost, debt balance and other metrics are included at 100% in the at JBG SMITH Share metrics presented within this Investor Package. |
| (4) | We leased the land underlying 2000/2001 South Bell Street to a lessee, which is constructing a multifamily asset comprising two towers with ground floor retail. The ground lessee has engaged us to be the development manager for the construction of 2000/2001 South Bell Street, and separately, we are the lessee in a master lease of the asset. We have an option to acquire the asset until a specified period after completion. In December 2021, the ground lessee entered into a mortgage loan collateralized by the leasehold interest with a maximum principal balance of $208.5 million and an interest rate of LIBOR plus 2.15% per annum. As of June 30, 2022, no proceeds had been received from the mortgage loan. The ground lessee was obligated to invest $16.0 million of equity funding, all of which was funded, and JBG SMITH is obligated to provide additional project funding through a mezzanine loan to the ground lessee. We determined that 2000/2001 South Bell Street is a VIE and that we are the primary beneficiary of the VIE. Accordingly, we consolidated the VIE with the lessee's ownership interest shown as "Noncontrolling interests" in our condensed consolidated balance sheets. The ground lease, the mezzanine loan and the master lease described above are eliminated in consolidation. 2000/2001 South Bell Street's full cost, debt balance and other metrics are included at 100% in the at JBG SMITH Share metrics presented within this Investor Package. |
| (5) | Historical Cost of 1900 Crystal Drive includes $22.6 million of design costs, the majority of which were incurred prior to the Formation Transaction, that are not related to the current planned development. Excluding these costs, Projected NOI Yield on Estimated Total Investment would be 6.0%. |
| | |
| | Page 41 |
Property Table – Near-Term Development
| | | | | | | | | | | | | | | | | | | | | | | |
| dollars in thousands, except per square foot data | | | | | | | | | |
| ||||||||||||
| | | | | | | | | | | | | | | | | | | | | | |
|
| | | | | | | Earliest | | | | | | | | | | | | | | | |
|
| | | | | | | Potential | | | | | | | | | | | | Estimated | | At JBG SMITH Share | | |
| | | | | % | | Construction | | Entitlement | | Estimated Potential Development Density (SF) | | Number of | | Historical | | |||||||
| Asset |
| Submarket | | Ownership | | Start Date | | Status | | Total |
| Office |
| Multifamily |
| Retail | | Units | | Cost (1) |
| |
| | | | | | | | | | | | | | | | | | | | | | | |
| National Landing |
|
|
| | | | | | | |
|
|
|
|
|
|
| | |
|
| |
| Potomac Yard Landbay F - Block 15 - 3331 Exchange Avenue | | National Landing | | 50.0% | | 2022 | | Fully Entitled | | 181,300 | | — | | 164,300 | | 17,000 | | 170 | | $ | 7,836 | |
| Potomac Yard Landbay F - Block 19 - 3330 Exchange Avenue | | National Landing | | 50.0% | | 2022 | | Fully Entitled | | 238,100 | | — | | 214,800 | | 23,300 | | 240 | | | 9,494 | |
| 2250 Crystal Drive | | National Landing | | 100.0% | | 2023 | | Entitlement In Process | | 677,100 | | — | | 677,100 | | — | | 825 | | | 23,485 | |
| 223 23rd Street | | National Landing | | 100.0% | | 2023 | | Entitlement In Process | | 512,800 | | — | | 512,800 | | — | | 620 | | | 18,203 | |
| 2525 Crystal Drive | | National Landing | | 100.0% | | 2024 | | Entitlement In Process | | 370,000 | | — | | 370,000 | | — | | 500 | | | 12,556 | |
| 101 12th Street | | National Landing | | 100.0% | | Pre-lease Dependent | | Fully Entitled | | 239,600 | | 234,400 | | — | | 5,200 | | — | | | 10,961 | |
| DC |
|
|
| | | | | | |
|
|
|
|
|
|
|
| | |
| | |
| 5 M Street Southwest |
| Ballpark | | 100.0% | | 2022 | | Fully Entitled | | 705,400 | | — | | 675,400 | | 30,000 | | 615 | | | 28,963 | |
| Gallaudet Parcel 1-3 (2) | | Union Market/NoMa/H Street |
| 100.0% | | 2023 | | Fully Entitled | | 818,000 |
| — |
| 756,400 |
| 61,600 |
| 840 | | | 21,562 | |
| | | | | | | | | | | | | | | | | | | | | | | |
| Total |
| |
| | | | | | | 3,742,300 |
| 234,400 |
| 3,370,800 |
| 137,100 |
| 3,810 | | $ | 133,060 | |
| | | | | | | | | | | | | | | | | | | | | | | |
| Total at JBG SMITH Share | | | | | | | | | | | | | | | | | | | | | | |
| National Landing | | | | | | | | | | 2,009,300 | | 234,400 | | 1,749,500 | | 25,400 | | 2,150 | | $ | 82,535 | |
| DC | | | | | | | | | | 1,523,400 | | — | | 1,431,800 | | 91,600 | | 1,455 | | | 50,525 | |
| | | | | | | | | | | 3,532,700 | | 234,400 | | 3,181,300 | | 117,000 | | 3,605 | | $ | 133,060 | |
| | | | | | | | | | | | | | | | | | | | | | | |
| | | | | | | | | Fully Entitled | | 1,972,800 | | 234,400 | | 1,621,400 | | 117,000 | | 1,660 | | | | |
| | | | | | | | | Entitlement In Process | | 1,559,900 | | — | | 1,559,900 | | — | | 1,945 | | | | |
| | | | | | | | | | | 3,532,700 | | 234,400 | | 3,181,300 | | 117,000 | | 3,605 | | | | |
| | | | | | | | | | | | | | | | | | | | | | | |
Note: Represents select assets that have the potential to commence construction over the next three years, subject to receipt of full entitlements, completion of design and market conditions.
| (1) | Historical Cost includes certain intangible assets, such as option and transferable density rights values recorded as part of the Formation Transaction; and excludes certain GAAP adjustments, such as capitalized interest and ground lease costs. See definition of Historical Cost on page 52. |
| | |
| | Page 42 |
| |
PROPERTY TABLE – FUTURE DEVELOPMENT | JUNE 30, 2022 |
Property Table – Future Development
| | | | | | | | | | | | | | | | | | | | | | | | | | | | | | |
| dollars in thousands, except per square foot data, at JBG SMITH Share | | | | Estimated | | | | | | | | Estimated | | Estimated | | | | | | |
| ||||||||
| | | | | | | | | | | Commercial | | | | | Estimated | | Capitalized | | Capitalized | | | | | Estimated |
| ||||
| | | | | | | | | | | SF / Multifamily | | | | | Remaining | | Cost of SF / | | Cost of | | Estimated | | Total | | |||||
| | | Number of | | Estimated Potential Development Density (SF) | | Units to be | | Historical | | Acquisition | | Units to Be | | Ground Rent | | Total | | Investment | | ||||||||||
| Region |
| Assets | | Total |
| Office |
| Multifamily | | Replaced (1) | | Cost (2) | | Cost (3) | | Replaced (4) | | Payments (5) | | Investment (6) | | per SF |
| ||||||
| | | | | | | | | | | | | | | | | | | | | | | | | | | | | | |
| Owned | | | | | | | | | | | | | | | | | | | | | | | | | | | | | |
| VA |
|
|
| |
|
|
|
|
|
| |
|
|
| |
| |
|
| |
|
| |
|
| |
|
| |
| National Landing |
| 7 |
| 4,491,500 |
| 1,113,000 | | 3,378,500 |
| 206,186 SF | | $ | 174,901 |
| | N/A | | $ | 110,533 | | $ | — | | $ | 285,434 | | $ | 63.55 | |
| Other VA |
| 2 |
| 145,700 |
| 89,700 | | 56,000 |
| 21,776 SF | |
| 1,430 |
| | N/A | |
| 1,832 | |
| — | |
| 3,262 | |
| 22.39 | |
| |
| 9 |
| 4,637,200 |
| 1,202,700 |
| 3,434,500 |
| 227,962 SF | | $ | 176,331 |
| | N/A | | $ | 112,365 | | $ | — | | $ | 288,696 | | $ | 62.26 | |
| DC | | | | | | | | | | | | | | | | | | | | | | | | | | | | | |
| DC |
| 5 |
| 852,900 |
| 149,600 |
| 703,300 |
| — | | $ | 71,029 |
| | N/A | | $ | — | | $ | — | | $ | 71,029 | | $ | 83.28 | |
| Total / weighted average |
| 14 |
| 5,490,100 |
| 1,352,300 |
| 4,137,800 |
| 227,962 SF | | $ | 247,360 |
| | N/A | | $ | 112,365 | | $ | — | | $ | 359,725 | | $ | 65.52 | |
| | | | | | | | | | | | | | | | | | | | | | | | | | | | | | |
| Optioned (7) |
|
|
|
|
|
|
|
|
|
| |
|
|
| |
| |
|
| |
|
| |
|
| |
|
| |
| DC |
|
|
|
|
|
|
|
|
|
| |
|
|
| |
| |
|
| |
|
| |
|
| |
|
| |
| DC |
| 2 |
| 783,600 |
| — |
| 783,600 |
| — | | $ | 11,280 | | $ | 7,850 | | $ | — | | $ | 29,434 | | $ | 48,564 | | $ | 61.98 | |
| | | | | | | | | | | | | | | | | | | | | | | | | | | | | | |
| Total / Weighted Average |
| 16 |
| 6,273,700 |
| 1,352,300 |
| 4,921,400 |
| 227,962 SF | | $ | 258,640 | | $ | 7,850 | | $ | 112,365 | | $ | 29,434 | | $ | 408,289 | | $ | 65.08 | |
| | | | | | | | | | | | | | | | | | | | | | | | | | | | | | |
| Total / Weighted Average (Fully Entitled and Entitlement In Process) | | 13 | | 6,051,200 | | 1,335,700 | | 4,715,500 | | 227,962 SF | | $ | 257,023 | | $ | N/A | | $ | 112,365 | | $ | 29,434 | | $ | 398,822 | | $ | 65.91 | |
| | | | | | | | | | | | | | | | | | | | | | | | | | | | | | |
| Entitlement Status | | | | | | | | | | | | | | | | | | | | | | | | | | | | | |
| Fully Entitled | | 7 | | 1,432,500 | | 673,200 | | 759,300 | | | | | | | | | | | | | | | | | | | | | |
| Entitlement In Process | | 6 | | 4,618,700 | | 662,500 | | 3,956,200 | | | | | | | | | | | | | | | | | | | | | |
| Encumbered / Not Currently Entitling | | 3 | | 222,500 | | 16,600 | | 205,900 | | | | | | | | | | | | | | | | | | | | | |
| Total | | 16 | | 6,273,700 | | 1,352,300 | | 4,921,400 | | | | | | | | | | | | | | | | | | | | | |
| (1) | Represents management's estimate of the total office and/or retail rentable SF and multifamily units currently included in our operating portfolio that would need to be redeveloped to access some of the Estimated Potential Development Density. |
| (2) | Historical Cost includes certain intangible assets, such as option and transferable density rights values recorded as part of the Formation Transaction; and excludes certain GAAP adjustments, such as capitalized interest and ground lease costs. See definition of Historical Cost on page 52. |
| (3) | Represents management's estimate of remaining deposits, option payments, and option strike prices as of June 30, 2022. |
| (4) | Capitalized value of estimated commercial SF / multifamily units to be replaced, which generated $1.7 million of NOI for the three months ended June 30, 2022 (included in the NOI of the applicable operating segment), at a 6.0% capitalization rate. |
| (5) | Capitalized value of stabilized annual ground rent payments associated with leasehold assets at a 5.0% capitalization rate. One optioned parcel is a leasehold interest with estimated stabilized annual ground rent payments totaling $2.0 million. |
| (6) | Represents Historical Cost plus incremental costs to access the Estimated Potential Development Density, but does not include potential entitlement costs or infrastructure costs. |
| (7) | As of June 30, 2022, the weighted average remaining term for the optioned Future Development Pipeline assets is 2.9 year. |
| | |
| | Page 43 |
| |
DISPOSITION AND RECAPITALIZATION ACTIVITY | JUNE 30, 2022 |
| | | | | | | | | | | | | | | | |
| dollars in thousands, at JBG SMITH Share | | | | | | | | | | | | | | |
|
| | | | | | | | | | | | Total Square Feet/ | | | |
|
| | | | | | | | | | | | Estimated Potential | | | |
|
| | | | | | | | | | |
| Development | | | | |
| | | Ownership | | | | | | | | | Density | | Gross Sales | | |
| Assets | | Percentage | | Asset Type | | Location | | Date Disposed | | (Square Feet) | | Price |
| ||
| | | | | | | | | | | | | | | | |
| Q1 2022 | | | | | | | | | | | | | | | |
| The Alaire, The Terano and 12511 Parklawn Drive |
| 1.8% to 18.0% | | Multifamily / Future Development |
| Rockville, MD | | | January 27, 2022 |
| 51,546 / 1,170 | | $ | 15,384 | |
| Development Parcel | | 100.0% | | Future Development | | Arlington, VA | | | March 28, 2022 | | — | | | 3,250 | |
| Subtotal | | | | | | | | | | | 51,546 / 1,170 | | $ | 18,634 | |
| | | | | | | | | | | | | | | | |
| Q2 2022 | | | | | | | | | | | | | | | |
| Universal Buildings | | 100.0% | | Commercial | | Washington, DC | | | April 1, 2022 | | 659,459 | | $ | 228,000 | |
| Galvan | | 1.8% | | Multifamily | | Rockville, MD | | | May 10, 2022 | | 7,025 | | | 2,745 | |
| Pen Place | | 100.0% | | Other | | Arlington, VA | | | May 25, 2022 | | 2,082,000 | | | 198,000 | |
| 1900 N Street | | 55.0% | | Commercial | | Washington, DC | | | June 1, 2022 | | 148,226 | | | 145,750 | |
| Subtotal | | | | | | | | | | | 814,710 / 2,082,000 | | $ | 574,495 | |
| | | | | | | | | | | | | | | | |
| | | | | | | | | | | | | | | | |
| Total |
|
|
|
|
|
| |
|
|
| 866,256 / 2,083,170 | | $ | 593,129 | |
Recapitalization and Other Activity:
In January 2022, we sold investments in equity securities for $17.8 million, resulting in a realized gain of $13.9 million.
On April 13, 2022, we formed an unconsolidated real estate venture with affiliates of Fortress to recapitalize a 1.6 million square foot office portfolio and land parcels valued at $580.0 million comprising four wholly owned commercial assets (7200 Wisconsin Avenue, 1730 M Street, RTC-West/RTC-West Trophy Office/RTC-West Land and Courthouse Plaza 1 and 2). Fortress contributed $131.0 million for a 66.5% interest in the venture. In connection with the transaction, the real estate venture obtained mortgage loans totaling $458.0 million secured by the properties, of which $402.0 million was drawn at closing. We provide asset management, property management and leasing services to the venture. Because our interest in the venture is subordinated to a 15% preferred return to Fortress, we do not anticipate receiving any near-term cash flow distributions from it. As of June 30, 2022, our investment in the venture was zero, and we have discontinued applying the equity method as we have not guaranteed its obligations or otherwise committed to providing financial support. These assets, as well as the associated non-recourse mortgages payable, held through an unconsolidated real estate venture are excluded from the occupancy, non-GAAP financial measures and leverage metrics presented in our investor package.
On April 29, 2022, we sold a 99-year term leasehold interest in a future development asset located in Reston, VA.
| | |
| | Page 44 |
| |
DEBT SUMMARY | JUNE 30, 2022 |
| | | | | | | | | | | | | | | | | | | | | | | |
| dollars in thousands, at JBG SMITH Share |
| 2022 |
| 2023 |
| 2024 |
| 2025 |
| 2026 |
| Thereafter |
| Total |
| |||||||
| | | | | | | | | | | | | | | | | | | | | | | |
| Consolidated and Unconsolidated Principal Balance | | | | | | | | | | | | | | | | | | | | | | |
| Unsecured Debt: | | | | | | | | | | | | | | | | | | | | | | |
| Revolving credit facility ($1 billion commitment) (1) | | $ | — | | $ | — | | $ | — | | $ | — | | $ | — | | $ | — | | $ | — | |
| Term loans ($400 million commitment) (2) | |
| — | |
| — | |
| 200,000 | |
| 200,000 | |
| — | |
| — | |
| 400,000 | |
| Total unsecured debt | |
| — | |
| — | |
| 200,000 | |
| 200,000 | |
| — | |
| — | |
| 400,000 | |
| Secured Debt: | |
|
| |
|
| |
|
| |
|
| |
|
| |
|
| |
|
| |
| Consolidated principal balance | |
| — | |
| 276,347 | |
| 125,805 | |
| 391,029 | |
| 105,000 | |
| 722,946 | |
| 1,621,127 | |
| Unconsolidated principal balance | |
| 86,550 | |
| 108,127 | |
| — | |
| 33,000 | |
| — | |
| 52,102 | |
| 279,779 | |
| Total secured debt | |
| 86,550 | |
| 384,474 | |
| 125,805 | |
| 424,029 | |
| 105,000 | |
| 775,048 | |
| 1,900,906 | |
| | | | | | | | | | | | | | | | | | | | | | | |
| Total Consolidated and Unconsolidated Principal Balance | | $ | 86,550 | | $ | 384,474 | | $ | 325,805 | | $ | 624,029 | | $ | 105,000 | | $ | 775,048 | | $ | 2,300,906 | |
| | | | | | | | | | | | | | | | | | | | | | | |
| % of total debt maturing | |
| 3.8 | % |
| 16.7 | % |
| 14.2 | % |
| 27.1 | % |
| 4.6 | % |
| 33.6 | % |
| 100.0 | % |
| % floating rate (3) | |
| 93.6 | % |
| 56.1 | % |
| — | |
| — | % |
| 100.0 | % |
| 83.2 | % |
| 45.5 | % |
| % fixed rate (4) | |
| 6.4 | % |
| 43.9 | % |
| 100.0 | % |
| 100.0 | % |
| — | |
| 16.8 | % |
| 54.5 | % |
| | | | | | | | | | | | | | | | | | | | | | | |
| Weighted Average Interest Rates | |
|
| |
|
| |
|
| |
|
| |
|
| |
|
| |
|
| |
| Variable rate (5) | |
| 3.44 | % |
| 4.60 | % |
| — | |
| — | % |
| 3.04 | % |
| 3.83 | % |
| 3.88 | % |
| Fixed rate | |
| 3.56 | % |
| 5.13 | % |
| 3.06 | % |
| 3.83 | % |
| — | |
| 4.29 | % |
| 3.85 | % |
| Total Weighted Average Interest Rates | |
| 3.45 | % |
| 4.83 | % |
| 3.06 | % |
| 3.83 | % |
| 3.04 | % |
| 3.91 | % |
| 3.86 | % |
| | | | | | | | | | | | | |
| | Credit Facility | |||||||||||
|
| Revolving |
| | |
| | |
| | |
| |
| | Credit | | Tranche A‑1 | | Tranche A‑2 | | Total/Weighted | | ||||
| | Facility (1) | | Term Loan (5) | | Term Loan (2) | | Average | | ||||
Credit limit | | $ | 1,000,000 | | $ | 200,000 | | $ | 200,000 | | $ | 1,400,000 | |
Outstanding principal balance | | $ | — | | $ | 200,000 | | $ | 200,000 | | $ | 400,000 | |
Letters of credit | | $ | 467 | | $ | — | | $ | — | | $ | 467 | |
Undrawn capacity | | $ | 999,533 | | $ | — | | $ | — | | $ | 999,533 | |
Interest rate spread (6) | |
| 1.05 | % |
| 1.15 | % |
| 1.15 | % |
| 1.15 | % |
All-In interest rate (7) | |
| 2.84 | % |
| 2.61 | % |
| 2.49 | % |
| 2.55 | % |
Initial maturity date | |
| Jan‑25 | |
| Jan‑25 | |
| Jul‑24 | |
| — | |
| (1) | In July 2022, we borrowed $100.0 million under our revolving credit facility, and we amended the interest rate of the revolving credit facility to SOFR plus 1.15% per annum based on our current leverage level. |
| (2) | In July 2022, our Tranche A‑2 Term Loan was amended to increase its borrowing capacity by $200.0 million. The incremental $200.0 million includes a one-year delayed draw feature, which was undrawn as of the date of this release. The amendment extends the maturity date of the term loan from July 2024 to January 2028 and amends the interest rate to SOFR plus 1.25% per annum based on our current leverage level with a resulting all-in interest rate of 2.59%, including our current interest rate swaps, as of the date of this release. We also entered into two forward-starting interest rate swaps with an effective date of July 2024 and a total notional value of $200.0 million, which will effectively fix SOFR at a weighted average interest rate of 2.25% through the maturity date, resulting in an all-in interest rate of 3.50% beginning in July 2024 based on our current leverage level. |
| (3) | Floating rate debt includes floating rate loans with interest rate caps. |
| (4) | Fixed rate debt includes floating rate loans with interest rate swaps. |
| (5) | For floating rate loans with interest rate caps, the weighted average cap strike is 2.51% for consolidated debt, and 2.60% for all debt. The interest rate cap strike is exclusive of the credit spreads associated with the loans. |
| (6) | The interest rate for the revolving credit facility excludes a 0.15% facility fee. |
| (7) | The all-in interest rate is inclusive of interest rate swaps. As of June 30, 2022, we had interest rates swaps for the Tranche A-1 Term Loan and the Tranche A-2 Term Loan. |
| | |
| | Page 45 |
| |
DEBT BY INSTRUMENT | JUNE 30, 2022 |
| | | | | | | | | | | | | | | | | |
| dollars in thousands | | | | | | | Stated | | Interest | | Current | | Initial | | Extended | |
| | | % | | Principal | | Interest | | Rate | | Annual | | Maturity | | Maturity |
| |
| Asset | | Ownership | | Balance | | Rate | | Hedge (1) |
| Interest Rate (2) | | Date | | Date (3) | | |
| | | | | | | | | | | | | | | | |
|
| Consolidated | | | | | | | | | | | | | | | | |
| 2121 Crystal Drive |
| 100.0 | % | $ | 131,535 |
| 5.51 | % | Fixed |
| 5.51 | % | 03/01/23 |
| 03/01/23 | |
| Falkland Chase - South & West |
| 100.0 | % |
| 37,312 |
| 3.78 | % | Fixed |
| 3.78 | % | 06/01/23 |
| 06/01/23 | |
| 800 North Glebe Road |
| 100.0 | % |
| 107,500 |
| S + 1.71 | % | — |
| 3.40 | % | 06/30/23 |
| 06/30/25 | |
| Credit Facility - Tranche A‑2 Term Loan (4) |
| 100.0 | % |
| 200,000 |
| L + 1.15 | % | Swap |
| 2.49 | % | 07/18/24 |
| 07/18/24 | |
| 2101 L Street |
| 100.0 | % |
| 125,805 |
| 3.97 | % | Fixed |
| 3.97 | % | 08/15/24 |
| 08/15/24 | |
| 201 12th Street S., 200 12th Street S., and 251 18th Street S. |
| 100.0 | % |
| 83,319 |
| 7.94 | % | Fixed |
| 7.94 | % | 01/01/25 |
| 01/01/25 | |
| Credit Facility - Revolving Credit Facility (5) |
| 100.0 | % |
| — |
| L + 1.05 | % | — |
| 2.84 | % | 01/07/25 |
| 01/07/25 | |
| RiverHouse Apartments |
| 100.0 | % |
| 307,710 |
| L + 1.28 | % | Swap |
| 3.47 | % | 04/01/25 |
| 04/01/25 | |
| 1900 Crystal Drive (6) | | — | | | — | | L + 3.00 | % | — | | 4.79 | % | 04/25/26 | | 04/25/26 | |
| 1215 S. Clark Street | | 100.0 | % | | 105,000 | | L + 1.25 | % | — | | 3.04 | % | 12/22/26 | | 12/22/26 | |
| Credit Facility - Tranche A‑1 Term Loan |
| 100.0 | % | | 200,000 |
| S + 1.15 | % | Swap |
| 2.61 | % | 01/14/25 |
| 01/14/27 | |
| 2000/2001 South Bell Street (7) | | — | | | — | | L + 2.15 | % | — | | 3.94 | % | 01/22/27 | | 01/22/27 | |
| 4747 Bethesda Avenue | | 100.0 | % | | 175,000 | | S + 1.35 | % | Cap | | 3.04 | % | 02/20/27 | | 02/20/27 | |
| 1235 S. Clark Street |
| 100.0 | % |
| 78,000 |
| 3.94 | % | Fixed |
| 3.94 | % | 11/01/27 |
| 11/01/27 | |
| 1225 S. Clark Street |
| 100.0 | % |
| 85,000 |
| L + 1.60 | % | — |
| 3.39 | % | 07/27/28 |
| 07/27/28 | |
| 1221 Van Street | | 100.0 | % | | 87,253 | | L + 2.51 | % | Cap | | 4.30 | % | 08/01/30 | | 08/01/30 | |
| 220 20th Street | | 100.0 | % | | 80,240 | | L + 2.51 | % | Cap | | 4.30 | % | 08/01/30 | | 08/01/30 | |
| The Bartlett | | 100.0 | % | | 217,453 | | L + 2.51 | % | Cap | | 4.30 | % | 08/01/30 | | 08/01/30 | |
| Total Consolidated Principal Balance |
| | |
| 2,021,127 |
|
|
|
|
|
|
|
|
|
| |
| Premium / (discount) recognized as a result of the Formation Transaction |
| | |
| 528 |
|
|
|
|
|
|
|
|
|
| |
| Deferred financing costs - mortgage loans (8) |
| | |
| (15,225) | | |
|
|
|
|
|
|
|
| |
| Deferred financing costs - credit facility (8) |
| | |
| (5,668) | | |
|
|
|
|
|
|
|
| |
| Total Consolidated Indebtedness | | | | $ | 2,000,762 | | |
|
|
|
|
|
|
|
| |
| | | | | | | | | | | | | | | | | |
| Total Consolidated Indebtedness (net of premium / (discount) and deferred financing costs) | |
|
|
|
|
|
|
|
|
|
|
|
| | ||
| Mortgages payable | | | | $ | 1,612,169 |
|
|
|
|
|
|
|
|
|
| |
| Revolving credit facility | | | |
| — |
| |
|
|
|
|
|
|
|
| |
| Deferred financing costs, net (included in other assets) (8) | | | |
| (9,907) |
|
|
|
|
|
|
|
|
|
| |
| Unsecured term loans (4) | | | |
| 398,500 |
|
|
|
|
|
|
|
|
|
| |
| Total Consolidated Indebtedness | | | | $ | 2,000,762 |
|
|
|
|
|
|
|
|
|
| |
| | |
| | Page 46 |
| |
DEBT BY INSTRUMENT | JUNE 30, 2022 |
| | | | | | | | | | | | | | | | | |
| dollars in thousands | | | | | | | Stated | | Interest | | Current | | Initial | | Extended | |
| | | % | | Principal | | Interest | | Rate | | Annual | | Maturity | | Maturity | | |
| Asset | | Ownership | | Balance | | Rate | | Hedge (1) |
| Interest Rate (2) | | Date | | Date (3) |
| |
| | | | | | | | | | | | | | | | | |
| Unconsolidated | | | | | | | | | | | | | | | | |
| Atlantic Plumbing | | 64.0 | % | $ | 100,000 | | L + 1.50 | % | — |
| 3.29 | % | 11/08/22 | | 11/08/22 | |
| Stonebridge at Potomac Town Center | | 10.0 | % |
| 84,600 | | L + 2.50 | % | — |
| 4.29 | % | 12/10/22 | | 12/10/22 | |
| L’Enfant Plaza Office - North, L’Enfant Plaza Office - East, L’Enfant Plaza Retail | | 49.0 | % | | 208,984 | | L + 3.65 | % | Cap |
| 5.94 | % | 05/09/23 | | 05/09/24 | |
| Rosslyn Gateway - North, Rosslyn Gateway - South | | 18.0 | % |
| 47,492 | | L + 2.00 | % | Cap |
| 3.79 | % | 08/29/22 | | 08/29/24 | |
| The Foundry | | 9.9 | % |
| 58,000 | | L + 1.40 | % | Cap |
| 3.19 | % | 12/12/23 | | 12/12/24 | |
| 1101 17th Street | | 55.0 | % |
| 60,000 | | L + 1.25 | % | Swap |
| 4.13 | % | 06/13/25 | | 06/13/25 | |
| The Gale Eckington | | 5.0 | % |
| 110,813 | | L + 1.60 | % | Swap |
| 3.56 | % | 12/31/22 | | 12/31/25 | |
| 8001 Woodmont | | 50.0 | % |
| 104,203 | | 4.82 | % | Fixed |
| 4.82 | % | 01/15/27 | | 01/15/27 | |
| Total Unconsolidated Principal Balance | | | |
| 774,092 | | |
|
|
|
|
|
|
|
| |
| Deferred financing costs |
| | | | (597) | | |
|
|
|
|
|
|
|
| |
| Total Unconsolidated Indebtedness | | | | $ | 773,495 | | | | | | | | | | | |
| | | | | | | | | | | | | | | | | |
| Principal Balance at JBG SMITH Share | | | |
|
|
|
|
|
|
|
|
|
|
|
| |
| Consolidated principal balance at JBG SMITH Share |
| | | $ | 2,021,127 |
|
|
|
|
|
|
|
|
|
| |
| Unconsolidated principal balance at JBG SMITH Share | | | |
| 279,779 |
| |
|
|
| |
|
|
|
| |
| Total Consolidated and Unconsolidated Principal Balance at JBG SMITH Share | | | | $ | 2,300,906 |
|
|
|
|
|
|
|
|
|
| |
| | | | | | | | | | | | | | | | | |
| Indebtedness at JBG SMITH Share (net of premium / (discount) and deferred financing costs) |
|
|
|
|
|
|
|
|
|
| | |||||
| Consolidated indebtedness at JBG SMITH Share |
| | | $ | 2,000,762 |
| |
|
|
|
|
|
|
|
| |
| Unconsolidated indebtedness at JBG SMITH Share | | | | | 279,534 | | | | | | | | | | | |
| Total Consolidated and Unconsolidated Indebtedness at JBG SMITH Share | | | | | 2,280,296 | | | | | | | | | | | |
| (1) | For floating rate loans with interest rate caps, the weighted average cap strike is 2.51% for consolidated debt, and 2.60% for all debt. The interest rate cap strike is exclusive of the credit spreads associated with the loans. |
| (2) | June 30, 2022 one-month LIBOR of 1.79% or SOFR of 1.69%, as applicable, applied to loans, which are denoted as floating (no swap) or floating with a cap, except as otherwise noted. |
| (3) | Represents the maturity date based on execution of all extension options. Many of these extensions are subject to lender covenant tests. |
| (4) | In July 2022, our Tranche A‑2 Term Loan was amended to increase its borrowing capacity by $200.0 million. The incremental $200.0 million includes a one-year delayed draw feature, which was undrawn as of the date of this release. The amendment extends the maturity date of the term loan from July 2024 to January 2028 and amends the interest rate to SOFR plus 1.25% per annum based on our current leverage level with a resulting all-in interest rate of 2.59%, including our current interest rate swaps, as of the date of this release. We also entered into two forward-starting interest rate swaps with an effective date of July 2024 and a total notional value of $200.0 million, which will effectively fix SOFR at a weighted average interest rate of 2.25% through the maturity date, resulting in an all-in interest rate of 3.50% beginning in July 2024 based on our current leverage level. |
| (5) | In July 2022, we borrowed $100.0 million under our revolving credit facility, and we amended the interest rate of the revolving credit facility to SOFR plus 1.15% per annum based on our current leverage level. |
| (6) | In March 2021, we leased the land associated with 1900 Crystal Drive to a lessee which will construct the asset. In March 2021, the ground lessee entered into a mortgage loan collateralized by the asset with a maximum principal balance of $227.0 million. See footnote (3) on page 41 for additional information. |
| (7) | In December 2021, we leased the land associated with 2000/2001 South Bell Street to a lessee which will construct the asset. In December 2021, the ground lessee entered into a mortgage loan collateralized by the asset with a maximum principal balance of $208.5 million. See footnote (4) on page 41 for additional information. |
| (8) | As of June 30, 2022, net deferred financing costs related to an unfunded mortgage loan totaling $5.7 million and the revolving credit facility totaling $4.2 million were included in "Other assets, net" in our condensed consolidated balance sheet. |
| | |
| | Page 47 |
| |
CONSOLIDATED AND UNCONSOLIDATED REAL ESTATE VENTURES | JUNE 30, 2022 |
Estate Ventures
| | | | | | | | | | | | |
| |
| Asset Type |
| City |
| Submarket |
| % Ownership |
| Total Square Feet |
|
| | | | | | | | | | | | |
| Consolidated Real Estate Ventures | | | | | | | | | | | |
| MRP Realty | | | | | | | | | | | |
| The Wren |
| Multifamily |
| Washington, DC |
| U Street/Shaw |
| 96.0 | % | 332,682 | |
| | | | | | | | | | | | |
| Total Consolidated Real Estate Ventures | | | | | | | | |
| 332,682 | |
| | | | | | | | | | | | |
| Unconsolidated Real Estate Ventures | | | | | | | | | | | |
| Landmark |
|
|
|
|
|
|
|
|
|
| |
| L’Enfant Plaza Office - East |
| Commercial |
| Washington, DC |
| Southwest |
| 49.0 | % | 399,163 | |
| L’Enfant Plaza Office - North |
| Commercial |
| Washington, DC |
| Southwest |
| 49.0 | % | 298,788 | |
| L’Enfant Plaza Retail |
| Commercial |
| Washington, DC |
| Southwest |
| 49.0 | % | 119,291 | |
| Rosslyn Gateway - North |
| Commercial |
| Arlington, VA |
| Rosslyn |
| 18.0 | % | 146,068 | |
| Rosslyn Gateway - South |
| Commercial |
| Arlington, VA |
| Rosslyn |
| 18.0 | % | 103,349 | |
| Rosslyn Gateway - South Land |
| Future Development |
| Arlington, VA |
| Rosslyn |
| 18.0 | % | 498,500 | |
| Rosslyn Gateway - North Land |
| Future Development |
| Arlington, VA |
| Rosslyn |
| 18.0 | % | 311,000 | |
| | | | | | | | | | | 1,876,159 | |
| | | | | | | | | | | | |
| J.P. Morgan Global Alternatives (1) | | | | | | | | | | | |
| Potomac Yard Landbay F - Block 15 - 3331 Exchange Avenue | | Multifamily | | Alexandria, VA | | National Landing | | 50.0 | % | 181,300 | |
| Potomac Yard Landbay F - Block 19 - 3330 Exchange Avenue | | Multifamily | | Alexandria, VA | | National Landing | | 50.0 | % | 238,100 | |
| Potomac Yard Landbay G | | Future Development | | Alexandria, VA | | National Landing | | 50.0 | % | 712,000 | |
| Potomac Yard Landbay F | | Future Development | | Alexandria, VA | | National Landing | | 50.0 | % | 901,000 | |
| |
| | | | | | | | | 2,032,400 | |
| | | | | | | | | | | | |
| CBREI Venture |
|
|
|
|
|
|
|
|
|
| |
| Stonebridge at Potomac Town Center |
| Commercial |
| Woodbridge, VA |
| Prince William County |
| 10.0 | % | 504,327 | |
| The Foundry |
| Commercial |
| Washington, DC |
| Georgetown |
| 9.9 | % | 227,493 | |
| The Gale Eckington |
| Multifamily |
| Washington, DC |
| Union Market / NoMa / H Street |
| 5.0 | % | 466,716 | |
| Atlantic Plumbing (2) |
| Multifamily |
| Washington, DC |
| U Street/Shaw |
| 64.0 | % | 245,527 | |
| |
| | | | | | | | | 1,444,063 | |
| | |
| | Page 48 |
| |
CONSOLIDATED AND UNCONSOLIDATED REAL ESTATE VENTURES | JUNE 30, 2022 |
| | | | | | | | | | |
| | Asset Type |
| City |
| Submarket |
| % Ownership |
| Total Square Feet |
| | | | | | | | | | |
Canadian Pension Plan Investment Board |
|
|
|
|
|
|
|
|
|
|
1101 17th Street |
| Commercial |
| Washington, DC |
| CBD |
| 55.0 | % | 209,108 |
| | | | | | | | | | |
Bresler / Brookfield |
|
|
|
|
|
|
|
|
|
|
Waterfront Station |
| Future Development |
| Washington, DC |
| Southwest |
| 2.5 | % | 662,600 |
| | | | | | | | | | |
Brandywine |
|
|
|
|
|
|
|
|
|
|
1250 1st Street |
| Future Development |
| Washington, DC |
| Union Market / NoMa / H Street |
| 30.0 | % | 265,800 |
51 N Street |
| Future Development |
| Washington, DC |
| Union Market / NoMa / H Street |
| 30.0 | % | 177,500 |
50 Patterson Street |
| Future Development |
| Washington, DC |
| Union Market / NoMa / H Street |
| 30.0 | % | 142,200 |
|
| | | | | | | | | 585,500 |
| | | | | | | | | | |
Prudential Global Investment Management |
|
|
|
|
|
|
|
|
|
|
Central Place Tower |
| Commercial |
| Arlington, VA |
| Rosslyn |
| 50.0 | % | 551,608 |
| | | | | | | | | | |
Berkshire Group |
|
|
|
|
|
|
|
|
|
|
8001 Woodmont |
| Multifamily |
| Bethesda, MD |
| Bethesda CBD |
| 50.0 | % | 363,979 |
| | | | | | | | | | |
Total Unconsolidated Real Estate Ventures |
| |
|
|
|
|
|
|
| 7,725,417 |
| (1) | J.P. Morgan Global Alternatives is the advisor for an institutional investor. |
| (2) | On August 1, 2022, we acquired the remaining 36.0% interest for $19.7 million. |
| | |
| | Page 49 |
| |
DEFINITIONS | JUNE 30, 2022 |
"Annualized Rent" is defined as (i) for commercial assets, or the retail component of a mixed-use asset, the in-place monthly base rent before Free Rent, plus tenant reimbursements as of June 30, 2022, multiplied by 12, and (ii) for multifamily assets, or the multifamily component of a mixed-use asset, the in-place monthly base rent before Free Rent as of June 30, 2022, multiplied by 12. Annualized Rent excludes rent from leases that have been signed but the tenant has not yet taken occupancy (not yet included in Percent Occupied metrics). The in-place monthly base rent does not take into consideration temporary rent relief arrangements.
"Annualized Rent per Square Foot" is defined as (i) for commercial assets, annualized office rent divided by occupied office square feet and annualized retail rent divided by occupied retail square feet; and (ii) for multifamily assets, monthly multifamily rent divided by occupied multifamily square feet; annualized retail rent and retail square feet are excluded from this metric. Occupied square footage may differ from leased square footage because leased square footage includes leases that have been signed but the tenant has not yet taken occupancy (not yet included in Percent Occupied metrics).
"Development Pipeline" refers to the Near-Term Development and Future Development Pipelines.
Earnings Before Interest, Taxes, Depreciation and Amortization ("EBITDA"), EBITDA for Real Estate ("EBITDAre") and "Adjusted EBITDA" are non-GAAP financial measures. EBITDA and EBITDAre are used by management as supplemental operating performance measures, which we believe help investors and lenders meaningfully evaluate and compare our operating performance from period-to-period by removing from our operating results the impact of our capital structure (primarily interest charges from our outstanding debt and the impact of our interest rate swaps) and certain non-cash expenses (primarily depreciation and amortization on our assets). EBITDAre is computed in accordance with the definition established by Nareit. Nareit defines EBITDAre as GAAP net income (loss) adjusted to exclude interest expense, income taxes, depreciation and amortization expenses, gains and losses on sales of real estate and impairment write-downs of certain real estate assets and investments in entities when the impairment is directly attributable to decreases in the value of depreciable real estate held by the entity, including our share of such adjustments of unconsolidated real estate ventures. These supplemental measures may help investors and lenders understand our ability to incur and service debt and to make capital expenditures. EBITDA and EBITDAre are not substitutes for net income (loss) (computed in accordance with GAAP) and may not be comparable to similarly titled measures used by other companies.
Adjusted EBITDA represents EBITDAre adjusted for items we believe are not representative of ongoing operating results, such as Transaction and Other Costs, impairment write-downs of right-of-use assets associated with leases in which we are a lessee, gain (loss) on the extinguishment of debt, earnings (losses) and distributions in excess of our investment in unconsolidated real estate ventures, lease liability adjustments, income from investments, business interruption insurance proceeds and share-based compensation expense related to the Formation Transaction and special equity awards. We believe that adjusting such items not considered part of our comparable operations, provides a meaningful measure to evaluate and compare our performance from period-to-period.
Because EBITDA, EBITDAre and Adjusted EBITDA have limitations as analytical tools, we use EBITDA, EBITDAre and Adjusted EBITDA to supplement GAAP financial measures. Additionally, we believe that users of these measures should consider EBITDA, EBITDAre and Adjusted EBITDA in conjunction with net income (loss) and other GAAP measures in understanding our operating results. A reconciliation of net income (loss) to EBITDA, EBITDAre and Adjusted EBITDA is presented on page 15.
"Estimated Incremental Investment" means management's estimate of the remaining cost to be incurred in connection with the development of an asset as of June 30, 2022, including all remaining acquisition costs, hard costs, soft costs, tenant improvements (excluding Free Rent converted to tenant improvement allowances), leasing costs and other similar costs to develop and stabilize the asset but excluding any financing costs and ground rent expenses. Actual incremental investment may differ substantially from our estimates due to numerous factors, including unanticipated expenses, delays in the estimated start and/or completion date, changes in design and other contingencies.
"Estimated Potential Development Density" reflects management's estimate of developable gross square feet based on our current business plans with respect to real estate owned or controlled as of June 30, 2022. Our current business plans may contemplate development of less than the maximum potential development density for individual assets. As market conditions change, our business plans, and therefore, the Estimated Potential Development Density, could change accordingly. Given timing, zoning requirements and other factors, we make no assurance that Estimated Potential Development Density amounts will become actual density to the extent we complete development of assets for which we have made such estimates.
| | |
| | Page 50 |
| |
DEFINITIONS | JUNE 30, 2022 |
"Estimated Total Investment" means, with respect to the development of an asset, the sum of the Historical Cost in such asset and the Estimated Incremental Investment for such asset. Actual total investment may differ substantially from our estimates due to numerous factors, including unanticipated expenses, delays in the estimated start and/or completion date, changes in design and other contingencies. For Future Development assets, Estimated Total Investment represents Historical Cost plus incremental costs to access the Estimated Potential Development Density, but does not include potential entitlement costs or infrastructure costs.
"First-generation" is a lease on space that had been vacant for at least nine months or a lease on newly delivered space.
"Formation Transaction" refers collectively to the spin-off on July 17, 2017 of substantially all of the assets and liabilities of Vornado Realty Trust's Washington, DC segment, which operated as Vornado / Charles E. Smith, and the acquisition of the management business and certain assets and liabilities of The JBG Companies.
"Free Rent" means the amount of base rent and tenant reimbursements that are abated according to the applicable lease agreement(s).
Funds from Operations ("FFO"), "Core FFO" and Funds Available for Distribution ("FAD") are non-GAAP financial measures. FFO is computed in accordance with the definition established by Nareit in the Nareit FFO White Paper - 2018 Restatement. Nareit defines FFO as net income (loss) (computed in accordance with GAAP), excluding depreciation and amortization related to real estate, gains and losses from the sale of certain real estate assets, gains and losses from change in control and impairment write-downs of certain real estate assets and investments in entities when the impairment is directly attributable to decreases in the value of depreciable real estate held by the entity, including our share of such adjustments for unconsolidated real estate ventures.
Core FFO represents FFO adjusted to exclude items (net of tax) which we believe are not representative of ongoing operating results, such as Transaction and Other Costs, impairment write-downs of right-of-use assets associated with leases in which we are a lessee, gains (or losses) on the extinguishment of debt, earnings (losses) and distributions in excess of our investment in unconsolidated real estate ventures, share-based compensation expense related to the Formation Transaction and special equity awards, lease liability adjustments, income from investments, business interruption insurance proceeds, amortization of the management contracts intangible and the mark-to-market of derivative instruments, including our share of such adjustments for unconsolidated real estate ventures.
FAD represents Core FFO less recurring tenant improvements, leasing commissions and other capital expenditures, net deferred rent activity, third-party lease liability assumption payments, recurring share-based compensation expense, accretion of acquired below-market leases, net of amortization of acquired above-market leases, amortization of debt issuance costs and other non-cash income and charges, including our share of such adjustments for unconsolidated real estate ventures. FAD is presented solely as a supplemental disclosure that management believes provides useful information as it relates to our ability to fund dividends.
We believe FFO, Core FFO and FAD are meaningful non-GAAP financial measures useful in comparing our levered operating performance from period-to-period and as compared to similar real estate companies because these non-GAAP measures exclude real estate depreciation and amortization expense and other non-comparable income and expenses, which implicitly assumes that the value of real estate diminishes predictably over time rather than fluctuating based on market conditions. FFO, Core FFO and FAD do not represent cash generated from operating activities and are not necessarily indicative of cash available to fund cash requirements and should not be considered as an alternative to net income (loss) (computed in accordance with GAAP) as a performance measure or cash flow as a liquidity measure. FFO, Core FFO and FAD may not be comparable to similarly titled measures used by other companies. A reconciliation of net income (loss) to FFO, Core FFO and FAD is presented on pages 16-17.
"Future Development Pipeline" refers to assets that are development opportunities on which we do not intend to commence construction within the next three years where we (i) own land or control the land through a ground lease or (ii) are under a long-term conditional contract to purchase, or enter into, a leasehold interest with respect to land.
| | |
| | Page 51 |
| |
DEFINITIONS | JUNE 30, 2022 |
"GAAP" means accounting principles generally accepted in the United States.
"Historical Cost" is a non-GAAP measure which includes the total Historical Cost incurred by JBG SMITH with respect to the development of an asset, including any acquisition costs, hard costs, soft costs, tenant improvements (excluding Free Rent converted to tenant improvement allowances), leasing costs and other similar costs, but excluding any financing costs and ground rent expenses incurred as of June 30, 2022.
"In-Service" refers to commercial or multifamily operating assets that are at or above 90% leased or have been operating and collecting rent for more than 12 months as of June 30, 2022.
"JBG SMITH Share" or "our share" refers to our ownership percentage of consolidated and unconsolidated assets in real estate ventures.
"Metro-Served" means locations, submarkets or assets that are within 0.5 miles of an existing or planned Metro station.
"Monthly Rent Per Unit" represents multifamily rent for the month ended June 30, 2022 divided by occupied units; retail rent is excluded from this metric.
"Near-Term Development Pipeline" refers to select assets that have the potential to commence construction over the next three years, subject to receipt of full entitlements, completion of design and market conditions.
"Net Debt" is a non-GAAP financial measurement. Net Debt represents our total consolidated and unconsolidated indebtedness less cash and cash equivalents at our share. Net Debt is an important component in the calculations of Net Debt to Annualized Adjusted EBITDA and Net Debt / total enterprise value. We believe that Net Debt is a meaningful non-GAAP financial measure useful to investors because we review Net Debt as part of the management of our overall financial flexibility, capital structure and leverage. We may utilize a considerable portion of our cash and cash equivalents at any given time for purposes other than debt reduction. In addition, cash and cash equivalents at our share may not be solely controlled by us. The deduction of cash and cash equivalents at our share from consolidated and unconsolidated indebtedness in the calculation of Net Debt, therefore, should not be understood to mean that it is available exclusively for debt reduction at any given time.
Net Operating Income ("NOI"), "Annualized NOI", "Estimated Stabilized NOI" and "Projected NOI Yield" are non-GAAP financial measures management uses to assess a segment's performance. The most directly comparable GAAP measure is net income (loss) attributable to common shareholders. We use NOI internally as a performance measure and believe NOI provides useful information to investors regarding our financial condition and results of operations because it reflects only property related revenue (which includes base rent, tenant reimbursements and other operating revenue, net of Free Rent and payments associated with assumed lease liabilities) less operating expenses and ground rent for operating leases, if applicable. NOI also excludes deferred rent, related party management fees, interest expense, and certain other non-cash adjustments, including the accretion of acquired below-market leases and the amortization of acquired above-market leases and below-market ground lease intangibles. Management uses NOI as a supplemental performance measure of our assets and believes it provides useful information to investors because it reflects only those revenue and expense items that are incurred at the asset level, excluding non-cash items. In addition, NOI is considered by many in the real estate industry to be a useful starting point for determining the value of a real estate asset or group of assets. However, because NOI excludes depreciation and amortization and captures neither the changes in the value of our assets that result from use or market conditions, nor the level of capital expenditures and capitalized leasing commissions necessary to maintain the operating performance of our assets, all of which have real economic effect and could materially impact the financial performance of our assets, the utility of NOI as a measure of the operating performance of our assets is limited. NOI presented by us may not be comparable to NOI reported by other REITs that define these measures differently. We believe to facilitate a clear understanding of our operating results, NOI should be examined in conjunction with net income (loss) attributable to common shareholders as presented in our financial statements. NOI should not be considered as an alternative to net income (loss) attributable to common shareholders as an indication of our performance or to cash flows as a measure of liquidity or our ability to make distributions. Annualized NOI, for all assets except Crystal City Marriott, represents NOI for the three months ended June 30, 2022 multiplied by four. Due to seasonality in the hospitality business, Annualized NOI for Crystal City Marriott represents the trailing 12-month NOI as of June 30, 2022. Management believes Annualized NOI provides useful information in understanding our financial performance over a 12-month period, however, investors and other users are cautioned against attributing undue certainty to our calculation of Annualized NOI. Actual NOI for any 12-month period will depend on a number of factors beyond our ability to control or predict, including general capital markets and economic conditions, any bankruptcy, insolvency, default or other failure to pay rent by one or more of our tenants and the destruction of one or
| | |
| | Page 52 |
| |
DEFINITIONS | JUNE 30, 2022 |
more of our assets due to terrorist attack, natural disaster or other casualty, among others. We do not undertake any obligation to update our calculation to reflect events or circumstances occurring after the date of this earnings release. There can be no assurance that the Annualized NOI shown will reflect our actual results of operations over any 12-month period.
This Investor Package also contains management's estimate of stabilized NOI and projections of NOI yield for Under-Construction and Near-Term Development Pipeline assets, which are based on management's estimates of property-related revenue and operating expenses for each asset. These estimates are inherently uncertain and represent management's plans, expectations and beliefs and are subject to numerous assumptions, risks and uncertainties. The property-related revenues and operating expenses for our assets may differ materially from the estimates included in this Investor Package. Management's projections of NOI yield are not projections of our overall financial performance or cash flow, and there can be no assurance that the Projected NOI Yield set forth in this Investor Package will be achieved.
Projected NOI Yield means our Estimated Stabilized NOI reported as a percentage of (i) Estimated Total Investment and (ii) Estimated Incremental Investment. Actual initial full year stabilized NOI yield may vary from the Projected NOI Yield based on the actual incremental investment to complete the asset and its actual initial full year stabilized NOI, and there can be no assurance that we will achieve the Projected NOI Yields described in this Investor Package.
We do not provide reconciliations for non-GAAP estimates on a future basis, including Estimated Stabilized NOI and expected annualized NOI because we are unable to provide a meaningful or accurate calculation or estimate of reconciling items and the information is not available without unreasonable effort. This inability is due to the inherent difficulty of forecasting the timing and/or amounts of various items that would impact net income (loss). Additionally, no reconciliation of Projected NOI Yield to the most directly comparable GAAP measure is included in this Investor Package because we are unable to quantify certain amounts that would be required to be included in the comparable GAAP financial measures without unreasonable efforts because such data is not currently available or cannot be currently estimated with confidence. Accordingly, we believe such reconciliations would imply a degree of precision that would be confusing or misleading to investors.
"Non-Same Store" refers to all operating assets excluded from the Same Store pool.
"Percent Leased" is based on leases signed as of June 30, 2022, and is calculated as total rentable square feet less rentable square feet available for lease divided by total rentable square feet expressed as a percentage. Out-of-service square feet are excluded from this calculation.
"Percent Occupied" is based on occupied rentable square feet/units as of June 30, 2022, and is calculated as (i) for office and retail space, total rentable square feet less unoccupied square feet divided by total rentable square feet, (ii) for multifamily space, total units less unoccupied units divided by total units, expressed as a percentage. Out-of-service square feet and units are excluded from this calculation.
"Pro Rata Adjusted General and Administrative Expenses", a non-GAAP financial measure, represents general and administrative expenses adjusted for share-based compensation expense related to the Formation Transaction and special equity awards and the general and administrative expenses of our third-party asset management and real estate services business that are directly reimbursed. We believe that adjusting such items not considered part of our comparable operations provides a meaningful measure to assess our general and administrative expenses as compared to similar real estate companies and in general.
"Recently Delivered" refers to commercial and multifamily assets that are below 90% leased and have been delivered within the 12 months ended June 30, 2022.
"Same Store" refers to the pool of assets that were In-Service for the entirety of both periods being compared, except for assets for which significant redevelopment, renovation, or repositioning occurred during either of the periods being compared.
"Second-generation" is a lease on space that had been vacant for less than nine months.
"Signed But Not Yet Commenced Leases" means leases that, as of June 30, 2022, have been executed but for which rent has not commenced.
| | |
| | Page 53 |
| |
DEFINITIONS | JUNE 30, 2022 |
"Square Feet" or "SF" refers to the area that can be rented to tenants, defined as (i) for commercial assets, rentable square footage defined in the current lease and for vacant space the rentable square footage defined in the previous lease for that space, (ii) for multifamily assets, management's estimate of approximate rentable square feet, (iii) for Under-Construction assets, management's estimate of approximate rentable square feet based on current design plans as of June 30, 2022, and (iv) for Near-Term and Future Development Pipeline assets, management's estimate of developable gross square feet based on current business plans with respect to real estate owned or controlled as of June 30, 2022.
"Transaction and Other Costs" include demolition costs, integration and severance costs, pursuit costs related to other completed, potential and pursued transactions, as well as other expenses.
"Under-Construction" refers to assets that were under construction during the three months ended June 30, 2022.
.
| | |
| | Page 54 |
| |
APPENDIX – TRANSACTION AND OTHER COSTS | JUNE 30, 2022 |
| | | | | | | | | | | | | | | | | |
| | | Three Months Ended | | |||||||||||||
| dollars in thousands |
| Q2 2022 |
| Q1 2022 |
| Q4 2021 |
| Q3 2021 |
| Q2 2021 | | |||||
| | | | | | | | | | | | | | | | | |
| Transaction and Other Costs |
| |
|
| |
| | |
| | |
| | |
| |
| Demolition costs | | $ | 406 | | $ | 22 | | $ | 704 | | $ | 1,422 | | $ | 439 | |
| Integration and severance costs | |
| 727 | |
| 145 | |
| 422 | |
| 154 | |
| 222 | |
| Completed, potential and pursued transaction expenses | |
| 854 | |
| 732 | |
| 392 | |
| 1,375 | |
| 1,609 | |
| Total (1) | | $ | 1,987 | | $ | 899 | | $ | 1,518 | | $ | 2,951 | | $ | 2,270 | |
| (1) | For Q1 2022 and Q4 2021, excludes $34,000 and $0.6 million of transaction costs attributable to noncontrolling interests. |
| | |
| | Page 55 |
| |
APPENDIX - EBITDA, EBITDAre AND ADJUSTED EBITDA RECONCILIATIONS (NON-GAAP) | JUNE 30, 2022 |
Are Appendix – EBITDAAre and Adjusted EBITDA
| | | | | | | | | | | | | | | | | |
| | | Three Months Ended | | |||||||||||||
| dollars in thousands |
| Q2 2022 |
| Q1 2022 |
| Q4 2021 |
| Q3 2021 |
| Q2 2021 |
| |||||
| | | | | | | | | | | | | | | | | |
| EBITDA, EBITDAre and Adjusted EBITDA |
| |
|
| |
| | |
| | |
| | |
| |
| Net income (loss) | | $ | 141,494 | | $ | (77) | | $ | (63,334) | | $ | 996 | | $ | (3,318) | |
| Depreciation and amortization expense | |
| 49,479 | |
| 58,062 | |
| 58,173 | |
| 56,726 | |
| 56,678 | |
| Interest expense | |
| 16,041 | |
| 16,278 | |
| 17,649 | |
| 17,243 | |
| 16,773 | |
| Income tax expense (benefit) | |
| 2,905 | |
| (471) | |
| (986) | |
| 217 | |
| (5) | |
| Unconsolidated real estate ventures allocated share of above adjustments | |
| 9,494 | |
| 9,829 | |
| 9,696 | |
| 10,147 | |
| 10,581 | |
| EBITDA attributable to noncontrolling interests | |
| (47) | |
| (26) | |
| 546 | |
| (54) | |
| (41) | |
| EBITDA | | $ | 219,366 | | $ | 83,595 | | $ | 21,744 | | $ | 85,275 | | $ | 80,668 | |
| (Gain) loss on the sale of real estate | |
| (158,767) | |
| 136 | |
| — | |
| — | |
| (11,290) | |
| Gain on the sale of unconsolidated real estate assets | |
| (936) | |
| (5,243) | |
| — | |
| (23,137) | |
| (5,189) | |
| Real estate impairment loss (1) | | | — | | | — | | | 25,144 | | | — | | | — | |
| Impairment related to unconsolidated real estate ventures (2) | | | — | | | — | | | 23,883 | | | 1,380 | | | — | |
| | | | | | | | | | | | | | | | | |
| EBITDAre | | $ | 59,663 | | $ | 78,488 | | $ | 70,771 | | $ | 63,518 | | $ | 64,189 | |
| Transaction and Other Costs (3) | |
| 1,987 | |
| 865 | |
| 888 | |
| 2,951 | |
| 2,270 | |
| Business interruption insurance proceeds | | | — | | | — | | | (4,517) | | | — | | | — | |
| Income from investments, net | | | (1,217) | | | (14,071) | | | (3,620) | | | — | | | — | |
| Loss on the extinguishment of debt | |
| 1,038 | |
| 591 | |
| — | |
| — | |
| — | |
| Share-based compensation related to Formation Transaction and special equity awards | |
| 1,577 | |
| 2,244 | |
| 3,459 | |
| 3,480 | |
| 4,441 | |
| Earnings and distributions in excess of our investment in unconsolidated real estate venture | |
| (124) | |
| (441) | |
| (181) | |
| (280) | |
| (92) | |
| Lease liability adjustments | | | — | | | — | | | (134) | | | — | | | — | |
| Unconsolidated real estate ventures allocated share of above adjustments | |
| 1,841 | |
| 204 | |
| (497) | |
| 130 | |
| 9 | |
| | | | | | | | | | | | | | | | | |
| Adjusted EBITDA | | $ | 64,765 | | $ | 67,880 | | $ | 66,169 | | $ | 69,799 | | $ | 70,817 | |
| | | | | | | | | | | | | | | | | |
| Net Debt to Annualized Adjusted EBITDA (4) | | | 8.1 | x |
| 9.6 | x |
| 9.6 | x |
| 7.9 | x |
| 7.6 | x |
| | | | | | | | | | | | | | | | | |
| Net Debt (at JBG SMITH Share) |
| June 30, 2022 |
| March 31, 2022 |
| December 31, 2021 |
| September 30, 2021 |
| June 30, 2021 |
| |||||
| Consolidated indebtedness (5) | | $ | 2,000,762 | | $ | 2,464,640 | | $ | 2,464,927 | | $ | 2,063,426 | | $ | 1,979,494 | |
| Unconsolidated indebtedness (5) | |
| 279,534 | |
| 362,861 | |
| 370,743 | |
| 362,698 | |
| 399,262 | |
| Total consolidated and unconsolidated indebtedness | |
| 2,280,296 | |
| 2,827,501 | |
| 2,835,670 | |
| 2,426,124 | |
| 2,378,756 | |
| Less: cash and cash equivalents | |
| 181,882 | |
| 207,568 | |
| 282,097 | |
| 213,612 | |
| 217,543 | |
| Net Debt (at JBG SMITH Share) | | $ | 2,098,414 | | $ | 2,619,933 | | $ | 2,553,573 | | $ | 2,212,512 | | $ | 2,161,213 | |
Note: All EBITDA measures as shown above are attributable to OP Units.
| (1) | In connection with the preparation and review of our annual financial statements, we determined that certain assets were impaired and recorded impairment losses in Q4 2021 totaling $25.1 million. |
| (2) | Includes an impairment on real estate assets taken by an unconsolidated real estate venture and an impairment of our investment in an unconsolidated real estate venture related to a decrease in the value of the underlying asset. |
| (3) | See page 55 for the components of Transaction and Other Costs. For Q1 2022 and Q4 2021, excludes $34,000 and $0.6 million of transaction costs attributable to noncontrolling interests. |
| (4) | Calculated using the Net Debt below. Adjusted EBITDA is annualized by multiplying by four. |
| (5) | Net of premium/discount and deferred financing costs. |
| | |
| | Page 56 |
| |
APPENDIX - FFO, CORE FFO AND FAD RECONCILIATIONS (NON-GAAP) | JUNE 30, 2022 |
Appendix – FFO, Core FFO and FAD
| | | | | | | | | | | | | | | | | |
| |
| Three Months Ended |
| |||||||||||||
| in thousands, except per share data |
| Q2 2022 |
| Q1 2022 |
| Q4 2021 |
| Q3 2021 |
| Q2 2021 |
| |||||
| | | | | | | | | | | | | | | | | |
| FFO and Core FFO | | |
|
| |
|
| |
|
| |
|
| |
| |
| Net income (loss) attributable to common shareholders | | $ | 123,275 | | $ | (32) | | $ | (56,446) | | $ | 893 | | $ | (2,973) | |
| Net income (loss) attributable to redeemable noncontrolling interests | |
| 18,248 | |
| 10 | |
| (6,256) | |
| 103 | |
| (345) | |
| Net loss attributable to noncontrolling interests | |
| (29) | |
| (55) | |
| (632) | |
| — | |
| — | |
| Net income (loss) | |
| 141,494 | |
| (77) | |
| (63,334) | |
| 996 | |
| (3,318) | |
| (Gain) loss on the sale of real estate, net of tax | |
| (155,642) | |
| 136 | |
| — | |
| — | |
| (11,290) | |
| Gain on the sale of unconsolidated real estate assets | |
| (936) | |
| (5,243) | |
| — | |
| (23,137) | |
| (5,189) | |
| Real estate depreciation and amortization | |
| 47,242 | |
| 55,517 | |
| 55,902 | |
| 54,547 | |
| 54,475 | |
| Real estate impairment loss, net of tax (1) | | | — | | | — | | | 24,301 | | | — | | | — | |
| Impairment related to unconsolidated real estate ventures (2) | | | — | | | — | | | 23,883 | | | 1,380 | | | — | |
| Pro rata share of real estate depreciation and amortization from unconsolidated real estate ventures | |
| 6,416 | |
| 6,870 | |
| 6,626 | |
| 7,002 | |
| 7,277 | |
| FFO attributable to noncontrolling interests | |
| (47) | |
| (26) | |
| 546 | |
| (54) | |
| (41) | |
| FFO Attributable to OP Units | | $ | 38,527 | | $ | 57,177 | | $ | 47,924 | | $ | 40,734 | | $ | 41,914 | |
| FFO attributable to redeemable noncontrolling interests | |
| (4,966) | |
| (5,877) | |
| (4,792) | |
| (4,703) | |
| (4,054) | |
| FFO Attributable to Common Shareholders | | $ | 33,561 | | $ | 51,300 | | $ | 43,132 | | $ | 36,031 | | $ | 37,860 | |
| | | | | | | | | | | | | | | | | |
| FFO attributable to OP Units | | $ | 38,527 | | $ | 57,177 | | $ | 47,924 | | $ | 40,734 | | $ | 41,914 | |
| Transaction and Other Costs, net of tax (3) | |
| 1,892 | |
| 843 | |
| 865 | |
| 2,928 | |
| 2,241 | |
| Business interruption insurance proceeds | | | — | | | — | | | (4,517) | | | — | | | — | |
| Income from investments, net | | | (957) | | | (10,538) | | | (2,711) | | | — | | | — | |
| (Gain) loss from mark-to-market on derivative instruments | |
| (2,027) | |
| (3,367) | |
| (292) | |
| 37 | |
| 46 | |
| Loss on the extinguishment of debt | |
| 1,038 | |
| 591 | |
| — | |
| — | |
| — | |
| Earnings and distributions in excess of our investment in unconsolidated real estate venture | |
| (124) | |
| (441) | |
| (181) | |
| (280) | |
| (92) | |
| Share-based compensation related to Formation Transaction and special equity awards | |
| 1,577 | |
| 2,244 | |
| 3,459 | |
| 3,480 | |
| 4,441 | |
| Lease liability adjustments | |
| — | |
| — | |
| (134) | |
| — | |
| — | |
| Amortization of management contracts intangible, net of tax | |
| 1,106 | |
| 1,105 | |
| 1,073 | |
| 1,072 | |
| 1,073 | |
| Unconsolidated real estate ventures allocated share of above adjustments | |
| 1,593 | |
| (48) | |
| (543) | |
| 112 | |
| 6 | |
| Core FFO Attributable to OP Units | | $ | 42,625 | | $ | 47,566 | | $ | 44,943 | | $ | 48,083 | | $ | 49,629 | |
| Core FFO attributable to redeemable noncontrolling interests | |
| (5,494) | |
| (4,889) | |
| (4,494) | |
| (5,552) | |
| (4,800) | |
| Core FFO Attributable to Common Shareholders | | $ | 37,131 | | $ | 42,677 | | $ | 40,449 | | $ | 42,531 | | $ | 44,829 | |
| FFO per diluted common share | | $ | 0.28 | | $ | 0.40 | | $ | 0.33 | | $ | 0.27 | | $ | 0.29 | |
| Core FFO per diluted common share | | $ | 0.31 | | $ | 0.34 | | $ | 0.31 | | $ | 0.32 | | $ | 0.34 | |
| Weighted average shares - diluted (FFO and Core FFO) | |
| 121,327 | |
| 126,688 | |
| 129,009 | |
| 131,351 | |
| 131,485 | |
See footnotes on page 58.
| | |
| | Page 57 |
| |
APPENDIX - FFO, CORE FFO AND FAD RECONCILIATIONS (NON-GAAP) | JUNE 30, 2022 |
| | | | | | | | | | | | | | | | | |
| in thousands, except per share data |
| Three Months Ended |
| |||||||||||||
| |
| Q2 2022 |
| Q1 2022 |
| Q4 2021 |
| Q3 2021 |
| Q2 2021 |
| |||||
| | | | | | | | | | | | | | | | | |
| FAD | | |
|
| |
|
| |
|
| |
|
| |
| |
| Core FFO attributable to OP Units | | $ | 42,625 | | $ | 47,566 | | $ | 44,943 | | $ | 48,083 | | $ | 49,629 | |
| Recurring capital expenditures and Second-generation tenant improvements and leasing commissions (4) | |
| (13,300) | |
| (13,702) | |
| (21,773) | |
| (12,124) | |
| (12,226) | |
| Straight-line and other rent adjustments (5) | |
| (1,978) | |
| (1,791) | |
| (2,985) | |
| (3,701) | |
| (4,088) | |
| Third-party lease liability assumption payments | |
| (25) | |
| — | |
| — | |
| (422) | |
| (703) | |
| Share-based compensation expense | |
| 10,171 | |
| 10,493 | |
| 9,663 | |
| 7,805 | |
| 9,045 | |
| Amortization of debt issuance costs | |
| 1,135 | |
| 1,176 | |
| 1,142 | |
| 1,126 | |
| 1,096 | |
| Unconsolidated real estate ventures allocated share of above adjustments | |
| (289) | |
| (648) | |
| (1,332) | |
| (1,478) | |
| (1,333) | |
| Non-real estate depreciation and amortization | |
| 760 | |
| 1,068 | |
| 795 | |
| 703 | |
| 727 | |
| FAD available to OP Units (A) | | $ | 39,099 | | $ | 44,162 | | $ | 30,453 | | $ | 39,992 | | $ | 42,147 | |
| Distributions to common shareholders and unitholders (B) | | $ | 31,768 | | $ | 32,603 | | $ | 33,137 | | $ | 33,688 | | $ | 33,511 | |
| FAD Payout Ratio (B÷A) (6) | | | 81.3 | % |
| 73.8 | % |
| 108.8 | % |
| 84.2 | % |
| 79.5 | % |
| | | | | | | | | | | | | | | | | |
| Capital Expenditures | |
|
| |
|
| |
|
| |
|
| |
|
| |
| Maintenance and recurring capital expenditures | | $ | 6,091 | | $ | 4,820 | | $ | 8,121 | | $ | 7,404 | | $ | 4,376 | |
| Share of maintenance and recurring capital expenditures from unconsolidated real estate ventures | |
| 312 | |
| 82 | |
| 168 | |
| 265 | |
| 324 | |
| Second-generation tenant improvements and leasing commissions | |
| 6,713 | |
| 8,594 | |
| 12,815 | |
| 3,762 | |
| 7,454 | |
| Share of Second-generation tenant improvements and leasing commissions from unconsolidated real estate ventures | |
| 184 | |
| 206 | |
| 669 | |
| 693 | |
| 72 | |
| Recurring capital expenditures and Second-generation tenant improvements and leasing commissions | |
| 13,300 | |
| 13,702 | |
| 21,773 | |
| 12,124 | |
| 12,226 | |
| Non-recurring capital expenditures | |
| 13,552 | |
| 12,810 | |
| 15,008 | |
| 5,885 | |
| 4,352 | |
| Share of non-recurring capital expenditures from unconsolidated real estate ventures | |
| 37 | |
| 12 | |
| 145 | |
| 177 | |
| 56 | |
| First-generation tenant improvements and leasing commissions | |
| 4,197 | |
| 4,450 | |
| 6,229 | |
| 2,603 | |
| 1,703 | |
| Share of First-generation tenant improvements and leasing commissions from unconsolidated real estate ventures | |
| 244 | |
| 473 | |
| 987 | |
| 93 | |
| 199 | |
| Non-recurring capital expenditures | |
| 18,030 | |
| 17,745 | |
| 22,369 | |
| 8,758 | |
| 6,310 | |
| Total JBG SMITH Share of Capital Expenditures | | $ | 31,330 | | $ | 31,447 | | $ | 44,142 | | $ | 20,882 | | $ | 18,536 | |
| (1) | In connection with the preparation and review of our annual financial statements, we determined that certain assets were impaired and recorded impairment losses in Q4 2021 totaling $25.1 million ($24.3 million after tax). |
| (2) | Includes an impairment on real estate assets taken by an unconsolidated real estate venture and an impairment of our investment in an unconsolidated real estate venture related to a decrease in the value of the underlying asset. |
| (3) | See page 55 for the components of Transaction and Other Costs. For Q1 2022 and Q4 2021, excludes $34,000 and $0.6 million of transaction costs attributable to noncontrolling interests. |
| (4) | Includes amounts, at JBG SMITH Share, related to unconsolidated real estate ventures. |
| (5) | Includes straight-line rent, above/below market lease amortization and lease incentive amortization. |
| (6) | The quarterly FAD payout ratio is not necessarily indicative of an amount for the full year due to fluctuation in the timing of capital expenditures, the commencement of new leases and the seasonality of our operations. |
| | |
| | Page 58 |
| |
APPENDIX - NOI RECONCILIATIONS (NON-GAAP) | JUNE 30, 2022 |
Appendix – NOI Reconciliations
| | | | | | | | | | | | | | | | | |
| in thousands |
| Three Months Ended |
| |||||||||||||
| |
| Q2 2022 |
| Q1 2022 |
| Q4 2021 |
| Q3 2021 |
| Q2 2021 |
| |||||
| Net income (loss) attributable to common shareholders | | $ | 123,275 | | $ | (32) | | $ | (56,446) | | $ | 893 | | $ | (2,973) | |
| Add: | |
|
| |
|
| |
|
| |
|
| |
|
| |
| Depreciation and amortization expense | |
| 49,479 | |
| 58,062 | |
| 58,173 | |
| 56,726 | |
| 56,678 | |
| General and administrative expense: | |
|
| |
|
| |
|
| |
|
| |
|
| |
| Corporate and other | |
| 14,782 | |
| 15,815 | |
| 15,344 | |
| 12,105 | |
| 13,895 | |
| Third-party real estate services | |
| 24,143 | |
| 27,049 | |
| 27,124 | |
| 25,542 | |
| 25,557 | |
| Share-based compensation related to Formation Transaction and special equity awards | |
| 1,577 | |
| 2,244 | |
| 3,459 | |
| 3,480 | |
| 4,441 | |
| Transaction and Other Costs | |
| 1,987 | |
| 899 | |
| 1,518 | |
| 2,951 | |
| 2,270 | |
| Interest expense | |
| 16,041 | |
| 16,278 | |
| 17,649 | |
| 17,243 | |
| 16,773 | |
| Loss on the extinguishment of debt | |
| 1,038 | |
| 591 | |
| — | |
| — | |
| — | |
| Impairment loss | | | — | | | — | | | 25,144 | | | — | | | — | |
| Income tax expense (benefit) | |
| 2,905 | |
| (471) | |
| (986) | |
| 217 | |
| (5) | |
| Net income (loss) attributable to redeemable noncontrolling interests | |
| 18,248 | |
| 10 | |
| (6,256) | |
| 103 | |
| (345) | |
| Net loss attributable to noncontrolling interests | | | (29) | | | (55) | | | (632) | | | — | | | — | |
| Less: | |
|
| |
|
| |
|
| |
|
| |
|
| |
| Third-party real estate services, including reimbursements revenue | |
| 22,157 | |
| 23,970 | |
| 23,309 | |
| 25,842 | |
| 26,745 | |
| Other income | |
| 1,798 | |
| 2,196 | |
| 2,013 | |
| 1,568 | |
| 1,904 | |
| Income (loss) from unconsolidated real estate ventures, net | |
| (2,107) | |
| 3,145 | |
| (25,583) | |
| 20,503 | |
| 3,953 | |
| Interest and other income (loss), net | |
| 1,672 | |
| 14,246 | |
| 8,672 | |
| 192 | |
| (38) | |
| Gain (loss) on the sale of real estate | |
| 158,767 | |
| (136) | |
| — | |
| — | |
| 11,290 | |
| | | | | | | | | | | | | | | | | |
| Consolidated NOI | |
| 71,159 | |
| 76,969 | |
| 75,680 | |
| 71,155 | |
| 72,437 | |
| NOI attributable to unconsolidated real estate ventures at our share | |
| 8,321 | |
| 6,967 | |
| 6,289 | |
| 7,336 | |
| 8,109 | |
| Non-cash rent adjustments (1) | |
| (1,978) | |
| (1,791) | |
| (2,985) | |
| (3,701) | |
| (4,088) | |
| Other adjustments (2) | |
| 5,695 | |
| 8,760 | |
| 6,107 | |
| 4,683 | |
| 5,191 | |
| Total adjustments | |
| 12,038 | |
| 13,936 | |
| 9,411 | |
| 8,318 | |
| 9,212 | |
| NOI | | $ | 83,197 | | $ | 90,905 | | $ | 85,091 | | $ | 79,473 | | $ | 81,649 | |
| Less: out-of-service NOI loss (3) | |
| (2,046) | |
| (1,448) | | | (1,745) | | | (2,019) | | | (1,329) | |
| Operating portfolio NOI | | $ | 85,243 | | $ | 92,353 | | $ | 86,836 | | $ | 81,492 | | $ | 82,978 | |
Note: NOI, Non-Same Store NOI and Same Store NOI are presented as originally reported in the respective quarter.
| (1) | Adjustment to exclude straight-line rent, above/below market lease amortization and lease incentive amortization. |
| (2) | Adjustment to include other revenue and payments associated with assumed lease liabilities related to operating properties and to exclude commercial lease termination revenue and allocated corporate general and administrative expenses to operating properties. |
| (3) | Includes the results of our Under-Construction assets and Near-Term and Future Development Pipelines. |
| | |
| | Page 59 |

JBGS Divider