May 7, 2019
To Our Fellow Shareholders:
We are pleased to report on our performance for the first quarter of 2019. For details regarding our financial and operating results, please see our first quarter earnings release and supplemental information, which follow this letter. In April, we held our first of two investor days for 2019 and posted the related presentation on our website. At the end of this letter are highlights from that presentation, including an updated estimated NOI bridge, Amazon’s potential NAV impact on our portfolio, and an illustrative timeline of important National Landing milestones.
Over the past five months, we executed definitive documentation for the initial Amazon leases and land sales, successfully closed a $472 million equity offering, completed the construction of 500 L’Enfant Plaza under budget and two quarters ahead of schedule, and closed a $115 million asset sale. We also reached an important milestone when Arlington County and the Commonwealth of Virginia enacted the Amazon-related incentive, infrastructure, and education legislation. In April, we announced a fourth lease with Amazon for approximately 48,000 square feet at 2345 Crystal Drive. This growth beyond their initial footprint demonstrates Amazon’s growing commitment to National Landing, as well as the strength of our public-private partnership with the County and the Commonwealth. Amazon’s decision to increase its footprint right on Crystal Drive also serves as further validation of our ongoing repositioning of this important retail main street in the submarket.
Equity Offering
In April, we successfully completed our first equity offering, issuing 11.5 million shares at $42.00 per share, and raising net proceeds of approximately $472 million, including an upsize and full exercise of the overallotment option. The positive investor response to our offering demonstrates a high level of support for JBG SMITH and our growth plans. The proceeds from the offering, combined with our ongoing capital recycling efforts, provide the capital to fund the approximately $457 million of estimated remaining investment in our nine Under Construction assets, as well as future development opportunities that we intend to accelerate as a result of Amazon’s presence in National Landing. Our strategy behind the timing, pricing, and sizing of the offering is detailed below.
Timing
The scale of Amazon-related internal investment opportunity in National Landing is significant and will require capital beyond our current 2019 capital recycling target of $400 million. Based on its strong growth during and after
the last recession, and the subsequent rapid growth of Amazon Web Services (AWS), we expect Amazon to grow its presence irrespective of the economic cycle. We further expect that our existing concentrated holdings in National Landing will significantly benefit from the placemaking impact of new development in the submarket. To capitalize on these opportunities in a timely fashion with prudent leverage will require ample liquidity. While we intend to continue individual asset sales for as long as the window remains open, the capital sourced in our recent equity offering enables us to execute our near-term Amazon-related growth opportunities without taking extended cap rate risk on future asset sales as a primary funding source. Although some of these investment opportunities are still several quarters away, we believe it is prudent to raise capital when you can, rather than when it is needed. All told, the balance sheet capacity created by the equity offering puts us in a stronger position to unlock value sooner and drive greater long-term NAV per share growth without straining our balance sheet.
Pricing
We evaluate every capital allocation decision through the lens of maximizing long-term NAV per share, and our recent offering was no exception. We believe the modest dilution associated with selling shares at a discount to our estimate of NAV will more than pay for itself over the long term by funding substantial additional internal growth while maintaining a strong balance sheet. While asset sales offer the prospect of sourcing capital at NAV, tax implications and borrowing capacity frequently require selling a greater value of assets for each dollar of desired liquidity. In addition, asset sales take time and depend on cap rates remaining low for the foreseeable future. As long as market conditions are supportive, we intend to continue to capitalize on sale opportunities, but sustained favorable conditions are not a given. Combining our ongoing capital recycling efforts with the immediate liquidity provided by the offering is a more balanced, lower risk means of maintaining balance sheet strength while not missing a beat when it comes to unlocking the future NAV growth embedded in our National Landing development portfolio.
Sizing
We sized the offering to fund the remaining spend related to our nine current Under Construction assets in a leverage neutral manner, and with careful attention to the balance between future growth opportunities and the impact of near-term dilution. Net proceeds from the offering reduced our Net Debt/Total Enterprise Value by 620 basis points and our Net Debt/Adjusted EBITDA by 1.7x on a proforma basis as of March 31, 2019. This allows additional investment in future growth opportunities now without the need to wait for the borrowing capacity that will come from the delivery and stabilization of our current Under Construction assets. While we would “never say never” when it comes to accessing the public equity markets for additional funding, we deliberately sized the offering at a level that would allow us to execute our current business plans without the need to return to the public markets for the foreseeable future.
Leverage Profile
Given that a high percentage of our assets are not income producing, consisting primarily of our Under Construction assets and Future Development Pipeline, we believe the most meaningful metric to evaluate our leverage is Net
Debt/Total Enterprise Value. We believe the appropriate stabilized range of Net Debt/Total Enterprise Value for JBG SMITH is between 25% and 35% and the appropriate stabilized Net Debt/Adjusted EBITDA is between 6x and 7x, with peak levels in the mid-8x’s during times of more active development. We have not changed our view on stabilized leverage levels, though we may operate at lower levels while building balance sheet capacity for future investment opportunities. At this point in the cycle, our bias is to operate at or below the low end of these ranges to ensure ample capacity for future investment opportunity when the cycle turns.
As of March 31, 2019, our pro forma Net Debt/Total Enterprise Value was 20.1% and our Net Debt/Adjusted EBITDA was 5.4x, adjusted for our recent equity offering. We expect our Net Debt/Adjusted EBITDA ratio to peak in the low 7.0x’s in the second half of this year, before declining, as we deliver our Under Construction assets. Future leverage levels will fluctuate based on the scale and timing of capital recycling and construction starts. That said, assuming the delivery of our nine Under Construction assets and 1900 Crystal Drive, as well as the successful execution of our $400 million capital recycling plan for 2019, we believe we have sufficient capacity to execute the entirety of our multifamily development pipeline in National Landing (approximately 4,000 to 5,000 units) over the next five years, while maintaining prudent leverage in accordance with our stated target levels.
Washington, DC Market Update
In the first quarter, the broad themes of office underperformance and positive multifamily momentum continued with little change. Looking forward, we expect continued downward momentum, particularly for commodity Class A office in DC proper, as more than 5 million square feet of new construction comes online over the next 12 to 24 months.
While it is still early days for Amazon’s impact in National Landing, signs of the submarket’s turnaround are here, and we maintain a bullish outlook on its long-term fundamentals. This view is shared by the brokerage community as evidenced by JLL’s recently increased estimate of average direct asking rents within National Landing to $43.97 per square foot - up from $37.66 per square foot in the fourth quarter, representing a 16.7% increase. Significantly, JLL’s estimate is also only slightly below the $44.60 per square foot average for the Rosslyn Ballston Corridor, which we believe indicates acceptance among the brokerage community that rent expectations for National Landing have reset in a post-Amazon environment.
Multifamily fundamentals remain more encouraging than office, showing positive rent growth over a trailing 12-month period with almost all JBG SMITH Class A submarkets posting above-inflationary same-store growth according to CoStar data. Half of the first quarter’s nearly 1,800 units of new deliveries were in the District - all in emerging markets. While it’s too early to speak definitively about the ultimate performance of these units, early signs are positive. In late April, CoStar reported that new deliveries (including some delivered after the close of the quarter) were nearly 40% leased on average, with only a half month of concessions, signaling continued strong demand for amenity-rich emerging markets even in the face of new supply.
On the investment sales front, headlines indicate continued strong volume across office and multifamily, but some notable trends have begun to emerge. In office, despite strong transaction volume in 2018, JLL noted that foreign buyer volume fell dramatically and is now negative, indicating foreign investors were net sellers through the first quarter of 2019. Reports from brokers other than JLL indicate that bidder pools are thinning, and pricing is wide of expectations on some recently marketed deals of which there are an increasing number. As JLL noted, while trophy deals are relatively thin, there is a wide variety of core plus and value-add deals currently on the market, which should provide an indication of pricing and investor depth soon. While it is too early to identify a definitive trend, these data points may be symptomatic of a cooling of the investment sales market, with the possible exception of National Landing.
In National Landing, while there are still very few comparable transactions, one recent example indicates that there is more investor demand for office assets than we have previously seen. Presidential Tower, an office asset located further south from Amazon’s new headquarters than the bulk of our holdings and a half mile from the Metro, is rumored to be under contract at a mid-to-high 5% cap rate, having attracted a deep pool of largely institutional buyers. The rumored pricing for this asset is noticeably more favorable than anything National Landing has seen in years.
According to CoStar data, multifamily volume stayed strong through the end of 2018, but was driven almost entirely by value-add opportunities in the Class B space. Class A volume has been consistently dropping since 2015, driven by a lack of investor depth in the market and the unwillingness of sellers to capitulate. As with the office market, we have seen the opposite trend in National Landing. As we noted last quarter, the Meridian at Pentagon City, a 2001 vintage building, recently went under contract to a private buyer at a 3.7% cap rate - substantially below the 4.6% average Arlington cap rate over the past three years. We believe this aggressive pricing was driven by substantial investor depth and the expectation of outsized rent growth fueled by Amazon-related demand.
Operating Portfolio
Our 10.9 million square foot operating commercial portfolio (at share) generated $240.2 million of annualized NOI and was 90.2% leased and 85.6% occupied as of the end of the first quarter. The 4.6% delta between the leased and occupied metrics for the overall operating commercial portfolio represents an additional $28.9 million of annualized estimated rent from signed but not yet commenced leases that will come on line over the next few years. A more comprehensive discussion of our total operating portfolio NOI, including our defensive leasing strategy, the impacts of our capital recycling efforts, and our development investments can be found at the end of this letter.
During the quarter we completed 32 office lease transactions totaling 785,000 square feet (at share), including 511,000 square feet in our operating portfolio and 274,000 square feet in our Under Construction portfolio. These amounts include 537,000 square feet of leasing related to Amazon. For second-generation leases, the rental rate mark-to-market was negative 6.8% on a cash basis. Although some quarters will be lower, and others will be
higher, this is in-line with our updated expectation of a negative 3.0% average mark-to-market through 2024, which we expect to be higher in the front-end of this time period and lower in the back-end.
Consistent with the expectations we outlined last year, same store NOI decreased 10.1% across our operating portfolio during the first quarter, predominately related to the previously discussed blend-and-extend lease renewals we executed in 2017 and 2018. These early blend-and-extend lease renewals significantly de-risk our DC assets at a time of increasing supply and downturn risk, as well as enhance the potential for asset sale or recapitalization on a more attractive basis. As a result of this defensive leasing strategy, we have significantly mitigated our renewal risk, with no private sector leases greater than 55,000 square feet rolling before the end of 2020. We expect the concessions associated with these early blend-and-extend lease renewals to result in negative same store NOI throughout 2019. As free rent in these leases burns off, we expect the temporary NOI decline associated with this strategy to reverse in the second half of 2019, with same store NOI turning positive again in 2020.
We are focusing on risk mitigation in our DC office holdings and positioning our commercial portfolio in National Landing for growth. In our DC portfolio, we have been aggressively reducing our rollover exposure as described above, executing on the lease-up of our Under Construction assets, which now stand at 82.1% pre-leased, and disposing of Commodity A office assets, generating proceeds at attractive pricing and reducing our exposure to this segment from 7% to 3% of our overall portfolio. In National Landing, we are positioning our portfolio to capture future rent growth through a combination of strategies, including shorter lease terms or longer-term leases with mid-term mark-to-market or fixed rent bump provisions on top of annual escalators. While still early, we have seen increased interest and inbound requests for tours from technology and higher education tenants interested in participating in the dynamic technology ecosystem we are creating. While Amazon’s growth will likely be gradual, we are encouraged by this increased level of interest.
Our operating multifamily portfolio, comprising approximately 4,531 units (at share), generated $81.4 million of annualized NOI and ended the first quarter at 97.0% leased. We saw particularly strong occupancy gains at 1221 Van Street, which ended the first quarter at 89.2% leased. We believe this is a strong position to be in heading into the spring leasing market. In addition, our continued focus on customer service initiatives across our multifamily portfolio has produced an online customer review score that is 18% above the Reputation.com multifamily industry average.
Development Portfolio
Under Construction
At the end of the first quarter, we had nine assets under construction, all of which have guaranteed maximum price construction contracts in place. These assets have weighted average estimated completion and stabilization dates of the second quarter of 2020 and the second quarter of 2021, respectively, with a projected NOI yield based on
Estimated Total Project Cost of 6.4%. Commercial assets represent approximately 927,000 square feet (at share), of which 82.1% is pre-leased.
In the first quarter, we completed construction on 500 L’Enfant Plaza, under budget and two quarters ahead of schedule. The building is 74.3% pre-leased, from the bottom up, to Urban Institute and Noblis. This asset will move into our recently delivered operating commercial portfolio next quarter.
Near-Term Development
We do not have any assets in the Near-Term Development Pipeline as of March 31, 2019. As a reminder, we only place assets into our Near-Term Development Pipeline when they have substantially completed the entitlement process and when we intend to commence construction within 18 months, subject to market conditions. Based on our current plans, we expect to place 1900 Crystal Drive into Near-Term Development by the end of this year. While our initial zoning application for this site calls for multifamily development, it may be developed as either multifamily or office depending upon potential tenant demand. We remain on track with our entitlement efforts, and we expect to commence construction on 1900 Crystal Drive in 2020. In addition, as other National Landing multifamily opportunities receive final entitlements, we expect them to transition from our Future Development Pipeline into Near-Term Development.
Future Development Pipeline
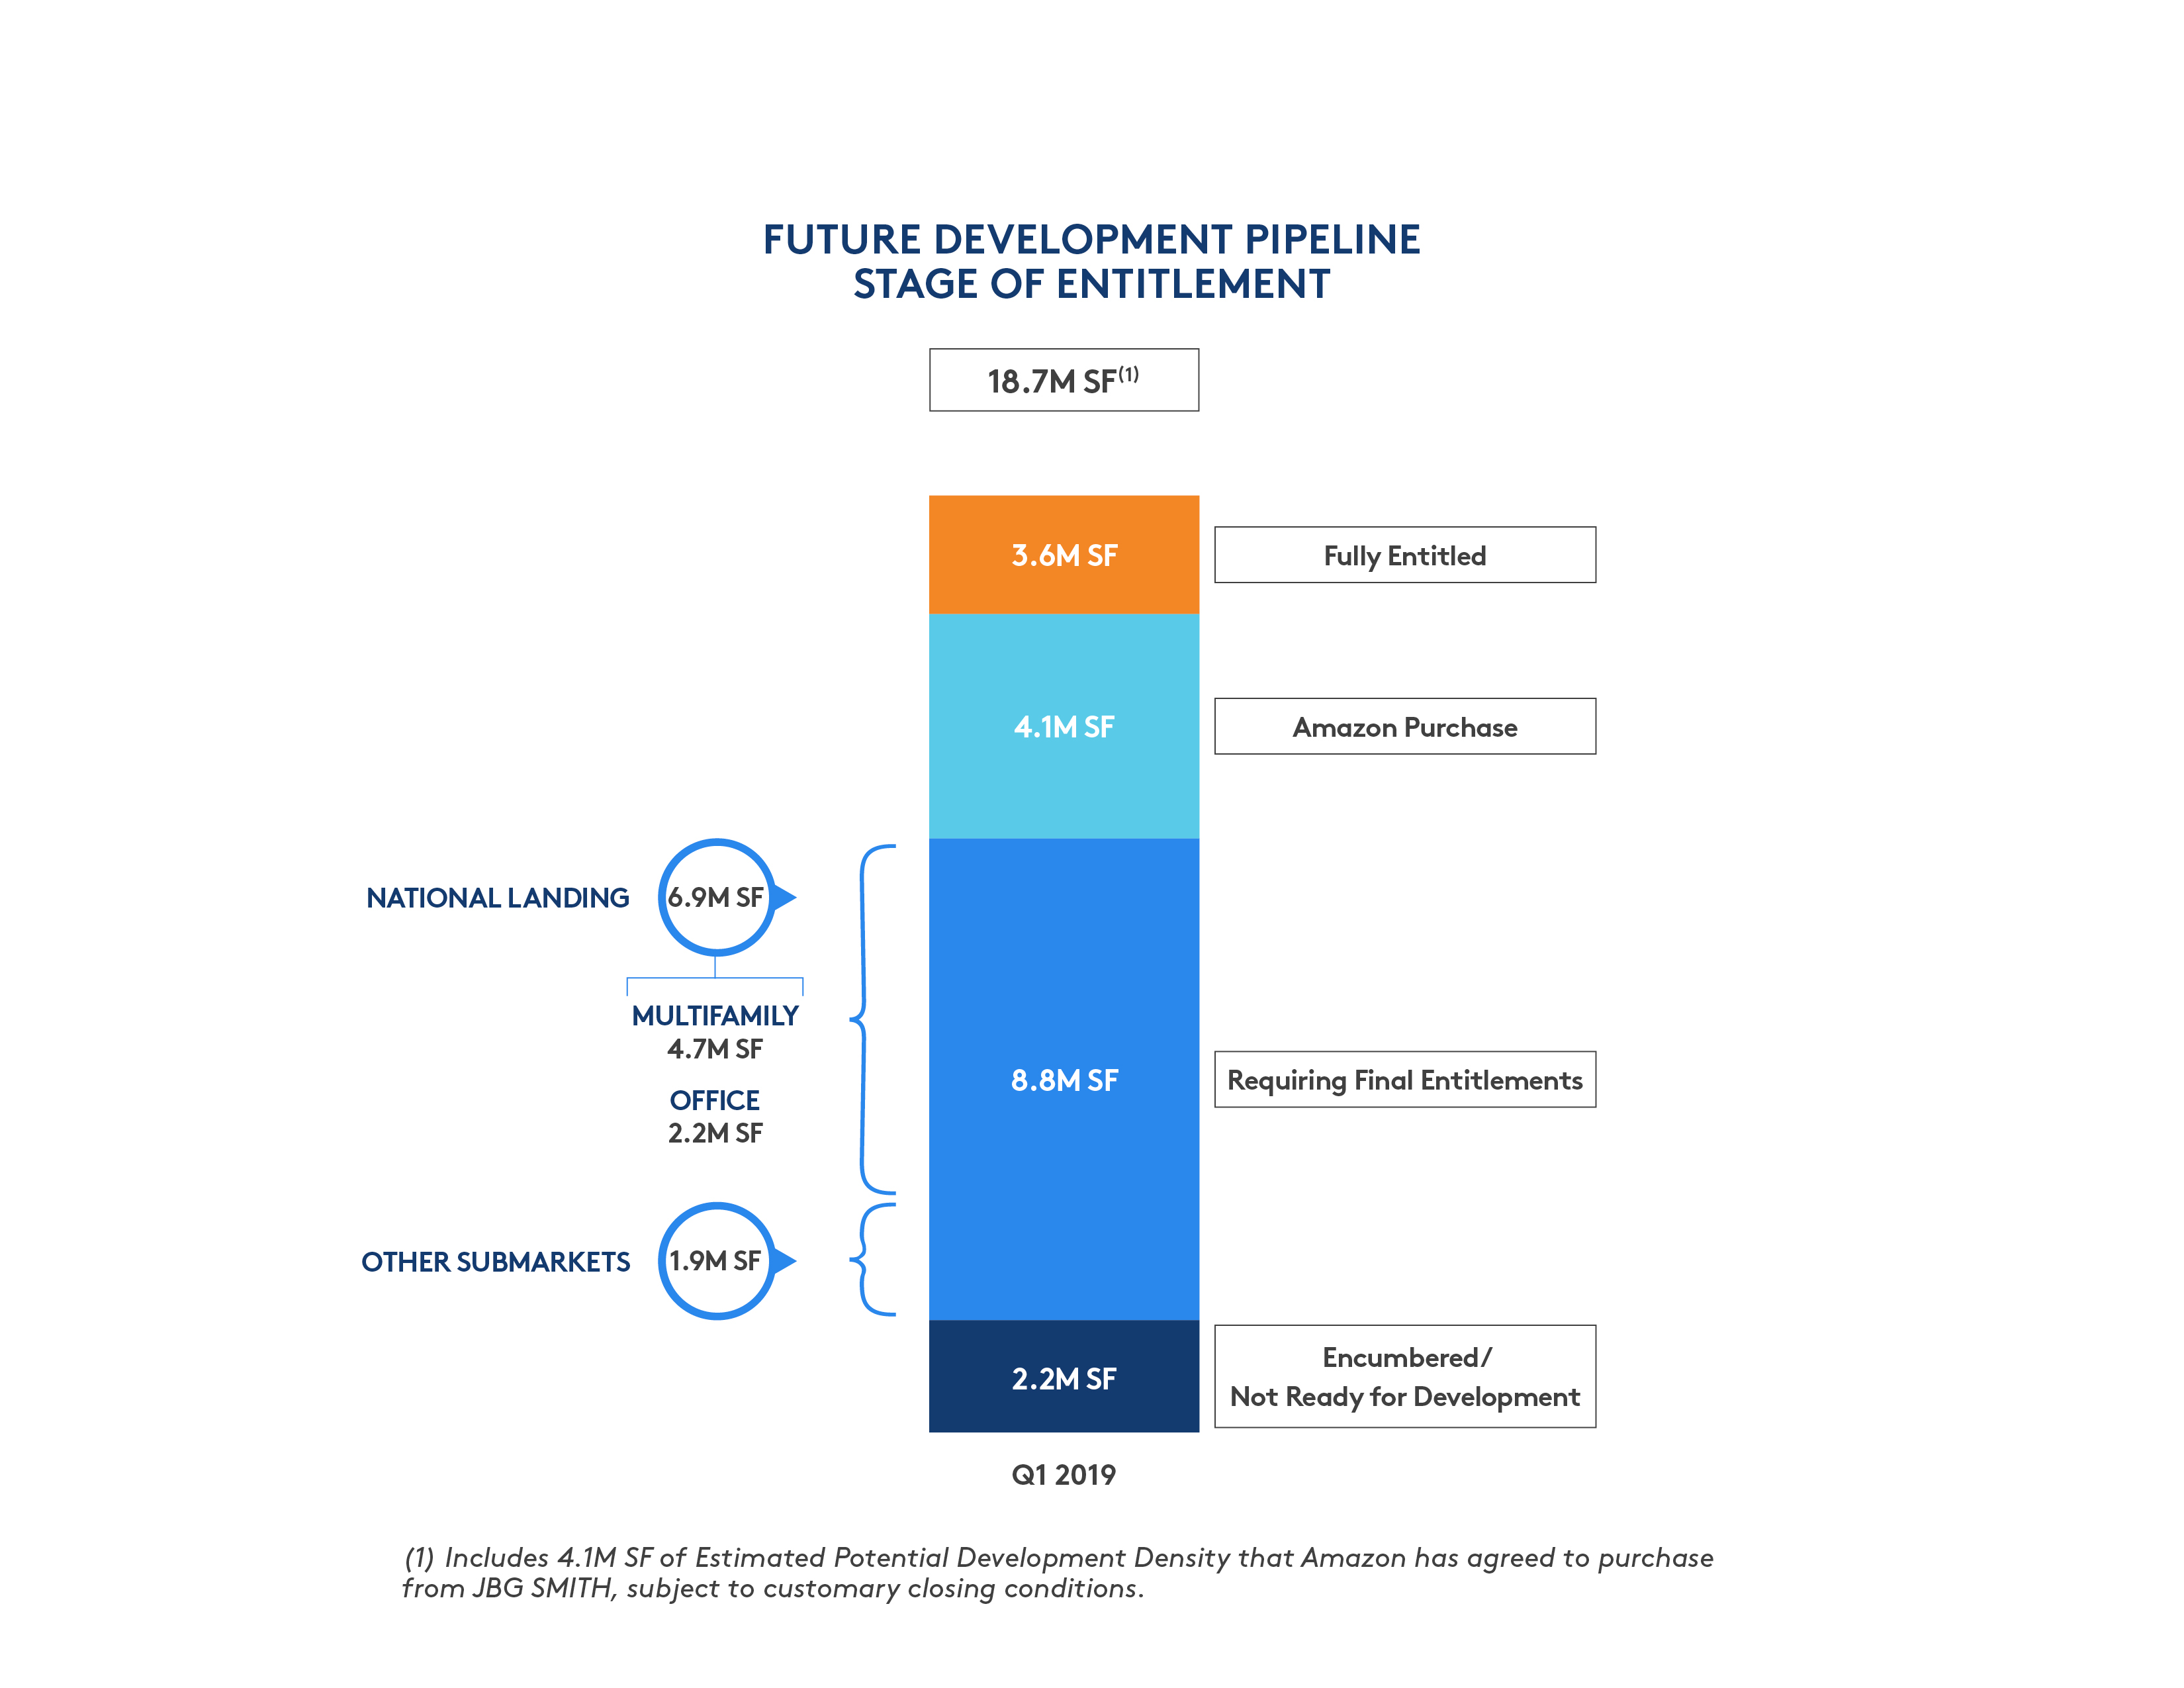
Our Future Development Pipeline comprises 18.7 million square feet (at share), with an Estimated Total Investment per square foot of approximately $38.38. At the end of the first quarter approximately 58.8% of this pipeline was in National Landing, 18.6% was in DC, 13.9% was in Reston, and the remaining 8.7% was in other Virginia and Maryland submarkets. 78% of this pipeline is within a 20-minute commute of National Landing, the geography that we believe will most directly benefit from Amazon’s growth over time. Our DC holdings are concentrated in the fast-growing emerging submarkets of Union Market and the Ballpark, and our Reston holdings include one of the best development sites on the Metro, adjacent to Reston Town Center.
Of the 18.7 million square feet in our Future Development Pipeline, 4.1 million square feet is held for sale to Amazon, 3.6 million square feet is fully entitled, and the remaining 11.0 million square feet is zoned for our planned use, but still requires the final stage of design and/or entitlement. Of the 11.0 million square feet requiring final entitlement, we are actively advancing 8.8 million square feet, which we expect to be fully entitled within the next two years. The remaining 2.2 million square feet is either encumbered with existing lease term or encompasses land that we do not believe suitable for new development in the near term.
Approximately 63% or 6.9 million square feet of the 11.0 million square feet requiring final entitlements is in National Landing. This amount excludes the 4.1 million square feet currently held for sale to Amazon. Based on our current plans, we expect 2.2 million square feet to be office, which can be pre-leased to Amazon or other tenants seeking to
co-locate near Amazon, and 4.7 million square feet, totaling approximately 4,000 to 5,000 units, to be multifamily. Within the next year, we expect final entitlement approvals on the vast majority of these opportunities.
The following bar chart summarizes the data described above:
We believe the value of these development opportunities as a whole exceeds the sum of the values of each project because our placemaking plans will benefit our surrounding holdings and the entire National Landing submarket. As a result, accelerating the execution of these development opportunities will better enable us to achieve our goal of maximizing long-term NAV per share growth.
Third-Party Asset Management and Real Estate Services Business
Our share of revenue from our third-party asset management and real estate services business was $13.8 million in the first quarter, primarily driven by $5.1 million in property management fees and $3.4 million in asset management fees. The portion of total revenues associated with the JBG Legacy Funds was $6.2 million. The Funds continued to focus on disposing of assets in accordance with their underlying business plans. We expect Amazon to pay third-
party fees to JBG SMITH for development, construction management, retail leasing, and property management services at market rates, which we expect to offset the reduction in fees from the wind down of the JBG Legacy Fund business over the next 3-6 years. It is worth noting that we have been retained as the third-party property manager on approximately 23% (based on square feet at 100%) of the assets we have sold since the spin-off. This includes approximately 46% of all commercial assets sold.
Capital Allocation
Acquisitions
On the acquisition front, we remain cautious given aggressive pricing across asset classes. As part of the sale of Pen Place and Mets 6, 7, and 8 to Amazon, we preserved flexibility to facilitate 1031 exchange opportunities. We have already identified our first exchange candidate for the Mets sites - a stabilized DC multifamily asset which is expected to close later this year. We expect Pen Place to close in 2020, and we intend to seek a 1031 exchange with the proceeds from that sale. We are targeting acquisitions for these 1031 exchanges that will generate approximately $15 million of annualized NOI.
Dispositions
As we outlined earlier this year, we plan to continue to seek capital recycling opportunities where we can source capital at or above our estimated NAV. We are targeting approximately $400 million of asset sales and recapitalizations in 2019. In the first quarter, we closed the sale of Commerce Executive for $115 million, and we entered into firm contracts, subject to customary closing conditions, for the sale of 4.1 million square feet of land to Amazon for $294 million. Of the $294 million, we expect approximately $150 million associated with Mets 6, 7, and 8 to close in 2019. For low-basis sale candidates, such as the land we are selling to Amazon, we plan to seek 1031 exchanges that would allow us to trade out of low-return assets into higher-yielding development opportunities or acquisitions with better long-term growth profiles. In the current environment, these are more likely to be multifamily assets. We are also focused on additional opportunities to turn land assets into income streams via 1031 exchanges or ground leases.
Development
We continue to advance the entitlement and design of opportunities in our Future Development Pipeline. We expect multifamily development opportunities to remain attractive, particularly in light of potentially declining supply levels, especially in National Landing and other emerging growth submarkets with strong demand drivers. In these locations, we expect to be active developers in the face of new demand.
Balance Sheet
As of March 31, 2019, we had $395.6 million of cash ($405.6 million of cash at share), excluding the $472million of net proceeds from our equity offering, and $1.1 billion available on our credit facility. Adjusted for the offering, and using our share price at March 31, 2019, our pro forma Net Debt/Total Enterprise value was 20.1% and our pro forma Net Debt/Adjusted EBITDA was 5.4x. As expressed at the beginning of this letter, our leverage metrics include the debt incurred to date to develop our nine Under Construction assets but not the estimated NOI from those assets. Therefore, we believe Net Debt/Total Enterprise Value is the most meaningful measure to evaluate our leverage. Our long-term leverage targets remain unchanged at 25% to 35% Net Debt/Total Enterprise Value and between 6x and 7x Net Debt/Adjusted EBITDA, with peak levels in the mid-8x’s during times of more active development. We plan to continue to execute our 2019 capital recycling program, which we expect will strengthen our ability to pursue long-term growth opportunities without incurring ongoing funding or leverage risk.
As of March 31, 2019, our average debt maturity was 3.8 years, with approximately $441.2 million (at our share) coming due in the next two years. Consistent with our strategy to finance our business primarily with non-recourse, asset-level financing, 88% of our consolidated and unconsolidated debt is mortgage debt, of which only approximately $8.3 million is recourse to JBG SMITH. Subsequent to the end of the first quarter, we repaid mortgage debt totaling approximately $293.6 million at The Bartlett and Fort Totten Square. After these repayments, our debt is 78% fixed rate, and we have caps in place for 49% of our floating rate debt.
Environmental, Social, and Governance
In mid-2018, we launched the Washington Housing Initiative (WHI) in partnership with the Federal City Council to preserve or build up to 3,000 units of affordable workforce housing in the Washington, DC region over the next decade. The WHI consists of a third-party non-profit, the Washington Housing Conservancy, and the Impact Pool, a JBG SMITH-managed debt financing vehicle. In April, the Washington Housing Conservancy announced its formation, and the Impact Pool has received significant investor interest. As a reminder, the Impact Pool has a targeted size of $150 million, of which we expect to contribute between $10 and $15 million. The first closing on the Impact Pool is expected within days, which should enable the initiative to begin making investments in late 2019.
We are proactive about succession planning and the cultivation of talent. As a reflection of that effort we are excited to announce that Elizabeth Morrison assumed leadership of our Debt Capital Markets team and is responsible for sourcing and managing all aspects of our debt portfolio. Elizabeth is a Senior Vice President and has been part of our team since 2014.
* * *
As always, thank you for taking the time to read this letter and to better understand JBG SMITH. As significant shareholders, we are excited about the long-term value creation opportunities ahead of us, particularly in National Landing, and we will continue to work hard to maintain your trust and confidence as we execute our growth plans.
W. Matthew Kelly
Chief Executive Officer
Investor Day Highlights
Last month, we hosted our first of two investor days for 2019 and posted the related presentation on our website, which can be found at http://investors.jbgsmith.com/presentations.
In our investor day presentation, we detailed our strategy and our 2018 accomplishments, including the pursuit and win of Amazon’s new headquarters, our capital recycling strategy, the improved profile of our commercial operating portfolio, the accelerated monetization of our Under Construction assets and Future Development Pipeline, and our ESG efforts throughout the organization. Our presentation also describes our growth and capitalization plans through 2024, including an updated estimated NOI bridge and the potential NAV impact of Amazon’s arrival on our holdings in National Landing.
Estimated NOI Bridge
There are three main drivers of change in our updated estimated NOI bridge since it was last published - 1) improved portfolio composition from our capital recycling efforts and the delivery of four Under Construction assets; 2) the defensive leasing strategy we have pursued over the past two years in our commercial operating portfolio; and 3) the impact we expect from Amazon’s presence in National Landing given the significant concentration of our holdings around its new headquarters. We estimated our annualized NOI through the fourth quarter of 2024, which matches the estimated stabilization period of 1900 Crystal Drive. As detailed in our estimated NOI bridge, after adjusting for assets already sold, our fourth quarter 2018 annualized NOI was $320 million. We expect this to grow to $550 million by the fourth quarter of 2024, which is an implied 9.4% NOI CAGR over this period. We expect our estimated NOI growth to be back-end weighted and to come from the following three sources:
| |
| 1) | $116 million of expected NOI growth from our operating portfolio, which represents a 5.3% NOI CAGR. As a reminder, we expect our NOI to decline during 2019, due to free rent associated with our defensive blend-and-extend leasing activity. We expect this to be a temporary NOI decline that will reverse in 2020 as concessions burn off. The $116 million of growth comprises the following: |
| |
| ▪ | $83 million (72%) from anticipated 3% base rental revenue growth across both the commercial and multifamily portfolios. This assumes a negative 3% weighted average mark-to-market on office rents for renewals and second-generation leases versus the negative 5% we previously assumed. |
| |
| ▪ | $33 million (28%) from the expected lease-lease-up |
| |
| ▪ | up of our operating portfolio. While our lease-up assumptions for the multifamily portfolio remain unchanged at 95% occupancy, our target lease-up assumption for the commercial portfolio has increased to 93% versus the 91.5% we previously assumed. |
| |
| ▪ | The primary driver behind these increases is anticipated Amazon-related demand in National Landing. |
| |
| ▪ | 80% of our operating portfolio NOI growth is commercial, 20% is multifamily, and approximately 53% is from our assets in National Landing. |
| |
| 2) | $99 million of expected NOI growth from the delivery and stabilization of our nine Under Construction assets and 1900 Crystal Drive, expected to commence construction in 2020. As of the fourth quarter of 2018, we plan to invest over $880 million in these 10 assets over the next four years. Assuming 1900 Crystal Drive is a multifamily project, the expected NOI from these 10 assets is 63% multifamily and 37% commercial, of which approximately 82.1% is pre-leased. |
| |
| 3) | $15 million of expected NOI growth from the exchange of proceeds from the Amazon land sale into stabilized multifamily assets. We have executed two Purchase and Sale Agreements with Amazon to purchase the Pen Place and Mets 6, 7, and 8 land for $294 million, subject to customary closing conditions. We have identified an exchange candidate for the proceeds from the expected sale of the Mets sites - a stabilized DC multifamily asset which is expected to close later this year. We anticipate closing on the sale of the Mets sites later this year and Pen Place by the second quarter of 2020. |
It is important to note that our estimated annualized fourth quarter 2024 NOI does not account for any additional value we may create from monetizing the remaining 13.9 million square feet in our Future Development Pipeline, aside from the land held for sale to Amazon and 1900 Crystal Drive. It also does not take into consideration our $400 million capital recycling goal for 2019 or any additional asset sales. It is also important to note that there are numerous assumptions built into our estimated NOI bridge, which may or may not prove to be accurate, and we urge you to review the more detailed presentation of the assumptions, as well as cautionary disclosures about forward-looking statements, included in the investor presentation on our website.
NAV Impact from Amazon in National Landing
As outlined in our investor day presentation, we anticipate the potential NAV impact Amazon could have on our holdings in National Landing to range from $5.25 to $8.25 per share. This NAV impact is anticipated to come from two main drivers. First, we expect our operating portfolio NAV to increase by approximately $2.50 to $3.75 as a result of cap rate compression from Amazon-related demand in National Landing. Our expected cap rates are based on comparisons of assets located in Washington, DC, Seattle, and recent transactions in National Landing. As the data in our investor presentation demonstrates, assets in Washington, DC and Seattle have traded at lower cap rates than those in Northern Virginia, especially office assets, driven by greater depth of investor demand and higher expectations for growth. Recent transactions in National Landing have attracted deep buyer pools, underwriting higher growth, resulting in meaningful cap rate compression. For more detail on recent transactions see our Washington, DC Market Update on page 3 of this letter.
Second, we estimate increases in the per square foot land values and developable density of our Future Development Pipeline will contribute between $2.75 to $4.50 per share. Land comparisons for National Landing assets are harder to come by, as the only recent trades are our pending land sales to Amazon at $72 per square foot, which we believe is more reflective of pre-Amazon land values. Land values vary widely because locations with good views and proximity to the Metro command significant premiums to inferior locations. We have estimated
a range of $70 to $100 per square foot, which could be conservative for the best sites. In addition to the per square foot increase in land value, we have also increased the square footage of our expected development potential for certain development sites. We only include the “in the money” density in our Future Development Pipeline, and we are realistic about the density we believe market demand will support, which is often less than what the maximum zoning density will allow. That said, with Amazon as a new demand driver, we have increased the planned density of certain sites in our development pipeline by an aggregate 2.1 million square feet.
Amazon’s arrival has not only increased the value of our assets in National Landing but may also drive increases in the value of assets in other nearby submarkets, especially those within a short commute of Amazon’s new headquarters. In addition to the 55% of JBG SMITH that sits within National Landing roughly 25% of our total assets sit within a 20-minute commute of the submarket. While we believe that many of these locations will realize value appreciation from their relative proximity to Amazon’s new headquarters, especially multifamily assets, we have not included any of that potential value increase in the potential NAV impact.
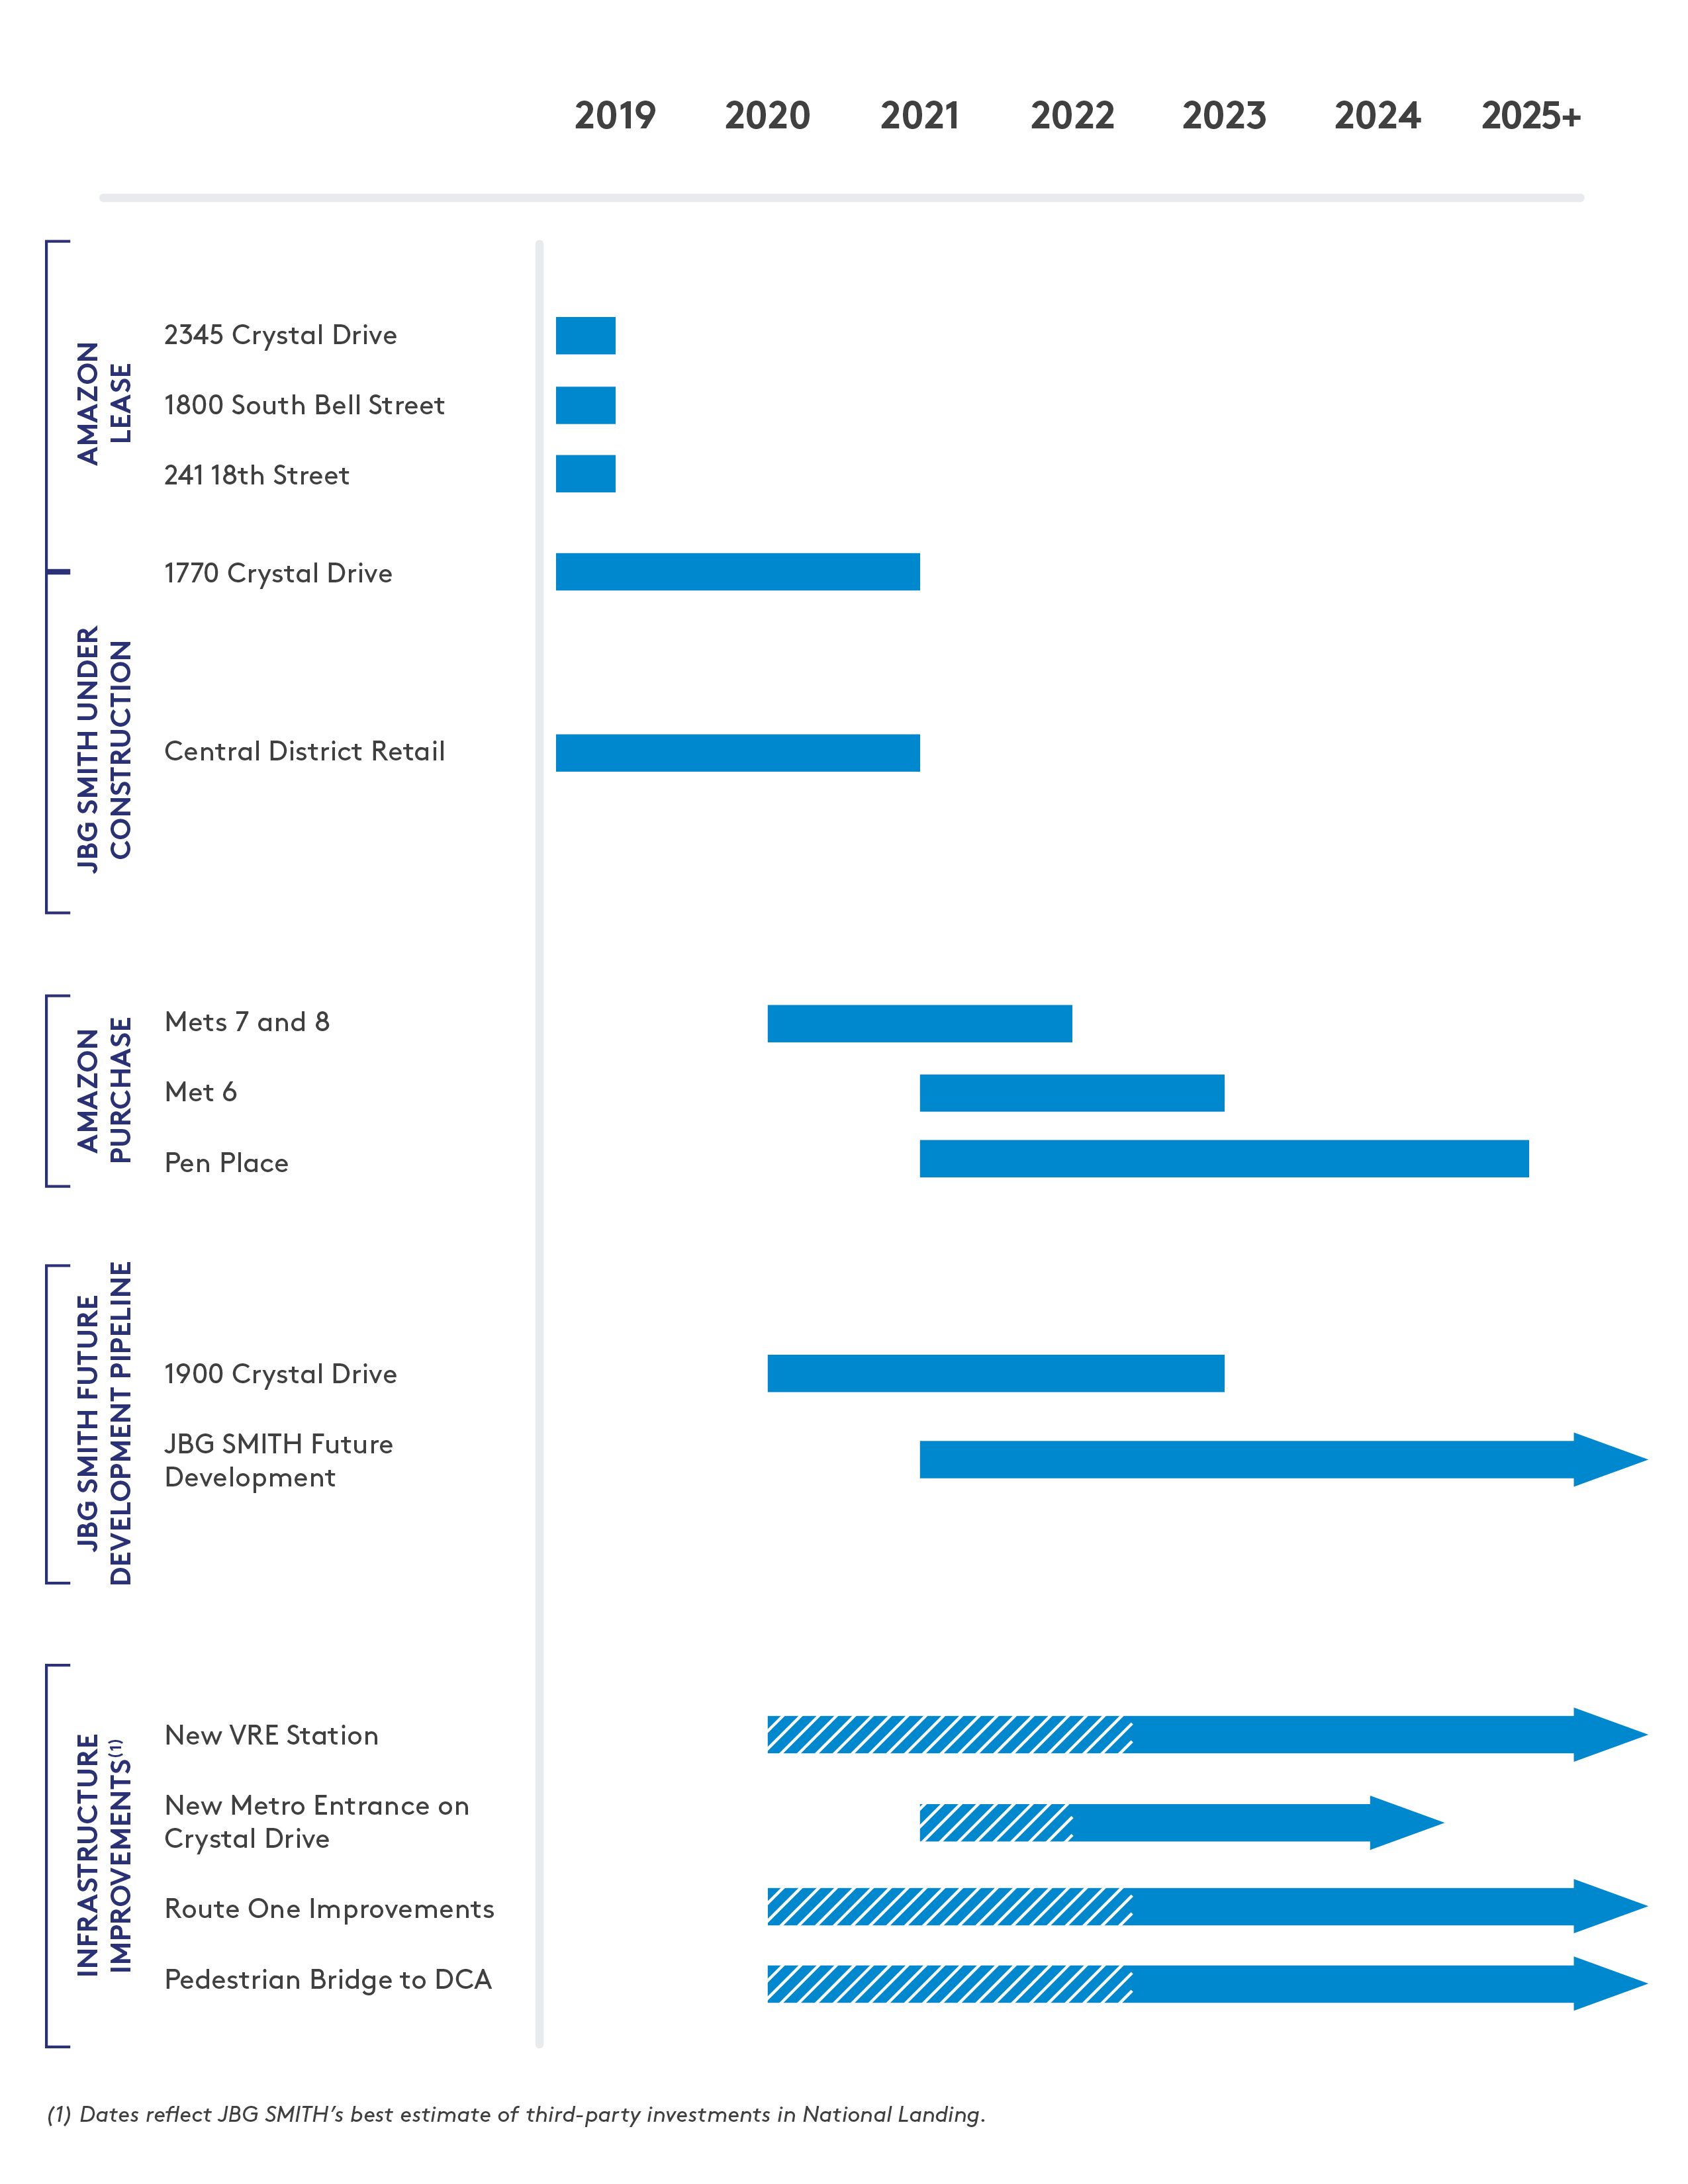
National Landing Milestones
The estimated development and delivery timeline for assets in National Landing, including the 4.1 million square feet of office assets we are developing for Amazon, our Under Construction and Future Development assets, and the third-party infrastructure investments is summarized below:
FOR IMMEDIATE RELEASE 
CONTACT
Jaime Marcus
SVP, Investor Relations
(240) 333-3643
jmarcus@jbgsmith.com
JBG SMITH ANNOUNCES FIRST QUARTER 2019 RESULTS
Chevy Chase, MD (May 7, 2019) - JBG SMITH (NYSE: JBGS), a leading owner and developer of high-quality, mixed-use properties in the Washington, DC market, today filed its Form 10-Q for the quarter ended March 31, 2019 and reported its financial results.
Additional information regarding our results of operations, properties and tenants can be found in our First Quarter 2019 Investor Package, which is posted in the Investor Relations section of our website at www.jbgsmith.com.
First Quarter 2019 Financial Results
| |
| • | Net income attributable to common shareholders was $24.9 million, or $0.20 per diluted share. |
| |
| • | Funds From Operations (“FFO”) attributable to common shareholders was $35.1 million, or $0.28 per diluted share. |
| |
| • | Core Funds From Operations (“Core FFO”) attributable to common shareholders was $44.2 million, or $0.36 per diluted share. |
Operating Portfolio Highlights
| |
| • | Annualized Net Operating Income (“NOI”) for the three months ended March 31, 2019 was $321.6 million, compared to $341.8 million for the three months ended December 31, 2018, at our share. The decrease in NOI is primarily attributable to lost income from disposed assets and increased rental abatements. |
| |
| • | The operating commercial portfolio was 90.2% leased and 85.6% occupied as of March 31, 2019, compared to 89.6% and 85.5% as of December 31, 2018, at our share. |
| |
| • | The operating multifamily portfolio was 97.0% leased and 94.8% occupied as of March 31, 2019, compared to 95.7% and 93.9% as of December 31, 2018, at our share. |
| |
| • | Executed approximately 785,000 square feet of office leases at our share in the first quarter, comprising approximately 555,000 square feet of new leases, and approximately 230,000 square feet of second generation leases, which generated a 3.9% rental rate decrease on a GAAP basis and a 6.8% rental rate decrease on a cash basis. The new leases primarily resulted from Amazon.com, Inc. ("Amazon") executing three initial leases during the quarter totaling 537,000 square feet at three of our existing office buildings in National Landing. The leases encompass approximately 88,000 square feet at 241 18th Street South, approximately 191,000 square feet at 1800 South Bell Street, and approximately 258,000 square feet at 1770 Crystal Drive. We expect Amazon to begin moving into 241 18th Street South and 1800 South Bell in 2019 and 1770 Crystal Drive by the end of 2020. Also, in April 2019, we executed an agreement with Amazon to lease an additional approximately 48,000 square feet of office space at 2345 Crystal Drive in National Landing in conjunction with the creation of Amazon's additional headquarters. |
| |
| • | Same Store Net Operating Income (“SSNOI”) decreased 10.1% to $73.6 million for the three months ended March 31, 2019, compared to $81.9 million for the three months ended March 31, 2018. The decrease in SSNOI for the three months ended March 31, 2019 is largely attributable to rental abatements and lower base |
rent. The reported same store pool as of March 31, 2019 includes only the assets that were in service for the entirety of both periods being compared.
Development Portfolio Highlights
Under Construction
| |
| • | During the quarter ended March 31, 2019, there were nine assets under construction (five commercial assets and four multifamily assets), consisting of 926,530 square feet and 1,298 units, both at our share. |
Near-Term Development
| |
| • | As of March 31, 2019, there were no assets in near-term development. |
Future Development Pipeline
| |
| • | As of March 31, 2019, there were 40 future development assets consisting of 18.7 million square feet of estimated potential density at our share, including the 4.1 million square feet held for sale to Amazon. |
Third-Party Asset Management and Real Estate Services Business
| |
| • | For the three months ended March 31, 2019, revenue from third-party real estate services, including reimbursements, was $27.7 million. Excluding reimbursements and service revenue from our interests in consolidated and unconsolidated real estate ventures, revenue from our third-party asset management and real estate services business was $13.8 million, of which $5.1 million came from property management fees, $3.4 million came from asset management fees, $2.2 million came from leasing fees, $1.6 million came from development fees, $0.6 million came from construction management fees and $0.8 million came from other service revenue. |
| |
| • | The general and administrative expenses allocated to the third-party asset management and real estate services business were $12.5 million for the three months ended March 31, 2019. |
Balance Sheet
| |
| • | We had $2.1 billion of debt ($2.4 billion including our share of debt of unconsolidated real estate ventures) as of March 31, 2019. Of the $2.4 billion of debt at our share, approximately 68% was fixed-rate, and rate caps were in place for approximately 2%. |
| |
| • | The weighted average interest rate of our debt at share was 4.28% as of March 31, 2019. |
| |
| • | At March 31, 2019, our total enterprise value was approximately $7.7 billion, comprising 137.8 million common shares and units valued at $5.7 billion and debt (net of premium / (discount) and deferred financing costs) at our share of $2.4 billion, less cash and cash equivalents at our share of $405.6 million. |
| |
| • | As of March 31, 2019, we had $395.6 million of cash and cash equivalents on a GAAP basis and $405.6 million of cash and cash equivalents at our share, and $1.1 billion of capacity under our credit facility. |
| |
| • | Net Debt to Annualized Adjusted EBITDA at our share for the three months ended March 31, 2019 was 7.1x and our Net Debt / Total Enterprise Value was 26.3% as of March 31, 2019. Pro forma Net Debt to Annualized Adjusted EBITDA at our share would have been 5.4x for the three months ended March 31, 2019, including the $472.3 million of net proceeds from the underwritten public offering completed in April 2019. |
Financing and Investing Activities
| |
| • | Sold Commerce Executive/Commerce Metro Land, an operating commercial/future development asset located in Reston, Virginia, for $115.0 million. The sale also included approximately 894,000 square feet of estimated potential development density. |
| |
| • | Executed purchase and sale agreements with Amazon for two of our National Landing Future Development assets, Pen Place and Mets 6, 7 and 8, which will serve as the initial phase of new construction associated with Amazon's additional headquarters. Subject to customary closing conditions, Amazon is expected to pay $293.9 |
million for the sites, or $72.00 per square foot based on their combined estimated potential development density of up to approximately 4.1 million square feet. We expect to close on the Mets land sale as early as 2019 and on Pen Place as early as 2020.
| |
| • | Executed a contract to purchase a stabilized multifamily asset located in Washington, DC, which we intend to use as a replacement property in a 1031 like-kind exchange for the expected proceeds from the sale of the Mets 6, 7 and 8 land parcels to Amazon. |
| |
| • | Redeemed 1.7 million common limited partnership units ("OP Units") for an equivalent number of our common shares. |
Subsequent to March 31, 2019:
| |
| • | Closed an underwritten public offering of 11.5 million common shares (including 1.5 million common shares related to the exercise of the underwriters' option to cover overallotments) at $42.00 per share, which generated net proceeds, after deducting the underwriting discounts and commissions and other estimated offering expenses, of approximately $472.3 million. We intend to use the net proceeds to fund development opportunities and for general corporate purposes. |
| |
| • | Repaid mortgage debt totaling approximately $293.6 million at The Bartlett and Fort Totten Square. |
Dividends
In May 2019, our Board of Trustees declared a quarterly dividend of $0.225 per common share, payable on May 24, 2019 to shareholders of record on May 13, 2019.
About JBG SMITH
JBG SMITH is an S&P 400 company that owns, operates, invests in and develops a dynamic portfolio of high-quality mixed-use properties in and around Washington, DC. Through an intense focus on placemaking, JBG SMITH cultivates vibrant, amenity-rich, walkable neighborhoods throughout the Capital region, including National Landing where it now serves as the exclusive developer for Amazon’s new headquarters. JBG SMITH’s operating portfolio currently comprises approximately 18 million square feet of high-quality office, multifamily and retail assets, 98% at our share of which are Metro-served. It also maintains a robust future pipeline encompassing approximately 18.7 million square feet of mixed-use development opportunities. For more information on JBG SMITH please visit www.jbgsmith.com.
Forward Looking Statements
Certain statements contained herein may constitute “forward-looking statements” as such term is defined in Section 27A of the Securities Act of 1933, as amended, and Section 21E of the Securities Exchange Act of 1934, as amended. Forward-looking statements are not guarantees of performance. They represent our intentions, plans, expectations and beliefs and are subject to numerous assumptions, risks and uncertainties. Consequently, the future results of JBG SMITH Properties (“JBG SMITH” or the “Company”) may differ materially from those expressed in these forward-looking statements. You can find many of these statements by looking for words such as “approximate”, "hypothetical", "potential", “believes”, “expects”, “anticipates”, “estimates”, “intends”, “plans”, “would”, “may” or similar expressions in this earnings release. We also note the following forward-looking statements: our anticipated dispositions, our indicated annual dividend per share and dividend yield, annualized net operating income; in the case of our construction and near-term development assets, estimated square feet, estimated number of units and in the case of our future development assets, estimated potential development density. Expected key Amazon transaction terms and timeframes for closing, planned infrastructure improvements related to Amazon's additional headquarters; the economic impacts of Amazon's additional headquarters on the DC region and National Landing; our development plans related to Amazon's additional headquarters; the expected accretion to our net asset value ("NAV") as a result of the Amazon transaction and our future NAV growth rate; in the case of our Amazon lease transaction and our new development opportunities in National Landing, the total square feet to be leased to Amazon and the expected net effective rent, estimated square feet, estimated number of units, the estimated construction start and occupancy dates, estimated incremental investment, targeted NOI yield; and in the case of our future development opportunities, estimated potential development density. Many of the
factors that will determine the outcome of these and our other forward-looking statements are beyond our ability to control or predict. These factors include, among others: adverse economic conditions in the Washington, DC metropolitan area, the timing of and costs associated with development and property improvements, financing commitments, and general competitive factors. For further discussion of factors that could materially affect the outcome of our forward-looking statements and other risks and uncertainties, see “Risk Factors” and the Cautionary Statement Concerning Forward-Looking Statements in the Company's Annual Report on Form 10-K for the year ended December 31, 2018 and other periodic reports the Company files with the Securities and Exchange Commission. For these statements, we claim the protection of the safe harbor for forward-looking statements contained in the Private Securities Litigation Reform Act of 1995. You are cautioned not to place undue reliance on our forward-looking statements. All subsequent written and oral forward-looking statements attributable to us or any person acting on our behalf are expressly qualified in their entirety by the cautionary statements contained or referred to in this section. We do not undertake any obligation to release publicly any revisions to our forward-looking statements after the date hereof.
Pro Rata Information
We present certain financial information and metrics in this release “at JBG SMITH Share,” which refers to our ownership percentage of consolidated and unconsolidated assets in real estate ventures (collectively, “real estate ventures”) as applied to these financial measures and metrics. Financial information “at JBG SMITH Share” is calculated on an asset-by-asset basis by applying our percentage economic interest to each applicable line item of that asset’s financial information. “At JBG SMITH Share” information, which we also refer to as being “at share,” “our pro rata share” or “our share,” is not, and is not intended to be, a presentation in accordance with GAAP. Given that a substantial portion of our assets are held through real estate ventures, we believe this form of presentation, which presents our economic interests in the partially owned entities, provides investors valuable information regarding a significant component of our portfolio, its composition, performance and capitalization.
We do not control the unconsolidated real estate ventures and do not have a legal claim to our co-venturers’ share of assets, liabilities, revenue and expenses. The operating agreements of the unconsolidated real estate ventures generally allow each co-venturer to receive cash distributions to the extent there is available cash from operations. The amount of cash each investor receives is based upon specific provisions of each operating agreement and varies depending on certain factors including the amount of capital contributed by each investor and whether any investors are entitled to preferential distributions.
With respect to any such third-party arrangement, we would not be in a position to exercise sole decision-making authority regarding the property, real estate venture or other entity, and may, under certain circumstances, be exposed to economic risks not present were a third-party not involved. We and our respective co-venturers may each have the right to trigger a buy-sell or forced sale arrangement, which could cause us to sell our interest, or acquire our co-venturers’ interests, or to sell the underlying asset, either on unfavorable terms or at a time when we otherwise would not have initiated such a transaction. Our real estate ventures may be subject to debt, and the repayment or refinancing of such debt may require equity capital calls. To the extent our co-venturers do not meet their obligations to us or our real estate ventures or they act inconsistent with the interests of the real estate venture, we may be adversely affected. Because of these limitations, the non-GAAP “at JBG SMITH Share” financial information should not be considered in isolation or as a substitute for our financial statements as reported under GAAP.
Non-GAAP Financial Measures
This release includes non-GAAP financial measures. For these measures, we have provided an explanation of how these non-GAAP measures are calculated and why JBG SMITH’s management believes that the presentation of these measures provides useful information to investors regarding JBG SMITH’s financial condition and results of operations. Reconciliations of certain non-GAAP measures to the most directly comparable GAAP financial measure are included in this earnings release. Our presentation of non-GAAP financial measures may not be comparable to similar non-GAAP measures used by other companies. In addition to "at share" financial information, the following non-GAAP measures are included in this release:
Earnings Before Interest, Taxes, Depreciation and Amortization ("EBITDA"), EBITDA for Real Estate ("EBITDAre") and Adjusted EBITDA
Management uses EBITDA and EBITDAre, non-GAAP financial measures, as supplemental operating performance measures and believes they help investors and lenders meaningfully evaluate and compare our operating performance from period-to-period by removing from our operating results the impact of our capital structure (primarily interest charges from our consolidated outstanding debt and the impact of our interest rate swaps) and certain non-cash expenses (primarily depreciation and amortization on our assets). EBITDAre is computed in accordance with the definition established by the National Association of Real Estate Investment Trusts (“NAREIT”). NAREIT defines EBITDAre as GAAP net income (loss) adjusted to exclude interest expense, income taxes, depreciation and amortization expenses, gains on sales of real estate and impairment losses of real estate, including our share of such adjustments of unconsolidated real estate ventures. These supplemental measures may help investors and lenders understand our ability to incur and service debt and to make capital expenditures. EBITDA and EBITDAre are not substitutes for net income (loss) (computed in accordance with GAAP) and may not be comparable to similarly titled measures used by other companies.
“Adjusted EBITDA,” a non-GAAP financial measure, represents EBITDAre adjusted for items we believe are not representative of ongoing operating results, such as transaction and other costs, gain (loss) on the extinguishment of debt, distributions in excess of our investment in consolidated real estate ventures, gain on the bargain purchase of a business, lease liability adjustments and share-based compensation expense related to the Formation Transaction and special equity awards. We believe that adjusting such items not considered part of our comparable operations, provides a meaningful measure to evaluate and compare our performance from period-to-period.
Because EBITDA, EBITDAre and Adjusted EBITDA have limitations as analytical tools, we use EBITDA, EBITDAre and Adjusted EBITDA to supplement GAAP financial measures. Additionally, we believe that users of these measures should consider EBITDA, EBITDAre and Adjusted EBITDA in conjunction with net income (loss) and other GAAP measures in understanding our operating results.
Funds from Operations ("FFO"), Core FFO and Funds Available for Distribution (“FAD")
FFO is a non-GAAP financial measure computed in accordance with the definition established by NAREIT in the NAREIT FFO White Paper - 2018 Restatement issued in 2018. NAREIT defines FFO as “net income (computed in accordance with GAAP), excluding depreciation and amortization related to real estate, gains and losses from the sale of certain real estate assets, gains and losses from change in control and impairment write-downs of certain real estate assets and investments in entities when the impairment is directly attributable to decreases in the value of depreciable real estate held by the entity."
"Core FFO" represents FFO adjusted to exclude items (net of tax) which we believe are not representative of ongoing operating results, such as transaction and other costs, gains (or losses) on extinguishment of debt, gain on the bargain purchase of a business, distributions in excess of our investment in consolidated real estate ventures, share-based compensation expense related to the Formation Transaction and special equity awards, lease liability adjustments, amortization of the management contracts intangible and the mark-to-market of derivative instruments.
"FAD" is a non-GAAP financial measure and represents FFO less recurring tenant improvements, leasing commissions and other capital expenditures, net deferred rent activity, third-party lease liability assumption payments, recurring share-based compensation expense, accretion of acquired below-market leases, net of amortization of acquired above-market leases, amortization of debt issuance costs and other non-cash income and charges. FAD is presented solely as a supplemental disclosure that management believes provides useful information as it relates to our ability to fund dividends.
We believe FFO, Core FFO and FAD are meaningful non‑GAAP financial measures useful in comparing our levered operating performance from period-to-period and as compared to similar real estate companies because these non‑GAAP measures exclude real estate depreciation and amortization expense and other non-comparable income and expenses, which implicitly assumes that the value of real estate diminishes predictably over time rather than fluctuating based on market conditions. FFO, Core FFO and FAD do not represent cash generated from operating activities and are not necessarily indicative of cash available to fund cash requirements and should not be considered as an alternative to net income (loss) (computed in accordance with GAAP) as a performance measure or cash flow as a liquidity measure. FFO, Core FFO and FAD may not be comparable to similarly titled measures used by other companies.
Net Operating Income ("NOI") and Annualized NOI
“NOI” is a non-GAAP financial measure management uses to measure the operating performance of our assets and consists of property-related revenue (which includes base rent, tenant reimbursements and other operating revenue, net of free rent and payments associated with assumed lease liabilities) less operating expenses and ground rent, if applicable. NOI also excludes deferred rent, related party management fees, interest expense, and certain other non-cash adjustments, including the accretion of acquired below-market leases and amortization of acquired above-market leases and below-market ground lease intangibles. Annualized NOI, for all assets except Crystal City Marriott, represents NOI for the three months ended March 31, 2019 multiplied by four. Due to seasonality in the hospitality business, annualized NOI for Crystal City Marriott represents the trailing twelve-month NOI as of March 31, 2019. Management believes Annualized NOI provides useful information in understanding JBG SMITH’s financial performance over a 12-month period, however, investors and other users are cautioned against attributing undue certainty to our calculation of Annualized NOI. Actual NOI for any 12-month period will depend on a number of factors beyond our ability to control or predict, including general capital markets and economic conditions, any bankruptcy, insolvency, default or other failure to pay rent by one or more of our tenants and the destruction of one or more of our assets due to terrorist attack, natural disaster or other casualty, among others. We do not undertake any obligation to update our calculation to reflect events or circumstances occurring after the date of this earnings release. There can be no assurance that the annualized NOI shown will reflect JBG SMITH’s actual results of operations over any 12-month period.
Management uses each of these measures as supplemental performance measures for its assets and believes they provide useful information to investors because they reflect only those revenue and expense items that are incurred at the asset level, excluding non-cash items. In addition, NOI is considered by many in the real estate industry to be a useful starting point for determining the value of a real estate asset or group of assets.
However, because NOI excludes depreciation and amortization and captures neither the changes in the value of our assets that result from use or market conditions, nor the level of capital expenditures and capitalized leasing commissions necessary to maintain the operating performance of our assets, all of which have real economic effect and could materially impact the financial performance of our assets, the utility of this measure of the operating performance of our assets is limited. Moreover, our method of calculating NOI may differ from other real estate companies and, accordingly, may not be comparable. NOI should be considered only as a supplement to net operating income (loss) (computed in accordance with GAAP) as a measure of the operating performance of our assets.
Same Store and Non-Same Store
“Same store” refers to the pool of assets that were in service for the entirety of both periods being compared, except for assets for which significant redevelopment, renovation, or repositioning occurred during either of the periods being compared.
“Non-same store” refers to all operating assets excluded from the same store pool.
Definitions
GAAP
"GAAP" refers to accounting principles generally accepted in the United States of America.
Formation Transaction
"Formation Transaction" refers collectively to the spin-off on July 17, 2017 of substantially all of the assets and liabilities of Vornado’s Washington, DC segment, which operated as Vornado / Charles E. Smith, and the acquisition of the management business and certain assets and liabilities of The JBG Companies.
CONDENSED CONSOLIDATED BALANCE SHEETS (Unaudited) |
| | | | | | | |
| in thousands | March 31, 2019 | | December 31, 2018 |
| | | | |
| ASSETS | |
| Real estate, at cost: | | | |
| Land and improvements | $ | 1,227,255 |
| | $ | 1,371,874 |
|
| Buildings and improvements | 3,717,906 |
| | 3,722,930 |
|
| Construction in progress, including land | 751,730 |
| | 697,930 |
|
| | 5,696,891 |
| | 5,792,734 |
|
| Less accumulated depreciation | (1,075,309 | ) | | (1,051,875 | ) |
| Real estate, net | 4,621,582 |
| | 4,740,859 |
|
| Cash and cash equivalents | 395,584 |
| | 260,553 |
|
| Restricted cash | 17,877 |
| | 138,979 |
|
| Tenant and other receivables, net | 49,979 |
| | 46,568 |
|
Deferred rent receivable, net
| 152,323 |
| | 143,473 |
|
| Investments in and advances to unconsolidated real estate ventures | 321,366 |
| | 322,878 |
|
Other assets, net
| 297,525 |
| | 264,994 |
|
| Assets held for sale | 168,458 |
| | 78,981 |
|
| TOTAL ASSETS | $ | 6,024,694 |
| | $ | 5,997,285 |
|
| | | | |
| LIABILITIES, REDEEMABLE NONCONTROLLING INTERESTS AND EQUITY | | | |
| Liabilities: | | | |
| Mortgages payable, net | $ | 1,835,842 |
| | $ | 1,838,381 |
|
| Unsecured term loans, net | 297,277 |
| | 297,129 |
|
| Accounts payable and accrued expenses | 134,776 |
| | 130,960 |
|
| Other liabilities, net | 174,434 |
| | 181,606 |
|
| Liabilities related to assets held for sale | 486 |
| | 3,717 |
|
| Total liabilities | 2,442,815 |
| | 2,451,793 |
|
| Commitments and contingencies |
| |
|
| Redeemable noncontrolling interests | 584,763 |
| | 558,140 |
|
| Total equity | 2,997,116 |
| | 2,987,352 |
|
| TOTAL LIABILITIES, REDEEMABLE NONCONTROLLING INTERESTS AND EQUITY | $ | 6,024,694 |
| | $ | 5,997,285 |
|
_______________
Note: For complete financial statements, please refer to the Company's Quarterly Report on Form 10-Q for the quarter ended March 31, 2019.
CONDENSED CONSOLIDATED STATEMENTS OF OPERATIONS (Unaudited) |
| | | | | | | |
| in thousands, except per share data | Three Months Ended March 31, |
| | 2019 | | 2018 |
| REVENUE | | | |
| Property rentals | $ | 119,413 |
| | $ | 131,228 |
|
| Third-party real estate services, including reimbursements | 27,691 |
| | 24,330 |
|
| Other income | 8,095 |
| | 7,479 |
|
| Total revenue | 155,199 |
| | 163,037 |
|
| EXPENSES | | | |
| Depreciation and amortization | 48,719 |
| | 49,160 |
|
| Property operating | 32,174 |
| | 35,158 |
|
| Real estate taxes | 17,235 |
| | 19,610 |
|
| General and administrative: | | | |
| Corporate and other | 12,314 |
| | 8,414 |
|
| Third-party real estate services | 28,066 |
| | 22,609 |
|
Share-based compensation related to Formation Transaction and
special equity awards
| 11,131 |
| | 9,428 |
|
| Transaction and other costs | 4,895 |
| | 4,221 |
|
| Total expenses | 154,534 |
| | 148,600 |
|
| OTHER INCOME (EXPENSE) |
| |
|
| Income (loss) from unconsolidated real estate ventures, net | 3,601 |
| | (1,902 | ) |
| Interest and other income, net | 951 |
| | 573 |
|
| Interest expense | (17,174 | ) | | (19,257 | ) |
| Gain on sale of real estate | 39,033 |
| | 455 |
|
| Total other income (expense) | 26,411 |
| | (20,131 | ) |
| INCOME (LOSS) BEFORE INCOME TAX BENEFIT (EXPENSE) | 27,076 |
| | (5,694 | ) |
| Income tax benefit | 1,172 |
| | 908 |
|
| NET INCOME (LOSS) | 28,248 |
| | (4,786 | ) |
| Net (income) loss attributable to redeemable noncontrolling interests | (3,387 | ) | | 594 |
|
| Net loss attributable to noncontrolling interests | — |
| | 2 |
|
| NET INCOME (LOSS) ATTRIBUTABLE TO COMMON SHAREHOLDERS | $ | 24,861 |
| | $ | (4,190 | ) |
| EARNINGS (LOSS) PER COMMON SHARE: | | | |
| Basic | $ | 0.20 |
| | $ | (0.04 | ) |
| Diluted | $ | 0.20 |
| | $ | (0.04 | ) |
| WEIGHTED AVERAGE NUMBER OF COMMON SHARES OUTSTANDING : | | | |
| Basic | 122,573 |
| | 117,955 |
|
| Diluted | 123,423 |
| | 117,955 |
|
___________________
Note: For complete financial statements, please refer to the Company's Quarterly Report on Form 10-Q for the quarter ended March 31, 2019.
EBITDA, EBITDAre AND ADJUSTED EBITDA (NON-GAAP)
(Unaudited)
|
| | | | | | | | |
| dollars in thousands | | Three Months Ended March 31, |
| | | 2019 | | 2018 |
| | | | | |
| EBITDA, EBITDAre and Adjusted EBITDA | | | | |
| Net income (loss) | | $ | 28,248 |
| | $ | (4,786 | ) |
| Depreciation and amortization expense | | 48,719 |
| | 49,160 |
|
Interest expense (1) | | 17,174 |
| | 19,257 |
|
| Income tax benefit | | (1,172 | ) | | (908 | ) |
| Unconsolidated real estate ventures allocated share of above adjustments | | 7,806 |
| | 10,175 |
|
| Allocated share of above adjustments to noncontrolling interests in consolidated real estate ventures | | (1 | ) | | — |
|
EBITDA (2) | | $ | 100,774 |
| | $ | 72,898 |
|
| Gain on sale of real estate | | (39,033 | ) | | (455 | ) |
EBITDAre (2) | | $ | 61,741 |
| | $ | 72,443 |
|
Transaction and other costs (3) | | 4,895 |
| | 4,221 |
|
| Share-based compensation related to Formation Transaction and special equity awards | | 11,131 |
| | 9,428 |
|
Net distributions in excess of our investment in unconsolidated real estate venture (4) | | (6,441 | ) | | — |
|
| Unconsolidated real estate ventures allocated share of above adjustments | | — |
| | 30 |
|
Adjusted EBITDA (2) | | $ | 71,326 |
| | $ | 86,122 |
|
| | | | | |
Net Debt to Annualized Adjusted EBITDA (5) | | 7.1x |
| | 6.9x |
|
| | | | | |
| | | March 31, 2019 | | March 31, 2018 |
| Net Debt (at JBG SMITH Share) | | | | |
Consolidated indebtedness (6) | | $ | 2,128,803 |
| | $ | 2,185,461 |
|
Unconsolidated indebtedness (6) | | 303,397 |
| | 419,476 |
|
| Total consolidated and unconsolidated indebtedness | 2,432,200 |
| | 2,604,937 |
|
| Less: cash and cash equivalents | | 405,646 |
| | 238,519 |
|
| Net Debt (at JBG SMITH Share) | | $ | 2,026,554 |
| | $ | 2,366,418 |
|
| | | $ | (0.41 | ) | | |
____________________
Note: EBITDAre for the three months ended March 31, 2018 was restated in compliance with the definition established by NAREIT in the NAREIT FFO White Paper - 2018 Restatement issued in 2018.
| |
| (1) | Interest expense includes the amortization of deferred financing costs and the ineffective portion of any interest rate swaps or caps, net of capitalized interest. |
| |
| (2) | Due to our adoption of the new accounting standard for leases, beginning in 2019, we no longer capitalize internal leasing costs and expense these costs as incurred (such costs were $1.3 million for the three months ended March 31, 2018). |
| |
| (3) | Includes fees and expenses incurred in connection with the Formation Transaction (including transition services provided by our former parent, integration costs and severance costs), demolition costs and costs related to other completed, potential and pursued transactions. |
| |
| (4) | As of June 30, 2018, we suspended the equity method of accounting for our investment in the real estate venture that owns 1101 17th Street as our investment had been reduced to zero and we did not have an obligation to provide further financial support to the venture. All subsequent net distributions from the venture have been recognized as income, which will continue until our share of unrecorded earnings and contributions exceed the cumulative excess distributions previously recognized. |
| |
| (5) | Pro forma Net Debt to Annualized Adjusted EBITDA would have been 5.4x for the three months ended March 31, 2019, including the $472.3 million of net proceeds from the underwritten public offering completed in April 2019. |
| |
| (6) | Net of premium/discount and deferred financing costs. |
FFO, CORE FFO AND FAD (NON-GAAP)
(Unaudited)
|
| | | | | | | |
| in thousands, except per share data | Three Months Ended March 31, |
| | 2019 | | 2018 |
| | | | |
| FFO and Core FFO | | | |
| Net income (loss) attributable to common shareholders | $ | 24,861 |
| | $ | (4,190 | ) |
| Net income (loss) attributable to redeemable noncontrolling interests | 3,387 |
| | (594 | ) |
| Net loss attributable to noncontrolling interests | — |
| | (2 | ) |
| Net income (loss) | 28,248 |
| | (4,786 | ) |
| Gain on sale of real estate | (39,033 | ) | | (455 | ) |
| Real estate depreciation and amortization | 46,035 |
| | 46,639 |
|
| Pro rata share of real estate depreciation and amortization from unconsolidated real estate ventures | 4,653 |
| | 6,436 |
|
| Net (income) loss attributable to noncontrolling interests in consolidated real estate ventures | (1 | ) | | 2 |
|
FFO Attributable to Operating Partnership Common Units (1) | $ | 39,902 |
| | $ | 47,836 |
|
| FFO attributable to redeemable noncontrolling interests | (4,783 | ) | | (7,127 | ) |
FFO attributable to common shareholders (1) | $ | 35,119 |
| | $ | 40,709 |
|
| | | | |
| FFO attributable to the operating partnership common units | $ | 39,902 |
| | $ | 47,836 |
|
Transaction and other costs, net of tax (2) | 4,626 |
| | 4,136 |
|
| Mark-to-market on derivative instruments | (476 | ) | | (1,119 | ) |
| Share of gain from mark-to-market on derivative instruments held by unconsolidated real estate ventures | 227 |
| | (342 | ) |
Net distributions in excess of our investment in unconsolidated real estate venture (3) | (6,441 | ) | | — |
|
| Share-based compensation related to Formation Transaction and special equity awards | 11,131 |
| | 9,428 |
|
| Amortization of management contracts intangible, net of tax | 1,287 |
| | 1,286 |
|
Core FFO Attributable to Operating Partnership Common Units (1) | $ | 50,256 |
| | $ | 61,225 |
|
| Core FFO attributable to redeemable noncontrolling interests | (6,024 | ) | | (9,037 | ) |
Core FFO attributable to common shareholders (1) | $ | 44,232 |
| | $ | 52,188 |
|
| FFO per diluted common share | $ | 0.28 |
| | $ | 0.35 |
|
| Core FFO per diluted common share | $ | 0.36 |
| | $ | 0.44 |
|
| Weighted average diluted shares | 123,423 |
| | 117,955 |
|
| | | | |
See footnotes on page 11.
FFO, CORE FFO AND FAD (NON-GAAP)
(Unaudited)
|
| | | | | | | |
| in thousands, except per share data | Three Months Ended March 31, |
| | 2019 | | 2018 |
| | | | |
| FAD | | | |
| Core FFO attributable to the operating partnership common units | $ | 50,256 |
| | $ | 61,225 |
|
| Recurring capital expenditures and second generation tenant improvements and leasing commissions | (22,297 | ) | | (6,097 | ) |
Straight-line and other rent adjustments (4) | (6,808 | ) | | (1,075 | ) |
| Share of straight-line rent from unconsolidated real estate ventures | (135 | ) | | 159 |
|
| Third-party lease liability assumption payments | (1,136 | ) | | (472 | ) |
| Share of third party lease liability assumption payments for unconsolidated real estate ventures | — |
| | (50 | ) |
| Share-based compensation expense | 5,330 |
| | 4,276 |
|
| Amortization of debt issuance costs | 970 |
| | 1,164 |
|
| Share of amortization of debt issuance costs from unconsolidated real estate ventures | 48 |
| | 69 |
|
| Non-real estate depreciation and amortization | 912 |
| | 749 |
|
FAD available to the Operating Partnership Common Units (A) (5) | $ | 27,140 |
| | $ | 59,948 |
|
Distributions to common shareholders and unitholders (6) (B) | $ | 31,284 |
| | $ | 31,423 |
|
FAD Payout Ratio (B÷A) (7) | 115.3 | % | | 52.4 | % |
|
| | | | | | | |
| Capital Expenditures | | | |
| Maintenance and recurring capital expenditures | $ | 5,495 |
| | $ | 2,683 |
|
| Share of maintenance and recurring capital expenditures from unconsolidated real estate ventures | 88 |
| | 1,149 |
|
| Second generation tenant improvements and leasing commissions | 16,155 |
| | 1,893 |
|
| Share of second generation tenant improvements and leasing commissions from unconsolidated real estate ventures | 559 |
| | 372 |
|
| Recurring capital expenditures and second generation tenant improvements and leasing commissions | 22,297 |
| | 6,097 |
|
| First generation tenant improvements and leasing commissions | 6,197 |
| | 4,185 |
|
| Share of first generation tenant improvements and leasing commissions from unconsolidated real estate ventures | 233 |
| | 995 |
|
| Non-recurring capital expenditures | 6,722 |
| | 3,366 |
|
| Share of non-recurring capital expenditures from unconsolidated joint ventures | — |
| | 620 |
|
| Non-recurring capital expenditures | 13,152 |
| | 9,166 |
|
| Total JBG SMITH Share of Capital Expenditures | $ | 35,449 |
| | $ | 15,263 |
|
_______________
Note: FFO attributable to operating partnership common units and FFO attributable to common shareholders for the three months ended March 31, 2018 were restated in compliance with the definition established by NAREIT in the NAREIT FFO White Paper - 2018 Restatement issued in 2018.
| |
| (1) | Due to our adoption of the new accounting standard for leases, beginning in 2019, we no longer capitalize internal leasing costs and expense these costs as incurred (such costs were $1.3 million for the three months ended March 31, 2018). |
| |
| (2) | Includes fees and expenses incurred in connection with the Formation Transaction (including transition services provided by our former parent, integration costs, and severance costs), demolition costs and costs related to other completed, potential and pursued transactions. |
| |
| (3) | As of June 30, 2018, we suspended the equity method of accounting for our investment in the real estate venture that owns 1101 17th Street as our investment had been reduced to zero and we did not have an obligation to provide further financial support to the venture. All subsequent net distributions from the venture have been recognized as income, which will continue until our share of unrecorded earnings and contributions exceed the cumulative excess distributions previously recognized. |
| |
| (4) | Includes straight-line rent, above/below market lease amortization and lease incentive amortization. |
| |
| (5) | The decline in FAD available to the Operating Partnership Common Units was attributable to a significant increase in second generation tenant improvements and leasing commissions from the early renewal of several leases during the quarter. |
| |
| (6) | The distribution for the three months ended March 31, 2019 excludes a special dividend of $0.10 per common share that was paid in January 2019. |
| |
| (7) | The FAD payout ratio on a quarterly basis is not necessarily indicative of an amount for the full year due to fluctuation in timing of capital expenditures, the commencement of new leases and the seasonality of our operations. |
NOI RECONCILIATIONS (NON-GAAP)
(Unaudited)
|
| | | | | | | |
| dollars in thousands | Three Months Ended March 31, |
| | 2019 | | 2018 |
| | |
| Net income (loss) attributable to common shareholders | $ | 24,861 |
| | $ | (4,190 | ) |
| Add: | | | |
| Depreciation and amortization expense | 48,719 |
| | 49,160 |
|
| General and administrative expense: | | | |
| Corporate and other | 12,314 |
| | 8,414 |
|
| Third-party real estate services | 28,066 |
| | 22,609 |
|
Share-based compensation related to Formation Transaction and
special equity awards
| 11,131 |
| | 9,428 |
|
| Transaction and other costs | 4,895 |
| | 4,221 |
|
| Interest expense | 17,174 |
| | 19,257 |
|
| Income tax benefit | (1,172 | ) | | (908 | ) |
| Net income (loss) attributable to redeemable noncontrolling interests | 3,387 |
| | (594 | ) |
| Less: | | | |
Third-party real estate services, including reimbursements
| 27,691 |
| | 24,330 |
|
| Other income (excluding parking income of $6,455 and $6,363 in 2019 and 2018) | 1,640 |
| | 1,116 |
|
| Income (loss) from unconsolidated real estate ventures, net | 3,601 |
| | (1,902 | ) |
| Interest and other income, net | 951 |
| | 573 |
|
| Gain on sale of real estate | 39,033 |
| | 455 |
|
| Net loss attributable to noncontrolling interests | — |
| | 2 |
|
| Consolidated NOI | 76,459 |
| | 82,823 |
|
| Proportionate NOI attributable to unconsolidated real estate ventures | 5,386 |
| | 9,207 |
|
Non-cash rent adjustments (1) | (6,808 | ) | | (1,096 | ) |
Other adjustments (2) | 3,353 |
| | 4,252 |
|
| Total adjustments | 1,931 |
| | 12,363 |
|
| NOI | $ | 78,390 |
| | $ | 95,186 |
|
Less: out-of-service NOI loss (3) | (1,271 | ) | | (834 | ) |
| Operating portfolio NOI | $ | 79,661 |
| | $ | 96,020 |
|
Non-same store NOI (4) | 6,088 |
| | 14,147 |
|
Same store NOI (5) | $ | 73,573 |
| | $ | 81,873 |
|
| | | | |
| Growth in same store NOI | (10.1 | )% | | |
| Number of properties in same store pool | 56 |
| | |
___________________
| |
| (1) | Adjustment to exclude straight-line rent, above/below market lease amortization and lease incentive amortization. |
| |
| (2) | Adjustment to include other income and payments associated with assumed lease liabilities related to operating properties and to exclude commercial lease termination revenue. |
| |
| (3) | Includes the results for our Under Construction assets and Future Development Pipeline. |
| |
| (4) | Includes the results for properties that were not owned, operated and in service for the entirety of both periods being compared and properties for which significant redevelopment, renovation or repositioning occurred during either of the periods being compared. The decrease in non-same store NOI is primarily attributable to lost income from disposed assets. |
| |
| (5) | Includes the results of the properties that are owned, operated and in service for the entirety of both periods being compared except for properties for which significant redevelopment, renovation or repositioning occurred during either of the periods being compared. |
|
| |
| TABLE OF CONTENTS | MARCH 31, 2019
|
|
| |
| | Page |
| Overview | |
| Disclosures | 3-4 |
| Company Profile | 5-6 |
| Financial Highlights | |
| Financial Highlights - Trends | 8-9 |
| Portfolio Overview | |
| Financial Information | |
| Condensed Consolidated Balance Sheets | |
| Condensed Consolidated Statements of Operations | |
| Unconsolidated Real Estate Ventures - Balance Sheet and Operating Information | |
| Other Tangible Assets and Liabilities, Net | |
| EBITDA, EBITDAre and Adjusted EBITDA (Non-GAAP) | |
| FFO, Core FFO and FAD (Non-GAAP) | 16-17 |
| Third-Party Asset Management and Real Estate Services Business (Non-GAAP) | |
| Pro Rata Adjusted General and Administrative Expenses (Non-GAAP) | |
| Operating Assets | |
| Summary & Same Store NOI (Non-GAAP) | |
| Summary NOI (Non-GAAP) | |
| Summary NOI - Commercial (Non-GAAP) | |
| Summary NOI - Multifamily (Non-GAAP) | |
| NOI Reconciliations (Non-GAAP) | |
| Leasing Activity | |
| Leasing Activity - Office | |
| Net Effective Rent - Office | |
| Lease Expirations | |
| Signed But Not Yet Commenced Leases | |
| Tenant Concentration | |
Industry Diversity
| |
| Property Data | |
| Portfolio Summary | |
| Property Tables: | |
| Commercial | 33-36 |
| Multifamily | 37-39 |
| Under Construction | |
| Future Development | |
| Disposition Activity | |
| Debt | |
| Debt Summary | |
| Debt by Instrument | 44-45 |
| Real Estate Ventures | |
| Consolidated Real Estate Ventures | |
| Unconsolidated Real Estate Ventures | 47-48 |
| Definitions | 49-52 |
| Appendices - Reconciliations of Non-GAAP Financial Highlights | 53-56 |
|
| |
| DISCLOSURES | MARCH 31, 2019
|
Forward-Looking Statements
Certain statements contained herein may constitute “forward-looking statements” as such term is defined in Section 27A of the Securities Act of 1933, as amended, and Section 21E of the Securities Exchange Act of 1934, as amended. Forward-looking statements are not guarantees of performance. They represent our intentions, plans, expectations and beliefs and are subject to numerous assumptions, risks and uncertainties. Consequently, the future results of JBG SMITH Properties (“JBG SMITH” or the “Company”) may differ materially from those expressed in these forward-looking statements. You can find many of these statements by looking for words such as “approximate”, “hypothetical”, “potential”, “believes”, “expects”, “anticipates”, “estimates”, “intends”, “plans”, “would”, “may” or similar expressions in this document. We also note the following forward-looking statements: our potential net operating income ("NOI") growth and the assumptions on which such growth is premised, our estimated future leverage (Debt/EBITDA) profile, the potential effect of Amazon.com, Inc. ("Amazon") on job growth, rent growth and cap rates in the Washington, DC metropolitan area and National Landing, in particular, our anticipated dispositions and 1031 exchanges, our indicated annual dividend per share and dividend yield, annualized NOI; adjusted annualized NOI; in the case of our construction assets, estimated square feet, estimated number of units, the estimated completion date, estimated stabilization date, estimated incremental investment, estimated total investment, projected NOI yield, weighted average projected NOI yield, NOI yield or estimated total project cost, estimated total NOI weighted average completion date, weighted average stabilization date and estimated incremental investment, intended type of asset use and potential tenants, and estimated stabilized NOI; and in the case of our future development assets, estimated potential development density, estimated commercial SF/multifamily units to be replaced, estimated remaining acquisition cost, estimated capitalized cost, estimated total investment, expected key Amazon transaction terms, our anticipated role as developer, property manager and retail leasing agent in connection with Amazon’s new headquarters, planned infrastructure and education improvements related to Amazon’s new headquarters; the economic impacts of Amazon’s new headquarters on the DC region and National Landing, our development planned related to Amazon’s new headquarters, the expected accretion to our net asset value ("NAV") as a result of the Amazon transaction and our future net asset value ("NAV") growth rate; in the case of our Amazon lease transactions and our development opportunities in National Landing, the total square feet to be leased to Amazon and the expected net effective rent, estimated square feet, estimated number of units, the estimated construction start and occupancy dates, estimated incremental investment, and targeted NOI yield; and in the case of our future development opportunities, estimated potential development density. Many of the factors that will determine the outcome of these and our other forward-looking statements are beyond our ability to control or predict. These factors include, among others: adverse economic conditions in the Washington, DC metropolitan area, the timing of and costs associated with development and property improvements, financing commitments, and general competitive factors. For further discussion of factors that could materially affect the outcome of our forward-looking statements and other risks and uncertainties, see “Risk Factors” and the Cautionary Statement Concerning Forward-Looking Statements in the Company's Annual Report on Form 10-K for the year ended December 31, 2018 and other periodic reports the Company files with the Securities and Exchange Commission. For these statements, we claim the protection of the safe harbor for forward-looking statements contained in the Private Securities Litigation Reform Act of 1995. You are cautioned not to place undue reliance on our forward-looking statements. All subsequent written and oral forward-looking statements attributable to us or any person acting on our behalf are expressly qualified in their entirety by the cautionary statements contained or referred to in this section. We do not undertake any obligation to release publicly any revisions to our forward-looking statements to reflect events or circumstances occurring after the issuance of this Investor Package.
Organization and Basis of Presentation
JBG SMITH Properties ("JBG SMITH") was organized as a Maryland real estate investment trust ("REIT") on October 27, 2016 for the purpose of receiving, via the spin-off on July 17, 2017 (the "Separation"), substantially all of the assets and liabilities of Vornado Realty Trust's ("Vornado") Washington, D.C. segment. On July 18, 2017, JBG SMITH acquired the management business and certain assets and liabilities of The JBG Companies ("JBG") (the "Combination"). The Separation and the Combination are collectively referred to as the "Formation Transaction."
The information contained in this Investor Package does not purport to disclose all items required by the accounting principles generally accepted in the United States of America (“GAAP”) and is unaudited information, unless otherwise indicated.
Pro Rata Information
We present certain financial information and metrics in this Investor Package “at JBG SMITH Share,” which refers to our ownership percentage of consolidated and unconsolidated assets in real estate ventures (collectively, “real estate ventures”) as applied to these financial measures and metrics. Financial information “at JBG SMITH Share” is calculated on an asset-by-asset basis by applying our percentage economic interest to each applicable line item of that asset’s financial information. “At JBG SMITH Share” information, which we also refer to as being “at share,” “our pro rata share” or “our share,” is not, and is not intended to be, a presentation in accordance with GAAP. Given that a substantial portion of our assets are held through real estate ventures, we believe this form of presentation, which presents our economic interests in the partially owned entities, provides investors valuable information regarding a significant component of our portfolio, its composition, performance and capitalization.
|
| |
| DISCLOSURES | MARCH 31, 2019
|
We do not control the unconsolidated real estate ventures and do not have a legal claim to our co-venturers’ share of assets, liabilities, revenue and expenses. The operating agreements of the unconsolidated real estate ventures generally allow each co-venturer to receive cash distributions to the extent there is available cash from operations. The amount of cash each investor receives is based upon specific provisions of each operating agreement and varies depending on certain factors including the amount of capital contributed by each investor and whether any investors are entitled to preferential distributions.
With respect to any such third-party arrangement, we would not be in a position to exercise sole decision-making authority regarding the property, real estate venture or other entity, and may, under certain circumstances, be exposed to economic risks not present were a third-party not involved. We and our respective co-venturers may each have the right to trigger a buy-sell or forced sale arrangement, which could cause us to sell our interest, or acquire our co-venturers’ interests, or to sell the underlying asset, either on unfavorable terms or at a time when we otherwise would not have initiated such a transaction. Our real estate ventures may be subject to debt, and the repayment or refinancing of such debt may require equity capital calls. To the extent our co-venturers do not meet their obligations to us or our real estate ventures or they act inconsistent with the interests of the real estate venture, we may be adversely affected. Because of these limitations, the non-GAAP “at JBG SMITH Share” financial information should not be considered in isolation or as a substitute for our financial statements as reported under GAAP.
Definitions
See pages 49-52 for definitions of terms used in this Investor Package.
Information herein with respect to the proposed transaction with Amazon is based on executed leases and purchase and sale agreements between us and Amazon. Closing under these agreements is subject to customary closing conditions.
Non-GAAP Measures
This Investor Package includes non-GAAP measures. For these measures, we have provided an explanation of how these non-GAAP measures are calculated and why JBG SMITH’s management believes that the presentation of these measures provides useful information to investors regarding JBG SMITH’s financial condition and results of operations. Reconciliations of certain non-GAAP measures to the most directly comparable GAAP financial measure are included in this Investor Package. Our presentation of non-GAAP financial measures may not be comparable to similar non-GAAP measures used by other companies.
In addition to "at share" financial information, the following non-GAAP measures are included in this Investor Package:
| |
| • | Earnings Before Interest, Taxes, Depreciation and Amortization ("EBITDA") |
| |
| • | EBITDA for Real Estate ("EBITDAre") |
| |
| • | Funds from Operations ("FFO") |
| |
| • | Funds Available for Distribution ("FAD") |
| |
| • | Net Operating Income ("NOI") |
| |
| • | Estimated Stabilized NOI |
| |
| • | Adjusted Consolidated and Unconsolidated Indebtedness |
| |
| • | Pro Rata Adjusted General and Administrative Expenses |
|
| |
| COMPANY PROFILE | MARCH 31, 2019 (Unaudited)
|
JBG SMITH is an S&P 400 company that owns, operates, invests in and develops assets concentrated in leading urban infill submarkets in and around Washington, DC. We own and operate a portfolio of high-quality commercial and multifamily assets, many of which are amenitized with ancillary retail. Our portfolio reflects our longstanding strategy of owning and operating assets within the Metro-served submarkets in the Washington, DC metropolitan area that have high barriers to entry and key urban amenities, including being within walking distance of a Metro station. Our revenues are derived primarily from leases with commercial and multifamily tenants, including fixed rents and reimbursements from tenants for certain expenses such as real estate taxes, property operating expenses, and repairs and maintenance. In addition to our portfolio, we have a third-party asset management and real estate services business that provides fee-based real estate services to third parties, our real estate ventures and the legacy funds formerly organized by JBG ("JBG Legacy Funds").
Q1 2019 Financial Results
| |
| ▪ | Net income attributable to common shareholders was $24.9 million, or $0.20 per diluted share. |
| |
| ▪ | FFO attributable to common shareholders was $35.1 million, or $0.28 per diluted share. |
| |
| ▪ | Core FFO attributable to common shareholders was $44.2 million, or $0.36 per diluted share. |
Q1 2019 to Q4 2018 Comparison
Below are the key highlights regarding quarter over quarter changes in the JBG SMITH portfolio.
Operating Assets
| |
| ▪ | Annualized NOI for the operating portfolio for the three months ended March 31, 2019 was $321.6 million, compared to $341.8 million for the three months ended December 31, 2018, at our share. The decrease in NOI is primarily attributable to lost income from disposed assets and increased rental abatements. |
| |
| ▪ | The operating commercial portfolio was 90.2% leased and 85.6% occupied as of March 31, 2019, compared to 89.6% and 85.5% as of December 31, 2018 at our share. |
| |
| ▪ | The operating multifamily portfolio was 97.0% leased and 94.8% occupied as of March 31, 2019, compared to 95.7% and 93.9% as of December 31, 2018 at our share. |
| |
| ▪ | Same store NOI decreased 10.1% to $73.6 million for the three months ended March 31, 2019, compared to $81.9 million for the three months ended March 31, 2018. The decrease in same store NOI for the three months ended March 31, 2019 is largely attributable to rental abatements and lower base rent. The reported same store pool as of March 31, 2019 includes only the assets that were in service for the entirety of both periods being compared. See page 51 for the definition of same store. |
Under Construction
| |
| ▪ | During the quarter ended March 31, 2019, there were nine assets under construction (five commercial assets and four multifamily assets), consisting of 926,530 square feet and 1,298 units, both at our share. |
Near-Term Development
| |
| ▪ | As of March 31, 2019, there were no assets in near-term development. |
Future Development
| |
| ▪ | As of March 31, 2019, there were 40 future development assets consisting of 18.7 million square feet of estimated potential density at our share, including the 4.1 million square feet held for sale to Amazon. |
|
| |
| COMPANY PROFILE | MARCH 31, 2019 (Unaudited)
|
Acquisition and Disposition Activity During the Quarter
| |
| ▪ | Sold Commerce Executive/Commerce Metro Land, an operating commercial/future development asset located in Reston, Virginia, for $115.0 million. The sale also included approximately 894,000 square feet of estimated potential development density. |
| |
| ▪ | Executed purchase and sale agreements with Amazon for two of our National Landing Future Development assets, Pen Place and Mets 6, 7 and 8, which will serve as the initial phase of new construction associated with Amazon’s additional headquarters. Subject to customary closing conditions, Amazon is expected to pay $293.9 million for the sites, or $72.00 per square foot based on their combined estimated potential development density of up to approximately 4.1 million square feet. We expect to close on the Mets land sale as early as 2019 and on Pen Place as early as 2020. |
| |
| ▪ | Executed a contract to purchase a stabilized multifamily asset located in Washington, DC, which we intend to use a replacement property in a 1031 like-kind exchange for the expected proceeds from the sale of the Mets 6, 7 and 8 land parcels to Amazon, which is expected to close later this year. |
Equity Offering
In April 2019, we closed an underwritten public offering of 11.5 million common shares (including 1.5 million common shares related to the exercise of the underwriters' option to cover overallotments) at $42.00 per share, which generated net proceeds, after deducting the underwriting discounts and commissions and other estimated offering expenses, of approximately $472.3 million. We intend to use the net proceeds to fund development opportunities and for general corporate purposes.
In April 2019, we repaid the mortgage debt totaling approximately $293.6 million at The Bartlett and Fort Totten Square.
|
| | | | |
| Executive Officers | | Company Snapshot as of March 31, 2019 |
| | | | | |
| W. Matthew Kelly | Chief Executive Officer and Trustee | | Exchange/ticker | NYSE: JBGS |
| David P. Paul | President and Chief Operating Officer | | Insider ownership (1) | approximately 8% |
| Stephen W. Theriot | Chief Financial Officer | | Indicated annual dividend per share | $0.90 |
| Kevin P. Reynolds | Chief Development Officer | | Dividend yield | 2.2% |
| Steven A. Museles | Chief Legal Officer | | | |
| M. Moina Banerjee | Executive Vice President, Head of Capital Markets | | Total Enterprise Value (dollars in billions, except share price) | |
| | | | Common share price | $41.35 |
| | | | Common shares and common limited partnership units ("OP Units") outstanding (in millions) | 137.76 |
| | | | Total market capitalization | $5.70 |
| | | | Total consolidated and unconsolidated indebtedness at JBG SMITH share | 2.43 |
| | | | Less: cash and cash equivalents at JBG SMITH share | (0.41) |
| | | | Net debt | $2.02 |
| | | | Total Enterprise Value | $7.72 |
| | | | | |
| | | | Net Debt / Total Enterprise Value (2) | 26.3% |
| | | | | |
| | (1) | Represents the percentage of all outstanding common shares of JBG SMITH Properties owned or represented by the Company’s trustees and executive officers as of March 31, 2019 assuming that all OP Units are redeemed for shares and including the 11.5 million shares issued in the underwritten public offering completed in April 2019. .
|
| | | (2) | Pro forma Net Debt / Total Enterprise Value would have been 20.1% as of March 31, 2019, including the $472.3 million of net proceeds from the underwritten public offering completed in April 2019. |
|
| |
| FINANCIAL HIGHLIGHTS | MARCH 31, 2019 (Unaudited)
|
|
| | | |
| dollars in thousands, except per share data | Three Months Ended March 31, 2019 |
| | |
| Summary Financial Results | |
| Total revenue | $ | 155,199 |
|
| Net income attributable to common shareholders | $ | 24,861 |
|
| Per diluted common share | $ | 0.20 |
|
| Operating portfolio NOI | $ | 79,661 |
|
| FFO attributable to operating partnership common units (including units owned by JBG SMITH Properties) | $ | 39,902 |
|
| Per operating partnership common unit | $ | 0.28 |
|
| Core FFO attributable to operating partnership common units (including units owned by JBG SMITH Properties) | $ | 50,256 |
|
| Per operating partnership common unit | $ | 0.36 |
|
| FAD attributable to the operating partnership common units (including units owned by JBG SMITH Properties) | $ | 27,140 |
|
| FAD payout ratio | 115.3 | % |
| EBITDA attributable to operating partnership common units (including units owned by JBG SMITH Properties) | $ | 100,774 |
|
| EBITDAre attributable to operating partnership common units (including units owned by JBG SMITH Properties) | $ | 61,741 |
|
| Adjusted EBITDA attributable to operating partnership common units (including units owned by JBG SMITH Properties) | $ | 71,326 |
|
Net debt to annualized adjusted EBITDA (1) | 7.1x |
|
| | |
| | March 31, 2019 |
| | |
| Debt Summary and Key Ratios (at JBG SMITH Share) | |
Total consolidated indebtedness (2) | $ | 2,128,803 |
|
Total consolidated and unconsolidated indebtedness (2) | $ | 2,432,200 |
|
| Weighted average interest rates: | |
| Variable rate debt | 4.53 | % |
| Fixed rate debt | 4.16 | % |
| Total debt | 4.28 | % |
| Cash and cash equivalents | $ | 405,646 |
|
____________________
| |
| (1) | Pro forma Net Debt to Annualized Adjusted EBITDA would have been 5.4x for the three months ended March 31, 2019, including the $472.3 million of net proceeds from the underwritten public offering completed in April 2019. |
| |
| (2) | Net of premium/discount and deferred financing costs. |
|
| |
| FINANCIAL HIGHLIGHTS - TRENDS | MARCH 31, 2019 (Unaudited)
|
|
| | | | | | | | | | | | | | | | |
| | | Three Months Ended |
| dollars in thousands, except per share data, at JBG SMITH share | | Q1 2019 | Q4 2018 | Q3 2018 | Q2 2018 | Q1 2018 |
Commercial NOI (1) | | $ | 59,304 |
| $ | 65,462 |
| $ | 71,314 |
| $ | 75,311 |
| $ | 73,764 |
|
Multifamily NOI (2) | | 20,357 |
| 20,078 |
| 19,615 |
| 19,324 |
| 19,059 |
|
Operating portfolio NOI (3) | | $ | 79,661 |
| $ | 85,540 |
| $ | 90,929 |
| $ | 94,635 |
| $ | 92,823 |
|
Total Annualized NOI (4) | | $ | 321,583 |
| $ | 341,849 |
| $ | 364,915 |
| $ | 378,540 |
| $ | 371,292 |
|
| | | | | | | |
| Net income (loss) attributable to common shareholders | | $ | 24,861 |
| $ | 710 |
| $ | 22,830 |
| $ | 20,574 |
| $ | (4,190 | ) |
| Per diluted common share | | $ | 0.20 |
| $ | (0.01 | ) | $ | 0.19 |
| $ | 0.17 |
| $ | (0.04 | ) |
FFO attributable to operating partnership common units (3) (5) | | $ | 39,902 |
| $ | 44,834 |
| $ | 49,246 |
| $ | 42,522 |
| $ | 47,836 |
|
| Per operating partnership common unit | | $ | 0.28 |
| $ | 0.32 |
| $ | 0.36 |
| $ | 0.31 |
| $ | 0.35 |
|
Core FFO attributable to operating partnership common units (3) (5) | $ | 50,256 |
| $ | 56,948 |
| $ | 59,256 |
| $ | 62,305 |
| $ | 61,225 |
|
| Per operating partnership common unit | | $ | 0.36 |
| $ | 0.41 |
| $ | 0.43 |
| $ | 0.45 |
| $ | 0.44 |
|
FAD attributable to operating partnership common units (5) (6) | | $ | 27,140 |
| $ | 20,736 |
| $ | 45,019 |
| $ | 57,568 |
| $ | 59,948 |
|
| FAD payout ratio | | 115.3 | % | 150.9 | % | 69.3 | % | 54.2 | % | 52.4 | % |
EBITDA attributable to operating partnership common units (3) (5) | | $ | 100,774 |
| $ | 97,503 |
| $ | 102,109 |
| $ | 101,211 |
| $ | 72,898 |
|
EBITDAre attributable to operating partnership common units (3) (5) | $ | 61,741 |
| $ | 70,555 |
| $ | 74,683 |
| $ | 67,815 |
| $ | 72,443 |
|
Adjusted EBITDA attributable to operating partnership common units (3) (5) | | $ | 71,326 |
| $ | 82,608 |
| $ | 83,842 |
| $ | 87,226 |
| $ | 86,122 |
|
Net debt to annualized adjusted EBITDA (7) | | 7.1x |
| 6.5x |
| 6.7x |
| 6.3x |
| 6.9x |
|
| | | | | | | |
| | | Q1 2019 | Q4 2018 | Q3 2018 | Q2 2018 | Q1 2018 |
| | | | | | | |
| Number of Operating Assets | | | | | | |
Commercial (1) | | 45 |
| 46 |
| 49 |
| 51 |
| 53 |
|
Multifamily (2) | | 16 |
| 16 |
| 16 |
| 16 |
| 15 |
|
| Total | | 61 |
| 62 |
| 65 |
| 67 |
| 68 |
|
| | | | | | | |
Operating Portfolio % Leased (8) | | | | | | |
Commercial (1) (9) | | 90.2 | % | 89.6 | % | 87.1 | % | 87.5 | % | 87.9 | % |
Multifamily (2) | | 97.0 | % | 95.7 | % | 96.1 | % | 95.9 | % | 96.1 | % |
| Weighted Average | | 92.0 | % | 91.2 | % | 89.4 | % | 89.5 | % | 89.8 | % |
| | | | | | | |
Operating Portfolio % Occupied (10) | | | | | | |
Commercial (1) (9) | | 85.6 | % | 85.5 | % | 85.4 | % | 86.0 | % | 87.0 | % |
Multifamily (2) | | 94.8 | % | 93.9 | % | 94.3 | % | 92.6 | % | 94.2 | % |
| Weighted Average | | 88.1 | % | 87.7 | % | 87.6 | % | 87.7 | % | 88.7 | % |
See footnotes on page 9.
|
| |
| FINANCIAL HIGHLIGHTS - TRENDS | MARCH 31, 2019 (Unaudited)
|
Footnotes
Note: See appendices for reconciliations of non-GAAP financial measures to their respective comparable GAAP financial measures. FFO attributable to operating partnership common units for Q1 2018 was restated in compliance with the definition established by the National Association of Real Estate Investment Trusts (“NAREIT”) in the NAREIT FFO White Paper - 2018 Restatement issued in 2018.
| |
| (1) | Beginning in Q4 2018, JBG SMITH renamed the Office portfolio to the Commercial portfolio and reclassified Vienna Retail, Stonebridge at Potomac Town Center and Crystal City Marriott from the Other portfolio to the Commercial portfolio. |
| |
| (2) | Beginning in Q4 2018, JBG SMITH reclassified North End Retail from the Other portfolio to the Multifamily portfolio. |
| |
| (3) | Due to our adoption of the new accounting standard for leases, beginning in 2019, we no longer capitalize internal leasing costs and expense these costs as incurred (such costs were $2.2 million, $1.5 million, $1.5 million and $1.3 million for Q4 2018, Q3 2018, Q2 2018 and Q1 2018). |
| |
| (4) | Beginning in Q3 2018, JBG SMITH revised the presentation of annualized NOI for Crystal City Marriott to reflect the trailing twelve-month NOI due to the seasonality in the hospitality business. |
| |
| (5) | Operating partnership common units include units owned by JBG SMITH Properties. |
| |
| (6) | The Q1 2019 and Q4 2018 declines in FAD available to the Operating Partnership Common Units were attributable to significant increases in second generation tenant improvements and leasing commissions from the early renewal of several leases during the quarters. Additionally, Q4 2018 was further impacted by increases in recurring capital expenditures, which is consistent with historical seasonality trends. |
| |
| (7) | Pro forma Net Debt to Annualized Adjusted EBITDA would have been 5.4x for the three months ended March 31, 2019, including the $472.3 million of net proceeds from the underwritten public offering completed in April 2019. |
| |
| (8) | Beginning in Q3 2018, JBG SMITH excludes storage square feet from the percent leased metric. |
| |
| (9) | Crystal City Marriott and 1700 M Street are excluded from the percent leased and the percent occupied metrics. |
| |
| (10) | Percent occupied excludes occupied retail square feet. |
|
| |
PORTFOLIO OVERVIEW
| MARCH 31, 2019 (Unaudited)
|
|
| | | | | | | | | | | | | | | | | | | | | | | | | | |
| | | | | 100% Share | | At JBG SMITH Share |
| | | Number of Assets | | Square Feet/Units | | Square Feet/Units | | %
Leased | | % Occupied | | Annualized
Rent (in thousands) | | Annualized Rent per Square Foot/Monthly Rent Per Unit (1) | Annualized NOI (in thousands) |
| | | | | | | | | | | | | | | | |
| Operating | | | | | | | | | | | | | | | |
Commercial (2) | | | | | | | | | | | | | | | |
| In service | | 45 |
| | 12,542,688 |
| | 10,904,102 |
| | 90.2 | % | | 85.6 | % | | $ | 404,881 |
| | $ | 44.57 |
| $ | 240,155 |
|
| Multifamily | | | | | | | | | | | | | | | |
| In service | | 15 |
| | 6,024 |
| | 4,240 |
| | 97.5 | % | | 95.3 | % | | $ | 106,995 |
| | $ | 2,121 |
| $ | 76,760 |
|
| Recently delivered | | 1 |
| | 291 |
| | 291 |
| | 89.2 | % | | 86.9 | % | | 8,432 |
| | 2,422 |
| 4,668 |
|
| Total / weighted average | | 16 |
| | 6,315 |
| | 4,531 |
| | 97.0 | % | | 94.8 | % | | $ | 115,427 |
| | $ | 2,139 |
| $ | 81,428 |
|
| | | | | | | | | | | 88.1 | % | | | | | |
| Operating - Total / Weighted Average | | 61 |
| | 12,542,688 SF/ 6,315 Units |
| | 10,904,102 SF/ 4,531 Units |
| | 92.0 | % | | 88.1 | % | | $ | 520,308 |
| | $44.57 per SF/ $2,139 per unit |
| $ | 321,583 |
|
| | | | | | | | | | | | | | | | |
Development (3) | | | | | | | | | | | | | | | |
| Under Construction | | | | | | | | | | | | | | | |
Commercial (4) | | 5 |
| | 1,158,429 |
| | 926,530 |
| | 82.1 | % | | | | | | | |
| Multifamily | | 4 |
| | 1,476 |
| | 1,298 |
| | N/A |
| | | | | | | |
| | | | | | | | | | | | | | | | |
| Development - Total | | 9 |
| | 1,158,429 SF/
1,476 Units |
| | 926,530 SF/
1,298 Units |
| | 82.1 | % | | | | | | | |
| | | | | | | | | | | | | | | | |
| Future Development | | 40 |
| | 22,131,000 |
| | 18,688,300 |
| | | | | | | | | |
_______________
| |
| (1) | For commercial assets, represents annualized office rent divided by occupied office square feet; annualized retail rent and retail square feet are excluded from this metric. For multifamily assets, represents monthly multifamily rent divided by occupied units; retail rent is excluded from this metric. Crystal City Marriott and 1700 M Street are excluded from annualized rent per square foot metrics. Occupied square footage may differ from leased square footage because leased square footage includes leases that have been signed but have not yet commenced. |
| |
| (2) | Crystal City Marriott and 1700 M Street are excluded from percent leased, percent occupied, annualized rent, and annualized rent per square foot metrics. |
| |
| (3) | Refer to pages 40-41 for detail on under construction and future development assets. |
| |
| (4) | Includes JBG SMITH’s lease for approximately 84,400 square feet at 4747 Bethesda Avenue. |
|
| |
| CONDENSED CONSOLIDATED BALANCE SHEETS | MARCH 31, 2019 (Unaudited)
|
|
| | | | | | | |
| in thousands | March 31,
2019 | | December 31,
2018 |
| | | | |
| ASSETS | |
| Real estate, at cost: | | | |
| Land and improvements | $ | 1,227,255 |
| | $ | 1,371,874 |
|
| Buildings and improvements | 3,717,906 |
| | 3,722,930 |
|
| Construction in progress, including land | 751,730 |
| | 697,930 |
|
| | 5,696,891 |
| | 5,792,734 |
|
| Less accumulated depreciation | (1,075,309 | ) | | (1,051,875 | ) |
| Real estate, net | 4,621,582 |
| | 4,740,859 |
|
| Cash and cash equivalents | 395,584 |
| | 260,553 |
|
| Restricted cash | 17,877 |
| | 138,979 |
|
| Tenant and other receivables, net | 49,979 |
| | 46,568 |
|
Deferred rent receivable, net
| 152,323 |
| | 143,473 |
|
| Investments in and advances to unconsolidated real estate ventures | 321,366 |
| | 322,878 |
|
Other assets, net
| 297,525 |
| | 264,994 |
|
| Assets held for sale | 168,458 |
| | 78,981 |
|
| TOTAL ASSETS | $ | 6,024,694 |
| | $ | 5,997,285 |
|
| | | | |
| LIABILITIES, REDEEMABLE NONCONTROLLING INTERESTS AND EQUITY | | | |
| Liabilities: | | | |
| Mortgages payable, net | $ | 1,835,842 |
| | $ | 1,838,381 |
|
| Unsecured term loans, net | 297,277 |
| | 297,129 |
|
| Accounts payable and accrued expenses | 134,776 |
| | 130,960 |
|
| Other liabilities, net | 174,434 |
| | 181,606 |
|
| Liabilities related to assets held for sale | 486 |
| | 3,717 |
|
| Total liabilities | 2,442,815 |
| | 2,451,793 |
|
| Commitments and contingencies | | | |
| Redeemable noncontrolling interests | 584,763 |
| | 558,140 |
|
| Total equity | 2,997,116 |
| | 2,987,352 |
|
| TOTAL LIABILITIES, REDEEMABLE NONCONTROLLING INTERESTS AND EQUITY | $ | 6,024,694 |
| | $ | 5,997,285 |
|
_______________
Note: For complete financial statements, please refer to the Company's Quarterly Report on Form 10-Q for the quarter ended March 31, 2019.
|
| |
| CONDENSED CONSOLIDATED STATEMENTS OF OPERATIONS | MARCH 31, 2019 (Unaudited)
(Unaudited) (In thousands) |
|
| | | | | | | |
| in thousands, except per share data | Three Months Ended March 31, |
| | 2019 | | 2018 |
| REVENUE | | | |
| Property rentals | $ | 119,413 |
| | $ | 131,228 |
|
| Third-party real estate services, including reimbursements | 27,691 |
| | 24,330 |
|
| Other income | 8,095 |
| | 7,479 |
|
| Total revenue | 155,199 |
| | 163,037 |
|
| EXPENSES | | | |
| Depreciation and amortization | 48,719 |
| | 49,160 |
|
| Property operating | 32,174 |
| | 35,158 |
|
| Real estate taxes | 17,235 |
| | 19,610 |
|
| General and administrative: | | | |
| Corporate and other | 12,314 |
| | 8,414 |
|
| Third-party real estate services | 28,066 |
| | 22,609 |
|
Share-based compensation related to Formation Transaction and
special equity awards
| 11,131 |
| | 9,428 |
|
| Transaction and other costs | 4,895 |
| | 4,221 |
|
| Total expenses | 154,534 |
| | 148,600 |
|
| OTHER INCOME (EXPENSE) |
| |
|
| Income (loss) from unconsolidated real estate ventures, net | 3,601 |
| | (1,902 | ) |
| Interest and other income, net | 951 |
| | 573 |
|
| Interest expense | (17,174 | ) | | (19,257 | ) |
| Gain on sale of real estate | 39,033 |
| | 455 |
|
| Total other income (expense) | 26,411 |
| | (20,131 | ) |
| INCOME (LOSS) BEFORE INCOME TAX BENEFIT (EXPENSE) | 27,076 |
| | (5,694 | ) |
| Income tax benefit | 1,172 |
| | 908 |
|
| NET INCOME (LOSS) | 28,248 |
| | (4,786 | ) |
| Net (income) loss attributable to redeemable noncontrolling interests | (3,387 | ) | | 594 |
|
| Net loss attributable to noncontrolling interests | — |
| | 2 |
|
| NET INCOME (LOSS) ATTRIBUTABLE TO COMMON SHAREHOLDERS | $ | 24,861 |
| | $ | (4,190 | ) |
| EARNINGS (LOSS) PER COMMON SHARE: | | | |
| Basic | $ | 0.20 |
| | $ | (0.04 | ) |
| Diluted | $ | 0.20 |
| | $ | (0.04 | ) |
| WEIGHTED AVERAGE NUMBER OF COMMON SHARES OUTSTANDING : | | | |
| Basic | 122,573 |
| | 117,955 |
|
| Diluted | 123,423 |
| | 117,955 |
|
___________________
Note: For complete financial statements, please refer to the Company's Quarterly Report on Form 10-Q for the quarter ended March 31, 2019.
|
| |
UNCONSOLIDATED REAL ESTATE VENTURES | MARCH 31, 2019 (Unaudited)
|
|
| | | |
| in thousands, at JBG SMITH share | |
| BALANCE SHEET INFORMATION | March 31, 2019 |
| | |
| Total real estate, at cost | $ | 638,728 |
|
| Less accumulated depreciation | (29,840 | ) |
| Real estate, net | 608,888 |
|
| Cash and cash equivalents | 10,090 |
|
Other assets, net
| 40,478 |
|
| Total assets | $ | 659,456 |
|
| Borrowings, net | $ | 303,397 |
|
| Other liabilities, net | 44,629 |
|
| Total liabilities | $ | 348,026 |
|
|
| | | |
| OPERATING INFORMATION | Three Months Ended March 31, 2019 |
| Total revenue | $ | 13,767 |
|
| Expenses: | |
| Depreciation and amortization | 4,677 |
|
| Property operating | 7,697 |
|
| Real estate taxes | 1,307 |
|
| Total expenses | 13,681 |
|
| Other income (expense): |
|
| Interest expense | (3,676 | ) |
| Interest and other income, net | 3 |
|
| Loss before income tax expense | (3,587 | ) |
| Income tax expense | (1 | ) |
| Net loss | $ | (3,588 | ) |
| Net distributions in excess of our investment in unconsolidated real estate venture | 6,441 |
|
| Other | 748 |
|
| Income from unconsolidated real estate ventures, net | $ | 3,601 |
|
|
| |
| OTHER TANGIBLE ASSETS AND LIABILITIES, NET | MARCH 31, 2019 (Unaudited)
|
|
| | | |
| in thousands, at JBG SMITH share | March 31, 2019 |
| | |
Other Tangible Assets, Net (1) (2) | |
| Restricted cash | $ | 20,642 |
|
| Tenant and other receivables, net | 52,878 |
|
| Other assets, net | 33,598 |
|
| Total Other Tangible Assets, Net | $ | 107,118 |
|
| | |
Other Tangible Liabilities, Net (2) (3) | |
| Accounts payable and accrued liabilities | $ | 157,121 |
|
| Other liabilities, net | 129,967 |
|
| Total Other Tangible Liabilities, Net | $ | 287,088 |
|
____________________
| |
| (1) | Excludes cash and cash equivalents. |
| |
| (2) | Excludes assets held for sale and liabilities related to assets held for sale. |
|
| |
| EBITDA, EBITDAre AND ADJUSTED EBITDA (NON-GAAP) | MARCH 31, 2019 (Unaudited)
|
|
| | | | | | | | |
| dollars in thousands | | Three Months Ended March 31, |
| | | 2019 | | 2018 |
| | | | | |
| EBITDA, EBITDAre and Adjusted EBITDA | | | | |
| Net income (loss) |
| $ | 28,248 |
| | $ | (4,786 | ) |
| Depreciation and amortization expense | | 48,719 |
| | 49,160 |
|
Interest expense (1) | | 17,174 |
| | 19,257 |
|
| Income tax benefit | | (1,172 | ) | | (908 | ) |
| Unconsolidated real estate ventures allocated share of above adjustments | | 7,806 |
| | 10,175 |
|
| Allocated share of above adjustments to noncontrolling interests in consolidated real estate ventures | | (1 | ) | | — |
|
EBITDA (2) | | $ | 100,774 |
| | $ | 72,898 |
|
| Gain on sale of real estate | | (39,033 | ) | | (455 | ) |
EBITDAre (2) | | $ | 61,741 |
| | $ | 72,443 |
|
Transaction and other costs (3) | | 4,895 |
| | 4,221 |
|
| Share-based compensation related to Formation Transaction and special equity awards | | 11,131 |
| | 9,428 |
|
Net distributions in excess of our investment in unconsolidated real estate venture (4) | | (6,441 | ) | | — |
|
| Unconsolidated real estate ventures allocated share of above adjustments | | — |
| | 30 |
|
Adjusted EBITDA (2) | | $ | 71,326 |
| | $ | 86,122 |
|
| | | | | |
Net Debt to Annualized Adjusted EBITDA (5) | | 7.1x |
| | 6.9x |
|
| | | | | |
| | | March 31, 2019 | | March 31, 2018 |
| Net Debt (at JBG SMITH Share) | | | | |
Consolidated indebtedness (6) | | $ | 2,128,803 |
| | $ | 2,185,461 |
|
Unconsolidated indebtedness (6) | | 303,397 |
| | 419,476 |
|
| Total consolidated and unconsolidated indebtedness | 2,432,200 |
| | 2,604,937 |
|
| Less: cash and cash equivalents | | 405,646 |
| | 238,519 |
|
| Net Debt (at JBG SMITH Share) | | $ | 2,026,554 |
| | $ | 2,366,418 |
|
| | | $ | (0.41 | ) | | |
____________________
Note: EBITDAre for the three months ended March 31, 2018 was restated in compliance with the definition established by NAREIT in the NAREIT FFO White Paper - 2018 Restatement issued in 2018.
| |
| (1) | Interest expense includes the amortization of deferred financing costs and the ineffective portion of any interest rate swaps or caps, net of capitalized interest. |
| |
| (2) | Due to our adoption of the new accounting standard for leases, beginning in 2019, we no longer capitalize internal leasing costs and expense these costs as incurred (such costs were $1.3 million for the three months ended March 31, 2018). |
| |
| (3) | Includes fees and expenses incurred in connection with the Formation Transaction (including transition services provided by our former parent, integration costs and severance costs), demolition costs and costs related to other completed, potential and pursued transactions. |
| |
| (4) | As of June 30, 2018, we suspended the equity method of accounting for our investment in the real estate venture that owns 1101 17th Street as our investment had been reduced to zero and we did not have an obligation to provide further financial support to the venture. All subsequent net distributions from the venture have been recognized as income, which will continue until our share of unrecorded earnings and contributions exceed the cumulative excess distributions previously recognized. |
| |
| (5) | Pro forma Net Debt to Annualized Adjusted EBITDA would have been 5.4x for the three months ended March 31, 2019, including the $472.3 million of net proceeds from the underwritten public offering completed in April 2019. |
| |
| (6) | Net of premium/discount and deferred financing costs. |
|
| |
| FFO, CORE FFO AND FAD (NON-GAAP) | MARCH 31, 2019 (Unaudited)
|
|
| | | | | | | |
| in thousands, except per share data | Three Months Ended March 31, |
| | 2019 | | 2018 |
| | | | |
| FFO and Core FFO | | | |
| Net income (loss) attributable to common shareholders | $ | 24,861 |
| | $ | (4,190 | ) |
| Net income (loss) attributable to redeemable noncontrolling interests | 3,387 |
| | (594 | ) |
| Net loss attributable to noncontrolling interests | — |
| | (2 | ) |
| Net income (loss) | 28,248 |
| | (4,786 | ) |
| Gain on sale of real estate | (39,033 | ) | | (455 | ) |
| Real estate depreciation and amortization | 46,035 |
| | 46,639 |
|
| Pro rata share of real estate depreciation and amortization from unconsolidated real estate ventures | 4,653 |
| | 6,436 |
|
| Net (income) loss attributable to noncontrolling interests in consolidated real estate ventures | (1 | ) | | 2 |
|
FFO Attributable to Operating Partnership Common Units (1) | $ | 39,902 |
| | $ | 47,836 |
|
| FFO attributable to redeemable noncontrolling interests | (4,783 | ) | | (7,127 | ) |
FFO attributable to common shareholders (1) | $ | 35,119 |
| | $ | 40,709 |
|
| | | | |
| FFO attributable to the operating partnership common units | $ | 39,902 |
| | $ | 47,836 |
|
Transaction and other costs, net of tax (2) | 4,626 |
| | 4,136 |
|
| Mark-to-market on derivative instruments | (476 | ) | | (1,119 | ) |
| Share of gain from mark-to-market on derivative instruments held by unconsolidated real estate ventures | 227 |
| | (342 | ) |
Net distributions in excess of our investment in unconsolidated real estate venture (3) | (6,441 | ) | | — |
|
| Share-based compensation related to Formation Transaction and special equity awards | 11,131 |
| | 9,428 |
|
| Amortization of management contracts intangible, net of tax | 1,287 |
| | 1,286 |
|
Core FFO Attributable to Operating Partnership Common Units (1) | $ | 50,256 |
| | $ | 61,225 |
|
| Core FFO attributable to redeemable noncontrolling interests | (6,024 | ) | | (9,037 | ) |
Core FFO attributable to common shareholders (1) | $ | 44,232 |
| | $ | 52,188 |
|
| FFO per diluted common share | $ | 0.28 |
| | $ | 0.35 |
|
| Core FFO per diluted common share | $ | 0.36 |
| | $ | 0.44 |
|
| Weighted average diluted shares | 123,423 |
| | 117,955 |
|
|
| | | | | | | |
| FAD | | | |
| Core FFO attributable to the operating partnership common units | $ | 50,256 |
| | $ | 61,225 |
|
| Recurring capital expenditures and second generation tenant improvements and leasing commissions | (22,297 | ) | | (6,097 | ) |
Straight-line and other rent adjustments (4) | (6,808 | ) | | (1,075 | ) |
| Share of straight-line rent from unconsolidated real estate ventures | (135 | ) | | 159 |
|
| Third-party lease liability assumption payments | (1,136 | ) | | (472 | ) |
| Share of third party lease liability assumption payments for unconsolidated real estate ventures | — |
| | (50 | ) |
| Share-based compensation expense | 5,330 |
| | 4,276 |
|
| Amortization of debt issuance costs | 970 |
| | 1,164 |
|
| Share of amortization of debt issuance costs from unconsolidated real estate ventures | 48 |
| | 69 |
|
| Non-real estate depreciation and amortization | 912 |
| | 749 |
|
FAD available to the Operating Partnership Common Units (A) (5) | $ | 27,140 |
| | $ | 59,948 |
|
Distributions to common shareholders and unitholders (6) (B) | $ | 31,284 |
| | $ | 31,423 |
|
FAD Payout Ratio (B÷A) (7) | 115.3 | % | | 52.4 | % |
See footnotes on page 17.
|
| |
| FFO, CORE FFO AND FAD (NON-GAAP) | MARCH 31, 2019 (Unaudited)
|
|
| | | | | | | |
| in thousands, except per share data | Three Months Ended March 31, |
| | 2019 | | 2018 |
| | | | |
| Capital Expenditures | | | |
| Maintenance and recurring capital expenditures | $ | 5,495 |
| | $ | 2,683 |
|
| Share of maintenance and recurring capital expenditures from unconsolidated real estate ventures | 88 |
| | 1,149 |
|
| Second generation tenant improvements and leasing commissions | 16,155 |
| | 1,893 |
|
| Share of second generation tenant improvements and leasing commissions from unconsolidated real estate ventures | 559 |
| | 372 |
|
| Recurring capital expenditures and second generation tenant improvements and leasing commissions | 22,297 |
| | 6,097 |
|
| First generation tenant improvements and leasing commissions | 6,197 |
| | 4,185 |
|
| Share of first generation tenant improvements and leasing commissions from unconsolidated real estate ventures | 233 |
| | 995 |
|
| Non-recurring capital expenditures | 6,722 |
| | 3,366 |
|
| Share of non-recurring capital expenditures from unconsolidated joint ventures | — |
| | 620 |
|
| Non-recurring capital expenditures | 13,152 |
| | 9,166 |
|
| Total JBG SMITH Share of Capital Expenditures | $ | 35,449 |
| | $ | 15,263 |
|
_______________
Note: FFO attributable to operating partnership common units and FFO attributable to common shareholders for the three months ended March 31, 2018 were restated in compliance with the definition established by NAREIT in the NAREIT FFO White Paper - 2018 Restatement issued in 2018.
| |
| (1) | Due to our adoption of the new accounting standard for leases, beginning in 2019, we no longer capitalize internal leasing costs and expense these costs as incurred (such costs were $1.3 million for the three months ended March 31, 2018). |
| |
| (2) | Includes fees and expenses incurred in connection with the Formation Transaction (including transition services provided by our former parent, integration costs, and severance costs), demolition costs and costs related to other completed, potential and pursued transactions. |
| |
| (3) | As of June 30, 2018, we suspended the equity method of accounting for our investment in the real estate venture that owns 1101 17th Street as our investment had been reduced to zero and we did not have an obligation to provide further financial support to the venture. All subsequent net distributions from the venture have been recognized as income, which will continue until our share of unrecorded earnings and contributions exceed the cumulative excess distributions previously recognized. |
| |
| (4) | Includes straight-line rent, above/below market lease amortization and lease incentive amortization. |
| |
| (5) | The decline in FAD available to the Operating Partnership Common Units was attributable to a significant increase in second generation tenant improvements and leasing commissions from the early renewal of several leases during the quarter. |
| |
| (6) | The distribution for the three months ended March 31, 2019 excludes a special dividend of $0.10 per common share that was paid in January 2019. |
| |
| (7) | The FAD payout ratio on a quarterly basis is not necessarily indicative of an amount for the full year due to fluctuation in timing of capital expenditures, the commencement of new leases and the seasonality of our operations. |
|
| |
THIRD-PARTY ASSET MANAGEMENT AND REAL ESTATE SERVICES BUSINESS (NON-GAAP) | MARCH 31, 2019 (Unaudited)
|
|
| | | | | | | | | | | | |
dollars in thousands, at JBG SMITH share
| Three Months Ended March 31, 2019 |
| | Source of Revenue | |
| | Third-Party Management |
JBG SMITH JV Partner (1) | JBG Legacy Funds | Total |
| | | | | |
| Service Revenue | | | | |
| Property management fees | $ | 2,782 |
| $ | 1,096 |
| $ | 1,230 |
| $ | 5,108 |
|
| Asset management fees | — |
| 548 |
| 2,864 |
| 3,412 |
|
| Leasing fees | 939 |
| 154 |
| 1,117 |
| 2,210 |
|
| Development fees | 487 |
| 378 |
| 754 |
| 1,619 |
|
| Construction management fees | 279 |
| 241 |
| 120 |
| 640 |
|
| Other service revenue | 391 |
| 253 |
| 141 |
| 785 |
|
Total Revenue (2) | $ | 4,878 |
| $ | 2,670 |
| $ | 6,226 |
| $ | 13,774 |
|
Pro Rata adjusted general and administrative expense: third-party real estate services (3) | | | | (12,509 | ) |
Total Services Revenue Less Allocated General and Administrative Expenses (4) | |
|
|
|
| $ | 1,265 |
|
____________________
| |
| (1) | Service revenues from joint ventures are calculated on an asset-by-asset basis by applying our real estate venture partners’ respective economic interests to the fees we earned from each consolidated and unconsolidated real estate venture. |
| |
| (2) | Included in “Third-party real estate services, including reimbursements” in our consolidated statement of operations are $13.4 million of reimbursement revenue and $0.5 million of service revenue from our economic interest in consolidated and unconsolidated real estate ventures that are excluded from this table. |
| |
| (3) | Our personnel perform services for wholly owned properties and properties we manage on behalf of third parties, real estate ventures and JBG Legacy Funds. |
We allocate personnel and other costs to wholly owned properties (included in "Property operating expenses" and "General and administrative expense: corporate and other" in our consolidated statement of operations) and to properties owned by the third parties, real estate ventures and JBG Legacy Funds (included in "General and administrative expense: third-party real estate services" in our consolidated statement of operations) using estimates of the time spent performing services related to properties in the respective portfolios and other allocation methodologies.
Allocated general and administrative expenses related to real estate ventures are calculated on an asset-by-asset basis by applying our real estate venture partners’ respective economic interests to the total general and administrative expenses allocated to each asset. See "pro rata adjusted general and administrative expenses" on the next page for a reconciliation of "G&A: third-party real estate services" to "Pro Rata adjusted general and administrative expense: third-party real estate services."
| |
| (4) | Services revenue, excluding reimbursement revenue and service revenue from our economic interest in consolidated and unconsolidated real estate ventures, less allocated general and administrative expenses. Management uses this measure as a supplemental performance measure for its third-party asset management and real estate services business and believes it provides useful information to investors because it reflects only those revenue and expense items incurred by the Company and can be used to assess the profitability of the third-party asset management and real estate services business. |
|
| |
PRO RATA ADJUSTED GENERAL AND ADMINISTRATIVE EXPENSES (NON-GAAP) | MARCH 31, 2019 (Unaudited)
|
|
| | | | | | | | | | | | | | | |
| dollars in thousands | Three Months Ended March 31, 2019 |
| | Per Statement of Operations | Adjustments (1) | Pro Rata Adjusted |
| | A | B | C |
| | | | | | |
| General and Administrative Expenses | | | | | |
| Corporate and other | $ | 12,314 |
| $ | — |
| $ | — |
| $ | 2,154 |
| $ | 14,468 |
|
| Third-party real estate services | 28,066 |
| — |
| (13,403 | ) | (2,154 | ) | 12,509 |
|
Share-based compensation related to Formation Transaction
and special equity awards
| 11,131 |
| (11,131 | ) | — |
| — |
| — |
|
| Total | $ | 51,511 |
| $ | (11,131 | ) | $ | (13,403 | ) | $ | — |
| $ | 26,977 |
|
_______________
|
|
A - Removes share-based compensation related to the Formation Transaction and special equity awards. |
B - Removes $13.4 million of G&A expenses reimbursed by third-party owners of real estate we manage related to revenue which has been excluded from Service Revenue on page 18. Revenue from reimbursements is included in "Third-party real estate services, including reimbursements" in our consolidated statement of operations. |
C - Reflects an adjustment to allocate our share of G&A expenses of unconsolidated real estate ventures from "Third-party real estate services" to "Corporate and other" and our consolidated real estate venture partners' share of G&A expenses from "Corporate and other" to "Third-party real estate services." |
|
| |
OPERATING ASSETS
| MARCH 31, 2019 (Unaudited)
|
|
| | | | | | | | | | | | | | | | | | |
| dollars in thousands, at JBG SMITH share | | | | | Plus: Signed But Not Yet Commenced Leases | Plus: Lease Up of Recently Delivered Assets (1) | Adjusted Annualized NOI |
| | | | Q1 2019 NOI | Annualized NOI |
| | % Occupied | |
| | | | | | | | |
Commercial (2) | | | | | | | |
| DC | 90.9 | % | | $ | 12,601 |
| $ | 50,404 |
| $ | 3,009 |
| $ | — |
| $ | 53,413 |
|
| VA | 84.3 | % | | 44,538 |
| 181,091 |
| 25,602 |
| — |
| 206,693 |
|
| MD | 86.7 | % | | 2,165 |
| 8,660 |
| 289 |
| — |
| 8,949 |
|
| Total / weighted average | 85.6 | % | | $ | 59,304 |
| $ | 240,155 |
| $ | 28,900 |
| $ | — |
| $ | 269,055 |
|
| | | | | | | | |
| Multifamily | | | | | | | |
| DC | 92.6 | % | | $ | 6,305 |
| $ | 25,220 |
| $ | 95 |
| $ | 682 |
| $ | 25,997 |
|
| VA | 95.5 | % | | 12,368 |
| 49,472 |
| — |
| — |
| 49,472 |
|
| MD | 96.0 | % | | 1,684 |
| 6,736 |
| — |
| — |
| 6,736 |
|
| Total / weighted average | 94.8 | % | | $ | 20,357 |
| $ | 81,428 |
| $ | 95 |
| $ | 682 |
| $ | 82,205 |
|
| | | | | | | | |
| Total / Weighted Average | 88.1 | % | | $ | 79,661 |
| $ | 321,583 |
| $ | 28,995 |
| $ | 682 |
| $ | 351,260 |
|
____________________
| |
| (1) | Incremental multifamily revenue of a recently delivered multifamily asset calculated as the product of units available for occupancy up to 95.0% occupancy and the weighted average monthly market rent per unit as of March 31, 2019, multiplied by 12. Excludes potential revenue from vacant retail space in recently delivered multifamily assets. |
| |
| (2) | Crystal City Marriott and 1700 M Street are excluded from the percent occupied metric. |
|
| |
| SUMMARY & SAME STORE NOI (NON-GAAP) | MARCH 31, 2019 (Unaudited)
|
|
| | | | | | | | | | | | | | | | | | | | | | | | | | |
| dollars in thousands | | 100% Share | | At JBG SMITH Share |
| | | | | | | | | | | | | NOI for the Three Months Ended March 31, |
| | | Number of Assets | | Square Feet/Units | | Square Feet/Units | | % Leased (1) | | %
Occupied (1) | | 2019 | | 2018 | | % Change |
| | | | | | | | | | | | | | | |
Same Store (2) | | | | | | | | | | | | | | | | |
| DC | | 14 |
| | 2,574,335 SF/
1,541 Units |
| | 1,863,696 SF/
857 Units |
| | 95.1 | % | | 92.0 | % | | $ | 17,294 |
| | $ | 20,212 |
| | (14.4 | )% |
| VA | | 33 |
| | 8,720,798 SF/
3,196 Units |
| | 7,844,224 SF/
2,885 Units |
| | 91.2 | % | | 86.6 | % | | 52,430 |
| | 57,522 |
| | (8.9 | )% |
| MD | | 9 |
| | 551,369 SF/
1,287 Units |
| | 499,996 SF/
498 Units |
| | 91.4 | % | | 90.9 | % | | 3,849 |
| | 4,139 |
| | (7.0 | )% |
| Total / weighted average | 56 |
| | 11,846,502 SF/
6,024 Units |
| | 10,207,916 SF/
4,240 Units |
| | 92.0 | % | | 87.9 | % | | $ | 73,573 |
| | $ | 81,873 |
| | (10.1 | )% |
| | | | | | | | | | | | | | | | | |
Non-Same Store (3) | | | | | | | | | | | | | | | | |
| DC | | 2 |
| | 34,000 SF/
291 Units |
| | 34,000 SF/
291 Units |
| | 89.2 | % | | 86.9 | % | | $ | 1,612 |
| | $ | 6,615 |
| | (75.6 | )% |
| VA | | 3 |
| | 662,186 SF |
| | 662,186 SF |
| | 93.2 | % | | 92.6 | % | | 4,476 |
| | 7,532 |
| | (40.6 | )% |
| MD | | — |
| | — |
| | — |
| | — |
| | — |
| | — |
| | — |
| | — |
|
| Total / weighted average | 5 |
| | 696,186 SF/ 291 Units |
| | 696,186 SF/
291 Units |
| | 92.2 | % | | 91.1 | % | | $ | 6,088 |
| | $ | 14,147 |
| | (57.0 | )% |
| | | | | | | | | | | | | | | | | |
| Total Operating Portfolio | | | | | | | | | | | | | | | | |
| DC | | 16 |
| | 2,608,335 SF/
1,832 Units |
| | 1,897,696 SF/
1,148 Units |
| | 94.6 | % | | 91.6 | % | | $ | 18,906 |
| | $ | 26,827 |
| | (29.5 | )% |
| VA | | 36 |
| | 9,382,984 SF/ 3,196 Units |
| | 8,506,410 SF/
2,885 Units |
| | 91.3 | % | | 87.0 | % | | 56,906 |
| | 65,054 |
| | (12.5 | )% |
| MD | | 9 |
| | 551,369 SF/
1,287 Units |
| | 499,996 SF/
498 Units |
| | 91.4 | % | | 90.9 | % | | 3,849 |
| | 4,139 |
| | (7.0 | )% |
Operating Portfolio - Total / Weighted Average | 61 |
| | 12,542,688 SF/
6,315 Units |
| | 10,904,102 SF/
4,531 Units |
| | 92.0 | % | | 88.1 | % | | $ | 79,661 |
| | $ | 96,020 |
| | (17.0 | )% |
_______________
| |
| (1) | Crystal City Marriott and 1700 M Street are excluded from the percent leased and percent occupied metrics. |
| |
| (2) | Same store refers to the pool of assets that were in service for the entirety of both periods being compared, except for assets for which significant redevelopment, renovation, or repositioning occurred during either of the periods being compared. |
| |
| (3) | The decrease in non-same store NOI is primarily attributable to lost income from disposed assets. |
|
| |
| SUMMARY NOI (NON-GAAP) | MARCH 31, 2019 (Unaudited)
|
|
| | | | | | | | | | | | | | | | |
| dollars in thousands | NOI for the Three Months Ended March 31, 2019 at JBG SMITH Share |
| | Consolidated (6) | Unconsolidated | | Commercial (6) | Multifamily | Total |
| Number of operating assets | 45 |
| 16 |
| | 45 |
| 16 |
| 61 |
|
Property rentals (1) | $ | 104,682 |
| $ | 8,015 |
| | $ | 84,596 |
| $ | 28,101 |
| $ | 112,697 |
|
| Tenant expense reimbursement | 11,372 |
| 705 |
| | 10,173 |
| 1,904 |
| 12,077 |
|
| Other revenue | 8,716 |
| 694 |
| | 7,768 |
| 1,642 |
| 9,410 |
|
| Total revenue | 124,770 |
| 9,414 |
| | 102,537 |
| 31,647 |
| 134,184 |
|
| | | | | | | |
| Operating expenses | (49,809 | ) | (4,020 | ) | | (42,544 | ) | (11,285 | ) | (53,829 | ) |
| Ground rent expense | (689 | ) | (5 | ) | | (689 | ) | (5 | ) | (694 | ) |
| Total expenses | (50,498 | ) | (4,025 | ) | | (43,233 | ) | (11,290 | ) | (54,523 | ) |
| | | | | | | |
NOI (1) | $ | 74,272 |
| $ | 5,389 |
| | $ | 59,304 |
| $ | 20,357 |
| $ | 79,661 |
|
| | | | | | | |
| Annualized NOI | $ | 300,027 |
| $ | 21,556 |
| | $ | 240,155 |
| $ | 81,428 |
| $ | 321,583 |
|
| Additional Information | | | | | | |
| Free rent (at 100% share) | $ | 8,012 |
| $ | 957 |
| | $ | 8,588 |
| $ | 381 |
| $ | 8,969 |
|
| Free rent (at JBG SMITH share) | $ | 8,012 |
| $ | 173 |
| | $ | 7,995 |
| $ | 190 |
| $ | 8,185 |
|
Annualized free rent (at JBG SMITH share) (2) | $ | 32,048 |
| $ | 692 |
| | $ | 31,980 |
| $ | 760 |
| $ | 32,740 |
|
| Payments associated with assumed lease liabilities (at 100% share) | $ | 1,136 |
| $ | — |
| | $ | 1,136 |
| $ | — |
| $ | 1,136 |
|
| Payments associated with assumed lease liabilities (at JBG SMITH share) | $ | 1,136 |
| $ | — |
| | $ | 1,136 |
| $ | — |
| $ | 1,136 |
|
Annualized payments associated with assumed lease liabilities (at JBG SMITH share)(3) | $ | 4,544 |
| $ | — |
| | $ | 4,544 |
| $ | — |
| $ | 4,544 |
|
% occupied (at JBG SMITH share) (4) | 88.0 | % | 89.2 | % | | 85.6 | % | 94.8 | % | 88.1 | % |
Annualized base rent of signed leases, not commenced (at 100% share) (5) | $ | 27,689 |
| $ | 2,701 |
| | $ | 30,295 |
| $ | 95 |
| $ | 30,390 |
|
Annualized base rent of signed leases, not commenced (at JBG SMITH share) (5) | $ | 27,689 |
| $ | 1,306 |
| | $ | 28,900 |
| $ | 95 |
| $ | 28,995 |
|
___________________
| |
| (1) | Property rentals excludes straight-line rent adjustments, and other GAAP adjustments, and include payments associated with assumed lease liabilities. NOI excludes approximately $4.0 million of related party management fees at JBG SMITH's share. See definition of NOI on page 50. |
| |
| (2) | Represents JBG SMITH's share of free rent for the three months ended March 31, 2019 multiplied by four. |
| |
| (3) | Represents JBG SMITH's share of payments associated with assumed lease liabilities for the three months ended March 31, 2019 multiplied by four. |
| |
| (4) | Crystal City Marriott and 1700 M Street are excluded from the percent occupied metric. |
| |
| (5) | Represents monthly base rent before free rent and straight line rent adjustments, plus estimated tenant reimbursements for the month in which the lease commences, multiplied by 12. Triple net leases are converted to a gross basis by adding estimated tenant reimbursements to monthly base rent. Includes only leases for office and retail spaces that were vacant as of March 31, 2019. |
| |
| (6) | Includes $2.1 million of annualized NOI from Commerce Executive, which was sold in February 2019. |
|
| |
SUMMARY NOI - COMMERCIAL (NON-GAAP)
| MARCH 31, 2019 (Unaudited)
|
|
| | | | | | | | | | | | | | | | | | | |
| dollars in thousands | NOI for the Three Months Ended March 31, 2019 at JBG SMITH Share |
| | Consolidated (6) | Unconsolidated | | DC | VA (6) | MD | Total |
| Number of operating assets | 35 |
| 10 |
| | 10 |
| 31 |
| 4 |
| 45 |
|
Property rentals (1) | $ | 78,789 |
| $ | 5,807 |
| | $ | 18,461 |
| $ | 62,688 |
| $ | 3,447 |
| $ | 84,596 |
|
| Tenant expense reimbursement | 9,598 |
| 575 |
| | 2,539 |
| 7,345 |
| 289 |
| 10,173 |
|
| Other revenue | 7,200 |
| 568 |
| | 1,503 |
| 5,591 |
| 674 |
| 7,768 |
|
| Total revenue | 95,587 |
| 6,950 |
| | 22,503 |
| 75,624 |
| 4,410 |
| 102,537 |
|
| | | | | | | | |
| Operating expenses | (39,339 | ) | (3,205 | ) | | (9,702 | ) | (30,744 | ) | (2,098 | ) | (42,544 | ) |
| Ground rent expense | (689 | ) | — |
| | (200 | ) | (342 | ) | (147 | ) | (689 | ) |
| Total expenses | (40,028 | ) | (3,205 | ) | | (9,902 | ) | (31,086 | ) | (2,245 | ) | (43,233 | ) |
| | | | | | | | |
NOI (1) | $ | 55,559 |
| $ | 3,745 |
| | $ | 12,601 |
| $ | 44,538 |
| $ | 2,165 |
| $ | 59,304 |
|
| | | | | | | | |
| Annualized NOI | $ | 225,175 |
| $ | 14,980 |
| | $ | 50,404 |
| $ | 181,091 |
| $ | 8,660 |
| $ | 240,155 |
|
| Additional Information | | | | | | | |
| Free rent (at 100% share) | $ | 7,851 |
| $ | 737 |
| | $ | 1,962 |
| $ | 6,228 |
| $ | 398 |
| $ | 8,588 |
|
| Free rent (at JBG SMITH share) | $ | 7,851 |
| $ | 144 |
| | $ | 1,419 |
| $ | 6,198 |
| $ | 378 |
| $ | 7,995 |
|
Annualized free rent (at JBG SMITH share) (2) | $ | 31,404 |
| $ | 576 |
| | $ | 5,676 |
| $ | 24,792 |
| $ | 1,512 |
| $ | 31,980 |
|
| Payments associated with assumed lease liabilities (at 100% share) | $ | 1,136 |
| $ | — |
| | $ | — |
| $ | 1,136 |
| $ | — |
| $ | 1,136 |
|
| Payments associated with assumed lease liabilities (at JBG SMITH share) | $ | 1,136 |
| $ | — |
| | $ | — |
| $ | 1,136 |
| $ | — |
| $ | 1,136 |
|
Annualized payments associated with assumed lease liabilities (at JBG SMITH share) (3) | $ | 4,544 |
| $ | — |
| | $ | — |
| $ | 4,544 |
| $ | — |
| $ | 4,544 |
|
% occupied (at JBG SMITH share) (4) | 85.5 | % | 86.8 | % | | 90.9 | % | 84.3 | % | 86.7 | % | 85.6 | % |
Annualized base rent of signed leases, not commenced (at 100% share) (5) | $ | 27,594 |
| $ | 2,701 |
| | $ | 4,190 |
| $ | 25,816 |
| $ | 289 |
| $ | 30,295 |
|
Annualized base rent of signed leases, not commenced (at JBG SMITH share) (5) | $ | 27,594 |
| $ | 1,306 |
| | $ | 3,009 |
| $ | 25,602 |
| $ | 289 |
| $ | 28,900 |
|
___________________
| |
| (1) | Property rentals excludes straight-line rent adjustments, and other GAAP adjustments, and include payments associated with assumed lease liabilities. NOI excludes approximately $3.0 million of related party management fees at JBG SMITH's share. See definition of NOI on page 50. |
| |
| (2) | Represents JBG SMITH's share of free rent for the three months ended March 31, 2019 multiplied by four. |
| |
| (3) | Represents JBG SMITH's share of payments associated with assumed lease liabilities for the three months ended March 31, 2019 multiplied by four. |
| |
| (4) | Crystal City Marriott and 1700 M Street are excluded from the percent occupied metric. |
| |
| (5) | Represents monthly base rent before free rent and straight-line rent adjustments, plus estimated tenant reimbursements for the month in which the lease commences, multiplied by 12. Triple net leases are converted to a gross basis by adding estimated tenant reimbursements to monthly base rent. Includes only leases for office and retail spaces that were vacant as of March 31, 2019. |
| |
| (6) | Includes $2.1 million of annualized NOI from Commerce Executive, which was sold in February 2019. |
|
| |
| SUMMARY NOI - MULTIFAMILY (NON-GAAP) | MARCH 31, 2019 (Unaudited)
|
|
| | | | | | | | | | | | | | | | | | | |
| dollars in thousands | NOI for the Three Months Ended March 31, 2019 at JBG SMITH Share |
| | Consolidated | Unconsolidated | | DC | VA | MD | Total |
| Number of operating assets | 10 |
| 6 |
| | 6 |
| 5 |
| 5 |
| 16 |
|
Property rentals (1) | $ | 25,893 |
| $ | 2,208 |
| | $ | 8,679 |
| $ | 16,988 |
| $ | 2,434 |
| $ | 28,101 |
|
| Tenant expense reimbursement | 1,774 |
| 130 |
| | 728 |
| 1,103 |
| 73 |
| 1,904 |
|
| Other revenue | 1,516 |
| 126 |
| | 326 |
| 1,159 |
| 157 |
| 1,642 |
|
| Total revenue | 29,183 |
| 2,464 |
| | 9,733 |
| 19,250 |
| 2,664 |
| 31,647 |
|
| | | | | | | | |
| Operating expenses | (10,470 | ) | (815 | ) | | (3,428 | ) | (6,882 | ) | (975 | ) | (11,285 | ) |
| Ground rent expense | — |
| (5 | ) | | — |
| — |
| (5 | ) | (5 | ) |
| Total expenses | (10,470 | ) | (820 | ) | | (3,428 | ) | (6,882 | ) | (980 | ) | (11,290 | ) |
| | | | | | | | |
NOI (1) | $ | 18,713 |
| $ | 1,644 |
| | $ | 6,305 |
| $ | 12,368 |
| $ | 1,684 |
| $ | 20,357 |
|
| | | | | | | | |
| Annualized NOI | $ | 74,852 |
| $ | 6,576 |
| | $ | 25,220 |
| $ | 49,472 |
| $ | 6,736 |
| $ | 81,428 |
|
| Additional Information | | | | | | | |
| Free rent (at 100% share) | $ | 161 |
| $ | 220 |
| | $ | 137 |
| $ | 131 |
| $ | 113 |
| $ | 381 |
|
| Free rent (at JBG SMITH share) | $ | 161 |
| $ | 29 |
| | $ | 63 |
| $ | 113 |
| $ | 14 |
| $ | 190 |
|
Annualized free rent (at JBG SMITH share) (2) | $ | 644 |
| $ | 116 |
| | $ | 252 |
| $ | 452 |
| $ | 56 |
| $ | 760 |
|
| Payments associated with assumed lease liabilities (at 100% share) | $ | — |
| $ | — |
| | $ | — |
| $ | — |
| $ | — |
| $ | — |
|
| Payments associated with assumed lease liabilities (at JBG SMITH share) | $ | — |
| $ | — |
| | $ | — |
| $ | — |
| $ | — |
| $ | — |
|
Annualized payments associated with assumed lease liabilities (at JBG SMITH share) (3) | $ | — |
| $ | — |
| | $ | — |
| $ | — |
| $ | — |
| $ | — |
|
% occupied (at JBG SMITH share) | 94.8 | % | 94.5 | % | | 92.6 | % | 95.5 | % | 96.0 | % | 94.8 | % |
Annualized base rent of signed leases, not commenced (at 100% share) (4) | $ | 95 |
| — |
| | $ | 95 |
| — |
| — |
| $ | 95 |
|
Annualized base rent of signed leases, not commenced (at JBG SMITH share) (4) | $ | 95 |
| — |
| | $ | 95 |
| — |
| — |
| $ | 95 |
|
___________________
| |
| (1) | Property rentals excludes straight-line rent adjustments, and other GAAP adjustments, and include payments associated with assumed lease liabilities. NOI excludes approximately $1.0 million of related party management fees at JBG SMITH's share. See definition of NOI on page 50. |
| |
| (2) | Represents JBG SMITH's share of free rent for the three months ended March 31, 2019 multiplied by four. |
| |
| (3) | Represents JBG SMITH's share of payments associated with assumed lease liabilities for the three months ended March 31, 2019 multiplied by four. |
| |
| (4) | Represents monthly base rent before free rent and straight line rent adjustments, plus estimated tenant reimbursements for the month in which the lease commences, multiplied by 12. Triple net leases are converted to a gross basis by adding estimated tenant reimbursements to monthly base rent. Includes only leases for office and retail spaces that were vacant as of March 31, 2019. |
|
| |
| NOI RECONCILIATIONS (NON-GAAP) | MARCH 31, 2019 (Unaudited)
|
|
| | | | | | | |
| dollars in thousands | Three Months Ended March 31, |
| | 2019 | | 2018 |
| | |
| Net income (loss) attributable to common shareholders | $ | 24,861 |
| | $ | (4,190 | ) |
| Add: | | | |
| Depreciation and amortization expense | 48,719 |
| | 49,160 |
|
| General and administrative expense: | | | |
| Corporate and other | 12,314 |
| | 8,414 |
|
| Third-party real estate services | 28,066 |
| | 22,609 |
|
Share-based compensation related to Formation Transaction and
special equity awards
| 11,131 |
| | 9,428 |
|
| Transaction and other costs | 4,895 |
| | 4,221 |
|
| Interest expense | 17,174 |
| | 19,257 |
|
| Income tax benefit | (1,172 | ) | | (908 | ) |
| Net income (loss) attributable to redeemable noncontrolling interests | 3,387 |
| | (594 | ) |
| Less: | | | |
Third-party real estate services, including reimbursements
| 27,691 |
| | 24,330 |
|
| Other income (excluding parking income of $6,455 and $6,363 in 2019 and 2018) | 1,640 |
| | 1,116 |
|
| Income (loss) from unconsolidated real estate ventures, net | 3,601 |
| | (1,902 | ) |
| Interest and other income, net | 951 |
| | 573 |
|
| Gain on sale of real estate | 39,033 |
| | 455 |
|
| Net loss attributable to noncontrolling interests | — |
| | 2 |
|
| Consolidated NOI | 76,459 |
| | 82,823 |
|
| Proportionate NOI attributable to unconsolidated real estate ventures | 5,386 |
| | 9,207 |
|
Non-cash rent adjustments (1) | (6,808 | ) | | (1,096 | ) |
Other adjustments (2) | 3,353 |
| | 4,252 |
|
| Total adjustments | 1,931 |
| | 12,363 |
|
| NOI | $ | 78,390 |
| | $ | 95,186 |
|
Less: out-of-service NOI loss (3) | (1,271 | ) | | (834 | ) |
| Operating portfolio NOI | $ | 79,661 |
| | $ | 96,020 |
|
Non-same store NOI (4) | 6,088 |
| | 14,147 |
|
Same store NOI (5) | $ | 73,573 |
| | $ | 81,873 |
|
| | | | |
| Growth in same store NOI | (10.1 | )% | | |
| Number of properties in same store pool | 56 |
| | |
___________________
| |
| (1) | Adjustment to exclude straight-line rent, above/below market lease amortization and lease incentive amortization. |
| |
| (2) | Adjustment to include other income and payments associated with assumed lease liabilities related to operating properties and to exclude commercial lease termination revenue. |
| |
| (3) | Includes the results for our Under Construction assets and Future Development Pipeline. |
| |
| (4) | Includes the results for properties that were not owned, operated and in service for the entirety of both periods being compared and properties for which significant redevelopment, renovation or repositioning occurred during either of the periods being compared. The decrease in non-same store NOI is primarily attributable to lost income from disposed assets. |
| |
| (5) | Includes the results of the properties that are owned, operated and in service for the entirety of both periods being compared except for properties for which significant redevelopment, renovation or repositioning occurred during either of the periods being compared. |
|
| |
| LEASING ACTIVITY - OFFICE | MARCH 31, 2019 (Unaudited)
|
|
| | | |
| square feet in thousands | Three Months Ended March 31, 2019 |
| Square feet leased: | |
| At 100% share | 807 |
|
| At JBG SMITH share | 785 |
|
Initial rent (1) | $ | 44.97 |
|
Straight-line rent (2) | $ | 45.91 |
|
| Weighted average lease term (years) | 5.4 |
|
| Weighted average free rent period (months) | 2.7 |
|
| Second generation space: | 555 |
|
| Square feet | 230 |
|
| Cash basis: | |
Initial rent (1) | $ | 45.04 |
|
| Prior escalated rent | $ | 48.32 |
|
| % change | (6.8 | )% |
| GAAP basis: | |
Straight-line rent (2) | $ | 46.19 |
|
| Prior straight-line rent | $ | 48.07 |
|
| % change | (3.9 | )% |
| Tenant improvements: | |
| Per square foot | $ | 39.31 |
|
| Per square foot per annum | $ | 7.32 |
|
| % of initial rent | 16.3 | % |
| Leasing commissions: | |
| Per square foot | $ | 4.25 |
|
| Per square foot per annum | $ | 0.79 |
|
| % of initial rent | 1.8 | % |
___________________
Note: At JBG SMITH share, unless otherwise indicated. The leasing activity and related statistics are based on leases signed during the period and are not intended to coincide with the commencement of rental revenue in accordance with GAAP. Second generation space represents square footage that was vacant for less than nine months.
| |
| (1) | Represents the cash basis weighted average starting rent per square foot, which is generally indicative of market rents. Triple net leases are converted to a gross basis by adding estimated tenant reimbursements to monthly base rent. Most leases include free rent and periodic step-ups in rent which are not included in the initial cash basis rent per square foot but are included in the GAAP basis deferred rent per square foot. |
| |
| (2) | Represents the GAAP basis weighted average rent per square foot that is recognized over the term of the respective leases, and includes the effect of free rent and fixed step-ups in rent. |
|
| |
| NET EFFECTIVE RENT - OFFICE | MARCH 31, 2019 (Unaudited)
|
|
| | | | | | | | | | | | | | | | | | | | | | | |
| square feet in thousands, dollars per square feet, at JBG SMITH share | Trailing Five Quarter Average | | Three Months Ended |
| | | March 31, 2019 | | December 31, 2018 | | September 30, 2018 | | June 30, 2018 | | March 31, 2018 |
| Square feet | 509 |
| | 785 |
| | 741 |
| | 378 |
| | 319 |
| | 322 |
|
| Weighted average lease term (years) | 7.7 |
| | 5.4 |
| | 10.2 |
| | 7.0 |
| | 8.6 |
| | 7.3 |
|
Initial rent (1) | $ | 46.86 |
| | $ | 44.97 |
| | $ | 45.08 |
| | $ | 42.89 |
| | $ | 54.01 |
| | $ | 47.35 |
|
Base rent per annum (2) | $ | 54.70 |
| | $ | 49.34 |
| | $ | 57.48 |
| | $ | 44.43 |
| | $ | 67.89 |
| | $ | 54.38 |
|
| Tenant improvements per annum | (6.27 | ) | | (7.32 | ) | | (6.54 | ) | | (3.77 | ) | | (7.46 | ) | | (6.27 | ) |
| Leasing commissions per annum | (1.43 | ) | | (0.79 | ) | | (1.93 | ) | | (0.61 | ) | | (2.03 | ) | | (1.80 | ) |
| Free rent per annum | (3.81 | ) | | (1.89 | ) | | (3.69 | ) | | (3.55 | ) | | (4.05 | ) | | (5.89 | ) |
| Net Effective Rent | $ | 43.19 |
| | $ | 39.34 |
| | $ | 45.32 |
| | $ | 36.50 |
| | $ | 54.35 |
| | $ | 40.42 |
|
| | | | | | | | | | | | |
| | | | | | | | | | | | |
| DC | | | | | | | | | | | |
| Square feet | 84 |
| | 33 |
| | 72 |
| | 88 |
| | 175 |
| | 50 |
|
Initial rent (1) | $ | 59.96 |
| | $ | 53.40 |
| | $ | 76.45 |
| | $ | 49.73 |
| | $ | 66.29 |
| | $ | 53.92 |
|
| Net effective rent | $ | 52.60 |
| | $ | 39.41 |
| | $ | 70.85 |
| | $ | 42.34 |
| | $ | 64.65 |
| | $ | 45.76 |
|
| | | | | | | | | | | | |
| VA | | | | | | | | | | | |
| Square feet | 404 |
| | 717 |
| | 658 |
| | 282 |
| | 115 |
| | 250 |
|
Initial rent (1) | $ | 41.85 |
| | $ | 44.03 |
| | $ | 41.83 |
| | $ | 41.08 |
| | $ | 38.20 |
| | $ | 44.08 |
|
| Net effective rent | $ | 35.96 |
| | $ | 38.18 |
| | $ | 41.85 |
| | $ | 33.86 |
| | $ | 30.61 |
| | $ | 35.28 |
|
| | | | | | | | | | | | |
| MD | | | | | | | | | | | |
| Square feet | 21 |
| | 35 |
| | 10 |
| | 8 |
| | 28 |
| | 22 |
|
Initial rent (1) | $ | 46.46 |
| | $ | 56.36 |
| | $ | 32.24 |
| | $ | 31.75 |
| | $ | 42.70 |
| | $ | 69.26 |
|
| Net effective rent | $ | 41.68 |
| | $ | 58.53 |
| | $ | 27.21 |
| | $ | 20.30 |
| | $ | 37.38 |
| | $ | 64.96 |
|
____________________
Note: Leasing activity and related statistics are based on leases signed during the period and are not intended to coincide with the commencement of rental revenue in accordance with GAAP. Second generation space represents square footage that was vacant for less than nine months.
| |
| (1) | Represents the cash basis weighted average starting rent per square foot, which is generally indicative of market rents. Triple net leases are converted to a gross basis by adding estimated tenant reimbursements to monthly base rent. Most leases include free rent and periodic step-ups in rent which are not included in the initial cash basis rent per square foot. |
| |
| (2) | Represents the weighted average base rent before free rent, plus estimated tenant reimbursements that is recognized over the term of the respective leases, including the effect of fixed step-ups in rent, divided by square feet, and divided by years of lease term. Triple net leases are converted to a gross basis by adding estimated tenant reimbursements to base rent. Tenant reimbursements are estimated by escalating tenant reimbursements as of the respective reporting period, or management’s estimate thereof, by 2.75% annually through the lease expiration year. |
|
| |
| LEASE EXPIRATIONS | MARCH 31, 2019 (Unaudited)
|
|
| | | | | | | | | | | | | | | | | | | | | | | | |
| | | | | At JBG SMITH Share |
| Year of Lease Expiration | | Number
of Leases | |
Square Feet | | % of
Total
Square Feet | | Annualized
Rent
(in thousands) | | % of
Total
Annualized
Rent | | Annualized
Rent Per
Square Foot | | Estimated
Annualized
Rent Per
Square Foot at
Expiration (1) |
| Month-to-Month | | 52 |
| | 269,764 |
| | 2.9 | % | | $ | 9,505 |
| | 2.3 | % | | $ | 35.23 |
| | $ | 35.23 |
|
| 2019 | | 107 |
| | 565,467 |
| | 6.0 | % | | 24,511 |
| | 5.9 | % | | 43.35 |
| | 43.62 |
|
| 2020 | | 152 |
| | 1,106,872 |
| | 11.8 | % | | 45,683 |
| | 11.1 | % | | 41.27 |
| | 42.16 |
|
| 2021 | | 116 |
| | 904,151 |
| | 9.7 | % | | 42,324 |
| | 10.3 | % | | 46.81 |
| | 47.87 |
|
| 2022 | | 100 |
| | 1,324,332 |
| | 14.1 | % | | 57,829 |
| | 14.0 | % | | 43.67 |
| | 45.42 |
|
| 2023 | | 90 |
| | 520,455 |
| | 5.6 | % | | 22,368 |
| | 5.4 | % | | 42.98 |
| | 47.16 |
|
| 2024 | | 82 |
| | 836,660 |
| | 8.9 | % | | 38,714 |
| | 9.4 | % | | 46.27 |
| | 51.42 |
|
| 2025 | | 47 |
| | 333,428 |
| | 3.6 | % | | 12,999 |
| | 3.2 | % | | 38.98 |
| | 43.17 |
|
| 2026 | | 57 |
| | 314,354 |
| | 3.4 | % | | 13,667 |
| | 3.3 | % | | 43.48 |
| | 51.83 |
|
| 2027 | | 45 |
| | 431,891 |
| | 4.6 | % | | 18,662 |
| | 4.5 | % | | 43.21 |
| | 51.61 |
|
| Thereafter | | 109 |
| | 2,756,180 |
| | 29.4 | % | | 125,810 |
| | 30.6 | % | | 45.65 |
| | 57.80 |
|
| Total / Weighted Average | | 957 |
| | 9,363,554 |
| | 100.0 | % | | $ | 412,072 |
| | 100.0 | % | | $ | 44.01 |
| | $ | 49.57 |
|
____________________
Note: Includes all in-place leases as of March 31, 2019 for office and retail space within JBG SMITH's operating portfolio and assuming no exercise of renewal options or early termination rights. The weighted average remaining lease term for the entire portfolio is 6.2 years.
| |
| (1) | Represents monthly base rent before free rent, plus tenant reimbursements, as of lease expiration multiplied by 12 and divided by square feet. Triple net leases are converted to a gross basis by adding tenant reimbursements to monthly base rent. Tenant reimbursements at lease expiration are estimated by escalating tenant reimbursements as of March 31, 2019, or management’s estimate thereof, by 2.75% annually through the lease expiration year. |
|
| |
| SIGNED BUT NOT YET COMMENCED LEASES | MARCH 31, 2019 (Unaudited)
|
|
| | | | | | | | | | | | | | | | | | | | | | | | | | | | | | |
| dollars in thousands, at JBG SMITH share | | | | | | | | |
| | | Total Annualized Estimated Rent (3) | | Estimated Rent (1) for the Quarter Ending |
| Assets | |
C/U (2)
| | | June 30, 2019 | | September 30, 2019 | | December 31, 2019 | | March 31, 2020 | | June 30, 2020 | | September 30, 2020 |
| | | | | | | | | | | | | | | | | |
| Commercial | | | | | | | | | | | | | | | | |
| Operating | | C | | $ | 27,594 |
| | $ | 2,044 |
| | $ | 2,973 |
| | $ | 3,949 |
| | $ | 5,864 |
| | $ | 6,209 |
| | $ | 6,898 |
|
| Operating | | U | | 1,306 |
| | 171 |
| | 179 |
| | 224 |
| | 327 |
| | 327 |
| | 327 |
|
Under construction (4) | | C | | 30,403 |
| | — |
| | 314 |
| | 3,056 |
| | 4,211 |
| | 4,211 |
| | 4,211 |
|
| Under construction | | U | | 12,624 |
| | — |
| | 1,069 |
| | 1,389 |
| | 2,244 |
| | 2,679 |
| | 2,679 |
|
| Total | | | | $ | 71,927 |
| | $ | 2,215 |
| | $ | 4,535 |
| | $ | 8,618 |
| | $ | 12,646 |
| | $ | 13,426 |
| | $ | 14,115 |
|
| | | | | | | | | | | | | | | | | |
| Multifamily | | | | | | | | | | | | | | | | |
| Operating | | C | | $ | 95 |
| | $ | 24 |
| | $ | 24 |
| | $ | 24 |
| | $ | 24 |
| | $ | 24 |
| | $ | 24 |
|
| Under construction | | C | | 3,130 |
| | 48 |
| | 202 |
| | 292 |
| | 637 |
| | 783 |
| | 783 |
|
| Under construction | | U | | 499 |
| | — |
| | — |
| | — |
| | — |
| | 24 |
| | 36 |
|
| Total | | | | $ | 3,724 |
| | $ | 72 |
| | $ | 226 |
| | $ | 316 |
| | $ | 661 |
| | $ | 831 |
| | $ | 843 |
|
| | | | | | | | | | | | | | | | | |
| Total | | | | $ | 75,651 |
| | $ | 2,287 |
| | $ | 4,761 |
| | $ | 8,934 |
| | $ | 13,307 |
| | $ | 14,257 |
| | $ | 14,958 |
|
____________________
Note: Includes only leases for office and retail spaces that were vacant as of March 31, 2019.
| |
| (1) | Represents contractual monthly base rent before free rent, plus estimated tenant reimbursements for the month in which the lease is estimated to commence, multiplied by the applicable number of months for each quarter based on the lease’s estimated commencement date. Triple net leases are converted to a gross basis by adding estimated tenant reimbursements to monthly base rent. |
| |
| (2) | “C” denotes a consolidated interest. “U” denotes an unconsolidated interest. |
| |
| (3) | Represents contractual monthly base rent before free rent, plus estimated tenant reimbursements for the month in which the lease is expected to commence, multiplied by 12. Triple net leases are converted to a gross basis by adding estimated tenant reimbursements to monthly base rent. |
| |
| (4) | Commercial under construction consolidated includes annualized estimated rent of $4.8 million from JBG SMITH's lease at 4747 Bethesda Avenue, estimated to commence in Q4 2019. |
|
| |
| TENANT CONCENTRATION | MARCH 31, 2019 (Unaudited)
|
|
| | | | | | | | | | | | | | | | | | |
| dollars in thousands | | | | At JBG SMITH Share |
| | Tenant | | Number of Leases | |
Square Feet | | % of Total Square Feet | | Annualized Rent | | % of Total Annualized Rent |
| 1 |
| U.S. Government (GSA) | | 64 |
| | 2,422,091 |
| | 25.9 | % | | $ | 96,162 |
| | 23.3 | % |
| 2 |
| Gartner, Inc | | 1 |
| | 348,847 |
| | 3.7 | % | | 22,169 |
| | 5.4 | % |
| 3 |
| Family Health International | | 3 |
| | 295,977 |
| | 3.2 | % | | 15,287 |
| | 3.7 | % |
| 4 |
| Lockheed Martin Corporation | | 3 |
| | 274,361 |
| | 2.9 | % | | 13,195 |
| | 3.2 | % |
| 5 |
| WeWork (1) | | 2 |
| | 205,565 |
| | 2.2 | % | | 11,053 |
| | 2.7 | % |
| 6 |
| Arlington County | | 3 |
| | 237,001 |
| | 2.5 | % | | 9,907 |
| | 2.4 | % |
| 7 |
| Accenture LLP | | 2 |
| | 130,716 |
| | 1.4 | % | | 7,450 |
| | 1.8 | % |
| 8 |
| Greenberg Traurig LLP | | 1 |
| | 101,602 |
| | 1.1 | % | | 7,056 |
| | 1.7 | % |
| 9 |
| Public Broadcasting Service | | 1 |
| | 140,885 |
| | 1.5 | % | | 5,968 |
| | 1.4 | % |
| 10 |
| Chemonics International | | 2 |
| | 111,520 |
| | 1.2 | % | | 4,421 |
| | 1.1 | % |
| 11 |
| Evolent Health LLC | | 1 |
| | 90,905 |
| | 1.0 | % | | 4,328 |
| | 1.1 | % |
| 12 |
| U.S. Green Building Council | | 1 |
| | 54,675 |
| | 0.6 | % | | 4,026 |
| | 1.0 | % |
| 13 |
| Conservation International Foundation | | 1 |
| | 86,981 |
| | 0.9 | % | | 3,983 |
| | 1.0 | % |
| 14 |
| Booz Allen Hamilton Inc | | 2 |
| | 94,794 |
| | 1.0 | % | | 3,860 |
| | 0.9 | % |
| 15 |
| The International Justice Mission | | 1 |
| | 74,481 |
| | 0.8 | % | | 3,802 |
| | 0.9 | % |
| 16 |
| Cushman & Wakefield U.S. Inc | | 1 |
| | 58,641 |
| | 0.6 | % | | 3,784 |
| | 0.9 | % |
| 17 |
| DRS Tech Inc dba Finmeccanica | | 2 |
| | 82,852 |
| | 0.9 | % | | 3,762 |
| | 0.9 | % |
| 18 |
| American Diabetes Association | | 1 |
| | 80,998 |
| | 0.9 | % | | 3,355 |
| | 0.8 | % |
| 19 |
| Willis Towers Watson US LLC | | 1 |
| | 61,653 |
| | 0.7 | % | | 2,923 |
| | 0.7 | % |
| 20 |
| National Consumer Cooperative | | 2 |
| | 86,814 |
| | 0.9 | % | | 2,892 |
| | 0.7 | % |
| | Other | | 862 |
| | 4,322,195 |
| | 46.1 | % | | 182,689 |
| | 44.4 | % |
| | Total | | 957 |
| | 9,363,554 |
| | 100.0 | % | | $ | 412,072 |
| | 100.0 | % |
_______________
Note: Includes all in-place leases as of March 31, 2019 for office and retail space within JBG SMITH's operating portfolio. As signed but not yet commenced leases commence and tenants take occupancy, our tenant concentration will change.
(1) Excludes the WeLive lease at 2221 S. Clark Street.
|
| |
| INDUSTRY DIVERSITY | MARCH 31, 2019 (Unaudited)
|
|
| | | | | | | | | | | | | | | | | | |
| dollars in thousands | | | | At JBG SMITH Share |
| | Industry | | Number of Leases | |
Square Feet | | % of Total Square Feet | | Annualized Rent | | % of Total Annualized Rent |
| 1 |
| Government | | 80 |
| | 2,723,876 |
| | 29.1 | % | | $ | 109,086 |
| | 26.5 | % |
| 2 |
| Government Contractors | | 102 |
| | 1,680,646 |
| | 17.9 | % | | 75,943 |
| | 18.4 | % |
| 3 |
| Business Services | | 134 |
| | 1,248,285 |
| | 13.3 | % | | 61,755 |
| | 15.0 | % |
| 4 |
| Member Organizations | | 78 |
| | 922,213 |
| | 9.8 | % | | 43,786 |
| | 10.6 | % |
| 5 |
| Real Estate | | 46 |
| | 446,241 |
| | 4.8 | % | | 21,935 |
| | 5.3 | % |
| 6 |
| Legal Services | | 38 |
| | 267,775 |
| | 2.9 | % | | 14,635 |
| | 3.6 | % |
| 7 |
| Food and Beverage | | 117 |
| | 258,635 |
| | 2.8 | % | | 14,053 |
| | 3.4 | % |
| 8 |
| Health Services | | 47 |
| | 351,791 |
| | 3.8 | % | | 13,912 |
| | 3.4 | % |
| 9 |
| Communications | | 14 |
| | 201,793 |
| | 2.2 | % | | 8,487 |
| | 2.1 | % |
| 10 |
| Educational Services | | 19 |
| | 152,801 |
| | 1.6 | % | | 6,687 |
| | 1.6 | % |
| | Other | | 282 |
| | 1,109,498 |
| | 11.8 | % | | 41,793 |
| | 10.1 | % |
| | Total | | 957 |
| | 9,363,554 |
| | 100.0 | % | | $ | 412,072 |
| | 100.0 | % |
_______________
Note: Includes all in-place leases as of March 31, 2019 for office and retail space within JBG SMITH's operating portfolio.
|
| |
| PORTFOLIO SUMMARY | MARCH 31, 2019 (Unaudited)
|
|
| | | | | | | | | | | | |
| | | Number
of Assets | | Rentable
Square Feet | | Number of
Units (1) | | Estimated
Potential Development
Density (2) |
| | | | | | | | | |
| Wholly Owned | | | | | | | | |
| Operating | | 45 |
| | 13,859,350 |
| | 4,207 |
| | — |
|
| Under construction | | 5 |
| | 1,285,516 |
| | 721 |
| | — |
|
| Future development | | 24 |
| | — |
| | — |
| | 17,913,500 |
|
| Total | | 74 |
| | 15,144,866 |
| | 4,928 |
| | 17,913,500 |
|
| | | | | | | | | |
| Real Estate Ventures | | | | | | | | |
| Operating | | 16 |
| | 4,243,297 |
| | 2,108 |
| | — |
|
| Under construction | | 4 |
| | 1,181,735 |
| | 755 |
| | — |
|
| Future development | | 16 |
| | — |
| | — |
| | 4,217,500 |
|
| Total | | 36 |
| | 5,425,032 |
| | 2,863 |
| | 4,217,500 |
|
| | | | | | | | | |
| Total Portfolio | | 110 |
| | 20,569,898 |
| | 7,791 |
| | 22,131,000 |
|
| | | | | | | | | |
| Total Portfolio (at JBG SMITH Share) | | 110 |
| | 16,846,773 |
| | 5,829 |
| | 18,688,300 |
|
____________________
Note: At 100% share, unless otherwise indicated.
| |
| (1) | For assets under construction, represents estimated number of units based on current design plans. |
| |
| (2) | Includes estimated potential office, multifamily and retail development density. |
|
| |
| PROPERTY TABLE - COMMERCIAL | MARCH 31, 2019 (Unaudited)
|
|
| | | | | | | | | | | | | | | | | | | | | | | | | | | |
| Commercial Assets | Submarket | %
Ownership |
C/U (1)
| Same Store (2):
Q1 2018-2019 / YTD 2018-2019 | Year Built /
Renovated | Total Square Feet | Office Square Feet | Retail Square Feet | %
Leased | Office % Occupied | Retail % Occupied | Annualized Rent (in thousands) | Office Annualized Rent Per Square Foot (3) | Retail Annualized Rent Per Square Foot (4) |
|
|
|
|
|
|
|
|
|
|
|
|
|
|
|
| DC |
|
|
|
|
|
|
|
|
|
|
|
|
|
|
| Universal Buildings | Uptown | 100.0 | % | C | Y / Y | 1956 / 1990 | 659,896 |
| 568,821 |
| 91,075 |
| 98.2 | % | 97.1 | % | 99.6 | % | $ | 32,610 |
| $ | 50.07 |
| $ | 54.72 |
|
| 2101 L Street | CBD | 100.0 | % | C | Y / Y | 1975 / 2007 | 378,869 |
| 347,549 |
| 31,320 |
| 94.6 | % | 87.3 | % | 92.6 | % | 20,567 |
| 62.32 |
| 56.90 |
|
1730 M Street (5) | CBD | 100.0 | % | C | Y / Y | 1964 / 1998 | 204,741 |
| 196,723 |
| 8,018 |
| 87.8 | % | 87.0 | % | 100.0 | % | 8,539 |
| 47.55 |
| 49.50 |
|
| 1600 K Street | CBD | 100.0 | % | C | Y / Y | 1950 / 2000 | 82,299 |
| 69,908 |
| 12,391 |
| 100.0 | % | 100.0 | % | 100.0 | % | 4,265 |
| 49.06 |
| 67.39 |
|
| 1700 M Street | CBD | 100.0 | % | C | N / N | N/A | 34,000 |
| — |
| — |
| — |
| — |
| — |
| — |
| — |
| — |
|
L’Enfant Plaza Office-East (5) | Southwest | 49.0 | % | U | Y / Y | 1972 / 2012 | 397,296 |
| 397,296 |
| — |
| 89.5 | % | 89.5 | % | — |
| 17,582 |
| 49.46 |
| — |
|
| L’Enfant Plaza Office-North | Southwest | 49.0 | % | U | Y / Y | 1969 / 2014 | 299,476 |
| 280,002 |
| 19,474 |
| 95.7 | % | 85.4 | % | 85.9 | % | 11,613 |
| 47.42 |
| 16.38 |
|
L’Enfant Plaza Retail (5) | Southwest | 49.0 | % | U | Y / Y | 1968 / 2014 | 119,361 |
| 16,596 |
| 102,765 |
| 76.3 | % | 100.0 | % | 72.5 | % | 4,641 |
| 36.50 |
| 54.19 |
|
| The Foundry | Georgetown | 9.9 | % | U | Y / Y | 1973 / 2017 | 221,204 |
| 214,350 |
| 6,854 |
| 84.0 | % | 83.5 | % | 100.0 | % | 8,780 |
| 47.47 |
| 41.24 |
|
| 1101 17th Street | CBD | 55.0 | % | U | Y / Y | 1964 / 1999 | 211,193 |
| 201,435 |
| 9,758 |
| 90.6 | % | 80.9 | % | 82.7 | % | 8,861 |
| 50.93 |
| 69.29 |
|
|
|
|
|
|
|
|
|
|
|
|
|
|
|
|
| VA |
|
|
|
|
|
|
|
|
|
|
|
|
|
|
Courthouse Plaza 1 and 2 (5) | Clarendon/Courthouse | 100.0 | % | C | Y / Y | 1989 / 2013 | 633,256 |
| 576,063 |
| 57,193 |
| 83.8 | % | 82.2 | % | 99.6 | % | $ | 22,814 |
| $ | 43.97 |
| $ | 35.02 |
|
Central Place Tower (5) (6) | Rosslyn | 100.0 | % | C | N / N | 2018 / N/A | 552,540 |
| 524,537 |
| 28,003 |
| 92.4 | % | 92.0 | % | 100.0 | % | 31,342 |
| 62.90 |
| 35.17 |
|
| 2121 Crystal Drive | National Landing | 100.0 | % | C | Y / Y | 1985 / 2006 | 505,754 |
| 505,349 |
| 405 |
| 94.2 | % | 94.3 | % | — |
| 22,809 |
| 47.88 |
| — |
|
| 2345 Crystal Drive | National Landing | 100.0 | % | C | Y / Y | 1988 / N/A | 502,526 |
| 498,320 |
| 4,206 |
| 77.7 | % | 77.5 | % | 100.0 | % | 17,754 |
| 45.63 |
| 30.24 |
|
| 2231 Crystal Drive | National Landing | 100.0 | % | C | Y / Y | 1987 / 2009 | 467,043 |
| 416,083 |
| 50,960 |
| 88.7 | % | 86.1 | % | 100.0 | % | 17,605 |
| 43.96 |
| 36.57 |
|
1550 Crystal Drive (7) | National Landing | 100.0 | % | C | Y / Y | 1980 / 2001 | 451,673 |
| 451,673 |
| — |
| 96.0 | % | 87.7 | % | — |
| 15,726 |
| 39.69 |
| — |
|
RTC-West (7) | Reston | 100.0 | % | C | Y / Y | 1988 / 2014 | 431,021 |
| 431,021 |
| — |
| 92.3 | % | 90.3 | % | — |
| 14,362 |
| 36.91 |
| — |
|
| RTC-West Retail | Reston | 100.0 | % | C | N / N | 2017 / N/A | 40,025 |
| — |
| 40,025 |
| 91.9 | % | — |
| 91.9 | % | 2,362 |
| — |
| 64.20 |
|
| 2011 Crystal Drive | National Landing | 100.0 | % | C | Y / Y | 1984 / 2006 | 440,046 |
| 433,284 |
| 6,762 |
| 90.9 | % | 90.8 | % | 49.7 | % | 16,852 |
| 42.36 |
| 56.74 |
|
| 2451 Crystal Drive | National Landing | 100.0 | % | C | Y / Y | 1990 / N/A | 398,329 |
| 386,639 |
| 11,690 |
| 70.7 | % | 69.8 | % | 100.0 | % | 11,948 |
| 42.72 |
| 35.59 |
|
| 1235 S. Clark Street | National Landing | 100.0 | % | C | Y / Y | 1981 / 2007 | 384,187 |
| 335,841 |
| 48,346 |
| 88.9 | % | 81.5 | % | 100.0 | % | 12,382 |
| 41.71 |
| 20.05 |
|
| 241 18th Street S. | National Landing | 100.0 | % | C | Y / Y | 1977 / 2013 | 359,509 |
| 333,019 |
| 26,490 |
| 90.1 | % | 62.1 | % | 91.5 | % | 8,494 |
| 38.06 |
| 25.58 |
|
| 251 18th Street S. | National Landing | 100.0 | % | C | Y / Y | 1975 / 2013 | 342,155 |
| 292,984 |
| 49,171 |
| 99.2 | % | 100.0 | % | 94.7 | % | 13,869 |
| 41.91 |
| 34.13 |
|
| 1215 S. Clark Street | National Landing | 100.0 | % | C | Y / Y | 1983 / 2002 | 336,159 |
| 333,546 |
| 2,613 |
| 100.0 | % | 100.0 | % | 100.0 | % | 10,862 |
| 32.31 |
| 32.80 |
|
| 201 12th Street S. | National Landing | 100.0 | % | C | Y / Y | 1987 / N/A | 329,813 |
| 318,688 |
| 11,125 |
| 91.4 | % | 91.1 | % | 100.0 | % | 10,828 |
| 35.73 |
| 40.79 |
|
| 800 North Glebe Road | Ballston | 100.0 | % | C | Y / Y | 2012 / N/A | 303,644 |
| 277,397 |
| 26,247 |
| 100.0 | % | 100.0 | % | 100.0 | % | 15,451 |
| 51.11 |
| 48.51 |
|
| 2200 Crystal Drive | National Landing | 100.0 | % | C | Y / Y | 1968 / 2006 | 282,920 |
| 282,920 |
| — |
| 71.5 | % | 45.6 | % | — |
| 5,803 |
| 44.94 |
| — |
|
| 1901 South Bell Street | National Landing | 100.0 | % | C | Y / Y | 1968 / 2008 | 276,987 |
| 275,063 |
| 1,924 |
| 100.0 | % | 100.0 | % | 100.0 | % | 10,621 |
| 38.58 |
| 4.48 |
|
| 1225 S. Clark Street | National Landing | 100.0 | % | C | Y / Y | 1982 / 2013 | 276,952 |
| 264,102 |
| 12,850 |
| 92.4 | % | 47.1 | % | 100.0 | % | 4,929 |
| 37.68 |
| 19.11 |
|
|
| |
| PROPERTY TABLE - COMMERCIAL | MARCH 31, 2019 (Unaudited)
|
|
| | | | | | | | | | | | | | | | | | | | | | | | | | | |
| Commercial Assets | Submarket | %
Ownership |
C/U (1)
| Same Store (2):
Q1 2018-2019 / YTD 2018-2019 | Year Built /
Renovated | Total Square Feet | Office Square Feet | Retail Square Feet | %
Leased | Office % Occupied | Retail % Occupied | Annualized Rent (in thousands) | Office Annualized Rent Per Square Foot (3) | Retail Annualized Rent Per Square Foot (4) |
| Crystal City Marriott (345 Rooms) | National Landing | 100.0 | % | C | Y / Y | 1968 / 2013 | 266,000 |
| — |
| — |
| — |
| — |
| — |
| $ | — |
| $ | — |
| $ | — |
|
| 2100 Crystal Drive | National Landing | 100.0 | % | C | Y / Y | 1968 / 2006 | 249,281 |
| 249,281 |
| — |
| 98.8 | % | 98.8 | % | — |
| 10,345 |
| 42.02 |
| — |
|
| 200 12th Street S. | National Landing | 100.0 | % | C | Y / Y | 1985 / 2013 | 202,736 |
| 202,736 |
| — |
| 86.7 | % | 86.7 | % | — |
| 7,779 |
| 44.26 |
| — |
|
| 2001 Jefferson Davis Highway | National Landing | 100.0 | % | C | Y / Y | 1967 / N/A | 159,838 |
| 159,838 |
| — |
| 65.7 | % | 65.7 | % | — |
| 3,503 |
| 33.34 |
| — |
|
1800 South Bell Street (7) | National Landing | 100.0 | % | C | N / N | 1969 / 2007 | 69,621 |
| 45,142 |
| 24,479 |
| 100.0 | % | 100.0 | % | 100.0 | % | 2,425 |
| 48.66 |
| 9.33 |
|
| Crystal City Shops at 2100 | National Landing | 100.0 | % | C | Y / Y | 1968 / 2006 | 59,574 |
| — |
| 59,574 |
| 86.3 | % | — |
| 86.3 | % | 785 |
| — |
| 15.28 |
|
| Crystal Drive Retail | National Landing | 100.0 | % | C | Y / Y | 2003 / N/A | 56,965 |
| — |
| 56,965 |
| 97.3 | % | — |
| 97.3 | % | 3,046 |
| — |
| 54.98 |
|
| Vienna Retail* | Vienna | 100.0 | % | C | Y / Y | 1981 / N/A | 8,584 |
| — |
| 8,584 |
| 100.0 | % | — |
| 100.0 | % | 468 |
| — |
| 54.58 |
|
| Stonebridge at Potomac Town Center* | Prince William County | 10.0 | % | U | Y / Y | 2012 / N/A | 503,613 |
| — |
| 503,613 |
| 94.4 | % | — |
| 94.4 | % | 15,768 |
| — |
| 33.18 |
|
| Pickett Industrial Park | Eisenhower Avenue | 10.0 | % | U | Y / Y | 1973 / N/A | 246,145 |
| 246,145 |
| — |
| 100.0 | % | 100.0 | % | — |
| 3,948 |
| 16.04 |
| — |
|
| Rosslyn Gateway-North | Rosslyn | 18.0 | % | U | Y / Y | 1996 / 2014 | 144,024 |
| 131,270 |
| 12,754 |
| 83.8 | % | 79.1 | % | 96.0 | % | 4,667 |
| 41.46 |
| 29.60 |
|
| Rosslyn Gateway-South | Rosslyn | 18.0 | % | U | Y / Y | 1961 / N/A | 102,064 |
| 94,480 |
| 7,584 |
| 86.2 | % | 88.4 | % | 40.4 | % | 2,336 |
| 26.31 |
| 45.10 |
|
|
|
|
|
|
|
|
|
|
|
|
|
|
|
|
|
|
|
|
|
|
|
|
|
|
| MD |
|
|
|
|
|
|
|
|
|
|
|
|
|
|
| 7200 Wisconsin Avenue | Bethesda CBD | 100.0 | % | C | Y / Y | 1986 / 2015 | 267,826 |
| 250,874 |
| 16,952 |
| 79.0 | % | 77.6 | % | 100.0 | % | $ | 10,133 |
| $ | 47.02 |
| $ | 57.57 |
|
One Democracy Plaza* (5) | Bethesda‑Rock Spring | 100.0 | % | C | Y / Y | 1987 / 2013 | 212,894 |
| 210,756 |
| 2,138 |
| 96.9 | % | 96.9 | % | 100.0 | % | 6,626 |
| 32.13 |
| 29.60 |
|
| 4749 Bethesda Avenue Retail | Bethesda CBD | 100.0 | % | C | Y / Y | 2016 / N/A | 7,999 |
| — |
| 7,999 |
| 47.9 | % | — |
| 47.9 | % | 1,011 |
| — |
| 264.00 |
|
| 11333 Woodglen Drive | Rockville Pike Corridor | 18.0 | % | U | Y / Y | 2004 / N/A | 62,650 |
| 54,077 |
| 8,573 |
| 97.6 | % | 97.2 | % | 100.0 | % | 2,303 |
| 36.67 |
| 43.82 |
|
|
|
|
|
|
|
|
|
|
|
|
|
|
|
|
|
|
|
|
|
|
|
|
|
|
| Operating - Total / Weighted Average |
|
|
|
| 12,542,688 |
| 10,873,808 |
| 1,368,880 |
| 90.3 | % | 85.9 | % | 93.1 | % | $ | 459,414 |
| $ | 43.92 |
| $ | 38.78 |
|
|
|
|
|
|
|
|
|
|
|
|
|
|
|
|
| Under Construction |
|
|
|
|
|
|
|
|
|
|
|
|
|
|
| DC |
|
|
|
|
|
|
|
|
|
|
|
|
|
|
|
|
|
|
|
1900 N Street (5) (8) | CBD | 55.0 | % | U |
|
| 271,433 |
| 258,931 |
| 12,502 |
| 65.2 | % |
|
|
|
|
|
500 L’Enfant Plaza (9) | Southwest | 49.0 | % | U |
|
| 215,185 |
| 215,185 |
| — |
| 74.3 | % |
|
|
|
|
|
| VA | | | | | | | | | | | | | | |
| 1770 Crystal Drive | National Landing | 100.0 | % | C | | | 271,572 |
| 258,299 |
| 13,273 |
| 97.8 | % | | | | | |
| Central District Retail | National Landing | 100.0 | % | C | | | 108,825 |
| — |
| 108,825 |
| 70.7 | % | | | | | |
|
| |
| PROPERTY TABLE - COMMERCIAL | MARCH 31, 2019 (Unaudited)
|
|
| | | | | | | | | | | | | | | | | | | | | | | | | | | |
| Commercial Assets | Submarket | %
Ownership |
C/U (1)
| Same Store (2):
Q1 2018-2019 / YTD 2018-2019 | Year Built /
Renovated | Total Square Feet | Office Square Feet | Retail Square Feet | %
Leased | Office % Occupied | Retail % Occupied | Annualized Rent (in thousands) | Office Annualized Rent Per Square Foot (3) | Retail Annualized Rent Per Square Foot (4) |
| MD |
|
|
|
|
|
|
|
|
|
|
|
|
|
|
|
|
|
|
|
4747 Bethesda Avenue (10) | Bethesda CBD | 100.0 | % | C |
|
| 291,414 |
| 285,251 |
| 6,163 |
| 83.3 | % |
|
|
|
|
|
| Under Construction - Total / Weighted Average |
|
|
|
| 1,158,429 |
| 1,017,666 |
| 140,763 |
| 79.6 | % |
|
|
|
|
|
|
|
|
|
|
|
|
|
|
|
|
|
|
|
|
|
|
|
|
|
|
|
|
| Total / Weighted Average |
|
|
|
| 13,701,117 |
| 11,891,474 |
| 1,509,643 |
| 89.4 | % |
|
|
|
|
|
|
|
|
|
|
|
|
|
|
|
|
|
|
|
|
|
|
|
|
| Totals at JBG SMITH Share |
|
|
|
|
|
|
|
|
|
|
|
|
|
|
| Operating assets |
|
|
|
|
| 10,904,102 |
| 9,785,096 |
| 819,006 |
| 90.2 | % | 85.6 | % | 94.1 | % | $ | 404,881 |
| $ | 44.57 |
| $ | 41.26 |
|
| Under construction assets |
|
|
|
|
| 926,530 |
| 791,392 |
| 135,137 |
| 82.1 | % |
|
|
|
|
|
|
|
|
|
|
|
|
|
|
|
|
|
|
|
| 1,068,602.0 |
|
|
|
|
|
| | | | | | | | | |
| Number of Assets and Total Square Feet Reconciliation | | |
| | | Number of Assets | | At 100% Share | | At JBG SMITH Share |
| Operating Assets | | | Square Feet | | Square Feet |
| Q4 2018 | | 46 |
| | 12,934,467 |
| | 11,294,489 |
|
| Placed into service | | — |
| | — |
| | — |
|
Dispositions (11) | | (1 | ) | | (388,562 | ) | | (388,562 | ) |
| Out-of-service adjustment | | — |
| | — |
| | — |
|
| Building re-measurements | | — |
| | (3,217 | ) | | (1,825 | ) |
| Q1 2019 | | 45 |
| | 12,542,688 |
| | 10,904,102 |
|
See footnotes on page 36.
|
| |
| PROPERTY TABLE - COMMERCIAL | MARCH 31, 2019 (Unaudited)
|
Footnotes
Note: At 100% share, unless otherwise noted. Excludes our 10% subordinated interest in three commercial buildings held through a real estate venture in which we have no economic interest.
* Not Metro-Served.
| |
| (1) | “C” denotes a consolidated interest. “U” denotes an unconsolidated interest. |
| |
| (2) | “Y” denotes an asset as same store and “N” denotes an asset as non-same store. |
| |
| (3) | Represents annualized office rent divided by occupied office square feet; annualized retail rent and retail square feet are excluded from this metric. Occupied office square footage may differ from leased office square footage because leased office square footage includes leases that have been signed but have not yet commenced. |
| |
| (4) | Represents annualized retail rent divided by occupied retail square feet. Occupied retail square footage may differ from leased retail square footage because leased retail square footage includes leases that have been signed but have not yet commenced. |
| |
| (5) | The following assets are subject to ground leases: |
|
| | |
| Commercial Asset | | Ground Lease Expiration Date |
| 1730 M Street | | 4/30/2061 |
| L'Enfant Plaza Office - East | | 11/23/2064 |
| L'Enfant Plaza Retail | | 11/23/2064 |
| Courthouse Plaza 1 and 2 | | 1/19/2062 |
| Central Place Tower* | | 6/2/2102 |
| One Democracy Plaza | | 11/17/2084 |
| 1900 N Street** | | 5/31/2106 |
* We have an option to purchase the ground lease at a fixed price.
** Only a portion of the asset is subject to a ground lease.
| |
| (6) | In Q1 2019, CEB Tower at Central Place was renamed Central Place Tower. |
| |
| (7) | The following assets contain space that is held for development or not otherwise available for lease. This out-of-service square footage is excluded from area, leased, and occupancy metrics. |
|
| | | | | |
| Commercial Asset | | In-Service | Not Available
for Lease |
| 1550 Crystal Drive | | 451,673 |
| 43,655 |
|
| RTC - West | | 431,021 |
| 17,988 |
|
| 1800 South Bell Street | | 69,621 |
| 150,321 |
|
| |
| (8) | Ownership percentage reflects expected dilution of JBG SMITH as contributions are funded during the construction of the asset. As of March 31, 2019, JBG SMITH's ownership interest was 63.7%. |
| |
| (9) | In Q1 2019, L'Enfant Plaza Office-Southeast was renamed to 500 L'Enfant Plaza. |
| |
| (10) | Includes JBG SMITH’s lease for approximately 84,400 square feet. |
| |
| (11) | In February 2019, we sold Commerce Executive. |
|
| |
| PROPERTY TABLE - MULTIFAMILY | MARCH 31, 2019 (Unaudited)
|
|
| | | | | | | | | | | | | | | | | | | | | | | | | | | | | |
| Multifamily Assets | Submarket | %
Ownership |
C/U (1)
| Same Store (2):
Q1 2018-2019 / YTD 2018-2019 | Year Built /
Renovated | Number of Units | Total Square Feet | Multifamily Square Feet | Retail Square Feet | % Leased | Multifamily
%
Occupied | Retail
%
Occupied | Annualized Rent (in thousands) |
Monthly Rent Per Unit (3) (4) |
Monthly Rent Per Square Foot (4) (5) |
| | | | | | | | | | | | | | | | |
| DC | | | | | | | | | | | | | | | |
| Fort Totten Square | Brookland/Fort Totten | 100.0 | % | C | Y / Y | 2015 / N/A | 345 |
| 384,956 |
| 254,292 |
| 130,664 |
| 97.6 | % | 93.0 | % | 100.0 | % | $ | 8,972 |
| $ | 1,759 |
| $ | 2.39 |
|
| WestEnd25 | West End | 100.0 | % | C | Y / Y | 2009 / N/A | 283 |
| 273,264 |
| 273,264 |
| — |
| 96.6 | % | 95.8 | % | — |
| 11,259 |
| 3,462 |
| 3.59 |
|
| North End Retail | U Street/Shaw | 100.0 | % | C | Y / Y | 2015 / N/A | — |
| 27,355 |
| — |
| 27,355 |
| 100.0 | % | N/A |
| 100.0 | % | 1,493 |
| N/A |
| N/A |
|
| The Gale Eckington | H Street/NoMa | 5.0 | % | U | Y / Y | 2013 / 2017 | 603 |
| 466,716 |
| 465,516 |
| 1,200 |
| 95.7 | % | 91.7 | % | 100.0 | % | 13,596 |
| 2,043 |
| 2.65 |
|
| Atlantic Plumbing | U Street/Shaw | 64.0 | % | U | Y / Y | 2015 / N/A | 310 |
| 245,527 |
| 221,788 |
| 23,739 |
| 98.3 | % | 95.5 | % | 100.0 | % | 10,120 |
| 2,533 |
| 3.54 |
|
| | | | | | | | | | | | | | | | |
| VA | | | | | | | | | | | | | | | |
| RiverHouse Apartments | National Landing | 100.0 | % | C | Y / Y | 1960 / 2013 | 1,670 |
| 1,321,966 |
| 1,319,304 |
| 2,662 |
| 97.7 | % | 95.3 | % | 100.0 | % | $ | 34,025 |
| $ | 1,777 |
| $ | 2.25 |
|
| The Bartlett | National Landing | 100.0 | % | C | Y / Y | 2016 / N/A | 699 |
| 619,372 |
| 577,295 |
| 42,077 |
| 96.3 | % | 93.8 | % | 100.0 | % | 22,340 |
| 2,658 |
| 3.22 |
|
| 220 20th Street | National Landing | 100.0 | % | C | Y / Y | 2009 / N/A | 265 |
| 271,476 |
| 269,913 |
| 1,563 |
| 97.9 | % | 97.4 | % | 100.0 | % | 8,089 |
| 2,596 |
| 2.55 |
|
| 2221 S. Clark Street | National Landing | 100.0 | % | C | Y / Y | 1964 / 2016 | 216 |
| 164,743 |
| 164,743 |
| — |
| 100.0 | % | 100.0 | % | — |
| 3,516 |
| N/A |
| N/A |
|
| Fairway Apartments* | Reston | 10.0 | % | U | Y / Y | 1969 / 2005 | 346 |
| 370,850 |
| 370,850 |
| — |
| 94.0 | % | 92.5 | % | — |
| 6,397 |
| 1,666 |
| 1.55 |
|
| | | | | | | | | | | | | | | | |
| MD | | | | | | | | | | | | | | | |
| Falkland Chase-South & West | Downtown Silver Spring | 100.0 | % | C | Y / Y | 1938 / 2011 | 268 |
| 222,797 |
| 222,797 |
| — |
| 97.7 | % | 95.9 | % | — |
| $ | 5,230 |
| $ | 1,696 |
| $ | 2.04 |
|
| Falkland Chase-North | Downtown Silver Spring | 100.0 | % | C | Y / Y | 1938 / 1986 | 170 |
| 112,229 |
| 112,229 |
| — |
| 98.2 | % | 97.1 | % | — |
| 2,924 |
| 1,477 |
| 2.24 |
|
| Galvan | Rockville Pike Corridor | 1.8 | % | U | Y / Y | 2015 / N/A | 356 |
| 390,641 |
| 295,033 |
| 95,608 |
| 95.9 | % | 92.7 | % | 96.8 | % | 10,629 |
| 1,784 |
| 2.15 |
|
The Alaire (6) | Rockville Pike Corridor | 18.0 | % | U | Y / Y | 2010 / N/A | 279 |
| 266,673 |
| 251,691 |
| 14,982 |
| 94.9 | % | 93.9 | % | 100.0 | % | 5,989 |
| 1,729 |
| 1.92 |
|
The Terano (6) (7) | Rockville Pike Corridor | 1.8 | % | U | Y / Y | 2015 / N/A | 214 |
| 195,864 |
| 183,496 |
| 12,368 |
| 95.8 | % | 94.4 | % | 76.2 | % | 4,494 |
| 1,739 |
| 2.03 |
|
| | | | | | | | | | | | | | | | |
| Total / Weighted Average | | | | | 6,024 |
| 5,334,429 |
| 4,982,211 |
| 352,218 |
| 96.8 | % | 94.6 | % | 98.3 | % | $ | 149,073 |
| $ | 2,048 |
| $ | 2.47 |
|
| | | | | | | | | | | | | | | | |
Recently Delivered | | | | | | | | | | | | | | |
| DC | | | | | | | | | | | | | | | |
| 1221 Van Street | Ballpark/Southeast | 100.0 | % | C | N / N | 2018 / N/A | 291 |
| 225,530 |
| 202,715 |
| 22,815 |
| 89.2 | % | 86.9 | % | 93.1 | % | $ | 8,432 |
| $ | 2,422 |
| $ | 3.48 |
|
| Operating - Total / Weighted Average | | | | | 6,315 |
| 5,559,959 |
| 5,184,926 |
| 375,033 |
| 96.5 | % | 94.3 | % | 98.0 | % | $ | 157,505 |
| $ | 2,065 |
| $ | 2.51 |
|
| | | | | | | | | | |
| | | | | |
| Under Construction | | | | | | | | | | | | | | | |
| DC | | | | | | | | | | | | | | | |
| West Half | Ballpark/Southeast | 100.0 | % | C | | | 465 |
| 388,174 |
| 346,415 |
| 41,759 |
| | | | | | |
965 Florida Avenue (8) | U Street/Shaw | 96.1 | % | C | | | 433 |
| 336,092 |
| 290,296 |
| 45,796 |
| | | | | | |
| Atlantic Plumbing C | U Street/Shaw | 100.0 | % | C | | | 256 |
| 225,531 |
| 206,057 |
| 19,474 |
| | | | | | |
|
| |
| PROPERTY TABLE - MULTIFAMILY | MARCH 31, 2019 (Unaudited)
|
|
| | | | | | | | | | | | | | | | | | | | | | | | | | | | | |
| Multifamily Assets | Submarket | %
Ownership |
C/U (1)
| Same Store (2):
Q1 2018-2019 / YTD 2018-2019 | Year Built /
Renovated | Number of Units | Total Square Feet | Multifamily Square Feet | Retail Square Feet | % Leased | Multifamily
%
Occupied | Retail
%
Occupied | Annualized Rent (in thousands) |
Monthly Rent Per Unit (3) (4) |
Monthly Rent Per Square Foot (4) (5) |
| | | | | | | | | | | | | | | | |
| MD | | | | | | | | | | | | | | | |
| 7900 Wisconsin Avenue | Bethesda CBD | 50.0 | % | U | | | 322 |
| 359,025 |
| 338,990 |
| 20,035 |
| | | | | | |
| | | | | | | | | | | | | | | | |
| Under Construction - Total | | | | | 1,476 |
| 1,308,822 |
| 1,181,758 |
| 127,064 |
| | | | | | |
| | | | | | | | | | | | | | | | |
| Total | | | | | 7,791 |
| 6,868,781 |
| 6,366,684 |
| 502,097 |
| | | | | | |
| | | | | | | | | | | | | | | | |
| | | | | | | | | | | | | | | | |
| | | | | | | | | | | | | | | | |
| Totals at JBG SMITH Share | | | | | | | | | | | | | | |
| In service assets | | | | | | 4,240 |
| 3,674,275 |
| 3,450,060 |
| 224,214 |
| 97.5 | % | 95.3 | % | 100.0 | % | $ | 106,995 |
| $ | 2,121 |
| $ | 2.60 |
|
| Recently delivered assets | | | | | | 291 |
| 225,530 |
| 202,715 |
| 22,815 |
| 89.2 | % | 86.9 | % | 93.1 | % | 8,432 |
| 2,422 |
| 3.48 |
|
| Operating assets | | | | | | 4,531 |
| 3,899,805 |
| 3,652,775 |
| 247,029 |
| 97.0 | % | 94.8 | % | 99.3 | % | 115,427 |
| 2,139 |
| 2.64 |
|
| Under construction assets | | | | | | 1,298 |
| 1,116,337 |
| 1,001,058 |
| 115,279 |
| | | | | | |
|
| | | | | | | | | |
| Number of Assets and Total Square Feet/Units Reconciliation | | |
| | | Number of Assets | | At 100% Share | | At JBG SMITH Share |
| Operating Assets | | | Square Feet/Units | | Square Feet/Units |
| Q4 2018 | | 16 |
| | 5,559,307 SF/ 6,315 Units |
| | 3,899,297 SF/
4,531 Units |
|
| Placed into service | | — |
| | — |
| | — |
|
| Out-of-service adjustment | | — |
| | — |
| | — |
|
| Building re-measurements | | — |
| | 652 SF |
| | 508 SF |
|
| Q1 2019 | | 16 |
| | 5,559,959 SF/ 6,315 Units |
| | 3,899,805 SF/ 4,531 Units |
|
|
| | | | | | | | | | | | | | | | | | | | | | | | | | | | |
| Leasing Activity - Multifamily |
| | Number of Assets | Number of Units | Monthly Rent Per Unit (3) | | Multifamily % Occupied | | Annualized Rent (in thousands) |
| | Q1 2019 | Q1 2018 | % Change | | Q1 2019 | Q1 2018 | % Change | | Q1 2019 | Q1 2018 | % Change |
| DC | 4 |
| 857 |
| $ | 2,520 |
| $ | 2,587 |
| (2.6 | )% | | 94.5 | % | 92.8 | % | 1.7 | % | | $ | 24,470 |
| $ | 24,688 |
| (0.9 | )% |
| VA | 4 |
| 2,669 |
| 2,087 |
| 2,087 |
| — |
| | 95.1 | % | 94.0 | % | 1.1 | % | | 63,560 |
| 62,820 |
| 1.2 | % |
| MD | 5 |
| 498 |
| 1,625 |
| 1,655 |
| (1.8 | )% | | 96.0 | % | 95.0 | % | 1.0 | % | | 9,336 |
| 9,258 |
| 0.8 | % |
| Total / Weighted Average | 13 |
| 4,024 |
| $ | 2,121 |
| $ | 2,139 |
| (0.8 | )% | | 95.1 | % | 93.7 | % | 1.4 | % | | $ | 97,366 |
| $ | 96,766 |
| 0.6 | % |
| Note: At JBG SMITH share. Includes assets placed in service prior to January 1, 2018. Excludes North End Retail and 2221 S. Clark Street (WeLive). |
See footnotes on page 39.
|
| |
| PROPERTY TABLE - MULTIFAMILY | MARCH 31, 2019 (Unaudited)
|
Footnotes
Note: At 100% share.
* Not Metro-Served.
| |
| (1) | “C” denotes a consolidated interest. “U” denotes an unconsolidated interest. |
| |
| (2) | “Y” denotes an asset as same store and “N” denotes an asset as non-same store. |
| |
| (3) | Represents multifamily rent divided by occupied multifamily units; retail rent is excluded from this metric. Occupied units may differ from leased units because leased units include leases that have been signed but have not yet commenced. |
| |
| (4) | Excludes North End Retail and 2221 S. Clark Street (WeLive). |
| |
| (5) | Represents multifamily rent divided by occupied multifamily square feet; retail rent and retail square feet are excluded from this metric. Occupied multifamily square footage may differ from leased multifamily square footage because leased multifamily square footage includes leases that have been signed but have not yet commenced. |
| |
| (6) | The following assets are subject to ground leases: |
|
| | |
| Multifamily Asset | | Ground Lease Expiration Date |
| The Alaire | | 3/27/2107 |
| The Terano | | 8/5/2112 |
| |
| (7) | The following asset contains space that is held for development or not otherwise available for lease. This out-of-service square footage is excluded from area, leased, and occupancy metrics. |
|
| | | | | |
| Multifamily Asset | | In-Service | Not Available
for Lease |
| The Terano | | 195,864 |
| 3,904 |
|
| |
| (8) | Ownership percentage reflects expected dilution of JBG SMITH's real estate venture partner as contributions are funded during the construction of the asset. As of March 31, 2019, JBG SMITH's ownership interest was 90.2%. |
|
| |
| PROPERTY TABLE - UNDER CONSTRUCTION | MARCH 31, 2019 (Unaudited)
|
|
| | | | | | | | | | | | | | | | | | | | | | | | | | |
| dollars in thousands, except per square foot data | %
Ownership | Estimated Square
Feet | % Pre-Leased |
Pre-Lease Rent Per Square Foot (1) | Estimated Number of Units | | Schedule (2) | | | At JBG SMITH Share |
| | | Construction Start Date | Estimated Completion Date | Estimated Stabilization Date | | Historical Cost (3) | Estimated Incremental Investment | Estimated Total Investment |
| Asset | Submarket | |
| | | | | | | | | | | | | | |
| Commercial | | | | | | | | | | | | | |
| DC | | | | | | | | | | | | | |
1900 N Street (4) | CBD | 55.0% | 271,433 |
| 65.2 | % | $ | 85.80 |
| — | Q2 2017 | Q2 2020 | Q4 2022 | | $ | 99,752 |
| $ | 24,137 |
| $ | 123,889 |
|
| 500 L'Enfant Plaza | Southwest | 49.0% | 215,185 |
| 74.3 | % | 54.58 |
| — | Q1 2017 | Q1 2019 | Q2 2021 | | 43,366 |
| 3,876 |
| 47,242 |
|
| VA | | | | | | | | | | | | | |
1770 Crystal Drive (5) | National Landing | 100.0% | 271,572 |
| 97.8 | % | 46.05 |
| — | Q4 2018 | Q2 2021 | Q2 2021 | | 44,467 |
| 75,475 |
| 119,942 |
|
Central District Retail (5) | National Landing | 100.0% | 108,825 |
| 70.7 | % | 47.35 |
| — | Q4 2018 | Q2 2021 | Q4 2021 | | 18,681 |
| 98,445 |
| 117,126 |
|
| MD | | | | | | | | | | | | | |
4747 Bethesda Avenue (6) | Bethesda CBD | 100.0% | 291,414 |
| 83.3 | % | 61.78 |
| — | Q2 2017 | Q4 2019 | Q2 2021 | | 111,203 |
| 49,417 |
| 160,620 |
|
| Total/weighted average | | | 1,158,429 |
| 79.6 | % | $ | 59.40 |
| — | Q4 2017 | Q3 2020 | Q3 2021 | | $ | 317,469 |
| $ | 251,350 |
| $ | 568,819 |
|
| | | | | | | | | | | | | | |
| Multifamily | | | | | | | | | | | | | |
| DC | | | | | | | | | | | | | |
| West Half | Ballpark/Southeast | 100.0% | 388,174 |
| — |
| — |
| 465 | Q1 2017 | Q1 2020 | Q1 2021 | | $ | 180,415 |
| $ | 47,954 |
| $ | 228,369 |
|
965 Florida Avenue (7) | U Street/Shaw | 96.1% | 336,092 |
| — |
| — |
| 433 | Q4 2017 | Q4 2020 | Q1 2022 | | 64,837 |
| 87,782 |
| 152,619 |
|
| Atlantic Plumbing C | U Street/Shaw | 100.0% | 225,531 |
| — |
| — |
| 256 | Q1 2017 | Q4 2019 | Q3 2020 | | 131,834 |
| 26,819 |
| 158,653 |
|
| MD | | | | | | | | | | | | | |
| 7900 Wisconsin Avenue | Bethesda CBD | 50.0% | 359,025 |
| — |
| — |
| 322 | Q2 2017 | Q3 2020 | Q4 2021 | | 51,382 |
| 43,033 |
| 94,415 |
|
| Total/weighted average | | 1,308,822 |
| — |
| — |
| 1,476 | Q2 2017 | Q2 2020 | Q2 2021 | | $ | 428,468 |
| $ | 205,588 |
| $ | 634,056 |
|
| | | | | | | | | | | | | | |
Under Construction - Total / Weighted Average (8) | 2,467,251 |
| 79.6 | % | $ | 59.40 |
| 1,476 | Q3 2017 | Q2 2020 | Q2 2021 | | $ | 745,937 |
| $ | 456,938 |
| $ | 1,202,875 |
|
Under Construction - Total / Weighted Average at JBG SMITH Share (8) | 2,042,866 |
| 82.1 | % | $ | 57.16 |
| 1,298 | | | | | | | |
| | | | | | | | | | | | | | |
| | | | | Commercial | Multifamily | Total | | | | | | | |
| Weighted average projected NOI yield at JBG SMITH share: | | | | | | | | | | | |
Estimated total project cost (9) | 6.5 | % | 6.4 | % | 6.4 | % | | | | | Consol | 385,892 |
| |
| Estimated total investment | 6.4 | % | 6.0 | % | 6.2 | % | | | | | Unconsol | 71,146 |
| |
| Estimated incremental investment | 14.4 | % | 18.5 | % | 16.2 | % | | | | | | | |
| Estimated Stabilized NOI at JBG SMITH Share (dollars in millions) | $ | 36.3 |
| $ | 37.9 |
| $ | 74.2 |
|
| | | | | | |
____________________
Note: At 100% share, unless otherwise noted.
| |
| (1) | Based on leases signed as of March 31, 2019 and calculated as contractual monthly base rent before free rent, plus estimated tenant reimbursements for the month in which the lease commences, multiplied by 12. Triple net leases are converted to a gross basis by adding estimated tenant reimbursements to contractual monthly base rent. |
| |
| (2) | Average dates are weighted by JBG SMITH share of estimated square feet. |
| |
| (3) | Historical cost excludes certain GAAP adjustments, such as capitalized payroll, interest and ground lease costs. See definition of historical cost on page 50. |
| |
| (4) | Ownership percentage reflects expected dilution of JBG SMITH as contributions are funded during the construction of the asset. As of March 31, 2019, JBG SMITH's ownership interest was 63.7%. |
| |
| (5) | Historical cost of 1770 Crystal Drive and Central District Retail includes $4.4 million and $4.3 million of prior design costs not related to the current planned development. |
| |
| (6) | Includes JBG SMITH’s lease for approximately 84,400 square feet. |
| |
| (7) | Ownership percentage reflects expected dilution of JBG SMITH's real estate venture partner as contributions are funded during the construction of the asset. As of March 31, 2019, JBG SMITH's ownership interest was 90.2%. |
| |
| (8) | Multifamily assets are excluded from the weighted average percent pre-leased and pre-lease rent per square foot metrics. |
| |
| (9) | Estimated total project cost is estimated total investment excluding purchase price allocation adjustments recognized as a result of the Formation Transaction. |
|
| |
| PROPERTY TABLE - FUTURE DEVELOPMENT | MARCH 31, 2019 (Unaudited)
(Unaudited)
|
|
| | | | | | | | | | | | | | | | | | | | | | | | | | | | | | | | | | | | | | | | | | |
| dollars in thousands, except per square foot data, at JBG SMITH share | | Estimated Commercial SF / Multifamily Units to be Replaced (1) | | | | | | Estimated Capitalized Cost of SF / Units to Be Replaced (4) | | Estimated Capitalized Cost of Ground Rent Payments (5) | | | | Estimated Total Investment per SF |
| | | Number of Assets | | | | | | | | | | | | | Estimated
Remaining Acquisition Cost (3) | | | | Estimated Total Investment | |
| | | | Estimated Potential Development Density (SF) | | | Historical Cost (2) | | | | | |
| Region | | | Total | | Office | | Multifamily | | Retail | | | | | | | |
| | | | | | | | | | | | | | | | | | | | | | | | | |
| Owned | | | | | | | | | | | | | | | | | | | | | | | | |
| DC | | | | | | | | | | | | | | | | | | | | | | | | |
| DC | | 8 |
| | 1,678,400 |
| | 312,100 |
| | 1,357,300 |
| | 9,000 |
| | — |
| | $ | 106,445 |
| | N/A | | $ | — |
| | $ | — |
| | $ | 106,445 |
| | $ | 63.42 |
|
| VA | | | | | | | | | | | | | | | | | | | | | | | | |
| National Landing | | 11 |
| | 6,910,400 |
| | 2,135,000 |
| | 4,655,700 |
| | 119,700 |
| | 229,459 SF |
| | 152,099 |
| | N/A | | 36,600 |
| | — |
| | 188,699 |
| | 27.31 |
|
| Reston | | 4 |
| | 2,589,200 |
| | 924,800 |
| | 1,462,400 |
| | 202,000 |
| | 15 units |
| | 72,702 |
| | N/A | | 2,760 |
| | — |
| | 75,462 |
| | 29.14 |
|
| Other VA | | 4 |
| | 220,600 |
| | 88,200 |
| | 121,300 |
| | 11,100 |
| | 21,544 SF |
| | 2,086 |
| | N/A | | 5,024 |
| | 2,480 |
| | 9,590 |
| | 43.47 |
|
| | | 19 |
| | 9,720,200 |
| | 3,148,000 |
| | 6,239,400 |
| | 332,800 |
| | 251,003 SF / 15 units |
| | 226,887 |
| | N/A | | 44,384 |
| | 2,480 |
| | 273,751 |
| | 28.16 |
|
| MD | | | | | | | | | | | | | | | | | | | | | | | | |
| Silver Spring | | 1 |
| | 1,276,300 |
| | — |
| | 1,156,300 |
| | 120,000 |
| | 170 units |
| | 15,060 |
| | N/A | | 35,133 |
| | — |
| | 50,193 |
| | 39.33 |
|
| Greater Rockville | | 4 |
| | 126,500 |
| | 19,200 |
| | 88,600 |
| | 18,700 |
| | — |
| | 3,256 |
| | N/A | | — |
| | 664 |
| | 3,920 |
| | 30.99 |
|
| | | 5 |
| | 1,402,800 |
| | 19,200 |
| | 1,244,900 |
| | 138,700 |
| | 170 units |
| | 18,316 |
| | N/A | | 35,133 |
| | 664 |
| | 54,113 |
| | 38.57 |
|
| Total / weighted average | | 32 |
| | 12,801,400 |
| | 3,479,300 |
| | 8,841,600 |
| | 480,500 |
| | 251,003 SF / 185 units |
| | $ | 351,648 |
| | N/A | | $ | 79,517 |
| | $ | 3,144 |
| | $ | 434,309 |
| | $ | 33.93 |
|
| | | | | | | | | | | | | | | | | | | | | | | | | |
Optioned (6) | | | | | | | | | | | | | | | | | | | | | | | | |
| DC | | | | | | | | | | | | | | | | | | | | | | | | |
| DC | | 3 |
| | 1,793,600 |
| | 78,800 |
| | 1,498,900 |
| | 215,900 |
| | — |
| | $ | 18,730 |
| | $ | 25,051 |
| | $ | — |
| | $ | 71,113 |
| | $ | 114,894 |
| | $ | 64.06 |
|
| VA | | | | | | | | | | | | | | | | | | | | | | | | |
| Other VA | | 1 |
| | 11,300 |
| | — |
| | 10,400 |
| | 900 |
| | — |
| | 87 |
| | 995 |
| | — |
| | — |
| | 1,082 |
| | 95.75 |
|
| Total / weighted average | | 4 |
| | 1,804,900 |
| | 78,800 |
| | 1,509,300 |
| | 216,800 |
| | — |
| | $ | 18,817 |
| | $ | 26,046 |
| | $ | — |
| | $ | 71,113 |
| | $ | 115,976 |
| | $ | 64.26 |
|
| | | | | | | | | | | | | | | | | | | | | | | | | |
| Held for Sale | | | | | | | | | | | | | | | | | | | | | | | | |
| VA | | | | | | | | | | | | | | | | | | | | | | | | |
National Landing (7) | | 4 |
| | 4,082,000 |
| | 4,082,000 |
| | — |
| | — |
| | — |
| | $ | 167,046 |
| | N/A | | $ | — |
| | $ | — |
| | $ | 167,046 |
| | $ | 40.92 |
|
| | | | | | | | | | | | | | | | | | | | | | | | | |
| Total / Weighted Average | | 40 |
| | 18,688,300 |
| | 7,640,100 |
| | 10,350,900 |
| | 697,300 |
| | 251,003 SF / 185 units |
| | $ | 537,511 |
| | $ | 26,046 |
| | $ | 79,517 |
| | $ | 74,257 |
| | $ | 717,331 |
| | $ | 38.38 |
|
____________________
| |
| (1) | Represents management's estimate of the total office and/or retail rentable square feet and multifamily units that would need to be redeveloped to access some of the estimated potential development density. |
| |
| (2) | Historical cost includes certain intangible assets, such as option and transferable density rights values; and excludes certain GAAP adjustments, such as capitalized payroll, interest and ground lease costs. See definition of historical cost on page 50. |
| |
| (3) | Represents management's estimate of remaining deposits, option payments, and option strike prices as of March 31, 2019. |
| |
| (4) | Capitalized value of estimated commercial square feet / multifamily units to be replaced, which generated approximately $1.2 million of NOI for the three months ended March 31, 2019 (included in the NOI of the applicable operating segment), at a 6.0% capitalization rate. The annualized NOI for 1800 South Bell Street is excluded from this calculation. |
| |
| (5) | Capitalized value of stabilized annual ground rent payments associated with leasehold assets at a 5.0% capitalization rate. Two owned parcels and one optioned parcel are leasehold interests with estimated annual stabilized ground rent payments totaling $3.7 million. |
| |
| (6) | March 31, 2019, the weighted average remaining term for the optioned future development assets is 5.4 years. |
| |
| (7) | Includes 4.1 million square feet of estimated potential development density that JBG SMITH has sold to Amazon pursuant to executed purchase and sale agreements. Subject to customary closing conditions, Amazon is expected to pay $293.9 million for the assets. |
|
| |
| DISPOSITION ACTIVITY | MARCH 31, 2019 (Unaudited)
|
Disposition Activity (1):
|
| | | | | | | | | | | | | | | |
| dollars in thousands, at JBG SMITH share | | | | | Total Square Feet/ Estimated Potential Development Density | Gross Sales Price | Net Cash Proceeds | Book Gain |
| Assets | Ownership Percentage | Asset Type | | Location | Date Disposed |
| |
| | | | | | | | | | |
| Q1 2019 | | | | | | | | | |
Commerce Executive / Commerce Metro Land (2) | 100.0% | Commercial / Future Development | | Reston, VA | February 4, 2019 | 388,562 / 894,000 | $ | 114,950 |
| $ | 117,676 |
| $ | 39,033 |
|
_______________
Note: For the three months ended March 31, 2019, the disposed asset generated $0.5 million of NOI.
| |
| (1) | As of March 31, 2019, Pen Place and Mets 6, 7 and 8 were classified as held for sale in our condensed consolidated balance sheet. In March 2019, we entered into agreements for the sale of Pen Place and Mets 6, 7 and 8, Future Development assets having an aggregate estimated potential development density of up to approximately 4.1 million square feet, with Amazon for its additional headquarters. |
| |
| (2) | Cash proceeds include the reimbursement of $4.0 million of tenant improvement costs and leasing commissions paid by us prior to the closing. |
|
| |
| DEBT SUMMARY | MARCH 31, 2019 (Unaudited)
|
|
| | | | | | | | | | | | | | | | | | | | | | | | | | | | | |
| dollars in thousands, at JBG SMITH share | | 2019 | | 2020 | | 2021 | | 2022 | | 2023 | | Thereafter | | Total |
| | | | | | | | | | | | | | | |
| Consolidated and Unconsolidated Principal Balance | | | | | | | | | | |
| | Unsecured Debt: | | | | | | | | | | | | | | |
| | Revolving credit facility ($1 billion commitment) | | $ | — |
| | $ | — |
| | $ | — |
| | $ | — |
| | $ | — |
| | $ | — |
| | $ | — |
|
| | Term loans ($400 million commitment) | | — |
| | — |
| | — |
| | — |
| | 100,000 |
| | 200,000 |
| | 300,000 |
|
| Total unsecured debt | | — |
| | — |
| | — |
| | — |
| | 100,000 |
| | 200,000 |
| | 300,000 |
|
| | Secured Debt: | | | | | | | | | | | | | | |
| | Consolidated principal balance | | 181,898 |
| | 97,141 |
| | 331,459 |
| | 327,500 |
| | 176,804 |
| | 726,784 |
| | 1,841,586 |
|
| | Unconsolidated principal balance | | 118,851 |
| | 43,336 |
| | — |
| | 74,253 |
| | 20,941 |
| | 46,770 |
| | 304,151 |
|
| Total secured debt | | 300,749 |
| | 140,477 |
| | 331,459 |
| | 401,753 |
| | 197,745 |
| | 773,554 |
| | 2,145,737 |
|
| | | | | | | | | | | | | | | |
Total Consolidated and Unconsolidated Principal Balance | | $ | 300,749 |
| | $ | 140,477 |
| | $ | 331,459 |
| | $ | 401,753 |
| | $ | 297,745 |
| | $ | 973,554 |
| | $ | 2,445,737 |
|
| | | | | | | | | | | | | | | | |
| | % of total debt maturing | | 12.3 | % | | 5.7 | % | | 13.6 | % | | 16.4 | % | | 12.2 | % | | 39.8 | % | | 100.0 | % |
| | % floating rate (1) | | 100.0 | % | | 21.8 | % | | 4.2 | % | | 54.8 | % | | — |
| | 21.4 | % | | 31.6 | % |
| | % fixed rate (2) | | — |
| | 78.2 | % | | 95.8 | % | | 45.2 | % | | 100.0 | % | | 78.6 | % | | 68.4 | % |
| | | | | | | | | | | | | | | | |
| Weighted Average Interest Rates | | | | | | | | | | | | | | |
| | Variable rate | | 4.99 | % | | 6.13 | % | | 3.76 | % | | 4.19 | % | | — |
| | 4.05 | % | | 4.53 | % |
| | Fixed rate | | — |
| | 3.32 | % | | 4.11 | % | | 4.12 | % | | 4.49 | % | | 4.19 | % | | 4.16 | % |
| Total Weighted Average Interest Rates | | 4.99 | % | | 3.93 | % | | 4.09 | % | | 4.16 | % | | 4.49 | % | | 4.16 | % | | 4.28 | % |
| | | | | | | | | | | | | | | | |
| | | | Credit Facility | | | | | | |
| | | | Revolving Credit
Facility | | Tranche A-1 Term Loan | | Tranche A-2 Term Loan | | Total/Weighted Average | | | | | | 2,141,586 |
|
| Credit limit | | $ | 1,000,000 |
| | $ | 200,000 |
| | $ | 200,000 |
| | $ | 1,400,000 |
| | | | | | 2.12 | % |
| Outstanding principal balance | | $ | — |
| | $ | 100,000 |
| | $ | 200,000 |
| | $ | 300,000 |
| | | | | | |
| Letters of credit | | $ | 5,794 |
| | $ | — |
| | $ | — |
| | $ | 5,794 |
| | | | | | |
| Undrawn capacity | | $ | 994,206 |
| | $ | 100,000 |
| | $ | — |
| | $ | 1,094,206 |
| | | | | | |
Interest rate spread (3) | | 1.10 | % | | 1.20 | % | | 1.55 | % | | 1.43 | % | | | | | | |
All-In interest rate (4) | | 3.59 | % | | 3.32 | % | | 4.04 | % | | 3.80 | % | | | | | | |
| Initial maturity date | | Jul-21 |
| | Jan-23 |
| | Jul-24 |
| | — |
| | | | | | |
| Delayed draw availability period | — |
| | Jul-19 |
| | — |
| | — |
| | | | | | |
____________________
| |
| (1) | Floating rate debt includes floating rate loans with interest rate caps. |
| |
| (2) | Fixed rate debt includes floating rate loans with interest rate swaps. |
| |
| (3) | The interest rate for the revolving credit facility excludes a 0.15% facility fee. |
| |
| (4) | The all-in interest rate is inclusive of interest rate swaps. As of March 31, 2019, only the $100 million outstanding balance on the Tranche A-1 Term Loan had been swapped. |
|
| |
| DEBT BY INSTRUMENT | MARCH 31, 2019 (Unaudited)
|
|
| | | | | | | | | | | | | |
dollars in thousands
Asset |
% Ownership |
Principal Balance | Stated Interest Rate | Interest Rate Hedge | Current Annual Interest Rate (1) | Initial Maturity Date | Extended Maturity Date (2) |
| | | | | | | | |
| Consolidated | | | | | | | |
| Courthouse Plaza 1 and 2 | 100.0 | % | — |
| L + 1.60% | — | 4.09 | % | 05/10/19 | 05/10/20 |
| RTC - West | 100.0 | % | 97,141 |
| L + 1.50% | Swap | 3.33 | % | 04/12/20 | 04/12/21 |
| WestEnd25 | 100.0 | % | 97,459 |
| 4.88% | Fixed | 4.88 | % | 06/01/21 | 06/01/21 |
| Universal Buildings | 100.0 | % | 181,898 |
| L + 1.90% | Cap | 4.39 | % | 08/12/19 | 08/12/21 |
The Bartlett (3) | 100.0 | % | 220,000 |
| L + 1.70% | — | 4.19 | % | 06/20/22 | 06/20/22 |
| Credit Facility - Revolving Credit Facility | 100.0 | % | — |
| L + 1.10% | — | 3.59 | % | 07/16/21 | 07/16/22 |
| Credit Facility -Tranche A-1 Term Loan | 100.0 | % | 100,000 |
| L + 1.20% | Swap | 3.32 | % | 01/18/23 | 01/18/23 |
| 2121 Crystal Drive | 100.0 | % | 136,050 |
| 5.51% | Fixed | 5.51 | % | 03/01/23 | 03/01/23 |
| Falkland Chase - South & West | 100.0 | % | 40,754 |
| 3.78% | Fixed | 3.78 | % | 06/01/23 | 06/01/23 |
Central Place Tower (4) | 100.0 | % | 234,000 |
| L + 1.65% | Swap | 3.76 | % | 11/07/21 | 11/07/23 |
| 800 North Glebe Road | 100.0 | % | 107,500 |
| L + 1.60% | Swap | 3.60 | % | 06/30/22 | 06/30/24 |
Credit Facility - Tranche A-2 Term Loan (5) | 100.0 | % | 200,000 |
| L + 1.55% | Swap | 4.39 | % | 07/18/24 | 07/18/24 |
| 2101 L Street | 100.0 | % | 136,655 |
| 3.97% | Fixed | 3.97 | % | 08/15/24 | 08/15/24 |
| 201 12th Street S., 200 12th Street S., and 251 18th Street S. | 100.0 | % | 83,319 |
| 7.94% | Fixed | 7.94 | % | 01/01/25 | 01/01/25 |
| RiverHouse Apartments | 100.0 | % | 307,710 |
| L + 1.28% | Swap | 3.47 | % | 04/01/25 | 04/01/25 |
Fort Totten Square (3) | 100.0 | % | 73,600 |
| L + 1.35% | Swap | 3.77 | % | 05/18/25 | 05/18/25 |
| 1730 M Street | 100.0 | % | 47,500 |
| L + 1.25% | Swap | 3.92 | % | 12/21/25 | 12/21/25 |
| 1235 S. Clark Street | 100.0 | % | 78,000 |
| 3.94% | Fixed | 3.94 | % | 11/01/27 | 11/01/27 |
| Total Consolidated Principal Balance | | 2,141,586 |
| | | | | |
| Premium / (discount) recognized as a result of the Formation Transaction | 1,214 |
| |
|
|
| |
| Deferred financing costs - mortgage loans | | (6,958 | ) | | 1,569,349 |
| | | |
Deferred financing costs - credit facility (6) | | (7,039 | ) | | 1,060,951 |
| | | |
| Total Consolidated Indebtedness | | $ | 2,128,803 |
| | 1,369,349 |
| | | |
| | | | | | | | |
| Total Consolidated Indebtedness (net of premium / (discount) and deferred financing costs) | | | | | |
| Mortgages payable | | $ | 1,835,842 |
| | | | | |
| Revolving credit facility | | — |
| — |
| 4,316 |
| | | |
| Deferred financing costs, net - credit facility (included in other assets) | (4,316 | ) | | | | | |
| Unsecured term loan | | 297,277 |
| | | | | |
| Total Consolidated Indebtedness | | $ | 2,128,803 |
|
| | | | |
| | | | | | | | |
|
| |
| DEBT BY INSTRUMENT | MARCH 31, 2019 (Unaudited)
|
|
| | | | | | | | | | | | | |
dollars in thousands
Asset |
% Ownership |
Principal Balance | Stated Interest Rate | Interest Rate Hedge | Current Annual Interest Rate (1) | Initial Maturity Date | Extended Maturity Date (2) |
| | | | | | | | |
| Unconsolidated | | | | | | | |
| 11333 Woodglen Drive | 18.0 | % | 12,695 |
| L + 1.90% | Swap | 3.52 | % | 01/01/20 | 01/01/20 |
| Galvan | 1.8 | % | 89,500 |
| L + 1.75% | Cap | 4.24 | % | 03/06/20 | 03/06/21 |
| Rosslyn Gateway - North, Rosslyn Gateway - South | 18.0 | % | 49,666 |
| L + 2.00% | Cap | 3.00 | % | 11/17/19 | 11/17/21 |
| The Foundry | 9.9 | % | 58,000 |
| L + 1.85% | Cap | 4.34 | % | 12/12/19 | 12/12/21 |
L'Enfant Plaza Office - North, L'Enfant Plaza Office - East, L'Enfant Plaza Retail (7) | 49.0 | % | 212,626 |
| L + 3.65% | — | 6.25 | % | 05/08/19 | 05/08/22 |
| 500 L'Enfant Plaza | 49.0 | % | 59,146 |
| L + 3.75% | Cap | 6.24 | % | 05/08/20 | 05/08/22 |
| Atlantic Plumbing | 64.0 | % | 100,000 |
| L + 1.50% | — | 3.99 | % | 11/08/22 | 11/08/22 |
| Stonebridge at Potomac Town Center | 10.0 | % | 104,611 |
| L + 1.70% | Swap | 3.25 | % | 12/10/20 | 12/10/22 |
| The Alaire | 18.0 | % | 48,000 |
| L + 1.82% | Cap | 4.31 | % | 03/01/25 | 03/01/25 |
| 1101 17th Street | 55.0 | % | 60,000 |
| L + 1.25% | Swap | 4.13 | % | 06/13/25 | 06/13/25 |
| Fairway Apartments | 10.0 | % | 47,115 |
| L + 1.50% | Swap | 3.60 | % | 07/01/22 | 07/01/25 |
| 7900 Wisconsin Avenue | 50.0 | % | 4,316 |
| 4.82% | Fixed | 4.82 | % | 07/15/25 | 07/15/25 |
| The Gale Eckington | 5.0 | % | 110,813 |
| L + 1.60% | Swap | 3.56 | % | 07/31/22 | 07/31/25 |
| Pickett Industrial Park | 10.0 | % | 23,600 |
| L + 1.45% | Swap | 3.56 | % | 09/04/25 | 09/04/25 |
| The Terano | 1.8 | % | $ | 34,000 |
| L + 1.35% | Swap | 4.45 | % | 11/09/25 | 11/09/25 |
| Wardman Park | 16.7 | % | 125,644 |
| 4.77% | Fixed | 4.77 | % | 02/01/23 | 02/01/28 |
| Total Unconsolidated Principal Balance | | 1,139,732 |
| | | | | |
| Deferred financing costs | | (1,858 | ) | | | | | |
| Total Unconsolidated Indebtedness | | $ | 1,137,874 |
| | | | | |
| | | | | | | | |
| Principal Balance at JBG SMITH Share | | | | | | | |
| Consolidated principal balance at JBG SMITH share | | $ | 2,141,586 |
| | | | | |
| Unconsolidated principal balance at JBG SMITH share | | 304,151 |
| 2 | % | | | | |
| Total Consolidated and Unconsolidated Principal Balance at JBG SMITH Share | $ | 2,445,737 |
| | | | | |
| | | | | | | | |
| Indebtedness at JBG SMITH Share (net of premium / (discount) and deferred financing costs) | | | | | |
| Consolidated indebtedness at JBG SMITH Share | | $ | 2,128,803 |
|
| | | | |
| Unconsolidated indebtedness at JBG SMITH Share | | 303,397 |
| | | | | |
| Total Consolidated and Unconsolidated Indebtedness at JBG SMITH Share | $ | 2,432,200 |
| 2.43 |
| | | | |
____________________
| |
| (1) | March 31, 2019 one-month LIBOR of 2.49% applied to loans which are denoted as floating (no swap) or floating with a cap, except as otherwise noted. |
| |
| (2) | Represents the maturity date based on execution of all extension options. Many of these extensions are subject to lender covenant tests. |
| |
| (3) | In April 2019, we repaid the mortgage debt at The Bartlett and Fort Totten Square. |
| |
| (4) | The notional amount of the Central Place Tower interest rate swap as of March 31, 2019 was $220.0 million. |
| |
| (5) | The notional amount of the Tranche A-2 Term Loan interest rate swap as of March 31, 2019 was $64.0 million. |
| |
| (6) | As of March 31, 2019, net deferred financing costs related to our revolving credit facility totaling $4.3 million were included in "Other assets, net" in our condensed consolidated balance sheet. |
| |
| (7) | The base rate for this loan is three-month LIBOR, which was 2.60% as of March 31, 2019. |
|
| |
| CONSOLIDATED REAL ESTATE VENTURES | MARCH 31, 2019 (Unaudited)
|
|
| | | | | | | |
| | Asset Type | City | Submarket | % Ownership |
Total Square Feet |
| MRP Realty | | | | | |
965 Florida Avenue (1) | Multifamily | Washington, DC | U Street/Shaw | 96.1 | % | 336,092 |
|
| | | | | | |
| Total Consolidated Real Estate Ventures | | | | | 336,092 |
|
____________________
Note: Total square feet at 100% share.
| |
| (1) | Ownership percentage reflects expected dilution of JBG SMITH's real estate venture partner as contributions are funded during the construction of the asset. As of March 31, 2019, JBG SMITH's ownership interest was 90.2%. |
|
| |
UNCONSOLIDATED REAL ESTATE VENTURES | MARCH 31, 2019 (Unaudited)
|
|
| | | | | | | |
| | Asset Type | City | Submarket | % Ownership |
Total Square Feet |
| Landmark | | | | | |
| L'Enfant Plaza Office - East | Commercial | Washington, DC | Southwest | 49.0 | % | 397,296 |
|
| L'Enfant Plaza Office - North | Commercial | Washington, DC | Southwest | 49.0 | % | 299,476 |
|
| 500 L'Enfant Plaza | Commercial | Washington, DC | Southwest | 49.0 | % | 215,185 |
|
| L'Enfant Plaza Retail | Commercial | Washington, DC | Southwest | 49.0 | % | 119,361 |
|
| Rosslyn Gateway - North | Commercial | Arlington, VA | Rosslyn | 18.0 | % | 144,024 |
|
| Rosslyn Gateway - South | Commercial | Arlington, VA | Rosslyn | 18.0 | % | 102,064 |
|
| 11333 Woodglen Drive | Commercial | Rockville, MD | Rockville Pike Corridor | 18.0 | % | 62,650 |
|
| Galvan | Multifamily | Rockville, MD | Rockville Pike Corridor | 1.8 | % | 390,641 |
|
| The Alaire | Multifamily | Rockville, MD | Rockville Pike Corridor | 18.0 | % | 266,673 |
|
| The Terano | Multifamily | Rockville, MD | Rockville Pike Corridor | 1.8 | % | 195,864 |
|
| NoBe II Land | Future Development | Rockville, MD | Rockville Pike Corridor | 18.0 | % | 589,000 |
|
| Rosslyn Gateway - South Land | Future Development | Arlington, VA | Rosslyn | 18.0 | % | 498,500 |
|
| Rosslyn Gateway - North Land | Future Development | Arlington, VA | Rosslyn | 18.0 | % | 311,000 |
|
| L'Enfant Plaza Office - Center | Future Development | Washington, DC | Southwest | 49.0 | % | 350,000 |
|
| Courthouse Metro Land | Future Development | Arlington, VA | Clarendon/Courthouse | 18.0 | % | 286,500 |
|
| Courthouse Metro Land - Option | Future Development | Arlington, VA | Clarendon/Courthouse | 18.0 | % | 62,500 |
|
| 5615 Fishers Drive | Future Development | Rockville, MD | Rockville Pike Corridor | 18.0 | % | 106,500 |
|
| 12511 Parklawn Drive | Future Development | Rockville, MD | Rockville Pike Corridor | 18.0 | % | 6,500 |
|
| Woodglen | Future Development | Rockville, MD | Rockville Pike Corridor | 18.0 | % | — |
|
| | | | | | 4,403,734 |
|
| | | | | | |
| CBREI Venture | | | | | |
| Stonebridge at Potomac Town Center | Commercial | Woodbridge, VA | Prince William County | 10.0 | % | 503,613 |
|
| Pickett Industrial Park | Commercial | Alexandria, VA | Eisenhower Avenue | 10.0 | % | 246,145 |
|
| The Foundry | Commercial | Washington, DC | Georgetown | 9.9 | % | 221,204 |
|
| The Gale Eckington | Multifamily | Washington, DC | H Street/NoMa | 5.0 | % | 466,716 |
|
| Fairway Apartments | Multifamily | Reston, VA | Reston | 10.0 | % | 370,850 |
|
| Atlantic Plumbing | Multifamily | Washington, DC | U Street/Shaw | 64.0 | % | 245,527 |
|
| Fairway Land | Future Development | Reston, VA | Reston | 10.0 | % | 526,200 |
|
| Stonebridge at Potomac Town Center - Land | Future Development | Woodbridge, VA | Prince William County | 10.0 | % | 232,700 |
|
| | | | | | 2,812,955 |
|
| | | | | | |
|
| |
UNCONSOLIDATED REAL ESTATE VENTURES | MARCH 31, 2019 (Unaudited)
|
|
| | | | | | | |
| | Asset Type | City | Submarket | % Ownership |
Total Square Feet |
| Canadian Pension Plan Investment Board | | | | | |
1900 N Street (1) | Commercial | Washington, DC | CBD | 55.0 | % | 271,433 |
|
| 1101 17th Street | Commercial | Washington, DC | CBD | 55.0 | % | 211,193 |
|
| | | | | | 482,626 |
|
| | | | | | |
| Forest City | | | | | |
| Waterfront Station | Future Development | Washington, DC | Southwest | 2.5 | % | 662,600 |
|
| | | | | | |
| Brandywine | | | | | |
| 1250 1st Street | Future Development | Washington, DC | NoMa | 30.0 | % | 265,800 |
|
| 51 N Street | Future Development | Washington, DC | NoMa | 30.0 | % | 177,500 |
|
| 50 Patterson Street | Future Development | Washington, DC | NoMa | 30.0 | % | 142,200 |
|
| | | | | | 585,500 |
|
| | | | | | |
| Berkshire Group | | | | | |
| 7900 Wisconsin Avenue | Multifamily | Bethesda, MD | Bethesda CBD | 50.0 | % | 359,025 |
|
| | | | | | |
| CIM Group / Pacific Life Insurance Company | | | | | |
| Wardman Park | Future Development | Washington, DC | Woodley Park | 16.7 | % | — |
|
| | | | | | |
| Total Unconsolidated Real Estate Ventures | | | | | 9,306,440 |
|
| | | | | | |
____________________
Note: Total square feet at 100% share.
| |
| (1) | Ownership percentage reflects expected dilution of JBG SMITH as contributions are funded during the construction of the asset. As of March 31, 2019, JBG SMITH's ownership interest was 63.7%. |
|
| |
| DEFINITIONS | MARCH 31, 2019
|
Annualized Rent
“Annualized rent” is defined as (i) for commercial assets, or the retail component of a mixed-use asset, the in-place monthly base rent before free rent, plus tenant reimbursements as of March 31, 2019, multiplied by 12, with triple net leases converted to a gross basis by adding estimated tenant reimbursements to monthly base rent, and (ii) for multifamily assets, or the multifamily component of a mixed-use asset, the in-place monthly base rent before free rent as of March 31, 2019, multiplied by 12. Annualized rent excludes rent from signed but not yet commenced leases.
Annualized Rent Per Square Foot
“Annualized rent per square foot” is defined as (i) for commercial assets, annualized office rent divided by occupied office square feet and annualized retail rent divided by occupied retail square feet; and (ii) for multifamily assets, monthly multifamily rent divided by occupied multifamily square feet; annualized retail rent and retail square feet are excluded from this metric. Occupied square footage may differ from leased square footage because leased square footage includes leases that have been signed but have not yet commenced.
Earnings Before Interest, Taxes, Depreciation and Amortization ("EBITDA"), EBITDA for Real Estate ("EBITDAre") and Adjusted EBITDA
Management uses EBITDA and EBITDAre, non-GAAP financial measures, as supplemental operating performance measures and believes they help investors and lenders meaningfully evaluate and compare our operating performance from period-to-period by removing from our operating results the impact of our capital structure (primarily interest charges from our consolidated outstanding debt and the impact of our interest rate swaps) and certain non-cash expenses (primarily depreciation and amortization on our assets). EBITDAre is computed in accordance with the definition established by NAREIT. NAREIT defines EBITDAre as GAAP net income (loss) adjusted to exclude interest expense, income taxes, depreciation and amortization expenses, gains on sales of real estate and impairment losses of real estate, including our share of such adjustments of unconsolidated real estate ventures. These supplemental measures may help investors and lenders understand our ability to incur and service debt and to make capital expenditures. EBITDA and EBITDAre are not substitutes for net income (loss) (computed in accordance with GAAP) and may not be comparable to similarly titled measures used by other companies.
“Adjusted EBITDA,” a non-GAAP financial measure, represents EBITDAre adjusted for items we believe are not representative of ongoing operating results, such as transaction and other costs, gain (loss) on the extinguishment of debt, distributions in excess of our investment in consolidated real estate ventures, gain on the bargain purchase of a business, lease liability adjustments and share-based compensation expense related to the Formation Transaction and special equity awards. We believe that adjusting such items not considered part of our comparable operations, provides a meaningful measure to evaluate and compare our performance from period-to-period.
Because EBITDA, EBITDAre and Adjusted EBITDA have limitations as analytical tools, we use EBITDA, EBITDAre and Adjusted EBITDA to supplement GAAP financial measures. Additionally, we believe that users of these measures should consider EBITDA, EBITDAre and Adjusted EBITDA in conjunction with net income (loss) and other GAAP measures in understanding our operating results. A reconciliation of net income (loss) to EBITDA, EBITDAre and Adjusted EBITDA is presented on page 15.
Estimated Potential Development Density
‘‘Estimated potential development density’’ reflects management’s estimate of developable gross square feet based on our current business plans with respect to real estate owned or controlled as of March 31, 2019. Our current business plans may contemplate development of less than the maximum potential development density for individual assets. As market conditions change, our business plans, and therefore, the Estimated Potential Development Density, could change accordingly. Given timing, zoning requirements and other factors, we make no assurance that estimated potential development density amounts will become actual density to the extent we complete development of assets for which we have made such estimates.
Free Rent
‘‘Free rent’’ means the amount of base rent and tenant reimbursements that are abated according to the applicable lease agreement(s).
Funds from Operations ("FFO"), Core FFO and Funds Available for Distribution ("FAD")
FFO is a non-GAAP financial measure computed in accordance with the definition established by NAREIT in the NAREIT FFO White Paper - 2018 Restatement issued in 2018. NAREIT defines FFO as “net income (computed in accordance with GAAP), excluding depreciation and amortization related to real estate, gains and losses from the sale of certain real estate assets, gains and losses from change in control and impairment write-downs of certain real estate assets and investments in entities when the impairment is directly attributable to decreases in the value of depreciable real estate held by the entity."
"Core FFO" represents FFO adjusted to exclude items (net of tax) which we believe are not representative of ongoing operating results, such as transaction and other costs, gains (or losses) on extinguishment of debt, gain on the bargain purchase of a business, distributions in excess of our investment in consolidated real estate ventures, share-based compensation expense related to the Formation Transaction and special equity awards, lease liability adjustments, amortization of the management contracts intangible and the mark-to-market of derivative instruments.
"FAD" is a non-GAAP financial measure and represents FFO less recurring tenant improvements, leasing commissions and other capital expenditures, net deferred rent activity, third-party lease liability assumption payments, recurring share-based compensation expense, accretion of acquired below-market leases, net of amortization of acquired above-market leases, amortization of debt issuance costs and other non-cash income and charges. FAD is presented solely as a supplemental disclosure that management believes provides useful information as it relates to our ability to fund dividends.
We believe FFO, Core FFO and FAD are meaningful non‑GAAP financial measures useful in comparing our levered operating performance from period-to-period and as compared to similar real estate companies because these non‑GAAP measures exclude real estate depreciation and amortization expense and other non-comparable income and expenses, which implicitly assumes that the value of real estate diminishes predictably over time rather than fluctuating based on market conditions. FFO, Core FFO and FAD do not represent cash generated from operating activities and
|
| |
| DEFINITIONS | MARCH 31, 2019
|
are not necessarily indicative of cash available to fund cash requirements and should not be considered as an alternative to net income (loss) (computed in accordance with GAAP) as a performance measure or cash flow as a liquidity measure. FFO, Core FFO and FAD may not be comparable to similarly titled measures used by other companies. A reconciliation of net income to FFO, Core FFO and FAD is presented on pages 16-17.
Future Development
“Future development” refers to assets that are development opportunities on which we do not intend to commence construction within 18 months of March 31, 2019 where we (i) own land or control the land through a ground lease or (ii) are under a long-term conditional contract to purchase, or enter into a leasehold interest with respect to land.
Historical Cost, Estimated Incremental Investment, Estimated Total Investment and Estimated Total Project Cost
“Historical cost” is a non-GAAP measure which includes the total historical cost incurred by JBG SMITH with respect to the development of an asset, including any acquisition costs, hard costs, soft costs, tenant improvements (excluding free rent converted to tenant improvement allowances), leasing costs and other similar costs, but excluding any financing costs, ground rent expenses and capitalized payroll costs incurred as of March 31, 2019.
“Estimated incremental investment” means management’s estimate of the remaining cost to be incurred in connection with the development of an asset as of March 31, 2019, including all remaining acquisition costs, hard costs, soft costs, tenant improvements (excluding free rent converted to tenant improvement allowances), leasing costs and other similar costs to develop and stabilize the asset but excluding any financing costs, ground rent expenses and capitalized payroll costs.
“Estimated total investment” means, with respect to the development of an asset, the sum of the historical cost in such asset and the estimated incremental investment for such asset.
"Estimated total project cost" is estimated total investment excluding purchase price allocation adjustments recognized as a result of the Formation Transaction.
Actual incremental investment, actual total investment and actual total project cost may differ substantially from our estimates due to numerous factors, including unanticipated expenses, delays in the estimated start and/or completion date, changes in design and other contingencies.
In Service
‘‘In service’’ refers to commercial or multifamily assets that are at or above 90% leased or have been operating and collecting rent for more than 12 months as of March 31, 2019.
Metro-Served
“Metro-served” means locations, submarkets or assets that are generally nearby and within walking distance of a Metro station, defined as being within 0.5 miles of an existing or planned Metro station.
Monthly Rent Per Unit
For multifamily assets, represents multifamily rent for the month ended March 31, 2019 divided by occupied units; retail rent is excluded from this metric.
Near-Term Development
‘‘Near-term development’’ refers to assets that have substantially completed the entitlement process and on which we intend to commence construction within 18 months following March 31, 2019, subject to market conditions.
Net Operating Income ("NOI"), Adjusted Annualized NOI, Estimated Stabilized NOI and Projected NOI Yield
“NOI” is a non-GAAP financial measure management uses to measure the operating performance of our assets and consists of property-related revenue (which includes base rent, tenant reimbursements and other operating revenue, net of free rent and payments associated with assumed lease liabilities) less operating expenses and ground rent, if applicable. NOI also excludes deferred rent, related party management fees, interest expense, and certain other non-cash adjustments, including the accretion of acquired below-market leases and amortization of acquired above-market leases and below-market ground lease intangibles. Annualized NOI, for all assets except Crystal City Marriott, represents NOI for the three months ended March 31, 2019 multiplied by four. Due to seasonality in the hospitality business, annualized NOI for Crystal City Marriott represents the trailing twelve-month NOI as of March 31, 2019. Management believes Annualized NOI provides useful information in understanding JBG SMITH’s financial performance over a 12-month period, however, investors and other users are cautioned against attributing undue certainty to our calculation of Annualized NOI. Actual NOI for any 12-month period will depend on a number of factors beyond our ability to control or predict, including general capital markets and economic conditions, any bankruptcy, insolvency, default or other failure to pay rent by one or more of our tenants and the destruction of one or more of our assets due to terrorist attack, natural disaster or other casualty, among others. We do not undertake any obligation to update our calculation to reflect events or circumstances occurring after the date of this Investor Package. There can be no assurance that the annualized NOI shown will reflect JBG SMITH’s actual results of operations over any 12-month period. We also report adjusted annualized NOI which includes signed but not yet commenced leases and incremental revenue from recently delivered assets assuming stabilization. While we believe adjusted annualized NOI provides useful information regarding potential future NOI from our assets, it does not account for any decrease in NOI for lease terminations, defaults or other negative events that could affect NOI and therefore, should not be relied upon as indicative of future NOI.
This Investor Package also contains management’s estimate of stabilized NOI and projections of NOI yield for under construction and near-term development assets, which are based on management’s estimates of property-related revenue and operating expenses for each asset. These estimates are inherently uncertain and represent management’s plans, expectations and beliefs and are subject
|
| |
| DEFINITIONS | MARCH 31, 2019
|
to numerous assumptions, risks and uncertainties. The property-related revenues and operating expenses for our assets may differ materially from the estimates included in this Investor Package. Management’s projections of NOI yield are not projections of JBG SMITH’s overall financial performance or cash flow, and there can be no assurance that the projected NOI yield set forth in this Investor Package will be achieved.
“Projected NOI yield” means our estimated stabilized NOI reported as a percentage of (i) estimated total project costs, (ii) estimated total investment and (iii) estimated incremental investment. Actual initial full year stabilized NOI yield may vary from the projected NOI yield based on the actual incremental investment to complete the asset and its actual initial full year stabilized NOI, and there can be no assurance that we will achieve the projected NOI yields described in this Investor Package.
The Company does not provide reconciliations for non-GAAP estimates on a future basis, including adjusted annualized NOI and estimated stabilized NOI because it is unable to provide a meaningful or accurate calculation or estimate of reconciling items and the information is not available without unreasonable effort. This inability is due to the inherent difficulty of forecasting the timing and/or amounts of various items that would impact net income. Additionally, no reconciliation of projected NOI yield to the most directly comparable GAAP measure is included in this Investor Package because we are unable to quantify certain amounts that would be required to be included in the comparable GAAP financial measures without unreasonable efforts because such data is not currently available or cannot be currently estimated with confidence. Accordingly, we believe such reconciliations would imply a degree of precision that would be confusing or misleading to investors.
Management uses each of these measures as supplemental performance measures for its assets and believes they provide useful information to investors because they reflect only those revenue and expense items that are incurred at the asset level, excluding non-cash items. In addition, NOI is considered by many in the real estate industry to be a useful starting point for determining the value of a real estate asset or group of assets.
However, because NOI excludes depreciation and amortization and captures neither the changes in the value of our assets that result from use or market conditions, nor the level of capital expenditures and capitalized leasing commissions necessary to maintain the operating performance of our assets, all of which have real economic effect and could materially impact the financial performance of our assets, the utility of this measure of the operating performance of our assets is limited. Moreover, our method of calculating NOI may differ from other real estate companies and, accordingly, may not be comparable. NOI should be considered only as a supplement to net operating income (loss) (computed in accordance with GAAP) as a measure of the operating performance of our assets.
Percent Leased
‘‘Percent leased’’ is based on leases signed as of March 31, 2019, and is calculated as total rentable square feet less rentable square feet available for lease divided by total rentable square feet expressed as a percentage. Out-of-service square feet are excluded from this calculation.
Percent Pre-Leased
‘‘Percent pre-leased’’ is based on leases signed as of March 31, 2019, and is calculated as the estimated rentable square feet leased divided by estimated total rentable square feet expressed as a percentage.
Percent Occupied
‘‘Percent occupied’’ is based on occupied rentable square feet/units as of March 31, 2019, and is calculated as (i) for office and retail space, total rentable square feet less unoccupied square feet divided by total rentable square feet, (ii) for multifamily space, total units less unoccupied units divided by total units, expressed as a percentage. Out-of-service square feet are excluded from this calculation.
Pro Rata Adjusted General and Administrative (“G&A”) Expenses
"Pro Rata Adjusted G&A expenses", a non-GAAP financial measure, represents G&A expenses adjusted for share-based compensation expense related to the Formation Transaction and special equity awards and the G&A expenses of our third-party asset management and real estate services business that are directly reimbursed. We believe that adjusting such items not considered part of our comparable operations provides a meaningful measure to assess our G&A expenses as compared to similar real estate companies and in general.
Recently Delivered
“Recently delivered” refers to commercial and multifamily assets that are below 90% leased and have been delivered within the 12 months ended March 31, 2019.
Same Store and Non-Same Store
“Same store” refers to the pool of assets that were in service for the entirety of both periods being compared, except for assets for which significant redevelopment, renovation, or repositioning occurred during either of the periods being compared.
“Non-same store” refers to all operating assets excluded from the same store pool.
Second Generation Lease
“Second generation lease” is a lease on space that had been vacant for less than nine months.
|
| |
| DEFINITIONS | MARCH 31, 2019
|
Signed But Not Yet Commenced Leases
“Signed but not yet commenced leases” means leases for assets in JBG SMITH’s portfolio that, as of March 31, 2019, have been executed but for which the contractual lease term had not yet begun, and no rental payments had yet been charged to the tenant.
Square Feet
‘‘Square feet’’ or ‘‘SF’’ refers to the area that can be rented to tenants, defined as (i) for commercial assets, rentable square footage defined in the current lease and for vacant space the rentable square footage defined in the previous lease for that space, (ii) for multifamily assets, management’s estimate of approximate rentable square feet, (iii) for assets under construction and near-term development assets, management’s estimate of approximate rentable square feet based on current design plans as of March 31, 2019, or (iv) for future development assets, management’s estimate of developable gross square feet based on its current business plans with respect to real estate owned or controlled as of March 31, 2019.
Transaction and Other Costs
Transaction and other costs include amounts incurred for transition services provided by our former parent, integration costs, severance costs, costs incurred in connection with recapitalization transactions and disposition costs and costs related to other completed, potential and pursued transactions.
Under Construction
‘‘Under construction’’ refers to assets that were under construction during the three months ended March 31, 2019.
|
| |
APPENDIX - EBITDA, EBITDAre AND ADJUSTED EBITDA (NON-GAAP)
| MARCH 31, 2019 (Unaudited) )
|
|
| | | | | | | | | | | | | | | | |
| | | Three Months Ended |
| dollars in thousands | | Q1 2019 | Q4 2018 | Q3 2018 | Q2 2018 | Q1 2018 |
| | | | | | | |
| EBITDA, EBITDAre and Adjusted EBITDA | | | | | | |
| Net income (loss) |
| $ | 28,248 |
| $ | 994 |
| $ | 26,382 |
| $ | 24,023 |
| $ | (4,786 | ) |
| Depreciation and amortization expense | | 48,719 |
| 67,556 |
| 46,603 |
| 48,117 |
| 49,160 |
|
Interest expense (1) | | 17,174 |
| 18,184 |
| 18,979 |
| 18,027 |
| 19,257 |
|
| Income tax benefit | | (1,172 | ) | 698 |
| (841 | ) | 313 |
| (908 | ) |
| Unconsolidated real estate ventures allocated share of above adjustments | | 7,806 |
| 10,253 |
| 10,986 |
| 10,602 |
| 10,175 |
|
| Allocated share of above adjustments to noncontrolling interests in consolidated real estate ventures | | (1 | ) | (182 | ) | — |
| 129 |
| — |
|
EBITDA (2) | | $ | 100,774 |
| $ | 97,503 |
| $ | 102,109 |
| $ | 101,211 |
| $ | 72,898 |
|
| Gain on sale of real estate | | (39,033 | ) | (6,394 | ) | (11,938 | ) | (33,396 | ) | (455 | ) |
| Gain on sale of unconsolidated real estate assets | | — |
| (20,554 | ) | (15,488 | ) | — |
| — |
|
EBITDAre (2) | | $ | 61,741 |
| $ | 70,555 |
| $ | 74,683 |
| $ | 67,815 |
| $ | 72,443 |
|
Transaction and other costs (3) | | 4,895 |
| 15,572 |
| 4,126 |
| 3,787 |
| 4,221 |
|
| Loss on extinguishment of debt | | — |
| 617 |
| 79 |
| 4,457 |
| — |
|
| Reduction of gain on bargain purchase | | — |
| — |
| — |
| 7,606 |
| — |
|
| Share-based compensation related to Formation Transaction and special equity awards | | 11,131 |
| 9,118 |
| 8,387 |
| 9,097 |
| 9,428 |
|
Net distributions in excess of our investment in unconsolidated real estate venture (4) | | (6,441 | ) | (7,374 | ) | (890 | ) | (5,412 | ) | — |
|
| Unconsolidated real estate ventures allocated share of above adjustments | | — |
| 1,542 |
| — |
| — |
| 30 |
|
| Lease liability adjustments | | — |
| (7,422 | ) | (2,543 | ) | — |
| — |
|
| Allocated share of above adjustments to noncontrolling interests in consolidated real estate ventures | | — |
| — |
| — |
| (124 | ) | — |
|
Adjusted EBITDA (2) | | $ | 71,326 |
| $ | 82,608 |
| $ | 83,842 |
| $ | 87,226 |
| $ | 86,122 |
|
| | | | | | | |
Net Debt to Annualized Adjusted EBITDA (5) | | 7.1x |
| 6.5x |
| 6.7x |
| 6.3x |
| 6.9x |
|
| | | | | | | |
| | | March 31, 2019 | December 31, 2018 | September 30, 2018 | June 30, 2018 | March 31, 2018 |
| Net Debt (at JBG SMITH Share) | | | | | | |
Consolidated indebtedness (6) | | $ | 2,128,803 |
| $ | 2,130,704 |
| $ | 2,103,589 |
| $ | 2,033,183 |
| $ | 2,185,461 |
|
Unconsolidated indebtedness (6) | | 303,397 |
| 298,588 |
| 442,669 |
| 440,177 |
| 419,476 |
|
| Total consolidated and unconsolidated indebtedness | 2,432,200 |
| 2,429,292 |
| 2,546,258 |
| 2,473,360 |
| 2,604,937 |
|
| Less: cash and cash equivalents | | 405,646 |
| 273,611 |
| 284,012 |
| 276,629 |
| 238,519 |
|
| Net Debt (at JBG SMITH Share) | | $ | 2,026,554 |
| $ | 2,155,681 |
| $ | 2,262,246 |
| $ | 2,196,731 |
| $ | 2,366,418 |
|
____________________
Note: EBITDAre for Q1 2018 was restated in compliance with the definition established by NAREIT in the NARIET FFO White Paper - 2018 Restatement issued in 2018.
| |
| (1) | Interest expense includes the amortization of deferred financing costs and the ineffective portion of any interest rate swaps or caps, net of capitalized interest. |
| |
| (2) | Due to our adoption of the new accounting standard for leases, beginning in 2019, we no longer capitalize internal leasing costs and expense these costs as incurred (such costs were $2.2 million, $1.5 million, $1.5 million and $1.3 million for Q4 2018, Q3 2018, Q2 2018 and Q1 2018). |
| |
| (3) | Includes fees and expenses incurred in connection with the Formation Transaction (including transition services provided by our former parent, integration costs and severance costs), costs related to the pursuit of Amazon's additional headquarters, demolition costs and costs related to other completed, potential and pursued transactions. |
| |
| (4) | As of June 30, 2018, we suspended the equity method of accounting for our investment in the real estate venture that owns 1101 17th Street as our investment had been reduced to zero and we did not have an obligation to provide further financial support to the venture. All subsequent net distributions from the venture have been recognized as income, which will continue until our share of unrecorded earnings and contributions exceed the cumulative excess distributions previously recognized. |
| |
| (5) | Pro forma Net Debt to Annualized Adjusted EBITDA would have been 5.4x for Q1 2019, including the $472.3 million of net proceeds from the underwritten public offering completed in April 2019. |
| |
| (6) | Net of premium/discount and deferred financing costs. |
|
| |
APPENDIX - FFO, CORE FFO AND FAD (NON-GAAP)
| MARCH 31, 2019 (Unaudited)
|
|
| | | | | | | | | | | | | | | |
| | Three Months Ended |
| in thousands, except per share data | Q1 2019 | Q4 2018 | Q3 2018 | Q2 2018 | Q1 2018 |
| | | | | | |
| FFO and Core FFO | | | | | |
| Net income (loss) attributable to common shareholders | $ | 24,861 |
| $ | 710 |
| $ | 22,830 |
| $ | 20,574 |
| $ | (4,190 | ) |
| Net income (loss) attributable to redeemable noncontrolling interests | 3,387 |
| 178 |
| 3,552 |
| 3,574 |
| (594 | ) |
| Net loss attributable to noncontrolling interests | — |
| 106 |
| — |
| (125 | ) | (2 | ) |
| Net income (loss) | 28,248 |
| 994 |
| 26,382 |
| 24,023 |
| (4,786 | ) |
| Gain on sale of real estate | (39,033 | ) | (6,394 | ) | (11,938 | ) | (33,396 | ) | (455 | ) |
| Gain on sale of unconsolidated real estate assets | — |
| (20,554 | ) | (15,488 | ) | — |
| — |
|
| Real estate depreciation and amortization | 46,035 |
| 64,891 |
| 43,945 |
| 45,587 |
| 46,639 |
|
| Pro rata share of real estate depreciation and amortization from unconsolidated real estate ventures | 4,653 |
| 6,079 |
| 6,345 |
| 6,179 |
| 6,436 |
|
| Net (income) attributable to noncontrolling interests in consolidated real estate ventures | (1 | ) | (182 | ) | — |
| 129 |
| 2 |
|
FFO Attributable to Operating Partnership Common Units (1) | $ | 39,902 |
| $ | 44,834 |
| $ | 49,246 |
| $ | 42,522 |
| $ | 47,836 |
|
| FFO attributable to redeemable noncontrolling interests | (4,783 | ) | (5,741 | ) | (6,631 | ) | (6,299 | ) | (7,127 | ) |
FFO attributable to common shareholders (1) | $ | 35,119 |
| $ | 39,093 |
| $ | 42,615 |
| $ | 36,223 |
| $ | 40,709 |
|
| | | | | | |
| FFO attributable to the operating partnership common units | $ | 39,902 |
| $ | 44,834 |
| $ | 49,246 |
| $ | 42,522 |
| $ | 47,836 |
|
Transaction and other costs, net of tax (2) | 4,626 |
| 14,509 |
| 3,586 |
| 3,394 |
| 4,136 |
|
| Mark-to-market on derivative instruments | (476 | ) | (542 | ) | 152 |
| (432 | ) | (1,119 | ) |
| Share of gain from mark-to-market on derivative instruments held by unconsolidated real estate ventures | 227 |
| 379 |
| (49 | ) | (90 | ) | (342 | ) |
| Loss on extinguishment of debt, net of noncontrolling interests | — |
| 2,159 |
| 79 |
| 4,333 |
| — |
|
Net distributions in excess of our investment in unconsolidated real estate venture (3) | (6,441 | ) | (7,374 | ) | (890 | ) | (5,412 | ) | — |
|
| Reduction of gain on bargain purchase | — |
| — |
| — |
| 7,606 |
| — |
|
| Share-based compensation related to Formation Transaction and special equity awards | 11,131 |
| 9,118 |
| 8,387 |
| 9,097 |
| 9,428 |
|
| Lease liability adjustments | — |
| (7,422 | ) | (2,543 | ) | — |
| — |
|
| Amortization of management contracts intangible, net of tax | 1,287 |
| 1,287 |
| 1,288 |
| 1,287 |
| 1,286 |
|
Core FFO Attributable to Operating Partnership Common Units (1) | $ | 50,256 |
| $ | 56,948 |
| $ | 59,256 |
| $ | 62,305 |
| $ | 61,225 |
|
| Core FFO attributable to redeemable noncontrolling interests | (6,024 | ) | (7,292 | ) | (7,978 | ) | (9,229 | ) | (9,037 | ) |
Core FFO attributable to common shareholders (1) | $ | 44,232 |
| $ | 49,656 |
| $ | 51,278 |
| $ | 53,076 |
| $ | 52,188 |
|
| FFO per diluted common share | $ | 0.28 |
| $ | 0.32 |
| $ | 0.36 |
| $ | 0.31 |
| $ | 0.35 |
|
| Core FFO per diluted common share | $ | 0.36 |
| $ | 0.41 |
| $ | 0.43 |
| $ | 0.45 |
| $ | 0.44 |
|
| Weighted average diluted shares | 123,423 |
| 120,917 |
| 119,835 |
| 117,955 |
| 117,955 |
|
See footnotes on page 55.
|
| |
APPENDIX - FFO, CORE FFO AND FAD (NON-GAAP)
| MARCH 31, 2019 (Unaudited)
|
|
| | | | | | | | | | | | | | | |
| | Three Months Ended |
| in thousands, except per share data | Q1 2019 | Q4 2018 | Q3 2018 | Q2 2018 | Q1 2018 |
| | | | | | |
| FAD | | | | | |
| Core FFO attributable to the operating partnership common units | $ | 50,256 |
| $ | 56,948 |
| $ | 59,256 |
| $ | 62,305 |
| $ | 61,225 |
|
| Recurring capital expenditures and second generation tenant improvements and leasing commissions | (22,297 | ) | (35,836 | ) | (19,123 | ) | (11,057 | ) | (6,097 | ) |
Straight-line and other rent adjustments (4) | (6,808 | ) | (6,692 | ) | (1,368 | ) | (1,216 | ) | (1,075 | ) |
| Share of straight-line rent from unconsolidated real estate ventures | (135 | ) | 680 |
| 180 |
| 189 |
| 159 |
|
| Third-party lease liability assumption payments | (1,136 | ) | (1,130 | ) | (912 | ) | (619 | ) | (472 | ) |
| Share of third party lease liability assumption payments for unconsolidated real estate ventures | — |
| — |
| — |
| — |
| (50 | ) |
| Share-based compensation expense | 5,330 |
| 4,666 |
| 4,879 |
| 5,941 |
| 4,276 |
|
| Amortization of debt issuance costs | 970 |
| 1,140 |
| 1,155 |
| 1,201 |
| 1,164 |
|
| Share of amortization of debt issuance costs from unconsolidated real estate ventures | 48 |
| 67 |
| 66 |
| 66 |
| 69 |
|
| Non-real estate depreciation and amortization | 912 |
| 893 |
| 886 |
| 758 |
| 749 |
|
FAD available to the Operating Partnership Common Units (A) (5) | $ | 27,140 |
| $ | 20,736 |
| $ | 45,019 |
| $ | 57,568 |
| $ | 59,948 |
|
Distributions to common shareholders and unitholders (6) (B) | $ | 31,284 |
| $ | 31,284 |
| $ | 31,196 |
| $ | 31,197 |
| $ | 31,423 |
|
| FAD Payout Ratio (B÷A) | 115.3 | % | 150.9 | % | 69.3 | % | 54.2 | % | 52.4 | % |
|
| | | | | | | | | | | | | | | |
| Capital Expenditures | | | | | |
| Maintenance and recurring capital expenditures | $ | 5,495 |
| $ | 14,445 |
| $ | 7,113 |
| $ | 3,989 |
| $ | 2,683 |
|
| Share of maintenance and recurring capital expenditures from unconsolidated real estate ventures | 88 |
| 978 |
| 444 |
| 250 |
| 1,149 |
|
| Second generation tenant improvements and leasing commissions | 16,155 |
| 19,211 |
| 10,603 |
| 6,273 |
| 1,893 |
|
| Share of second generation tenant improvements and leasing commissions from unconsolidated real estate ventures | 559 |
| 1,202 |
| 963 |
| 545 |
| 372 |
|
| Recurring capital expenditures and second generation tenant improvements and leasing commissions | 22,297 |
| 35,836 |
| 19,123 |
| 11,057 |
| 6,097 |
|
| First generation tenant improvements and leasing commissions | 6,197 |
| 8,215 |
| 4,443 |
| 6,676 |
| 4,185 |
|
| Share of first generation tenant improvements and leasing commissions from unconsolidated real estate ventures | 233 |
| 17 |
| 169 |
| 1,391 |
| 995 |
|
| Non-recurring capital expenditures | 6,722 |
| 15,375 |
| 2,895 |
| 3,765 |
| 3,366 |
|
| Share of non-recurring capital expenditures from unconsolidated joint ventures | — |
| 112 |
| 300 |
| 142 |
| 620 |
|
| Non-recurring capital expenditures | 13,152 |
| 23,719 |
| 7,807 |
| 11,974 |
| 9,166 |
|
| Total JBG SMITH Share of Capital Expenditures | $ | 35,449 |
| $ | 59,555 |
| $ | 26,930 |
| $ | 23,031 |
| $ | 15,263 |
|
_______________
Note: FFO attributable to operating partnership common units and FFO attributable to common shareholders for Q1 2018 was restated in compliance with the definition established by NAREIT in the NARIET FFO White Paper - 2018 Restatement issued in 2018.
| |
| (1) | Due to our adoption of the new accounting standard for leases, beginning in 2019, we no longer capitalize internal leasing costs and expense these costs as incurred (such costs were $2.2 million, $1.5 million, $1.5 million and $1.3 million for Q4 2018, Q3 2018, Q2 2018 and Q1 2018). |
| |
| (2) | Includes fees and expenses incurred in connection with the Formation Transaction (including transition services provided by our former parent, integration costs, and severance costs), costs related to the pursuit of Amazon's additional headquarters, demolition costs and costs related to other completed, potential and pursued transactions. |
| |
| (3) | As of June 30, 2018, we suspended the equity method of accounting for our investment in the real estate venture that owns 1101 17th Street as our investment had been reduced to zero and we did not have an obligation to provide further financial support to the venture. All subsequent net distributions from the venture have been recognized as income, which will continue until our share of unrecorded earnings and contributions exceed the cumulative excess distributions previously recognized. |
| |
| (4) | Includes straight-line rent, above/below market lease amortization and lease incentive amortization. |
| |
| (5) | The Q1 2019 and Q4 2018 declines in FAD available to the Operating Partnership Common Units were attributable to significant increases in second generation tenant improvements and leasing commissions from the early renewal of several leases during the quarters. Additionally, Q4 2018 was further impacted by increases in recurring capital expenditures, which is consistent with historical seasonality trends. |
| |
| (6) | The distribution for Q1 2019 excludes a special dividend of $0.10 per common share that was paid in January 2019. |
|
| |
APPENDIX - NOI RECONCILIATIONS (NON-GAAP)
| MARCH 31, 2019 (Unaudited)
|
|
| | | | | | | | | | | | | | | |
| dollars in thousands | Three Months Ended |
| | Q1 2019 | Q4 2018 | Q3 2018 | Q2 2018 | Q1 2018 |
| Net income (loss) attributable to common shareholders | $ | 24,861 |
| $ | 710 |
| $ | 22,830 |
| $ | 20,574 |
| $ | (4,190 | ) |
| Add: | | | | | |
| Depreciation and amortization expense | 48,719 |
| 67,556 |
| 46,603 |
| 48,117 |
| 49,160 |
|
| General and administrative expense: | | | | | |
Corporate and other (1) | 12,314 |
| 8,512 |
| 8,219 |
| 8,603 |
| 8,414 |
|
| Third-party real estate services | 28,066 |
| 25,274 |
| 20,754 |
| 21,189 |
| 22,609 |
|
Share-based compensation related to Formation Transaction and
special equity awards
| 11,131 |
| 9,118 |
| 8,387 |
| 9,097 |
| 9,428 |
|
| Transaction and other costs | 4,895 |
| 15,572 |
| 4,126 |
| 3,787 |
| 4,221 |
|
| Interest expense | 17,174 |
| 18,184 |
| 18,979 |
| 18,027 |
| 19,257 |
|
| Loss on extinguishment of debt | — |
| 617 |
| 79 |
| 4,457 |
| — |
|
| Reduction of gain on bargain purchase | — |
| — |
| — |
| 7,606 |
| — |
|
| Income tax benefit | (1,172 | ) | 698 |
| (841 | ) | 313 |
| (908 | ) |
| Net income (loss) attributable to redeemable noncontrolling interests | 3,387 |
| 178 |
| 3,552 |
| 3,574 |
| (594 | ) |
| Less: | | | | | |
Third-party real estate services, including reimbursements
| 27,691 |
| 26,421 |
| 23,788 |
| 24,160 |
| 24,330 |
|
Other income (2) | 1,640 |
| 1,454 |
| 1,708 |
| 2,080 |
| 1,116 |
|
| Income (loss) from unconsolidated real estate ventures, net | 3,601 |
| 23,991 |
| 13,484 |
| 3,836 |
| (1,902 | ) |
| Interest and other income, net | 951 |
| 9,991 |
| 4,091 |
| 513 |
| 573 |
|
| Gain on sale of real estate | 39,033 |
| 6,394 |
| 11,938 |
| 33,396 |
| 455 |
|
| Net (income) loss attributable to noncontrolling interests | — |
| (106 | ) | — |
| 125 |
| 2 |
|
Consolidated NOI (3) | 76,459 |
| 78,274 |
| 77,679 |
| 81,234 |
| 82,823 |
|
| Proportionate NOI attributable to unconsolidated real estate ventures | 5,386 |
| 8,847 |
| 9,722 |
| 9,011 |
| 9,207 |
|
Non-cash rent adjustments (4) | (6,808 | ) | (6,691 | ) | (1,369 | ) | (1,237 | ) | (1,096 | ) |
Other adjustments (1) (5) | 3,353 |
| 3,915 |
| 3,205 |
| 3,635 |
| 4,252 |
|
| Total adjustments | 1,931 |
| 6,071 |
| 11,558 |
| 11,409 |
| 12,363 |
|
NOI (3) | $ | 78,390 |
| $ | 84,345 |
| $ | 89,237 |
| $ | 92,643 |
| $ | 95,186 |
|
Less: out-of-service NOI loss (6) | (1,271 | ) | (1,195 | ) | $ | (1,692 | ) | $ | (1,992 | ) | $ | 2,363 |
|
Operating portfolio NOI (3) | $ | 79,661 |
| $ | 85,540 |
| $ | 90,929 |
| $ | 94,635 |
| $ | 92,823 |
|
Non-same store NOI (7) | 6,088 |
| 8,742 |
| 20,910 |
| 24,449 |
| 21,419 |
|
Same store NOI (8) | $ | 73,573 |
| $ | 76,798 |
| $ | 70,019 |
| $ | 70,186 |
| $ | 71,404 |
|
| | | | | | |
___________________
Note: NOI, non-same store NOI and same store NOI are presented as originally reported in the respective quarter.
| |
| (1) | Adjusted for property management fees of $4.2 million, $4.0 million and $4.3 million for Q3 2018, Q2 2018 and Q1 2018. |
| |
| (2) | Excludes operating parking income of $6.5 million, $6.3 million, $6.4 million, $6.6 million, $6.4 million in Q1 2019, Q4 2018, Q3 2018, Q2 2018 and Q1 2018. |
| |
| (3) | Due to our adoption of the new accounting standard for leases, beginning in 2019, we no longer capitalize internal leasing costs and expense these costs as incurred (such costs were $2.2 million, $1.5 million, $1.5 million and $1.3 million for Q4 2018, Q3 2018, Q2 2018 and Q1 2018). |
| |
| (4) | Adjustment to exclude straight-line rent, above/below market lease amortization and lease incentive amortization. |
| |
| (5) | Adjustment to include other income and payments associated with assumed lease liabilities related to operating properties and to exclude commercial lease termination revenue. |
| |
| (6) | Includes the results for our Under Construction assets and Future Development Pipeline. |
| |
| (7) | Includes the results for properties that were not owned, operated and in service for the entirety of both periods being compared and properties for which significant redevelopment, renovation or repositioning occurred during either of the periods being compared. The decrease in non-same store NOI in Q1 2019 and Q4 2018 is primarily attributable to lost income from disposed assets. |
| |
| (8) | Includes the results of the properties that are owned, operated and in service for the entirety of both periods being compared except for properties for which significant redevelopment, renovation or repositioning occurred during either of the periods being compared. |
|
| |
APPENDIX - NOI RECONCILIATIONS (NON-GAAP)
| MARCH 31, 2019 (Unaudited)
|