February 25, 2020
To Our Fellow Shareholders:
2019 was another extraordinary year for JBG SMITH. The year began with the execution of the Amazon HQ2 agreements and ended with an additional full-building lease to Amazon for 272,000 square feet at 2100 Crystal Drive. Additionally, after receiving final approvals at the end of 2019, we commenced construction on the first 2.15 million square feet of Amazon’s new headquarters. We also succeeded in landing the $1 billion Virginia Tech Innovation Campus directly adjacent to approximately 2.0 million square feet of development density we own in the submarket. With almost 60% of our company located directly in National Landing and approximately 83% within a 20-minute commute, our lease-up, repositioning, and development efforts in the submarket will remain top priorities and sources of growth for years to come.
Our repositioning of National Landing is already underway with approximately 380,000 square feet under construction (Central District Retail and 1770 Crystal Drive) and an additional 650,000 square feet at 1900 Crystal Drive, expected to commence construction by the end of the first quarter. In addition, we have filed entitlement applications for 3.7 million square feet of future development density in National Landing, of which we expect approximately 1.1 million square feet (approximately 1,400 multifamily units) could be ready for construction start as early as next year. These investment opportunities not only represent compelling growth potential in their own right, but also contribute to the overall neighborhood repositioning that will benefit the other 11.3 million square feet we control in the submarket. To that end, the leasing strategy of our operating portfolio is well aligned with the timing and impact of what will be a dramatic upgrade to the amenity base in National Landing. Tenant demand already reflects some of these anticipated changes, but seeing is believing, and when delivery milestones are achieved, we expect further rental rate and occupancy growth from these strategic investments.
Outside of National Landing we are focused on increasing our concentration in a handful of high-growth, rapidly evolving emerging submarkets, such as the Ballpark, Union Market/H Street Corridor, and U Street/Shaw, where our mixed-use skillset, development expertise and our ability to deliver placemaking and amenities are strong differentiators. In these submarkets and across our portfolio, we anticipate strong near-term growth from the five Under Construction assets that we completed in 2019, as well as our remaining four Under Construction assets, which we expect to deliver in 2020 and 2021. Our operating portfolio in these locations is also well positioned for near-term growth given underlying multifamily fundamentals, and the burn off of free rent associated with the proactive early renewal strategy we implemented in our commercial portfolio in 2017 and 2018.
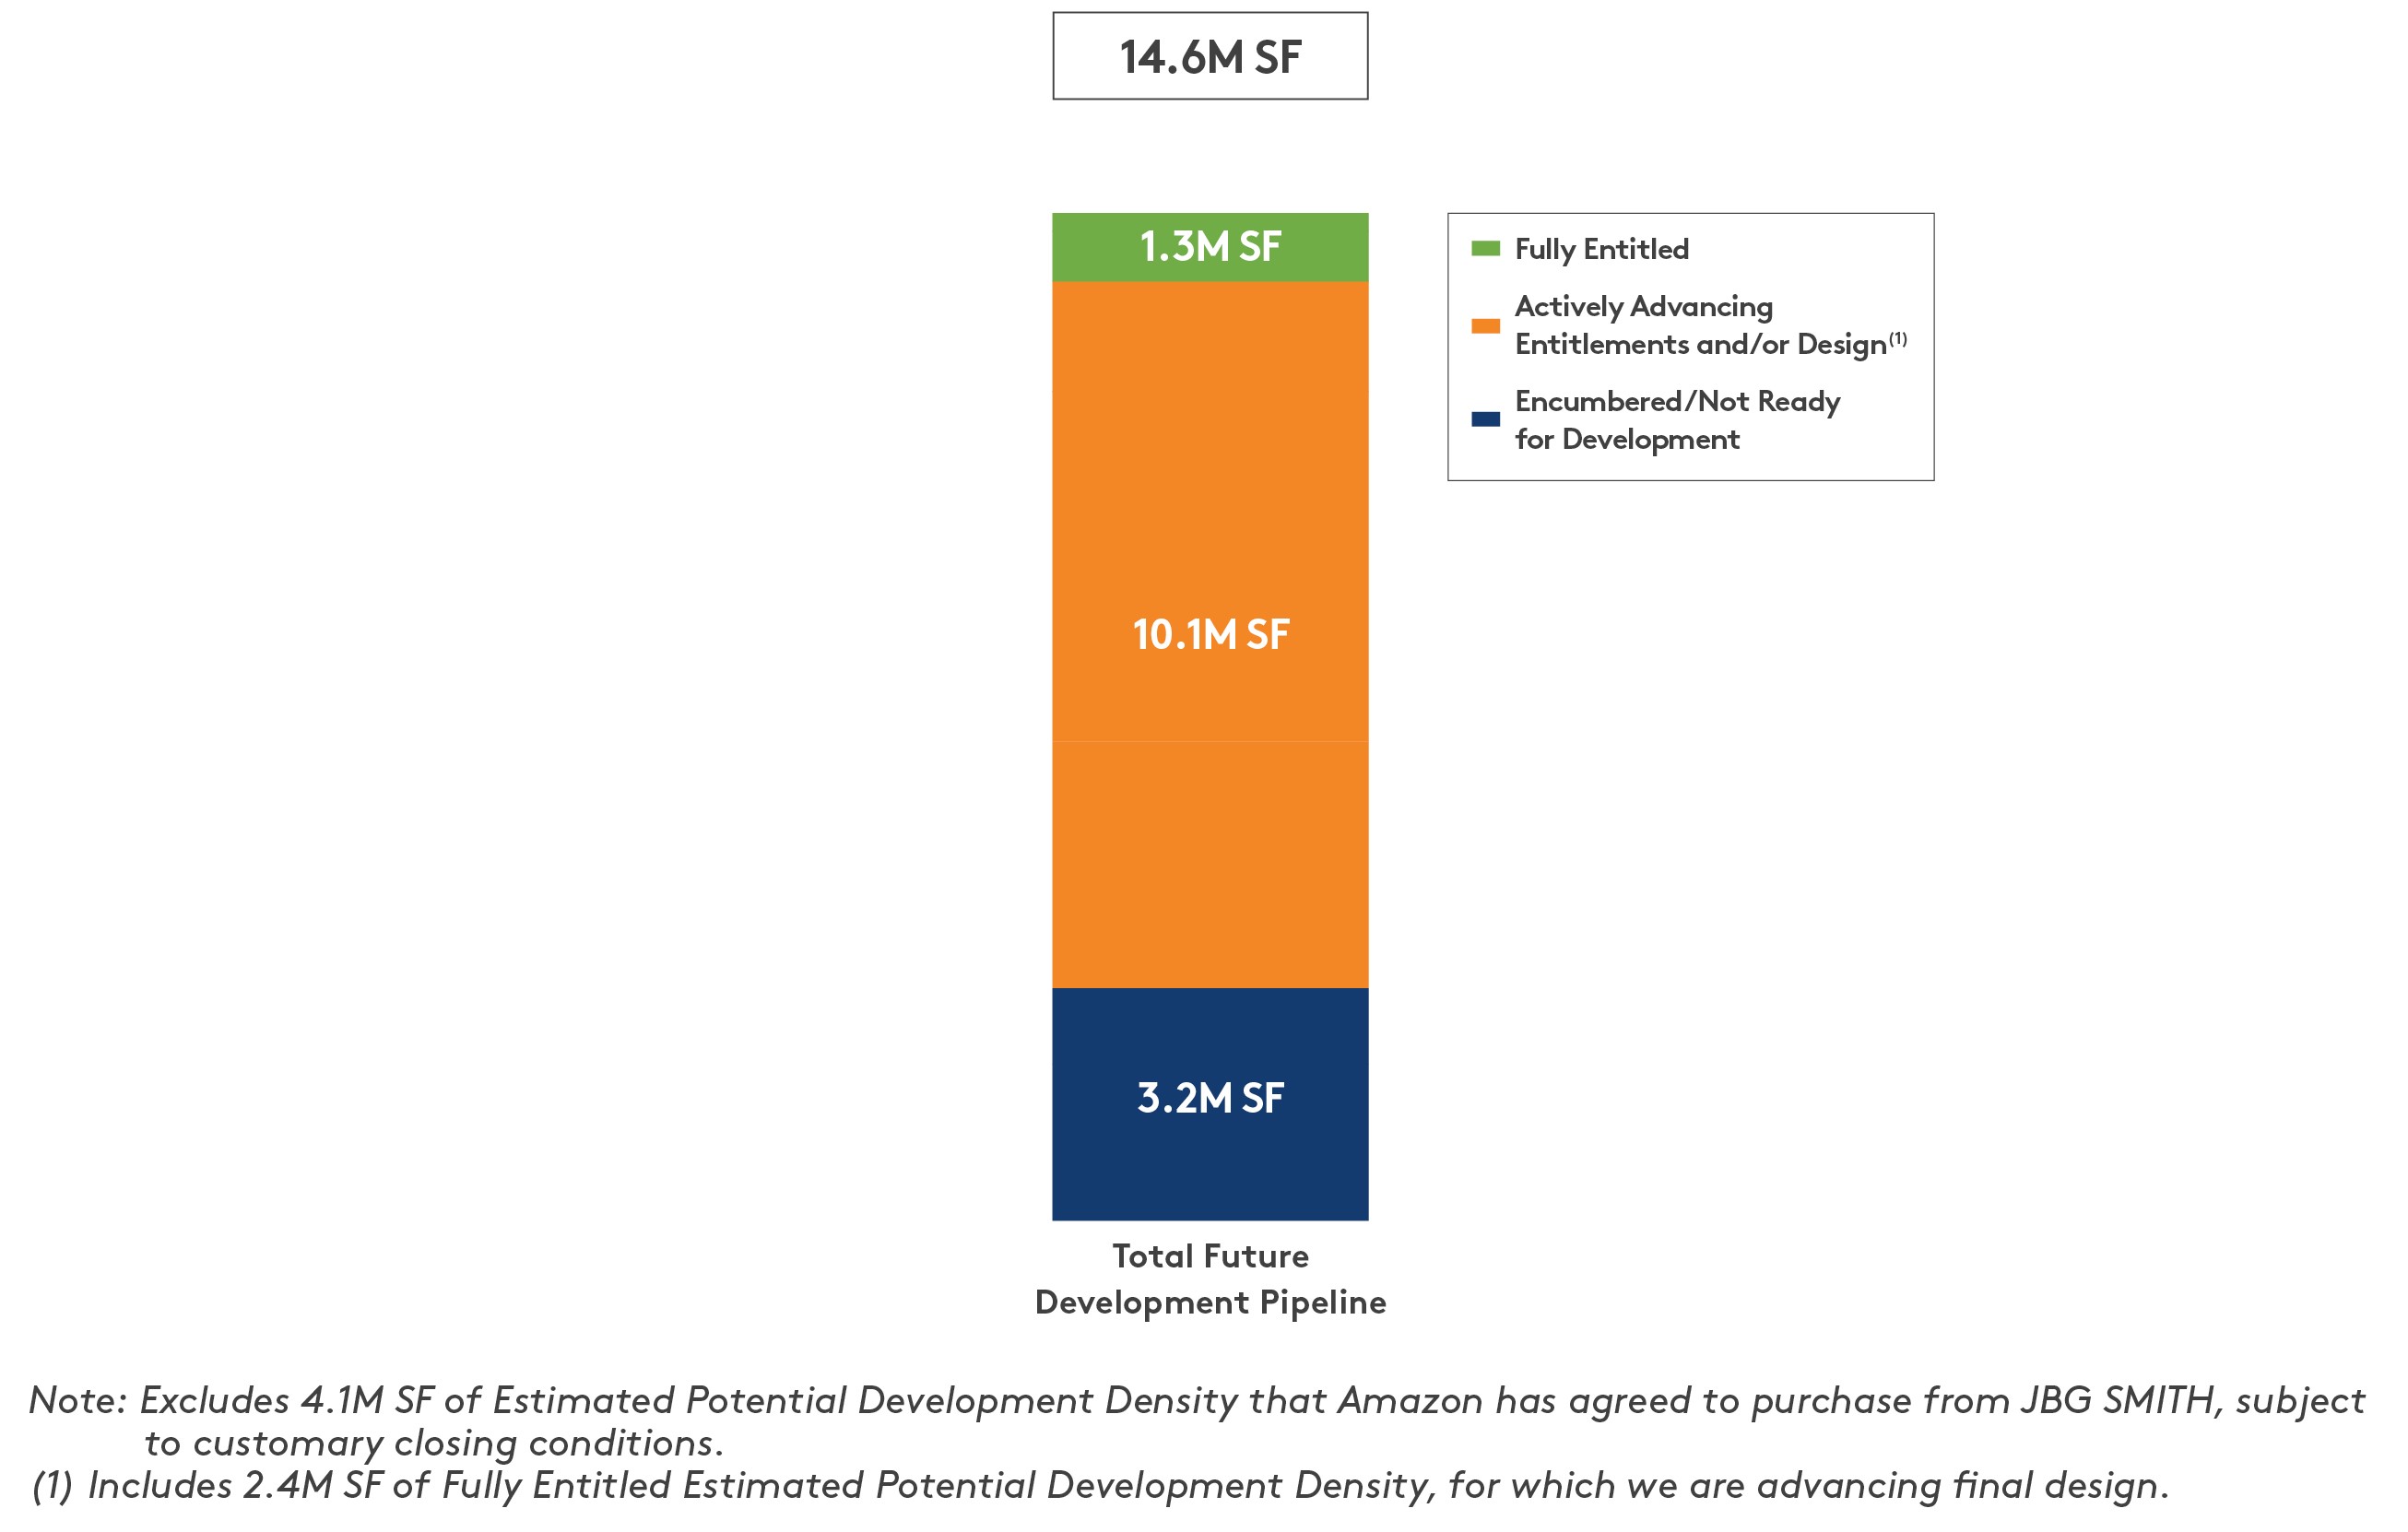
As impatient owners of land, we are always focused on mining value from unproductive assets. In addition to the approximately 4.4 million square feet of entitlements we are seeking in National Landing (1900 Crystal Drive and the 3.7 million square feet referenced above), we are actively advancing entitlement and design of an additional 5.7
million square feet within our 14.6 million square foot Future Development Pipeline (excluding the land held for sale to Amazon). Entitling this combined 10.1 million square feet of density will improve our ability to extract value from these opportunities either through development, sales, recapitalizations, and/or ground leases to third parties.
To maximize the abundant upside of our development portfolio, we continue to cultivate balance sheet capacity and position ourselves to invest both internally and externally when the cycle turns. In addition to our successful $472 million equity offering, we recycled $426 million of assets in 2019, and we expect to continue this opportunistic strategy in 2020 by marketing over $500 million of assets. Based on the current challenging investment sales market, and our opportunistic expectations as a seller, we expect to transact on at least $200 million in 2020. The strong balance sheet capacity we have created will allow us to allocate future capital to opportunities in the path of Amazon’s growth and other high-growth urban infill submarkets without relying on the sale of assets or equity. Positioning ourselves to capitalize on these tailwinds is key to our long-term growth and aligns with our unwavering focus on maximizing long-term net asset value (NAV) per share.
Delivering long-term growth requires prudent near-term capital allocation and excellent operational execution. To that end, our team accomplished a great deal during 2019, which put us well on our way to achieving significant long-term NAV growth per share. The following summarizes our achievements.
Launched Amazon’s 4.1 Million Square Foot New Headquarters
| |
| • | Executed leases with Amazon for approximately 857,000 square feet, including a new full building lease at 2100 Crystal Drive for 272,000 square feet with occupancy expected in 2020. |
| |
| • | Executed purchase and sale agreements with Amazon for land with 4.1 million square feet of estimated potential development density in National Landing. |
| |
| • | Received final approvals from Arlington County for the first 2.15 million square feet of space for Amazon’s new headquarters in National Landing. Construction commenced in January 2020. |
Increased Operating In Service Portfolio Leased Percentage from 91.2% to 92.5%
| |
| • | Leased over 2.1 million square feet of commercial space, bringing occupancy to 88.2% in our operating commercial portfolio. |
| |
| • | Proactively attracted tenant demand to National Landing, increasing our total commercial leased percentage from 88.3% to 91.5% with an average mark-to-market of positive 7.0% and net effective rent growth of 6.5%. |
| |
| • | Leased over 191,400 square feet of retail across the portfolio. In National Landing, leased 32,000 square feet of placemaking retail at Central District Retail, which was 75.2% pre-leased at the end of 2019. |
| |
| • | Achieved in service multifamily occupancy of 93.3%, and successfully completed West Half in the third quarter of 2019, which was 30.2% leased at the end of 2019. |
Completed Five Under Construction Assets Expected to Deliver $48 Million of Stabilized Annualized NOI
| |
| • | Completed five Under Construction assets on or ahead of schedule and delivered all below budget, including: 500 L’Enfant Plaza, West Half, 4747 Bethesda Avenue, Atlantic Plumbing C, and 1900 N Street, |
totaling 550,000 square feet and 721 units in the aggregate. The three commercial assets were 83.4% leased at the end of 2019.
| |
| • | We expect these five assets will deliver approximately $48 million of annualized NOI with a weighted average stabilization date of the second quarter of 2021. |
Increased Value and Readiness of 14.6 Million Square Foot Future Development Pipeline
| |
| • | Actively advancing entitlement and design of 10.1 million square feet (69%) of our Future Development Pipeline (excluding the land held for sale to Amazon). |
| |
| • | Submitted entitlements for 4.4 million square feet of space in National Landing, which represents approximately two-thirds of our Future Development Pipeline in the submarket. |
| |
| • | Made significant progress on entitling and designing the next tranche of multifamily development in National Landing, totaling approximately $1.4 billion of new investment and approximately 2,900 multifamily units. |
| |
| • | As master developer of the planned Virginia Tech Innovation Campus site, we advanced the overall plan in coordination with the directly adjacent 2.0 million square feet of development density we own in National Landing. |
Sold or Recapitalized $426 Million of Assets at or Above our Estimated NAV
| |
| • | Closed on the sale or recapitalization of four assets, totaling $426 million, including the Metropolitan Park land sites sold to Amazon for approximately $155 million (approximately $11 million above the estimated contract value) in January 2020. |
| |
| • | Executed a reverse like-kind exchange (with proceeds from the first Amazon land sale) for the acquisition of F1RST Residences, a multifamily asset in the Ballpark submarket of Washington, DC. |
Strengthened Balance Sheet - Pro forma Net Debt/Total Enterprise Value of 21.0%
| |
| • | Issued 11.5 million shares at $42.00 per share, raising net proceeds of approximately $472 million in our first equity offering. |
| |
| • | Recast our $1 billion credit facility in January 2020, extending the term for five years and reducing the interest rate. |
| |
| • | Raised capital and accumulated balance sheet capacity to develop 1900 Crystal Drive and to pursue future acquisition and development opportunities. |
| |
| • | Adjusted for the $155 million of proceeds from the land sale to Amazon in January 2020, our pro forma Net Debt/Adjusted EBITDA was 5.3x. |
Raised $104 Million for Affordable Housing and Achieved 4-Star GRESB Sustainability Rating
| |
| • | Raised over $104 million for the Washington Housing Initiative Impact Pool (including a $10.2 million commitment from JBG SMITH), which completed its first financing of a 326-unit residential building in Alexandria, Virginia in January 2020. Identified a pipeline to potentially preserve over 6,000 units of workforce affordable housing. |
| |
| • | Received a 4-star rating from GRESB for the second year in a row, ranking in the top quartile of mixed-use office and multifamily portfolios. |
Washington, DC Market Update
As the real estate cycle grows longer and pricing remains aggressive, it is worth noting that Washington, DC is a market with proven resilience to recession. In each of the last three national recessions, Washington, DC Metro area employment shrank by only 1.0% on average while other gateway cities shrank by an average of 3.0%. We believe that our focused investment in high-growth, infill locations with a heavy concentration around Amazon’s new headquarters in National Landing positions JBG SMITH to enjoy the best of all worlds in today’s investment climate - upside through exposure to the fast-growing technology sector and continued urban infill migration against the backdrop of the historically recession resilient DC Metro market.
For our detailed quarterly market update, please see the Appendix to this letter.
Capital Allocation
Since the spin-off, we have sold or recapitalized $1.4 billion of assets at values at or above our estimated NAV. Most of these assets were identified for sale because of their relatively low projected return potential. These sales were executed at very attractive cap rates and even more attractive “economic” cap rates when factoring in go-forward capital requirements. The assets sold or recapitalized would have required an additional $350 million of capital over the next five years, generating an average yield on total cost of 3.5%-4.0% over this time period and a stabilized 4.5%-5.0% yield on total cost. This 5-year stabilized yield is consistent with current market values indicating little to no upside at current market cap rates. By investing the proceeds from these sales into our higher growth development pipeline where we expect to earn an average yield of approximately 6.0%-6.5% on multifamily assets and 7.0%-7.5% on commercial assets, we believe we will deliver higher income and NAV growth over the long term.
Acquisitions
We continue to remain cautious on the acquisition front as a result of aggressive pricing across asset classes. That said, to fulfill our like-kind exchange needs, we expect to be multifamily buyers in the emerging growth submarkets where we are already concentrated and where we see strong rent growth potential. In December, we acquired F1RST Residences, a 325-unit multifamily asset in the Ballpark submarket of Washington, DC with approximately 21,000 square feet of street level retail, for approximately $161 million. The building is located one block from 1221 Van Street and West Half, our other multifamily holdings in the Ballpark submarket. The multifamily portion of the building was 91.7% occupied as of December 31, 2019. The proceeds from the sale of the Metropolitan Park land sites to Amazon completed the reverse like-kind exchange for F1RST Residences. We expect to complete the sale of the Pen Place land to Amazon in 2021, and we intend to identify a like-kind exchange acquisition for the proceeds from that sale.
Dispositions
We continued to be a net seller in 2019 with $426 million of asset sales and recapitalizations against our $400 million goal. We sold or recapitalized 1600 K Street, a 50% joint venture interest in Central Place Tower, Vienna Retail, and the Metropolitan Park land sites, which closed in January 2020. We sold Metropolitan Park to Amazon
for approximately $155 million, $11 million above the estimated contract value due to the development density that was ultimately approved. We completed each of these transactions at or above our estimated NAV.
We have identified over $500 million of additional recycling candidates that we expect to opportunistically market for sale in 2020, assuming market conditions remain supportive. Given the softening of demand for CBD office assets we saw in 2019, we believe it is prudent to expect to transact on at least $200 million of these sale candidates as some of these assets may not ultimately trade. Having already transacted on most of the low hanging fruit in the DC portion of our office portfolio, our current sale candidates are less “core” in nature and may not fetch compelling pricing if market conditions soften. While we intend to pursue these recycling opportunities aggressively, we are fortunate that we have the balance sheet strength to be opportunistic, and only transact if and when we can source capital at attractive levels.
For low-basis sale candidates, such as the land we are selling to Amazon, we plan to seek like-kind exchanges that would allow us to trade out of low-return assets into higher-yielding development opportunities or acquisitions with better long-term growth profiles. In the current environment, these are more likely to be multifamily assets in the emerging growth submarkets where we are already concentrated. We are also focused on opportunities to turn land assets into income streams via like-kind exchanges or ground leases.
Financial and Operating Metrics
For the year ended December 31, 2019, we reported net income attributable to common shareholders of $65.6 million and Core FFO attributable to common shareholders of $210.2 million or $1.61 per share. Same store NOI decreased 7.0% and we ended the year at 90.8% leased and 87.9% occupied. For second generation leases, the rental rate mark-to-market was positive 3.5%. As we have mentioned in the past, our mark-to-market will vary from quarter-to-quarter. That said, this level of performance exceeded our own expectations, which primarily reflects the positive commercial leasing environment in National Landing.
As expected, due to asset sales and the defensive blend-and-extend leasing strategy we implemented in 2017 and 2018, our NOI declined in 2019. Because (i) the concessions in our commercial portfolio have burned off to stabilized levels, (ii) we delivered five Under Construction assets on or ahead of schedule, and (iii) we acquired F1RST Residences, we expect our NOI to rebound in 2020. We do not, however, expect to see this NOI increase immediately flow through to Core FFO in 2020, primarily due to the reduction in capitalized interest from the delivery of our Under Construction assets. As these assets stabilize, we expect the increase in earnings to offset the increase in interest expense, which will increase Core FFO.
Operating Portfolio
For the three months ended December 31, 2019, our 10.7 million square foot operating commercial portfolio generated $246 million of annualized NOI and was 91.4% leased and 88.2% occupied. We completed 40 office lease transactions in our operating commercial portfolio totaling over 724,000 square feet, including 438,000 square feet of new leases and 286,000 square feet of renewals. For second-generation leases, the rental rate mark-to-market was positive 7.6%.
Our same store NOI increased 1.2% across our operating portfolio during the fourth quarter. As noted in prior quarters, throughout most of 2019, the concessions related to blend-and-extend leases signed in 2017 and 2018 significantly increased the portion of our portfolio that was in a free rent period. This elevated level of free rent has burned off and returned to a level consistent with long-term averages. It is worth noting that while we expect the burn-off of rental abatements to result in significant same store NOI growth in 2020, we do not expect this year’s elevated growth rate to continue over the longer term.
In 2019, we leased 2.1 million square feet of space, bringing the leased percentage of our commercial operating portfolio to 91.4% versus 89.6% at the end of 2018. We also increased our occupancy to 88.2% from 85.5% over this same period, a 270 basis point improvement. We achieved these leasing outcomes while also pushing rental rates across the portfolio, which is reflected in the positive 3.5% mark-to-market increase on rents across our portfolio in 2019 versus negative 6.6% in 2018.
In our operating multifamily portfolio, our leased percentage was 89.5% at year-end 2019 and 95.7% at year-end 2018, and our occupied percentage was 87.2% at year-end 2019 compared to 93.9% at year-end 2018. This decrease is a result of West Half, a recently delivered under construction asset, which completed in the third quarter of 2019 and was 30.2% leased as of the end of the fourth quarter. Our operating multifamily portfolio, comprising approximately 5,327 units, generated $82 million of annualized NOI. Our concentration in multifamily assets (based on square footage at share) increased to 30% at year-end 2019 from 26% at year-end 2018.
Development Portfolio
Over the course of 2019, we completed two new multifamily assets - West Half and Atlantic Plumbing C, and three new office assets - 500 L’Enfant Plaza, 1900 N Street, and 4747 Bethesda Avenue, which in aggregate were 83.4% leased as of the end of the fourth quarter. All five assets delivered on or ahead of schedule and below budget.
As of December 31, 2019, our development portfolio consisted of seven assets totaling 1.5 million square feet currently under construction and a Future Development Pipeline totaling 18.7 million square feet. Excluding the land held for sale to Amazon, our pipeline was 14.6 million square feet. Of the 1.5 million square feet in our Under Construction portfolio, 700,000 square feet is multifamily and 800,000 square feet is commercial, which is 86.8% pre-leased.
Under Construction
At the end of the fourth quarter, our seven assets under construction all had guaranteed maximum price construction contracts in place. These assets have weighted average estimated completion and stabilization dates of the third quarter of 2020 and the third quarter of 2021, respectively, with a projected NOI yield based on Estimated Total Project Cost of 6.4%. We expect our Under Construction assets to deliver $56.2 million of annualized NOI.
Near Term Development
We did not have any assets in the Near Term Development pipeline at the end of the fourth quarter. As a reminder, we only place assets into our Near Term Development Pipeline when they have completed the entitlement process and when we intend to commence construction within 12 to 18 months, subject to market conditions. We expect to commence construction on 1900 Crystal Drive in the first quarter, upon receipt of full entitlements from Arlington County. We are also focused on completing design and entitlements for the next tranche of multifamily development opportunities in National Landing including, 2000 and 2001 South Bell Street, 222 23rd Street, and 2525 Crystal Drive, all of which are within a ½ mile of Amazon’s new headquarters. This pipeline includes approximately 2,100 units and is still subject to final entitlements from Arlington County. Subject to market conditions, including today’s escalating construction cost environment, we could be in a position to deliver these projects over the next four to five years. Based on current market conditions these projects would represent an estimated total investment of approximately $1.0 billion and a potential stabilized NOI of between $60 and $65 million.
If we execute these planned multifamily developments in National Landing, without assuming any additional capital recycling activity, we expect our leverage will stabilize in the mid 6x’s, with interim peak levels in the mid 8x’s at the front end of this period.
Future Development Pipeline
As of December 31, 2019, our Future Development pipeline comprises 18.7 million square feet, with an Estimated Total Investment per square foot of approximately $40.52. Excluding the land held for sale to Amazon, our pipeline was 14.6 million square feet. At the end of the fourth quarter, 58.9% of this pipeline was in National Landing, 18.6% was in DC, 13.9% was in Reston, and the remaining 8.6% was in other Virginia and Maryland submarkets. Our DC holdings are concentrated in the fast-growing emerging submarkets of Union Market and Ballpark, and our Reston holdings include one of the best development sites on the Metro, adjacent to Reston Town Center.
Over the course of 2019, we actively advanced the entitlement and design of 10.1 million square feet (69%) of our Future Development Pipeline. This includes the 4.4 million square feet that we submitted for entitlement in National Landing, which is approximately two-thirds of our pipeline in National Landing. Of the remaining 4.5 million square feet, we continue to seek opportunities to monetize our Future Development Pipeline, either through land sales or ground lease structures, as we did with 1700 M Street in 2018.
The following bar chart describes the stage of entitlement of our Future Development Pipeline:
Third-Party Asset Management and Real Estate Services Business
Revenue from our third-party asset management and real estate services business was $16.0 million in the fourth quarter, primarily driven by $5.1 million in property management fees, $4.7 million in development fees, and $3.4 million in asset management fees. The portion of total revenues associated with the JBG Legacy Funds was $5.1 million (approximately 32.2% of total third-party revenue). The JBG Legacy Funds continued to focus on disposing of assets in accordance with their underlying business plans. We expect the fees from retaining management and leasing of sold assets, the Amazon-related fees that we expect to receive, any fee income associated with the Washington Housing Initiative, and other third-party fee income streams to offset the wind down of the JBG Legacy Fund business over time.
Balance Sheet
As of December 31, 2019, we had $126.4 million of cash ($136.2 million of cash at share), $898.5 million available under our credit facility, and over $800 million of multifamily borrowing capacity from our Operating and Under Construction multifamily assets. Our Net Debt/Total Enterprise Value was 22.5%, using our share price at February 21, 2019, and our Net Debt/Adjusted EBITDA was 5.8x. Our Net Debt/Adjusted EBITDA metric includes the short-term impact of a $200 million draw on our credit facility to fund the F1RST Residences acquisition, which was part of the reverse like-kind exchange of the Metropolitan Park land sale to Amazon. Adjusted for the $155 million of proceeds from the land sale to Amazon in January 2020, our pro forma Net Debt/Total Enterprise Value was 21.0%
and our pro forma Net Debt/Adjusted EBITDA was 5.3x. Given that these leverage metrics include the debt incurred to date to develop our seven Under Construction assets, but none of the estimated NOI from those assets, we believe Net Debt/Total Enterprise Value is the most meaningful measure to evaluate our leverage. Our long-term leverage targets remain unchanged at 25% to 35% Net Debt/Total Enterprise Value and between 6x and 7x Net Debt/Adjusted EBITDA, with peak levels in the mid-8x’s during periods of more active development. Based on these long-term leverage targets, we believe that we have ample balance sheet capacity to develop 1900 Crystal Drive and the next tranche of multifamily developments in National Landing without any additional asset sales or capital transactions.
We continue to focus on maintaining a well-laddered debt maturity profile. As of December 31, 2019, our weighted average interest rate was 4.0%, and our average debt maturity was 3.5 years, with approximately $513 million coming due in the next two years. Consistent with our strategy to finance our business primarily with non-recourse, asset-level financing, 74.5% of our consolidated and unconsolidated debt is property-level mortgage debt, of which only approximately $8.3 million is recourse to JBG SMITH. Our debt is 74.8% fixed rate, and we have rate caps in place for 33.3% of our floating rate debt.
Over the course of 2019, we were very active in the debt markets. We closed or modified 8 loans totaling $737 million and repaid $709 million of debt. The weighted average interest rate of the repaid debt was 4.05%, generating $28.7 million of annual interest expense savings. In early January, we amended and extended our existing revolving credit facility, which was set to mature on July 16, 2021. The recast $1.0 billion revolving credit facility extends the maturity date for five years to January 7, 2025, with a slight reduction in the interest rate. We were very pleased with the demand to participate in the recast of our credit facility, which solidified our strong balance sheet by giving us financial flexibility to execute on the significant development opportunities in our portfolio.
Environmental, Social, and Governance
In December 2019, we closed on another round of funding for the Washington Housing Initiative Impact Pool (the “Impact Pool”), bringing the total to approximately $104 million, including a $10.2 million commitment from JBG SMITH. We launched the Washington Housing Initiative (WHI) in partnership with the Federal City Council in 2018 to preserve or build up to 3,000 units of affordable workforce housing in the Washington, DC region over the next decade. The WHI includes a third-party non-profit, the Washington Housing Conservancy, and the Impact Pool, the JBG SMITH-managed financing component of the WHI. The Impact Pool has a targeted size of $150 million, of which we expect to contribute up to 9.75%.
In January 2020, the Impact Pool made its first investment, providing approximately $15 million of mezzanine financing for the Alexandria Housing Development Corporation (AHDC) to acquire Avana - renamed Parkstone - a recently renovated 326-unit, high rise residential community in Alexandria, Virginia for $106 million. Currently, most of the units at Parkstone are naturally occurring workforce housing with rents affordable to middle-income renters. Using the Impact Pool loan, AHDC will commit to keep the property affordable for middle-income renters through long-term covenants, in addition to making investments to ensure it remains high-quality housing. JBG SMITH will
be the property manager for Parkstone. In addition to this recent investment, the Impact Pool is currently evaluating a pipeline of financings that could preserve nearly 6,000 units of affordable workforce housing across the DC region.
On the corporate governance front, we regularly review best practices and proactively engage with investors on these issues. Accordingly, we recently amended our Bylaws to provide for a majority (rather than plurality) voting standard in uncontested trustee elections.
* * *
As we look ahead into 2020 and beyond, we believe that JBG SMITH is at the front end of a significant wave of growth, and that we are only getting started. The capital allocation decisions we have made over the past few years are bearing fruit, and we anticipate strong growth in our NAV per share as a result. Similarly, the investment opportunities ahead are substantial, and we will pursue them with an obsessive focus on maximizing long-term value. Indeed, we find ourselves in the fortunate position of investing ahead of the tailwinds of Amazon’s expected significant growth, while also enjoying the solid foundation of the historically recession resilient DC market. This combination is especially important given the length of the current real estate cycle and our strong capital position.
We appreciate the continued strong interest in our company, and we encourage you to visit our real estate and spend time with our team. We remain focused on the significant opportunities in front of us, and we will continue to work hard to maintain your trust and confidence.
W. Matthew Kelly
Chief Executive Officer
Appendix
Washington, DC Market Update
Economy
The region’s job growth and office absorption continue to be concentrated in a thriving Northern Virginia. 55% of the region’s overall 2019 job growth (37,000 jobs) was in Northern Virginia, driving 84% of the net absorption in the overall market. This level of regional job growth is in line with the area’s historic long-term average of approximately 40,000 jobs per year and is largely attributable to a surging professional and business services industry, which accounted for 40% of the region’s total job growth. Much of that growth is in cloud computing and cyber security - two areas where federal defense spending is translating into private sector growth. High paying professional services jobs translate into apartment and, to a lesser extent, office demand. By contrast, the federal government continues to be stagnant from a hiring perspective and contributes relatively little net new office demand. As Amazon moves into its first full year of hiring, we expect the region’s diversification away from federal employment drivers to accelerate even further.
Office
Supply and demand fundamentals in Northern Virginia continue to strengthen particularly along the Metro corridor between the tech-talent clusters of National Landing and Reston where professional services job growth is concentrated. In addition to strong demand, supply levels in Northern Virginia remain adequate but not excessive. Despite two new speculative projects (380,000 square feet of available space) breaking ground in the fourth quarter, only roughly 800,000 square feet of speculative office space is scheduled to deliver within the next two years, representing less than 1% of Northern Virginia supply. Given that the bulk of the region’s demand is in submarkets with limited supply, favorable conditions exist for rent growth in the most desirable locations, even while Northern Virginia’s overall vacancy remains relatively high at 17% (having fallen from 20% and 19% in 2017 and 2018, respectively). The contradiction between a high vacancy rate and selective pockets of rent growth continues to highlight the difference between desirable and undesirable locations. Locations with high-quality, walkable amenities continue to outperform, almost irrespective of the level of distress for locations that lack these attributes. National Landing, for example, benefitted from 400,000 square feet of positive absorption in 2019, and continues to exhibit improving office market fundamentals, with occupancy levels up 4% and rents up 17% over fourth quarter 2018 levels. JLL also reports that rents for new construction trophy assets in National Landing are now on par with those in other core Northern Virginia submarkets like the Rosslyn-Ballston Corridor and Reston. While we have not seen enough office trades to judge the impact of these improved fundamentals on investor demand, we expect to see increased interest and pricing based on these trends.
Despite improving fundamentals in Northern Virginia, the outlook in downtown DC remains less sanguine. The 12% vacancy level is the highest it has been in a decade, though it is largely static year-over-year. Direct net absorption for the year was positive by only 525,000 square feet, significantly down from the 10-year peak of 3 million square feet in 2010, and a slight decrease from the 540,000 square feet of positive absorption in 2018. That said, most of this absorption was driven by emerging submarkets, which continue to be a bright spot, with approximately 1.2 million square feet of positive absorption, including a few notable GSA moves such as the Department of Justice
(500,000 square feet) and Peace Corps (176,000 square feet), versus approximately 690,000 of negative absorption in the balance of DC, according to JLL. This negative absorption is exacerbated by a pipeline of new deliveries that remains elevated, with roughly 3.6 million square feet delivering in 2019 and another 4 million square feet under construction. The emerging DC markets account for just 522,000 square feet of 2019 deliveries and 1.5 million square feet of under construction assets, which are 87% pre-leased. In comparison, non-emerging DC markets account for nearly 3.1 million square feet of 2019 deliveries and 2.5 million square feet of assets under construction, which are only 28% pre-leased.
This data suggests that, given the favorable supply-demand dynamics, emerging DC markets will continue to outperform non-emerging DC markets. For several quarters we have been predicting that continued trophy oversupply and tenant preference for amenity-rich, emerging markets will put pressure on commodity Class A assets, which will in turn, put pressure on Class B assets. It appears that the pricing spread between Class A and Class B has narrowed to a point where Class B tenants are making the jump to better-quality product. We have seen that phenomenon play out with JLL reporting a continued decline in commodity Class A vacancy, now at its lowest level (12.8%) since 2015, and a corresponding uptick in Class B vacancy, now at a historical high (12.3%). This movement also indicates that, after protracted vacancy, many commodity Class A buildings have dropped their rents (a current discount of 28% to trophy product) and/or increased concessions to levels necessary to lease the buildings. With overall annual rents in DC proper down (-1%) for the first time in a decade, we expect to continue to see elevated concessions across all classes.
Multifamily
We continue to be encouraged by strong multifamily fundamentals across the region. Combined deliveries remain consistently on track at approximately 14,000 units expected to deliver in 2020 and 2021. As a reminder, this level is roughly on par with the 2014 single-year peak of 15,000 deliveries. With less than 200 units commencing construction in the fourth quarter, the pipeline appears to be declining with just under 1,400 units currently under construction for delivery in 2022. We believe that the shrinking pipeline will be particularly impactful in DC emerging markets where same store Class A market rents have grown by 4.1% over the past two years according to CoStar data, with average stabilization of 16 months for newly delivered buildings with a typical size of 260 units since 2015. As a reminder, our DC multifamily properties are concentrated in those emerging submarkets. We believe approximately 6,000 units will deliver in emerging markets through 2021, representing roughly 29% of the existing inventory as of the end of 2019. As amenity and population growth continue in these emerging markets, we maintain our belief in the eventual convergence of emerging market rents with those in mature markets. As of the fourth quarter, we have seen the spread between emerging and mature market rents narrow by over 5% in buildings delivered since 2015.
Office Sales
Following a spike in third quarter activity totaling $2.1 billion, investor activity within DC proper slowed, ending the fourth quarter at $690 million. The total sales volume of approximately $4.1 billion for the year finished well above the five-year low of $2.9 billion in 2016, but below the 2017 and 2018 levels of approximately $5 billion. Buyers in fourth quarter transactions were mostly high-net worth and domestic buyers, with foreign capital remaining largely on the sidelines. According to JLL, assets with a value-add profile accounted for 12 of the first 16 single-asset
trades in the first half of 2019, most likely in response to the aggressive price tags of Class A and Trophy. The recent sales of 815 Connecticut Avenue and 901 15th Street, both well-leased trophy and Class A buildings, priced at low-5% cap rates, above the 24-month trophy average of 4.8%, according to JLL.
Multifamily Sales
In 2019, multifamily volume reached $7 billion - far higher than the $3.7 to $4.5 billion we have seen in the past three years. This volume increase was almost entirely suburban product, with 76% of 2019 transactions outside urban markets, according to CoStar data for the DC Metro Region. The suburban volume is mostly attributable to significant large portfolio sales, totaling approximately $2 billion, which reflects portfolio re-alignments by large owners and a hunger for value-add suburban deals among investors. Downtown Class A trades were rare and competitively priced, with average cap rates of 4.4% over the past 12 months. According to CoStar, National Landing is an even more competitive environment with trailing 12-month cap rates averaging 3.7%.
FOR IMMEDIATE RELEASE 
CONTACT
Jaime Marcus
SVP, Investor Relations and Corporate Communications
(240) 333-3643
jmarcus@jbgsmith.com
JBG SMITH ANNOUNCES FOURTH QUARTER 2019 RESULTS
Chevy Chase, MD (February 25, 2020) - JBG SMITH (NYSE: JBGS), a leading owner and developer of high-growth, mixed-use properties in the Washington, DC market, today filed its Form 10-K for the year ended December 31, 2019 and reported its financial results.
Additional information regarding our results of operations, properties and tenants can be found in our Fourth Quarter 2019 Investor Package, which is posted in the Investor Relations section of our website at www.jbgsmith.com.
Fourth Quarter 2019 Financial Results
| |
| • | Net income attributable to common shareholders was $34.4 million, or $0.25 per diluted share. |
| |
| • | Funds From Operations (“FFO”) attributable to common shareholders was $30.4 million, or $0.23 per diluted share. |
| |
| • | Core Funds From Operations (“Core FFO”) attributable to common shareholders was $52.8 million, or $0.39 per diluted share. |
Year Ended December 31, 2019 Financial Results
| |
| • | Net income attributable to common shareholders was $65.6 million, or $0.48 per diluted share. |
| |
| • | FFO attributable to common shareholders was $150.6 million, or $1.15 per diluted share. |
| |
| • | Core FFO attributable to common shareholders was $210.2 million, or $1.61 per diluted share. |
Operating Portfolio Highlights
| |
| • | Annualized Net Operating Income (“NOI”) for the three months ended December 31, 2019 was $328.2 million, compared to $313.2 million for the three months ended September 30, 2019, at our share. |
| |
| • | The operating commercial portfolio was 91.4% leased and 88.2% occupied as of December 31, 2019, compared to 90.2% and 86.8% as of September 30, 2019, at our share. |
| |
| • | The operating multifamily portfolio was 89.5% leased and 87.2% occupied as of December 31, 2019, compared to 96.5% and 94.9% as of September 30, 2019, at our share. The decreases are due in part to the movement of West Half into our recently delivered operating assets during the quarter. The in service operating multifamily portfolio was 95.1% leased and 93.3% occupied as of December 31, 2019. |
| |
| • | Executed approximately 724,000 square feet of office leases at our share in the fourth quarter, comprising approximately 173,000 square feet of new leases and approximately 551,000 square feet of second generation |
leases, which generated a 15.5% rental rate increase on a GAAP basis and a 7.6% rental rate increase on a cash basis.
| |
| • | Executed approximately 2.1 million square feet of commercial leases at our share during the year ended December 31, 2019, comprising approximately 938,000 square feet of new leases and approximately 1.2 million square feet of second generation leases, which generated a 9.7% rental rate increase on a GAAP basis and a 3.5% rental rate increase on a cash basis. The new leases include leases totaling approximately 857,000 square feet to date at five office buildings in our National Landing portfolio executed by Amazon.com, Inc. ("Amazon") in conjunction with the establishment of their additional headquarters, which is inclusive of 272,000 square feet of office space executed in December at 2100 Crystal Drive in National Landing. |
| |
| • | Same Store Net Operating Income (“SSNOI”) at our share increased 1.2% to $74.9 million for the three months ended December 31, 2019, compared to $74.1 million for the three months ended December 31, 2018. SSNOI decreased 7.0% to $292.3 million for the year ended December 31, 2019, compared to $314.1 million for the year ended December 31, 2018. The increase in SSNOI for the three months ended December 31, 2019 is largely attributable to decreased ground rent expense. The decrease in SSNOI for the year ended December 31, 2019 is largely attributable to increased rental abatements and rent reductions, and an increase in assumed lease liability payments. The lease renewals we executed in 2017 and 2018 have reduced our NOI in 2019, primarily due to free rent associated with these early renewals. Because (i) the concessions in our commercial portfolio have burned off to stabilized levels, (ii) we delivered Under Construction assets on or ahead of schedule, and (iii) we acquired F1RST Residences, we expect NOI to rebound in 2020. We do not, however, expect to see this NOI increase immediately flow through to Core FFO in 2020, primarily due to the reduction in capitalized interest from the delivery of our Under Construction assets. As these assets stabilize, we expect the increase in earnings to offset the increase in interest expense which will increase Core FFO. |
The reported same store pools as of December 31, 2019 include only the assets that were in service for the entirety of both periods being compared.
Development Portfolio Highlights
Under Construction
| |
| • | During the quarter ended December 31, 2019, there were seven assets under construction (four commercial assets and three multifamily assets), consisting of approximately 821,000 square feet and 833 units, both at our share. |
| |
| • | During the quarter ended December 31, 2019, we completed 4747 Bethesda, Atlantic Plumbing C and 1900 N Street, all delivered on or ahead of schedule and below budget. |
Near-Term Development
| |
| • | As of December 31, 2019, there were no assets in near-term development. |
Future Development Pipeline
| |
| • | As of December 31, 2019, there were 40 future development assets consisting of 18.7 million square feet of estimated potential density at our share, including the 4.1 million square feet held for sale to Amazon. |
Third-Party Asset Management and Real Estate Services Business
For the three months ended December 31, 2019, revenue from third-party real estate services, including reimbursements, was $29.1 million. Excluding reimbursements and service revenue from our interests in consolidated and unconsolidated real estate ventures, revenue from our third-party asset management and real
estate services business was $16.0 million, primarily driven by $5.1 million of property management fees, $4.7 million of development fees, $3.4 million of asset management fees and $2.0 million of leasing fees.
Balance Sheet
| |
| • | We had $1.6 billion of debt ($2.0 billion including our share of debt of unconsolidated real estate ventures) as of December 31, 2019. Of the $2.0 billion of debt at our share, approximately 75% was fixed-rate and rate caps were in place for approximately 33% of our floating rate debt. |
| |
| • | The weighted average interest rate of our debt at share was 4.03% as of December 31, 2019. |
| |
| • | As of December 31, 2019, our total enterprise value was approximately $8.1 billion, comprising 149.3 million common shares and units valued at $6.2 billion (calculated using our closing share price as of February 21, 2020) and debt (net of premium / (discount) and deferred financing costs) at our share of $1.9 billion, less cash and cash equivalents at our share of $136.2 million. |
| |
| • | As of December 31, 2019, we had $126.4 million of cash and cash equivalents ($136.2 million of cash and cash equivalents at our share), $898.5 million of capacity under our credit facility, and an unencumbered multifamily borrowing base of approximately $811.0 million, including our Under Construction multifamily assets. |
| |
| • | Net Debt to Annualized Adjusted EBITDA at our share for the three months and year ended December 31, 2019 was 5.8x for both periods and our Net Debt / Total Enterprise Value was 22.5% as of December 31, 2019 (calculated using our closing share price as of February 21, 2020). Pro forma Net Debt to Annualized Adjusted EBITDA at our share would have been 5.3x for the three months and year ended December 31, 2019, and pro forma Net Debt / Total Enterprise Value would have been 21.0% as of December 31, 2019, which includes the $155.0 million of net proceeds from the sale of Metropolitan Park in January 2020. |
Financing and Investing Activities
| |
| • | Acquired F1RST Residences, a 325-unit multifamily asset in the Ballpark submarket of Washington, DC with approximately 21,000 square feet of street level retail, for a purchase price of approximately $160.5 million. The multifamily portion of the building is 91.7% occupied as of December 31, 2019. We used F1RST Residences as a replacement property in a like-kind exchange for the proceeds from the sale of Metropolitan Park to Amazon, which was completed in January 2020. |
| |
| • | Sold a 50.0% interest in a real estate venture that owns Central Place Tower, a 552,000 square foot commercial asset located in Arlington, Virginia. |
| |
| • | Sold Vienna Retail, an 8,600 square foot commercial asset located in Vienna, Virginia, for $7.4 million. |
| |
| • | Drew $200.0 million under the revolving credit facility, which was repaid in 2020. |
Subsequent to December 31, 2019:
| |
| • | Sold Metropolitan Park to Amazon for $155.0 million, which represents an $11.0 million increase over the previously estimated contract value resulting from an increase in the approved development density on the sites. |
| |
| • | Amended our credit facility to extend the maturity date of the revolving credit facility to January 2025. |
| |
| • | Entered into a mortgage loan with a principal balance of $175.0 million collateralized by 4747 and 4749 Bethesda Avenue. |
Dividends
In December 2019, our Board of Trustees declared a quarterly dividend of $0.225 per common share, which was paid on January 8, 2020 to shareholders of record as of December 27, 2019.
About JBG SMITH
JBG SMITH is an S&P 400 company that owns, operates, invests in and develops a dynamic portfolio of high-growth mixed-use properties in and around Washington, DC. Through an intense focus on placemaking, JBG SMITH cultivates vibrant, amenity-rich, walkable neighborhoods throughout the Capital region, including National Landing where it now serves as the exclusive developer for Amazon’s new headquarters. JBG SMITH’s portfolio currently comprises 20.8 million square feet of high-growth office, multifamily and retail assets, 98% at our share of which are Metro-served. It also maintains a robust future pipeline encompassing 18.7 million square feet of mixed-use development opportunities. For more information on JBG SMITH please visit www.jbgsmith.com.
Forward Looking Statements
Certain statements contained herein may constitute “forward-looking statements” as such term is defined in Section 27A of the Securities Act of 1933, as amended, and Section 21E of the Securities Exchange Act of 1934, as amended. Forward-looking statements are not guarantees of performance. They represent our intentions, plans, expectations and beliefs and are subject to numerous assumptions, risks and uncertainties. Consequently, the future results of JBG SMITH Properties (“JBG SMITH”, the “Company”, "we", "us", "our" or similar terms) may differ materially from those expressed in these forward-looking statements. You can find many of these statements by looking for words such as “approximate”, "hypothetical", "potential", “believes”, “expects”, “anticipates”, “estimates”, “intends”, “plans”, “would”, “may” or similar expressions in this earnings release. We also note the following forward-looking statements: our anticipated dispositions and like-kind exchanges, our indicated annual dividend per share and dividend yield, annualized net operating income; in the case of our construction and near-term development assets, estimated square feet, estimated number of units and in the case of our future development assets, estimated potential development density; expected key Amazon transaction terms and timeframes for closing of any Amazon transactions not yet closed, planned infrastructure improvements related to Amazon's additional headquarters; the economic impacts of Amazon's additional headquarters on the DC region and National Landing; our development plans related to Amazon's additional headquarters; the expected accretion to our net asset value ("NAV") as a result of the Amazon transaction and our future NAV growth rate; in the case of any further Amazon lease transactions and our new development opportunities in National Landing, the total square feet to be leased to Amazon and the expected net effective rent, estimated square feet, estimated number of units, the estimated construction start and occupancy dates, estimated incremental investment, projected NOI yield; and in the case of our future development opportunities, estimated potential development density. Many of the factors that will determine the outcome of these and our other forward-looking statements are beyond our ability to control or predict. These factors include, among others: adverse economic conditions in the Washington, DC metropolitan area, the timing of and costs associated with development and property improvements, financing commitments, and general competitive factors. For further discussion of factors that could materially affect the outcome of our forward-looking statements and other risks and uncertainties, see “Risk Factors” and the Cautionary Statement Concerning Forward-Looking Statements in the Company's Annual Report on Form 10-K for the year ended December 31, 2019 and other periodic reports the Company files with the Securities and Exchange Commission. For these statements, we claim the protection of the safe harbor for forward-looking statements contained in the Private Securities Litigation Reform Act of 1995. You are cautioned not to place undue reliance on our forward-looking statements. All subsequent written and oral forward-looking statements attributable to us or any person acting on our behalf are expressly qualified in their entirety by the cautionary statements contained or referred to in this section. We do not undertake any obligation to release publicly any revisions to our forward-looking statements after the date hereof.
We are reiterating the assumptions in our estimated NOI bridge and the potential estimated NAV impact from Amazon in National Landing, which can be found in our Spring 2019 Investor Day presentation on our website at http://investors.jbgsmith.com/presentations.
Pro Rata Information
We present certain financial information and metrics in this release “at JBG SMITH Share,” which refers to our ownership percentage of consolidated and unconsolidated assets in real estate ventures (collectively, “real estate ventures”) as applied to these financial measures and metrics. Financial information “at JBG SMITH Share” is calculated on an asset-by-asset basis by applying our percentage economic interest to each applicable line item of that asset’s financial information. “At JBG SMITH Share” information, which we also refer to as being “at share,” “our pro rata share” or “our share,” is not, and is not intended to be, a presentation in accordance with GAAP. Given that a substantial portion of our assets are held through real estate ventures, we believe this form of presentation, which presents our economic interests in the partially owned entities, provides investors valuable information regarding a significant component of our portfolio, its composition, performance and capitalization.
We do not control the unconsolidated real estate ventures and do not have a legal claim to our co-venturers’ share of assets, liabilities, revenue and expenses. The operating agreements of the unconsolidated real estate ventures generally allow each co-venturer to receive cash distributions to the extent there is available cash from operations. The amount of cash each investor receives is based upon specific provisions of each operating agreement and varies depending on certain factors including the amount of capital contributed by each investor and whether any investors are entitled to preferential distributions.
With respect to any such third-party arrangement, we would not be in a position to exercise sole decision-making authority regarding the property, real estate venture or other entity, and may, under certain circumstances, be exposed to economic risks not present were a third-party not involved. We and our respective co-venturers may each have the right to trigger a buy-sell or forced sale arrangement, which could cause us to sell our interest, or acquire our co-venturers’ interests, or to sell the underlying asset, either on unfavorable terms or at a time when we otherwise would not have initiated such a transaction. Our real estate ventures may be subject to debt, and the repayment or refinancing of such debt may require equity capital calls. To the extent our co-venturers do not meet their obligations to us or our real estate ventures or they act inconsistent with the interests of the real estate venture, we may be adversely affected. Because of these limitations, the non-GAAP “at JBG SMITH Share” financial information should not be considered in isolation or as a substitute for our financial statements as reported under GAAP.
Non-GAAP Financial Measures
This release includes non-GAAP financial measures. For these measures, we have provided an explanation of how these non-GAAP measures are calculated and why JBG SMITH’s management believes that the presentation of these measures provides useful information to investors regarding JBG SMITH’s financial condition and results of operations. Reconciliations of certain non-GAAP measures to the most directly comparable GAAP financial measure are included in this earnings release. Our presentation of non-GAAP financial measures may not be comparable to similar non-GAAP measures used by other companies. In addition to "at share" financial information, the following non-GAAP measures are included in this release:
Earnings Before Interest, Taxes, Depreciation and Amortization ("EBITDA"), EBITDA for Real Estate ("EBITDAre") and Adjusted EBITDA
Management uses EBITDA and EBITDAre, non-GAAP financial measures, as supplemental operating performance measures and believes they help investors and lenders meaningfully evaluate and compare our operating performance from period-to-period by removing from our operating results the impact of our capital structure (primarily interest charges from our outstanding debt and the impact of our interest rate swaps) and certain non-cash expenses (primarily depreciation and amortization on our assets). EBITDAre is computed in accordance with the definition established by the National Association of Real Estate Investment Trusts (“NAREIT”). NAREIT defines EBITDAre as GAAP net income (loss) adjusted to exclude interest expense, income taxes, depreciation and
amortization expenses, gains on sales of real estate and impairment losses of real estate, including our share of such adjustments of unconsolidated real estate ventures. These supplemental measures may help investors and lenders understand our ability to incur and service debt and to make capital expenditures. EBITDA and EBITDAre are not substitutes for net income (loss) (computed in accordance with GAAP) and may not be comparable to similarly titled measures used by other companies.
“Adjusted EBITDA,” a non-GAAP financial measure, represents EBITDAre adjusted for items we believe are not representative of ongoing operating results, such as transaction and other costs, gain (loss) on the extinguishment of debt, distributions in excess of our investment in unconsolidated real estate ventures, gain on the bargain purchase of a business, lease liability adjustments and share-based compensation expense related to the Formation Transaction and special equity awards. We believe that adjusting such items not considered part of our comparable operations, provides a meaningful measure to evaluate and compare our performance from period-to-period.
Because EBITDA, EBITDAre and Adjusted EBITDA have limitations as analytical tools, we use EBITDA, EBITDAre and Adjusted EBITDA to supplement GAAP financial measures. Additionally, we believe that users of these measures should consider EBITDA, EBITDAre and Adjusted EBITDA in conjunction with net income (loss) and other GAAP measures in understanding our operating results.
Funds from Operations ("FFO"), Core FFO and Funds Available for Distribution (“FAD")
FFO is a non-GAAP financial measure computed in accordance with the definition established by NAREIT in the NAREIT FFO White Paper - 2018 Restatement issued in 2018. NAREIT defines FFO as net income (computed in accordance with GAAP), excluding depreciation and amortization related to real estate, gains and losses from the sale of certain real estate assets, gains and losses from change in control and impairment write-downs of certain real estate assets and investments in entities when the impairment is directly attributable to decreases in the value of depreciable real estate held by the entity, including our share of such adjustments for unconsolidated real estate ventures.
"Core FFO" represents FFO adjusted to exclude items (net of tax) which we believe are not representative of ongoing operating results, such as transaction and other costs, gains (or losses) on extinguishment of debt, gain on the bargain purchase of a business, distributions in excess of our investment in unconsolidated real estate ventures, share-based compensation expense related to the Formation Transaction and special equity awards, lease liability adjustments, amortization of the management contracts intangible and the mark-to-market of derivative instruments.
"FAD" is a non-GAAP financial measure and represents FFO less recurring tenant improvements, leasing commissions and other capital expenditures, net deferred rent activity, third-party lease liability assumption payments, recurring share-based compensation expense, accretion of acquired below-market leases, net of amortization of acquired above-market leases, amortization of debt issuance costs and other non-cash income and charges. FAD is presented solely as a supplemental disclosure that management believes provides useful information as it relates to our ability to fund dividends.
We believe FFO, Core FFO and FAD are meaningful non‑GAAP financial measures useful in comparing our levered operating performance from period-to-period and as compared to similar real estate companies because these non‑GAAP measures exclude real estate depreciation and amortization expense and other non-comparable income and expenses, which implicitly assumes that the value of real estate diminishes predictably over time rather than fluctuating based on market conditions. FFO, Core FFO and FAD do not represent cash generated from operating activities and are not necessarily indicative of cash available to fund cash requirements and should not be considered as an alternative to net income (loss) (computed in accordance with GAAP) as a performance measure or cash flow as a liquidity measure. FFO, Core FFO and FAD may not be comparable to similarly titled measures used by other companies.
Net Operating Income ("NOI") and Annualized NOI
“NOI” is a non-GAAP financial measure management uses to assess a segment’s performance. The most directly comparable GAAP measure is net income attributable to common shareholders. We use NOI internally as a performance measure and believe NOI provides useful information to investors regarding our financial condition and results of operations because it reflects only property related revenue (which includes base rent, tenant reimbursements and other operating revenue, net of free rent and payments associated with assumed lease liabilities) less operating expenses and ground rent, if applicable. NOI also excludes deferred rent, related party management fees, interest expense, and certain other non-cash adjustments, including the accretion of acquired below-market leases and amortization of acquired above-market leases and below-market ground lease intangibles. Management uses NOI as a supplemental performance measure for our assets and believes it provides useful information to investors because it reflects only those revenue and expense items that are incurred at the asset level, excluding non-cash items. In addition, NOI is considered by many in the real estate industry to be a useful starting point for determining the value of a real estate asset or group of assets. However, because NOI excludes depreciation and amortization and captures neither the changes in the value of our assets that result from use or market conditions, nor the level of capital expenditures and capitalized leasing commissions necessary to maintain the operating performance of our assets, all of which have real economic effect and could materially impact the financial performance of our assets, the utility of NOI as a measure of the operating performance of our assets is limited. NOI presented by us may not be comparable to NOI reported by other REITs that define these measures differently. We believe that to facilitate a clear understanding of our operating results, NOI should be examined in conjunction with net income attributable to common shareholders as presented in our financial statements. NOI should not be considered as an alternative to net income attributable to common shareholders as an indication of our performance or to cash flows as a measure of liquidity or our ability to make distributions. Annualized NOI, for all assets except Crystal City Marriott, represents NOI for the three months ended December 31, 2019 multiplied by four. Due to seasonality in the hospitality business, annualized NOI for Crystal City Marriott represents the trailing 12-month NOI as of December 31, 2019. Management believes Annualized NOI provides useful information in understanding our financial performance over a 12-month period, however, investors and other users are cautioned against attributing undue certainty to our calculation of Annualized NOI. Actual NOI for any 12-month period will depend on a number of factors beyond our ability to control or predict, including general capital markets and economic conditions, any bankruptcy, insolvency, default or other failure to pay rent by one or more of our tenants and the destruction of one or more of our assets due to terrorist attack, natural disaster or other casualty, among others. We do not undertake any obligation to update our calculation to reflect events or circumstances occurring after the date of this earnings release. There can be no assurance that the annualized NOI shown will reflect our actual results of operations over any 12-month period.
Same Store and Non-Same Store
“Same store” refers to the pool of assets that were in service for the entirety of both periods being compared, except for assets for which significant redevelopment, renovation, or repositioning occurred during either of the periods being compared.
“Non-same store” refers to all operating assets excluded from the same store pool.
Definitions
GAAP
"GAAP" refers to accounting principles generally accepted in the United States of America.
Formation Transaction
"Formation Transaction" refers collectively to the spin-off on July 17, 2017 of substantially all of the assets and liabilities of Vornado’s Washington, DC segment, which operated as Vornado / Charles E. Smith, and the acquisition of the management business and certain assets and liabilities of The JBG Companies.
CONDENSED CONSOLIDATED BALANCE SHEETS (Unaudited) |
| | | | | | | |
| in thousands | December 31, 2019 | | December 31, 2018 |
| | | | |
| ASSETS | |
| Real estate, at cost: | | | |
| Land and improvements | $ | 1,240,455 |
| | $ | 1,371,874 |
|
| Buildings and improvements | 3,880,973 |
| | 3,722,930 |
|
| Construction in progress, including land | 654,091 |
| | 697,930 |
|
| | 5,775,519 |
| | 5,792,734 |
|
| Less accumulated depreciation | (1,119,571 | ) | | (1,051,875 | ) |
| Real estate, net | 4,655,948 |
| | 4,740,859 |
|
| Cash and cash equivalents | 126,413 |
| | 260,553 |
|
| Restricted cash | 16,103 |
| | 138,979 |
|
| Tenant and other receivables, net | 52,941 |
| | 46,568 |
|
Deferred rent receivable, net
| 169,721 |
| | 143,473 |
|
| Investments in unconsolidated real estate ventures | 543,026 |
| | 322,878 |
|
Other assets, net
| 253,687 |
| | 264,994 |
|
| Assets held for sale | 168,412 |
| | 78,981 |
|
| TOTAL ASSETS | $ | 5,986,251 |
| | $ | 5,997,285 |
|
| | | | |
| LIABILITIES, REDEEMABLE NONCONTROLLING INTERESTS AND EQUITY | | | |
| Liabilities: | | | |
| Mortgages payable, net | $ | 1,125,777 |
| | $ | 1,838,381 |
|
| Revolving credit facility | 200,000 |
| | — |
|
| Unsecured term loans, net | 297,295 |
| | 297,129 |
|
| Accounts payable and accrued expenses | 157,702 |
| | 130,960 |
|
| Other liabilities, net | 206,042 |
| | 181,606 |
|
| Liabilities related to assets held for sale | — |
| | 3,717 |
|
| Total liabilities | 1,986,816 |
| | 2,451,793 |
|
| Commitments and contingencies |
| |
|
| Redeemable noncontrolling interests | 612,758 |
| | 558,140 |
|
| Total equity | 3,386,677 |
| | 2,987,352 |
|
| TOTAL LIABILITIES, REDEEMABLE NONCONTROLLING INTERESTS AND EQUITY | $ | 5,986,251 |
| | $ | 5,997,285 |
|
_______________
Note: For complete financial statements, please refer to the Company's Annual Report on Form 10-K for the year ended December 31, 2019.
CONDENSED CONSOLIDATED STATEMENTS OF OPERATIONS (Unaudited) |
| | | | | | | | | | | | | | | |
| in thousands, except per share data | Three Months Ended December 31, | | Year Ended December 31, |
| | 2019 | | 2018 | | 2019 | | 2018 |
| REVENUE | | | | | | | |
| Property rentals | $ | 127,571 |
| | $ | 129,048 |
| | $ | 493,273 |
| | $ | 513,447 |
|
| Third-party real estate services, including reimbursements | 29,121 |
| | 26,421 |
| | 120,886 |
| | 98,699 |
|
| Other revenue | 8,185 |
| | 7,786 |
| | 33,611 |
| | 32,036 |
|
| Total revenue | 164,877 |
| | 163,255 |
| | 647,770 |
| | 644,182 |
|
| EXPENSES | | | | | | | |
| Depreciation and amortization | 50,004 |
| | 67,556 |
| | 191,580 |
| | 211,436 |
|
| Property operating | 37,535 |
| | 40,076 |
| | 137,622 |
| | 148,081 |
|
| Real estate taxes | 18,252 |
| | 17,030 |
| | 70,493 |
| | 71,054 |
|
| General and administrative: | | | | | | | |
| Corporate and other | 11,934 |
| | 8,512 |
| | 46,822 |
| | 33,728 |
|
| Third-party real estate services | 26,910 |
| | 25,274 |
| | 113,495 |
| | 89,826 |
|
Share-based compensation related to Formation Transaction and
special equity awards
| 11,959 |
| | 9,118 |
| | 42,162 |
| | 36,030 |
|
| Transaction and other costs | 13,307 |
| | 15,572 |
| | 23,235 |
| | 27,706 |
|
| Total expenses | 169,901 |
| | 183,138 |
| | 625,409 |
| | 617,861 |
|
| OTHER INCOME (EXPENSE) |
|
| |
| |
| |
|
| Income (loss) from unconsolidated real estate ventures, net | (2,042 | ) | | 23,991 |
| | (1,395 | ) | | 39,409 |
|
| Interest and other income, net | 3,022 |
| | 9,991 |
| | 5,385 |
| | 15,168 |
|
| Interest expense | (11,831 | ) | | (18,184 | ) | | (52,695 | ) | | (74,447 | ) |
| Gain on sale of real estate | 57,870 |
| | 6,394 |
| | 104,991 |
| | 52,183 |
|
| Loss on extinguishment of debt | (3,916 | ) | | (617 | ) | | (5,805 | ) | | (5,153 | ) |
| Reduction of gain on bargain purchase | — |
| | — |
| | — |
| | (7,606 | ) |
| Total other income (expense) | 43,103 |
| | 21,575 |
| | 50,481 |
| | 19,554 |
|
| INCOME BEFORE INCOME TAX (EXPENSE) BENEFIT | 38,079 |
| | 1,692 |
| | 72,842 |
| | 45,875 |
|
| Income tax (expense) benefit | 613 |
| | (698 | ) | | 1,302 |
| | 738 |
|
| NET INCOME | 38,692 |
| | 994 |
| | 74,144 |
| | 46,613 |
|
| Net income attributable to redeemable noncontrolling interests | (4,302 | ) | | (178 | ) | | (8,573 | ) | | (6,710 | ) |
| Net (income) loss attributable to noncontrolling interests | — |
| | (106 | ) | | — |
| | 21 |
|
| NET INCOME ATTRIBUTABLE TO COMMON SHAREHOLDERS | $ | 34,390 |
| | $ | 710 |
| | $ | 65,571 |
| | $ | 39,924 |
|
| EARNINGS (LOSS) PER COMMON SHARE: | | | | | | | |
| Basic | $ | 0.25 |
| | $ | (0.01 | ) | | $ | 0.48 |
| | $ | 0.31 |
|
| Diluted | $ | 0.25 |
| | $ | (0.01 | ) | | $ | 0.48 |
| | $ | 0.31 |
|
| WEIGHTED AVERAGE NUMBER OF COMMON SHARES OUTSTANDING : | | | | | | | |
| Basic | 134,129 |
| | 120,917 |
| | 130,687 |
| | 119,176 |
|
| Diluted | 134,129 |
| | 120,917 |
| | 130,687 |
| | 119,176 |
|
___________________
Note: For complete financial statements, please refer to the Company's Annual Report on Form 10-K for the year ended December 31, 2019.
EBITDA, EBITDAre AND ADJUSTED EBITDA (NON-GAAP)
(Unaudited)
|
| | | | | | | | | | | | | | | |
| dollars in thousands | Three Months Ended December 31, | | Year Ended December 31, |
| | 2019 | | 2018 | | 2019 | | 2018 |
| | | | | | | | |
| EBITDA, EBITDAre and Adjusted EBITDA | | | | | | | |
| Net income | $ | 38,692 |
| | $ | 994 |
| | $ | 74,144 |
| | $ | 46,613 |
|
| Depreciation and amortization expense | 50,004 |
| | 67,556 |
| | 191,580 |
| | 211,436 |
|
Interest expense (1) | 11,831 |
| | 18,184 |
| | 52,695 |
| | 74,447 |
|
| Income tax expense (benefit) | (613 | ) | | 698 |
| | (1,302 | ) | | (738 | ) |
| Unconsolidated real estate ventures allocated share of above adjustments | 10,050 |
| | 10,253 |
| | 36,877 |
| | 42,016 |
|
| Net income attributable to noncontrolling interests in consolidated real estate ventures | (2 | ) | | (182 | ) | | (7 | ) | | (53 | ) |
EBITDA (2) | $ | 109,962 |
| | $ | 97,503 |
| | $ | 353,987 |
| | $ | 373,721 |
|
| Gain on sale of real estate | (57,870 | ) | | (6,394 | ) | | (104,991 | ) | | (52,183 | ) |
| Gain on sale from unconsolidated real estate ventures | — |
| | (20,554 | ) | | (335 | ) | | (36,042 | ) |
EBITDAre (2) | $ | 52,092 |
| | $ | 70,555 |
| | $ | 248,661 |
| | $ | 285,496 |
|
Transaction and other costs (3) | 13,307 |
| | 15,572 |
| | 23,235 |
| | 27,706 |
|
| Loss on extinguishment of debt, net of noncontrolling interests | 3,916 |
| | 617 |
| | 5,805 |
| | 5,029 |
|
| Reduction of gain on bargain purchase | — |
| | — |
| | — |
| | 7,606 |
|
| Share-based compensation related to Formation Transaction and special equity awards | 11,959 |
| | 9,118 |
| | 42,162 |
| | 36,030 |
|
Losses and distributions in excess of our investment in unconsolidated real estate venture (4) | (518 | ) | | (7,374 | ) | | (7,356 | ) | | (13,676 | ) |
| Unconsolidated real estate ventures allocated share of above adjustments | (1,345 | ) | | 1,542 |
| | (1,345 | ) | | 1,572 |
|
| Lease liability adjustments | (1,829 | ) | | (7,422 | ) | | 162 |
| | (9,965 | ) |
Adjusted EBITDA (2) | $ | 77,582 |
| | $ | 82,608 |
| | $ | 311,324 |
| | $ | 339,798 |
|
| | | | | | | | |
Net Debt to Annualized Adjusted EBITDA (5) (6) | 5.8x |
| | 6.5x |
| | 5.8x |
| | 6.3x |
|
| | | | | | | | |
| | December 31, 2019 | | December 31, 2018 | | | | |
| Net Debt (at JBG SMITH Share) | | | | | | | |
Consolidated indebtedness (7) | $ | 1,620,001 |
| | $ | 2,130,704 |
| | | | |
Unconsolidated indebtedness (7) | 329,056 |
| | 298,588 |
| | | | |
| Total consolidated and unconsolidated indebtedness | 1,949,057 |
| | 2,429,292 |
| | | | |
| Less: cash and cash equivalents | 136,200 |
| | 273,611 |
| | | | |
| Net Debt (at JBG SMITH Share) | $ | 1,812,857 |
| | $ | 2,155,681 |
| | | | |
| | $ | (0.14 | ) | | | | | | |
____________________
Note: All EBITDA measures as shown above are attributable to operating partnership common units.
| |
| (1) | Interest expense includes the amortization of deferred financing costs and the ineffective portion of any interest rate swaps or caps, net of capitalized interest. |
| |
| (2) | Due to our adoption of the new accounting standard for leases, beginning in 2019, we no longer capitalize internal leasing costs and expense these costs as incurred (such costs were $2.2 million and $6.5 million for the three months and year ended December 31, 2018). |
| |
| (3) | Includes fees and expenses incurred for the relocation of our corporate headquarters, demolition costs, fees and expenses incurred in connection with the Formation Transaction (including amounts incurred for transition services provided by our former parent, integration costs and severance costs), pursuit costs related to other completed, potential and pursued transactions, as well as other expenses. |
| |
| (4) | As of June 30, 2018, we suspended the equity method of accounting for our investment in the real estate venture that owns 1101 17th Street as our investment had been reduced to zero and we did not have an obligation to provide further financial support to the venture. All subsequent distributions from the venture have been recognized as income, which will continue until our share of unrecorded earnings and contributions exceed the cumulative excess distributions previously recognized. |
| |
| (5) | Adjusted EBITDA for the three months ended December 31, 2019 and 2018 is annualized by multiplying by four. |
| |
| (6) | Pro forma Net Debt to Annualized Adjusted EBITDA would have been 5.3x for the three months and year ended December 31, 2019, which includes the $155.0 million of net proceeds from the sale of Metropolitan Park in January 2020. |
| |
| (7) | Net of premium/discount and deferred financing costs. |
FFO, CORE FFO AND FAD (NON-GAAP)
(Unaudited)
|
| | | | | | | | | | | | | | | |
| in thousands, except per share data | Three Months Ended December 31, | | Year Ended December 31, |
| | 2019 | | 2018 | | 2019 | | 2018 |
| | | | | | | | |
| FFO and Core FFO | | | | | | | |
| Net income attributable to common shareholders | $ | 34,390 |
| | $ | 710 |
| | $ | 65,571 |
| | $ | 39,924 |
|
| Net income attributable to redeemable noncontrolling interests | 4,302 |
| | 178 |
| | 8,573 |
| | 6,710 |
|
| Net income (loss) attributable to noncontrolling interests | — |
| | 106 |
| | — |
| | (21 | ) |
| Net income | 38,692 |
| | 994 |
| | 74,144 |
| | 46,613 |
|
| Gain on sale of real estate | (57,870 | ) | | (6,394 | ) | | (104,991 | ) | | (52,183 | ) |
| Gain on sale from unconsolidated real estate ventures | — |
| | (20,554 | ) | | (335 | ) | | (36,042 | ) |
| Real estate depreciation and amortization | 47,001 |
| | 64,891 |
| | 180,508 |
| | 201,062 |
|
| Pro rata share of real estate depreciation and amortization from unconsolidated real estate ventures | 6,407 |
| | 6,079 |
| | 20,577 |
| | 25,039 |
|
| Net income attributable to noncontrolling interests in consolidated real estate ventures | (2 | ) | | (182 | ) | | (7 | ) | | (51 | ) |
FFO Attributable to Operating Partnership Common Units (1) | $ | 34,228 |
| | $ | 44,834 |
| | $ | 169,896 |
| | $ | 184,438 |
|
| FFO attributable to redeemable noncontrolling interests | (3,804 | ) | | (5,741 | ) | | (19,306 | ) | | (25,798 | ) |
FFO attributable to common shareholders (1) | $ | 30,424 |
| | $ | 39,093 |
| | $ | 150,590 |
| | $ | 158,640 |
|
| | | | | | | | |
| FFO attributable to the operating partnership common units | $ | 34,228 |
| | $ | 44,834 |
| | $ | 169,896 |
| | $ | 184,438 |
|
Transaction and other costs, net of tax (2) | 11,725 |
| | 14,509 |
| | 21,139 |
| | 25,625 |
|
| (Gain) loss from mark-to-market on derivative instruments | — |
| | (542 | ) | | 50 |
| | (1,941 | ) |
| Loss on extinguishment of debt, net of noncontrolling interests | 3,916 |
| | 617 |
| | 5,805 |
| | 5,029 |
|
Losses and distributions in excess of our investment in unconsolidated real estate venture (3) | (518 | ) | | (7,374 | ) | | (7,356 | ) | | (13,676 | ) |
| Reduction of gain on bargain purchase | — |
| | — |
| | — |
| | 7,606 |
|
| Share-based compensation related to Formation Transaction and special equity awards | 11,959 |
| | 9,118 |
| | 42,162 |
| | 36,030 |
|
| Lease liability adjustments | (1,829 | ) | | (7,422 | ) | | 162 |
| | (9,965 | ) |
| Amortization of management contracts intangible, net of tax | 1,288 |
| | 1,287 |
| | 5,150 |
| | 5,148 |
|
| Unconsolidated real estate ventures allocated share of above adjustments | (1,407 | ) | | 1,921 |
| | 100 |
| | 1,440 |
|
Core FFO Attributable to Operating Partnership Common Units (1) | $ | 59,362 |
| | $ | 56,948 |
| | $ | 237,108 |
| | $ | 239,734 |
|
| Core FFO attributable to redeemable noncontrolling interests | (6,598 | ) | | (7,292 | ) | | (26,895 | ) | | (33,536 | ) |
Core FFO attributable to common shareholders (1) | $ | 52,764 |
| | $ | 49,656 |
| | $ | 210,213 |
| | $ | 206,198 |
|
| FFO per diluted common share | $ | 0.23 |
| | $ | 0.32 |
| | $ | 1.15 |
| | $ | 1.33 |
|
| Core FFO per diluted common share | $ | 0.39 |
| | $ | 0.41 |
| | $ | 1.61 |
| | $ | 1.73 |
|
| Weighted average diluted shares | 134,129 |
| | 120,917 |
| | 130,687 |
| | 119,176 |
|
See footnotes on page 12.
FFO, CORE FFO AND FAD (NON-GAAP)
(Unaudited)
|
| | | | | | | | | | | | | | | |
| in thousands, except per share data | Three Months Ended December 31, | | Year Ended December 31, |
| | 2019 | | 2018 | | 2019 | | 2018 |
| | | | | | | | |
| FAD | | | | | | | |
| Core FFO attributable to the operating partnership common units | $ | 59,362 |
| | $ | 56,948 |
| | $ | 237,108 |
| | $ | 239,734 |
|
| Recurring capital expenditures and second generation tenant improvements and leasing commissions | (27,689 | ) | | (35,836 | ) | | (84,934 | ) | | (72,113 | ) |
Straight-line and other rent adjustments (4) | (8,464 | ) | | (6,692 | ) | | (34,359 | ) | | (10,351 | ) |
| Third-party lease liability assumption payments | (1,450 | ) | | (1,130 | ) | | (5,182 | ) | | (3,133 | ) |
| Share-based compensation expense | 5,512 |
| | 4,666 |
| | 22,665 |
| | 19,762 |
|
| Amortization of debt issuance costs | 671 |
| | 1,140 |
| | 3,217 |
| | 4,660 |
|
| Unconsolidated real estate ventures allocated share of above adjustments | (386 | ) | | 747 |
| | (2,820 | ) | | 1,426 |
|
| Non-real estate depreciation and amortization | 1,234 |
| | 893 |
| | 3,987 |
| | 3,286 |
|
FAD available to the Operating Partnership Common Units (A) (1) | $ | 28,790 |
| | $ | 20,736 |
| | $ | 139,682 |
| | $ | 183,271 |
|
Distributions to common shareholders and unitholders (5) (B) | $ | 34,011 |
| | $ | 31,284 |
| | $ | 133,307 |
| | $ | 125,100 |
|
FAD Payout Ratio (B÷A) (6) | 118.1 | % | | 150.9 | % | | 95.4 | % | | 68.3 | % |
|
| | | | | | | | | | | | | | | |
| Capital Expenditures | | | | | | | |
| Maintenance and recurring capital expenditures | $ | 11,748 |
| | $ | 14,445 |
| | $ | 31,495 |
| | $ | 28,230 |
|
| Share of maintenance and recurring capital expenditures from unconsolidated real estate ventures | 561 |
| | 978 |
| | 1,340 |
| | 2,821 |
|
| Second generation tenant improvements and leasing commissions | 13,426 |
| | 19,211 |
| | 48,651 |
| | 37,980 |
|
| Share of second generation tenant improvements and leasing commissions from unconsolidated real estate ventures | 1,954 |
| | 1,202 |
| | 3,448 |
| | 3,082 |
|
| Recurring capital expenditures and second generation tenant improvements and leasing commissions | 27,689 |
| | 35,836 |
| | 84,934 |
| | 72,113 |
|
| First generation tenant improvements and leasing commissions | 20,057 |
| | 8,215 |
| | 51,751 |
| | 23,519 |
|
| Share of first generation tenant improvements and leasing commissions from unconsolidated real estate ventures | 2,672 |
| | 17 |
| | 3,831 |
| | 2,572 |
|
| Non-recurring capital expenditures | 16,410 |
| | 15,375 |
| | 36,967 |
| | 25,401 |
|
| Share of non-recurring capital expenditures from unconsolidated joint ventures | 488 |
| | 112 |
| | 602 |
| | 1,174 |
|
| Non-recurring capital expenditures | 39,627 |
| | 23,719 |
| | 93,151 |
| | 52,666 |
|
| Total JBG SMITH Share of Capital Expenditures | $ | 67,316 |
| | $ | 59,555 |
| | $ | 178,085 |
| | $ | 124,779 |
|
_______________
Note: FFO attributable to operating partnership common units.
| |
| (1) | Due to our adoption of the new accounting standard for leases, beginning in 2019, we no longer capitalize internal leasing costs and expense these costs as incurred (such costs were $2.2 million and $6.5 million for the three months and year ended December 31, 2018). |
| |
| (2) | Includes fees and expenses incurred for the relocation of our corporate headquarters, demolition costs, fees and expenses incurred in connection with the Formation Transaction (including amounts incurred for transition services provided by our former parent, integration costs and severance costs), pursuit costs related to other completed, potential and pursued transactions, as well as other expenses. |
| |
| (3) | As of June 30, 2018, we suspended the equity method of accounting for our investment in the real estate venture that owns 1101 17th Street as our investment had been reduced to zero and we did not have an obligation to provide further financial support to the venture. All subsequent distributions from the venture have been recognized as income, which will continue until our share of unrecorded earnings and contributions exceed the cumulative excess distributions previously recognized. |
| |
| (4) | Includes straight-line rent, above/below market lease amortization and lease incentive amortization. |
| |
| (5) | The distribution for the year ended December 31, 2019 excludes a special dividend of $0.10 per common share that was paid in January 2019. |
| |
| (6) | The FAD payout ratio on a quarterly basis is not necessarily indicative of an amount for the full year due to fluctuation in timing of capital expenditures, the commencement of new leases and the seasonality of our operations. Q4 2019 and Q4 2018 were impacted by increases in recurring capital expenditures, which is consistent with historical seasonality trends. |
NOI RECONCILIATIONS (NON-GAAP)
(Unaudited)
|
| | | | | | | | | | | | | | | |
| dollars in thousands | Three Months Ended December 31, | | Year Ended December 31, |
| | 2019 | | 2018 | | 2019 | | 2018 |
| | |
| Net income attributable to common shareholders | $ | 34,390 |
| | $ | 710 |
| | $ | 65,571 |
| | $ | 39,924 |
|
| Add: | | | | | | | |
| Depreciation and amortization expense | 50,004 |
| | 67,556 |
| | 191,580 |
| | 211,436 |
|
| General and administrative expense: | | | | | | | |
| Corporate and other | 11,934 |
| | 8,512 |
| | 46,822 |
| | 33,728 |
|
| Third-party real estate services | 26,910 |
| | 25,274 |
| | 113,495 |
| | 89,826 |
|
Share-based compensation related to Formation Transaction and
special equity awards
| 11,959 |
| | 9,118 |
| | 42,162 |
| | 36,030 |
|
| Transaction and other costs | 13,307 |
| | 15,572 |
| | 23,235 |
| | 27,706 |
|
| Interest expense | 11,831 |
| | 18,184 |
| | 52,695 |
| | 74,447 |
|
| Loss on extinguishment of debt | 3,916 |
| | 617 |
| | 5,805 |
| | 5,153 |
|
| Reduction of gain on bargain purchase | — |
| | — |
| | — |
| | 7,606 |
|
| Income tax expense (benefit) | (613 | ) | | 698 |
| | (1,302 | ) | | (738 | ) |
| Net income attributable to redeemable noncontrolling interests | 4,302 |
| | 178 |
| | 8,573 |
| | 6,710 |
|
| Less: | | | | | | | |
Third-party real estate services, including reimbursements
| 29,121 |
| | 26,421 |
| | 120,886 |
| | 98,699 |
|
Other revenue (1) | 1,686 |
| | 1,454 |
| | 7,638 |
| | 6,358 |
|
| Income (loss) from unconsolidated real estate ventures, net | (2,042 | ) | | 23,991 |
| | (1,395 | ) | | 39,409 |
|
| Interest and other income, net | 3,022 |
| | 9,991 |
| | 5,385 |
| | 15,168 |
|
| Gain on sale of real estate | 57,870 |
| | 6,394 |
| | 104,991 |
| | 52,183 |
|
| Net income (loss) attributable to noncontrolling interests | — |
| | (106 | ) | | — |
| | 21 |
|
| Consolidated NOI | 78,283 |
| | 78,274 |
| | 311,131 |
| | 319,990 |
|
| NOI attributable to unconsolidated real estate ventures at our share | 6,052 |
| | 8,741 |
| | 21,797 |
| | 36,684 |
|
Non-cash rent adjustments (2) | (8,465 | ) | | (6,691 | ) | | (34,359 | ) | | (10,349 | ) |
Other adjustments (3) | 3,913 |
| | 3,915 |
| | 13,979 |
| | 15,061 |
|
| Total adjustments | 1,500 |
| | 5,965 |
| | 1,417 |
| | 41,396 |
|
| NOI | $ | 79,783 |
| | $ | 84,239 |
| | $ | 312,548 |
| | $ | 361,386 |
|
Less: out-of-service NOI loss (4) | (2,817 | ) | | (1,090 | ) | | (7,013 | ) | | (4,395 | ) |
| Operating Portfolio NOI | $ | 82,600 |
| | $ | 85,329 |
| | $ | 319,561 |
| | $ | 365,781 |
|
Non-same store NOI (5) | 7,653 |
| | 11,266 |
| | 27,298 |
| | 51,646 |
|
Same store NOI (6) | $ | 74,947 |
| | $ | 74,063 |
| | $ | 292,263 |
| | $ | 314,135 |
|
| | | | | | | | |
| Change in same store NOI | 1.2 | % | | | | (7.0 | )% | | |
| Number of properties in same store pool | 54 |
| | | | 53 |
| | |
___________________
| |
| (1) | Excludes parking revenue of $6.5 million and $6.3 million for the three months ended December 31, 2019 and 2018, and $26.0 million and $25.7 million for the year ended December 31, 2019 and 2018. |
| |
| (2) | Adjustment to exclude straight-line rent, above/below market lease amortization and lease incentive amortization. |
| |
| (3) | Adjustment to include other revenue and payments associated with assumed lease liabilities related to operating properties and to exclude commercial lease termination revenue and allocated corporate general and administrative expenses to operating properties. |
| |
| (4) | Includes the results for our Under Construction assets and Future Development Pipeline. |
| |
| (5) | Includes the results for properties that were not in service for the entirety of both periods being compared and properties for which significant redevelopment, renovation or repositioning occurred during either of the periods being compared. The decrease in non-same store NOI is primarily attributable to lost income from disposed assets. |
| |
| (6) | Includes the results of the properties that are owned, operated and in service for the entirety of both periods being compared except for properties for which significant redevelopment, renovation or repositioning occurred during either of the periods being compared. |
|
| |
| TABLE OF CONTENTS | DECEMBER 31, 2019
|
|
| |
| | Page |
| Overview | |
| 3-4 |
| 5-6 |
| |
| 8-9 |
| |
| Financial Information | |
| |
| |
| |
| |
| |
| 16-17 |
| |
| |
| |
| 21-22 |
| |
| |
| |
| |
| Leasing Activity | |
| |
| |
| |
| |
| |
| |
| Property Data | |
| |
| Property Tables: | |
| 34-37 |
| 38-40 |
| |
| |
| |
| Debt | |
| |
| 45-46 |
| Real Estate Ventures | |
| |
| 48-49 |
| 50-53 |
| 54-57 |
|
| |
| DISCLOSURES | DECEMBER 31, 2019
|
Forward-Looking Statements
Certain statements contained herein may constitute “forward-looking statements” as such term is defined in Section 27A of the Securities Act of 1933, as amended, and Section 21E of the Securities Exchange Act of 1934, as amended. Forward-looking statements are not guarantees of performance. They represent our intentions, plans, expectations and beliefs and are subject to numerous assumptions, risks and uncertainties. Consequently, the future results of JBG SMITH Properties (“JBG SMITH”, the “Company”, "we", "us", "our" or similar terms) may differ materially from those expressed in these forward-looking statements. You can find many of these statements by looking for words such as “approximate”, “hypothetical”, “potential”, “believes”, “expects”, “anticipates”, “estimates”, “intends”, “plans”, “would”, “may” or similar expressions in this document. We also note the following forward-looking statements: our potential net operating income ("NOI") growth and the assumptions on which such growth is premised, our estimated future leverage (Debt/EBITDA) profile, the potential effect of Amazon.com, Inc. ("Amazon") on job growth, rent growth and cap rates in the Washington, DC metropolitan area and National Landing, in particular, our anticipated dispositions and like-kind exchanges, our indicated annual dividend per share and dividend yield, annualized NOI; adjusted annualized NOI; in the case of our construction assets, estimated square feet, estimated number of units, the estimated completion date, estimated stabilization date, estimated incremental investment, estimated total investment, projected NOI yield, weighted average projected NOI yield, NOI yield or estimated total project cost, estimated total NOI weighted average completion date, weighted average stabilization date and estimated incremental investment, intended type of asset use and potential tenants, and estimated stabilized NOI; and in the case of our future development assets, estimated potential development density, estimated commercial SF/multifamily units to be replaced, estimated remaining acquisition cost, estimated capitalized cost, estimated total investment, expected key Amazon transaction terms, the impact of our role as developer, property manager and retail leasing agent in connection with Amazon’s new headquarters, planned infrastructure and education improvements related to Amazon’s new headquarters; the economic impacts of Amazon’s new headquarters on the DC region and National Landing, our development planned related to Amazon’s new headquarters, the expected accretion to our net asset value ("NAV") as a result of the Amazon transaction and our future NAV growth rate; in the case of any further Amazon lease transactions and our development opportunities in National Landing, the total square feet to be leased to Amazon and the expected net effective rent, estimated square feet, estimated number of units, the estimated construction start and occupancy dates, estimated incremental investment, and projected NOI yield; and in the case of our future development opportunities, estimated potential development density. Many of the factors that will determine the outcome of these and our other forward-looking statements are beyond our ability to control or predict. These factors include, among others: adverse economic conditions in the Washington, DC metropolitan area, the timing of and costs associated with development and property improvements, financing commitments, and general competitive factors. For further discussion of factors that could materially affect the outcome of our forward-looking statements and other risks and uncertainties, see “Risk Factors” and the Cautionary Statement Concerning Forward-Looking Statements in the Company's Annual Report on Form 10-K for the year ended December 31, 2019 and other periodic reports the Company files with the Securities and Exchange Commission. For these statements, we claim the protection of the safe harbor for forward-looking statements contained in the Private Securities Litigation Reform Act of 1995. You are cautioned not to place undue reliance on our forward-looking statements. All subsequent written and oral forward-looking statements attributable to us or any person acting on our behalf are expressly qualified in their entirety by the cautionary statements contained or referred to in this section. We do not undertake any obligation to release publicly any revisions to our forward-looking statements to reflect events or circumstances occurring after the issuance of this Investor Package.
We are reiterating the assumptions in our estimated NOI bridge and the potential estimated NAV impact from Amazon in National Landing, which can be found in our Spring 2019 Investor Day presentation on our website at http://investors.jbgsmith.com/presentations.
Organization and Basis of Presentation
JBG SMITH Properties ("JBG SMITH") was organized as a Maryland real estate investment trust ("REIT") for the purpose of receiving, via the spin-off on July 17, 2017 (the "Separation"), substantially all of the assets and liabilities of Vornado Realty Trust's ("Vornado") Washington, D.C. segment. On July 18, 2017, JBG SMITH acquired the management business and certain assets and liabilities of The JBG Companies ("JBG") (the "Combination"). The Separation and the Combination are collectively referred to as the "Formation Transaction."
The information contained in this Investor Package does not purport to disclose all items required by the accounting principles generally accepted in the United States of America (“GAAP”) and is unaudited information, unless otherwise indicated.
Pro Rata Information
We present certain financial information and metrics in this Investor Package “at JBG SMITH Share,” which refers to our ownership percentage of consolidated and unconsolidated assets in real estate ventures (collectively, “real estate ventures”) as applied to these financial measures and metrics. Financial information “at JBG SMITH Share” is calculated on an asset-by-asset basis by applying our percentage economic interest to each applicable line item of that asset’s financial information. “At JBG SMITH Share” information, which we also refer to as being “at share,” “our pro rata share” or “our share,” is not, and is not intended to be, a presentation in accordance with GAAP. Given that a substantial portion of our assets are held through real estate ventures, we believe this form of presentation, which presents our economic interests in the partially owned entities, provides investors valuable
|
| |
| DISCLOSURES | DECEMBER 31, 2019
|
information regarding a significant component of our portfolio, its composition, performance and capitalization.
We do not control the unconsolidated real estate ventures and do not have a legal claim to our co-venturers’ share of assets, liabilities, revenue and expenses. The operating agreements of the unconsolidated real estate ventures generally allow each co-venturer to receive cash distributions to the extent there is available cash from operations. The amount of cash each investor receives is based upon specific provisions of each operating agreement and varies depending on certain factors including the amount of capital contributed by each investor and whether any investors are entitled to preferential distributions.
With respect to any such third-party arrangement, we would not be in a position to exercise sole decision-making authority regarding the property, real estate venture or other entity, and may, under certain circumstances, be exposed to economic risks not present were a third-party not involved. We and our respective co-venturers may each have the right to trigger a buy-sell or forced sale arrangement, which could cause us to sell our interest, or acquire our co-venturers’ interests, or to sell the underlying asset, either on unfavorable terms or at a time when we otherwise would not have initiated such a transaction. Our real estate ventures may be subject to debt, and the repayment or refinancing of such debt may require equity capital calls. To the extent our co-venturers do not meet their obligations to us or our real estate ventures or they act inconsistent with the interests of the real estate venture, we may be adversely affected. Because of these limitations, the non-GAAP “at JBG SMITH Share” financial information should not be considered in isolation or as a substitute for our financial statements as reported under GAAP.
Definitions
See pages 50-53 for definitions of terms used in this Investor Package.
Information herein with respect to the proposed transaction with Amazon is based on executed leases and purchase and sale agreements between us and Amazon. Closing under these agreements is subject to customary closing conditions.
Non-GAAP Measures
This Investor Package includes non-GAAP measures. For these measures, we have provided an explanation of how these non-GAAP measures are calculated and why our management believes that the presentation of these measures provides useful information to investors regarding our financial condition and results of operations. Reconciliations of certain non-GAAP measures to the most directly comparable GAAP financial measure are included in this Investor Package. Our presentation of non-GAAP financial measures may not be comparable to similar non-GAAP measures used by other companies.
In addition to "at share" financial information, the following non-GAAP measures are included in this Investor Package:
| |
| • | Earnings Before Interest, Taxes, Depreciation and Amortization ("EBITDA") |
| |
| • | EBITDA for Real Estate ("EBITDAre") |
| |
| • | Funds from Operations ("FFO") |
| |
| • | Funds Available for Distribution ("FAD") |
| |
| • | Third-Party Asset Management and Real Estate Services Business |
| |
| • | Net Operating Income ("NOI") |
| |
| • | Estimated Stabilized NOI |
| |
| • | Adjusted Consolidated and Unconsolidated Indebtedness |
| |
| • | Pro Rata Adjusted General and Administrative Expenses |
|
| |
| COMPANY PROFILE | DECEMBER 31, 2019 (Unaudited)
|
JBG SMITH is real estate investment company trust that owns, operates, invests in and develops a dynamic portfolio of high-growth mixed-use properties concentrated in leading urban infill submarkets in and around Washington, DC. We own and operate a portfolio of high-growth commercial and multifamily assets, many of which are amenitized with ancillary retail. Our portfolio reflects our longstanding strategy of owning and operating assets within the Metro-served submarkets in the Washington, DC metropolitan area that have high barriers to entry and key urban amenities, including being within walking distance of a Metro station. Our revenues are derived primarily from leases with commercial and multifamily tenants, including fixed rents and reimbursements from tenants for certain expenses such as real estate taxes, property operating expenses, and repairs and maintenance. In addition to our portfolio, we have a third-party asset management and real estate services business that provides fee-based real estate services to third parties, our real estate ventures and the legacy funds formerly organized by JBG ("JBG Legacy Funds").
Q4 2019 Financial Results
| |
| ▪ | Net income attributable to common shareholders was $34.4 million, or $0.25 per diluted share. |
| |
| ▪ | FFO attributable to common shareholders was $30.4 million, or $0.23 per diluted share. |
| |
| ▪ | Core FFO attributable to common shareholders was $52.8 million, or $0.39 per diluted share. |
Q4 2019 to Q3 2019 Comparison
Below are the key highlights regarding quarter over quarter changes in the JBG SMITH portfolio.
Operating Assets
| |
| ▪ | Annualized NOI for the operating portfolio for the three months ended December 31, 2019 was $328.2 million, compared to $313.2 million for the three months ended September 30, 2019, at our share. |
| |
| ▪ | The operating commercial portfolio was 91.4% leased and 88.2% occupied as of December 31, 2019, compared to 90.2% and 86.8% as of September 30, 2019, at our share. |
| |
| ▪ | The operating multifamily portfolio was 89.5% leased and 87.2% occupied as of December 31, 2019, compared to 96.5% and 94.9% as of September 30, 2019, at our share. The decreases are due in part to the movement of West Half into our recently delivered operating assets during the quarter. The in service operating multifamily portfolio was 95.1% leased and 93.3% occupied as of December 31, 2019. |
| |
| ▪ | Same store NOI at our share increased 1.2% to $74.9 million for the three months ended December 31, 2019, compared to $74.1 million for the three months ended December 31, 2018. Same store NOI decreased 7.0% to $292.3 million for the year ended December 31, 2019, compared to $314.1 million for the year ended December 31, 2018. The increase in same store NOI for the three months ended December 31, 2019 is largely attributable to decreased ground rent expense. The decrease in same store NOI for the year ended December 31, 2019 is largely attributable to increased rental abatements and rent reductions, and an increase in assumed lease liability payments. The reported same store pools as of December 31, 2019 include only the assets that were in service for the entirety of both periods being compared. See page 52 for the definition of same store. |
Under Construction
| |
| ▪ | During the quarter ended December 31, 2019, there were seven assets under construction (four commercial assets and three multifamily assets), consisting of approximately 821,000 square feet and 833 units, both at our share. |
| |
| ▪ | During the quarter ended December 31, 2019, we completed 4747 Bethesda, Atlantic Plumbing C and 1900 N Street, all delivered ahead or on schedule and below budget. |
Near-Term Development
| |
| ▪ | As of December 31, 2019, there were no assets in near-term development. |
Future Development
| |
| ▪ | As of December 31, 2019, there were 40 future development assets consisting of 18.7 million square feet of estimated potential density at our share, including the 4.1 million square feet held for sale to Amazon. |
|
| |
| COMPANY PROFILE | DECEMBER 31, 2019 (Unaudited)
|
Acquisition, Disposition and Recapitalization Activity
| |
| • | Acquired F1RST Residences, a 325-unit multifamily asset in the Ballpark submarket of Washington, D.C. with approximately 21,000 square feet of street level retail, for $160.5 million through a like-kind exchange agreement with a third-party intermediary. |
| |
| • | Sold a 50.0% interest in a real estate venture that owns Central Place Tower, a 552,000 square foot commercial asset located in Arlington, Virginia. |
| |
| • | Sold Vienna Retail, an 8,600 square foot commercial asset located in Vienna, Virginia, for $7.4 million. |
| |
| • | In January 2020, sold Metropolitan Park to Amazon for $155.0 million, which represents an $11.0 million increase over the previously estimated contract value resulting from an increase in the approved development density on the sites. |
|
| | | | | | |
| Executive Officers | | Company Snapshot as of December 31, 2019 |
| | | | | |
| W. Matthew Kelly | Chief Executive Officer and Trustee | | Exchange/ticker | NYSE: JBGS |
| David P. Paul | President and Chief Operating Officer | | Insider ownership (1) | approximately 8% |
| Stephen W. Theriot | Chief Financial Officer | | Indicated annual dividend per share | $0.90 |
| Kevin P. Reynolds | Chief Development Officer | | Dividend yield (2) | 2.2% |
| Steven A. Museles | Chief Legal Officer | | | |
| M. Moina Banerjee | Executive Vice President, Head of Capital Markets | | Total Enterprise Value (dollars in billions, except share price) | |
| | | | Common share price (3) | $41.77 |
| | | | Common shares and common limited partnership units ("OP Units") outstanding (in millions) | 149.30 |
| | | | Total market capitalization | $6.24 |
| | | | Total consolidated and unconsolidated indebtedness at JBG SMITH share | 1.95 |
| | | | Less: cash and cash equivalents at JBG SMITH share | (0.14) |
| | | | Net debt | $1.81 |
| | | | Total Enterprise Value | $8.05 |
| | | | | |
| | | | Net Debt / Total Enterprise Value (4) | 22.5% |
| | | | | |
| | (1) | Represents the percentage of all outstanding common shares of JBG SMITH and OP Units owned or represented by the Company’s trustees and executive officers as of December 31, 2019 assuming that all the vested long-term incentive partnership units ("LTIP Units") owned by trustees and executive officers were redeemed for common shares.
|
| | | (2) | Calculated using closing share price as of February 21, 2020. |
| | | (3) | Closing share price as of February 21, 2020. |
| | | (4) | Pro forma Net Debt / Total Enterprise Value would have been 21.0% as of December 31, 2019, which includes the $155.0 million of net proceeds from the sale of Metropolitan Park in January 2020.
|
| | | | | $ | 1,812,857 |
|
| | | | | 22.520 | % |
|
| |
| FINANCIAL HIGHLIGHTS | DECEMBER 31, 2019 (Unaudited)
|
|
| | | | | | | |
| dollars in thousands, except per share data | Three Months Ended December 31, 2019 | | Year Ended December 31, 2019 |
| | | | |
| Summary Financial Results | | | |
| Total revenue | $ | 164,877 |
| | $ | 647,770 |
|
| Net income attributable to common shareholders | $ | 34,390 |
| | $ | 65,571 |
|
| Per diluted common share | $ | 0.25 |
| | $ | 0.48 |
|
| Operating portfolio NOI | $ | 82,600 |
| | $ | 319,561 |
|
FFO (1) | $ | 34,228 |
| | $ | 169,896 |
|
| Per operating partnership common unit | $ | 0.23 |
| | $ | 1.15 |
|
Core FFO (1) | $ | 59,362 |
| | $ | 237,108 |
|
| Per operating partnership common unit | $ | 0.39 |
| | $ | 1.61 |
|
FAD (1) | $ | 28,790 |
| | $ | 139,682 |
|
| FAD payout ratio | 118.1 | % | | 95.4 | % |
EBITDA (1) | $ | 109,962 |
| | $ | 353,987 |
|
EBITDAre (1) | $ | 52,092 |
| | $ | 248,661 |
|
Adjusted EBITDA (1) | $ | 77,582 |
| | $ | 311,324 |
|
Net debt / total enterprise value (2) | 22.5 | % | | 22.5 | % |
Net debt to annualized adjusted EBITDA (3) | 5.8x |
| | 5.8x |
|
| | | | |
| | December 31, 2019 | | |
| | | | |
| Debt Summary and Key Ratios (at JBG SMITH Share) | | | |
Total consolidated indebtedness (4) | $ | 1,620,001 |
| | |
Total consolidated and unconsolidated indebtedness (4) | $ | 1,949,057 |
| | |
| Weighted average interest rates: | | | |
| Variable rate debt | 3.54 | % | | |
| Fixed rate debt | 4.20 | % | | |
| Total debt | 4.03 | % | | |
| Cash and cash equivalents | $ | 136,200 |
| | |
____________________
| |
| (1) | Attributable to operating partnership common units, which include units owned by JBG SMITH. |
| |
| (2) | Calculated using closing share price as of February 21, 2020. |
| |
| (3) | Pro forma Net Debt to Annualized Adjusted EBITDA would have been 5.3x for the three months and year ended December 31, 2019, which includes the $155.0 million of net proceeds from the sale of Metropolitan Park in January 2020. |
| |
| (4) | Net of premium/discount and deferred financing costs. |
|
| |
| FINANCIAL HIGHLIGHTS - TRENDS | DECEMBER 31, 2019 (Unaudited)
|
|
| | | | | | | | | | | | | | | | |
| | | Three Months Ended |
| dollars in thousands, except per share data, at JBG SMITH share | | Q4 2019 | Q3 2019 | Q2 2019 | Q1 2019 | Q4 2018 |
| Commercial NOI | | $ | 61,999 |
| $ | 57,840 |
| $ | 59,735 |
| $ | 59,304 |
| $ | 65,462 |
|
| Multifamily NOI | | 20,601 |
| 20,436 |
| 20,569 |
| 20,357 |
| 20,078 |
|
Operating portfolio NOI (1) | | $ | 82,600 |
| $ | 78,276 |
| $ | 80,304 |
| $ | 79,661 |
| $ | 85,540 |
|
| Total annualized NOI | | $ | 328,207 |
| $ | 313,224 |
| $ | 322,026 |
| $ | 321,583 |
| $ | 341,849 |
|
| | | | | | | |
| Net income (loss) attributable to common shareholders | | $ | 34,390 |
| $ | 9,360 |
| $ | (3,040 | ) | $ | 24,861 |
| $ | 710 |
|
| Per diluted common share | | $ | 0.25 |
| $ | 0.06 |
| $ | (0.03 | ) | $ | 0.20 |
| $ | (0.01 | ) |
FFO (1) (2) | | $ | 34,228 |
| $ | 51,321 |
| $ | 44,445 |
| $ | 39,902 |
| $ | 44,834 |
|
| Per operating partnership common unit | | $ | 0.23 |
| $ | 0.34 |
| $ | 0.30 |
| $ | 0.28 |
| $ | 0.32 |
|
Core FFO (1) (2) | $ | 59,362 |
| $ | 66,053 |
| $ | 61,437 |
| $ | 50,256 |
| $ | 56,948 |
|
| Per operating partnership common unit | | $ | 0.39 |
| $ | 0.44 |
| $ | 0.41 |
| $ | 0.36 |
| $ | 0.41 |
|
FAD (2) (3) | | $ | 28,790 |
| $ | 46,232 |
| $ | 37,520 |
| $ | 27,140 |
| $ | 20,736 |
|
| FAD payout ratio | | 118.1 | % | 73.6 | % | 90.6 | % | 115.3 | % | 150.9 | % |
EBITDA (1) (2) | | $ | 109,962 |
| $ | 77,073 |
| $ | 66,178 |
| $ | 100,774 |
| $ | 97,503 |
|
EBITDAre (1) (2) | $ | 52,092 |
| $ | 68,985 |
| $ | 65,843 |
| $ | 61,741 |
| $ | 70,555 |
|
Adjusted EBITDA (1) (2) | | $ | 77,582 |
| $ | 82,419 |
| $ | 79,997 |
| $ | 71,326 |
| $ | 82,608 |
|
Net debt / total enterprise value (4) | | 22.5 | % | 22.9 | % | 22.2 | % | 26.3 | % | 31.0 | % |
Net debt to annualized adjusted EBITDA (4) (5) | | 5.8x |
| 5.3x |
| 5.2x |
| 7.1x |
| 6.5x |
|
| | | | | | | |
| | | Q4 2019 | Q3 2019 | Q2 2019 | Q1 2019 | Q4 2018 |
| | | | | | | |
| Number of Operating Assets | | | | | | |
| Commercial | | 44 |
| 45 |
| 46 |
| 45 |
| 46 |
|
| Multifamily | | 18 |
| 16 |
| 16 |
| 16 |
| 16 |
|
| Total | | 62 |
| 61 |
| 62 |
| 61 |
| 62 |
|
| | | | | | | |
| Operating Portfolio % Leased | | | | | | |
Commercial (6) | | 91.4 | % | 90.2 | % | 90.3 | % | 90.2 | % | 89.6 | % |
Multifamily (7) | | 89.5 | % | 96.5 | % | 98.0 | % | 97.0 | % | 95.7 | % |
| Weighted Average | | 90.8 | % | 91.9 | % | 92.3 | % | 92.0 | % | 91.2 | % |
| | | | | | | |
Operating Portfolio % Occupied (8) | | | | | | |
Commercial (6) | | 88.2 | % | 86.8 | % | 86.0 | % | 85.6 | % | 85.5 | % |
Multifamily (7) | | 87.2 | % | 94.9 | % | 95.0 | % | 94.8 | % | 93.9 | % |
| Weighted Average | | 87.9 | % | 89.0 | % | 88.4 | % | 88.1 | % | 87.7 | % |
See footnotes on page 9.
|
| |
| FINANCIAL HIGHLIGHTS - TRENDS | DECEMBER 31, 2019 (Unaudited)
|
Footnotes
Note: See appendices for reconciliations of non-GAAP financial measures to their respective comparable GAAP financial measures.
| |
| (1) | Due to our adoption of the new accounting standard for leases, beginning in 2019, we no longer capitalize internal leasing costs and expense these costs as incurred (such costs were $2.2 million for Q4 2018). |
| |
| (2) | Attributable to operating partnership common units, which include units owned by JBG SMITH. |
| |
| (3) | Q4 2019 and Q4 2018 were impacted by increases in recurring capital expenditures, which is consistent with historical seasonality trends. |
| |
| (4) | Q4 2019 calculated using closing share price as of February 21, 2020. In Q2 2019, we closed an underwritten public offering of 11.5 million common shares that generated net proceeds of $472.8 million. |
| |
| (5) | Pro forma Net Debt to Annualized Adjusted EBITDA would have been 5.3x in Q4 2019, which includes the $155.0 million of net proceeds from the sale of Metropolitan Park in January 2020. |
| |
| (6) | Crystal City Marriott and 1700 M Street are excluded from the percent leased and the percent occupied metrics. |
| |
| (7) | Includes recently delivered assets. In service assets were 95.1% leased and 93.3% occupied as of Q4 2019. |
| |
| (8) | Percent occupied excludes occupied retail square feet. |
|
| |
PORTFOLIO OVERVIEW
| DECEMBER 31, 2019 (Unaudited)
|
|
| | | | | | | | | | | | | | | | | | | | | | | | | | |
| | | | | 100% Share | | At JBG SMITH Share |
| | | Number of Assets | | Square Feet/Units | | Square Feet/Units | | %
Leased | | % Occupied | | Annualized
Rent (in thousands) | | Annualized Rent per Square Foot/Monthly Rent Per Unit (1) | Annualized NOI (in thousands) |
| | | | | | | | | | | | | | | | |
| Operating | | | | | | | | | | | | | | | |
Commercial (2) | | | | | | | | | | | | | | | |
| In service | | 43 |
| | 12,520,856 |
| | 10,602,754 |
| | 91.5 | % | | 88.3 | % | | $ | 401,114 |
| | $ | 44.27 |
| $ | 243,703 |
|
| Recently delivered | | 1 |
| | 215,213 |
| | 105,444 |
| | 85.7 | % | | 79.2 | % | | 4,595 |
| | 54.99 |
| 2,100 |
|
| Total / weighted average | | 44 |
| | 12,736,069 |
| | 10,708,198 |
| | 91.4 | % | | 88.2 | % | | $ | 405,709 |
| | $ | 44.38 |
| $ | 245,803 |
|
| Multifamily | | | | | | | | | | | | | | | |
| In service | | 17 |
| | 6,646 |
| | 4,862 |
| | 95.1 | % | | 93.3 | % | | $ | 125,854 |
| | $ | 2,193 |
| $ | 81,936 |
|
| Recently delivered | | 1 |
| | 465 |
| | 465 |
| | 30.2 | % | | 23.9 | % | | 4,604 |
| | 2,248 |
| 468 |
|
| Total / weighted average | | 18 |
| | 7,111 |
| | 5,327 |
| | 89.5 | % | | 87.2 | % | | $ | 130,458 |
| | $ | 2,195 |
| $ | 82,404 |
|
| | | | | | | | | | | | | | | | |
| Operating - In Service | | 60 |
| | 12,520,856 SF/ 6,646 Units |
| | 10,602,754 SF/ 4,862 Units |
| | 92.5 | % | | 89.8 | % | | $ | 526,968 |
| | $44.27 per SF/ $2,193 per unit |
| $ | 325,639 |
|
| | | 2 |
| | | | | | | | | | | | | |
| Operating - Recently Delivered | | 2 |
| | 215,213 SF/ 465 Units |
| | 105,444 SF/ 465 Units |
| | 42.1 | % | | 36.8 | % | | $ | 9,199 |
| | $54.99 per SF/ $2,248 per unit |
| $ | 2,568 |
|
| | | | | | | | | | | 88.1 | % | | | | | |
| Operating - Total / Weighted Average | | 62 |
| | 12,736,069 SF/ 7,111 Units |
| | 10,708,198 SF/ 5,327 Units |
| | 90.8 | % | | 87.9 | % | | $ | 536,167 |
| | $44.38 per SF/ $2,195 per unit |
| $ | 328,207 |
|
| | | | | | | | | | | | | | | | |
Development (3) | | | | | | | | | | | | | | | |
| Under Construction | | | | | | | | | | | | | | | |
Commercial (4) | | 4 |
| | 943,244 |
| | 821,099 |
| | 86.8 | % | | | | | | | |
| Multifamily | | 3 |
| | 1,011 |
| | 833 |
| | N/A |
| | | | | | | |
| | | | | | | | | | | | | | | | |
| Development - Total | | 7 |
| | 943,244 SF/
1,011 Units |
| | 821,099 SF/
833 Units |
| | 86.8 | % | | | | | | | |
| | | | | | | | | | | | | | | | |
| Future Development | | 40 |
| | 21,921,200 |
| | 18,667,300 |
| | | | | | | | | |
_______________
| |
| (1) | For commercial assets, represents annualized office rent divided by occupied office square feet; annualized retail rent and retail square feet are excluded from this metric. For multifamily assets, represents monthly multifamily rent divided by occupied units; retail rent is excluded from this metric. Crystal City Marriott and 1700 M Street are excluded from annualized rent per square foot metrics. Occupied square footage may differ from leased square footage because leased square footage includes leases that have been signed but have not yet commenced. |
| |
| (2) | Crystal City Marriott and 1700 M Street are excluded from percent leased, percent occupied, annualized rent, and annualized rent per square foot metrics. |
| |
| (3) | Refer to pages 41-42 for detail on Under Construction assets and Future Development pipeline. |
| |
| (4) | Includes JBG SMITH’s lease for approximately 84,400 square feet at 4747 Bethesda Avenue. |
|
| |
| CONDENSED CONSOLIDATED BALANCE SHEETS | DECEMBER 31, 2019 (Unaudited)
|
|
| | | | | | | |
| in thousands | December 31,
2019 | | December 31,
2018 |
| | | | |
| ASSETS | |
| Real estate, at cost: | | | |
| Land and improvements | $ | 1,240,455 |
| | $ | 1,371,874 |
|
| Buildings and improvements | 3,880,973 |
| | 3,722,930 |
|
| Construction in progress, including land | 654,091 |
| | 697,930 |
|
| | 5,775,519 |
| | 5,792,734 |
|
| Less accumulated depreciation | (1,119,571 | ) | | (1,051,875 | ) |
| Real estate, net | 4,655,948 |
| | 4,740,859 |
|
| Cash and cash equivalents | 126,413 |
| | 260,553 |
|
| Restricted cash | 16,103 |
| | 138,979 |
|
| Tenant and other receivables, net | 52,941 |
| | 46,568 |
|
Deferred rent receivable, net
| 169,721 |
| | 143,473 |
|
| Investments in unconsolidated real estate ventures | 543,026 |
| | 322,878 |
|
Other assets, net
| 253,687 |
| | 264,994 |
|
| Assets held for sale | 168,412 |
| | 78,981 |
|
| TOTAL ASSETS | $ | 5,986,251 |
| | $ | 5,997,285 |
|
| | | | |
| LIABILITIES, REDEEMABLE NONCONTROLLING INTERESTS AND EQUITY | | | |
| Liabilities: | | | |
| Mortgages payable, net | $ | 1,125,777 |
| | $ | 1,838,381 |
|
| Revolving credit facility | 200,000 |
| | — |
|
| Unsecured term loans, net | 297,295 |
| | 297,129 |
|
| Accounts payable and accrued expenses | 157,702 |
| | 130,960 |
|
| Other liabilities, net | 206,042 |
| | 181,606 |
|
| Liabilities related to assets held for sale | — |
| | 3,717 |
|
| Total liabilities | 1,986,816 |
| | 2,451,793 |
|
| Commitments and contingencies | | | |
| Redeemable noncontrolling interests | 612,758 |
| | 558,140 |
|
| Total equity | 3,386,677 |
| | 2,987,352 |
|
| TOTAL LIABILITIES, REDEEMABLE NONCONTROLLING INTERESTS AND EQUITY | $ | 5,986,251 |
| | $ | 5,997,285 |
|
_______________
Note: For complete financial statements, please refer to the Company's Annual Report on Form 10-K for the year ended December 31, 2019.
|
| |
| CONDENSED CONSOLIDATED STATEMENTS OF OPERATIONS | DECEMBER 31, 2019 (Unaudited)
(Unaudited) (In thousands) |
|
| | | | | | | | | | | | | | | |
| in thousands, except per share data | Three Months Ended December 31, | | Year Ended December 31, |
| | 2019 | | 2018 | | 2019 | | 2018 |
| REVENUE | | | | | | | |
| Property rentals | $ | 127,571 |
| | $ | 129,048 |
| | $ | 493,273 |
| | $ | 513,447 |
|
| Third-party real estate services, including reimbursements | 29,121 |
| | 26,421 |
| | 120,886 |
| | 98,699 |
|
| Other revenue | 8,185 |
| | 7,786 |
| | 33,611 |
| | 32,036 |
|
| Total revenue | 164,877 |
| | 163,255 |
| | 647,770 |
| | 644,182 |
|
| EXPENSES | | | | | | | |
| Depreciation and amortization | 50,004 |
| | 67,556 |
| | 191,580 |
| | 211,436 |
|
| Property operating | 37,535 |
| | 40,076 |
| | 137,622 |
| | 148,081 |
|
| Real estate taxes | 18,252 |
| | 17,030 |
| | 70,493 |
| | 71,054 |
|
| General and administrative: | | | | | | | |
| Corporate and other | 11,934 |
| | 8,512 |
| | 46,822 |
| | 33,728 |
|
| Third-party real estate services | 26,910 |
| | 25,274 |
| | 113,495 |
| | 89,826 |
|
Share-based compensation related to Formation Transaction and
special equity awards
| 11,959 |
| | 9,118 |
| | 42,162 |
| | 36,030 |
|
| Transaction and other costs | 13,307 |
| | 15,572 |
| | 23,235 |
| | 27,706 |
|
| Total expenses | 169,901 |
| | 183,138 |
| | 625,409 |
| | 617,861 |
|
| OTHER INCOME (EXPENSE) |
|
| |
| |
| |
|
| Income (loss) from unconsolidated real estate ventures, net | (2,042 | ) | | 23,991 |
| | (1,395 | ) | | 39,409 |
|
| Interest and other income, net | 3,022 |
| | 9,991 |
| | 5,385 |
| | 15,168 |
|
| Interest expense | (11,831 | ) | | (18,184 | ) | | (52,695 | ) | | (74,447 | ) |
| Gain on sale of real estate | 57,870 |
| | 6,394 |
| | 104,991 |
| | 52,183 |
|
| Loss on extinguishment of debt | (3,916 | ) | | (617 | ) | | (5,805 | ) | | (5,153 | ) |
| Reduction of gain on bargain purchase | — |
| | — |
| | — |
| | (7,606 | ) |
| Total other income (expense) | 43,103 |
| | 21,575 |
| | 50,481 |
| | 19,554 |
|
| INCOME BEFORE INCOME TAX (EXPENSE) BENEFIT | 38,079 |
| | 1,692 |
| | 72,842 |
| | 45,875 |
|
| Income tax (expense) benefit | 613 |
| | (698 | ) | | 1,302 |
| | 738 |
|
| NET INCOME | 38,692 |
| | 994 |
| | 74,144 |
| | 46,613 |
|
| Net income attributable to redeemable noncontrolling interests | (4,302 | ) | | (178 | ) | | (8,573 | ) | | (6,710 | ) |
| Net (income) loss attributable to noncontrolling interests | — |
| | (106 | ) | | — |
| | 21 |
|
| NET INCOME ATTRIBUTABLE TO COMMON SHAREHOLDERS | $ | 34,390 |
| | $ | 710 |
| | $ | 65,571 |
| | $ | 39,924 |
|
| EARNINGS (LOSS) PER COMMON SHARE: | | | | | | | |
| Basic | $ | 0.25 |
| | $ | (0.01 | ) | | $ | 0.48 |
| | $ | 0.31 |
|
| Diluted | $ | 0.25 |
| | $ | (0.01 | ) | | $ | 0.48 |
| | $ | 0.31 |
|
| WEIGHTED AVERAGE NUMBER OF COMMON SHARES OUTSTANDING : | | | | | | | |
| Basic | 134,129 |
| | 120,917 |
| | 130,687 |
| | 119,176 |
|
| Diluted | 134,129 |
| | 120,917 |
| | 130,687 |
| | 119,176 |
|
___________________
Note: For complete financial statements, please refer to the Company's Annual Report on Form 10-K for the year ended December 31, 2019.
|
| |
UNCONSOLIDATED REAL ESTATE VENTURES | DECEMBER 31, 2019 (Unaudited)
|
|
| | | |
| in thousands, at JBG SMITH share | |
| BALANCE SHEET INFORMATION | December 31, 2019 |
| | |
| Total real estate, at cost | $ | 855,713 |
|
| Less accumulated depreciation | (41,450 | ) |
| Real estate, net | 814,263 |
|
| Cash and cash equivalents | 9,797 |
|
Other assets, net
| 91,382 |
|
| Total assets | $ | 915,442 |
|
| Borrowings, net | $ | 329,056 |
|
| Other liabilities, net | 57,957 |
|
| Total liabilities | $ | 387,013 |
|
|
| | | | | | | |
| OPERATING INFORMATION | Three Months Ended December 31, 2019 | | Year Ended December 31, 2019 |
| Total revenue | $ | 16,872 |
| | $ | 63,615 |
|
| Expenses: | | | |
| Depreciation and amortization | 6,426 |
| | 20,657 |
|
| Property operating | 9,298 |
| | 32,163 |
|
| Real estate taxes | 1,780 |
| | 6,282 |
|
| Total expenses | 17,504 |
| | 59,102 |
|
| Other income (expense): |
| |
|
| Interest expense | (3,584 | ) | | (15,389 | ) |
| Gain on the sale of real estate | — |
| | 335 |
|
| Interest and other income, net | 1,354 |
| | 1,946 |
|
| Loss before income tax expense | (2,862 | ) | | (8,595 | ) |
| Income tax expense | (34 | ) | | (59 | ) |
| Net loss | $ | (2,896 | ) | | $ | (8,654 | ) |
Earnings and distributions in excess of our investment in unconsolidated real estate venture | 518 |
| | 7,356 |
|
| Other | 336 |
| | (97 | ) |
| Loss from unconsolidated real estate ventures, net | $ | (2,042 | ) | | $ | (1,395 | ) |
|
| |
| OTHER TANGIBLE ASSETS AND LIABILITIES | DECEMBER 31, 2019 (Unaudited)
|
|
| | | |
| in thousands, at JBG SMITH share | December 31, 2019 |
| | |
Other Tangible Assets, Net (1) (2) | |
| Restricted cash | $ | 19,986 |
|
| Tenant and other receivables, net | 59,028 |
|
| Other assets, net | 28,752 |
|
| Total Other Tangible Assets, Net | $ | 107,766 |
|
| | |
Other Tangible Liabilities, Net (2) (3) | |
| Accounts payable and accrued liabilities | $ | 185,026 |
|
| Other liabilities, net | 180,734 |
|
| Total Other Tangible Liabilities, Net | $ | 365,760 |
|
____________________
| |
| (1) | Excludes cash and cash equivalents. |
| |
| (2) | Excludes assets held for sale and liabilities related to assets held for sale. |
|
| |
| EBITDA, EBITDAre AND ADJUSTED EBITDA (NON-GAAP) | DECEMBER 31, 2019 (Unaudited)
|
|
| | | | | | | | | | | | | | | |
| dollars in thousands | Three Months Ended December 31, | | Year Ended December 31, |
| | 2019 | | 2018 | | 2019 | | 2018 |
| | | | | | | | |
| EBITDA, EBITDAre and Adjusted EBITDA | | | | | | | |
| Net income | $ | 38,692 |
| | $ | 994 |
| | $ | 74,144 |
| | $ | 46,613 |
|
| Depreciation and amortization expense | 50,004 |
| | 67,556 |
| | 191,580 |
| | 211,436 |
|
Interest expense (1) | 11,831 |
| | 18,184 |
| | 52,695 |
| | 74,447 |
|
| Income tax expense (benefit) | (613 | ) | | 698 |
| | (1,302 | ) | | (738 | ) |
| Unconsolidated real estate ventures allocated share of above adjustments | 10,050 |
| | 10,253 |
| | 36,877 |
| | 42,016 |
|
| Net income attributable to noncontrolling interests in consolidated real estate ventures | (2 | ) | | (182 | ) | | (7 | ) | | (53 | ) |
EBITDA (2) | $ | 109,962 |
| | $ | 97,503 |
| | $ | 353,987 |
| | $ | 373,721 |
|
| Gain on sale of real estate | (57,870 | ) | | (6,394 | ) | | (104,991 | ) | | (52,183 | ) |
| Gain on sale from unconsolidated real estate ventures | — |
| | (20,554 | ) | | (335 | ) | | (36,042 | ) |
EBITDAre (2) | $ | 52,092 |
| | $ | 70,555 |
| | $ | 248,661 |
| | $ | 285,496 |
|
Transaction and other costs (3) | 13,307 |
| | 15,572 |
| | 23,235 |
| | 27,706 |
|
| Loss on extinguishment of debt, net of noncontrolling interests | 3,916 |
| | 617 |
| | 5,805 |
| | 5,029 |
|
| Reduction of gain on bargain purchase | — |
| | — |
| | — |
| | 7,606 |
|
| Share-based compensation related to Formation Transaction and special equity awards | 11,959 |
| | 9,118 |
| | 42,162 |
| | 36,030 |
|
Losses and distributions in excess of our investment in unconsolidated real estate venture (4) | (518 | ) | | (7,374 | ) | | (7,356 | ) | | (13,676 | ) |
| Unconsolidated real estate ventures allocated share of above adjustments | (1,345 | ) | | 1,542 |
| | (1,345 | ) | | 1,572 |
|
| Lease liability adjustments | (1,829 | ) | | (7,422 | ) | | 162 |
| | (9,965 | ) |
Adjusted EBITDA (2) | $ | 77,582 |
| | $ | 82,608 |
| | $ | 311,324 |
| | $ | 339,798 |
|
| | | | | | | | |
Net Debt to Annualized Adjusted EBITDA (5) (6) | 5.8x |
| | 6.5x |
| | 5.8x |
| | 6.3x |
|
| | | | | | | | |
| | December 31, 2019 | | December 31, 2018 | | | | |
| Net Debt (at JBG SMITH Share) | | | | | | | |
Consolidated indebtedness (7) | $ | 1,620,001 |
| | $ | 2,130,704 |
| | | | |
Unconsolidated indebtedness (7) | 329,056 |
| | 298,588 |
| | | | |
| Total consolidated and unconsolidated indebtedness | 1,949,057 |
| | 2,429,292 |
| | | | |
| Less: cash and cash equivalents | 136,200 |
| | 273,611 |
| | | | |
| Net Debt (at JBG SMITH Share) | $ | 1,812,857 |
| | $ | 2,155,681 |
| | | | |
| | $ | (0.14 | ) | | | | | | |
____________________
Note: All EBITDA measures as shown above are attributable to operating partnership common units.
| |
| (1) | Interest expense includes the amortization of deferred financing costs and the ineffective portion of any interest rate swaps or caps, net of capitalized interest. |
| |
| (2) | Due to our adoption of the new accounting standard for leases, beginning in 2019, we no longer capitalize internal leasing costs and expense these costs as incurred (such costs were $2.2 million and $6.5 million for the three months and year ended December 31, 2018). |
| |
| (3) | Includes fees and expenses incurred for the relocation of our corporate headquarters, demolition costs, fees and expenses incurred in connection with the Formation Transaction (including amounts incurred for transition services provided by our former parent, integration costs and severance costs), pursuit costs related to other completed, potential and pursued transactions, as well as other expenses. |
| |
| (4) | As of June 30, 2018, we suspended the equity method of accounting for our investment in the real estate venture that owns 1101 17th Street as our investment had been reduced to zero and we did not have an obligation to provide further financial support to the venture. All subsequent distributions from the venture have been recognized as income, which will continue until our share of unrecorded earnings and contributions exceed the cumulative excess distributions previously recognized. |
| |
| (5) | Adjusted EBITDA for the three months ended December 31, 2019 and 2018 is annualized by multiplying by four. |
| |
| (6) | Pro forma Net Debt to Annualized Adjusted EBITDA would have been 5.3x for the three months and year ended December 31, 2019, which includes the $155.0 million of net proceeds from the sale of Metropolitan Park in January 2020. |
| |
| (7) | Net of premium/discount and deferred financing costs. |
|
| |
| FFO, CORE FFO AND FAD (NON-GAAP) | DECEMBER 31, 2019 (Unaudited)
|
|
| | | | | | | | | | | | | | | |
| in thousands, except per share data | Three Months Ended December 31, | | Year Ended December 31, |
| | 2019 | | 2018 | | 2019 | | 2018 |
| | | | | | | | |
| FFO and Core FFO | | | | | | | |
| Net income attributable to common shareholders | $ | 34,390 |
| | $ | 710 |
| | $ | 65,571 |
| | $ | 39,924 |
|
| Net income attributable to redeemable noncontrolling interests | 4,302 |
| | 178 |
| | 8,573 |
| | 6,710 |
|
| Net income (loss) attributable to noncontrolling interests | — |
| | 106 |
| | — |
| | (21 | ) |
| Net income | 38,692 |
| | 994 |
| | 74,144 |
| | 46,613 |
|
| Gain on sale of real estate | (57,870 | ) | | (6,394 | ) | | (104,991 | ) | | (52,183 | ) |
| Gain on sale from unconsolidated real estate ventures | — |
| | (20,554 | ) | | (335 | ) | | (36,042 | ) |
| Real estate depreciation and amortization | 47,001 |
| | 64,891 |
| | 180,508 |
| | 201,062 |
|
| Pro rata share of real estate depreciation and amortization from unconsolidated real estate ventures | 6,407 |
| | 6,079 |
| | 20,577 |
| | 25,039 |
|
| Net income attributable to noncontrolling interests in consolidated real estate ventures | (2 | ) | | (182 | ) | | (7 | ) | | (51 | ) |
FFO Attributable to Operating Partnership Common Units (1) | $ | 34,228 |
| | $ | 44,834 |
| | $ | 169,896 |
| | $ | 184,438 |
|
| FFO attributable to redeemable noncontrolling interests | (3,804 | ) | | (5,741 | ) | | (19,306 | ) | | (25,798 | ) |
FFO attributable to common shareholders (1) | $ | 30,424 |
| | $ | 39,093 |
| | $ | 150,590 |
| | $ | 158,640 |
|
| | | | | | | | |
| FFO attributable to the operating partnership common units | $ | 34,228 |
| | $ | 44,834 |
| | $ | 169,896 |
| | $ | 184,438 |
|
Transaction and other costs, net of tax (2) | 11,725 |
| | 14,509 |
| | 21,139 |
| | 25,625 |
|
| (Gain) loss from mark-to-market on derivative instruments | — |
| | (542 | ) | | 50 |
| | (1,941 | ) |
| Loss on extinguishment of debt, net of noncontrolling interests | 3,916 |
| | 617 |
| | 5,805 |
| | 5,029 |
|
Losses and distributions in excess of our investment in unconsolidated real estate venture (3) | (518 | ) | | (7,374 | ) | | (7,356 | ) | | (13,676 | ) |
| Reduction of gain on bargain purchase | — |
| | — |
| | — |
| | 7,606 |
|
| Share-based compensation related to Formation Transaction and special equity awards | 11,959 |
| | 9,118 |
| | 42,162 |
| | 36,030 |
|
| Lease liability adjustments | (1,829 | ) | | (7,422 | ) | | 162 |
| | (9,965 | ) |
| Amortization of management contracts intangible, net of tax | 1,288 |
| | 1,287 |
| | 5,150 |
| | 5,148 |
|
| Unconsolidated real estate ventures allocated share of above adjustments | (1,407 | ) | | 1,921 |
| | 100 |
| | 1,440 |
|
Core FFO Attributable to Operating Partnership Common Units (1) | $ | 59,362 |
| | $ | 56,948 |
| | $ | 237,108 |
| | $ | 239,734 |
|
| Core FFO attributable to redeemable noncontrolling interests | (6,598 | ) | | (7,292 | ) | | (26,895 | ) | | (33,536 | ) |
Core FFO attributable to common shareholders (1) | $ | 52,764 |
| | $ | 49,656 |
| | $ | 210,213 |
| | $ | 206,198 |
|
| FFO per diluted common share | $ | 0.23 |
| | $ | 0.32 |
| | $ | 1.15 |
| | $ | 1.33 |
|
| Core FFO per diluted common share | $ | 0.39 |
| | $ | 0.41 |
| | $ | 1.61 |
| | $ | 1.73 |
|
| Weighted average diluted shares | 134,129 |
| | 120,917 |
| | 130,687 |
| | 119,176 |
|
|
| | | | | | | | | | | | | | | |
| FAD | | | | | | | |
| Core FFO attributable to the operating partnership common units | $ | 59,362 |
| | $ | 56,948 |
| | $ | 237,108 |
| | $ | 239,734 |
|
| Recurring capital expenditures and second generation tenant improvements and leasing commissions | (27,689 | ) | | (35,836 | ) | | (84,934 | ) | | (72,113 | ) |
Straight-line and other rent adjustments (4) | (8,464 | ) | | (6,692 | ) | | (34,359 | ) | | (10,351 | ) |
| Third-party lease liability assumption payments | (1,450 | ) | | (1,130 | ) | | (5,182 | ) | | (3,133 | ) |
| Share-based compensation expense | 5,512 |
| | 4,666 |
| | 22,665 |
| | 19,762 |
|
| Amortization of debt issuance costs | 671 |
| | 1,140 |
| | 3,217 |
| | 4,660 |
|
| Unconsolidated real estate ventures allocated share of above adjustments | (386 | ) | | 747 |
| | (2,820 | ) | | 1,426 |
|
| Non-real estate depreciation and amortization | 1,234 |
| | 893 |
| | 3,987 |
| | 3,286 |
|
FAD available to the Operating Partnership Common Units (A) (1) | $ | 28,790 |
| | $ | 20,736 |
| | $ | 139,682 |
| | $ | 183,271 |
|
Distributions to common shareholders and unitholders (5) (B) | $ | 34,011 |
| | $ | 31,284 |
| | $ | 133,307 |
| | $ | 125,100 |
|
FAD Payout Ratio (B÷A) (6) | 118.1 | % | | 150.9 | % | | 95.4 | % | | 68.3 | % |
See footnotes on page 17.
|
| |
| FFO, CORE FFO AND FAD (NON-GAAP) | DECEMBER 31, 2019 (Unaudited)
|
|
| | | | | | | | | | | | | | | |
| in thousands, except per share data | Three Months Ended December 31, | | Year Ended December 31, |
| | 2019 | | 2018 | | 2019 | | 2018 |
| | | | | | | | |
| Capital Expenditures | | | | | | | |
| Maintenance and recurring capital expenditures | $ | 11,748 |
| | $ | 14,445 |
| | $ | 31,495 |
| | $ | 28,230 |
|
| Share of maintenance and recurring capital expenditures from unconsolidated real estate ventures | 561 |
| | 978 |
| | 1,340 |
| | 2,821 |
|
| Second generation tenant improvements and leasing commissions | 13,426 |
| | 19,211 |
| | 48,651 |
| | 37,980 |
|
| Share of second generation tenant improvements and leasing commissions from unconsolidated real estate ventures | 1,954 |
| | 1,202 |
| | 3,448 |
| | 3,082 |
|
| Recurring capital expenditures and second generation tenant improvements and leasing commissions | 27,689 |
| | 35,836 |
| | 84,934 |
| | 72,113 |
|
| First generation tenant improvements and leasing commissions | 20,057 |
| | 8,215 |
| | 51,751 |
| | 23,519 |
|
| Share of first generation tenant improvements and leasing commissions from unconsolidated real estate ventures | 2,672 |
| | 17 |
| | 3,831 |
| | 2,572 |
|
| Non-recurring capital expenditures | 16,410 |
| | 15,375 |
| | 36,967 |
| | 25,401 |
|
| Share of non-recurring capital expenditures from unconsolidated joint ventures | 488 |
| | 112 |
| | 602 |
| | 1,174 |
|
| Non-recurring capital expenditures | 39,627 |
| | 23,719 |
| | 93,151 |
| | 52,666 |
|
| Total JBG SMITH Share of Capital Expenditures | $ | 67,316 |
| | $ | 59,555 |
| | $ | 178,085 |
| | $ | 124,779 |
|
_______________
Note: FFO attributable to operating partnership common units.
| |
| (1) | Due to our adoption of the new accounting standard for leases, beginning in 2019, we no longer capitalize internal leasing costs and expense these costs as incurred (such costs were $2.2 million and $6.5 million for the three months and year ended December 31, 2018). |
| |
| (2) | Includes fees and expenses incurred for the relocation of our corporate headquarters, demolition costs, fees and expenses incurred in connection with the Formation Transaction (including amounts incurred for transition services provided by our former parent, integration costs and severance costs), pursuit costs related to other completed, potential and pursued transactions, as well as other expenses. |
| |
| (3) | As of June 30, 2018, we suspended the equity method of accounting for our investment in the real estate venture that owns 1101 17th Street as our investment had been reduced to zero and we did not have an obligation to provide further financial support to the venture. All subsequent distributions from the venture have been recognized as income, which will continue until our share of unrecorded earnings and contributions exceed the cumulative excess distributions previously recognized. |
| |
| (4) | Includes straight-line rent, above/below market lease amortization and lease incentive amortization. |
| |
| (5) | The distribution for the year ended December 31, 2019 excludes a special dividend of $0.10 per common share that was paid in January 2019. |
| |
| (6) | The FAD payout ratio on a quarterly basis is not necessarily indicative of an amount for the full year due to fluctuation in timing of capital expenditures, the commencement of new leases and the seasonality of our operations. Q4 2019 and Q4 2018 were impacted by increases in recurring capital expenditures, which is consistent with historical seasonality trends. |
|
| |
THIRD-PARTY ASSET MANAGEMENT AND REAL ESTATE SERVICES BUSINESS (NON-GAAP) | DECEMBER 31, 2019 (Unaudited)
|
|
| | | | | | | | | | | | |
dollars in thousands, at JBG SMITH share
| Three Months Ended December 31, 2019 |
| | Source of Revenue | |
| | Third-Party Management |
JBG SMITH JV Partner (1) | JBG Legacy Funds | Total |
| | | | | |
| Service Revenue | | | | |
| Property management fees | $ | 2,763 |
| $ | 1,195 |
| $ | 1,170 |
| $ | 5,128 |
|
| Asset management fees | — |
| 548 |
| 2,810 |
| 3,358 |
|
| Leasing fees | 1,320 |
| 633 |
| 92 |
| 2,045 |
|
| Development fees | 3,072 |
| 408 |
| 1,263 |
| 4,743 |
|
| Construction management fees | 114 |
| 78 |
| — |
| 192 |
|
| Other service revenue | 432 |
| 267 |
| (188 | ) | 511 |
|
Total Revenue (2) | $ | 7,701 |
| $ | 3,129 |
| $ | 5,147 |
| $ | 15,977 |
|
Pro Rata adjusted general and administrative expense: third-party real estate services (3) | | | | (13,720 | ) |
Total Services Revenue Less Allocated General and Administrative Expenses (4) | |
|
|
|
| $ | 2,257 |
|
____________________
| |
| (1) | Service revenues from joint ventures are calculated on an asset-by-asset basis by applying our real estate venture partners’ respective economic interests to the fees we earned from each consolidated and unconsolidated real estate venture. |
| |
| (2) | Included in “Third-party real estate services, including reimbursements” in our consolidated statement of operations are $12.4 million of reimbursement revenue and $0.7 million of service revenue from our economic interest in consolidated and unconsolidated real estate ventures that are excluded from this table. |
| |
| (3) | Our personnel perform services for wholly owned properties and properties we manage on behalf of third parties, real estate ventures and JBG Legacy Funds. |
We allocate personnel and other costs to wholly owned properties (included in "Property operating expenses" and "General and administrative expense: corporate and other" in our consolidated statement of operations) and to properties owned by the third parties, real estate ventures and JBG Legacy Funds (included in "General and administrative expense: third-party real estate services" in our consolidated statement of operations) using estimates of the time spent performing services related to properties in the respective portfolios and other allocation methodologies.
Allocated general and administrative expenses related to real estate ventures are calculated on an asset-by-asset basis by applying our real estate venture partners’ respective economic interests to the total general and administrative expenses allocated to each asset. See "pro rata adjusted general and administrative expenses" on the next page for a reconciliation of "G&A: third-party real estate services" to "Pro Rata adjusted general and administrative expense: third-party real estate services."
| |
| (4) | Services revenue, excluding reimbursement revenue and service revenue from our economic interest in consolidated and unconsolidated real estate ventures, less allocated general and administrative expenses. Management uses this measure as a supplemental performance measure for its third-party asset management and real estate services business and believes it provides useful information to investors because it reflects only those revenue and expense items incurred by the Company and can be used to assess the profitability of the third-party asset management and real estate services business. |
|
| |
PRO RATA ADJUSTED GENERAL AND ADMINISTRATIVE EXPENSES (NON-GAAP) | DECEMBER 31, 2019 (Unaudited)
|
|
| | | | | | | | | | | | | | | |
| dollars in thousands | Three Months Ended December 31, 2019 |
| | Per Statement of Operations | Adjustments (1) | Pro Rata Adjusted |
| | A | B | C |
| | | | | | |
| General and Administrative Expenses | | | | | |
| Corporate and other | $ | 11,934 |
| $ | — |
| $ | — |
| $ | 771 |
| $ | 12,705 |
|
| Third-party real estate services | 26,910 |
| — |
| (12,419 | ) | (771 | ) | 13,720 |
|
Share-based compensation related to Formation Transaction
and special equity awards
| 11,959 |
| (11,959 | ) | — |
| — |
| — |
|
| Total | $ | 50,803 |
| $ | (11,959 | ) | $ | (12,419 | ) | $ | — |
| $ | 26,425 |
|
_______________
|
|
A - Removes share-based compensation related to the Formation Transaction and special equity awards. |
B - Removes $12.4 million of G&A expenses reimbursed by third-party owners of real estate we manage related to revenue which has been excluded from Service Revenue on page 18. Revenue from reimbursements is included in "Third-party real estate services, including reimbursements" in our consolidated statement of operations. |
C - Reflects an adjustment to allocate our share of G&A expenses of unconsolidated real estate ventures from "Third-party real estate services" to "Corporate and other" and our consolidated real estate venture partners' share of G&A expenses from "Corporate and other" to "Third-party real estate services." |
|
| |
OPERATING ASSETS
| DECEMBER 31, 2019 (Unaudited)
|
|
| | | | | | | | | | | | | | | | | | |
| dollars in thousands, at JBG SMITH share | | | | | Plus: Signed But Not Yet Commenced Leases | Plus: Lease Up of Recently Delivered Assets (1) | Adjusted Annualized NOI |
| | | | Q4 2019 NOI | Annualized NOI |
| | % Occupied | |
| | | | | | | | |
Commercial (2) | | | | | | | |
| DC | 90.5 | % | | $ | 13,924 |
| $ | 55,696 |
| $ | 485 |
| $ | — |
| $ | 56,181 |
|
| VA | 87.8 | % | | 45,669 |
| 180,483 |
| 12,487 |
| — |
| 192,970 |
|
| MD | 87.7 | % | | 2,406 |
| 9,624 |
| 1,252 |
| — |
| 10,876 |
|
| Total / weighted average | 88.2 | % | | $ | 61,999 |
| $ | 245,803 |
| $ | 14,224 |
| $ | — |
| $ | 260,027 |
|
| | | | | | | | |
| Multifamily | | | | | | | |
| DC | 75.6 | % | | $ | 6,847 |
| $ | 27,388 |
| $ | 1,975 |
| $ | 8,922 |
| $ | 38,285 |
|
| VA | 94.0 | % | | 12,081 |
| 48,324 |
| — |
| — |
| 48,324 |
|
| MD | 93.1 | % | | 1,673 |
| 6,692 |
| — |
| — |
| 6,692 |
|
| Total / weighted average | 87.2 | % | | $ | 20,601 |
| $ | 82,404 |
| $ | 1,975 |
| $ | 8,922 |
| $ | 93,301 |
|
| | | | | | | | |
| Total / Weighted Average | 87.9 | % | | $ | 82,600 |
| $ | 328,207 |
| $ | 16,199 |
| $ | 8,922 |
| $ | 353,328 |
|
____________________
| |
| (1) | Incremental multifamily revenue of a recently delivered multifamily assets calculated as the product of units available for occupancy up to 95.0% occupancy and the weighted average monthly market rent per unit as of December 31, 2019, multiplied by 12. Excludes potential revenue from vacant retail space in recently delivered multifamily assets. |
| |
| (2) | Crystal City Marriott and 1700 M Street are excluded from the percent occupied metric. |
|
| |
| SUMMARY & SAME STORE NOI (NON-GAAP) | DECEMBER 31, 2019 (Unaudited)
|
|
| | | | | | | | | | | | | | | | | | | | | | | | | | |
| dollars in thousands | | 100% Share | | At JBG SMITH Share |
| | | | | | | | | | | | | NOI for the Three Months Ended December 31, |
| | | Number of Assets | | Square Feet/Units | | Square Feet/Units | | % Leased (1) | | %
Occupied (1) | | 2019 | | 2018 | | % Change |
| | | | | | | | | | | | | | | |
Same Store (2) | | | | | | | | | | | | | | | | |
| DC | | 13 |
| | 2,494,920 SF/
1,541 Units |
| | 1,781,199 SF/
857 Units |
| | 92.6 | % | | 91.4 | % | | $ | 17,699 |
| | $ | 18,373 |
| | (3.7 | )% |
| VA | | 32 |
| | 8,592,603 SF/
3,202 Units |
| | 7,715,813 SF/
2,891 Units |
| | 92.1 | % | | 88.8 | % | | 53,169 |
| | 52,159 |
| | 1.9 | % |
| MD | | 9 |
| | 553,484 SF/
1,287 Units |
| | 502,111 SF/
498 Units |
| | 93.3 | % | | 90.2 | % | | 4,079 |
| | 3,531 |
| | 15.5 | % |
| Total / weighted average | 54 |
| | 11,641,007 SF/
6,030 Units |
| | 9,999,123 SF/
4,246 Units |
| | 92.3 | % | | 89.4 | % | | $ | 74,947 |
| | $ | 74,063 |
| | 1.2 | % |
| | | | | | | | | | | | | | | | | |
Non-Same Store (3) | | | | | | | | | | | | | | | | |
| DC | | 5 |
| | 249,213 SF/
1,081 Units |
| | 139,444 SF/
1,081 Units |
| | 67.8 | % | | 64.3 | % | | $ | 3,072 |
| | $ | 4,969 |
| | (38.2 | )% |
| VA | | 3 |
| | 845,849 SF |
| | 569,631 SF |
| | 96.6 | % | | 96.4 | % | | 4,581 |
| | 6,297 |
| | (27.3 | )% |
| MD | | — |
| | — |
| | — |
| | — |
| | — |
| | — |
| | — |
| | — |
|
| Total / weighted average | 8 |
| | 1,095,062 SF/
1,081 Units |
| | 709,075 SF/
1,081 Units |
| | 78.3 | % | | 76.2 | % | | $ | 7,653 |
| | $ | 11,266 |
| | (32.1 | )% |
| | | | | | | | | | | | | | | | | |
| Total Operating Portfolio | | | | | | | | | | | | | | | | |
| DC | | 18 |
| | 2,744,133 SF/
2,622 Units |
| | 1,920,643 SF/
1,938 Units |
| | 85.8 | % | | 83.7 | % | | $ | 20,771 |
| | $ | 23,342 |
| | (11.0 | )% |
| VA | | 35 |
| | 9,438,452 SF/
3,202 Units |
| | 8,285,444 SF/
2,891 Units |
| | 92.4 | % | | 89.2 | % | | 57,750 |
| | 58,456 |
| | (1.2 | )% |
| MD | | 9 |
| | 553,484 SF/
1,287 Units |
| | 502,111 SF/
498 Units |
| | 93.3 | % | | 90.2 | % | | 4,079 |
| | 3,531 |
| | 15.5 | % |
Operating Portfolio - Total / Weighted Average | 62 |
| | 12,736,069 SF/
7,111 Units |
| | 10,708,198 SF/
5,327 Units |
| | 90.8 | % | | 87.9 | % | | $ | 82,600 |
| | $ | 85,329 |
| | (3.2 | )% |
_______________
| |
| (1) | Crystal City Marriott and 1700 M Street are excluded from the percent leased and percent occupied metrics. |
| |
| (2) | Same store refers to the pool of assets that were in service for the entirety of both periods being compared, except for assets for which significant redevelopment, renovation, or repositioning occurred during either of the periods being compared. |
| |
| (3) | The decrease in non-same store NOI is primarily attributable to lost income from disposed assets. |
|
| |
| SUMMARY & SAME STORE NOI (NON-GAAP) | DECEMBER 31, 2019 (Unaudited)
|
|
| | | | | | | | | | | | | | | | | | | | | | | | | | |
| dollars in thousands | | 100% Share | | At JBG SMITH Share |
| | | | | | | | | | | | | NOI for the Year Ended December 31, |
| | | Number of Assets | | Square Feet/Units | | Square Feet/Units | | % Leased (1) | | % Occupied (1) | | 2019 | | 2018 | | % Change |
| | | | | | | | | | | | | | | |
Same Store (2) | | | | | | | | | | | | | | | | |
| DC | | 13 |
| | 2,494,920 SF/
1,541 Units |
| | 1,781,199 SF/
857 Units |
| | 92.6 | % | | 91.4 | % | | $ | 70,258 |
| | $ | 76,735 |
| | (8.4 | )% |
| VA | | 31 |
| | 8,552,578 SF/
3,202 Units |
| | 7,675,788 SF/
2,891 Units |
| | 92.1 | % | | 88.8 | % | | 205,439 |
| | 222,457 |
| | (7.7 | )% |
| MD | | 9 |
| | 553,484 SF/
1,287 Units |
| | 502,111 SF/
498 Units |
| | 93.3 | % | | 90.2 | % | | 16,566 |
| | 14,943 |
| | 10.9 | % |
| Total / weighted average | 53 |
| | 11,600,982 SF/
6,030 Units |
| | 9,959,098 SF/
4,246 Units |
| | 92.3 | % | | 89.4 | % | | $ | 292,263 |
| | $ | 314,135 |
| | (7.0 | )% |
| | | | | | | | | | | | | | | | | |
Non-Same Store (3) | | | | | | | | | | | | | | | | |
| DC | | 5 |
| | 249,213 SF/
1,081 Units |
| | 139,444 SF/
1,081 Units |
| | 67.8 | % | | 64.3 | % | | $ | 7,950 |
| | $ | 23,961 |
| | (66.8 | )% |
| VA | | 4 |
| | 885,874 SF |
| | 609,656 SF |
| | 96.3 | % | | 96.4 | % | | 19,348 |
| | 27,685 |
| | (30.1 | )% |
| MD | | — |
| | — |
| | — |
| | — |
| | — |
| | — |
| | — |
| | — |
|
| Total / weighted average | 9 |
| | 1,135,087 SF/
1,081 Units |
| | 749,100 SF/
1,081 Units |
| | 78.6 | % | | 76.2 | % | | $ | 27,298 |
| | $ | 51,646 |
| | (47.1 | )% |
| | | | | | | | | | | | | | | | | |
| Total Operating Portfolio | | | | | | | | | | | | | | | | |
| DC | | 18 |
| | 2,744,133 SF/
2,622 Units |
| | 1,920,643 SF/
1,938 Units |
| | 85.8 | % | | 83.7 | % | | $ | 78,208 |
| | $ | 100,696 |
| | (22.3 | )% |
| VA | | 35 |
| | 9,438,452 SF/
3,202 Units |
| | 8,285,444 SF/
2,891 Units |
| | 92.4 | % | | 89.2 | % | | 224,787 |
| | 250,142 |
| | (10.1 | )% |
| MD | | 9 |
| | 553,484 SF/
1,287 Units |
| | 502,111 SF/
498 Units |
| | 93.3 | % | | 90.2 | % | | 16,566 |
| | 14,943 |
| | 10.9 | % |
Operating Portfolio - Total / Weighted Average | 62 |
| | 12,736,069 SF/
7,111 Units |
| | 10,708,198 SF/
5,327 Units |
| | 90.8 | % | | 87.9 | % | | $ | 319,561 |
| | $ | 365,781 |
| | (12.6 | )% |
See footnotes on page 21.
|
| |
| SUMMARY NOI (NON-GAAP) | DECEMBER 31, 2019 (Unaudited)
|
|
| | | | | | | | | | | | | | | | |
| dollars in thousands | NOI for the Three Months Ended December 31, 2019 at JBG SMITH Share |
| | Consolidated (6) (7) | Unconsolidated (8) | | Commercial (6) (8) | Multifamily (7) | Total |
| Number of operating assets | 44 |
| 18 |
| | 44 |
| 18 |
| 62 |
|
Property rentals (1) | $ | 100,681 |
| $ | 14,843 |
| | $ | 85,992 |
| $ | 29,532 |
| $ | 115,524 |
|
| Tenant expense reimbursement | 10,480 |
| 1,139 |
| | 9,433 |
| 2,186 |
| 11,619 |
|
| Other revenue | 8,711 |
| 1,204 |
| | 8,044 |
| 1,871 |
| 9,915 |
|
| Total revenue | 119,872 |
| 17,186 |
| | 103,469 |
| 33,589 |
| 137,058 |
|
| | | | | | | |
| Operating expenses | (46,623 | ) | (7,456 | ) | | (41,096 | ) | (12,983 | ) | (54,079 | ) |
| Ground rent expense | (374 | ) | (5 | ) | | (374 | ) | (5 | ) | (379 | ) |
| Total expenses | (46,997 | ) | (7,461 | ) | | (41,470 | ) | (12,988 | ) | (54,458 | ) |
| | | | | | | |
NOI (1) | $ | 72,875 |
| $ | 9,725 |
| | $ | 61,999 |
| $ | 20,601 |
| $ | 82,600 |
|
| | | | | | | |
| Annualized NOI | $ | 289,307 |
| $ | 38,900 |
| | $ | 245,803 |
| $ | 82,404 |
| $ | 328,207 |
|
| Additional Information | | | | | | |
| Free rent (at 100% share) | $ | 8,106 |
| $ | 971 |
| | $ | 8,445 |
| $ | 632 |
| $ | 9,077 |
|
| Free rent (at JBG SMITH share) | $ | 8,106 |
| $ | 298 |
| | $ | 7,905 |
| $ | 499 |
| $ | 8,404 |
|
Annualized free rent (at JBG SMITH share) (2) | $ | 32,424 |
| $ | 1,192 |
| | $ | 31,620 |
| $ | 1,996 |
| $ | 33,616 |
|
| Payments associated with assumed lease liabilities (at 100% share) | $ | 1,450 |
| $ | — |
| | $ | 1,450 |
| $ | — |
| $ | 1,450 |
|
| Payments associated with assumed lease liabilities (at JBG SMITH share) | $ | 1,450 |
| $ | — |
| | $ | 1,450 |
| $ | — |
| $ | 1,450 |
|
Annualized payments associated with assumed lease liabilities (at JBG SMITH share)(3) | $ | 5,800 |
| $ | — |
| | $ | 5,800 |
| $ | — |
| $ | 5,800 |
|
% occupied (at JBG SMITH share) (4) | 87.6 | % | 91.0 | % | | 88.2 | % | 87.2 | % | 87.9 | % |
Annualized base rent of signed leases, not commenced (at 100% share) (5) | $ | 15,702 |
| $ | 1,318 |
| | $ | 15,045 |
| $ | 1,975 |
| $ | 17,020 |
|
Annualized base rent of signed leases, not commenced (at JBG SMITH share) (5) | $ | 15,702 |
| $ | 497 |
| | $ | 14,224 |
| $ | 1,975 |
| $ | 16,199 |
|
___________________
| |
| (1) | Property rentals excludes straight-line rent adjustments, and other GAAP adjustments, and include payments associated with assumed lease liabilities. NOI excludes approximately $4.3 million of related party management fees at JBG SMITH's share. See definition of NOI on page 51. |
| |
| (2) | Represents JBG SMITH's share of free rent for the three months ended December 31, 2019 multiplied by four. |
| |
| (3) | Represents JBG SMITH's share of payments associated with assumed lease liabilities for the three months ended December 31, 2019 multiplied by four. |
| |
| (4) | Crystal City Marriott and 1700 M Street are excluded from the percent occupied metric. |
| |
| (5) | Represents monthly base rent before free rent and straight-line rent adjustments, plus estimated tenant reimbursements for the month in which the lease commences, multiplied by 12. Triple net leases are converted to a gross basis by adding estimated tenant reimbursements to monthly base rent. Includes only leases for office and retail spaces that were vacant as of December 31, 2019. |
| |
| (6) | Includes $0.3 million of annualized NOI from Vienna Retail, which was sold in December 2019. |
| |
| (7) | Includes $1.5 million of annualized NOI from F1RST Residences, which was acquired in December 2019. If the asset was owned for the entire quarter, we estimate the annualized NOI from F1RST Residences would have been $7.0 million. |
| |
| (8) | Includes $7.3 million of annualized NOI from the 50% interest in Central Place Tower, which was sold in December 2019. |
|
| |
SUMMARY NOI - COMMERCIAL (NON-GAAP)
| DECEMBER 31, 2019 (Unaudited)
|
|
| | | | | | | | | | | | | | | | | | | |
| dollars in thousands | NOI for the Three Months Ended December 31, 2019 at JBG SMITH Share |
| | Consolidated (6) | Unconsolidated (7) | | DC | VA (6) (7) | MD | Total |
| Number of operating assets | 32 |
| 12 |
| | 10 |
| 30 |
| 4 |
| 44 |
|
Property rentals (1) | $ | 73,395 |
| $ | 12,597 |
| | $ | 19,841 |
| $ | 62,515 |
| $ | 3,636 |
| $ | 85,992 |
|
| Tenant expense reimbursement | 8,404 |
| 1,029 |
| | 3,174 |
| 6,014 |
| 245 |
| 9,433 |
|
| Other revenue | 6,964 |
| 1,080 |
| | 1,620 |
| 5,875 |
| 549 |
| 8,044 |
|
| Total revenue | 88,763 |
| 14,706 |
| | 24,635 |
| 74,404 |
| 4,430 |
| 103,469 |
|
| | | | | | | | |
| Operating expenses | (34,511 | ) | (6,585 | ) | | (10,511 | ) | (28,789 | ) | (1,796 | ) | (41,096 | ) |
| Ground rent expense | (374 | ) | — |
| | (200 | ) | 54 |
| (228 | ) | (374 | ) |
| Total expenses | (34,885 | ) | (6,585 | ) | | (10,711 | ) | (28,735 | ) | (2,024 | ) | (41,470 | ) |
| | | | | | | | |
NOI (1) | $ | 53,878 |
| $ | 8,121 |
| | $ | 13,924 |
| $ | 45,669 |
| $ | 2,406 |
| $ | 61,999 |
|
| | | | | | | | |
| Annualized NOI | $ | 213,319 |
| $ | 32,484 |
| | $ | 55,696 |
| $ | 180,483 |
| $ | 9,624 |
| $ | 245,803 |
|
| Additional Information | | | | | | | |
| Free rent (at 100% share) | $ | 7,639 |
| $ | 806 |
| | $ | 927 |
| $ | 7,030 |
| $ | 488 |
| $ | 8,445 |
|
| Free rent (at JBG SMITH share) | $ | 7,639 |
| $ | 266 |
| | $ | 589 |
| $ | 6,886 |
| $ | 430 |
| $ | 7,905 |
|
Annualized free rent (at JBG SMITH share) (2) | $ | 30,556 |
| $ | 1,064 |
| | $ | 2,356 |
| $ | 27,544 |
| $ | 1,720 |
| $ | 31,620 |
|
| Payments associated with assumed lease liabilities (at 100% share) | $ | 1,450 |
| $ | — |
| | $ | — |
| $ | 1,450 |
| $ | — |
| $ | 1,450 |
|
| Payments associated with assumed lease liabilities (at JBG SMITH share) | $ | 1,450 |
| $ | — |
| | $ | — |
| $ | 1,450 |
| $ | — |
| $ | 1,450 |
|
Annualized payments associated with assumed lease liabilities (at JBG SMITH share) (3) | $ | 5,800 |
| $ | — |
| | $ | — |
| $ | 5,800 |
| $ | — |
| $ | 5,800 |
|
% occupied (at JBG SMITH share) (4) | 88.0 | % | 90.1 | % | | 90.5 | % | 87.8 | % | 87.7 | % | 88.2 | % |
Annualized base rent of signed leases, not commenced (at 100% share) (5) | $ | 13,727 |
| $ | 1,318 |
| | $ | 1,201 |
| $ | 12,592 |
| $ | 1,252 |
| $ | 15,045 |
|
Annualized base rent of signed leases, not commenced (at JBG SMITH share) (5) | $ | 13,727 |
| $ | 497 |
| | $ | 485 |
| $ | 12,487 |
| $ | 1,252 |
| $ | 14,224 |
|
___________________
| |
| (1) | Property rentals excludes straight-line rent adjustments, and other GAAP adjustments, and include payments associated with assumed lease liabilities. NOI excludes approximately $3.2 million of related party management fees at JBG SMITH's share. See definition of NOI on page 51. |
| |
| (2) | Represents JBG SMITH's share of free rent for the three months ended December 31, 2019 multiplied by four. |
| |
| (3) | Represents JBG SMITH's share of payments associated with assumed lease liabilities for the three months ended December 31, 2019 multiplied by four. |
| |
| (4) | Crystal City Marriott and 1700 M Street are excluded from the percent occupied metric. |
| |
| (5) | Represents monthly base rent before free rent and straight-line rent adjustments, plus estimated tenant reimbursements for the month in which the lease commences, multiplied by 12. Triple net leases are converted to a gross basis by adding estimated tenant reimbursements to monthly base rent. Includes only leases for office and retail spaces that were vacant as of December 31, 2019. |
| |
| (6) | Includes $0.3 million of annualized NOI from Vienna Retail, which was sold in December 2019. |
| |
| (7) | Includes $7.3 million of annualized NOI from the 50% interest in Central Place Tower, which was sold in December 2019. |
|
| |
| SUMMARY NOI - MULTIFAMILY (NON-GAAP) | DECEMBER 31, 2019 (Unaudited)
|
|
| | | | | | | | | | | | | | | | | | | |
| dollars in thousands | NOI for the Three Months Ended December 31, 2019 at JBG SMITH Share |
| | Consolidated (5) | Unconsolidated | | DC (5) | VA | MD | Total |
| Number of operating assets | 12 |
| 6 |
| | 8 |
| 5 |
| 5 |
| 18 |
|
Property rentals (1) | $ | 27,286 |
| $ | 2,246 |
| | $ | 10,086 |
| $ | 17,014 |
| $ | 2,432 |
| $ | 29,532 |
|
| Tenant expense reimbursement | 2,076 |
| 110 |
| | 833 |
| 1,282 |
| 71 |
| 2,186 |
|
| Other revenue | 1,747 |
| 124 |
| | 699 |
| 1,021 |
| 151 |
| 1,871 |
|
| Total revenue | 31,109 |
| 2,480 |
| | 11,618 |
| 19,317 |
| 2,654 |
| 33,589 |
|
| | | | | | | | |
| Operating expenses | (12,112 | ) | (871 | ) | | (4,771 | ) | (7,236 | ) | (976 | ) | (12,983 | ) |
| Ground rent expense | — |
| (5 | ) | | — |
| — |
| (5 | ) | (5 | ) |
| Total expenses | (12,112 | ) | (876 | ) | | (4,771 | ) | (7,236 | ) | (981 | ) | (12,988 | ) |
| | | | | | | | |
NOI (1) | $ | 18,997 |
| $ | 1,604 |
| | $ | 6,847 |
| $ | 12,081 |
| $ | 1,673 |
| $ | 20,601 |
|
| | | | | | | | |
| Annualized NOI | $ | 75,988 |
| $ | 6,416 |
| | $ | 27,388 |
| $ | 48,324 |
| $ | 6,692 |
| $ | 82,404 |
|
| Additional Information | | | | | | | |
| Free rent (at 100% share) | $ | 467 |
| $ | 165 |
| | $ | 348 |
| $ | 249 |
| $ | 35 |
| $ | 632 |
|
| Free rent (at JBG SMITH share) | $ | 467 |
| $ | 32 |
| | $ | 264 |
| $ | 233 |
| $ | 2 |
| $ | 499 |
|
Annualized free rent (at JBG SMITH share) (2) | $ | 1,868 |
| $ | 128 |
| | $ | 1,056 |
| $ | 932 |
| $ | 8 |
| $ | 1,996 |
|
| Payments associated with assumed lease liabilities (at 100% share) | $ | — |
| $ | — |
| | $ | — |
| $ | — |
| $ | — |
| $ | — |
|
| Payments associated with assumed lease liabilities (at JBG SMITH share) | $ | — |
| $ | — |
| | $ | — |
| $ | — |
| $ | — |
| $ | — |
|
Annualized payments associated with assumed lease liabilities (at JBG SMITH share) (3) | $ | — |
| $ | — |
| | $ | — |
| $ | — |
| $ | — |
| $ | — |
|
% occupied (at JBG SMITH share) | 86.7 | % | 94.1 | % | | 75.6 | % | 94.0 | % | 93.1 | % | 87.2 | % |
Annualized base rent of signed leases, not commenced (at 100% share) (4) | $ | 1,975 |
| — |
| | $ | 1,975 |
| — |
| — |
| $ | 1,975 |
|
Annualized base rent of signed leases, not commenced (at JBG SMITH share) (4) | $ | 1,975 |
| — |
| | $ | 1,975 |
| — |
| — |
| $ | 1,975 |
|
___________________
| |
| (1) | Property rentals excludes straight-line rent adjustments, and other GAAP adjustments, and include payments associated with assumed lease liabilities. NOI excludes approximately $1.1 million of related party management fees at JBG SMITH's share. See definition of NOI on page 51. |
| |
| (2) | Represents JBG SMITH's share of free rent for the three months ended December 31, 2019 multiplied by four. |
| |
| (3) | Represents JBG SMITH's share of payments associated with assumed lease liabilities for the three months ended December 31, 2019 multiplied by four. |
| |
| (4) | Represents monthly base rent before free rent and straight-line rent adjustments, plus estimated tenant reimbursements for the month in which the lease commences, multiplied by 12. Triple net leases are converted to a gross basis by adding estimated tenant reimbursements to monthly base rent. Includes only leases for office and retail spaces that were vacant as of December 31, 2019. |
| |
| (5) | Includes $1.5 million of annualized NOI from F1RST Residences, which was acquired in December 2019. If the asset was owned for the entire quarter, we estimate the annualized NOI from F1RST Residences would have been $7.0 million. |
|
| |
| NOI RECONCILIATIONS (NON-GAAP) | DECEMBER 31, 2019 (Unaudited)
|
|
| | | | | | | | | | | | | | | |
| dollars in thousands | Three Months Ended December 31, | | Year Ended December 31, |
| | 2019 | | 2018 | | 2019 | | 2018 |
| Net income attributable to common shareholders | $ | 34,390 |
| | $ | 710 |
| | $ | 65,571 |
| | $ | 39,924 |
|
| Add: | | | | | | | |
| Depreciation and amortization expense | 50,004 |
| | 67,556 |
| | 191,580 |
| | 211,436 |
|
| General and administrative expense: | | | | | | | |
| Corporate and other | 11,934 |
| | 8,512 |
| | 46,822 |
| | 33,728 |
|
| Third-party real estate services | 26,910 |
| | 25,274 |
| | 113,495 |
| | 89,826 |
|
Share-based compensation related to Formation Transaction and
special equity awards
| 11,959 |
| | 9,118 |
| | 42,162 |
| | 36,030 |
|
| Transaction and other costs | 13,307 |
| | 15,572 |
| | 23,235 |
| | 27,706 |
|
| Interest expense | 11,831 |
| | 18,184 |
| | 52,695 |
| | 74,447 |
|
| Loss on extinguishment of debt | 3,916 |
| | 617 |
| | 5,805 |
| | 5,153 |
|
| Reduction of gain on bargain purchase | — |
| | — |
| | — |
| | 7,606 |
|
| Income tax expense (benefit) | (613 | ) | | 698 |
| | (1,302 | ) | | (738 | ) |
| Net income attributable to redeemable noncontrolling interests | 4,302 |
| | 178 |
| | 8,573 |
| | 6,710 |
|
| Less: | | | | | | | |
Third-party real estate services, including reimbursements
| 29,121 |
| | 26,421 |
| | 120,886 |
| | 98,699 |
|
Other revenue (1) | 1,686 |
| | 1,454 |
| | 7,638 |
| | 6,358 |
|
| Income (loss) from unconsolidated real estate ventures, net | (2,042 | ) | | 23,991 |
| | (1,395 | ) | | 39,409 |
|
| Interest and other income, net | 3,022 |
| | 9,991 |
| | 5,385 |
| | 15,168 |
|
| Gain on sale of real estate | 57,870 |
| | 6,394 |
| | 104,991 |
| | 52,183 |
|
| Net income (loss) attributable to noncontrolling interests | — |
| | (106 | ) | | — |
| | 21 |
|
| Consolidated NOI | 78,283 |
| | 78,274 |
| | 311,131 |
| | 319,990 |
|
| NOI attributable to unconsolidated real estate ventures at our share | 6,052 |
| | 8,741 |
| | 21,797 |
| | 36,684 |
|
Non-cash rent adjustments (2) | (8,465 | ) | | (6,691 | ) | | (34,359 | ) | | (10,349 | ) |
Other adjustments (3) | 3,913 |
| | 3,915 |
| | 13,979 |
| | 15,061 |
|
| Total adjustments | 1,500 |
| | 5,965 |
| | 1,417 |
| | 41,396 |
|
| NOI | $ | 79,783 |
| | $ | 84,239 |
| | $ | 312,548 |
| | $ | 361,386 |
|
Less: out-of-service NOI loss (4) | (2,817 | ) | | (1,090 | ) | | (7,013 | ) | | (4,395 | ) |
| Operating Portfolio NOI | $ | 82,600 |
| | $ | 85,329 |
| | $ | 319,561 |
| | $ | 365,781 |
|
Non-same store NOI (5) | 7,653 |
| | 11,266 |
| | 27,298 |
| | 51,646 |
|
Same store NOI (6) | $ | 74,947 |
| | $ | 74,063 |
| | $ | 292,263 |
| | $ | 314,135 |
|
| | | | | | | | |
| Change in same store NOI | 1.2 | % | | | | (7.0 | )% | | |
| Number of properties in same store pool | 54 |
| | | | 53 |
| | |
___________________
| |
| (1) | Excludes parking revenue of $6.5 million and $6.3 million for the three months ended December 31, 2019 and 2018, and $26.0 million and $25.7 million for the year ended December 31, 2019 and 2018. |
| |
| (2) | Adjustment to exclude straight-line rent, above/below market lease amortization and lease incentive amortization. |
| |
| (3) | Adjustment to include other revenue and payments associated with assumed lease liabilities related to operating properties and to exclude commercial lease termination revenue and allocated corporate general and administrative expenses to operating properties. |
| |
| (4) | Includes the results for our Under Construction assets and Future Development Pipeline. |
| |
| (5) | Includes the results for properties that were not in service for the entirety of both periods being compared and properties for which significant redevelopment, renovation or repositioning occurred during either of the periods being compared. The decrease in non-same store NOI is primarily attributable to lost income from disposed assets. |
| |
| (6) | Includes the results of the properties that are in service for the entirety of both periods being compared except for properties for which significant redevelopment, renovation or repositioning occurred during either of the periods being compared. |
|
| |
| LEASING ACTIVITY - OFFICE | DECEMBER 31, 2019 (Unaudited)
|
|
| | | | | | | |
| square feet in thousands | Three Months Ended December 31, 2019 | | Year Ended December 31, 2019 |
| Square feet leased: | | |
|
| At 100% share | 843 |
| | 2,348 |
|
| At JBG SMITH share | 724 |
| | 2,147 |
|
Initial rent (1) | $ | 46.61 |
| | $ | 45.61 |
|
Straight-line rent (2) | $ | 47.38 |
| | $ | 46.31 |
|
| Weighted average lease term (years) | 5.2 |
| | 5.2 |
|
| Weighted average free rent period (months) | 1.7 |
| | 2.6 |
|
| Second generation space: | 173 |
| | 938 |
|
| Square feet | 551 |
| | 1,209 |
|
| Cash basis: | | | |
Initial rent (1) | $ | 45.67 |
| | $ | 45.22 |
|
| Prior escalated rent | $ | 42.43 |
| | $ | 43.67 |
|
| % change | 7.6 | % | | 3.5 | % |
| GAAP basis: | | | |
Straight-line rent (2) | $ | 45.91 |
| | $ | 45.10 |
|
| Prior straight-line rent | $ | 39.75 |
| | $ | 41.13 |
|
| % change | 15.5 | % | | 9.7 | % |
| Tenant improvements: | | | |
| Per square foot | $ | 28.80 |
| | $ | 32.43 |
|
| Per square foot per annum | $ | 5.59 |
| | $ | 6.29 |
|
| % of initial rent | 12.0 | % | | 13.8 | % |
| Leasing commissions: | | | |
| Per square foot | $ | 5.91 |
| | $ | 5.17 |
|
| Per square foot per annum | $ | 1.15 |
| | $ | 1.00 |
|
| % of initial rent | 2.5 | % | | 2.2 | % |
___________________
Note: At JBG SMITH share, unless otherwise indicated. The leasing activity and related statistics are based on leases signed during the period and are not intended to coincide with the commencement of rental revenue in accordance with GAAP. Second generation space represents square footage that was vacant for less than nine months.
| |
| (1) | Represents the cash basis weighted average starting rent per square foot, which is generally indicative of market rents. Triple net leases are converted to a gross basis by adding estimated tenant reimbursements to monthly base rent. Most leases include free rent and periodic step-ups in rent which are not included in the initial cash basis rent per square foot but are included in the GAAP basis rent per square foot. |
| |
| (2) | Represents the GAAP basis weighted average rent per square foot that is recognized over the term of the respective leases, and includes the effect of free rent and fixed step-ups in rent. |
|
| |
| NET EFFECTIVE RENT - OFFICE | DECEMBER 31, 2019 (Unaudited)
|
|
| | | | | | | | | | | | | | | | | | | | | | | |
| square feet in thousands, dollars per square feet, at JBG SMITH share | Trailing Five Quarter Average | | Three Months Ended |
| | | December 31, 2019 | | September 30, 2019 | | June 30, 2019 | | March 31, 2019 | | December 31, 2018 |
| Square feet | 577 |
| | 724 |
| | 243 |
| | 395 |
| | 785 |
| | 741 |
|
| Weighted average lease term (years) | 6.1 |
| | 5.2 |
| | 4.4 |
| | 5.2 |
| | 5.4 |
| | 10.2 |
|
Initial rent (1) | $ | 45.50 |
| | $ | 46.61 |
| | $ | 45.99 |
| | $ | 44.82 |
| | $ | 44.97 |
| | $ | 45.08 |
|
Base rent per annum (2) | $ | 51.41 |
| | $ | 51.09 |
| | $ | 48.40 |
| | $ | 50.73 |
| | $ | 49.34 |
| | $ | 57.48 |
|
| Tenant improvements per annum | (6.36 | ) | | (5.59 | ) | | (7.54 | ) | | (4.80 | ) | | (7.32 | ) | | (6.54 | ) |
| Leasing commissions per annum | (1.20 | ) | | (1.15 | ) | | (0.93 | ) | | (1.22 | ) | | (0.79 | ) | | (1.93 | ) |
| Free rent per annum | (2.46 | ) | | (1.28 | ) | | (3.02 | ) | | (2.42 | ) | | (1.89 | ) | | (3.69 | ) |
| Net Effective Rent | $ | 41.39 |
| | $ | 43.07 |
| | $ | 36.91 |
| | $ | 42.29 |
| | $ | 39.34 |
| | $ | 45.32 |
|
| | | | | | | | | | | | |
| | | | | | | | | | | | |
| DC | | | | | | | | | | | |
| Square feet | 51 |
| | 117 |
| | 12 |
| | 21 |
| | 33 |
| | 72 |
|
Initial rent (1) | $ | 61.71 |
| | $ | 50.16 |
| | $ | 63.45 |
| | $ | 65.10 |
| | $ | 53.40 |
| | $ | 76.45 |
|
| Net effective rent | $ | 57.89 |
| | $ | 48.03 |
| | $ | 65.02 |
| | $ | 66.17 |
| | $ | 39.41 |
| | $ | 70.85 |
|
| | | | | | | | | | | | |
| VA | | | | | | | | | | | |
| Square feet | 501 |
| | 579 |
| | 211 |
| | 338 |
| | 717 |
| | 658 |
|
Initial rent (1) | $ | 43.89 |
| | $ | 45.59 |
| | $ | 44.63 |
| | $ | 43.38 |
| | $ | 44.03 |
| | $ | 41.83 |
|
| Net effective rent | $ | 39.06 |
| | $ | 41.63 |
| | $ | 34.66 |
| | $ | 38.96 |
| | $ | 38.18 |
| | $ | 41.85 |
|
| | | | | | | | | | | | |
| MD | | | | | | | | | | | |
| Square feet | 26 |
| | 27 |
| | 20 |
| | 36 |
| | 35 |
| | 10 |
|
Initial rent (1) | $ | 47.59 |
| | $ | 52.98 |
| | $ | 49.73 |
| | $ | 46.62 |
| | $ | 56.36 |
| | $ | 32.24 |
|
| Net effective rent | $ | 41.07 |
| | $ | 44.86 |
| | $ | 34.55 |
| | $ | 40.22 |
| | $ | 58.53 |
| | $ | 27.21 |
|
____________________
Note: Leasing activity and related statistics are based on leases signed during the period and are not intended to coincide with the commencement of rental revenue in accordance with GAAP.
| |
| (1) | Represents the cash basis weighted average starting rent per square foot, which is generally indicative of market rents. Triple net leases are converted to a gross basis by adding estimated tenant reimbursements to monthly base rent. Most leases include free rent and periodic step-ups in rent which are not included in the initial cash basis rent per square foot. |
| |
| (2) | Represents the weighted average base rent before free rent, plus estimated tenant reimbursements that is recognized over the term of the respective leases, including the effect of fixed step-ups in rent, divided by square feet, and divided by years of lease term. Triple net leases are converted to a gross basis by adding estimated tenant reimbursements to base rent. Tenant reimbursements are estimated by escalating tenant reimbursements as of the respective reporting period, or management’s estimate thereof, by 2.75% annually through the lease expiration year. |
|
| |
| LEASE EXPIRATIONS | DECEMBER 31, 2019 (Unaudited)
|
|
| | | | | | | | | | | | | | | | | | | | | | | | |
| | | | | At JBG SMITH Share |
| Year of Lease Expiration | | Number
of Leases | |
Square Feet | | % of
Total
Square Feet | | Annualized
Rent
(in thousands) | | % of
Total
Annualized
Rent | | Annualized
Rent Per
Square Foot | | Estimated
Annualized
Rent Per
Square Foot at
Expiration (1) |
| Month-to-Month | | 62 |
| | 158,441 |
| | 1.7 | % | | $ | 5,049 |
| | 1.2 | % | | $ | 31.87 |
| | $ | 31.87 |
|
| 2020 | | 160 |
| | 1,051,182 |
| | 11.1 | % | | 42,275 |
| | 10.2 | % | | 40.22 |
| | 40.62 |
|
| 2021 | | 116 |
| | 989,425 |
| | 10.4 | % | | 46,014 |
| | 11.1 | % | | 46.51 |
| | 48.11 |
|
| 2022 | | 104 |
| | 1,539,568 |
| | 16.2 | % | | 66,996 |
| | 16.1 | % | | 43.52 |
| | 45.65 |
|
| 2023 | | 91 |
| | 553,972 |
| | 5.8 | % | | 24,274 |
| | 5.8 | % | | 43.82 |
| | 47.32 |
|
| 2024 | | 97 |
| | 1,047,902 |
| | 11.0 | % | | 48,004 |
| | 11.5 | % | | 45.81 |
| | 49.99 |
|
| 2025 | | 76 |
| | 608,702 |
| | 6.4 | % | | 25,315 |
| | 6.1 | % | | 41.59 |
| | 46.98 |
|
| 2026 | | 55 |
| | 265,397 |
| | 2.8 | % | | 11,607 |
| | 2.8 | % | | 43.73 |
| | 50.36 |
|
| 2027 | | 49 |
| | 455,115 |
| | 4.8 | % | | 20,166 |
| | 4.8 | % | | 44.31 |
| | 52.37 |
|
| 2028 | | 45 |
| | 386,045 |
| | 4.1 | % | | 17,902 |
| | 4.3 | % | | 46.37 |
| | 55.62 |
|
| Thereafter | | 99 |
| | 2,440,276 |
| | 25.7 | % | | 108,449 |
| | 26.1 | % | | 44.44 |
| | 56.84 |
|
| Total / Weighted Average | | 954 |
| | 9,496,025 |
| | 100.0 | % | | $ | 416,051 |
| | 100.0 | % | | $ | 43.81 |
| | $ | 49.52 |
|
____________________
Note: Includes all in-place leases as of December 31, 2019 for office and retail space within JBG SMITH's operating portfolio and assuming no exercise of renewal options or early termination rights. The weighted average remaining lease term for the entire portfolio is 5.8 years.
| |
| (1) | Represents monthly base rent before free rent, plus tenant reimbursements, as of lease expiration multiplied by 12 and divided by square feet. Triple net leases are converted to a gross basis by adding tenant reimbursements to monthly base rent. Tenant reimbursements at lease expiration are estimated by escalating tenant reimbursements as of December 31, 2019, or management’s estimate thereof, by 2.75% annually through the lease expiration year. |
|
| |
| SIGNED BUT NOT YET COMMENCED LEASES | DECEMBER 31, 2019 (Unaudited)
|
|
| | | | | | | | | | | | | | | | | | | | | | | | | | | | | | |
| dollars in thousands, at JBG SMITH share | | | | | | | | |
| | | Total Annualized Estimated Rent (3) | | Estimated Rent (1) for the Quarter Ending |
| Assets | |
C/U (2)
| | | March 31, 2020 | | June 30, 2020 | | September 30, 2020 | | December 31, 2020 | | March 31, 2021 | | June 30, 2021 |
| | | | | | | | | | | | | | | | | |
| Commercial | | | | | | | | | | | | | | | | |
| Operating | | C | | $ | 13,728 |
| | $ | 595 |
| | $ | 1,438 |
| | $ | 3,144 |
| | $ | 3,148 |
| | $ | 3,110 |
| | $ | 3,228 |
|
| Operating | | U | | 496 |
| | 34 |
| | 50 |
| | 123 |
| | 124 |
| | 124 |
| | 124 |
|
Under construction (4) | | C | | 31,512 |
| | 4,254 |
| | 4,296 |
| | 4,385 |
| | 6,604 |
| | 7,878 |
| | 7,878 |
|
| Under construction | | U | | 9,368 |
| | 1,175 |
| | 1,638 |
| | 1,696 |
| | 1,855 |
| | 1,855 |
| | 2,012 |
|
| Total | | | | $ | 55,104 |
| | $ | 6,058 |
| | $ | 7,422 |
| | $ | 9,348 |
| | $ | 11,731 |
| | $ | 12,967 |
| | $ | 13,242 |
|
| | | | | | | | | | | | | | | | | |
| Multifamily | | | | | | | | | | | | | | | | |
| Operating | | C | | $ | 1,980 |
| | $ | 332 |
| | $ | 426 |
| | $ | 495 |
| | $ | 495 |
| | $ | 495 |
| | $ | 495 |
|
| Under construction | | C | | 2,472 |
| | 469 |
| | 618 |
| | 618 |
| | 618 |
| | 618 |
| | 618 |
|
| Under construction | | U | | 500 |
| | — |
| | 24 |
| | 36 |
| | 125 |
| | 125 |
| | 125 |
|
| Total | | | | $ | 4,952 |
| | $ | 801 |
| | $ | 1,068 |
| | $ | 1,149 |
| | $ | 1,238 |
| | $ | 1,238 |
| | $ | 1,238 |
|
| | | | | | | | | | | | | | | | | |
| Total | | | | $ | 60,056 |
| | $ | 6,859 |
| | $ | 8,490 |
| | $ | 10,497 |
| | $ | 12,969 |
| | $ | 14,205 |
| | $ | 14,480 |
|
____________________
Note: Includes only leases for office and retail spaces that were vacant as of December 31, 2019.
| |
| (1) | Represents contractual monthly base rent before free rent, plus estimated tenant reimbursements for the month in which the lease is estimated to commence, multiplied by the applicable number of months for each quarter based on the lease’s estimated commencement date. Triple net leases are converted to a gross basis by adding estimated tenant reimbursements to monthly base rent. |
| |
| (2) | “C” denotes a consolidated interest. “U” denotes an unconsolidated interest. |
| |
| (3) | Represents contractual monthly base rent before free rent, plus estimated tenant reimbursements for the month in which the lease is expected to commence, multiplied by 12. Triple net leases are converted to a gross basis by adding estimated tenant reimbursements to monthly base rent. |
| |
| (4) | Includes annualized estimated rent of $4.8 million from JBG SMITH's lease at 4747 Bethesda Avenue. |
|
| |
| TENANT CONCENTRATION | DECEMBER 31, 2019 (Unaudited)
|
|
| | | | | | | | | | | | | | | | | | |
| dollars in thousands | | | | At JBG SMITH Share |
| | Tenant | | Number of Leases | |
Square Feet | | % of Total Square Feet | | Annualized Rent | | % of Total Annualized Rent |
| 1 |
| U.S. Government (GSA) | | 67 |
| | 2,447,892 |
| | 25.8 | % | | $ | 97,169 |
| | 23.4 | % |
| 2 |
| Family Health International | | 3 |
| | 295,977 |
| | 3.1 | % | | 15,311 |
| | 3.7 | % |
| 3 |
| Amazon | | 3 |
| | 326,665 |
| | 3.4 | % | | 14,130 |
| | 3.4 | % |
| 4 |
| Gartner, Inc | | 1 |
| | 174,424 |
| | 1.8 | % | | 11,360 |
| | 2.7 | % |
| 5 |
| Lockheed Martin Corporation | | 2 |
| | 232,598 |
| | 2.4 | % | | 10,860 |
| | 2.6 | % |
| 6 |
| Arlington County | | 2 |
| | 235,779 |
| | 2.5 | % | | 9,908 |
| | 2.4 | % |
| 7 |
| WeWork (1) | | 2 |
| | 163,918 |
| | 1.7 | % | | 8,543 |
| | 2.1 | % |
| 8 |
| Greenberg Traurig LLP | | 1 |
| | 101,602 |
| | 1.1 | % | | 7,304 |
| | 1.8 | % |
| 9 |
| Accenture LLP | | 2 |
| | 116,736 |
| | 1.2 | % | | 6,763 |
| | 1.6 | % |
| 10 |
| Public Broadcasting Service | | 1 |
| | 140,885 |
| | 1.5 | % | | 5,186 |
| | 1.2 | % |
| 11 |
| Chemonics International | | 2 |
| | 111,520 |
| | 1.2 | % | | 4,517 |
| | 1.1 | % |
| 12 |
| Evolent Health LLC | | 1 |
| | 90,905 |
| | 1.0 | % | | 4,319 |
| | 1.0 | % |
| 13 |
| Conservation International Foundation | | 1 |
| | 86,981 |
| | 0.9 | % | | 4,060 |
| | 1.0 | % |
| 14 |
| U.S. Green Building Council | | 1 |
| | 54,675 |
| | 0.6 | % | | 3,996 |
| | 1.0 | % |
| 15 |
| The International Justice Mission | | 1 |
| | 74,481 |
| | 0.8 | % | | 3,903 |
| | 0.9 | % |
| 16 |
| Cushman & Wakefield U.S. Inc | | 1 |
| | 58,641 |
| | 0.6 | % | | 3,875 |
| | 0.9 | % |
| 17 |
| The Urban Institute | | 1 |
| | 68,620 |
| | 0.7 | % | | 3,702 |
| | 0.9 | % |
| 18 |
| Booz Allen Hamilton Inc | | 2 |
| | 94,366 |
| | 1.0 | % | | 3,613 |
| | 0.9 | % |
| 19 |
| American Diabetes Association | | 1 |
| | 80,998 |
| | 0.9 | % | | 3,420 |
| | 0.8 | % |
| 20 |
| DRS Tech Inc dba Finmeccanica | | 2 |
| | 74,649 |
| | 0.8 | % | | 3,366 |
| | 0.8 | % |
| | Other | | 857 |
| | 4,463,713 |
| | 47.0 | % | | 190,746 |
| | 45.8 | % |
| | Total | | 954 |
| | 9,496,025 |
| | 100.0 | % | | $ | 416,051 |
| | 100.0 | % |
_______________
Note: Includes all in-place leases as of December 31, 2019 for office and retail space within JBG SMITH's operating portfolio. As signed but not yet commenced leases commence and tenants take occupancy, our tenant concentration will change.
(1) Excludes the WeLive lease at 2221 S. Clark Street.
|
| |
| INDUSTRY DIVERSITY | DECEMBER 31, 2019 (Unaudited)
|
|
| | | | | | | | | | | | | | | | | | |
| dollars in thousands | | | | At JBG SMITH Share |
| | Industry | | Number of Leases | |
Square Feet | | % of Total Square Feet | | Annualized Rent | | % of Total Annualized Rent |
| 1 |
| Government | | 80 |
| | 2,754,962 |
| | 29.0 | % | | $ | 110,348 |
| | 26.5 | % |
| 2 |
| Government Contractors | | 89 |
| | 1,553,140 |
| | 16.4 | % | | 69,842 |
| | 16.8 | % |
| 3 |
| Business Services | | 136 |
| | 1,443,914 |
| | 15.2 | % | | 68,412 |
| | 16.4 | % |
| 4 |
| Member Organizations | | 77 |
| | 922,713 |
| | 9.7 | % | | 44,494 |
| | 10.7 | % |
| 5 |
| Real Estate | | 50 |
| | 492,085 |
| | 5.2 | % | | 23,379 |
| | 5.6 | % |
| 6 |
| Legal Services | | 41 |
| | 276,589 |
| | 2.9 | % | | 15,107 |
| | 3.6 | % |
| 7 |
| Health Services | | 47 |
| | 365,082 |
| | 3.8 | % | | 14,767 |
| | 3.5 | % |
| 8 |
| Food and Beverage | | 118 |
| | 250,561 |
| | 2.6 | % | | 14,040 |
| | 3.4 | % |
| 9 |
| Communications | | 11 |
| | 194,253 |
| | 2.0 | % | | 7,425 |
| | 1.8 | % |
| 10 |
| Educational Services | | 15 |
| | 94,262 |
| | 1.0 | % | | 4,141 |
| | 1.0 | % |
| | Other | | 290 |
| | 1,148,464 |
| | 12.2 | % | | 44,096 |
| | 10.7 | % |
| | Total | | 954 |
| | 9,496,025 |
| | 100.0 | % | | $ | 416,051 |
| | 100.0 | % |
_______________
Note: Includes all in-place leases as of December 31, 2019 for office and retail space within JBG SMITH's operating portfolio.
|
| |
| PORTFOLIO SUMMARY | DECEMBER 31, 2019 (Unaudited)
|
|
| | | | | | | | | | | | |
| | | Number
of Assets | | Rentable
Square Feet | | Number of
Units (1) | | Estimated
Potential Development
Density (2) |
| | | | | | | | | |
| Wholly Owned | | | | | | | | |
| Operating | | 44 |
| | 13,946,845 |
| | 5,003 |
| | — |
|
| Under construction | | 4 |
| | 897,342 |
| | 256 |
| | — |
|
| Future development | | 24 |
| | — |
| | — |
| | 17,913,500 |
|
| Total | | 72 |
| | 14,844,187 |
| | 5,259 |
| | 17,913,500 |
|
| | | | | | | | | |
| Real Estate Ventures | | | | | | | | |
| Operating | | 18 |
| | 5,014,349 |
| | 2,108 |
| | — |
|
| Under construction | | 3 |
| | 966,550 |
| | 755 |
| | — |
|
| Future development | | 16 |
| | — |
| | — |
| | 4,007,700 |
|
| Total | | 37 |
| | 5,980,899 |
| | 2,863 |
| | 4,007,700 |
|
| | | | | | | | | |
| Total Portfolio | | 109 |
| | 20,825,086 |
| | 8,122 |
| | 21,921,200 |
|
| | | | | | | | | |
| Total Portfolio (at JBG SMITH Share) | | 109 |
| | 16,822,431 |
| | 6,160 |
| | 18,667,300 |
|
____________________
Note: At 100% share, unless otherwise indicated.
| |
| (1) | For assets under construction, represents estimated number of units based on current design plans. |
| |
| (2) | Includes estimated potential office, multifamily and retail development density. |
|
| |
| PROPERTY TABLE - COMMERCIAL | DECEMBER 31, 2019 (Unaudited)
|
|
| | | | | | | | | | | | | | | | | | | | | | | | | | | |
| Commercial Assets | Submarket | %
Ownership |
C/U (1)
| Same Store (2):
Q4 2018-2019 / YTD 2018-2019 | Year Built /
Renovated | Total Square Feet | Office Square Feet | Retail Square Feet | %
Leased | Office % Occupied | Retail % Occupied | Annualized Rent (in thousands) | Office Annualized Rent Per Square Foot (3) | Retail Annualized Rent Per Square Foot (4) |
|
|
|
|
|
|
|
|
|
|
|
|
|
|
|
| DC |
|
|
|
|
|
|
|
|
|
|
|
|
|
|
| Universal Buildings | Uptown | 100.0 | % | C | Y / Y | 1956 / 1990 | 659,809 |
| 568,734 |
| 91,075 |
| 97.4 | % | 97.1 | % | 99.6 | % | $ | 32,929 |
| $ | 50.59 |
| $ | 55.03 |
|
| 2101 L Street | CBD | 100.0 | % | C | Y / Y | 1975 / 2007 | 378,696 |
| 347,376 |
| 31,320 |
| 84.8 | % | 84.1 | % | 92.6 | % | 21,550 |
| 68.07 |
| 56.99 |
|
1730 M Street (5) | CBD | 100.0 | % | C | Y / Y | 1964 / 1998 | 204,746 |
| 196,728 |
| 8,018 |
| 88.5 | % | 88.0 | % | 100.0 | % | 8,638 |
| 47.59 |
| 49.94 |
|
| 1700 M Street | CBD | 100.0 | % | C | N / N | N/A | 34,000 |
| — |
| — |
| — |
| — |
| — |
| — |
| — |
| — |
|
L’Enfant Plaza Office-East (5) | Southwest | 49.0 | % | U | Y / Y | 1972 / 2012 | 397,057 |
| 397,057 |
| — |
| 89.5 | % | 89.5 | % | — |
| 17,643 |
| 49.67 |
| — |
|
| L’Enfant Plaza Office-North | Southwest | 49.0 | % | U | Y / Y | 1969 / 2014 | 298,445 |
| 278,971 |
| 19,474 |
| 96.8 | % | 97.6 | % | 85.9 | % | 12,924 |
| 46.48 |
| 16.27 |
|
L’Enfant Plaza Retail (5) | Southwest | 49.0 | % | U | Y / Y | 1968 / 2014 | 119,291 |
| 16,596 |
| 102,695 |
| 73.5 | % | 100.0 | % | 69.2 | % | 4,449 |
| 36.62 |
| 54.04 |
|
| The Foundry | Georgetown | 9.9 | % | U | Y / Y | 1973 / 2017 | 225,095 |
| 218,241 |
| 6,854 |
| 92.2 | % | 89.4 | % | 100.0 | % | 9,573 |
| 47.60 |
| 41.24 |
|
| 1101 17th Street | CBD | 55.0 | % | U | Y / Y | 1964 / 1999 | 211,781 |
| 202,023 |
| 9,758 |
| 84.4 | % | 84.0 | % | 82.7 | % | 9,444 |
| 52.34 |
| 70.08 |
|
|
|
|
|
|
|
|
|
|
|
|
|
|
|
|
| VA |
|
|
|
|
|
|
|
|
|
|
|
|
|
|
Courthouse Plaza 1 and 2 (5) | Clarendon/Courthouse | 100.0 | % | C | Y / Y | 1989 / 2013 | 628,988 |
| 571,795 |
| 57,193 |
| 85.2 | % | 83.8 | % | 100.0 | % | $ | 22,851 |
| $ | 43.47 |
| $ | 35.52 |
|
| 2121 Crystal Drive | National Landing | 100.0 | % | C | Y / Y | 1985 / 2006 | 505,349 |
| 505,349 |
| — |
| 84.3 | % | 84.3 | % | — |
| 19,814 |
| 46.52 |
| — |
|
| 2345 Crystal Drive | National Landing | 100.0 | % | C | Y / Y | 1988 / N/A | 503,178 |
| 494,191 |
| 8,987 |
| 85.7 | % | 83.6 | % | 10.1 | % | 19,088 |
| 46.20 |
| 8.73 |
|
| 2231 Crystal Drive | National Landing | 100.0 | % | C | Y / Y | 1987 / 2009 | 468,262 |
| 416,335 |
| 51,927 |
| 85.6 | % | 83.1 | % | 100.0 | % | 17,216 |
| 44.31 |
| 36.13 |
|
| 1550 Crystal Drive | National Landing | 100.0 | % | C | Y / Y | 1980 / 2001 | 449,364 |
| 449,364 |
| — |
| 89.5 | % | 89.5 | % | — |
| 16,056 |
| 39.92 |
| — |
|
RTC-West (6) | Reston | 100.0 | % | C | Y / Y | 1988 / 2014 | 432,509 |
| 432,509 |
| — |
| 94.5 | % | 94.5 | % | — |
| 16,391 |
| 40.10 |
| — |
|
| RTC-West Retail | Reston | 100.0 | % | C | Y / N | 2017 / N/A | 40,025 |
| — |
| 40,025 |
| 91.9 | % | — |
| 91.9 | % | 2,438 |
| — |
| 66.28 |
|
| 2011 Crystal Drive | National Landing | 100.0 | % | C | Y / Y | 1984 / 2006 | 439,286 |
| 432,524 |
| 6,762 |
| 87.2 | % | 87.0 | % | 49.7 | % | 16,360 |
| 42.97 |
| 56.74 |
|
| 2451 Crystal Drive | National Landing | 100.0 | % | C | Y / Y | 1990 / N/A | 401,535 |
| 389,845 |
| 11,690 |
| 88.5 | % | 70.4 | % | 95.5 | % | 12,258 |
| 43.13 |
| 37.49 |
|
| 1235 S. Clark Street | National Landing | 100.0 | % | C | Y / Y | 1981 / 2007 | 383,953 |
| 335,607 |
| 48,346 |
| 95.7 | % | 87.7 | % | 100.0 | % | 13,227 |
| 41.61 |
| 20.19 |
|
| 241 18th Street S. | National Landing | 100.0 | % | C | Y / Y | 1977 / 2013 | 360,034 |
| 333,544 |
| 26,490 |
| 94.0 | % | 91.8 | % | 90.2 | % | 12,404 |
| 38.96 |
| 20.04 |
|
| 251 18th Street S. | National Landing | 100.0 | % | C | Y / Y | 1975 / 2013 | 342,333 |
| 293,162 |
| 49,171 |
| 96.9 | % | 95.1 | % | 97.0 | % | 13,165 |
| 41.58 |
| 33.01 |
|
| 1215 S. Clark Street | National Landing | 100.0 | % | C | Y / Y | 1983 / 2002 | 336,159 |
| 333,546 |
| 2,613 |
| 100.0 | % | 100.0 | % | 100.0 | % | 10,968 |
| 32.62 |
| 33.51 |
|
| 201 12th Street S. | National Landing | 100.0 | % | C | Y / Y | 1987 / N/A | 329,607 |
| 318,482 |
| 11,125 |
| 98.5 | % | 98.5 | % | 100.0 | % | 11,837 |
| 36.30 |
| 40.79 |
|
| 800 North Glebe Road | Ballston | 100.0 | % | C | Y / Y | 2012 / N/A | 303,644 |
| 277,397 |
| 26,247 |
| 98.5 | % | 100.0 | % | 82.3 | % | 15,392 |
| 51.74 |
| 48.16 |
|
| 2200 Crystal Drive | National Landing | 100.0 | % | C | Y / Y | 1968 / 2006 | 283,608 |
| 283,608 |
| — |
| 82.8 | % | 76.2 | % | — |
| 8,501 |
| 39.35 |
| — |
|
| 1225 S. Clark Street | National Landing | 100.0 | % | C | Y / Y | 1982 / 2013 | 277,145 |
| 264,295 |
| 12,850 |
| 96.9 | % | 53.5 | % | 100.0 | % | 5,603 |
| 37.88 |
| 19.28 |
|
| 1901 South Bell Street | National Landing | 100.0 | % | C | Y / Y | 1968 / 2008 | 276,987 |
| 275,063 |
| 1,924 |
| 93.3 | % | 93.2 | % | 100.0 | % | 10,491 |
| 40.84 |
| 8.52 |
|
| Crystal City Marriott (345 Rooms) | National Landing | 100.0 | % | C | Y / Y | 1968 / 2013 | 266,000 |
| — |
| — |
| — |
| — |
| — |
| — |
| — |
| — |
|
| 2100 Crystal Drive | National Landing | 100.0 | % | C | Y / Y | 1968 / 2006 | 249,281 |
| 249,281 |
| — |
| 100.0 | % | 97.4 | % | — |
| 9,452 |
| 38.93 |
| — |
|
|
| |
| PROPERTY TABLE - COMMERCIAL | DECEMBER 31, 2019 (Unaudited)
|
|
| | | | | | | | | | | | | | | | | | | | | | | | | | | |
| Commercial Assets | Submarket | %
Ownership |
C/U (1)
| Same Store (2):
Q4 2018-2019 / YTD 2018-2019 | Year Built /
Renovated | Total Square Feet | Office Square Feet | Retail Square Feet | %
Leased | Office % Occupied | Retail % Occupied | Annualized Rent (in thousands) | Office Annualized Rent Per Square Foot (3) | Retail Annualized Rent Per Square Foot (4) |
| 1800 South Bell Street | National Landing | 100.0 | % | C | N / N | 1969 / 2007 | 215,828 |
| 191,349 |
| 24,479 |
| 100.0 | % | 100.0 | % | 100.0 | % | $ | 8,726 |
| $ | 44.41 |
| $ | 9.33 |
|
| 200 12th Street S. | National Landing | 100.0 | % | C | Y / Y | 1985 / 2013 | 202,708 |
| 202,708 |
| — |
| 90.5 | % | 90.5 | % | — |
| 8,101 |
| 44.17 |
| — |
|
2001 Richmond Highway (6) | National Landing | 100.0 | % | C | N / N | 1967 / N/A | 77,584 |
| 77,584 |
| — |
| 100.0 | % | 100.0 | % | — |
| 2,765 |
| 35.64 |
| — |
|
| Crystal City Shops at 2100 | National Landing | 100.0 | % | C | Y / Y | 1968 / 2006 | 59,574 |
| — |
| 59,574 |
| 88.2 | % | — |
| 88.2 | % | 776 |
| — |
| 14.77 |
|
| Crystal Drive Retail | National Landing | 100.0 | % | C | Y / Y | 2003 / N/A | 56,965 |
| — |
| 56,965 |
| 87.9 | % | — |
| 85.1 | % | 2,828 |
| — |
| 58.30 |
|
Central Place Tower (5) (7) | Rosslyn | 50.0 | % | U | N / N | 2018 / N/A | 552,437 |
| 524,537 |
| 27,900 |
| 93.0 | % | 92.6 | % | 100.0 | % | 31,830 |
| 64.09 |
| 24.79 |
|
| Stonebridge at Potomac Town Center* | Prince William County | 10.0 | % | U | Y / Y | 2012 / N/A | 503,613 |
| — |
| 503,613 |
| 95.8 | % | — |
| 95.4 | % | 15,963 |
| — |
| 33.24 |
|
| Pickett Industrial Park | Eisenhower Avenue | 10.0 | % | U | Y / Y | 1973 / N/A | 246,145 |
| 246,145 |
| — |
| 100.0 | % | 100.0 | % | — |
| 4,164 |
| 16.92 |
| — |
|
| Rosslyn Gateway-North | Rosslyn | 18.0 | % | U | Y / Y | 1996 / 2014 | 144,157 |
| 131,403 |
| 12,754 |
| 87.6 | % | 86.8 | % | 96.0 | % | 5,170 |
| 42.14 |
| 29.68 |
|
| Rosslyn Gateway-South | Rosslyn | 18.0 | % | U | Y / Y | 1961 / N/A | 102,194 |
| 94,610 |
| 7,584 |
| 86.9 | % | 90.6 | % | 40.4 | % | 2,352 |
| 25.82 |
| 45.10 |
|
|
|
|
|
|
|
|
|
|
|
|
|
|
|
|
|
|
|
|
|
|
|
|
|
|
| MD |
|
|
|
|
|
|
|
|
|
|
|
|
|
|
| 7200 Wisconsin Avenue | Bethesda CBD | 100.0 | % | C | Y / Y | 1986 / 2015 | 269,941 |
| 259,751 |
| 10,190 |
| 90.4 | % | 79.9 | % | 83.9 | % | $ | 10,637 |
| $ | 48.44 |
| $ | 67.54 |
|
One Democracy Plaza* (5) | Bethesda- Rock Spring | 100.0 | % | C | Y / Y | 1987 / 2013 | 212,894 |
| 210,756 |
| 2,138 |
| 96.9 | % | 96.9 | % | 100.0 | % | 6,670 |
| 32.34 |
| 29.98 |
|
| 4749 Bethesda Avenue Retail | Bethesda CBD | 100.0 | % | C | Y / Y | 2016 / N/A | 7,999 |
| — |
| 7,999 |
| 47.9 | % | — |
| 47.9 | % | 1,011 |
| — |
| 264.00 |
|
| 11333 Woodglen Drive | Rockville Pike Corridor | 18.0 | % | U | Y / Y | 2004 / N/A | 62,650 |
| 54,077 |
| 8,573 |
| 97.6 | % | 97.2 | % | 100.0 | % | 2,166 |
| 34.05 |
| 43.82 |
|
|
|
|
|
|
|
|
|
|
|
|
|
|
|
|
|
|
|
|
|
|
|
|
|
|
| Total / Weighted Average |
|
|
|
| 12,520,856 |
| 10,874,543 |
| 1,346,313 |
| 91.7 | % | 88.8 | % | 91.7 | % | $ | 473,821 |
| $ | 44.19 |
| $ | 37.98 |
|
|
|
|
|
|
|
|
|
|
|
|
|
|
|
|
| Recently Delivered |
|
|
|
|
|
|
|
|
|
|
|
|
|
|
| DC |
|
|
|
|
|
|
|
|
|
|
|
|
|
|
|
|
|
|
|
|
|
|
|
|
| 500 L'Enfant Plaza | Southwest | 49.0 | % | U | N / N | 2019 / N/A | 215,213 |
| 215,213 |
| — |
| 85.7 | % | 79.2 | % | — |
| 9,379 |
| 54.99 |
| — |
|
|
|
|
|
|
|
|
|
|
|
|
|
|
|
|
|
|
|
|
|
| Operating - Total / Weighted Average |
|
|
|
| 12,736,069 |
| 11,089,756 |
| 1,346,313 |
| 91.6 | % | 88.7 | % | 91.7 | % | $ | 483,200 |
| $ | 44.38 |
| $ | 37.98 |
|
|
|
|
|
|
|
|
|
|
|
|
|
|
|
|
| Under Construction |
|
|
|
|
|
|
|
|
|
|
|
|
|
|
| DC |
|
|
|
|
|
|
|
|
|
|
|
|
|
|
|
|
|
|
|
1900 N Street (5) | CBD | 55.0 | % | U |
|
| 271,433 |
| 258,931 |
| 12,502 |
| 73.4 | % |
|
| 552,000 |
|
|
|
| VA | | | | | | | | | | | | | | |
| 1770 Crystal Drive | National Landing | 100.0 | % | C | | | 271,572 |
| 258,299 |
| 13,273 |
| 97.8 | % | | | | | |
| Central District Retail | National Landing | 100.0 | % | C | | | 108,825 |
| — |
| 108,825 |
| 75.2 | % | | | | | |
|
| |
| PROPERTY TABLE - COMMERCIAL | DECEMBER 31, 2019 (Unaudited)
|
|
| | | | | | | | | | | | | | | | | | | | | | | | | | | |
| Commercial Assets | Submarket | %
Ownership |
C/U (1)
| Same Store (2):
Q4 2018-2019 / YTD 2018-2019 | Year Built /
Renovated | Total Square Feet | Office Square Feet | Retail Square Feet | %
Leased | Office % Occupied | Retail % Occupied | Annualized Rent (in thousands) | Office Annualized Rent Per Square Foot (3) | Retail Annualized Rent Per Square Foot (4) |
| MD |
|
|
|
|
|
|
|
|
|
|
|
|
|
|
|
|
|
|
|
4747 Bethesda Avenue (8) | Bethesda CBD | 100.0 | % | C |
|
| 291,414 |
| 285,251 |
| 6,163 |
| 87.7 | % |
|
|
|
|
|
| Under Construction - Total / Weighted Average |
|
|
|
| 943,244 |
| 802,481 |
| 140,763 |
| 85.1 | % |
|
|
|
|
|
|
|
|
|
|
|
|
|
|
|
|
|
|
|
|
|
|
|
|
|
|
|
|
| Total / Weighted Average |
|
|
|
| 13,679,313 |
| 11,892,237 |
| 1,487,076 |
| 91.1 | % |
|
|
|
|
|
|
|
|
|
|
|
|
|
|
|
|
|
|
|
|
|
|
|
|
| Totals at JBG SMITH Share |
|
|
|
|
|
|
|
|
|
|
|
|
|
|
| In service assets |
|
|
|
|
| 10,602,754 |
| 9,520,228 |
| 782,525 |
| 91.5 | % | 88.3 | % | 91.2 | % | $ | 401,113 |
| $ | 44.27 |
| $ | 40.39 |
|
| Recently delivered assets |
|
|
|
|
| 105,444 |
| 105,444 |
| — |
| 85.7 | % | 79.2 | % | — |
| $ | 4,595 |
| $ | 54.99 |
| $ | — |
|
| Operating assets |
|
|
|
|
| 10,708,198 |
| 9,625,672 |
| 782,525 |
| 91.4 | % | 88.2 | % | 91.2 | % | $ | 405,709 |
| $ | 44.38 |
| $ | 40.39 |
|
| Under construction assets |
|
|
|
|
| 821,099 |
| 685,962 |
| 135,137 |
| 86.8 | % |
|
|
|
|
|
|
|
|
|
|
|
|
|
|
|
|
|
|
|
| 893,000.0 |
|
|
|
|
|
| | | | | | | | | |
| Number of Assets and Total Square Feet Reconciliation | | |
| | | Number of Assets | | At 100% Share | | At JBG SMITH Share |
| Operating Assets | | | Square Feet | | Square Feet |
| Q3 2019 | | 45 |
| | 12,743,576 |
| | 10,993,101 |
|
| Placed into service | | — |
| | — |
| | — |
|
Dispositions (7) (9) | | (1 | ) | | (8,584 | ) | | (284,854 | ) |
| Out-of-service adjustment | | — |
| | (834 | ) | | (834 | ) |
| Building re-measurements | | — |
| | 1,911 |
| | 785 |
|
| Q4 2019 | | 44 |
| | 12,736,069 |
| | 10,708,198 |
|
See footnotes on page 37.
|
| |
| PROPERTY TABLE - COMMERCIAL | DECEMBER 31, 2019 (Unaudited)
|
Footnotes
Note: At 100% share, unless otherwise noted. Excludes our 10% subordinated interest in two commercial buildings held through a real estate venture in which we have no economic interest.
* Not Metro-served.
| |
| (1) | “C” denotes a consolidated interest. “U” denotes an unconsolidated interest. |
| |
| (2) | “Y” denotes an asset as same store and “N” denotes an asset as non-same store. |
| |
| (3) | Represents annualized office rent divided by occupied office square feet; annualized retail rent and retail square feet are excluded from this metric. Occupied office square footage may differ from leased office square footage because leased office square footage includes leases that have been signed but have not yet commenced. |
| |
| (4) | Represents annualized retail rent divided by occupied retail square feet. Occupied retail square footage may differ from leased retail square footage because leased retail square footage includes leases that have been signed but have not yet commenced. |
| |
| (5) | The following assets are subject to ground leases: |
|
| | |
| Commercial Asset | | Ground Lease Expiration Date |
| 1730 M Street | | 4/30/2061 |
| L'Enfant Plaza Office - East | | 11/23/2064 |
| L'Enfant Plaza Retail | | 11/23/2064 |
| Courthouse Plaza 1 and 2 | | 1/19/2062 |
| Central Place Tower* | | 6/2/2102 |
| One Democracy Plaza | | 11/17/2084 |
| 1900 N Street** | | 5/31/2106 |
* We have an option to purchase the ground lease at a fixed price. The ground lease has been recorded as a financing lease for accounting purposes; therefore, any expense is recorded as interest expense and excluded from NOI.
** Only a portion of the asset is subject to a ground lease.
| |
| (6) | The following assets contain space that is held for development or not otherwise available for lease. This out-of-service square footage is excluded from area, leased, and occupancy metrics. |
|
| | | | | |
| Commercial Asset | | In-Service | Not Available
for Lease |
| RTC - West | | 432,509 |
| 17,988 |
|
| 2001 Richmond Highway | | 77,584 |
| 82,254 |
|
| |
| (7) | In December 2019, we sold 50.0% of our interest in a real estate venture that owns Central Place Tower. |
| |
| (8) | Includes JBG SMITH’s lease for approximately 84,400 square feet. |
| |
| (9) | In December 2019, we sold Vienna Retail for $7.4 million. |
|
| |
| PROPERTY TABLE - MULTIFAMILY | DECEMBER 31, 2019 (Unaudited)
|
|
| | | | | | | | | | | | | | | | | | | | | | | | | | | | | |
| Multifamily Assets | Submarket | %
Ownership |
C/U (1)
| Same Store (2):
Q4 2018-2019 / YTD 2018-2019 | Year Built /
Renovated | Number of Units | Total Square Feet | Multifamily Square Feet | Retail Square Feet | % Leased | Multifamily
%
Occupied | Retail
%
Occupied | Annualized Rent (in thousands) |
Monthly Rent Per Unit (3) (4) |
Monthly Rent Per Square Foot (4) (5) |
| | | | | | | | | | | | | | | | |
| DC | | | | | | | | | | | | | | | |
| Fort Totten Square | Brookland/Fort Totten | 100.0 | % | C | Y / Y | 2015 / N/A | 345 |
| 384,956 |
| 254,292 |
| 130,664 |
| 95.6 | % | 91.6 | % | 100.0 | % | $ | 9,002 |
| $ | 1,806 |
| $ | 2.45 |
|
| WestEnd25 | West End | 100.0 | % | C | Y / Y | 2009 / N/A | 283 |
| 273,264 |
| 273,264 |
| — |
| 94.3 | % | 90.1 | % | — |
| 10,934 |
| 3,573 |
| 3.70 |
|
F1RST Residences (6) | Ballpark/Southeast | 100.0 | % | C | N / N | 2017 / N/A | 325 |
| 270,928 |
| 249,456 |
| 21,472 |
| 92.0 | % | 91.7 | % | 91.8 | % | 10,343 |
| 2,474 |
| 3.22 |
|
| 1221 Van Street | Ballpark/Southeast | 100.0 | % | C | N / N | 2018 / N/A | 291 |
| 225,530 |
| 202,715 |
| 22,815 |
| 95.1 | % | 92.1 | % | 100.0 | % | 8,840 |
| 2,388 |
| 3.43 |
|
| North End Retail | U Street/Shaw | 100.0 | % | C | Y / Y | 2015 / N/A | — |
| 27,355 |
| — |
| 27,355 |
| 95.6 | % | N/A |
| 95.6 | % | 1,467 |
| N/A |
| N/A |
|
| The Gale Eckington | H Street/NoMa | 5.0 | % | U | Y / Y | 2013 / 2017 | 603 |
| 466,716 |
| 465,516 |
| 1,200 |
| 95.7 | % | 93.2 | % | 100.0 | % | 14,182 |
| 2,097 |
| 2.72 |
|
| Atlantic Plumbing | U Street/Shaw | 64.0 | % | U | Y / Y | 2015 / N/A | 310 |
| 245,527 |
| 221,788 |
| 23,739 |
| 97.4 | % | 94.8 | % | 100.0 | % | 10,149 |
| 2,551 |
| 3.57 |
|
| | | | | | | | | | | | | | | | |
| VA | | | | | | | | | | | | | | | |
| RiverHouse Apartments | National Landing | 100.0 | % | C | Y / Y | 1960 / 2013 | 1,676 |
| 1,327,551 |
| 1,324,889 |
| 2,662 |
| 95.0 | % | 93.4 | % | 100.0 | % | $ | 34,306 |
| $ | 1,823 |
| $ | 2.31 |
|
| The Bartlett | National Landing | 100.0 | % | C | Y / Y | 2016 / N/A | 699 |
| 619,372 |
| 577,295 |
| 42,077 |
| 94.7 | % | 93.8 | % | 100.0 | % | 22,496 |
| 2,677 |
| 3.24 |
|
| 220 20th Street | National Landing | 100.0 | % | C | Y / Y | 2009 / N/A | 265 |
| 271,476 |
| 269,913 |
| 1,563 |
| 96.2 | % | 93.2 | % | 100.0 | % | 7,849 |
| 2,630 |
| 2.58 |
|
| 2221 S. Clark Street | National Landing | 100.0 | % | C | Y / Y | 1964 / 2016 | 216 |
| 164,743 |
| 164,743 |
| — |
| 100.0 | % | 100.0 | % | — |
| 3,491 |
| N/A |
| N/A |
|
| Fairway Apartments* | Reston | 10.0 | % | U | Y / Y | 1969 / 2005 | 346 |
| 370,850 |
| 370,850 |
| — |
| 94.2 | % | 93.1 | % | — |
| 6,537 |
| 1,692 |
| 1.58 |
|
| | | | | | | | | | | | | | | | |
| MD | | | | | | | | | | | | | | | |
| Falkland Chase-South & West | Downtown Silver Spring | 100.0 | % | C | Y / Y | 1938 / 2011 | 268 |
| 222,797 |
| 222,797 |
| — |
| 95.5 | % | 94.4 | % | — |
| $ | 5,141 |
| $ | 1,693 |
| $ | 2.04 |
|
| Falkland Chase-North | Downtown Silver Spring | 100.0 | % | C | Y / Y | 1938 / 1986 | 170 |
| 112,229 |
| 112,229 |
| — |
| 91.2 | % | 91.2 | % | — |
| 2,756 |
| 1,482 |
| 2.24 |
|
| Galvan | Rockville Pike Corridor | 1.8 | % | U | Y / Y | 2015 / N/A | 356 |
| 390,641 |
| 295,033 |
| 95,608 |
| 96.0 | % | 94.4 | % | 96.8 | % | 10,908 |
| 1,814 |
| 2.19 |
|
The Alaire (7) | Rockville Pike Corridor | 18.0 | % | U | Y / Y | 2010 / N/A | 279 |
| 266,673 |
| 251,691 |
| 14,982 |
| 94.6 | % | 92.5 | % | 100.0 | % | 6,067 |
| 1,775 |
| 1.97 |
|
The Terano (7) (8) | Rockville Pike Corridor | 1.8 | % | U | Y / Y | 2015 / N/A | 214 |
| 195,864 |
| 183,496 |
| 12,368 |
| 94.1 | % | 93.0 | % | 76.2 | % | 4,513 |
| 1,772 |
| 2.07 |
|
| | | | | | | | | | | | | | | | |
| Total / Weighted Average | | | | | 6,646 |
| 5,836,472 |
| 5,439,967 |
| 396,505 |
| 95.1 | % | 93.3 | % | 97.7 | % | $ | 168,981 |
| $ | 2,117 |
| $ | 2.58 |
|
| | | | | | | | | | | | | | | | |
Recently Delivered | | | | | | | | | | | | | | |
| DC | | | | | | | | | | | | | | | |
West Half (9) | Ballpark/Southeast | 100.0 | % | C | N / N | 2019 / N/A | 465 |
| 388,653 |
| 346,415 |
| 42,238 |
| 30.2 | % | 23.9 | % | 57.1 | % | 4,604 |
| 2,248 |
| 3.02 |
|
| Operating - Total / Weighted Average | | | | | 7,111 |
| 6,225,125 |
| 5,786,382 |
| 438,743 |
| 91.1 | % | 88.7 | % | 93.8 | % | $ | 173,585 |
| $ | 2,120 |
| $ | 2.60 |
|
| | | | | | | | | | |
| | | | | |
| Under Construction | | | | | | | | | | | | | | | |
| DC | | | | | | | | | | | | | | | |
965 Florida Avenue (10) | U Street/Shaw | 96.1 | % | C | | | 433 |
| 336,092 |
| 290,296 |
| 45,796 |
| | | | | | |
| Atlantic Plumbing C | U Street/Shaw | 100.0 | % | C | | | 256 |
| 225,531 |
| 206,057 |
| 19,474 |
| | | | | | |
|
| |
| PROPERTY TABLE - MULTIFAMILY | DECEMBER 31, 2019 (Unaudited)
|
|
| | | | | | | | | | | | | | | | | | | | | | | | | | | | | |
| Multifamily Assets | Submarket | %
Ownership |
C/U (1)
| Same Store (2):
Q4 2018-2019 / YTD 2018-2019 | Year Built /
Renovated | Number of Units | Total Square Feet | Multifamily Square Feet | Retail Square Feet | % Leased | Multifamily
%
Occupied | Retail
%
Occupied | Annualized Rent (in thousands) |
Monthly Rent Per Unit (3) (4) |
Monthly Rent Per Square Foot (4) (5) |
| | | | | | | | | | | | | | | | |
| MD | | | | | | | | | | | | | | | |
| 7900 Wisconsin Avenue | Bethesda CBD | 50.0 | % | U | | | 322 |
| 359,025 |
| 338,990 |
| 20,035 |
| | | | | | |
| | | | | | | | | | | | | | | | |
| Under Construction - Total | | | | | 1,011 |
| 920,648 |
| 835,343 |
| 85,305 |
| | | | | | |
| | | | | | | | | | | | | | | | |
| Total | | | | | 8,122 |
| 7,145,773 |
| 6,621,725 |
| 524,048 |
| | | | | | |
| | | | | | | | | | | | | | | | |
| Totals at JBG SMITH Share | | | | | | | | | | | | | | |
| In service assets | | | | | | 4,862 |
| 4,176,318 |
| 3,907,816 |
| 268,501 |
| 95.1 | % | 93.3 | % | 98.9 | % | $ | 125,854 |
| $ | 2,193 |
| $ | 2.72 |
|
| Recently delivered assets | | | | | | 465 |
| 388,653 |
| 346,415 |
| 42,238 |
| 30.2 | % | 23.9 | % | 57.1 | % | 4,604 |
| 2,248 |
| 3.02 |
|
| Operating assets | | | | | | 5,327 |
| 4,564,971 |
| 4,254,231 |
| 310,739 |
| 89.5 | % | 87.2 | % | 93.2 | % | $ | 130,458 |
| $ | 2,195 |
| $ | 2.73 |
|
| Under construction assets | | | | | | 833 |
| 728,163 |
| 654,643 |
| 73,520 |
| | | | | | |
|
| | | | | | | | | |
| Number of Assets and Total Square Feet/Units Reconciliation | | |
| | | Number of Assets | | At 100% Share | | At JBG SMITH Share |
| Operating Assets | | | Square Feet/Units | | Square Feet/Units |
| Q3 2019 | | 16 |
| | 5,565,544 SF/ 6,321 Units |
| | 3,905,390 SF/
4,537 Units |
|
Acquisitions (6) | | 1 |
| | 270,928 SF/ 325 Units |
| | 270,928 SF/ 325 Units |
|
Placed into service (9) | | 1 |
| | 388,653 SF/ 465 Units |
| | 388,653 SF/ 465 Units |
|
| Out-of-service adjustment | | — |
| | — |
| | — |
|
| Building re-measurements | | — |
| | — |
| | — |
|
| Q4 2019 | | 18 |
| | 6,225,125 SF/ 7,111 Units |
| | 4,564,971 SF/ 5,327 Units |
|
|
| | | | | | | | | | | | | | | | | | | | | | | | | | | | |
| Leasing Activity - Multifamily |
| | Number of Assets | Number of Units | Monthly Rent Per Unit (3) | | Multifamily % Occupied | | Annualized Rent (in thousands) |
| | Q4 2019 | Q4 2018 | % Change | | Q4 2019 | Q4 2018 | % Change | | Q4 2019 | Q4 2018 | % Change |
| DC | 4 |
| 857 |
| $ | 2,567 |
| $ | 2,515 |
| 2.1 | % | | 91.9 | % | 95.2 | % | (3.3 | )% | | $ | 24,251 |
| $ | 24,610 |
| (1.5 | )% |
| VA | 4 |
| 2,675 |
| 2,125 |
| 2,090 |
| 1.7 | % | | 93.5 | % | 94.2 | % | (0.7 | )% | | 63,765 |
| 63,018 |
| 1.2 | % |
| MD | 5 |
| 498 |
| 1,633 |
| 1,627 |
| 0.4 | % | | 93.1 | % | 95.7 | % | (2.6 | )% | | 9,094 |
| 9,315 |
| (2.4 | )% |
| Total / Weighted Average | 13 |
| 4,030 |
| $ | 2,157 |
| $ | 2,123 |
| 1.6 | % | | 93.1 | % | 94.4 | % | (1.3 | )% | | $ | 97,110 |
| $ | 96,943 |
| 0.2 | % |
| Note: At JBG SMITH share. Includes assets placed in service prior to October 1, 2018. Excludes North End Retail and 2221 S. Clark Street (WeLive). |
See footnotes on page 40.
|
| |
| PROPERTY TABLE - MULTIFAMILY | DECEMBER 31, 2019 (Unaudited)
|
Footnotes
Note: At 100% share.
* Not Metro-served.
| |
| (1) | “C” denotes a consolidated interest. “U” denotes an unconsolidated interest. |
| |
| (2) | “Y” denotes an asset as same store and “N” denotes an asset as non-same store. |
| |
| (3) | Represents multifamily rent divided by occupied multifamily units; retail rent is excluded from this metric. Occupied units may differ from leased units because leased units include leases that have been signed but have not yet commenced. |
| |
| (4) | Excludes North End Retail and 2221 S. Clark Street (WeLive). |
| |
| (5) | Represents multifamily rent divided by occupied multifamily square feet; retail rent and retail square feet are excluded from this metric. Occupied multifamily square footage may differ from leased multifamily square footage because leased multifamily square footage includes leases that have been signed but have not yet commenced. |
| |
| (6) | In December 2019, we acquired F1RST Residences for $160.5 million. |
| |
| (7) | The following assets are subject to ground leases: |
|
| | |
| Multifamily Asset | | Ground Lease Expiration Date |
| The Alaire | | 3/27/2107 |
| The Terano | | 8/5/2112 |
| |
| (8) | The following asset contains space that is held for development or not otherwise available for lease. This out-of-service square footage is excluded from area, leased, and occupancy metrics. |
|
| | | | | |
| Multifamily Asset | | In-Service | Not Available
for Lease |
| The Terano | | 195,864 |
| 3,904 |
|
| |
| (9) | In Q3 2019, we completed the construction of West Half. |
| |
| (10) | Ownership percentage reflects expected dilution of JBG SMITH's real estate venture partner as contributions are funded during the construction of the asset. As of December 31, 2019, JBG SMITH's ownership interest was 95.0%. |
|
| |
| PROPERTY TABLE - UNDER CONSTRUCTION | DECEMBER 31, 2019 (Unaudited)
|
|
| | | | | | | | | | | | | | | | | | | | | | | | | | |
| dollars in thousands, except per square foot data | %
Ownership | Estimated Square
Feet | % Pre-Leased |
Pre-Lease Rent Per Square Foot (1) | Estimated Number of Units | | Schedule (2) | | | At JBG SMITH Share |
| | | Construction Start Date | Estimated Completion Date | Estimated Stabilization Date | | Historical Cost (3) | Estimated Incremental Investment | Estimated Total Investment |
| Asset | Submarket | |
| | | | | | | | | | | | | | |
| Commercial | | | | | | | | | | | | | |
| DC | | | | | | | | | | | | | |
| 1900 N Street | CBD | 55.0% | 271,433 |
| 73.4 | % | $ | 85.95 |
| — | Q2 2017 | Q4 2019 | Q4 2021 | | $ | 111,099 |
| $ | 12,790 |
| $ | 123,889 |
|
| VA | | | | | | | | | | | | | |
| 1770 Crystal Drive | National Landing | 100.0% | 271,572 |
| 97.8 | % | 46.05 |
| — | Q4 2018 | Q2 2021 | Q2 2021 | | 84,641 |
| 41,627 |
| 126,268 |
|
| Central District Retail | National Landing | 100.0% | 108,825 |
| 75.2 | % | 46.91 |
| — | Q4 2018 | Q2 2021 | Q4 2021 | | 52,079 |
| 58,722 |
| 110,801 |
|
| MD | | | | | | | | | | | | | |
4747 Bethesda Avenue (4) | Bethesda CBD | 100.0% | 291,414 |
| 87.7 | % | 62.23 |
| — | Q2 2017 | Q4 2019 | Q2 2021 | | 140,475 |
| 20,145 |
| 160,620 |
|
| Total/weighted average | | | 943,244 |
| 85.1 | % | $ | 61.20 |
| — | Q1 2018 | Q3 2020 | Q3 2021 | | $ | 388,294 |
| $ | 133,284 |
| $ | 521,578 |
|
| | | | | | | | | | | | | | |
| Multifamily | | | | | | | | | | | | | |
| DC | | | | | | | | | | | | | |
965 Florida Avenue (5) | U Street/Shaw | 96.1% | 336,092 |
| — |
| — |
| 433 | Q4 2017 | Q4 2020 | Q1 2022 | | 123,561 |
| 29,058 |
| 152,619 |
|
| Atlantic Plumbing C | U Street/Shaw | 100.0% | 225,531 |
| — |
| — |
| 256 | Q1 2017 | Q4 2019 | Q3 2020 | | 148,122 |
| 10,531 |
| 158,653 |
|
| MD | | | | | | | | | | | | | |
| 7900 Wisconsin Avenue | Bethesda CBD | 50.0% | 359,025 |
| — |
| — |
| 322 | Q2 2017 | Q3 2020 | Q4 2021 | | 70,352 |
| 24,063 |
| 94,415 |
|
| Total/weighted average | | 920,648 |
| — |
| — |
| 1,011 | Q3 2017 | Q3 2020 | Q3 2021 | | $ | 342,035 |
| $ | 63,652 |
| $ | 405,687 |
|
| | | | | | | | | | | | | | |
Under Construction - Total / Weighted Average (6) | 1,863,892 |
| 85.1 | % | $ | 61.20 |
| 1,011 | Q4 2017 | Q3 2020 | Q3 2021 | | $ | 730,329 |
| $ | 196,936 |
| $ | 927,265 |
|
Under Construction - Total / Weighted Average at JBG SMITH Share (6) | 1,549,261 |
| 86.8 | % | $ | 58.09 |
| 833 | | | | | | | |
| | | | | | | | | | | | | | |
| | | | | Commercial | Multifamily | Total | | | | | | | |
| Weighted average projected NOI yield at JBG SMITH share: | | | | | | | | | | | |
Estimated total project cost (7) | 6.5 | % | 6.3 | % | 6.4 | % | | | | | Consol | 160,083 |
| |
| Estimated total investment | 6.3 | % | 5.7 | % | 6.1 | % | | | | | Unconsol | 36,803 |
| |
| Estimated incremental investment | 24.7 | % | 36.6 | % | 28.5 | % | | | | | | | |
| Estimated Stabilized NOI at JBG SMITH Share (dollars in millions) | $ | 32.9 |
| $ | 23.3 |
| $ | 56.2 |
|
| | | | | | |
____________________
Note: At 100% share, unless otherwise noted.
| |
| (1) | Based on leases signed as of December 31, 2019 and calculated as contractual monthly base rent before free rent, plus estimated tenant reimbursements for the month in which the lease commences, multiplied by 12. Triple net leases are converted to a gross basis by adding estimated tenant reimbursements to contractual monthly base rent. |
| |
| (2) | Average dates are weighted by JBG SMITH share of estimated square feet. |
| |
| (3) | Historical cost excludes certain GAAP adjustments, interest and ground lease costs. See definition of historical cost on page 51. |
| |
| (4) | Includes JBG SMITH’s lease for approximately 84,400 square feet. |
| |
| (5) | Ownership percentage reflects expected dilution of JBG SMITH's real estate venture partner as contributions are funded during the construction of the asset. As of December 31, 2019, JBG SMITH's ownership interest was 95.0%. |
| |
| (6) | Multifamily assets are excluded from the weighted average percent pre-leased and pre-lease rent per square foot metrics. |
| |
| (7) | Estimated total project cost is estimated total investment excluding purchase price allocation adjustments recognized as a result of the Formation Transaction. |
|
| |
| PROPERTY TABLE - FUTURE DEVELOPMENT | DECEMBER 31, 2019 (Unaudited)
(Unaudited)
|
|
| | | | | | | | | | | | | | | | | | | | | | | | | | | | | | | | | | | | | | | | | | |
| dollars in thousands, except per square foot data, at JBG SMITH share | | Estimated Commercial SF / Multifamily Units to be Replaced (1) | | | | | | Estimated Capitalized Cost of SF / Units to Be Replaced (4) | | Estimated Capitalized Cost of Ground Rent Payments (5) | | | | Estimated Total Investment per SF |
| | | Number of Assets | | | | | | | | | | | | | Estimated
Remaining Acquisition Cost (3) | | | | Estimated Total Investment | |
| | | | Estimated Potential Development Density (SF) | | | Historical Cost (2) | | | | | |
| Region | | | Total | | Office | | Multifamily | | Retail | | | | | | | |
| | | | | | | | | | | | | | | | | | | | | | | | | |
| Owned | | | | | | | | | | | | | | | | | | | | | | | | |
| DC | | | | | | | | | | | | | | | | | | | | | | | | |
| DC | | 8 |
| | 1,678,400 |
| | 312,100 |
| | 1,357,300 |
| | 9,000 |
| | — |
| | $ | 107,573 |
| | N/A | | $ | — |
| | $ | — |
| | $ | 107,573 |
| | $ | 64.09 |
|
| VA | | | | | | | | | | | | | | | | | | | | | | | | |
| National Landing | | 11 |
| | 6,910,400 |
| | 2,135,000 |
| | 4,655,700 |
| | 119,700 |
| | 293,412 SF |
| | 181,622 |
| | N/A | | 41,933 |
| | — |
| | 223,555 |
| | 32.35 |
|
| Reston | | 4 |
| | 2,589,200 |
| | 924,800 |
| | 1,462,400 |
| | 202,000 |
| | 15 units |
| | 75,263 |
| | N/A | | 3,056 |
| | — |
| | 78,319 |
| | 30.25 |
|
| Other VA | | 4 |
| | 199,600 |
| | 88,200 |
| | 102,100 |
| | 9,300 |
| | 21,568 SF |
| | 1,444 |
| | N/A | | 4,642 |
| | 2,504 |
| | 8,590 |
| | 43.04 |
|
| | | 19 |
| | 9,699,200 |
| | 3,148,000 |
| | 6,220,200 |
| | 331,000 |
| | 314,980 SF / 15 units |
| | 258,329 |
| | N/A | | 49,631 |
| | 2,504 |
| | 310,464 |
| | 32.01 |
|
| MD | | | | | | | | | | | | | | | | | | | | | | | | |
| Silver Spring | | 1 |
| | 1,276,300 |
| | — |
| | 1,156,300 |
| | 120,000 |
| | 170 units |
| | 15,095 |
| | N/A | | 34,800 |
| | — |
| | 49,895 |
| | 39.09 |
|
| Greater Rockville | | 4 |
| | 126,500 |
| | 19,200 |
| | 88,600 |
| | 18,700 |
| | — |
| | 3,270 |
| | N/A | | — |
| | 671 |
| | 3,941 |
| | 31.15 |
|
| | | 5 |
| | 1,402,800 |
| | 19,200 |
| | 1,244,900 |
| | 138,700 |
| | 170 units |
| | 18,365 |
| | N/A | | 34,800 |
| | 671 |
| | 53,836 |
| | 38.38 |
|
| Total / weighted average | | 32 |
| | 12,780,400 |
| | 3,479,300 |
| | 8,822,400 |
| | 478,700 |
| | 314,980 SF / 185 units |
| | $ | 384,267 |
| | N/A | | $ | 84,431 |
| | $ | 3,175 |
| | $ | 471,873 |
| | $ | 36.92 |
|
| | | | | | | | | | | | | | | | | | | | | | | | | |
Optioned (6) | | | | | | | | | | | | | | | | | | | | | | | | |
| DC | | | | | | | | | | | | | | | | | | | | | | | | |
| DC | | 3 |
| | 1,793,600 |
| | 78,800 |
| | 1,498,900 |
| | 215,900 |
| | — |
| | $ | 20,322 |
| | $ | 24,901 |
| | $ | — |
| | $ | 71,113 |
| | $ | 116,336 |
| | $ | 64.86 |
|
| VA | | | | | | | | | | | | | | | | | | | | | | | | |
| Other VA | | 1 |
| | 11,300 |
| | — |
| | 10,400 |
| | 900 |
| | — |
| | 127 |
| | 995 |
| | — |
| | — |
| | 1,122 |
| | 99.29 |
|
| Total / weighted average | | 4 |
| | 1,804,900 |
| | 78,800 |
| | 1,509,300 |
| | 216,800 |
| | — |
| | $ | 20,449 |
| | $ | 25,896 |
| | $ | — |
| | $ | 71,113 |
| | $ | 117,458 |
| | $ | 65.08 |
|
| | | | | | | | | | | | | | | | | | | | | | | | | |
| Held for Sale | | | | | | | | | | | | | | | | | | | | | | | | |
| VA | | | | | | | | | | | | | | | | | | | | | | | | |
National Landing (7) | | 4 |
| | 4,082,000 |
| | 4,082,000 |
| | — |
| | — |
| | — |
| | $ | 166,998 |
| | N/A | | $ | — |
| | $ | — |
| | $ | 166,998 |
| | $ | 40.91 |
|
| | | | | | | | | | | | | | | | | | | | | | | | | |
| Total / Weighted Average | | 40 |
| | 18,667,300 |
| | 7,640,100 |
| | 10,331,700 |
| | 695,500 |
| | 314,980 SF / 185 units |
| | $ | 571,714 |
| | $ | 25,896 |
| | $ | 84,431 |
| | $ | 74,288 |
| | $ | 756,329 |
| | $ | 40.52 |
|
____________________
| |
| (1) | Represents management's estimate of the total office and/or retail rentable square feet and multifamily units that would need to be redeveloped to access some of the estimated potential development density. |
| |
| (2) | Historical cost includes certain intangible assets, such as option and transferable density rights values; and excludes certain GAAP adjustments, such as capitalized interest and ground lease costs. See definition of historical cost on page 51. |
| |
| (3) | Represents management's estimate of remaining deposits, option payments, and option strike prices as of December 31, 2019. |
| |
| (4) | Capitalized value of estimated commercial square feet / multifamily units to be replaced, which generated approximately $1.3 million of NOI for the three months ended December 31, 2019 (included in the NOI of the applicable operating segment), at a 6.0% capitalization rate. |
| |
| (5) | Capitalized value of stabilized annual ground rent payments associated with leasehold assets at a 5.0% capitalization rate. Two owned parcels and one optioned parcel are leasehold interests with estimated annual stabilized ground rent payments totaling $3.7 million. |
| |
| (6) | As of December 31, 2019, the weighted average remaining term for the optioned future development assets is 4.5 years. |
| |
| (7) | Represents the estimated potential development density that JBG SMITH has sold to Amazon pursuant to executed purchase and sale agreements. Subject to customary closing conditions, Amazon contracted to acquire these two development sites for an estimated aggregate $293.9 million. In January 2020, we sold Metropolitan Park to Amazon for a gross sales price of $155.0 million, which represents an $11.0 million increase over the previously estimated contract value resulting from an increase in the approved development density on the sites. We expect the sale of the Pen Place land to Amazon to be completed in 2021. |
|
| |
| DISPOSITION & RECAPITALIZATION ACTIVITY | DECEMBER 31, 2019 (Unaudited)
|
Disposition Activity (1):
|
| | | | | | | | | | | | | | | | |
| dollars in thousands, at JBG SMITH share | | | | | Total Square Feet/ Estimated Potential Development Density | Gross Sales Price | Net Cash Proceeds | Book Gain |
| Assets | Ownership Percentage | Asset Type | | Location | Date Disposed |
| |
| | | | | | | | | | |
| Q1 2019 | | | | | | | | | |
Commerce Executive / Commerce Metro Land (2) | 100.0% | Commercial / Future Development | | Reston, VA | February 4, 2019 | 388,562 / 894,000 |
| $ | 114,950 |
| $ | 117,676 |
| $ | 39,033 |
|
| | | | | | | | | | |
| Q2 2019 | | | | | | | | | |
| None | | | | | | | | | |
| | | | | | | | | | |
| Q3 2019 | | | | | | | | | |
| 1600 K Street | 100.0% | Commercial | | Washington, DC | July 31, 2019 | 82,653 |
| $ | 43,000 |
| $ | 40,134 |
| $ | 8,088 |
|
| | | | | | | | | | |
| Q4 2019 | | | | | | | | | |
| Vienna Retail | 100.0% | Commercial | | Vienna, VA | December 18, 2019 | 8,584 |
| 7,400 |
| 7,005 |
| 4,514 |
|
| | | | | | | | | | |
| | | | | | | | | | |
| Total | | | |
|
| 479,799/ 894,000 |
| $ | 165,350 |
| $ | 164,815 |
| $ | 51,635 |
|
Recapitalization Activity:
In December 2019, we sold a 50.0% interest in a real estate venture that owns Central Place Tower, a 552,000 square foot commercial asset located in Arlington, Virginia.
_______________
| |
| (1) | The disposed assets generated $2.0 million and $10.8 million of NOI for the three months and year ended December 31, 2019. As of December 31, 2019, Pen Place and Metropolitan Park were classified as held for sale in our condensed consolidated balance sheet. In March 2019, we entered into agreements for the sale of Pen Place and Metropolitan Park, Future Development assets having an aggregate estimated potential development density of up to approximately 4.1 million square feet, with Amazon for its additional headquarters. Subject to customary closing conditions, Amazon contracted to acquire these two development sites for an estimated aggregate $293.9 million. In January 2020, we sold Metropolitan Park to Amazon for a gross sales price of $155.0 million, which represents an $11.0 million increase over the previously estimated contract value resulting from an increase in the approved development density on the sites. We expect the sale of the Pen Place land to Amazon to be completed in 2021. |
| |
| (2) | Net cash proceeds include the reimbursement of $4.0 million of tenant improvement costs and leasing commissions paid by us prior to the closing. |
|
| |
| DEBT SUMMARY | DECEMBER 31, 2019 (Unaudited)
|
|
| | | | | | | | | | | | | | | | | | | | | | | | | | | | | |
| dollars in thousands, at JBG SMITH share | | 2020 | | 2021 | | 2022 | | 2023 | | 2024 | | Thereafter | | Total |
| | | | | | | | | | | | | | | |
| Consolidated and Unconsolidated Principal Balance | | | | | | | | | | |
| | Unsecured Debt: | | | | | | | | | | | | | | |
| | Revolving credit facility ($1 billion commitment) (1) (5) | | $ | — |
| | $ | 200,000 |
| | $ | — |
| | $ | — |
| | $ | — |
| | $ | — |
| | $ | 200,000 |
|
| | Term loans ($400 million commitment) | | — |
| | — |
| | — |
| | 100,000 |
| | 200,000 |
| | — |
| | 300,000 |
|
| Total unsecured debt | | — |
| | 200,000 |
| | — |
| | 100,000 |
| | 200,000 |
| | — |
| | 500,000 |
|
| | Secured Debt: | | | | | | | | | | | | | | |
| | Consolidated principal balance (6) | | 99,341 |
| | 96,227 |
| | 107,500 |
| | 173,961 |
| | 134,290 |
| | 516,529 |
| | 1,127,848 |
|
| | Unconsolidated principal balance | | 117,688 |
| | — |
| | 119,050 |
| | 26,483 |
| | — |
| | 66,998 |
| | 330,219 |
|
| Total secured debt | | 217,029 |
| | 96,227 |
| | 226,550 |
| | 200,444 |
| | 134,290 |
| | 583,527 |
| | 1,458,067 |
|
| | | | | | | | | | | | | | | |
Total Consolidated and Unconsolidated Principal Balance | | $ | 217,029 |
| | $ | 296,227 |
| | $ | 226,550 |
| | $ | 300,444 |
| | $ | 334,290 |
| | $ | 583,527 |
| | $ | 1,958,067 |
|
| | | | | | | | | | | | | | | | |
| | % of total debt maturing | | 11.1 | % | | 15.1 | % | | 11.6 | % | | 15.3 | % | | 17.1 | % | | 29.8 | % | | 100.0 | % |
| | % floating rate (2) | | 49.4 | % | | 67.5 | % | | 48.0 | % | | 1.9 | % | | 18.7 | % | | 1.5 | % | | 25.2 | % |
| | % fixed rate (3) | | 50.6 | % | | 32.5 | % | | 52.0 | % | | 98.1 | % | | 81.3 | % | | 98.5 | % | | 74.8 | % |
| | | | | | | | | | | | | | | | |
| Weighted Average Interest Rates | | | | | | | | | | | | | | |
| | Variable rate | | 5.48 | % | | 2.86 | % | | 3.24 | % | | 3.16 | % | | 2.91 | % | | 3.58 | % | | 3.54 | % |
| | Fixed rate | | 3.32 | % | | 4.88 | % | | 3.59 | % | | 4.48 | % | | 3.85 | % | | 4.31 | % | | 4.20 | % |
| Total Weighted Average Interest Rates | | 4.39 | % | | 3.52 | % | | 3.42 | % | | 4.45 | % | | 3.68 | % | | 4.30 | % | | 4.03 | % |
| | | | | | | | | | | | | | | | |
| | | | Credit Facility | | | | | | |
| | | | Revolving Credit
Facility | | Tranche A-1 Term Loan | | Tranche A-2 Term Loan | | Total/Weighted Average | | | | | | 1,627,848 |
|
| Credit limit | | $ | 1,000,000 |
| | $ | 200,000 |
| | $ | 200,000 |
| | $ | 1,400,000 |
| | | | | | 2.12 | % |
| Outstanding principal balance | | $ | 200,000 |
| | $ | 100,000 |
| | $ | 200,000 |
| | $ | 500,000 |
| | | | | | |
| Letters of credit | | $ | 1,466 |
| | $ | — |
| | $ | — |
| | $ | 1,466 |
| | | | | | |
| Undrawn capacity | | $ | 798,534 |
| | $ | 100,000 |
| | $ | — |
| | $ | 898,534 |
| | | | | | |
Interest rate spread (4) (5) | | 1.10 | % | | 1.20 | % | | 1.15 | % | | 1.14 | % | | | | | | |
All-In interest rate (7) | | 2.86 | % | | 3.32 | % | | 3.74 | % | | 3.30 | % | | | | | | |
Initial maturity date (5) | | Jul-21 |
| | Jan-23 |
| | Jul-24 |
| | — |
| | | | | | |
| Delayed draw availability period | — |
| | Jul-20 |
| | — |
| | — |
| | | | | | |
____________________
| |
| (1) | In 2020, we repaid the revolving credit facility. |
| |
| (2) | Floating rate debt includes floating rate loans with interest rate caps. |
| |
| (3) | Fixed rate debt includes floating rate loans with interest rate swaps. |
| |
| (4) | The interest rate for the revolving credit facility excludes a 0.15% facility fee. |
| |
| (5) | In January 2020, the revolving credit facility was amended to extend the maturity date to January 2025. |
| |
| (6) | Excludes a $175.0 million mortgage loan collateralized by 4747 and 4749 Bethesda Avenue entered into in February 2020. The mortgage loan has an interest rate of L + 1.35% and matures in February 2027. |
| |
| (7) | The all-in interest rate is inclusive of interest rate swaps. As of December 31, 2019, the notional amount of the Tranche A-1 Term Loan and the Tranche A-2 Term Loan interest rate swap was $100.0 million and $137.6 million. |
|
| |
| DEBT BY INSTRUMENT | DECEMBER 31, 2019 (Unaudited)
|
|
| | | | | | | | | | | | | |
dollars in thousands
Asset |
% Ownership |
Principal Balance | Stated Interest Rate | Interest Rate Hedge | Current Annual Interest Rate (1) | Initial Maturity Date | Extended Maturity Date (2) |
| | | | | | | | |
| Consolidated | | | | | | | |
| RTC - West | 100.0 | % | $ | 97,141 |
| L + 1.50% | Swap | 3.33 | % | 04/12/20 | 04/12/21 |
| Courthouse Plaza 1 and 2 | 100.0 | % | 2,200 |
| L + 1.60% | — | 3.36 | % | 05/10/20 | 05/10/21 |
| WestEnd25 | 100.0 | % | 96,227 |
| 4.88% | Fixed | 4.88 | % | 06/01/21 | 06/01/21 |
Credit Facility - Revolving Credit Facility (3) | 100.0 | % | 200,000 |
| L + 1.10% | — | 2.86 | % | 07/16/21 | 07/16/22 |
| Credit Facility -Tranche A-1 Term Loan | 100.0 | % | 100,000 |
| L + 1.20% | Swap | 3.32 | % | 01/18/23 | 01/18/23 |
| 2121 Crystal Drive | 100.0 | % | 133,960 |
| 5.51% | Fixed | 5.51 | % | 03/01/23 | 03/01/23 |
| Falkland Chase - South & West | 100.0 | % | 40,001 |
| 3.78% | Fixed | 3.78 | % | 06/01/23 | 06/01/23 |
| 800 North Glebe Road | 100.0 | % | 107,500 |
| L + 1.60% | Swap | 3.60 | % | 06/30/22 | 06/30/24 |
Credit Facility - Tranche A-2 Term Loan (4) | 100.0 | % | 200,000 |
| L + 1.15% | Swap | 3.74 | % | 07/18/24 | 07/18/24 |
| 2101 L Street | 100.0 | % | 134,290 |
| 3.97% | Fixed | 3.97 | % | 08/15/24 | 08/15/24 |
| 201 12th Street S., 200 12th Street S., and 251 18th Street S. | 100.0 | % | 83,319 |
| 7.94% | Fixed | 7.94 | % | 01/01/25 | 01/01/25 |
| RiverHouse Apartments | 100.0 | % | 307,710 |
| L + 1.28% | Swap | 3.47 | % | 04/01/25 | 04/01/25 |
| 1730 M Street | 100.0 | % | 47,500 |
| L + 1.25% | Swap | 3.92 | % | 12/21/25 | 12/21/25 |
| 1235 S. Clark Street | 100.0 | % | 78,000 |
| 3.94% | Fixed | 3.94 | % | 11/01/27 | 11/01/27 |
| Total Consolidated Principal Balance | | 1,627,848 |
| | | | | |
| Premium / (discount) recognized as a result of the Formation Transaction | 1,055 |
| |
|
|
| |
| Deferred financing costs - mortgage loans | | (3,126 | ) | | 1,062,051 |
| | | |
Deferred financing costs - credit facility (5) | | (5,776 | ) | | 797,451 |
| | | |
| Total Consolidated Indebtedness | | $ | 1,620,001 |
| | 862,051 |
| | | |
| | | | | | | | |
| Total Consolidated Indebtedness (net of premium / (discount) and deferred financing costs) | | | | | |
| Mortgages payable | | $ | 1,125,777 |
| | | | | |
| Revolving credit facility | | 200,000 |
| 200,000 |
| 3,071 |
| | | |
| Deferred financing costs, net - credit facility (included in other assets) | (3,071 | ) | | | | | |
| Unsecured term loan | | 297,295 |
| | | | | |
| Total Consolidated Indebtedness | | $ | 1,620,001 |
|
| | | | |
| | | | | | | | |
|
| |
| DEBT BY INSTRUMENT | DECEMBER 31, 2019 (Unaudited)
|
|
| | | | | | | | | | | | | |
dollars in thousands
Asset |
% Ownership |
Principal Balance | Stated Interest Rate | Interest Rate Hedge | Current Annual Interest Rate (1) | Initial Maturity Date | Extended Maturity Date (2) |
| | | | | | | | |
| Unconsolidated | | | | | | | |
11333 Woodglen Drive (6) | 18.0 | % | $ | 12,370 |
| L + 1.90% | Swap | 3.52 | % | 04/01/20 | 04/01/20 |
| Galvan | 1.8 | % | 89,500 |
| L + 1.75% | Cap | 3.51 | % | 03/06/20 | 03/06/21 |
L'Enfant Plaza Office - North, L'Enfant Plaza Office - East, L'Enfant Plaza Retail (7) | 49.0 | % | 211,019 |
| L + 3.65% | Cap | 5.56 | % | 05/08/20 | 05/08/22 |
| Atlantic Plumbing | 64.0 | % | 100,000 |
| L + 1.50% | — | 3.26 | % | 11/08/22 | 11/08/22 |
| Stonebridge at Potomac Town Center | 10.0 | % | 104,611 |
| L + 1.70% | Swap | 3.25 | % | 12/10/20 | 12/10/22 |
| Rosslyn Gateway - North, Rosslyn Gateway - South | 18.0 | % | 49,666 |
| L + 2.00% | Cap | 3.76 | % | 08/29/22 | 08/29/24 |
| 500 L'Enfant Plaza | 49.0 | % | 73,294 |
| L + 1.30% | Cap | 3.06 | % | 10/25/22 | 10/25/24 |
| The Foundry | 9.9 | % | 58,000 |
| L + 1.40% | Cap | 3.16 | % | 12/12/23 | 12/12/24 |
| The Alaire | 18.0 | % | 48,000 |
| L + 1.82% | Cap | 3.58 | % | 03/01/25 | 03/01/25 |
| 1101 17th Street | 55.0 | % | 60,000 |
| L + 1.25% | Swap | 4.13 | % | 06/13/25 | 06/13/25 |
| Fairway Apartments | 10.0 | % | 46,579 |
| L + 1.50% | Swap | 3.54 | % | 07/01/22 | 07/01/25 |
| 7900 Wisconsin Avenue | 50.0 | % | 44,772 |
| 4.82% | Fixed | 4.82 | % | 07/15/25 | 07/15/25 |
| The Gale Eckington | 5.0 | % | 110,813 |
| L + 1.60% | Swap | 3.56 | % | 07/31/22 | 07/31/25 |
| Pickett Industrial Park | 10.0 | % | 23,600 |
| L + 1.45% | Swap | 3.56 | % | 09/04/25 | 09/04/25 |
| The Terano | 1.8 | % | 34,000 |
| L + 1.35% | Swap | 4.45 | % | 11/09/25 | 11/09/25 |
| Wardman Park | 16.7 | % | 124,491 |
| 4.77% | Fixed | 4.77 | % | 02/01/23 | 02/01/28 |
| Total Unconsolidated Principal Balance | | 1,190,715 |
| | | | | |
| Deferred financing costs | | (2,859 | ) | | | | | |
| Total Unconsolidated Indebtedness | | $ | 1,187,856 |
| | | | | |
| | | | | | | | |
| Principal Balance at JBG SMITH Share | | | | | | | |
| Consolidated principal balance at JBG SMITH share | | $ | 1,627,848 |
| 74.8 | % | | | | |
| Unconsolidated principal balance at JBG SMITH share | | 330,219 |
| 33 | % | | 448,519 |
|
| |
| Total Consolidated and Unconsolidated Principal Balance at JBG SMITH Share | $ | 1,958,067 |
| | | | | |
| | | | | | | | |
| Indebtedness at JBG SMITH Share (net of premium / (discount) and deferred financing costs) | | | | | |
| Consolidated indebtedness at JBG SMITH Share | | $ | 1,620,001 |
|
| 1,620,001 |
| | | |
| Unconsolidated indebtedness at JBG SMITH Share | | 329,056 |
| | | | | |
| Total Consolidated and Unconsolidated Indebtedness at JBG SMITH Share | $ | 1,949,057 |
| 1.95 |
| | | | |
____________________
| |
| (1) | December 31, 2019 one-month LIBOR of 1.76% applied to loans which are denoted as floating (no swap) or floating with a cap, except as otherwise noted. |
| |
| (2) | Represents the maturity date based on execution of all extension options. Many of these extensions are subject to lender covenant tests. |
| |
| (3) | In January 2020, the revolving credit facility was amended to extend the maturity date to January 2025. In 2020, we repaid the revolving credit facility. |
| |
| (4) | As of December 31, 2019, the notional amount of the Tranche A-2 Term Loan interest rate swap was $137.6 million. |
| |
| (5) | As of December 31, 2019, net deferred financing costs related to our revolving credit facility totaling $3.1 million were included in "Other assets, net" in our condensed consolidated balance sheet. |
| |
| (6) | The interest rate swap associated with 11333 Woodglen Drive matured on January 1, 2020. The loan is now floating and has an all-in interest rate of 3.66%. |
| |
| (7) | The base rate for this loan is three-month LIBOR, which was 1.91% as of December 31, 2019. |
|
| |
| CONSOLIDATED REAL ESTATE VENTURES | DECEMBER 31, 2019 (Unaudited)
|
|
| | | | | | | |
| | Asset Type | City | Submarket | % Ownership |
Total Square Feet |
| MRP Realty | | | | | |
965 Florida Avenue (1) | Multifamily | Washington, DC | U Street/Shaw | 96.1 | % | 336,092 |
|
| | | | | | |
| Total Consolidated Real Estate Ventures | | | | | 336,092 |
|
____________________
Note: Total square feet at 100% share.
| |
| (1) | Ownership percentage reflects expected dilution of JBG SMITH's real estate venture partner as contributions are funded during the construction of the asset. As of December 31, 2019, JBG SMITH's ownership interest was 95.0%. |
|
| |
UNCONSOLIDATED REAL ESTATE VENTURES | DECEMBER 31, 2019 (Unaudited)
|
|
| | | | | | | |
| | Asset Type | City | Submarket | % Ownership |
Total Square Feet |
| Landmark | | | | | |
| L'Enfant Plaza Office - East | Commercial | Washington, DC | Southwest | 49.0 | % | 397,057 |
|
| L'Enfant Plaza Office - North | Commercial | Washington, DC | Southwest | 49.0 | % | 298,445 |
|
| 500 L'Enfant Plaza | Commercial | Washington, DC | Southwest | 49.0 | % | 215,213 |
|
| L'Enfant Plaza Retail | Commercial | Washington, DC | Southwest | 49.0 | % | 119,291 |
|
| Rosslyn Gateway - North | Commercial | Arlington, VA | Rosslyn | 18.0 | % | 144,157 |
|
| Rosslyn Gateway - South | Commercial | Arlington, VA | Rosslyn | 18.0 | % | 102,194 |
|
| 11333 Woodglen Drive | Commercial | Rockville, MD | Rockville Pike Corridor | 18.0 | % | 62,650 |
|
| Galvan | Multifamily | Rockville, MD | Rockville Pike Corridor | 1.8 | % | 390,641 |
|
| The Alaire | Multifamily | Rockville, MD | Rockville Pike Corridor | 18.0 | % | 266,673 |
|
| The Terano | Multifamily | Rockville, MD | Rockville Pike Corridor | 1.8 | % | 195,864 |
|
| NoBe II Land | Future Development | Rockville, MD | Rockville Pike Corridor | 18.0 | % | 589,000 |
|
| Rosslyn Gateway - South Land | Future Development | Arlington, VA | Rosslyn | 18.0 | % | 498,500 |
|
| Rosslyn Gateway - North Land | Future Development | Arlington, VA | Rosslyn | 18.0 | % | 311,000 |
|
| L'Enfant Plaza Office - Center | Future Development | Washington, DC | Southwest | 49.0 | % | 350,000 |
|
| Courthouse Metro Land | Future Development | Arlington, VA | Clarendon/Courthouse | 18.0 | % | 286,500 |
|
| Courthouse Metro Land - Option | Future Development | Arlington, VA | Clarendon/Courthouse | 18.0 | % | 62,500 |
|
| 5615 Fishers Drive | Future Development | Rockville, MD | Rockville Pike Corridor | 18.0 | % | 106,500 |
|
| 12511 Parklawn Drive | Future Development | Rockville, MD | Rockville Pike Corridor | 18.0 | % | 6,500 |
|
| Woodglen | Future Development | Rockville, MD | Rockville Pike Corridor | 18.0 | % | — |
|
| | | | | | 4,402,685 |
|
| | | | | | |
| CBREI Venture | | | | | |
| Stonebridge at Potomac Town Center | Commercial | Woodbridge, VA | Prince William County | 10.0 | % | 503,613 |
|
| Pickett Industrial Park | Commercial | Alexandria, VA | Eisenhower Avenue | 10.0 | % | 246,145 |
|
| The Foundry | Commercial | Washington, DC | Georgetown | 9.9 | % | 225,095 |
|
| The Gale Eckington | Multifamily | Washington, DC | H Street/NoMa | 5.0 | % | 466,716 |
|
| Fairway Apartments | Multifamily | Reston, VA | Reston | 10.0 | % | 370,850 |
|
| Atlantic Plumbing | Multifamily | Washington, DC | U Street/Shaw | 64.0 | % | 245,527 |
|
| Fairway Land | Future Development | Reston, VA | Reston | 10.0 | % | 526,200 |
|
| Stonebridge at Potomac Town Center - Land | Future Development | Woodbridge, VA | Prince William County | 10.0 | % | 22,900 |
|
| | | | | | 2,607,046 |
|
| | | | | | |
|
| |
UNCONSOLIDATED REAL ESTATE VENTURES | DECEMBER 31, 2019 (Unaudited)
|
|
| | | | | | | |
| | Asset Type | City | Submarket | % Ownership |
Total Square Feet |
| Canadian Pension Plan Investment Board | | | | | |
| 1900 N Street | Commercial | Washington, DC | CBD | 55.0 | % | 271,433 |
|
| 1101 17th Street | Commercial | Washington, DC | CBD | 55.0 | % | 211,781 |
|
| | | | | | 483,214 |
|
| | | | | | |
| Forest City | | | | | |
| Waterfront Station | Future Development | Washington, DC | Southwest | 2.5 | % | 662,600 |
|
| | | | | | |
| Brandywine | | | | | |
| 1250 1st Street | Future Development | Washington, DC | NoMa | 30.0 | % | 265,800 |
|
| 51 N Street | Future Development | Washington, DC | NoMa | 30.0 | % | 177,500 |
|
| 50 Patterson Street | Future Development | Washington, DC | NoMa | 30.0 | % | 142,200 |
|
| | | | | | 585,500 |
|
| Prudential Global Investment Management | | | | | |
Central Place Tower (1) | Commercial | Arlington, VA | Rosslyn | 50.0 | % | 552,437 |
|
| | | | | | |
| Berkshire Group | | | | | |
| 7900 Wisconsin Avenue | Multifamily | Bethesda, MD | Bethesda CBD | 50.0 | % | 359,025 |
|
| | | | | | |
| CIM Group / Pacific Life Insurance Company | | | | | |
| Wardman Park | Future Development | Washington, DC | Woodley Park | 16.7 | % | — |
|
| | | | | | |
| Total Unconsolidated Real Estate Ventures | | | | | 9,652,507 |
|
| | | | | | |
____________________
Note: Total square feet at 100% share.
| |
| (1) | In December 2019, we sold a 50.0% interest in a real estate venture that owns Central Place Tower. |
|
| |
| DEFINITIONS | DECEMBER 31, 2019
|
Annualized Rent
“Annualized rent” is defined as (i) for commercial assets, or the retail component of a mixed-use asset, the in-place monthly base rent before free rent, plus tenant reimbursements as of December 31, 2019, multiplied by 12, with triple net leases converted to a gross basis by adding estimated tenant reimbursements to monthly base rent, and (ii) for multifamily assets, or the multifamily component of a mixed-use asset, the in-place monthly base rent before free rent as of December 31, 2019, multiplied by 12. Annualized rent excludes rent from signed but not yet commenced leases.
Annualized Rent Per Square Foot
“Annualized rent per square foot” is defined as (i) for commercial assets, annualized office rent divided by occupied office square feet and annualized retail rent divided by occupied retail square feet; and (ii) for multifamily assets, monthly multifamily rent divided by occupied multifamily square feet; annualized retail rent and retail square feet are excluded from this metric. Occupied square footage may differ from leased square footage because leased square footage includes leases that have been signed but have not yet commenced.
Earnings Before Interest, Taxes, Depreciation and Amortization ("EBITDA"), EBITDA for Real Estate ("EBITDAre") and Adjusted EBITDA
Management uses EBITDA and EBITDAre, non-GAAP financial measures, as supplemental operating performance measures and believes they help investors and lenders meaningfully evaluate and compare our operating performance from period-to-period by removing from our operating results the impact of our capital structure (primarily interest charges from our outstanding debt and the impact of our interest rate swaps) and certain non-cash expenses (primarily depreciation and amortization on our assets). EBITDAre is computed in accordance with the definition established by NAREIT. NAREIT defines EBITDAre as GAAP net income (loss) adjusted to exclude interest expense, income taxes, depreciation and amortization expenses, gains on sales of real estate and impairment losses of real estate, including our share of such adjustments of unconsolidated real estate ventures. These supplemental measures may help investors and lenders understand our ability to incur and service debt and to make capital expenditures. EBITDA and EBITDAre are not substitutes for net income (loss) (computed in accordance with GAAP) and may not be comparable to similarly titled measures used by other companies.
“Adjusted EBITDA,” a non-GAAP financial measure, represents EBITDAre adjusted for items we believe are not representative of ongoing operating results, such as transaction and other costs, gain (loss) on the extinguishment of debt, distributions in excess of our investment in unconsolidated real estate ventures, gain on the bargain purchase of a business, lease liability adjustments and share-based compensation expense related to the Formation Transaction and special equity awards. We believe that adjusting such items not considered part of our comparable operations, provides a meaningful measure to evaluate and compare our performance from period-to-period.
Because EBITDA, EBITDAre and Adjusted EBITDA have limitations as analytical tools, we use EBITDA, EBITDAre and Adjusted EBITDA to supplement GAAP financial measures. Additionally, we believe that users of these measures should consider EBITDA, EBITDAre and Adjusted EBITDA in conjunction with net income (loss) and other GAAP measures in understanding our operating results. A reconciliation of net income (loss) to EBITDA, EBITDAre and Adjusted EBITDA is presented on page 15.
Estimated Potential Development Density
‘‘Estimated potential development density’’ reflects management’s estimate of developable gross square feet based on our current business plans with respect to real estate owned or controlled as of December 31, 2019. Our current business plans may contemplate development of less than the maximum potential development density for individual assets. As market conditions change, our business plans, and therefore, the Estimated Potential Development Density, could change accordingly. Given timing, zoning requirements and other factors, we make no assurance that estimated potential development density amounts will become actual density to the extent we complete development of assets for which we have made such estimates.
Free Rent
‘‘Free rent’’ means the amount of base rent and tenant reimbursements that are abated according to the applicable lease agreement(s).
Funds from Operations ("FFO"), Core FFO and Funds Available for Distribution ("FAD")
FFO is a non-GAAP financial measure computed in accordance with the definition established by NAREIT in the NAREIT FFO White Paper - 2018 Restatement issued in 2018. NAREIT defines FFO as net income (computed in accordance with GAAP), excluding depreciation and amortization related to real estate, gains and losses from the sale of certain real estate assets, gains and losses from change in control and impairment write-downs of certain real estate assets and investments in entities when the impairment is directly attributable to decreases in the value of depreciable real estate held by the entity, including our share of such adjustments for unconsolidated real estate ventures.
"Core FFO" represents FFO adjusted to exclude items (net of tax) which we believe are not representative of ongoing operating results, such as transaction and other costs, gains (or losses) on extinguishment of debt, gain on the bargain purchase of a business, distributions in excess of our investment in unconsolidated real estate ventures, share-based compensation expense related to the Formation Transaction and special equity awards, lease liability adjustments, amortization of the management contracts intangible and the mark-to-market of derivative instruments.
"FAD" is a non-GAAP financial measure and represents FFO less recurring tenant improvements, leasing commissions and other capital expenditures, net deferred rent activity, third-party lease liability assumption payments, recurring share-based compensation expense, accretion of acquired below-market leases, net of amortization of acquired above-market leases, amortization of debt issuance costs and other non-cash income and charges. FAD is presented solely as a supplemental disclosure that management believes provides useful information as it relates to our ability to fund dividends.
We believe FFO, Core FFO and FAD are meaningful non‑GAAP financial measures useful in comparing our levered operating performance from period-to-period and as compared to similar real estate companies because these non‑GAAP measures exclude real estate depreciation and amortization expense and other non-comparable income and expenses, which implicitly assumes that the value of real estate diminishes predictably over time rather than fluctuating based on market conditions. FFO, Core FFO and FAD do not represent cash generated from operating activities and
|
| |
| DEFINITIONS | DECEMBER 31, 2019
|
are not necessarily indicative of cash available to fund cash requirements and should not be considered as an alternative to net income (loss) (computed in accordance with GAAP) as a performance measure or cash flow as a liquidity measure. FFO, Core FFO and FAD may not be comparable to similarly titled measures used by other companies. A reconciliation of net income to FFO, Core FFO and FAD is presented on pages 16-17.
Future Development
“Future development” refers to assets that are development opportunities on which we do not intend to commence construction within 18 months of December 31, 2019 where we (i) own land or control the land through a ground lease or (ii) are under a long-term conditional contract to purchase, or enter into a leasehold interest with respect to land.
Historical Cost, Estimated Incremental Investment, Estimated Total Investment and Estimated Total Project Cost
“Historical cost” is a non-GAAP measure which includes the total historical cost incurred by JBG SMITH with respect to the development of an asset, including any acquisition costs, hard costs, soft costs, tenant improvements (excluding free rent converted to tenant improvement allowances), leasing costs and other similar costs, but excluding any financing costs and ground rent expenses incurred as of December 31, 2019.
“Estimated incremental investment” means management’s estimate of the remaining cost to be incurred in connection with the development of an asset as of December 31, 2019, including all remaining acquisition costs, hard costs, soft costs, tenant improvements (excluding free rent converted to tenant improvement allowances), leasing costs and other similar costs to develop and stabilize the asset but excluding any financing costs and ground rent expenses.
“Estimated total investment” means, with respect to the development of an asset, the sum of the historical cost in such asset and the estimated incremental investment for such asset.
"Estimated total project cost" is estimated total investment excluding purchase price allocation adjustments recognized as a result of the Formation Transaction.
Actual incremental investment, actual total investment and actual total project cost may differ substantially from our estimates due to numerous factors, including unanticipated expenses, delays in the estimated start and/or completion date, changes in design and other contingencies.
In Service
‘‘In service’’ refers to commercial or multifamily assets that are at or above 90% leased or have been operating and collecting rent for more than 12 months as of December 31, 2019.
Metro-Served
“Metro-served” means locations, submarkets or assets that are within walking distance of a Metro station, defined as being within 0.5 miles of an existing or planned Metro station.
Monthly Rent Per Unit
For multifamily assets, represents multifamily rent for the month ended December 31, 2019 divided by occupied units; retail rent is excluded from this metric.
Near-Term Development
‘‘Near-term development’’ refers to assets that have substantially completed the entitlement process and on which we intend to commence construction within 18 months following December 31, 2019, subject to market conditions.
Net Operating Income ("NOI"), Adjusted Annualized NOI, Estimated Stabilized NOI and Projected NOI Yield
“NOI” is a non-GAAP financial measure management uses to assess a segment’s performance. The most directly comparable GAAP measure is net income attributable to common shareholders. We use NOI internally as a performance measure and believe NOI provides useful information to investors regarding our financial condition and results of operations because it reflects only property related revenue (which includes base rent, tenant reimbursements and other operating revenue, net of free rent and payments associated with assumed lease liabilities) less operating expenses and ground rent, if applicable. NOI also excludes deferred rent, related party management fees, interest expense, and certain other non-cash adjustments, including the accretion of acquired below-market leases and amortization of acquired above-market leases and below-market ground lease intangibles. Management uses NOI as a supplemental performance measure for our assets and believes it provides useful information to investors because it reflects only those revenue and expense items that are incurred at the asset level, excluding non-cash items. In addition, NOI is considered by many in the real estate industry to be a useful starting point for determining the value of a real estate asset or group of assets. However, because NOI excludes depreciation and amortization and captures neither the changes in the value of our assets that result from use or market conditions, nor the level of capital expenditures and capitalized leasing commissions necessary to maintain the operating performance of our assets, all of which have real economic effect and could materially impact the financial performance of our assets, the utility of NOI as a measure of the operating performance of our assets is limited. NOI presented by us may not be comparable to NOI reported by other REITs that define these measures differently. We believe that to facilitate a clear understanding of our operating results, NOI should be examined in conjunction with net income attributable to common shareholders as presented in our financial statements. NOI should not be considered as an alternative to net income attributable to common shareholders as an indication of our performance or to cash flows as a measure of liquidity or our ability to make distributions. Annualized NOI, for all assets except Crystal City Marriott, represents NOI for the three months ended December 31, 2019 multiplied by four. Due to seasonality in the hospitality business, annualized NOI for Crystal City Marriott represents the trailing 12-month NOI as of December 31, 2019. Management believes Annualized NOI provides useful information in understanding our financial performance over a 12-month period, however, investors and other users are cautioned against attributing undue certainty to our calculation of Annualized NOI. Actual NOI for any 12-month period will depend on a number of factors beyond our ability to control or predict, including general capital markets and economic conditions, any bankruptcy, insolvency, default or other failure to pay rent by one or more of our tenants and
|
| |
| DEFINITIONS | DECEMBER 31, 2019
|
the destruction of one or more of our assets due to terrorist attack, natural disaster or other casualty, among others. We do not undertake any obligation to update our calculation to reflect events or circumstances occurring after the date of this earnings release. There can be no assurance that the annualized NOI shown will reflect our actual results of operations over any 12-month period.
We also report adjusted annualized NOI which includes signed but not yet commenced leases and incremental revenue from recently delivered assets assuming stabilization. While we believe adjusted annualized NOI provides useful information regarding potential future NOI from our assets, it does not account for any decrease in NOI for lease terminations, defaults or other negative events that could affect NOI and therefore, should not be relied upon as indicative of future NOI.
This Investor Package also contains management’s estimate of stabilized NOI and projections of NOI yield for under construction and near-term development assets, which are based on management’s estimates of property-related revenue and operating expenses for each asset. These estimates are inherently uncertain and represent management’s plans, expectations and beliefs and are subject to numerous assumptions, risks and uncertainties. The property-related revenues and operating expenses for our assets may differ materially from the estimates included in this Investor Package. Management’s projections of NOI yield are not projections of our overall financial performance or cash flow, and there can be no assurance that the projected NOI yield set forth in this Investor Package will be achieved.
“Projected NOI yield” means our estimated stabilized NOI reported as a percentage of (i) estimated total project costs, (ii) estimated total investment and (iii) estimated incremental investment. Actual initial full year stabilized NOI yield may vary from the projected NOI yield based on the actual incremental investment to complete the asset and its actual initial full year stabilized NOI, and there can be no assurance that we will achieve the projected NOI yields described in this Investor Package.
The Company does not provide reconciliations for non-GAAP estimates on a future basis, including adjusted annualized NOI and estimated stabilized NOI because it is unable to provide a meaningful or accurate calculation or estimate of reconciling items and the information is not available without unreasonable effort. This inability is due to the inherent difficulty of forecasting the timing and/or amounts of various items that would impact net income. Additionally, no reconciliation of projected NOI yield to the most directly comparable GAAP measure is included in this Investor Package because we are unable to quantify certain amounts that would be required to be included in the comparable GAAP financial measures without unreasonable efforts because such data is not currently available or cannot be currently estimated with confidence. Accordingly, we believe such reconciliations would imply a degree of precision that would be confusing or misleading to investors.
Percent Leased
‘‘Percent leased’’ is based on leases signed as of December 31, 2019, and is calculated as total rentable square feet less rentable square feet available for lease divided by total rentable square feet expressed as a percentage. Out-of-service square feet are excluded from this calculation.
Percent Pre-Leased
‘‘Percent pre-leased’’ is based on leases signed as of December 31, 2019, and is calculated as the estimated rentable square feet leased divided by estimated total rentable square feet expressed as a percentage.
Percent Occupied
‘‘Percent occupied’’ is based on occupied rentable square feet/units as of December 31, 2019, and is calculated as (i) for office and retail space, total rentable square feet less unoccupied square feet divided by total rentable square feet, (ii) for multifamily space, total units less unoccupied units divided by total units, expressed as a percentage. Out-of-service square feet are excluded from this calculation.
Pro Rata Adjusted General and Administrative (“G&A”) Expenses
"Pro Rata Adjusted G&A expenses", a non-GAAP financial measure, represents G&A expenses adjusted for share-based compensation expense related to the Formation Transaction and special equity awards and the G&A expenses of our third-party asset management and real estate services business that are directly reimbursed. We believe that adjusting such items not considered part of our comparable operations provides a meaningful measure to assess our G&A expenses as compared to similar real estate companies and in general.
Recently Delivered
“Recently delivered” refers to commercial and multifamily assets that are below 90% leased and have been delivered within the 12 months ended December 31, 2019.
Same Store and Non-Same Store
“Same store” refers to the pool of assets that were in service for the entirety of both periods being compared, except for assets for which significant redevelopment, renovation, or repositioning occurred during either of the periods being compared.
“Non-same store” refers to all operating assets excluded from the same store pool.
Second Generation Lease
“Second generation lease” is a lease on space that had been vacant for less than nine months.
|
| |
| DEFINITIONS | DECEMBER 31, 2019
|
Signed But Not Yet Commenced Leases
“Signed but not yet commenced leases” means leases for assets in JBG SMITH’s portfolio that, as of December 31, 2019, have been executed but for which no rental payments had yet been charged to the tenant.
Square Feet
‘‘Square feet’’ or ‘‘SF’’ refers to the area that can be rented to tenants, defined as (i) for commercial assets, rentable square footage defined in the current lease and for vacant space the rentable square footage defined in the previous lease for that space, (ii) for multifamily assets, management’s estimate of approximate rentable square feet, (iii) for assets under construction and near-term development assets, management’s estimate of approximate rentable square feet based on current design plans as of December 31, 2019, and (iv) for future development assets, management’s estimate of developable gross square feet based on its current business plans with respect to real estate owned or controlled as of December 31, 2019.
Transaction and Other Costs
Transaction and other costs include amounts incurred for transition services provided by our former parent, integration costs, severance costs, costs incurred in connection with recapitalization transactions and disposition costs and costs related to other completed, potential and pursued transactions.
Under Construction
‘‘Under construction’’ refers to assets that were under construction during the three months ended December 31, 2019.
|
| |
APPENDIX - EBITDA, EBITDAre AND ADJUSTED EBITDA (NON-GAAP)
| DECEMBER 31, 2019 (Unaudited)
|
|
| | | | | | | | | | | | | | | | |
| | | Three Months Ended |
| dollars in thousands | | Q4 2019 | Q3 2019 | Q2 2019 | Q1 2019 | Q4 2018 |
| | | | | | | |
| EBITDA, EBITDAre and Adjusted EBITDA | | | | | | |
| Net income (loss) |
| $ | 38,692 |
| $ | 10,532 |
| $ | (3,328 | ) | $ | 28,248 |
| $ | 994 |
|
| Depreciation and amortization expense | | 50,004 |
| 46,862 |
| 45,995 |
| 48,719 |
| 67,556 |
|
Interest expense (1) | | 11,831 |
| 10,583 |
| 13,107 |
| 17,174 |
| 18,184 |
|
| Income tax expense (benefit) | | (613 | ) | 432 |
| 51 |
| (1,172 | ) | 698 |
|
| Unconsolidated real estate ventures allocated share of above adjustments | | 10,050 |
| 8,664 |
| 10,357 |
| 7,806 |
| 10,253 |
|
| Net income attributable to noncontrolling interests in consolidated real estate ventures | | (2 | ) | — |
| (4 | ) | (1 | ) | (182 | ) |
EBITDA (2) | | $ | 109,962 |
| $ | 77,073 |
| $ | 66,178 |
| $ | 100,774 |
| $ | 97,503 |
|
| Gain on sale of real estate | | (57,870 | ) | (8,088 | ) | — |
| (39,033 | ) | (6,394 | ) |
| Gain on sale from unconsolidated real estate ventures | | — |
| — |
| (335 | ) | — |
| (20,554 | ) |
EBITDAre (2) | | $ | 52,092 |
| $ | 68,985 |
| $ | 65,843 |
| $ | 61,741 |
| $ | 70,555 |
|
Transaction and other costs (3) | | 13,307 |
| 2,059 |
| 2,974 |
| 4,895 |
| 15,572 |
|
| Loss on extinguishment of debt, net of noncontrolling interests | | 3,916 |
| — |
| 1,889 |
| — |
| 617 |
|
| Share-based compensation related to Formation Transaction and special equity awards | | 11,959 |
| 9,549 |
| 9,523 |
| 11,131 |
| 9,118 |
|
Losses and distributions in excess of our investment in unconsolidated real estate venture (4) | | (518 | ) | (165 | ) | (232 | ) | (6,441 | ) | (7,374 | ) |
| Unconsolidated real estate ventures allocated share of above adjustments | | (1,345 | ) | — |
| — |
| — |
| 1,542 |
|
| Lease liability adjustments | | (1,829 | ) | 1,991 |
| — |
| — |
| (7,422 | ) |
Adjusted EBITDA (2) | | $ | 77,582 |
| $ | 82,419 |
| $ | 79,997 |
| $ | 71,326 |
| $ | 82,608 |
|
| | | | | | | |
Net Debt to Annualized Adjusted EBITDA (5) (6) | | 5.8x |
| 5.3x |
| 5.2x |
| 7.1x |
| 6.5x |
|
| | | | | | | |
| | | December 31, 2019 | September 30, 2019 | June 30, 2019 | March 31, 2019 | December 31, 2018 |
| Net Debt (at JBG SMITH Share) | | | | | | |
Consolidated indebtedness (7) | | $ | 1,620,001 |
| $ | 1,652,303 |
| $ | 1,653,538 |
| $ | 2,128,803 |
| $ | 2,130,704 |
|
Unconsolidated indebtedness (7) | | 329,056 |
| 322,692 |
| 312,686 |
| 303,397 |
| 298,588 |
|
| Total consolidated and unconsolidated indebtedness | 1,949,057 |
| 1,974,995 |
| 1,966,224 |
| 2,432,200 |
| 2,429,292 |
|
| Less: cash and cash equivalents | | 136,200 |
| 237,288 |
| 289,554 |
| 405,646 |
| 273,611 |
|
| Net Debt (at JBG SMITH Share) | | $ | 1,812,857 |
| $ | 1,737,707 |
| $ | 1,676,670 |
| $ | 2,026,554 |
| $ | 2,155,681 |
|
____________________
Note: All EBITDA measures as shown above are attributable to operating partnership common units.
| |
| (1) | Interest expense includes the amortization of deferred financing costs and the ineffective portion of any interest rate swaps or caps, net of capitalized interest. |
| |
| (2) | Due to our adoption of the new accounting standard for leases, beginning in 2019, we no longer capitalize internal leasing costs and expense these costs as incurred (such costs were $2.2 million for Q4 2018). |
| |
| (3) | Includes fees and expenses incurred for the relocation of our corporate headquarters, demolition costs, fees and expenses incurred in connection with the Formation Transaction (including amounts incurred for transition services provided by our former parent, integration costs and severance costs), pursuit costs related to other completed, potential and pursued transactions, as well as other expenses. |
| |
| (4) | As of June 30, 2018, we suspended the equity method of accounting for our investment in the real estate venture that owns 1101 17th Street as our investment had been reduced to zero and we did not have an obligation to provide further financial support to the venture. All subsequent distributions from the venture have been recognized as income, which will continue until our share of unrecorded earnings and contributions exceed the cumulative excess distributions previously recognized. |
| |
| (5) | In Q2 2019, we closed an underwritten public offering of 11.5 million common shares that generated net proceeds of $472.8 million. |
| |
| (6) | Pro forma Net Debt to Annualized Adjusted EBITDA would have been 5.3x for Q4 2019, which includes the $155.0 million of net proceeds from the sale of Metropolitan Park in January 2020. |
| |
| (7) | Net of premium/discount and deferred financing costs. |
|
| |
APPENDIX - FFO, CORE FFO AND FAD (NON-GAAP)
| DECEMBER 31, 2019 (Unaudited)
|
|
| | | | | | | | | | | | | | | |
| | Three Months Ended |
| in thousands, except per share data | Q4 2019 | Q3 2019 | Q2 2019 | Q1 2019 | Q4 2018 |
| | | | | | |
| FFO and Core FFO | | | | | |
| Net income (loss) attributable to common shareholders | $ | 34,390 |
| $ | 9,360 |
| $ | (3,040 | ) | $ | 24,861 |
| $ | 710 |
|
| Net income (loss) attributable to redeemable noncontrolling interests | 4,302 |
| 1,172 |
| (288 | ) | 3,387 |
| 178 |
|
| Net income attributable to noncontrolling interests | — |
| — |
| — |
| — |
| 106 |
|
| Net income (loss) | 38,692 |
| 10,532 |
| (3,328 | ) | 28,248 |
| 994 |
|
| Gain on sale of real estate | (57,870 | ) | (8,088 | ) | — |
| (39,033 | ) | (6,394 | ) |
| Gain on sale from unconsolidated real estate ventures | — |
| — |
| (335 | ) | — |
| (20,554 | ) |
| Real estate depreciation and amortization | 47,001 |
| 44,164 |
| 43,308 |
| 46,035 |
| 64,891 |
|
| Pro rata share of real estate depreciation and amortization from unconsolidated real estate ventures | 6,407 |
| 4,713 |
| 4,804 |
| 4,653 |
| 6,079 |
|
| Net income attributable to noncontrolling interests in consolidated real estate ventures | (2 | ) | — |
| (4 | ) | (1 | ) | (182 | ) |
FFO Attributable to Operating Partnership Common Units (1) | $ | 34,228 |
| $ | 51,321 |
| $ | 44,445 |
| $ | 39,902 |
| $ | 44,834 |
|
| FFO attributable to redeemable noncontrolling interests | (3,804 | ) | (5,705 | ) | (5,014 | ) | (4,783 | ) | (5,741 | ) |
FFO attributable to common shareholders (1) | $ | 30,424 |
| $ | 45,616 |
| $ | 39,431 |
| $ | 35,119 |
| $ | 39,093 |
|
| | | | | | |
| FFO attributable to the operating partnership common units | $ | 34,228 |
| $ | 51,321 |
| $ | 44,445 |
| $ | 39,902 |
| $ | 44,834 |
|
Transaction and other costs, net of tax (2) | 11,725 |
| 1,941 |
| 2,847 |
| 4,626 |
| 14,509 |
|
| (Gain) loss from mark-to-market on derivative instruments | — |
| 2 |
| 524 |
| (476 | ) | (542 | ) |
| Loss on extinguishment of debt, net of noncontrolling interests | 3,916 |
| — |
| 1,889 |
| — |
| 2,159 |
|
Losses and distributions in excess of our investment in unconsolidated real estate venture (3) | (518 | ) | (165 | ) | (232 | ) | (6,441 | ) | (7,374 | ) |
| Share-based compensation related to Formation Transaction and special equity awards | 11,959 |
| 9,549 |
| 9,523 |
| 11,131 |
| 9,118 |
|
| Lease liability adjustments | (1,829 | ) | 1,991 |
| — |
| — |
| (7,422 | ) |
| Amortization of management contracts intangible, net of tax | 1,288 |
| 1,287 |
| 1,288 |
| 1,287 |
| 1,287 |
|
| Unconsolidated real estate ventures allocated share of above adjustments | (1,407 | ) | 127 |
| 1,153 |
| 227 |
| 379 |
|
Core FFO Attributable to Operating Partnership Common Units (1) | $ | 59,362 |
| $ | 66,053 |
| $ | 61,437 |
| $ | 50,256 |
| $ | 56,948 |
|
| Core FFO attributable to redeemable noncontrolling interests | (6,598 | ) | (7,342 | ) | (6,931 | ) | (6,024 | ) | (7,292 | ) |
Core FFO attributable to common shareholders (1) | $ | 52,764 |
| $ | 58,711 |
| $ | 54,506 |
| $ | 44,232 |
| $ | 49,656 |
|
| FFO per diluted common share | $ | 0.23 |
| $ | 0.34 |
| $ | 0.30 |
| $ | 0.28 |
| $ | 0.32 |
|
| Core FFO per diluted common share | $ | 0.39 |
| $ | 0.44 |
| $ | 0.41 |
| $ | 0.36 |
| $ | 0.41 |
|
| Weighted average diluted shares | 134,129 |
| 134,127 |
| 131,754 |
| 123,423 |
| 120,917 |
|
See footnotes on page 56.
|
| |
APPENDIX - FFO, CORE FFO AND FAD (NON-GAAP)
| DECEMBER 31, 2019 (Unaudited)
|
|
| | | | | | | | | | | | | | | |
| | Three Months Ended |
| in thousands, except per share data | Q4 2019 | Q3 2019 | Q2 2019 | Q1 2019 | Q4 2018 |
| | | | | | |
| FAD | | | | | |
| Core FFO attributable to the operating partnership common units | $ | 59,362 |
| $ | 66,053 |
| $ | 61,437 |
| $ | 50,256 |
| $ | 56,948 |
|
| Recurring capital expenditures and second generation tenant improvements and leasing commissions | (27,689 | ) | (14,872 | ) | (20,076 | ) | (22,297 | ) | (35,836 | ) |
Straight-line and other rent adjustments (4) | (8,464 | ) | (10,348 | ) | (8,739 | ) | (6,808 | ) | (6,692 | ) |
| Third-party lease liability assumption payments | (1,450 | ) | (1,413 | ) | (1,183 | ) | (1,136 | ) | (1,130 | ) |
| Share-based compensation expense | 5,512 |
| 6,129 |
| 5,694 |
| 5,330 |
| 4,666 |
|
| Amortization of debt issuance costs | 671 |
| 701 |
| 875 |
| 970 |
| 1,140 |
|
| Unconsolidated real estate ventures allocated share of above adjustments | (386 | ) | (943 | ) | (1,404 | ) | (87 | ) | 747 |
|
| Non-real estate depreciation and amortization | 1,234 |
| 925 |
| 916 |
| 912 |
| 893 |
|
FAD available to the Operating Partnership Common Units (A) (1) | $ | 28,790 |
| $ | 46,232 |
| $ | 37,520 |
| $ | 27,140 |
| $ | 20,736 |
|
Distributions to common shareholders and unitholders (5) (B) | $ | 34,011 |
| $ | 34,006 |
| $ | 34,006 |
| $ | 31,284 |
| $ | 31,284 |
|
FAD Payout Ratio (B÷A) (6) | 118.1 | % | 73.6 | % | 90.6 | % | 115.3 | % | 150.9 | % |
|
| | | | | | | | | | | | | | | |
| Capital Expenditures | | | | | |
| Maintenance and recurring capital expenditures | $ | 11,748 |
| $ | 7,000 |
| $ | 7,252 |
| $ | 5,495 |
| $ | 14,445 |
|
| Share of maintenance and recurring capital expenditures from unconsolidated real estate ventures | 561 |
| 439 |
| 252 |
| 88 |
| 978 |
|
| Second generation tenant improvements and leasing commissions | 13,426 |
| 6,713 |
| 12,357 |
| 16,155 |
| 19,211 |
|
| Share of second generation tenant improvements and leasing commissions from unconsolidated real estate ventures | 1,954 |
| 720 |
| 215 |
| 559 |
| 1,202 |
|
| Recurring capital expenditures and second generation tenant improvements and leasing commissions | 27,689 |
| 14,872 |
| 20,076 |
| 22,297 |
| 35,836 |
|
| First generation tenant improvements and leasing commissions | 20,057 |
| 6,501 |
| 18,996 |
| 6,197 |
| 8,215 |
|
| Share of first generation tenant improvements and leasing commissions from unconsolidated real estate ventures | 2,672 |
| 507 |
| 419 |
| 233 |
| 17 |
|
| Non-recurring capital expenditures | 16,410 |
| 8,365 |
| 5,470 |
| 6,722 |
| 15,375 |
|
| Share of non-recurring capital expenditures from unconsolidated joint ventures | 488 |
| 84 |
| 30 |
| — |
| 112 |
|
| Non-recurring capital expenditures | 39,627 |
| 15,457 |
| 24,915 |
| 13,152 |
| 23,719 |
|
| Total JBG SMITH Share of Capital Expenditures | $ | 67,316 |
| $ | 30,329 |
| $ | 44,991 |
| $ | 35,449 |
| $ | 59,555 |
|
_______________
| |
| (1) | Due to our adoption of the new accounting standard for leases, beginning in 2019, we no longer capitalize internal leasing costs and expense these costs as incurred (such costs were $2.2 million for Q4 2018). |
| |
| (2) | Includes fees and expenses incurred for the relocation of our corporate headquarters, demolition costs, fees and expenses incurred in connection with the Formation Transaction (including amounts incurred for transition services provided by our former parent, integration costs and severance costs), pursuit costs related to other completed, potential and pursued transactions, as well as other expenses. |
| |
| (3) | As of June 30, 2018, we suspended the equity method of accounting for our investment in the real estate venture that owns 1101 17th Street as our investment had been reduced to zero and we did not have an obligation to provide further financial support to the venture. All subsequent distributions from the venture have been recognized as income, which will continue until our share of unrecorded earnings and contributions exceed the cumulative excess distributions previously recognized. |
| |
| (4) | Includes straight-line rent, above/below market lease amortization and lease incentive amortization. |
| |
| (5) | The distribution for Q1 2019 excludes a special dividend of $0.10 per common share that was paid in January 2019. |
| |
| (6) | The FAD payout ratio on a quarterly basis is not necessarily indicative of an amount for the full year due to fluctuation in timing of capital expenditures, the commencement of new leases and the seasonality of our operations. Q4 2019 and Q4 2018 were impacted by increases in recurring capital expenditures, which is consistent with historical seasonality trends. |
|
| |
APPENDIX - NOI RECONCILIATIONS (NON-GAAP)
| DECEMBER 31, 2019 (Unaudited)
|
|
| | | | | | | | | | | | | | | |
| dollars in thousands | Three Months Ended |
| | Q4 2019 | Q3 2019 | Q2 2019 | Q1 2019 | Q4 2018 |
| Net income (loss) attributable to common shareholders | $ | 34,390 |
| $ | 9,360 |
| $ | (3,040 | ) | $ | 24,861 |
| $ | 710 |
|
| Add: | | | | | |
| Depreciation and amortization expense | 50,004 |
| 46,862 |
| 45,995 |
| 48,719 |
| 67,556 |
|
| General and administrative expense: | | | | | |
| Corporate and other | 11,934 |
| 11,015 |
| 11,559 |
| 12,314 |
| 8,512 |
|
| Third-party real estate services | 26,910 |
| 29,809 |
| 28,710 |
| 28,066 |
| 25,274 |
|
Share-based compensation related to Formation Transaction and
special equity awards
| 11,959 |
| 9,549 |
| 9,523 |
| 11,131 |
| 9,118 |
|
| Transaction and other costs | 13,307 |
| 2,059 |
| 2,974 |
| 4,895 |
| 15,572 |
|
| Interest expense | 11,831 |
| 10,583 |
| 13,107 |
| 17,174 |
| 18,184 |
|
| Loss on extinguishment of debt | 3,916 |
| — |
| 1,889 |
| — |
| 617 |
|
| Income tax expense (benefit) | (613 | ) | 432 |
| 51 |
| (1,172 | ) | 698 |
|
| Net income (loss) attributable to redeemable noncontrolling interests | 4,302 |
| 1,172 |
| (288 | ) | 3,387 |
| 178 |
|
| Less: | | | | | |
Third-party real estate services, including reimbursements
| 29,121 |
| 34,587 |
| 29,487 |
| 27,691 |
| 26,421 |
|
Other income (1) | 1,686 |
| 2,196 |
| 2,114 |
| 1,640 |
| 1,454 |
|
| Income (loss) from unconsolidated real estate ventures, net | (2,042 | ) | (1,144 | ) | (1,810 | ) | 3,601 |
| 23,991 |
|
| Interest and other income (loss), net | 3,022 |
| (640 | ) | 2,052 |
| 951 |
| 9,991 |
|
| Gain on sale of real estate | 57,870 |
| 8,088 |
| — |
| 39,033 |
| 6,394 |
|
| Net loss attributable to noncontrolling interests | — |
| — |
| — |
| — |
| (106 | ) |
Consolidated NOI (2) | 78,283 |
| 77,754 |
| 78,637 |
| 76,459 |
| 78,274 |
|
| NOI attributable to unconsolidated real estate ventures at our share | 6,052 |
| 5,500 |
| 5,091 |
| 5,386 |
| 8,847 |
|
Non-cash rent adjustments (3) | (8,465 | ) | (10,348 | ) | (8,738 | ) | (6,808 | ) | (6,691 | ) |
Other adjustments (4) | 3,913 |
| 3,181 |
| 3,758 |
| 3,353 |
| 3,915 |
|
| Total adjustments | 1,500 |
| (1,667 | ) | 111 |
| 1,931 |
| 6,071 |
|
NOI (3) | $ | 79,783 |
| $ | 76,087 |
| $ | 78,748 |
| $ | 78,390 |
| $ | 84,345 |
|
Less: out-of-service NOI loss (5) | (2,817 | ) | (2,189 | ) | $ | (1,556 | ) | $ | (1,271 | ) | $ | (1,195 | ) |
Operating portfolio NOI (2) | $ | 82,600 |
| $ | 78,276 |
| $ | 80,304 |
| $ | 79,661 |
| $ | 85,540 |
|
Non-same store NOI (6) | 7,653 |
| 6,286 |
| 6,311 |
| 6,088 |
| 8,742 |
|
Same store NOI (7) | $ | 74,947 |
| $ | 71,990 |
| $ | 73,993 |
| $ | 73,573 |
| $ | 76,798 |
|
___________________
Note: NOI, non-same store NOI and same store NOI are presented as originally reported in the respective quarter.
| |
| (1) | Excludes operating parking revenue of $6.5 million, $6.3 million, $6.7 million and $6.5 million in Q4 2019, Q3 2019, Q2 2019 and Q1 2019. |
| |
| (2) | Due to our adoption of the new accounting standard for leases, beginning in 2019, we no longer capitalize internal leasing costs and expense these costs as incurred (such costs were $2.2 million for Q4 2018). |
| |
| (3) | Adjustment to exclude straight-line rent, above/below market lease amortization and lease incentive amortization. |
| |
| (4) | Adjustment to include other revenue and payments associated with assumed lease liabilities related to operating properties and to exclude commercial lease termination revenue and allocated corporate general and administrative expenses to operating properties. |
| |
| (5) | Includes the results for our Under Construction assets and Future Development Pipeline. |
| |
| (6) | Includes the results for properties that were not in service for the entirety of both periods being compared and properties for which significant redevelopment, renovation or repositioning occurred during either of the periods being compared. |
| |
| (7) | Includes the results of the properties that are in service for the entirety of both periods being compared except for properties for which significant redevelopment, renovation or repositioning occurred during either of the periods being compared. |
|
| |
APPENDIX - NOI RECONCILIATIONS (NON-GAAP)
| DECEMBER 31, 2019 (Unaudited)
|