UNITED STATES
SECURITIES AND EXCHANGE COMMISSION
Washington, D.C. 20549
FORM N-CSR
CERTIFIED SHAREHOLDER REPORT OF REGISTERED MANAGEMENT INVESTMENT COMPANIES
Investment Company Act file number 811-23214
GraniteShares ETF Trust
(Exact name of registrant as specified in charter)
222 Broadway, 21st Floor
New York, New York 10038
(Address of principal executive offices) (Zip code)
William Rhind
GraniteShares ETF Trust
222 Broadway, 21st Floor
New York, New York 10038
(Name and address of agent for service)
Copy to:
Andrew Davalla, Esq.
Thompson Hine LLP
41 South High Street – Suite 1700
Columbus, OH 43215-6101
Registrant’s telephone number, including area code: 1-800-422-3554
Date of fiscal year end: June 30
Date of reporting period: July 1, 2023 - June 30, 2024
Form N-CSR is to be used by management investment companies to file reports with the Commission not later than 10 days after the transmission to stockholders of any report that is required to be transmitted to stockholders under Rule 30e-1 under the Investment Company Act of 1940 (17 CFR 270.30e-1). The Commission may use the information provided on Form N-CSR in its regulatory, disclosure review, inspection, and policymaking roles.
A registrant is required to disclose the information specified by Form N-CSR, and the Commission will make this information public. A registrant is not required to respond to the collection of information contained in Form N-CSR unless the Form displays a currently valid Office of Management and Budget (“OMB”) control number. Please direct comments concerning the accuracy of the information collection burden estimate and any suggestions for reducing the burden to Secretary, Securities and Exchange Commission, 450 Fifth Street, NW, Washington, DC 20549-0609. The OMB has reviewed this collection of information under the clearance requirements of 44 U.S.C. § 3507.
Item 1. Reports to Stockholders.
The Report to Shareholders is attached herewith.
(a)
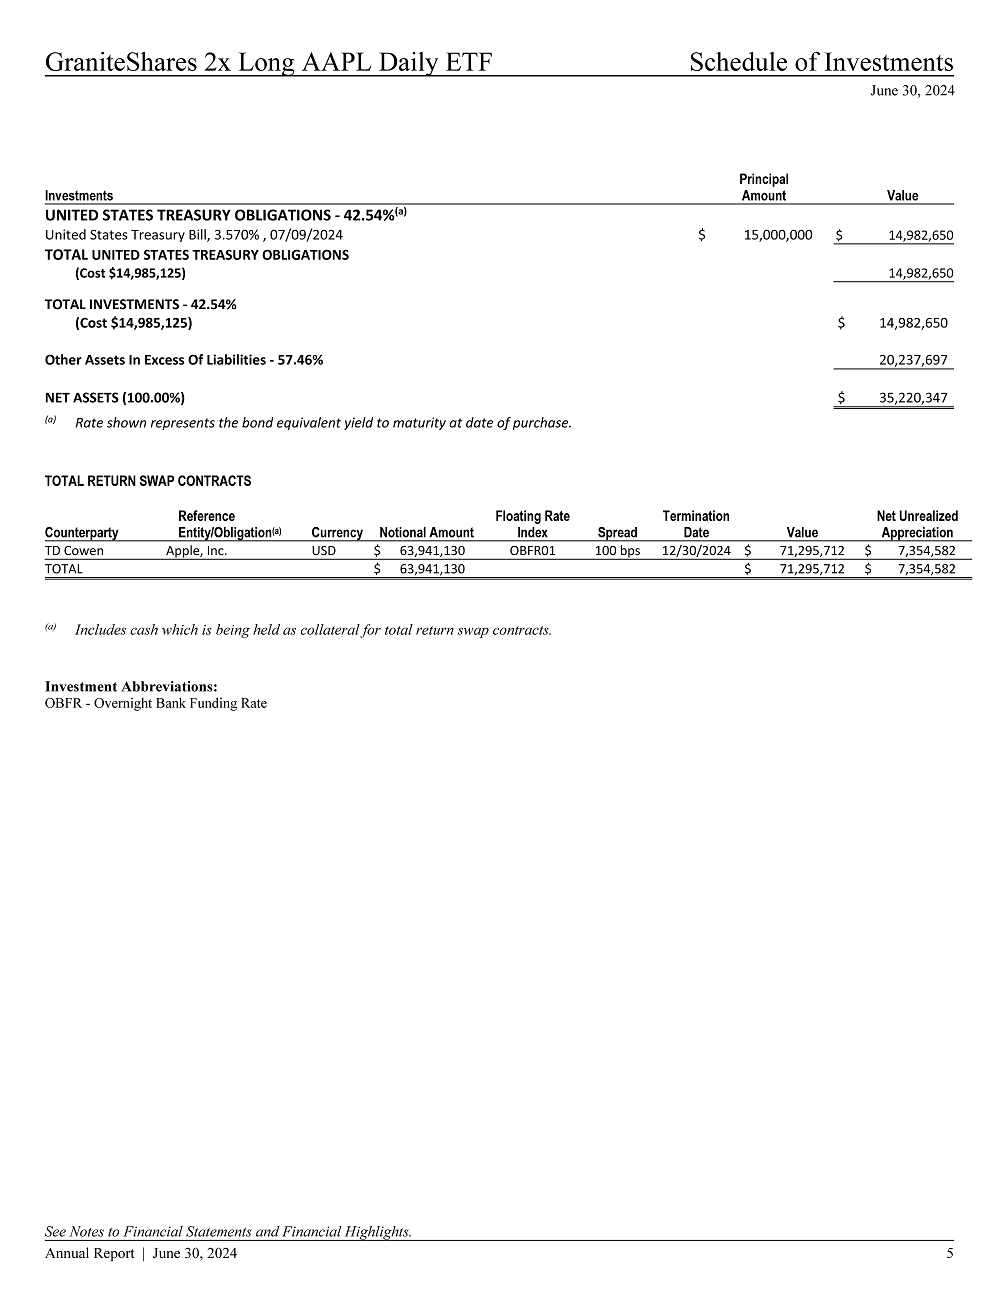
| GraniteShares 2x Long AAPL Daily ETF |  |
| NASDAQ: AAPB | Annual Shareholder Report – June 30, 2024 |
| | |
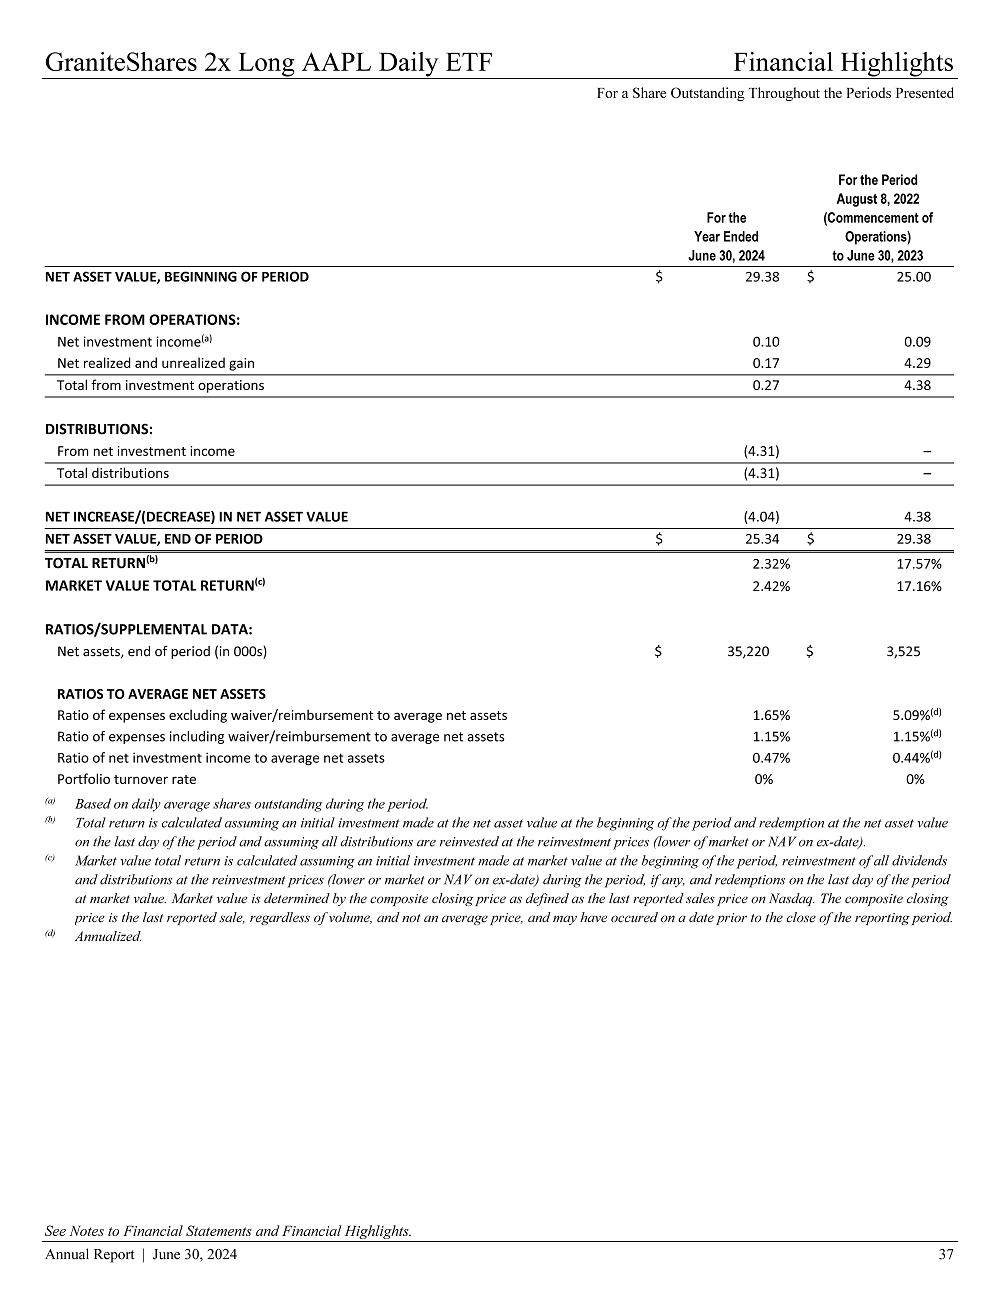
Fund Overview The Fund seeks daily investment results, before fees and expenses, of 2 times (200%) the daily percentage change of the common stock of Apple Inc. (NASDAQ: AAPL). You can find additional information about the Fund at www.graniteshares.com You can request this information by calling at (844) 476 8747 or send email to info@graniteshares.com |
How did the fund perform last fiscal year During the 1-year period starting June 30, 2023, to June 30, 2024, the Fund had a 2.32% return. |
| |
| Over the same period the common stock of Apple Inc. (AAPL) had a return of 9.16% and the S&P 500 Index (the Benchmark) a return of 24.56% |
| What were the fund’s costs for the year | | | |
| | | | |
| (based on hypothetical $10,000 investment) | | | |
| | | | |
Cost of a $10,000
Investment | | Cost paid as % of a
$10,000 investment | |
| | | | |
| $115 | | 1.15% | |
How did the fund perform since inception The $10,000 chart reflects a hypothetical $10,000 investment in the Fund. The chart uses total return NAV performance and assumes reinvestment of dividend and capital gains. The NAV performance includes all fund expenses. 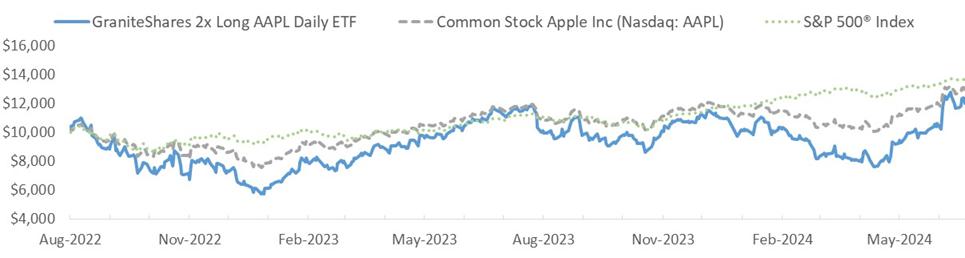
|
| |
Average Annual Total Returns (as of June 30, 2024) | |
| | | | | | |
| | | 1 Year | | Since Inception | |
| | | | | (Aug 08, 2022) | |
| NAV | | | 2.32 | % | | | 10.23 | % |
| Price | | | 2.42 | % | | | 10.16 | % |
| S&P 500 Total Return Index | | | 24.56 | % | | | 17.65 | % |
Fund Statistics (as of June 30, 2024) |
| | | |
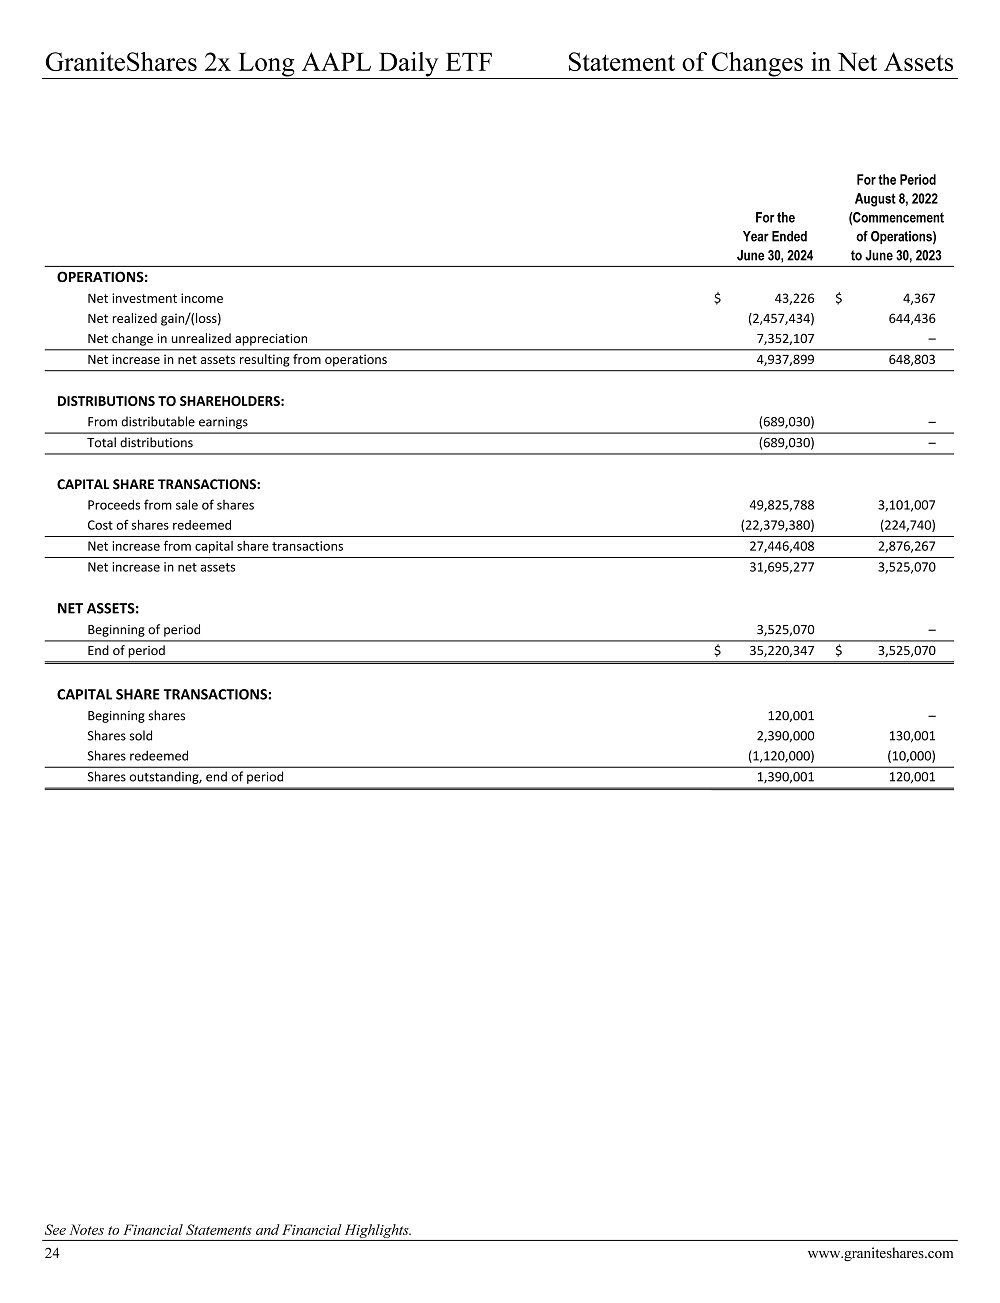
| Total Net Assets | | $ | 35,220,347 | |
| Advisory Fees Paid | | $ | 91,530 | |
| Portfolio Turnover | | | 0 | % |
What does the Fund invest in? The Fund enters into one or more swap agreements with major financial institutions for a specified period whereby the Fund and the financial institution will agree to exchange the return (or differentials in rates of return) earned or realized on the common stock of Apple Inc. The Fund may invest in (1) U.S. Government securities, such as bills, notes and bonds issued by the U.S. Treasury; (2) money market funds; (3) short term bond ETFs and/or (4) corporate debt securities, such as commercial paper and other short-term unsecured promissory notes issued by businesses that are rated investment grade or of comparable quality as collateral for the Fund’s swap agreements |
| | | | | | |
| Top 10 Holdings | | | | Sector Breakdown | |
| | | | | | |
| AAPL Equity Swap | 70.56% | | | Total Return Swap | 70.56% |
| United States Treasury Bills | 14.83% | | | U.S. Government | 14.83% |
| Cash | 14.61% | | | Cash | 14.61% |
| Top 10 Holdings | 100.00% | | | | |
| | | | | | |
Material Fund Changes There were no material fund changes during the year. Changes in or Disagreements with Accountants There were no disagreements reported by the accountants. Householding If you wish to receive a copy of this document at a new address, contact (844) 476 8747 or send an email to info@graniteshares.com |
| | |
GraniteShares 2x Long AAPL Daily ETF |  |
| NASDAQ: AAPB | Annual Shareholder Report – June 30, 2024 |
| | |
| | |
| | |
| | |
| | |
Past performance does not guarantee futures results. Call (844) 476 8747 or send an email to info@graniteshares.com for current performance questions. If you wish to view additional information about the Fund, including but not limited to the financial statements and holdings, please visit www.graniteshares.com Phone: (844) 476 8747 – email: info@graniteshares.com |
| GraniteShares 2x Long AMD Daily ETF |  |
| NASDAQ: AMDL | Annual Shareholder Report – June 30, 2024 |
| | |
Fund Overview The Fund seeks daily investment results, before fees and expenses, of 2 times (200%) the daily percentage change of the common stock of Advanced Micro Devices Inc. (NASDAQ: AMD). You can find additional information about the Fund at www.graniteshares.com You can request this information by calling at (844) 476 8747 or send email to info@graniteshares.com |
How did the fund perform since inception Since inception on March 18, 2024, to June 30, 2024, the Fund had a -34.24% return. |
| |
| Over the same period the common stock of Advanced Micro Devices Inc. (AMD) had a return of -14.92% and the S&P 500 Index (the Benchmark) a return of 7.12% |
| What were the fund’s costs for the year |
| |
| (based on hypothetical $10,000 investment) |
Cost of a $10,000
Investment | | Cost paid as % of a
$10,000 investment | |
| | | | |
| $115 | | 1.15% | |
How did the fund perform since inception The $10,000 chart reflects a hypothetical $10,000 investment in the Fund. The chart uses total return NAV performance and assumes reinvestment of dividend and capital gains. The NAV performance includes all fund expenses. 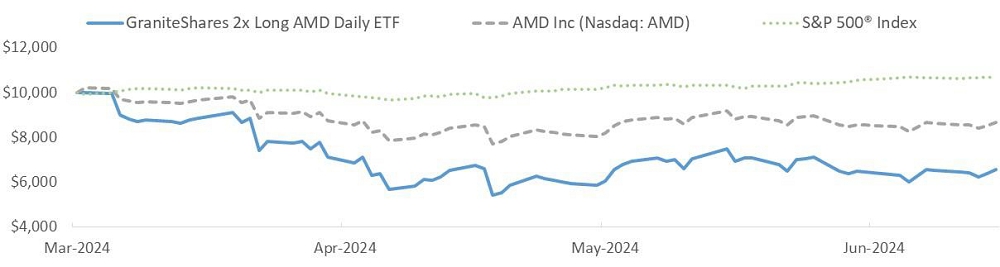
|
| |
Average Annual Total Returns (Returns for periods of less than one year are not annualized) (as of June 30, 2024) |
| | | | |
| | | Since Inception | |
| | | (March 18, 2024) | |
| NAV | | | (34.24 | )% |
| Price | | | (34.32 | )% |
| S&P 500 Total Return Index | | | 7.12 | % |
Fund Statistics (as of June 30, 2024) |
| | | |
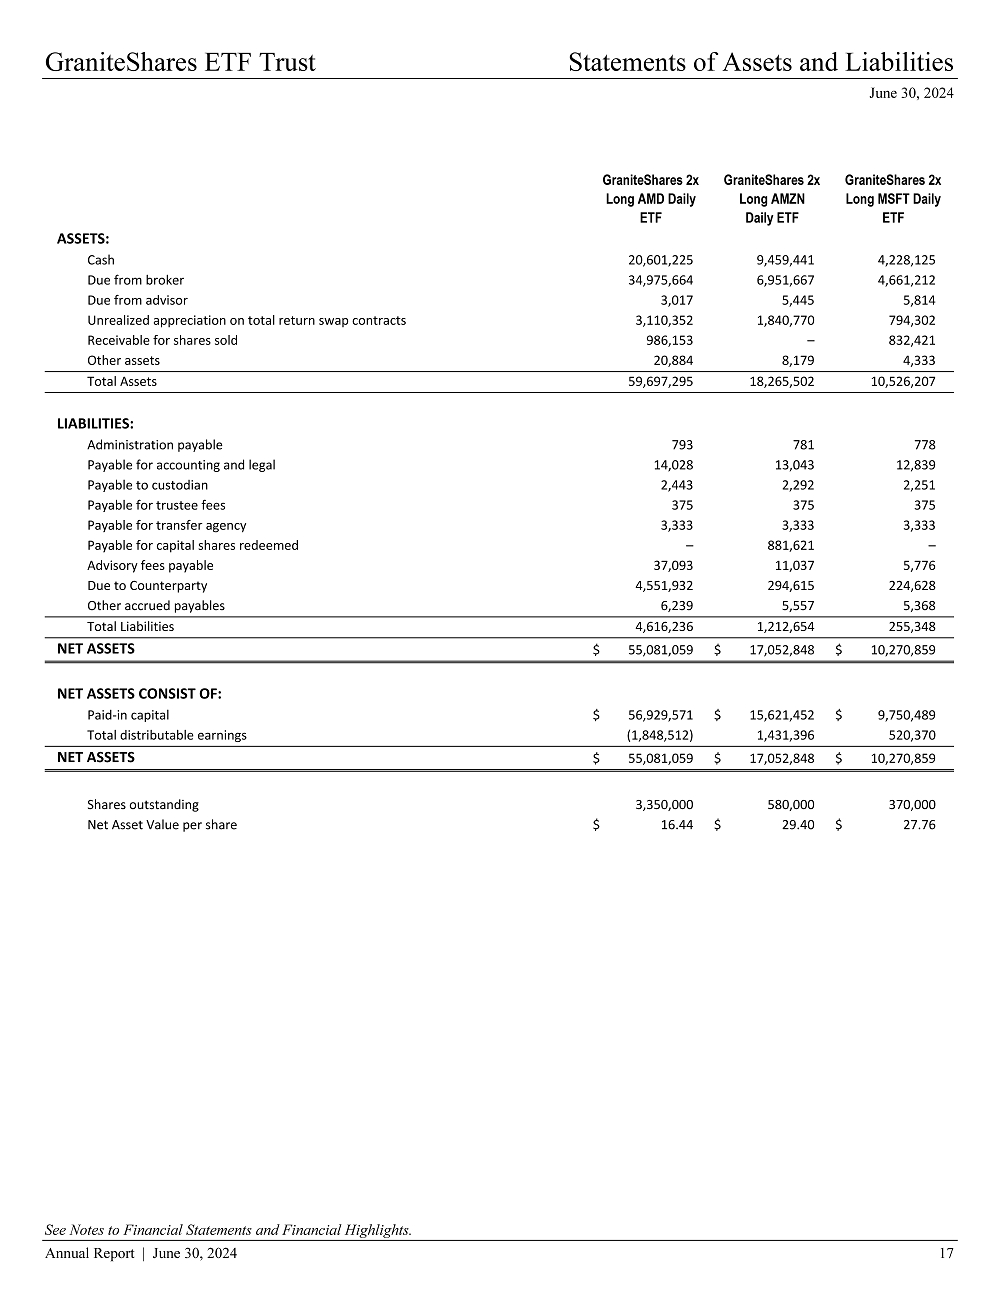
| Total Net Assets | | $ | 55,081,059 | |
| Advisory Fees Paid | | $ | 68,890 | |
| Portfolio Turnover | | | 0 | % |
What does the Fund invest in? The Fund enters into one or more swap agreements with major financial institutions for a specified period whereby the Fund and the financial institution will agree to exchange the return (or differentials in rates of return) earned or realized on the common stock of Advanced Micro Devices Inc. The Fund may invest in (1) U.S. Government securities, such as bills, notes and bonds issued by the U.S. Treasury; (2) money market funds; (3) short term bond ETFs and/or (4) corporate debt securities, such as commercial paper and other short-term unsecured promissory notes issued by businesses that are rated investment grade or of comparable quality as collateral for the Fund’s swap agreements |
| | | | | | |
| Top 10 Holdings | | | | Sector Breakdown | |
| | | | | | |
| AMD Equity Swap | 78.40% | | | Total Return Swap | 78.40% |
| Cash | 21.60% | | | Cash | 21.60% |
| Top 10 Holdings | 100.00% | | | | |
| | | | | | |
Material Fund Changes There were no material fund changes during the year. Changes in or Disagreements with Accountants There were no disagreements reported by the accountants. Householding If you wish to receive a copy of this document at a new address, contact (844) 476 8747 or send an email to info@graniteshares.com |
| | |
GraniteShares 2x Long AMD Daily ETF | |
| NASDAQ: AMDL | Annual Shareholder Report – June 30, 2024 |
| | |
| | |
| | |
| | |
| | |
Past performance does not guarantee futures results. Call (844) 476 8747 or send an email to info@graniteshares.com for current performance questions. If you wish to view additional information about the Fund, including but not limited to the financial statements and holdings, please visit www.graniteshares.com Phone: (844) 476 8747 – email: info@graniteshares.com |
| GraniteShares 1x Short AMD Daily ETF | |
| NASDAQ: AMDS | Annual Shareholder Report – June 30, 2024 |
| | |
Fund Overview The Fund seeks daily investment results, before fees and expenses, of inverse 1 times (-100%) the daily percentage change of the common stock of Advanced Micro Devices Inc. (NASDAQ: AMD). You can find additional information about the Fund at www.graniteshares.com You also request this information by calling at (844) 476 8747 or send email to info@graniteshares.com |
How did the fund perform since inception Since inception on August 21, 2023, to June 30, 2024, the Fund had a -41.67% return. |
| |
| Over the same period the common stock of Advanced Micro Devices Inc. (AMD) had a return of 53.52% and the S&P 500 Index (the Benchmark) a return of 25.72% |
What were the fund’s costs for the year (based on hypothetical $10,000 investment) |
Cost of a $10,000
Investment | | Cost paid as % of a
$10,000 investment | |
| | | | |
| $115 | | 1.15% | |
| |
How did the fund perform since inception The $10,000 chart reflects a hypothetical $10,000 investment in the Fund. The chart uses total return NAV performance and assumes reinvestment of dividend and capital gains. The NAV performance includes all fund expenses. 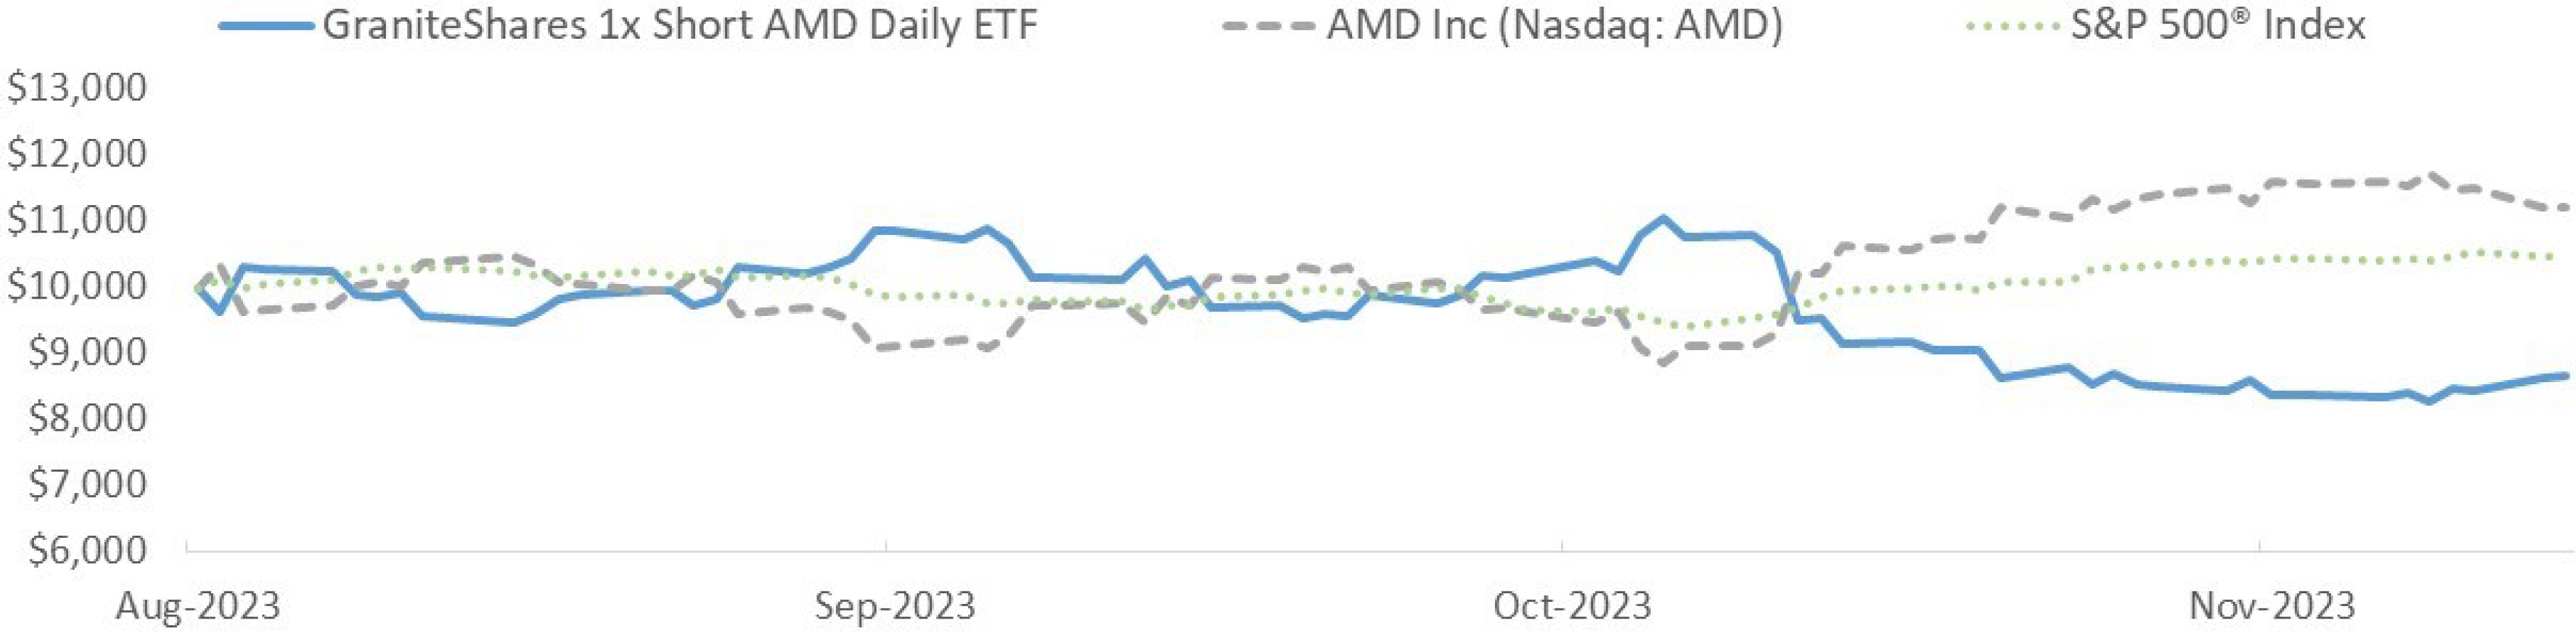
|
Average Annual Total Returns (Returns for periods of less than one year are not annualized) (as of June 30, 2024) | |
| | | | |
| | | Since Inception | |
| | | (August 21, 2023) | |
| NAV | | | (41.67 | )% |
| Price | | | (41.72 | )% |
| S&P 500 Total Return Index | | | 25.72 | % |
Fund Statistics (as of June 30, 2024) |
| | | |
| Total Net Assets | | $ | 1,915,173 | |
| Advisory Fees Paid | | $ | 9,754 | |
| Portfolio Turnover | | | 0 | % |
What does the Fund invest in? The Fund enters into one or more swap agreements with major financial institutions for a specified period whereby the Fund and the financial institution will agree to exchange the return (or differentials in rates of return) earned or realized on the common stock of Advanced Micro Devices Inc. The Fund may invest in (1) U.S. Government securities, such as bills, notes and bonds issued by the U.S. Treasury; (2) money market funds; (3) short term bond ETFs and/or (4) corporate debt securities, such as commercial paper and other short-term unsecured promissory notes issued by businesses that are rated investment grade or of comparable quality as collateral for the Fund’s swap agreements |
| | | | | | |
| Top 10 Holdings | | | | Sector Breakdown | |
| | | | | | |
| AMD Equity Swap | 67.78% | | | Total Return Swap | 67.78% |
| Cash | 32.22% | | | Cash | 32.22% |
| Top 10 Holdings | 100.00% | | | | |
| | | | | | |
Material Fund Changes There were no material fund changes during the year. Changes in or Disagreements with Accountants There were no disagreements reported by the accountants. Householding If you wish to receive a copy of this document at a new address, contact (844) 476 8747 or send an email to info@graniteshares.com |
| | |
GraniteShares 1x Short AMD Daily ETF | |
| NASDAQ: AMDS | Annual Shareholder Report – June 30, 2024 |
| | |
| | |
| | |
| | |
| | |
Past performance does not guarantee futures results. Call (844) 476 8747 or send an email to info@graniteshares.com for current performance questions. If you wish to view additional information about the Fund, including but not limited to the financial statements and holdings, please visit www.graniteshares.com Phone: (844) 476 8747 – email: info@graniteshares.com |
| GraniteShares 2x Long AMZN Daily ETF | |
| NASDAQ: AMZZ | Annual Shareholder Report – June 30, 2024 |
| | |
Fund Overview The Fund seeks daily investment results, before fees and expenses, of 2 times (200%) the daily percentage change of the common stock of Amazon.com (NASDAQ: AMZN). You can find additional information about the Fund at www.graniteshares.com You can request this information by calling at (844) 476 8747 or send email to info@graniteshares.com |
| |
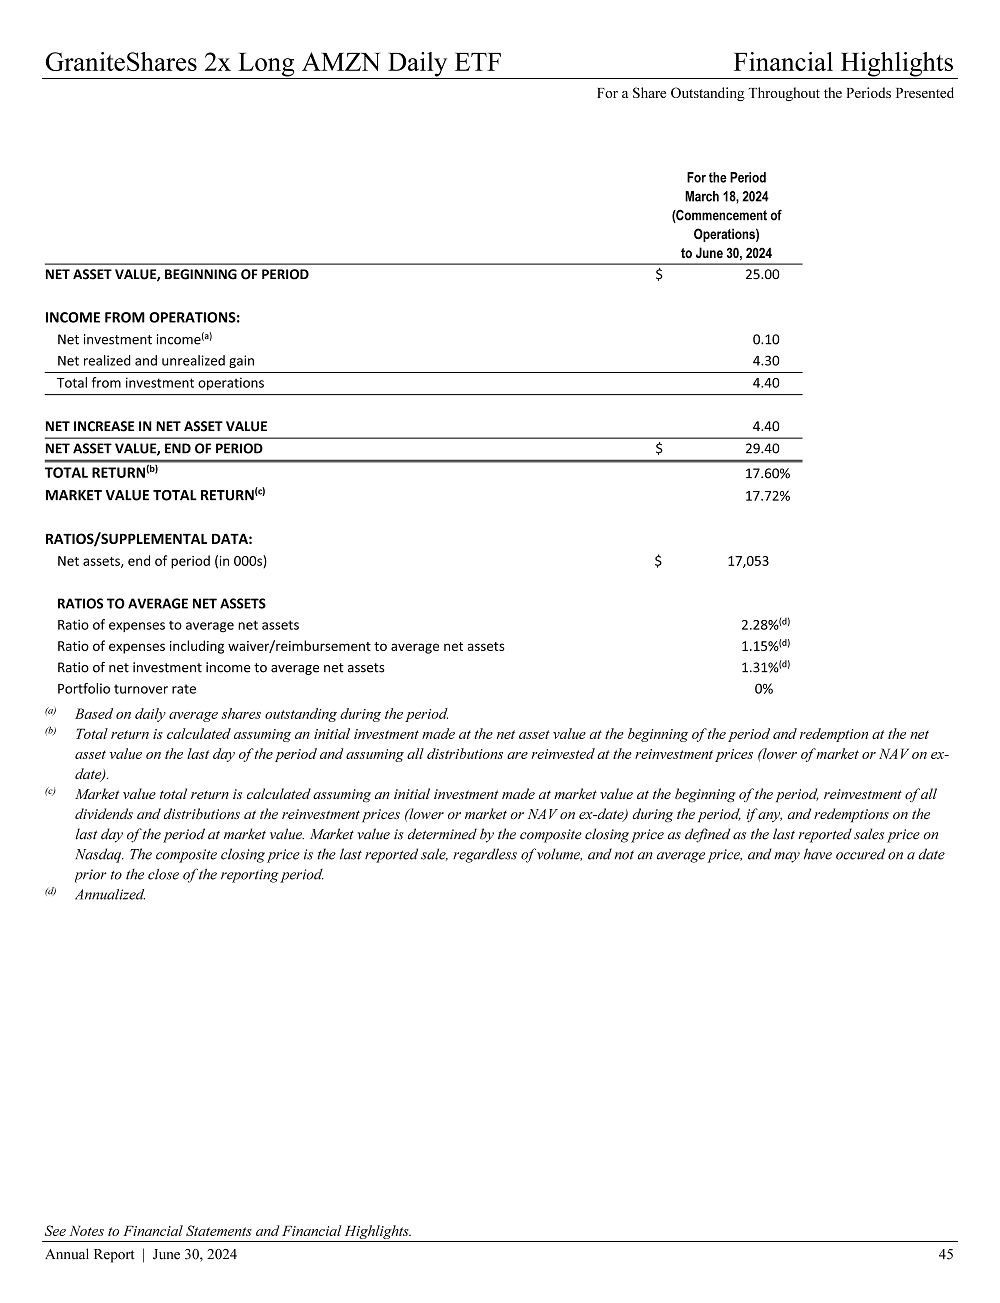
How did the fund perform since inception Since inception on March 18, 2024, to June 30, 2024, the Fund had a 17.60% return. |
| |
| Over the same period the common stock of Amazon.com (NASDAǪ: AMZN) had a return of 6.42% and the S&P 500 Index (the Benchmark) a return of 7.12% |
What were the fund’s costs for the year (based on hypothetical $10,000 investment) |
Cost of a $10,000
Investment | | Cost paid as % of a
$10,000 investment | |
| | | | |
| $115 | | 1.15% | |
| |
How did the fund perform since inception The $10,000 chart reflects a hypothetical $10,000 investment in the Fund. The chart uses total return NAV performance and assumes reinvestment of dividend and capital gains. The NAV performance includes all fund expenses. 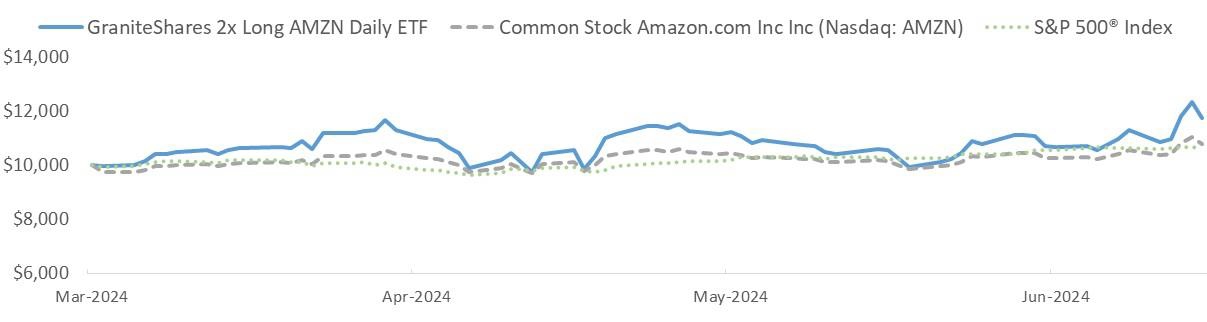
|
| |
Average Annual Total Returns (Returns for periods of less than one year are not annualized) (as of June 30, 2024) | |
| | | | |
| | | Since Inception | |
| | | (March 18, 2024) | |
| NAV | | 17.60 | % |
| Price | | 17.72 | % |
| S&P 500 Total Return Index | | 13.95 | % |
Fund Statistics (as of June 30, 2024) |
| | | |
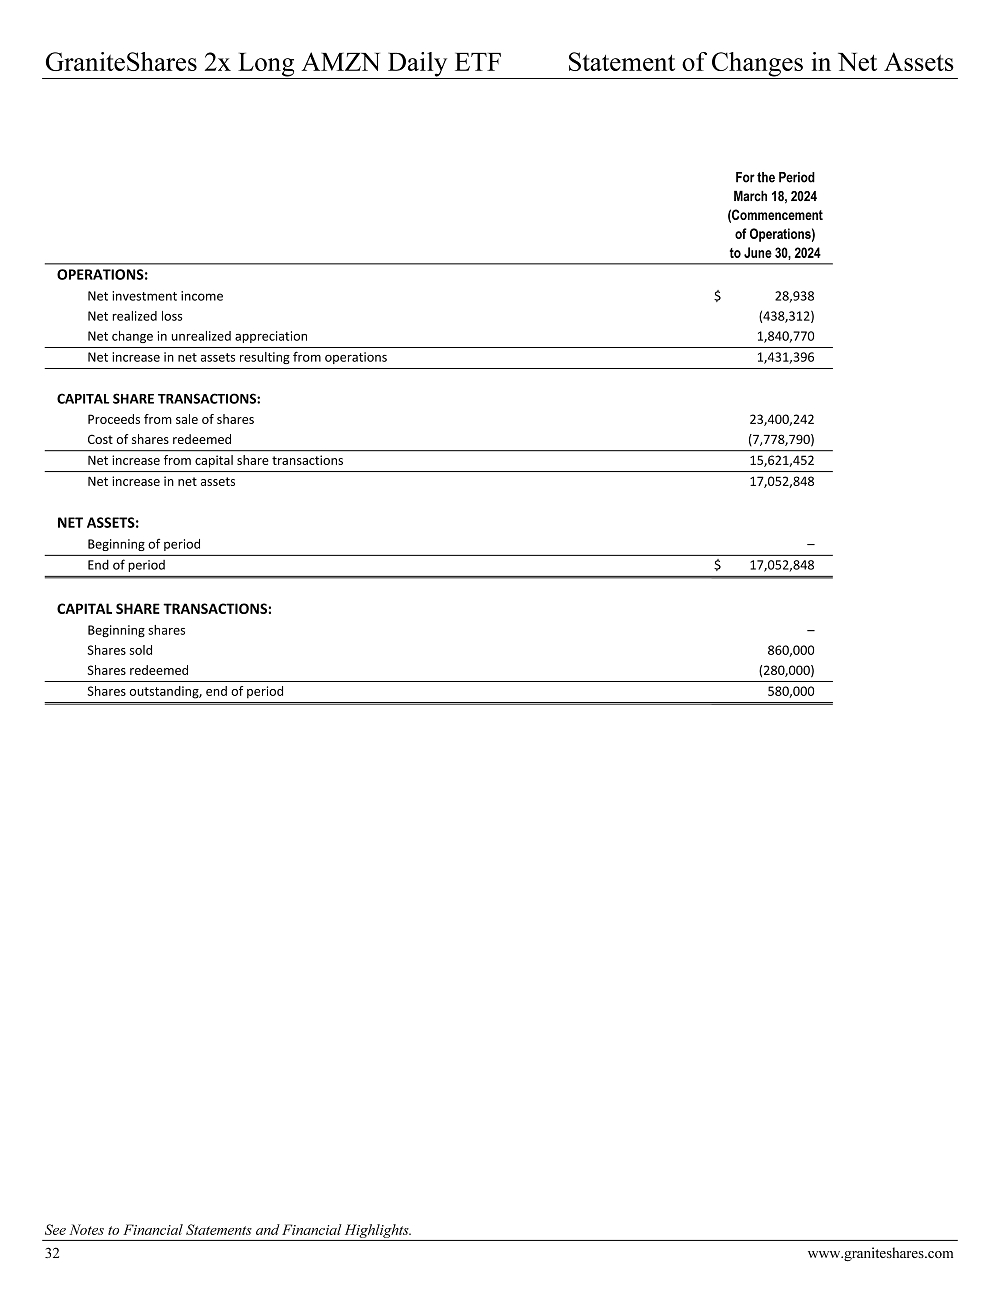
| Total Net Assets | | $ | 17,052,848 | |
| Advisory Fees Paid | | $ | 21,814 | |
| Portfolio Turnover | | | 0 | % |
What does the Fund invest in? The Fund enters into one or more swap agreements with major financial institutions for a specified period whereby the Fund and the financial institution will agree to exchange the return (or differentials in rates of return) earned or realized on the common stock of Amazon.com. The Fund may invest in (1) U.S. Government securities, such as bills, notes and bonds issued by the U.S. Treasury; (2) money market funds; (3) short term bond ETFs and/or (4) corporate debt securities, such as commercial paper and other short-term unsecured promissory notes issued by businesses that are rated investment grade or of comparable quality as collateral for the Fund’s swap agreements |
| | | | | | |
| Top 10 Holdings | | | | Sector Breakdown | |
| | | | | | |
| AMZN Equity Swap | 83.10% | | | Total Return Swap | 83.10% |
| Cash | 16.90% | | | Cash | 16.90% |
| Top 10 Holdings | 100.00% | | | | |
| | | | | | |
Material Fund Changes There were no material fund changes during the year. Changes in or Disagreements with Accountants There were no disagreements reported by the accountants. Householding If you wish to receive a copy of this document at a new address, contact (844) 476 8747 or send an email to info@graniteshares.com |
| | |
GraniteShares 2x Long AMZN Daily ETF | |
| NASDAQ: AMZZ | Annual Shareholder Report – June 30, 2024 |
| | |
| | |
| | |
| | |
| | |
Past performance does not guarantee futures results. Call (844) 476 8747 or send an email to info@graniteshares.com for current performance questions. If you wish to view additional information about the Fund, including but not limited to the financial statements and holdings, please visit www.graniteshares.com Phone: (844) 476 8747 – email: info@graniteshares.com |
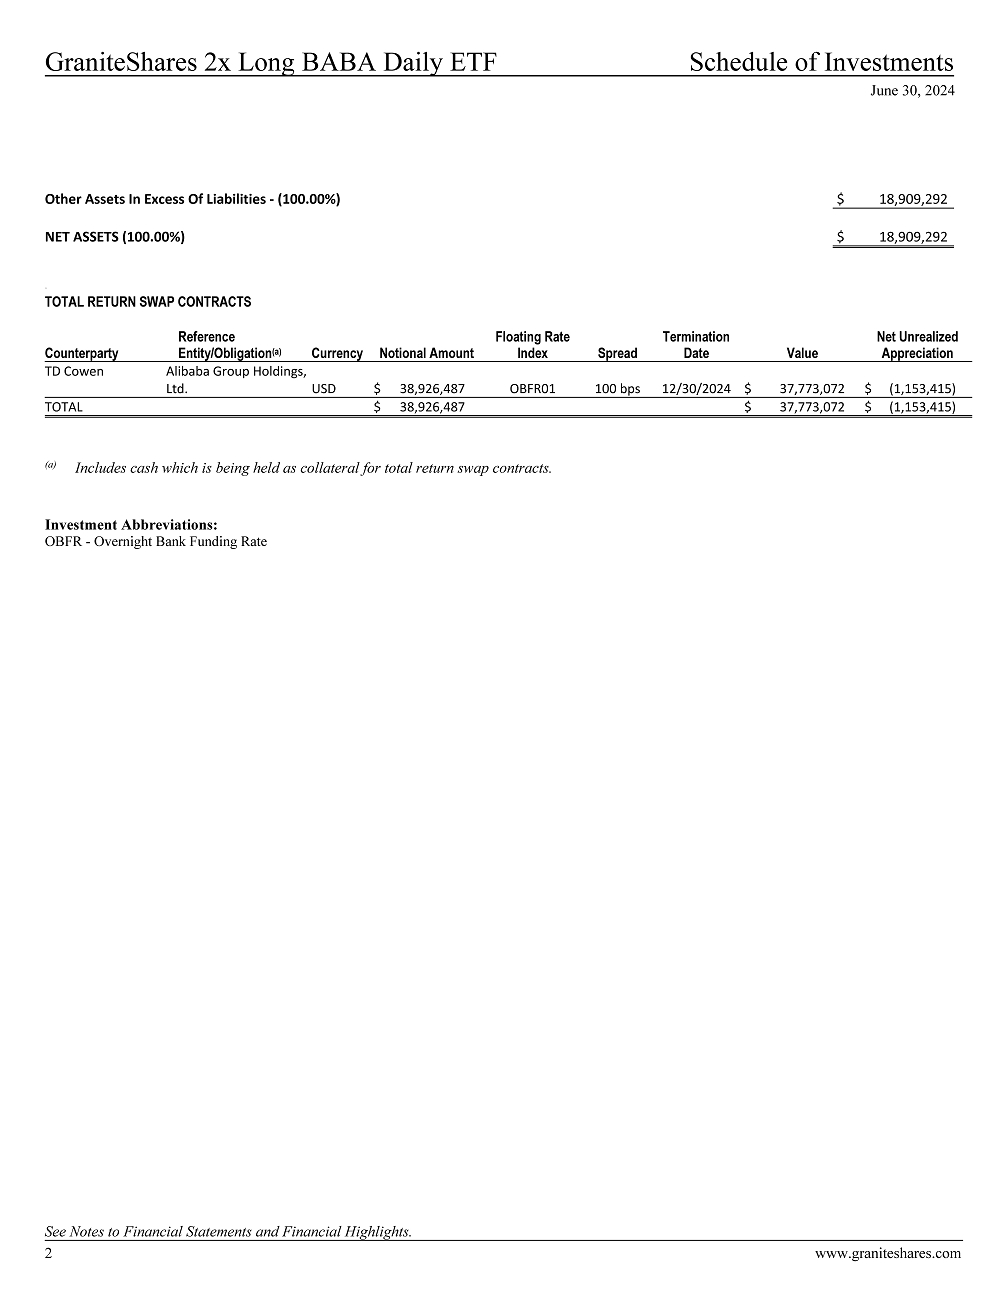
| GraniteShares 2x Long BABA Daily ETF | |
| NASDAQ: BABX | Annual Shareholder Report – June 30, 2024 |
| | |
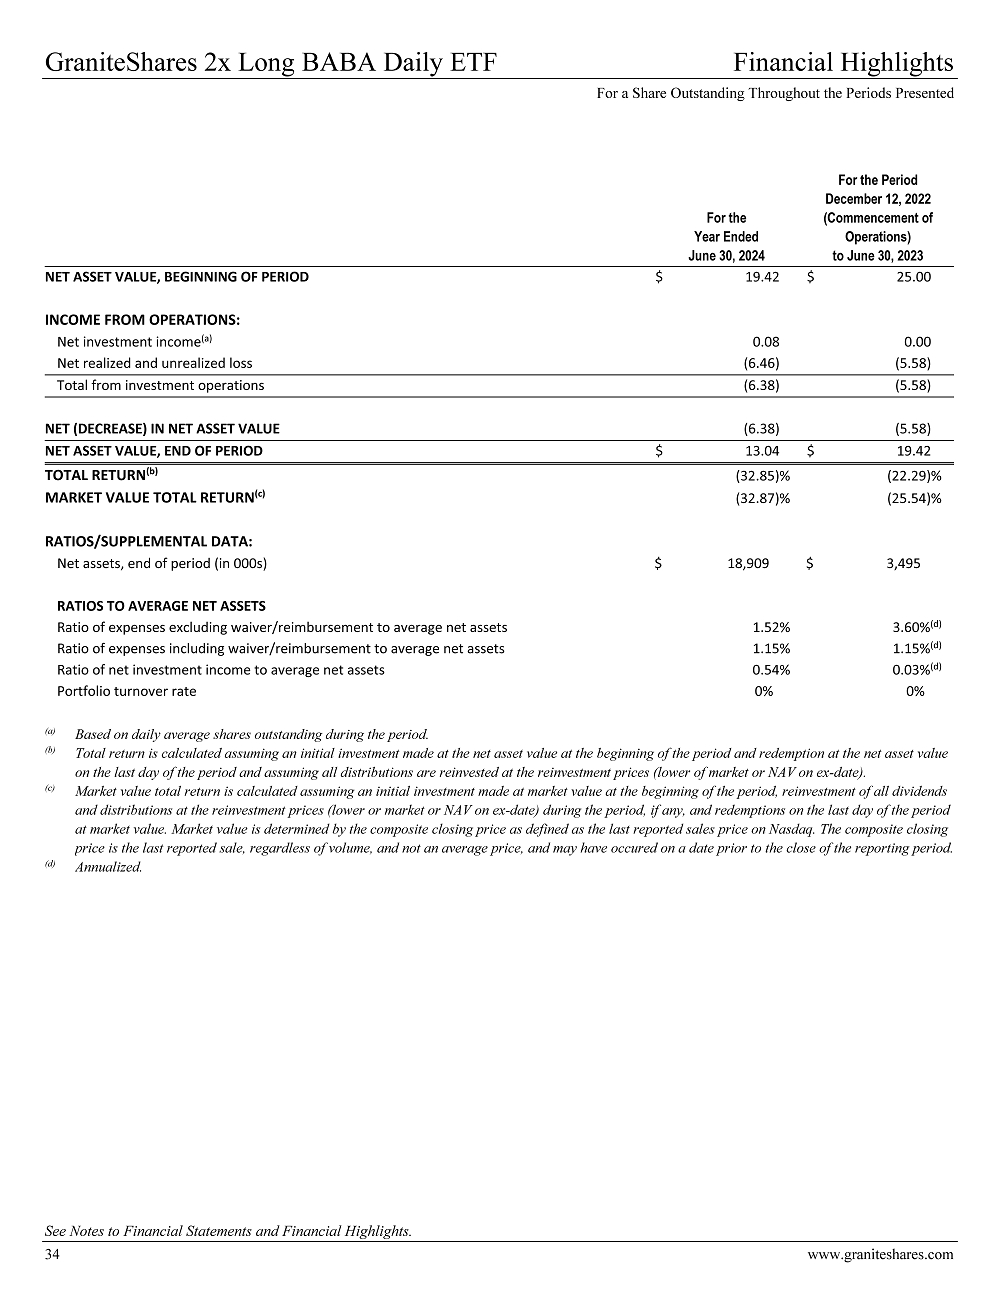
Fund Overview The Fund seeks daily investment results, before fees and expenses, of 2 times (200%) the daily percentage change of the ADR of Alibaba Group Holding Limited (NYSE: BABA). You can find additional information about the Fund at www.graniteshares.com You can request this information by calling at (844) 476 8747 or send email to info@graniteshares.com |
| |
How did the fund perform last fiscal year During the 1-year period starting June 30, 2023, to June 30, 2024, the Fund had a -32.85% return. |
| |
| Over the same period the ADR of Alibaba Group Holding Limited (BABA) had a return of -10.55% and the S&P 500 Index (the Benchmark) a return of 24.56% |
What were the fund’s costs for the year (based on hypothetical $10,000 investment) |
Cost of a $10,000
Investment | | Cost paid as % of a
$10,000 investment | |
| | | | |
| $115 | | 1.15% | |
How did the fund perform since inception The $10,000 chart reflects a hypothetical $10,000 investment in the Fund. The chart uses total return NAV performance and assumes reinvestment of dividend and capital gains. The NAV performance includes all fund expenses. 
|
Average Annual Total Returns (as of June 30, 2024) | |
| | | | | | |
| | | 1 Year | | Since Inception | |
| | | | | (Dec 12, 2022) | |
| NAV | | | (32.85 | )% | | | (34.31 | )% |
| Price | | | (32.87 | )% | | | (34.31 | )% |
| S&P 500 Total Return Index | | | 24.56 | % | | | 24.41 | % |
Fund Statistics (as of June 30, 2024) |
| | | |
| Total Net Assets | | $ | 18,909,292 | |
| Advisory Fees Paid | | $ | 115,920 | |
| Portfolio Turnover | | | 0 | % |
What does the Fund invest in? The Fund enters into one or more swap agreements with major financial institutions for a specified period whereby the Fund and the financial institution will agree to exchange the return (or differentials in rates of return) earned or realized on the ADR of Alibaba Group Holding Limited. The Fund may invest in (1) U.S. Government securities, such as bills, notes and bonds issued by the U.S. Treasury; (2) money market funds; (3) short term bond ETFs and/or (4) corporate debt securities, such as commercial paper and other short-term unsecured promissory notes issued by businesses that are rated investment grade or of comparable quality as collateral for the Fund’s swap agreements |
| | | | | | |
| Top 10 Holdings | | | | Sector Breakdown | |
| | | | | | |
| BABA Equity Swap | 72.17% | | | Total Return Swap | 72.17% |
| Cash | 27.83% | | | Cash | 27.83% |
| Top 10 Holdings | 100.00% | | | | |
| | | | | | |
Material Fund Changes There were no material fund changes during the year. Changes in or Disagreements with Accountants There were no disagreements reported by the accountants. Householding If you wish to receive a copy of this document at a new address, contact (844) 476 8747 or send an email to info@graniteshares.com |
| | |
GraniteShares 2x Long BABA Daily ETF | |
| NASDAQ: BABX | Annual Shareholder Report – June 30, 2024 |
| | |
| | |
| | |
| | |
| | |
Past performance does not guarantee futures results. Call (844) 476 8747 or send an email to info@graniteshares.com for current performance questions. If you wish to view additional information about the Fund, including but not limited to the financial statements and holdings, please visit www.graniteshares.com Phone: (844) 476 8747 – email: info@graniteshares.com |
| GraniteShares Bloomberg Commodity Broad Strategy No K-1 ETF | |
| NYSE: COMB | Annual Shareholder Report – June 30, 2024 |
| | |
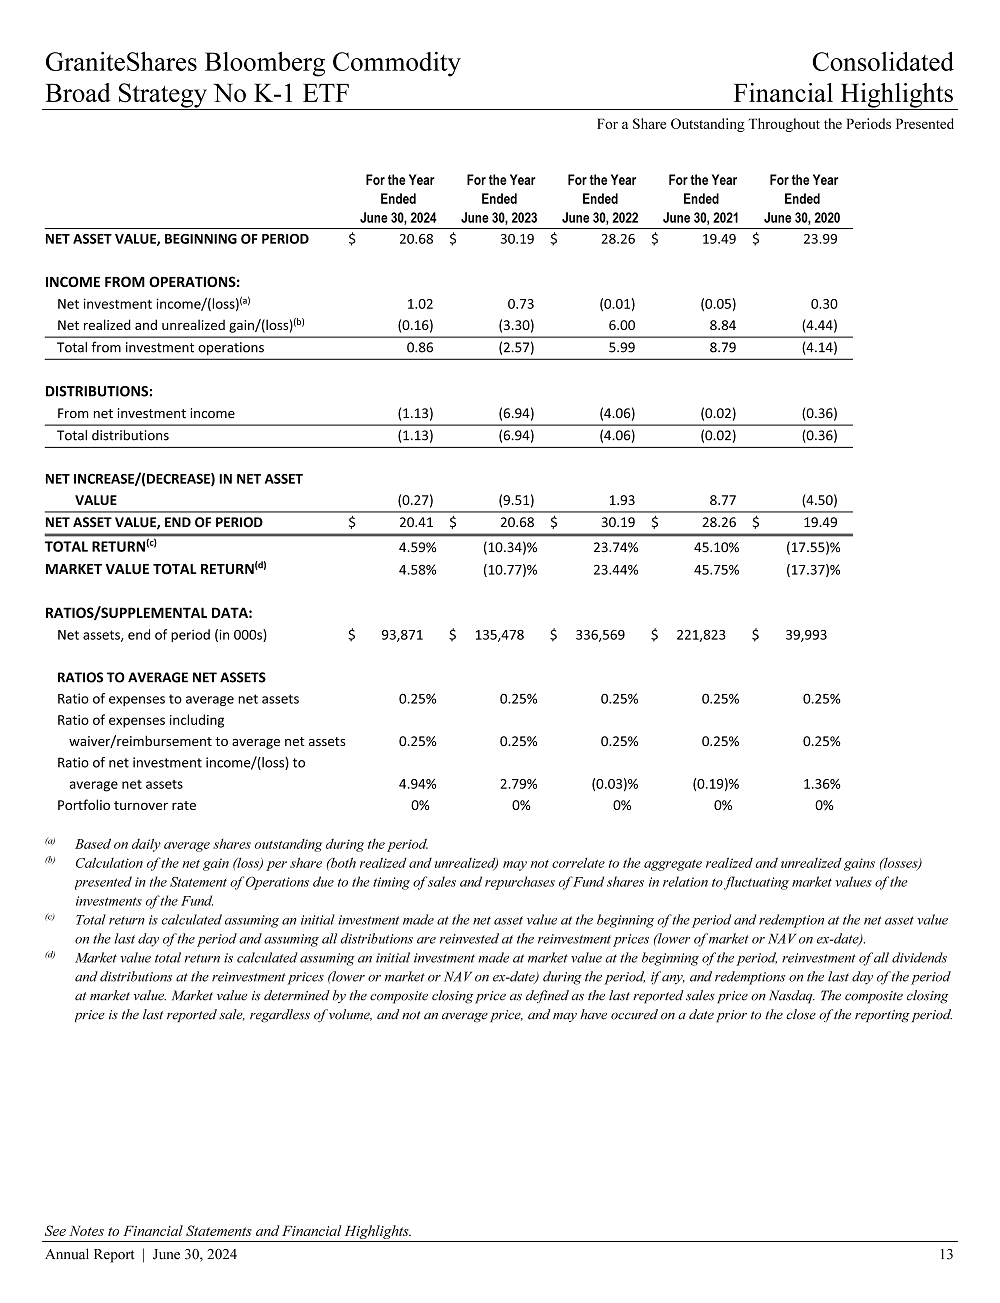
Fund Overview The GraniteShares Bloomberg Commodity Broad Strategy No K-1 ETF seeks to provide long-term capital appreciation, primarily through exposure to commodity futures markets. You can find additional information about the Fund at www.graniteshares.com You can request this information by calling at (844) 476 8747 or send email to info@graniteshares.com |
| |
How did the fund perform last fiscal year During the 1-year period starting June 30, 2023, to June 30, 2024, the Fund had a 4.59% return. |
| |
| Over the same period the Bloomberg Commodity Index (the Benchmark) had a return of 5.00% |
What were the fund’s costs for the year (based on hypothetical $10,000 investment) |
Cost of a $10,000
Investment | | Cost paid as % of a
$10,000 investment | |
| | | | |
| $25 | | 0.25% | |
How did the fund perform since inception The $10,000 chart reflects a hypothetical $10,000 investment in the Fund. The chart uses total return NAV performance and assumes reinvestment of dividend and capital gains. The NAV performance includes all fund expenses. 
|
Average Annual Total Returns (as of June 30, 2024) | |
| | | | | | | | | | |
| | | 1 Year | | 3 Years | | 5 Years | | Since Inception | |
| | | | | | | | | (May 22, 2017) | |
| NAV | | 4.59% | | 5.04% | | 6.75% | | | 4.26 | % |
| Price | | 4.58% | | 4.94% | | 6.80% | | | 4.26 | % |
| Bloomberg Commodity Total Return Index | | 5.00% | | 5.65% | | 7.25% | | | 4.70 | % |
Fund Statistics (as of June 30, 2024) |
| | | |
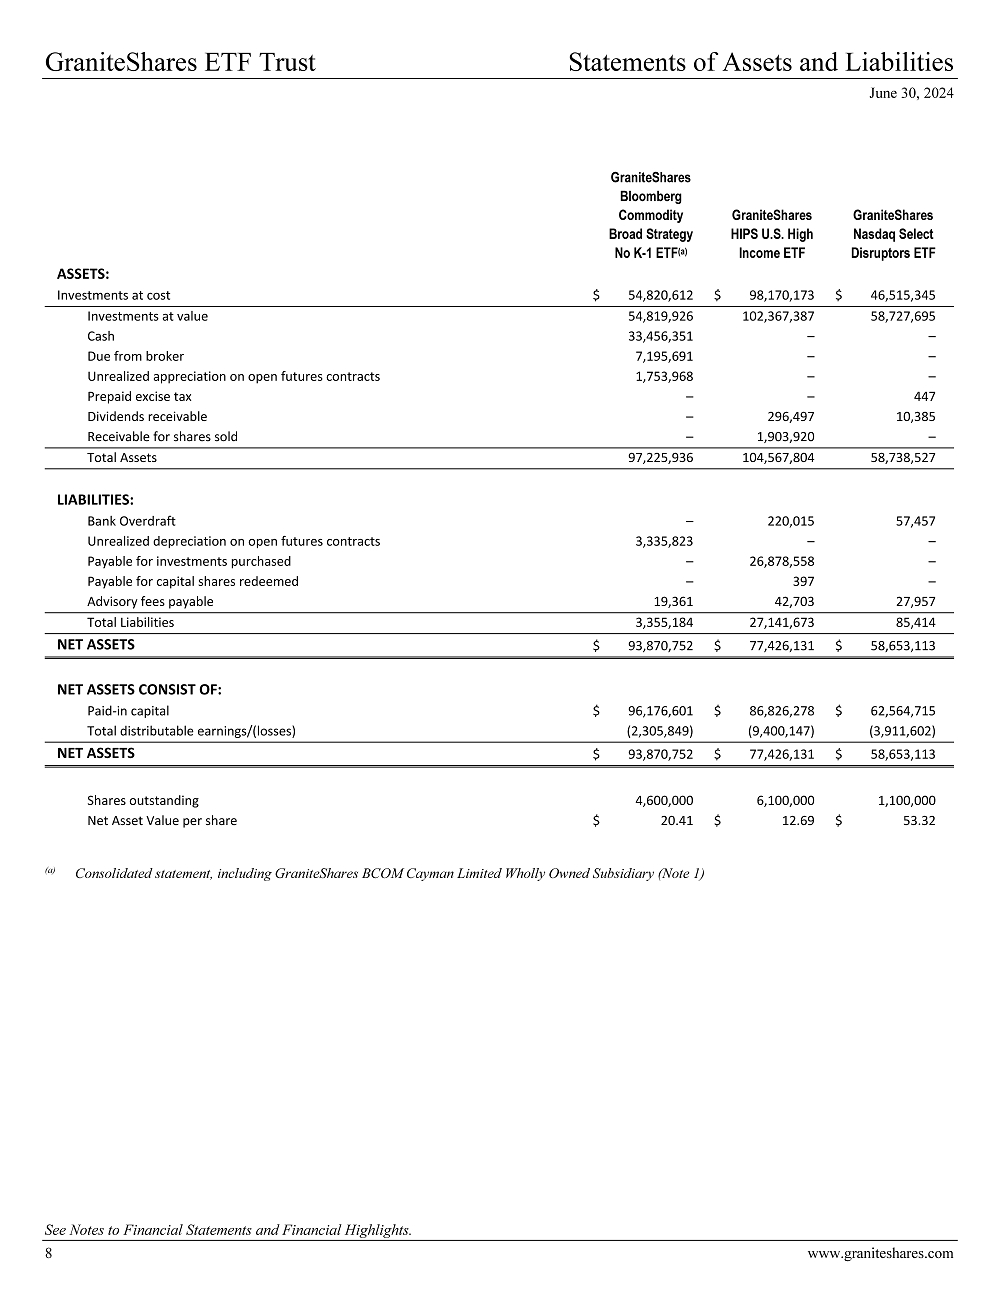
| Total Net Assets | | $ | 93,870,752 | |
| Advisory Fees Paid | | $ | 254,617 | |
| Portfolio Turnover | | | 0 | % |
What does the Fund invest in? While the Fund generally seeks exposure to the commodity futures markets included in the Bloomberg Commodity Index. The Fund seeks to enhance its performance, in part through a cash management strategy consisting of investments in investment grade fixed income securities issued by various U.S. public sector or corporate entities |
| | | | | | | |
| Top 10 Holdings | | | | Sector Breakdown | | |
| | | | | | | |
| | | | | Futures | 60.13% | |
| Unites States Treasuries Bills | 35.24% | | | U.S. Government | 35.24% | |
| Gold 100 Oz Future | 9.32% | | | Cash | 4.63% | |
| Brent Crude Future | 4.70% | | | | | |
| WTI Crude Future | 4.56% | | | | | |
| Natural Gas Future | 4.51% | | | | | |
| Copper Future | 3.46% | | | | | |
| Silver Future | 3.23% | | | | | |
| Soybean Future | 2.95% | | | | | |
| Corn Future | 2.86% | | | | | |
| Aluminum Future | 2.64% | | | | | |
| Top 10 Holdings | 73.47% | | | | | |
| | | | | | | |
Material Fund Changes There were no material fund changes during the year. Changes in or Disagreements with Accountants There were no disagreements reported by the accountants. Householding If you wish to receive a copy of this document at a new address, contact (844) 476 8747 or send an email to info@graniteshares.com |
| | |
GraniteShares Bloomberg Commodity Broad Strategy No K-1 ETF | |
| NYSE: COMB | Annual Shareholder Report – June 30, 2024 |
| | |
| | |
| | |
| | |
| | |
Past performance does not guarantee futures results. Call (844) 476 8747 or send an email to info@graniteshares.com for current performance questions. If you wish to view additional information about the Fund, including but not limited to the financial statements and holdings, please visit www.graniteshares.com Phone: (844) 476 8747 – email: info@graniteshares.com |
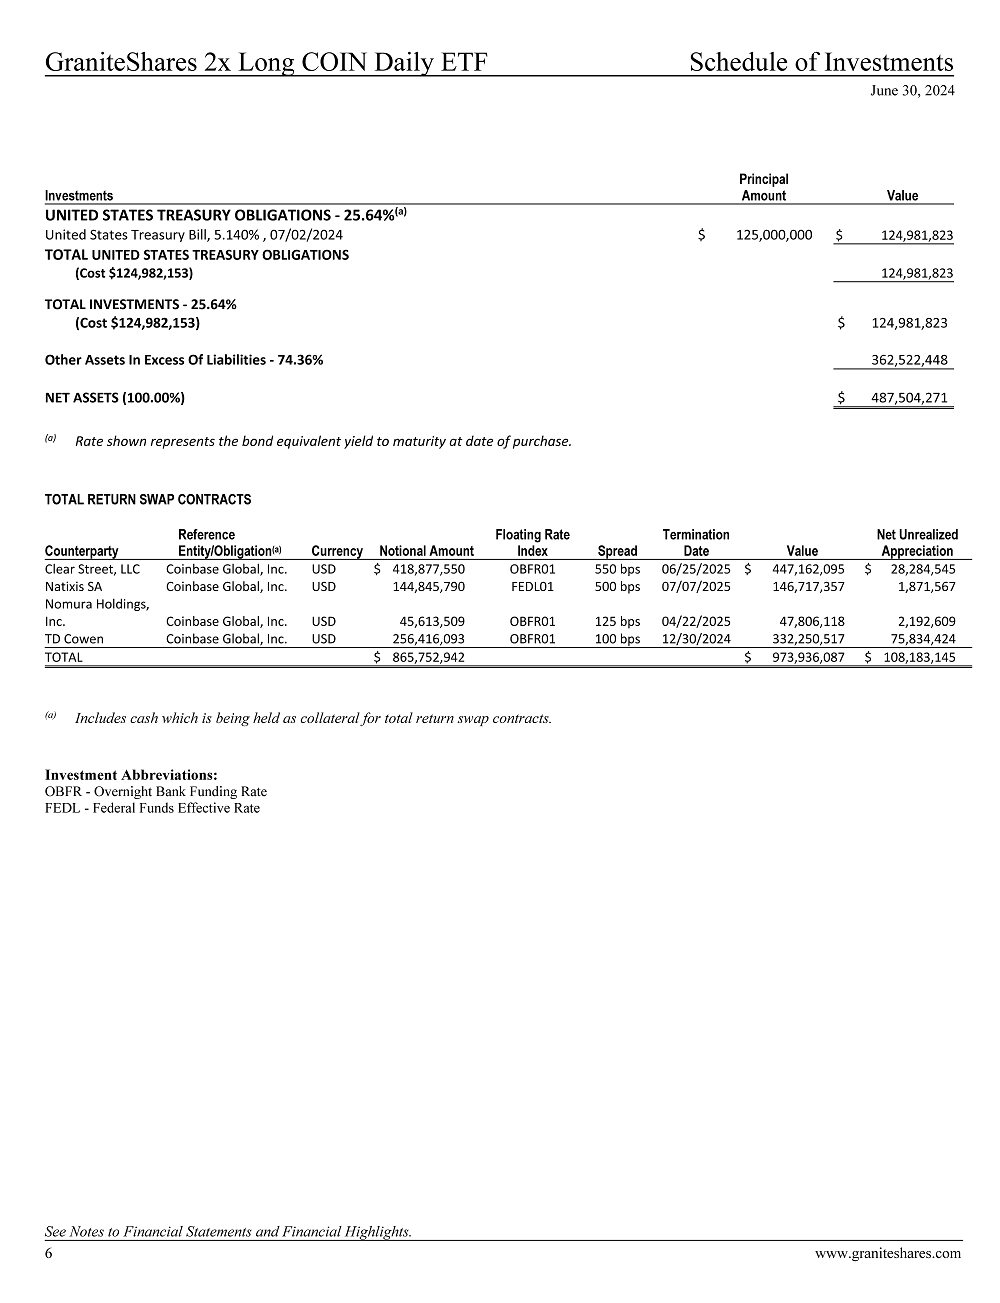
| GraniteShares 2x Long COIN Daily ETF | |
| NASDAQ: CONL | Annual Shareholder Report – June 30, 2024 |
| | |
Fund Overview The Fund seeks daily investment results, before fees and expenses, of 2 times (200%) the daily percentage change of the common stock of Coinbase Global Inc. (NASDAQ: COIN). You can find additional information about the Fund at www.graniteshares.com You can request this information by calling at (844) 476 8747 or send email to info@graniteshares.com |
| |
How did the fund perform last fiscal year During the 1-year period starting June 30, 2023, to June 30, 2024, the Fund had a 343.82% return.
|
| |
| Over the same period the common stock of Coinbase Global Inc. (NASDAQ: COIN) had a return of 210.59% and the S&P 500 Index (the Benchmark) a return of 24.56% |
What were the fund’s costs for the year (based on hypothetical $10,000 investment) |
| Cost of a $10,000 Investment | | Cost paid as % of a $10,000 investment | |
| | | | |
| $110 | | 1.10% | |
How did the fund perform since inception The $10,000 chart reflects a hypothetical $10,000 investment in the Fund. The chart uses total return NAV performance and assumes reinvestment of dividend and capital gains. The NAV performance includes all fund expenses. 
|
Average Annual Total Returns (as of June 30, 2024) | |
| | | | | | | |
| | | 1 Year | | | Since Inception | |
| | | | | | (Aug 08, 2022) | |
| NAV | | | 343.82 | % | | | 37.29 | % |
| Price | | | 344.36 | % | | | 37.31 | % |
| S&P 500 Total Return Index | | | 24.56 | % | | | 17.65 | % |
Fund Statistics (as of June 30, 2024) |
| | | |
| Total Net Assets | | $ | 487,504,271 | |
| Advisory Fees Paid | | $ | 1,564,948 | |
| Portfolio Turnover | | | 44,577 | % |
What does the Fund invest in? The Fund enters into one or more swap agreements with major financial institutions for a specified period whereby the Fund and the financial institution will agree to exchange the return (or differentials in rates of return) earned or realized on the common stock of Coinbase Global Inc. The Fund may invest in (1) U.S. Government securities, such as bills, notes and bonds issued by the U.S. Treasury; (2) money market funds; (3) short term bond ETFs and/or (4) corporate debt securities, such as commercial paper and other short-term unsecured promissory notes issued by businesses that are rated investment grade or of comparable quality as collateral for the Fund’s swap agreements |
| | | | | | | |
| Top 10 Holdings | | | | Sector Breakdown | | |
| | | | | | | |
| COIN Equity Swap | 66.52% | | | Total Return Swap | 66.52% | |
| Cash | 24.94% | | | Cash | 24.94% | |
| United States Treasury Bills | 8.54% | | | U.S. Government | 8.54% | |
| Top 10 Holdings | 100.00% | | | | | |
| | | | | | | |
Material Fund Changes There were no material fund changes during the year. Changes in or Disagreements with Accountants There were no disagreements reported by the accountants. Householding If you wish to receive a copy of this document at a new address, contact (844) 476 8747 or send an email to info@graniteshares.com |
| | |
| GraniteShares 2x Long COIN Daily ETF NASDAQ: CONL | |
| Annual Shareholder Report – June 30, 2024 |
| | |
| | |
| | |
| | |
| | |
Past performance does not guarantee futures results. Call (844) 476 8747 or send an email to info@graniteshares.com for current performance questions. If you wish to view additional information about the Fund, including but not limited to the financial statements and holdings, please visit www.graniteshares.com Phone: (844) 476 8747 – email: info@graniteshares.com |
GraniteShares Nasdaq Select Disruptors ETF NYSE: DRUP | |
| Annual Shareholder Report – June 30, 2024 |
| | |
Fund Overview The GraniteShares Nasdaq Select Disruptors ETF (the Fund) seeks to provide investment results that, before fees and expenses, correspond generally to the total return performance of the Nasdaq US Large Cap Select Disruptors Index (Index 1). From inception on October 10, 2019, to August 14, 2023, the Fund sought to provide investment results that, before fees and expenses, correspond generally to the total return performance of the XOUT U.S. Large Cap index (Index 2). The Benchmark represents a combination of the performances of Index 1 and Index 2. You can find additional information about the Fund at www.graniteshares.com You can request this information by calling at (844) 476 8747 or send email to info@graniteshares.com |
| |
How did the fund perform last fiscal year During the 1-year period starting June 30, 2023, to June 30, 2024, the Fund had a 32.92% return.
|
| |
| Over the same period the Benchmark had a return of 31.82%. |
| What were the fund’s costs for the year |
| |
| (based on hypothetical $10,000 investment) |
| Cost of a $10,000 Investment | | Cost paid as % of a $10,000 investment | |
| | | | |
| $60 | | 0.60% | |
How did the fund perform since inception The $10,000 chart reflects a hypothetical $10,000 investment in the Fund. The chart uses total return NAV performance and assumes reinvestment of dividend and capital gains. The NAV performance includes all fund expenses. 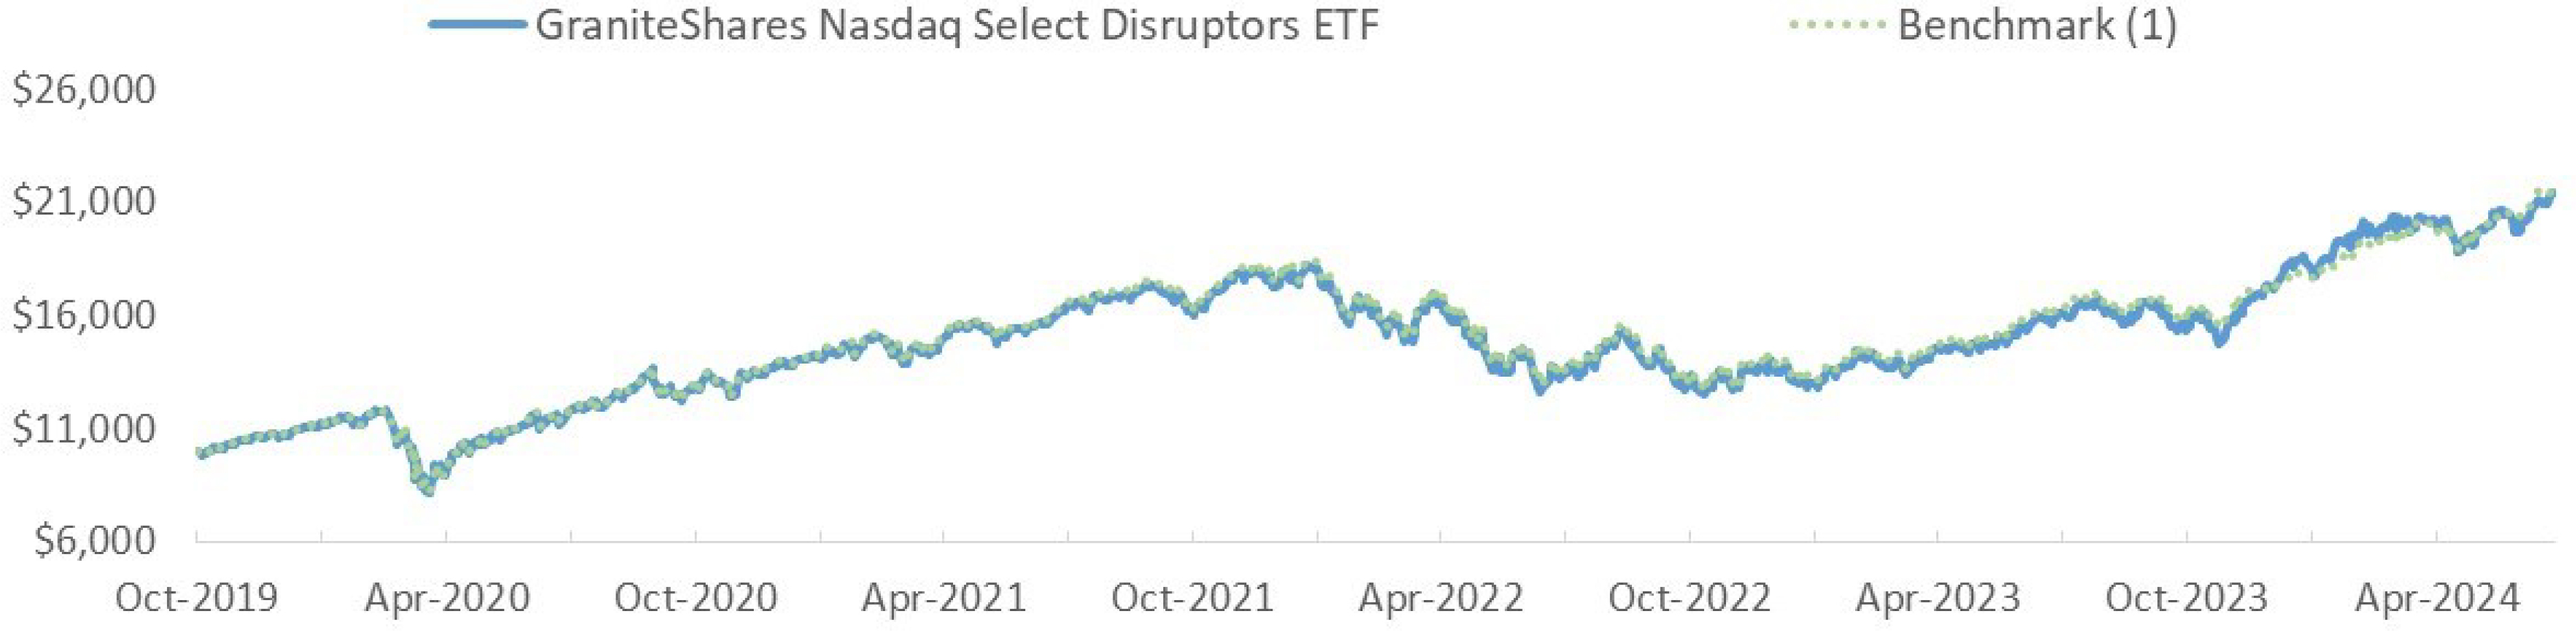
|
Average Annual Total Returns (as of June 30, 2024) | | | |
| | | | | | | | |
| | | 1 Year | | 3 Years | | Since Inception | |
| | | | | | | (Oct 10, 2019) | |
| | | | | | | | |
| NAV | | | 32.92 | % | | | 9.78 | % | | | 17.49 | % |
| Price | | | 33.02 | % | | | 9.82 | % | | | 17.49 | % |
| Benchmark (1) | | | 31.82 | % | | | 9.10 | % | | | 21.38 | % |
| (1) | From inception to 08.14.23 the Fund aimed to track before fees and expenses the XOUT US Large Index. Since 08.15.23 the Fund aims to track before fees and expenses the Nasdaq US Large Cap Select Disruptors Index |
Fund Statistics (as of June 30, 2024) |
| | | |
| Total Net Assets | | $ | 58,653,113 | |
| Advisory Fees Paid | | $ | 337,544 | |
| Portfolio Turnover | | | 107 | % |
| (1) | | From inception to 08.14.23 the Fund aimed to track before fees and expenses the XOUT US Large Index. Since 08.15.23 the Fund aims to track before fees and expenses the Nasdaq US Large Cap Select Disruptors Index |
What does the Fund invest in? The Fund seeks to achieve its investment objective by investing, under normal circumstances, at least 80% of its assets (exclusive of collateral held from securities lending) in the securities included in the Nasdaq US Large Cap Select Disruptors Index. |
| | | | | | | |
| Top 10 Holdings | | | | Sector Breakdown | | |
| | | | | | | |
| Microsoft Corp. | 9.95% | | | Technology | 56.77% | |
| Meta Platforms, Inc. – Class A | 6.13% | | | Communications | 20.65% | |
| Alphabet, Inc. | 6.12% | | | Consumer - non-cyclical | 19.06% | |
| Adobe, Inc. | 3.59% | | | Industrial | 3.52% | |
| Salesforce, Inc. | 3.40% | | | | | |
| Applied Materials, Inc. | 2.99% | | | | | |
| ServiceNow, Inc. | 2.92% | | | | | |
| Intuitive Surgical, Inc. | 2.76% | | | | | |
| Palo Alto Networks, Inc. | 2.48% | | | | | |
| Stryker Corp. | 2.39% | | | | | |
| Top Ten Holdings | 42.73% | | | | | |
| | | | | | | |
Material Fund Changes There were no material fund changes during the year. Changes in or Disagreements with Accountants There were no disagreements reported by the accountants. Householding If you wish to receive a copy of this document at a new address, contact (844) 476 8747 or send an email to info@graniteshares.com |
| | |
| GraniteShares Nasdaq Select Disruptors ETF NYSE: DRUP | |
| Annual Shareholder Report – June 30, 2024 |
| | |
| | |
| | |
| | |
| | |
Past performance does not guarantee futures results. Call (844) 476 8747 or send an email to info@graniteshares.com for current performance questions. If you wish to view additional information about the Fund, including but not limited to the financial statements and holdings, please visit www.graniteshares.com Phone: (844) 476 8747 – email: info@graniteshares.com |
| GraniteShares 2x Long META Daily ETF | |
| NASDAQ: FBL | Annual Shareholder Report – June 30, 2024 |
| | |
Fund Overview
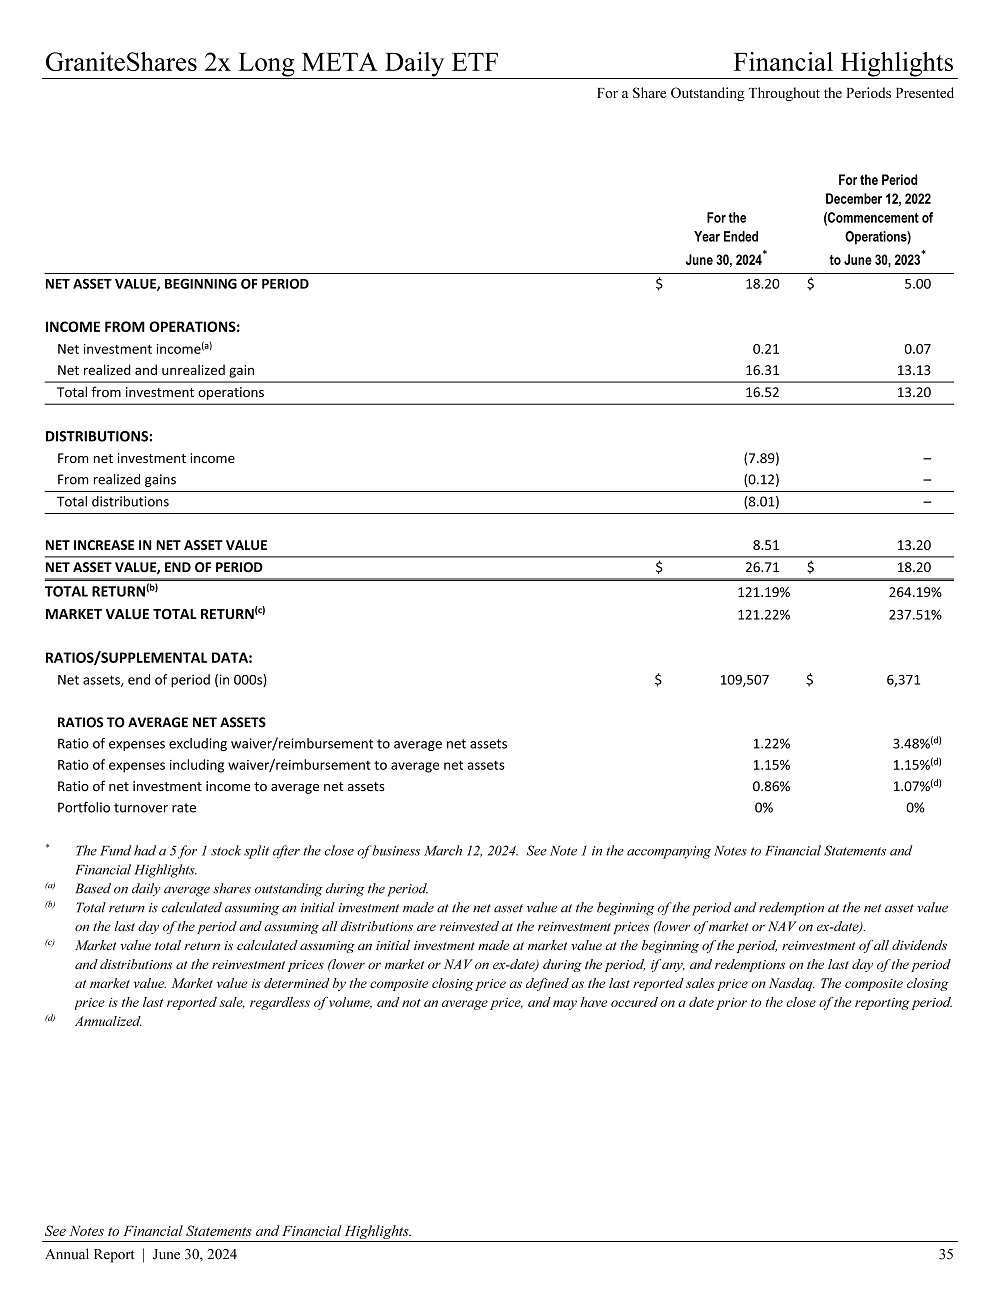
The Fund seeks daily investment results, before fees and expenses, of 2 times (200%) the daily percentage change of the common stock of Meta Platforms Inc. (NASDAQ: META). You can find additional information about the Fund at www.graniteshares.com You can request this information by calling at (844) 476 8747 or send email to info@graniteshares.com |
How did the fund perform last fiscal year During the 1-year period starting June 30, 2023, to June 30, 2024, the Fund had a 121.19% return.
|
| |
| Over the same period the common stock of Meta Platforms Inc. (NASDAQ: META) had a return of 76.06% and the S&P 500 Index (the Benchmark) a return of 24.56% |
What were the fund’s costs for the year (based on hypothetical $10,000 investment) |
| Cost of a $10,000 Investment | | Cost paid as % of a $10,000 investment | |
| | | | |
| $115 | | 1.15% | |
How did the fund perform since inception The $10,000 chart reflects a hypothetical $10,000 investment in the Fund. The chart uses total return NAV performance and assumes reinvestment of dividend and capital gains. The NAV performance includes all fund expenses. 
|
Average Annual Total Returns (as of June 30, 2024) | |
| | | | | | |
| | | 1 Year | | Since Inception | |
| | | | | (Dec 12, 2022) | |
| NAV | | | 121.19 | % | | | 248.80 | % |
| Price | | | 121.22 | % | | | 248.71 | % |
| S&P 500 Total Return Index | | | 24.56 | % | | | 24.41 | % |
Fund Statistics (as of June 30, 2024) |
| | | |
| Total Net Assets | | $ | 109,506,608 | |
| Advisory Fees Paid | | $ | 406,395 | |
| Portfolio Turnover | | | 0 | % |
What does the Fund invest in? The Fund enters into one or more swap agreements with major financial institutions for a specified period whereby the Fund and the financial institution will agree to exchange the return (or differentials in rates of return) earned or realized on the common stock of Coinbase Global Inc. The Fund may invest in (1) U.S. Government securities, such as bills, notes and bonds issued by the U.S. Treasury; (2) money market funds; (3) short term bond ETFs and/or (4) corporate debt securities, such as commercial paper and other short-term unsecured promissory notes issued by businesses that are rated investment grade or of comparable quality as collateral for the Fund’s swap agreements |
| | | | | | |
| Top 10 Holdings | | | | Sector Breakdown | |
| | | | | | |
| META Equity Swap | 60.95% | | | Total Return Swap | 60.95% |
| United States Treasury Bills | 21.95% | | | U.S. Government | 21.95% |
| Cash | 17.10% | | | Cash | 17.10% |
| Top 10 Holdings | 100.00% | | | | |
| | | | | | |
Material Fund Changes There were no material fund changes during the year. Changes in or Disagreements with Accountants There were no disagreements reported by the accountants. Householding If you wish to receive a copy of this document at a new address, contact (844) 476 8747 or send an email to info@graniteshares.com |
| | |
| GraniteShares 2x Long META Daily ETF NASDAQ: FBL | |
| Annual Shareholder Report – June 30, 2024 |
| | |
| | |
| | |
| | |
| | |
Past performance does not guarantee futures results. Call (844) 476 8747 or send an email to info@graniteshares.com for current performance questions. If you wish to view additional information about the Fund, including but not limited to the financial statements and holdings, please visit www.graniteshares.com Phone: (844) 476 8747 – email: info@graniteshares.com |
| GraniteShares HIPS US High Income ETF | |
| NYSE: HIPS | Annual Shareholder Report – June 30, 2024 |
| | |
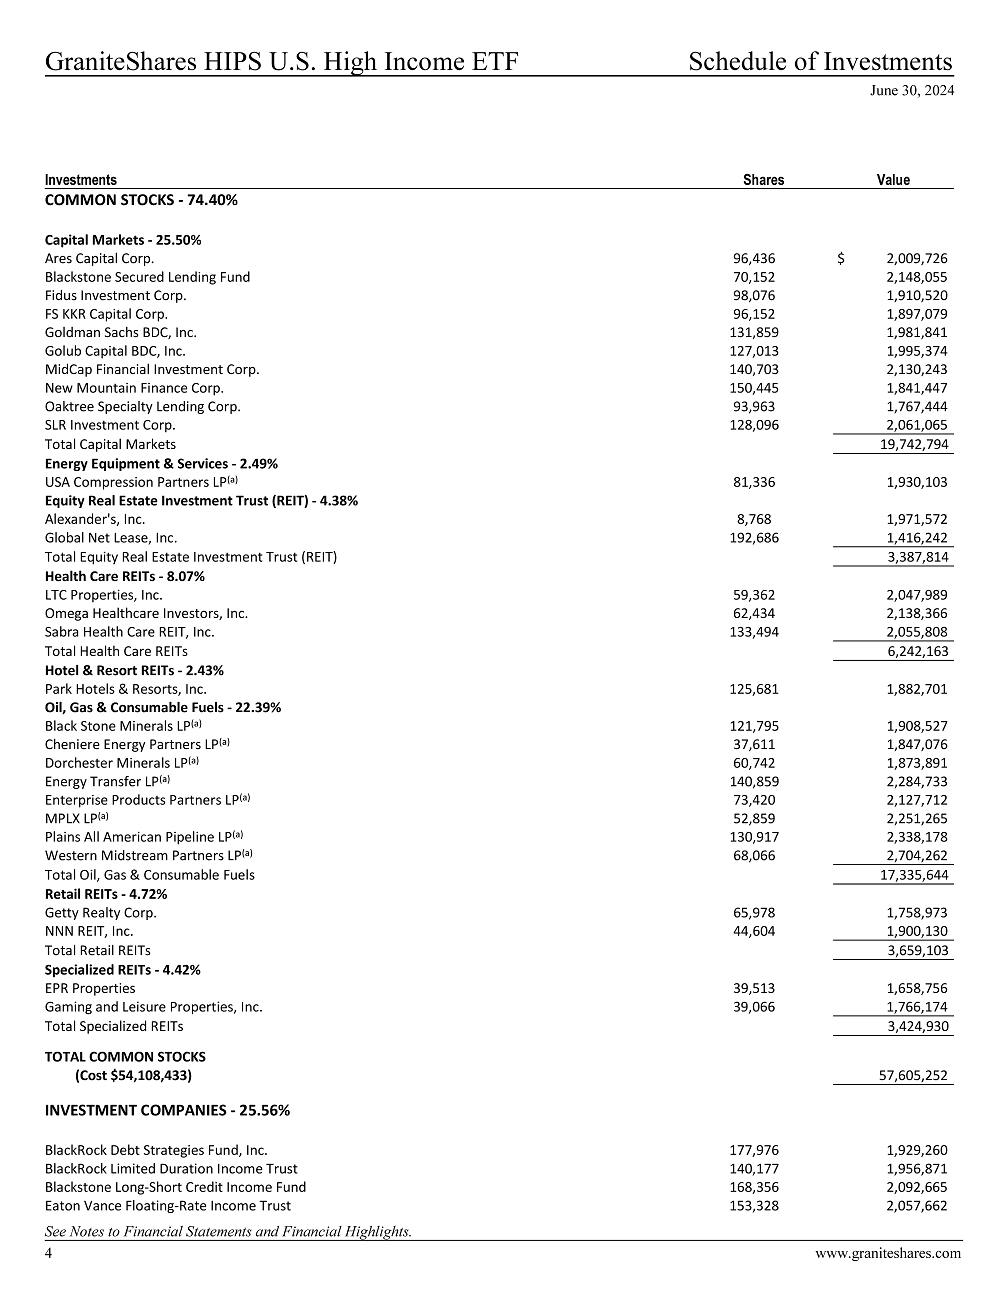
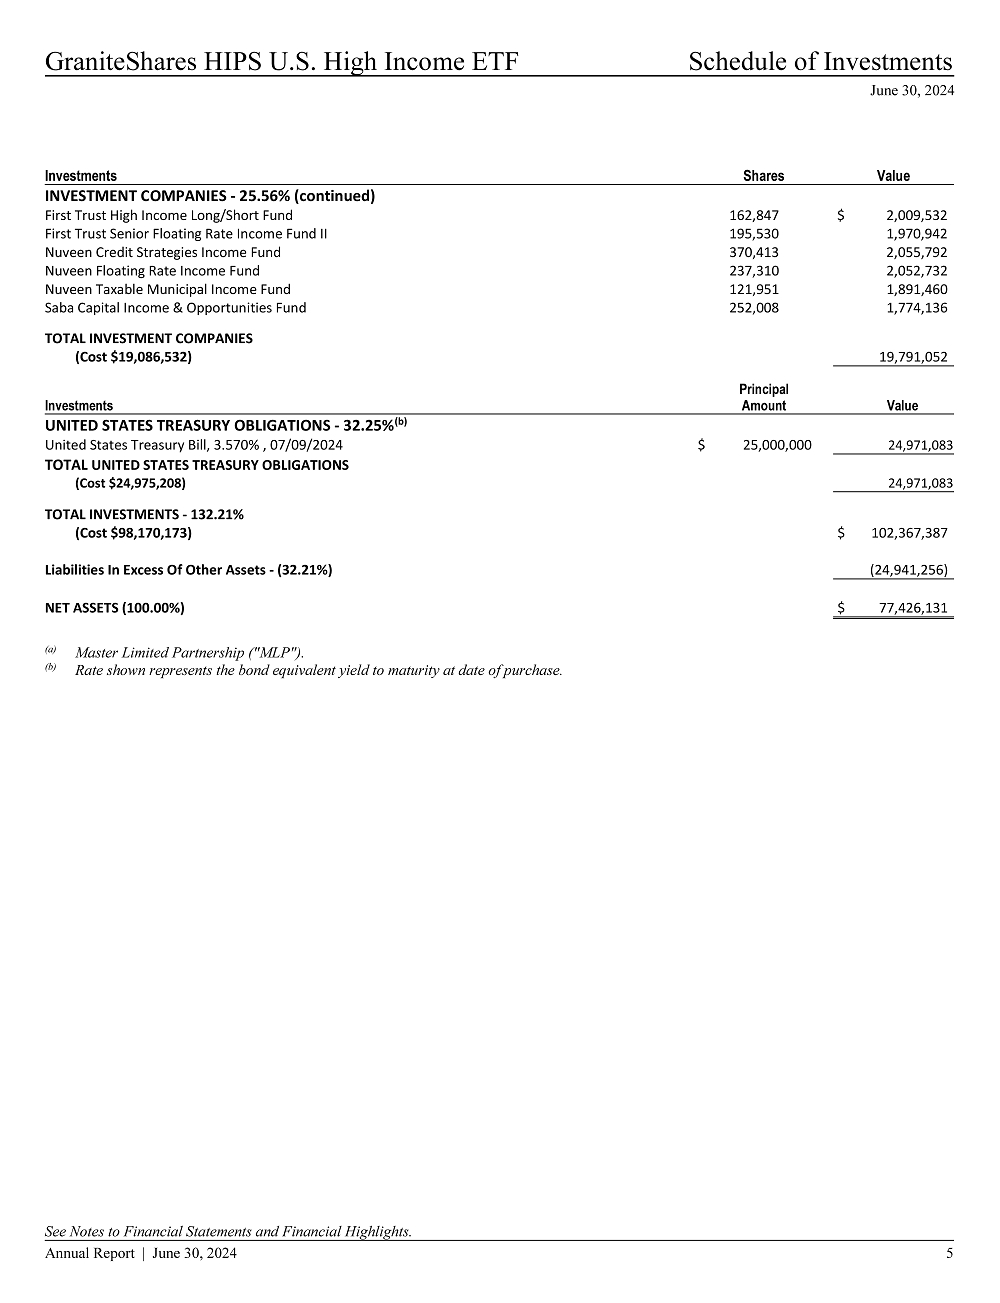
Fund Overview The GraniteShares HIPS US High Income ETF seeks to track the performance, before fees and expenses, of the EQM High Income Pass-Through Securities Index (Index 1). From inception on January 05, 2015, to March 15, 2023, the Fund sought to provide investment results that, before fees and expenses, correspond generally to the total return performance of the TFMS HIPS index (Index 2). The Benchmark represents a combination of the performances of Index 1 and Index 2. You can find additional information about the Fund at www.graniteshares.com You can request this information by calling at (844) 476 8747 or send email to info@graniteshares.com |
| |
How did the fund perform last fiscal year During the 1-year period starting June 30, 2023, to June 30, 2024, the Fund had a 19.08% return.
|
| |
| Over the same period the Benchmark had a return of 19.93%. |
What were the fund’s costs for the year (based on hypothetical $10,000 investment) |
| Cost of a $10,000 Investment | | Cost paid as % of a $10,000 investment | |
| | | | |
| $70 | | 0.70% | |
How did the fund perform since inception The $10,000 chart reflects a hypothetical $10,000 investment in the Fund. The chart uses total return NAV performance and assumes reinvestment of dividend and capital gains. The NAV performance includes all fund expenses. 
|
Average Annual Total Returns (as of June 30, 2024) | | | | | |
| | | | | | | | | | |
| | | 1 Year | | 3 Years | | 5 Years | | Since Inception | |
| | | | | | | | | (Jan 05, 2015) | |
| | | | | | | | | | |
| NAV | | | 19.08 | % | | | 2.83 | % | | | 4.20 | % | | | 3.88 | % |
| Price | | | 20.36 | % | | | 3.10 | % | | | 4.25 | % | | | 3.96 | % |
| Benchmark(1) | | | 19.93 | % | | | 3.52 | % | | | 4.90 | % | | | 4.60 | % |
| (1) | From inception to 03.15.23 the Fund aimed to track before fees and expenses the TFMS HIPS Index. Since 03.16.23 the Fund aims to track before fees and expenses the EQM High Income Pass-Through Securities Index |
Fund Statistics (as of June 30, 2024) |
| | | |
| Total Net Assets | | $ | 77,426,131 | |
| Advisory Fees Paid | | $ | 443,200. | |
| Portfolio Turnover | | | 43 | % |
| (1) | | From inception to 03.15.23 the Fund aimed to track before fees and expenses the TFMS HIPS Index. Since 03.16.23 the Fund aims to track before fees and expenses the EQM High Income Pass-Through Securities Index |
What does the Fund invest in? The Fund attempts to invest all, or substantially all, of its assets in the securities that make up the EQM High Income Pass-Through Securities Index. |
| | | | | | |
| Top 10 Holdings | | | | Sector Breakdown | |
| | | | | | |
| United States Treasury Bills | 24.86% | | | Financial | 37.46% |
| Western Midstream Partners LP | 2.63% | | | U.S. Government | 24.39% |
| Plains All American Pipeline LP | 2.27% | | | Closed End Funds | 19.33% |
| Energy Transfer LP | 2.22% | | | Energy | 18.82% |
| MPLX LP | 2.19% | | | | |
| Blackstone Secured | | | | | |
| Lending Fund | 2.09% | | | | |
| Omega Healthcare | | | | | |
| Investors Inc | 2.08% | | | | |
| MidCap Financial | | | | | |
| Investment Corp | 2.07% | | | | |
| Enterprise Products LP | 2.07% | | | | |
| Blackstone Long-Short Credit | | | | | |
| Income Fund | 2.03% | | | | |
| Top Ten Holdings | 44.51% | | | | |
| | | | | | |
Material Fund Changes There were no material fund changes during the year. Changes in or Disagreements with Accountants There were no disagreements reported by the accountants. Householding If you wish to receive a copy of this document at a new address, contact (844) 476 8747 or send an email to info@graniteshares.com |
| | |
| GraniteShares HIPS US High Income ETF | |
| NYSE: HIPS | Annual Shareholder Report – June 30, 2024 |
| | |
| | |
| | |
| | |
| | |
Past performance does not guarantee futures results. Call (844) 476 8747 or send an email to info@graniteshares.com for current performance questions. If you wish to view additional information about the Fund, including but not limited to the financial statements and holdings, please visit www.graniteshares.com Phone: (844) 476 8747 – email: info@graniteshares.com |
| GraniteShares 2x Long MSFT Daily ETF | |
| NASDAQ: MSFL | Annual Shareholder Report – June 30, 2024 |
| | |
Fund Overview The Fund seeks daily investment results, before fees and expenses, of 2 times (200%) the daily percentage change of the common stock of Microsoft Corp. (NASDAQ: MSFT). You can find additional information about the Fund at www.graniteshares.com You can request this information by calling at (844) 476 8747 or send email to info@graniteshares.com |
| |
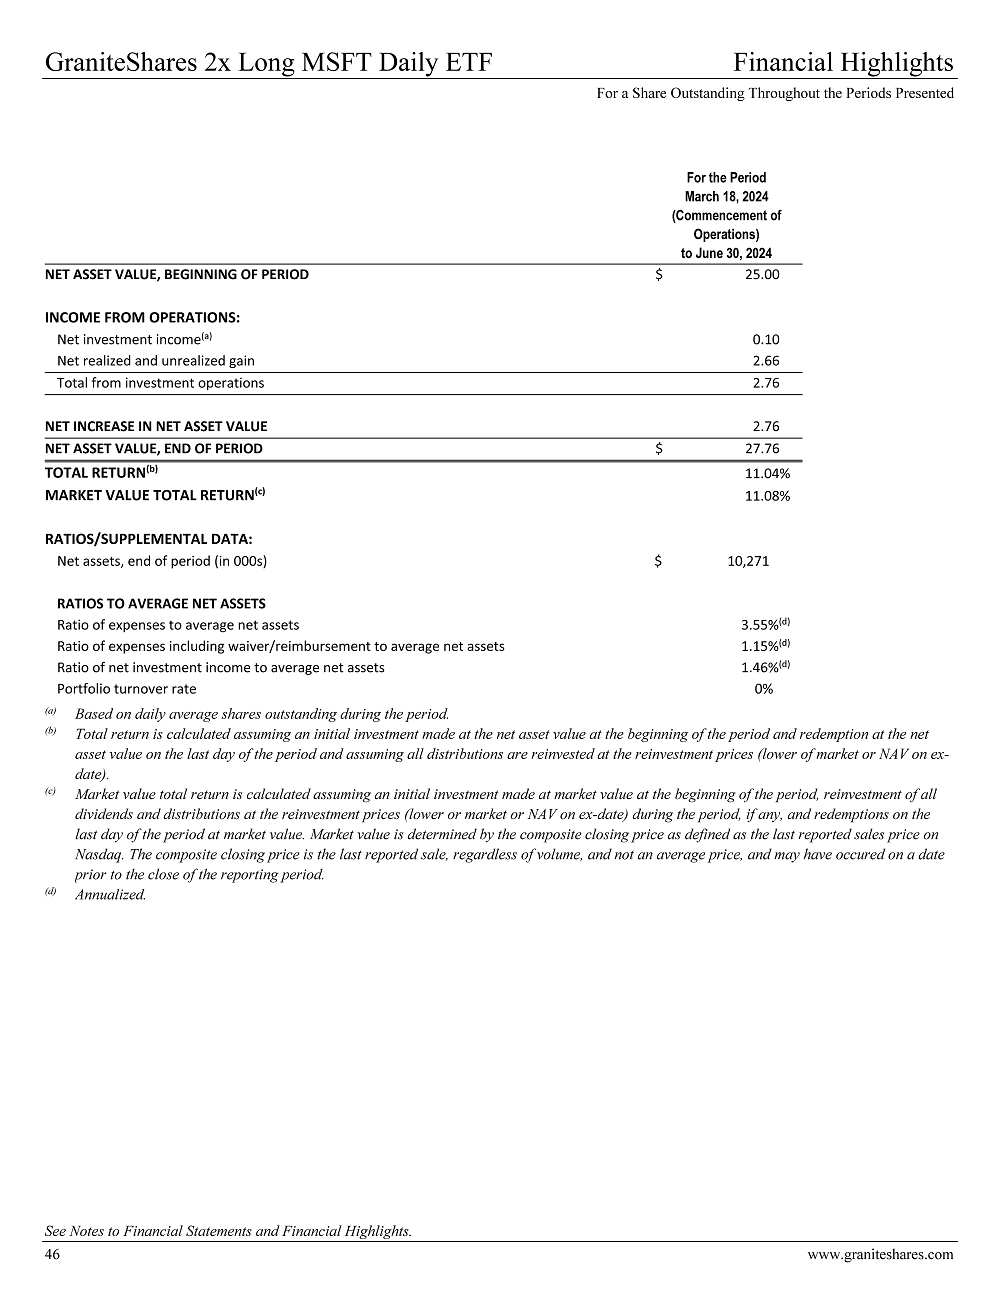
How did the fund perform since inception Since inception on March 18, 2024, to June 30, 2024, the Fund had a 11.04% return. |
| |
| Over the same period the common stock of Microsoft Corp. (NASDAQ: MSFT) had a return of 7.52% and the S&P 500 Index (the Benchmark) a return of 7.12% |
What were the fund’s costs for the year (based on hypothetical $10,000 investment) |
| Cost of a $10,000 Investment | | Cost paid as % of a $10,000 investment | |
| | | | |
| $115 | | 1.15% | |
How did the fund perform since inception The $10,000 chart reflects a hypothetical $10,000 investment in the Fund. The chart uses total return NAV performance and assumes reinvestment of dividend and capital gains. The NAV performance includes all fund expenses. 
|
Average Annual Total Returns (Returns for periods of less than one year are not annualized) (as of June 30, 2024) | |
| | | | |
| | | Since Inception | |
| | | (March 18 2024) | |
| NAV | | | 11.04 | % |
| Price | | | 11.08 | % |
| S&P 500 Total Return Index | | | 7.12 | % |
Fund Statistics (as of June 30, 2024) |
| | | |
| Total Net Assets | | $ | 10,270,859 | |
| Advisory Fees Paid | | $ | 10,693 | |
| Portfolio Turnover | | | 0 | % |
What does the Fund invest in? The Fund enters into one or more swap agreements with major financial institutions for a specified period whereby the Fund and the financial institution will agree to exchange the return (or differentials in rates of return) earned or realized on the common stock of Coinbase Global Inc. The Fund may invest in (1) U.S. Government securities, such as bills, notes and bonds issued by the U.S. Treasury; (2) money market funds; (3) short term bond ETFs and/or (4) corporate debt securities, such as commercial paper and other short-term unsecured promissory notes issued by businesses that are rated investment grade or of comparable quality as collateral for the Fund’s swap agreements |
| | | | | | |
| Top 10 Holdings | | | | Sector Breakdown | |
| | | | | | |
| MSFT Equity Swap | 86.08% | | | Total Return Swap | 86.08% |
| Cash | 13.92% | | | Cash | 13.92% |
| Top 10 Holdings | 100.00% | | | | |
| | | | | | |
Material Fund Changes There were no material fund changes during the year. Changes in or Disagreements with Accountants There were no disagreements reported by the accountants. Householding If you wish to receive a copy of this document at a new address, contact (844) 476 8747 or send an email to info@graniteshares.com |
| | |
| GraniteShares 2x Long MSFT Daily ETF NASDAQ: MSFL | |
| Annual Shareholder Report – June 30, 2024 |
| | |
| | |
| | |
| | |
| | |
Past performance does not guarantee futures results. Call (844) 476 8747 or send an email to info@graniteshares.com for current performance questions. If you wish to view additional information about the Fund, including but not limited to the financial statements and holdings, please visit www.graniteshares.com Phone: (844) 476 8747 – email: info@graniteshares.com |
| GraniteShares 2x Short NVDA Daily ETF | |
| NASDAQ: NVD | Annual Shareholder Report – June 30, 2024 |
| | |
Fund Overview The Fund seeks daily investment results, before fees and expenses, of inverse 2 times (-200%) the daily percentage change of the common stock of NVIDIA Corp. (NASDAQ: NVDA). You can find additional information about the Fund at www.graniteshares.com You can request this information by calling at (844) 476 8747 or send email to info@graniteshares.com |
| |
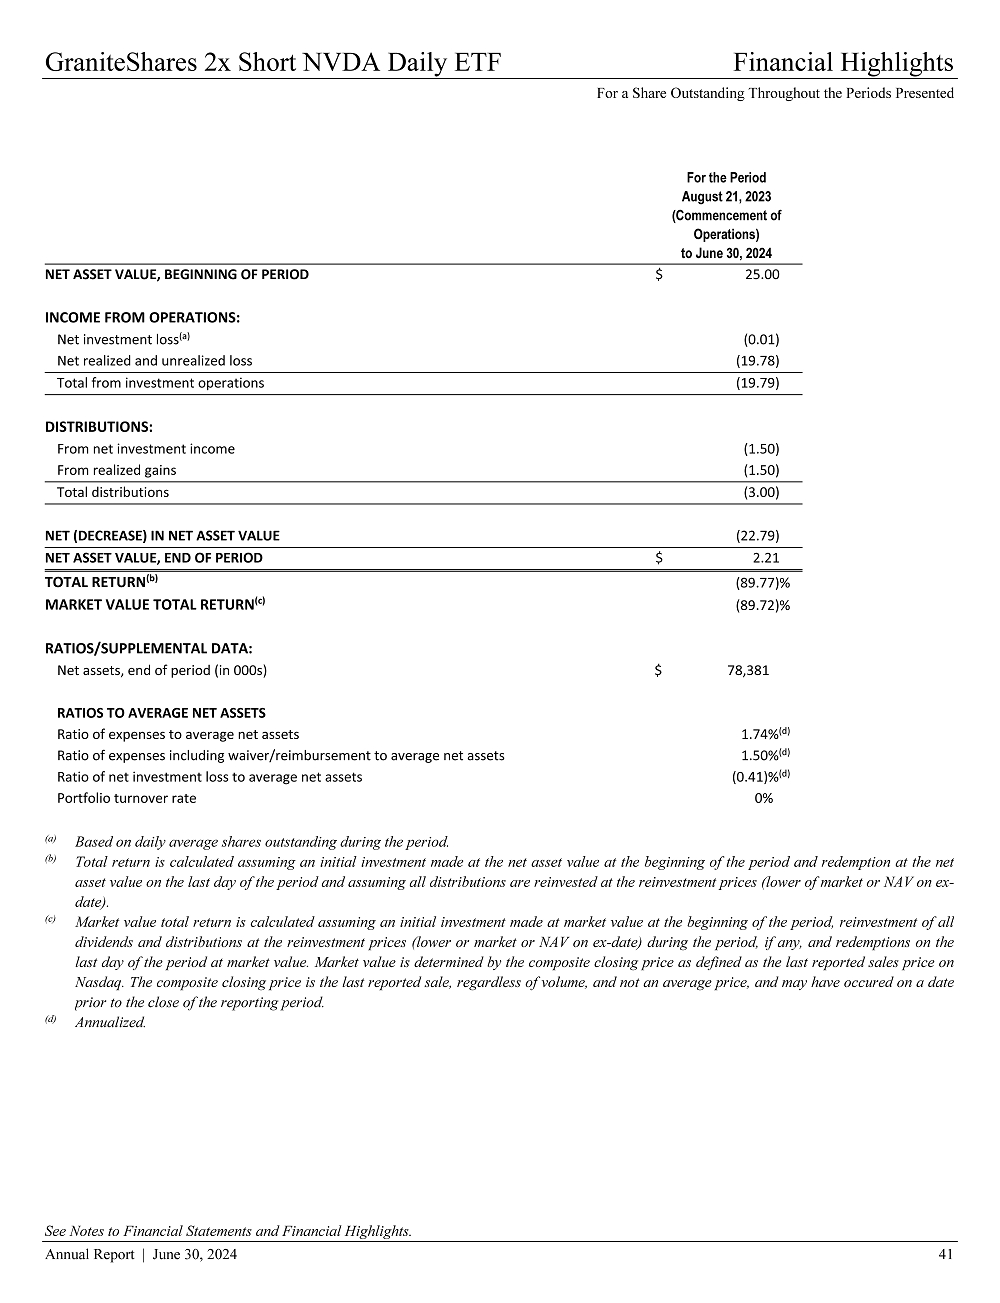
How did the fund perform since inception Since inception on August 21, 2023, to June 30, 2024, the Fund had a -89.77% return. |
| |
| Over the same period the common stock of NVIDIA Corp (NASDAQ: NVDA) had a return of 170.60% and the S&P 500 Index (the Benchmark) a return of 25.72% |
| |
What were the fund’s costs for the year (based on hypothetical $10,000 investment) |
Cost of a $10,000
Investment | | Cost paid as % of a
$10,000 investment | |
| | | | |
| $150 | | 1.50% | |
How did the fund perform since inception The $10,000 chart reflects a hypothetical $10,000 investment in the Fund. The chart uses total return NAV performance and assumes reinvestment of dividend and capital gains. The NAV performance include all fund expenses. 
|
Average Annual Total Returns (Returns for periods of less than one year are not annualized) (as of June 30, 2024) | |
| | | | |
| | | Since Inception | |
| | | (Aug 21, 2023) | |
| NAV | | | (89.77 | )% |
| Price | | | (89.72 | )% |
| S&P 500 Total Return Index | | | 25.72 | % |
Fund Statistics (as of June 30, 2024) |
| | | |
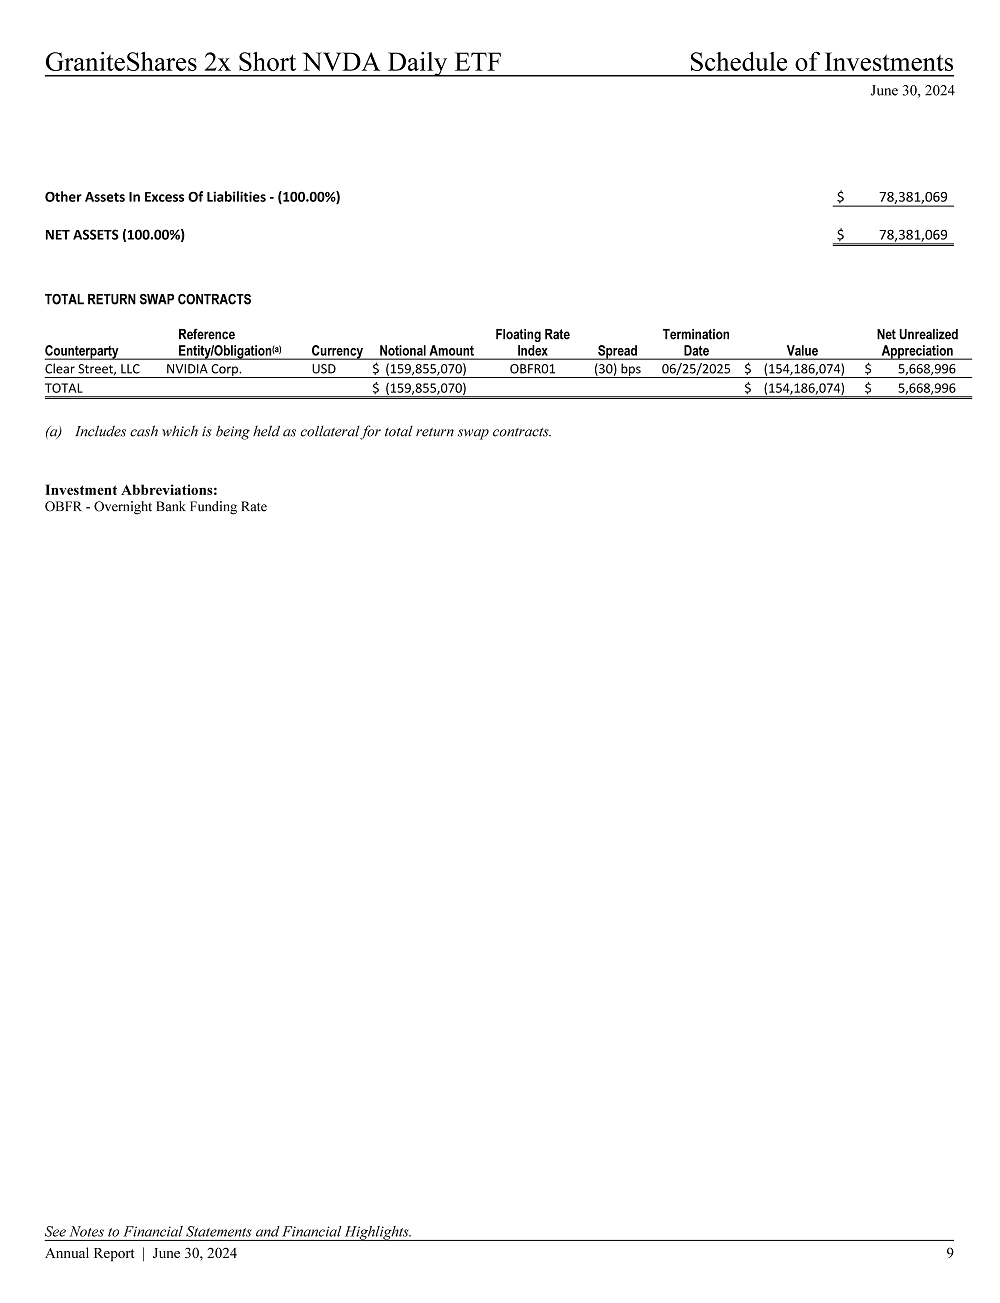
| Total Net Assets | | $ | 78,381,069 | |
| Advisory Fees Paid | | $ | 196,261 | |
| Portfolio Turnover | | | 0 | % |
What does the Fund invest in? The Fund enters into one or more swap agreements with major financial institutions for a specified period whereby the Fund and the financial institution will agree to exchange the return (or differentials in rates of return) earned or realized on the common stock of Coinbase Global Inc. The Fund may invest in (1) U.S. Government securities, such as bills, notes and bonds issued by the U.S. Treasury; (2) money market funds; (3) short term bond ETFs and/or (4) corporate debt securities, such as commercial paper and other short-term unsecured promissory notes issued by businesses that are rated investment grade or of comparable quality as collateral for the Fund’s swap agreements |
| | | | | | |
| Top 10 Holdings | | | | Sector Breakdown | |
| | | | | | |
| NVDA Equity Swap | 58.88% | | | Total Return Swap | 58.88% |
| Cash | 41.12% | | | Cash | 41.12% |
| Top 10 Holdings | 100.00% | | | | |
| | | | | | |
Material Fund Changes There were no material fund changes during the year. Changes in or Disagreements with Accountants There were no disagreements reported by the accountants. Householding If you wish to receive a copy of this document at a new address, contact (844) 476 8747 or send an email to info@graniteshares.com |
| | |
GraniteShares 2x Short NVDA Daily ETF | |
| NASDAQ: NVD | Annual Shareholder Report – June 30, 2024 |
| | |
| | |
| | |
| | |
| | |
Past performance does not guarantee futures results. Call (844) 476 8747 or send an email to info@graniteshares.com for current performance questions. If you wish to view additional information about the Fund, including but not limited to the financial statements and holdings, please visit www.graniteshares.com Phone: (844) 476 8747 – email: info@graniteshares.com |
GraniteShares 2x Long NVDA Daily ETF | |
| NASDAQ: NVDL | Annual Shareholder Report – June 30, 2024 |
| | |
Fund Overview The Fund seeks daily investment results, before fees and expenses, of 2 times (200%) the daily percentage change of the common stock of NVIDIA Corp. (NASDAQ: NVDA). You can find additional information about the Fund at www.graniteshares.com You can request this information by calling at (844) 476 8747 or send email to info@graniteshares.com |
How did the fund perform last fiscal year
During the 1-year period starting June 30, 2023, to June 30, 2024, the Fund had 450.96% return.
Over the same period the common stock of NVIDIA Corp. (NASDAQ: NVDA) had a return of 192.13% and the S&P 500 Index (the Benchmark) a return of 24.56%
| |
What were the fund’s costs for the year (based on hypothetical $10,000 investment) |
| Cost of a $10,000 Investment | | Cost paid as % of a $10,000 investment | |
| | | | |
| $106 | | 1.06% | |
How did the fund perform since inception The $10,000 chart reflects a hypothetical $10,000 investment in the Fund. The chart uses total return NAV performance and assumes reinvestment of dividend and capital gains. The NAV performance includes all fund expenses. 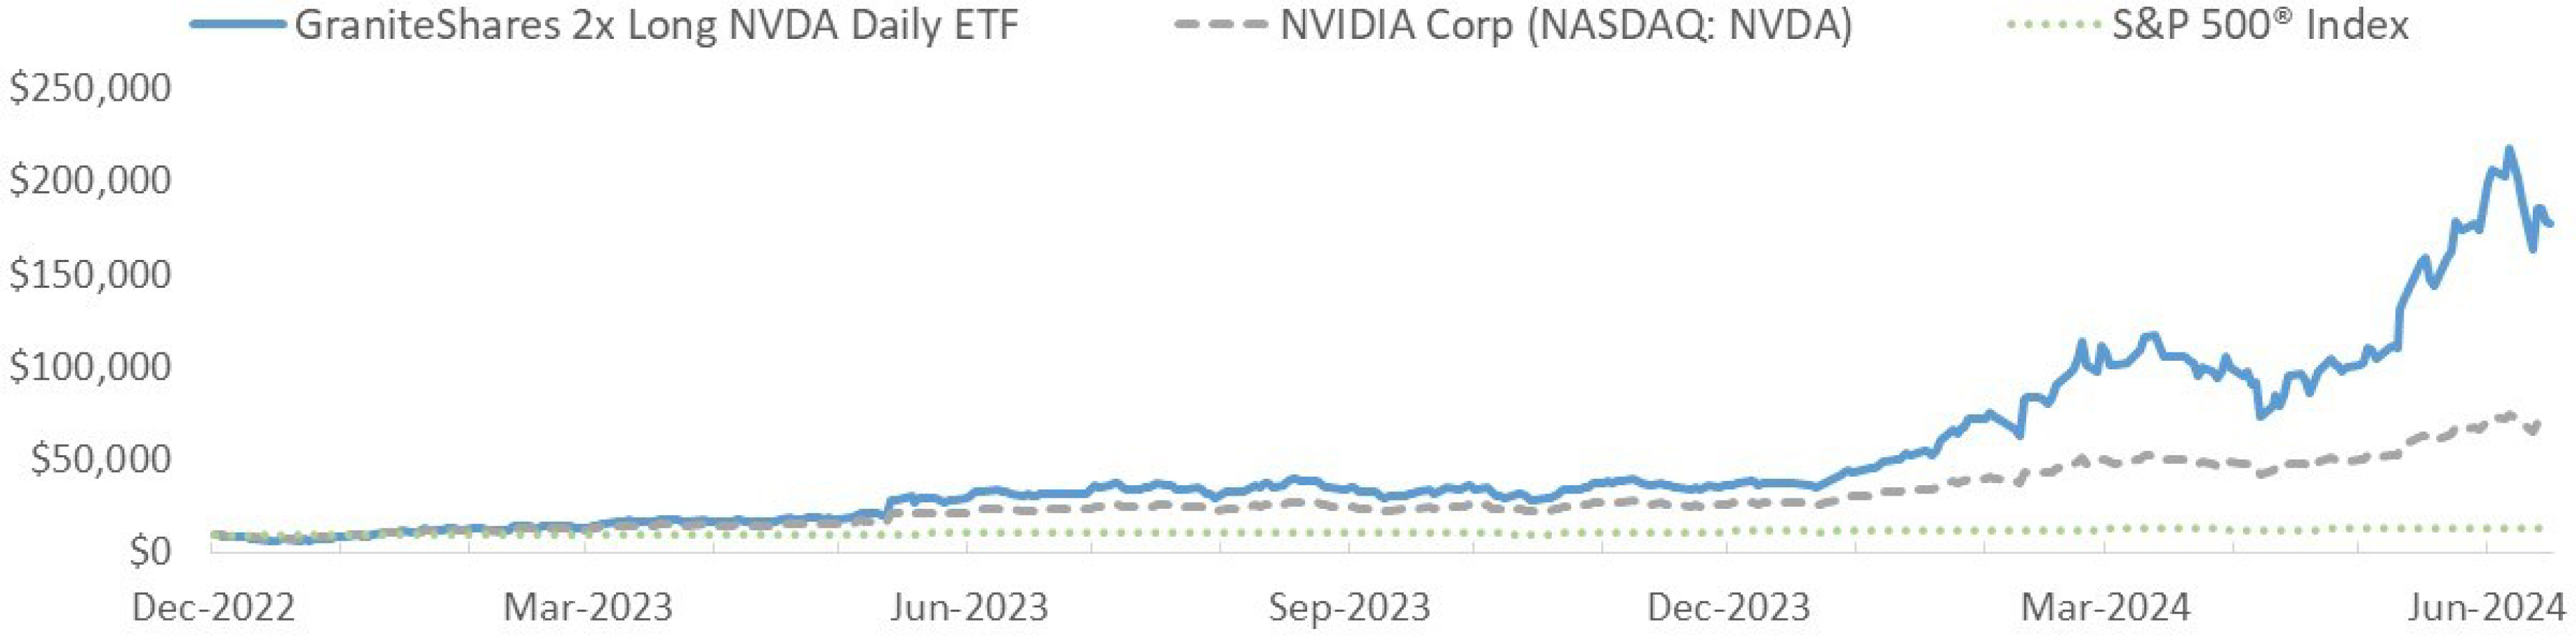
|
Average Annual Total Returns (as of June 30, 2024) | |
| | | | | | |
| | | 1 Year | | Since Inception | |
| | | | | (Dec 12, 2022) | |
| NAV | | | 450.96 | % | | | 560.86 | % |
| Price | | | 452.02 | % | | | 560.67 | % |
| S&P 500 Total Return Index | | | 24.56 | % | | | 24.41 | % |
Fund Statistics (as of June 30, 2024) |
| | | |
| Total Net Assets | | $ | 4,723,553,931 | |
| Advisory Fees Paid | | $ | 9,406,158 | |
| Portfolio Turnover | | | 11,811 | % |
What does the Fund invest in? The Fund enters into one or more swap agreements with major financial institutions for a specified period whereby the Fund and the financial institution will agree to exchange the return (or differentials in rates of return) earned or realized on the common stock of Coinbase Global Inc. The Fund may invest in (1) U.S. Government securities, such as bills, notes and bonds issued by the U.S. Treasury; (2) money market funds; (3) short term bond ETFs and/or (4) corporate debt securities, such as commercial paper and other short-term unsecured promissory notes issued by businesses that are rated investment grade or of comparable quality as collateral for the Fund’s swap agreements |
| | | | | | | |
| Top 10 Holdings | | | | Sector Breakdown | | |
| | | | | | | |
| NVDA Equity Swap | 66.67% | | | Total Return Swap | 66.67% | |
| United States Treasury Bills | 18.43% | | | U.S. Government | 18.43% | |
| Cash | 12.99% | | | Cash | 12.99% | |
| NVDA Stock | 1.21% | | | Technology | 1.21% | |
| Options | 0.70% | | | Options | 0.70% | |
| Top Ten Holdings | 100.00% | | | | | |
| | | | | | | |
Material Fund Changes There were no material fund changes during the year. Changes in or Disagreements with Accountants There were no disagreements reported by the accountants. Householding If you wish to receive a copy of this document at a new address, contact (844) 476 8747 or send an email to info@graniteshares.com |
| | |
| GraniteShares 2x Long NVDA Daily ETF | |
| NASDAQ: NVDL | Annual Shareholder Report – June 30, 2024 |
| | |
| | |
| | |
| | |
| | |
Past performance does not guarantee futures results. Call (844) 476 8747 or send an email to info@graniteshares.com for current performance questions. If you wish to view additional information about the Fund, including but not limited to the financial statements and holdings, please visit www.graniteshares.com Phone: (844) 476 8747 – email: info@graniteshares.com |
| GraniteShares 2x Short TSLA Daily ETF | |
| NASDAQ: TSDD | Annual Shareholder Report – June 30, 2024 |
| | |
Fund Overview The Fund seeks daily investment results, before fees and expenses, of inverse 2 times (-200%) the daily percentage change of the common stock of Tesla Inc (NASDAQ: TSLA). You can find additional information about the Fund at www.graniteshares.com You can request this information by calling at (844) 476 8747 or send email to info@graniteshares.com |
How did the fund perform since inception
Since inception on August 21, 2023, to June 30, 2024, the Fund had a - 21.22% return.
Over the same period the common stock of Tesla Inc. (NASDAQ: TSLA) had a return of -15.14% and the S&P 500 Index (the Benchmark) a return of 25.72%
What were the fund’s costs for the year
(based on hypothetical $10,000 investment)
Cost of a $10,000
Investment | | Cost paid as % of a
$10,000 investment | |
| | | | |
| $150 | | 1.50% | |
How did the fund perform since inception The $10,000 chart reflects a hypothetical $10,000 investment in the Fund. The chart uses total return NAV performance and assumes reinvestment of dividend and capital gains. The NAV performance include all fund expenses. 
|
Average Annual Total Returns (Returns for periods of less than one year are not annualized) (as of June 30, 2024) | |
| | | | |
| | | Since Inception | |
| | | (Aug 21, 2023) | |
| | | | |
| NAV | | | (21.22 | )% |
| Price | | | (21.22 | )% |
| S&P 500 Total Return Index | | | 25.72 | % |
Fund Statistics (as of June 30, 2024) |
| | | |
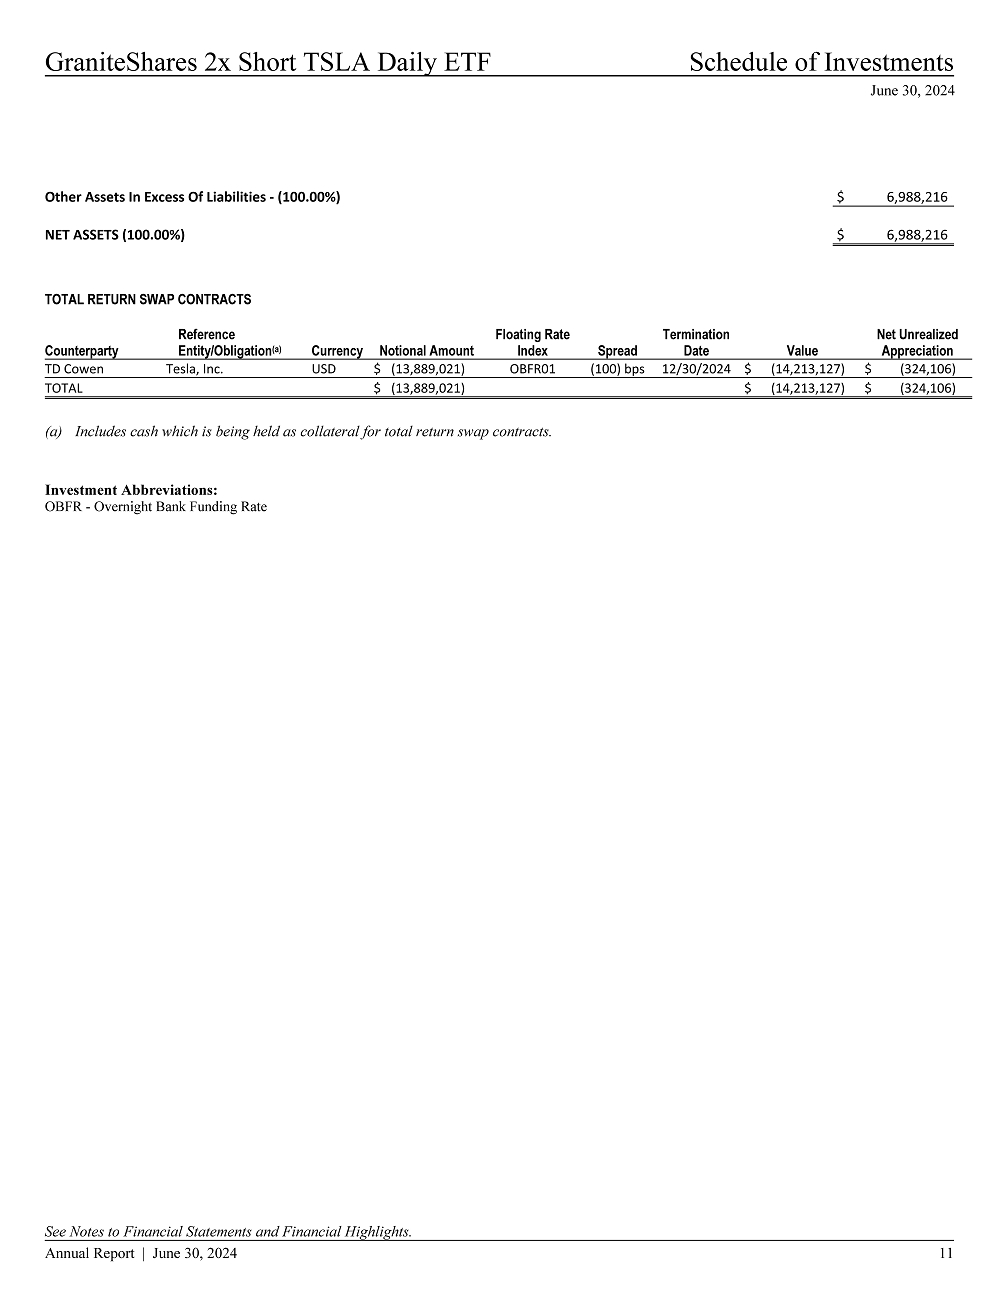
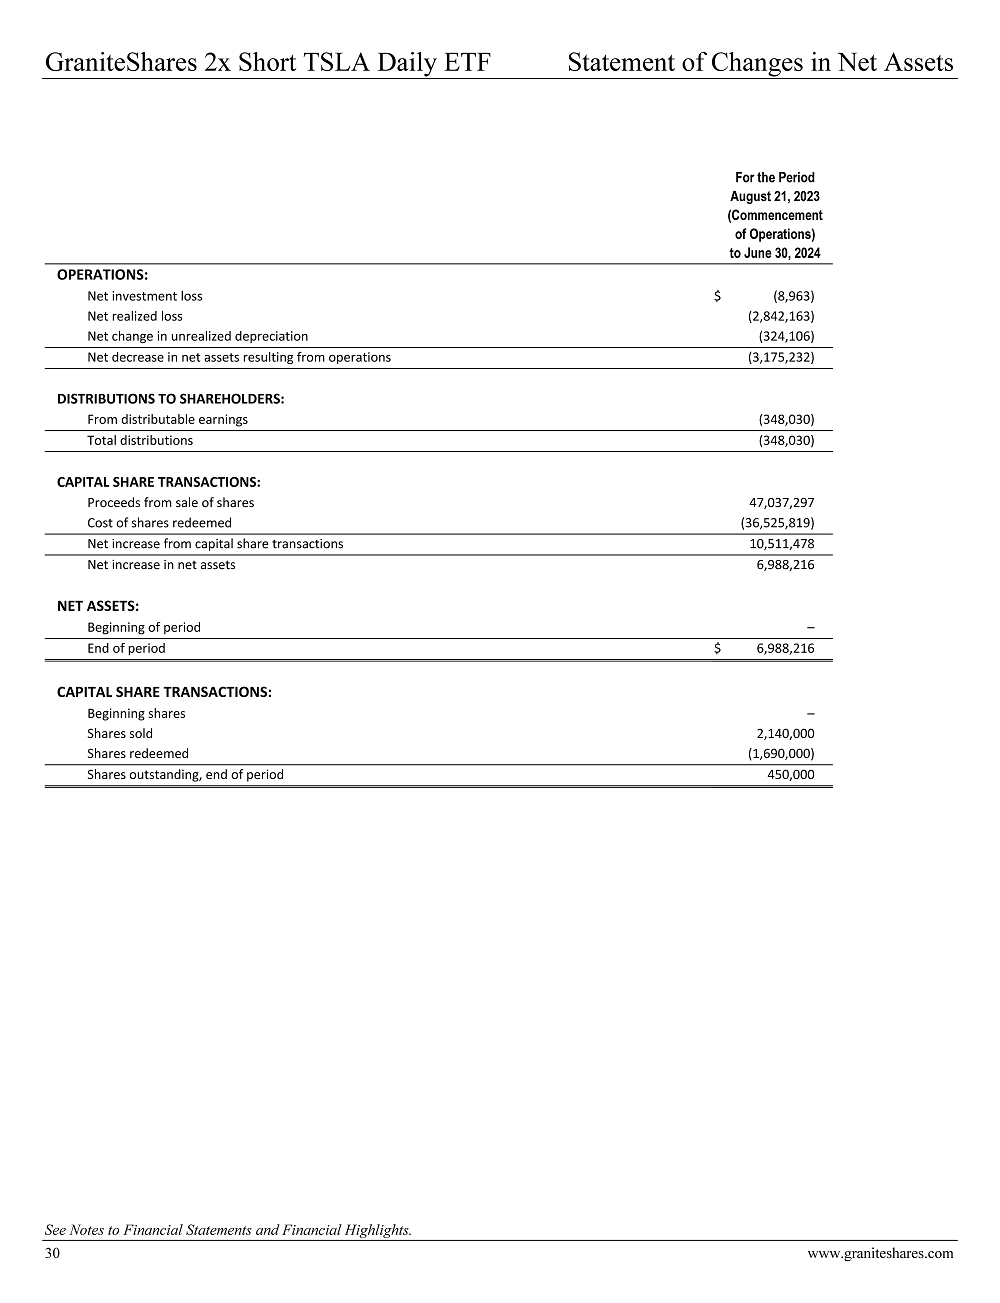
| Total Net Assets | | $ | 6,988,216 | |
| Advisory Fees Paid | | $ | 39,980 | |
| Portfolio Turnover | | | 0 | % |
What does the Fund invest in? The Fund enters into one or more swap agreements with major financial institutions for a specified period whereby the Fund and the financial institution will agree to exchange the return (or differentials in rates of return) earned or realized on the common stock of Tesla Inc. The Fund may invest in (1) U.S. Government securities, such as bills, notes and bonds issued by the U.S. Treasury; (2) money market funds; (3) short term bond ETFs and/or (4) corporate debt securities, such as commercial paper and other short-term unsecured promissory notes issued by businesses that are rated investment grade or of comparable quality as collateral for the Fund’s swap agreements |
| | | | | | |
| Top 10 Holdings | | | | Sector Breakdown | |
| | | | | | |
| TSLA Equity Swap | 63.34% | | | Total Return Swaps | 64.34% |
| Cash | 36.66% | | | Cash | 36.66% |
| Top Ten Holdings | 100.00% | | | | |
| | | | | | |
Material Fund Changes There were no material fund changes during the year. Changes in or Disagreements with Accountants There were no disagreements reported by the accountants. Householding If you wish to receive a copy of this document at a new address, contact (844) 476 8747 or send an email to info@graniteshares.com |
| | |
GraniteShares 2x Short TSLA Daily ETF | |
| NASDAQ: TSDD | Annual Shareholder Report – June 30, 2024 |
| | |
| | |
| | |
| | |
| | |
Past performance does not guarantee futures results. Call (844) 476 8747 or send an email to info@graniteshares.com for current performance questions. If you wish to view additional information about the Fund, including but not limited to the financial statements and holdings, please visit www.graniteshares.com Phone: (844) 476 8747 – email: info@graniteshares.com |
| GraniteShares 1.25x Long TSLA Daily ETF | |
| NASDAQ: TSL | Annual Shareholder Report – June 30, 2024 |
| | |
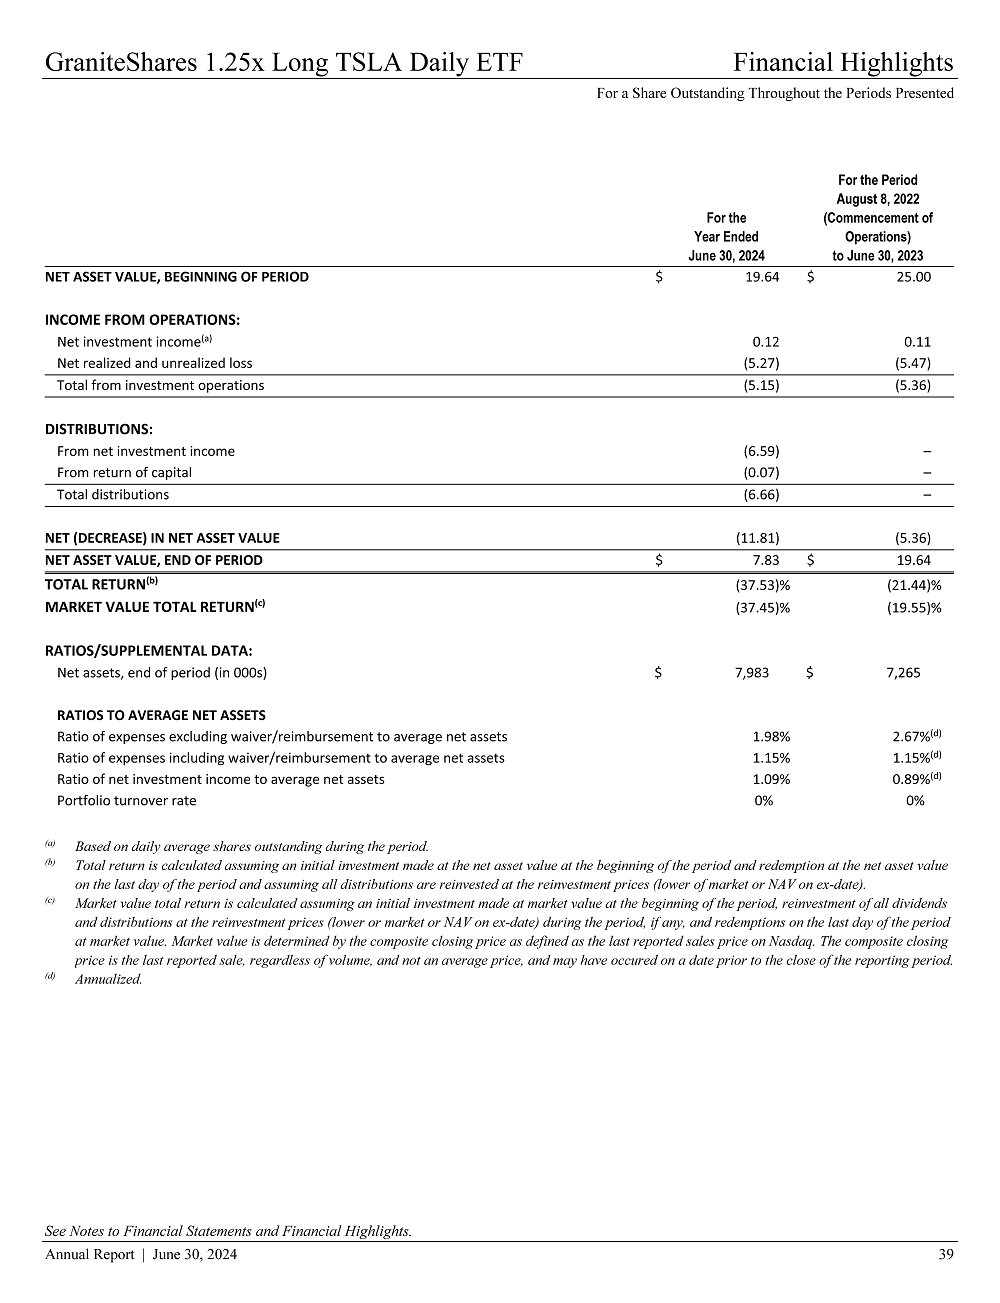
Fund Overview The Fund seeks daily investment results, before fees and expenses, of 1.25 times (125%) the daily percentage change of the common stock of Tesla Inc. (NASDAQ: TSLA). You can find additional information about the Fund at www.graniteshares.com You can request this information by calling at (844) 476 8747 or send email to info@graniteshares.com |
How did the fund perform last fiscal year
During the 1-year period starting June 30, 2023, to June 30, 2024, the Fund had a -37.53% return.
Over the same period the common stock of Tesla Inc. (NASDAǪ: TSLA) had a return of -24.41% and the S&P 500 Index (the Benchmark) a return of 17.65%
What were the fund’s costs for the year
(based on hypothetical $10,000 investment)
Cost of a $10,000
Investment | | Cost paid as % of a
$10,000 investment | |
| | | | |
| $115 | | 1.15% | |
How did the fund perform since inception The $10,000 chart reflects a hypothetical $10,000 investment in the Fund. The chart uses total return NAV performance and assumes reinvestment of dividend and capital gains. The NAV performance includes all fund expenses. 
|
Average Annual Total Returns (as of June 30, 2024) | |
| | | | | | | |
| | | 1 Year | | | Since Inception | |
| | | | | | (Aug 08, 2022) | |
| NAV | | (37.53 | )% | | | (31.88 | )% |
| Price | | (37.45 | )% | | | (31.38 | )% |
| S&P 500 Total Return Index | | 24.56 | % | | | 17.65 | % |
Fund Statistics (as of June 30, 2024) |
| | | |
| Total Net Assets | | $ | 7,982,554 | |
| Advisory Fees Paid | | $ | 58,619 | |
| Portfolio Turnover | | | 0 | % |
What does the Fund invest in? The Fund enters into one or more swap agreements with major financial institutions for a specified period whereby the Fund and the financial institution will agree to exchange the return (or differentials in rates of return) earned or realized on the common stock of Tesla Inc. The Fund may invest in (1) U.S. Government securities, such as bills, notes and bonds issued by the U.S. Treasury; (2) money market funds; (3) short term bond ETFs and/or (4) corporate debt securities, such as commercial paper and other short-term unsecured promissory notes issued by businesses that are rated investment grade or of comparable quality as collateral for the Fund’s swap agreements |
| | | | | | |
| Top 10 Holdings | | | | Sector Breakdown | |
| | | | | | |
| TSLA Equity Swap | 77.54% | | | Total Return Swap | 77.54% |
| Cash | 22.46% | | | Cash | 22.46% |
| Top 10 Holdings | 100.00% | | | | |
| | | | | | |
Material Fund Changes There were no material fund changes during the year. Changes in or Disagreements with Accountants There were no disagreements reported by the accountants. Householding If you wish to receive a copy of this document at a new address, contact (844) 476 8747 or send an email to info@graniteshares.com |
| | |
GraniteShares 1.25x Long TSLA Daily ETF | |
| NASDAQ: TSL | Annual Shareholder Report – June 30, 2024 |
| | |
| | |
| | |
| | |
| | |
Past performance does not guarantee futures results. Call (844) 476 8747 or send an email to info@graniteshares.com for current performance questions. If you wish to view additional information about the Fund, including but not limited to the financial statements and holdings, please visit www.graniteshares.com Phone: (844) 476 8747 – email: info@graniteshares.com |
| GraniteShares 2x Long TSLA Daily ETF | |
| NASDAQ: TSLR | Annual Shareholder Report – June 30, 2024 |
| | |
Fund Overview The Fund seeks daily investment results, before fees and expenses, of 2 times (200%) the daily percentage change of the common stock of Tesla Inc. (NASDAQ: TSLA). You can find additional information about the Fund at www.graniteshares.com You can request this information by calling at (844) 476 8747 or send email to info@graniteshares.com |
How did the fund perform since inception
Since inception on August 21, 2023, to June 30, 2024, the Fund had a -44.26% return.
Over the same period the common stock of Tesla Inc. (NASDAǪ: TSLA) had a return of -15.14% and the S&P 500 Index (the Benchmark) a return of 25.72%
What were the fund’s costs for the year
(based on hypothetical $10,000 investment)
Cost of a $10,000
Investment | | Cost paid as % of a
$10,000 investment | |
| | | | |
| $150 | | 1.50% | |
How did the fund perform since inception The $10,000 chart reflects a hypothetical $10,000 investment in the Fund. The chart uses total return NAV performance and assumes reinvestment of dividend and capital gains. The NAV performance includes all fund expenses. 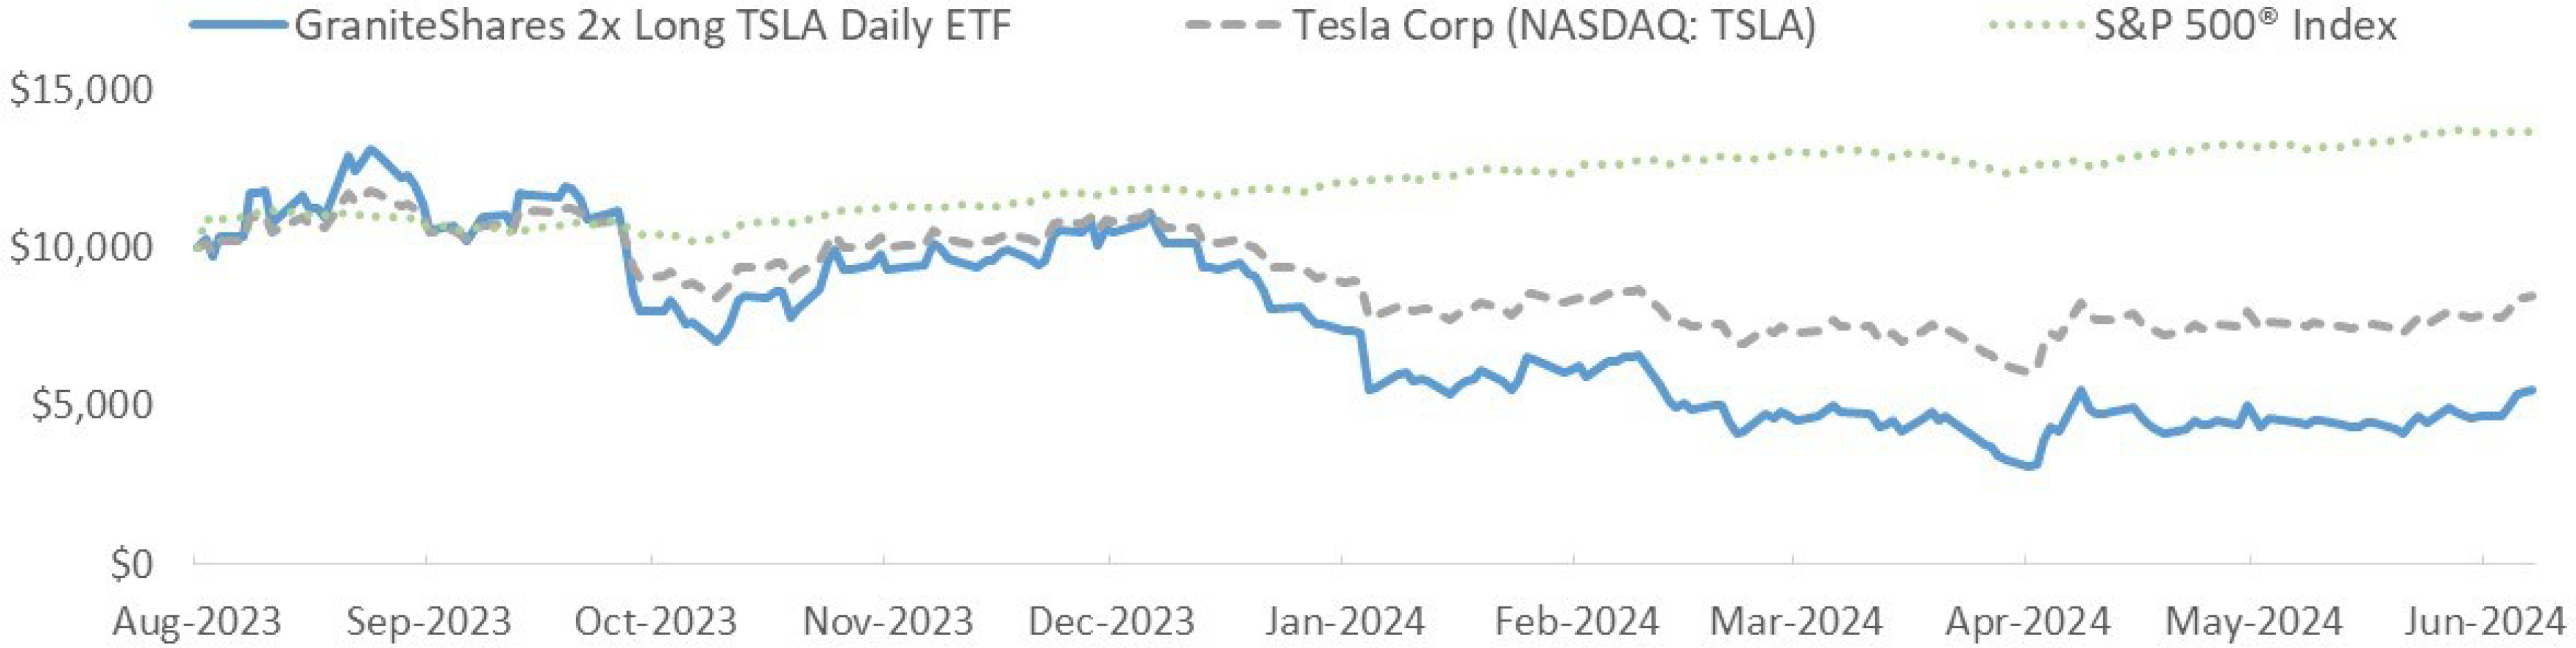
|
Average Annual Total Returns (Returns for periods of less than one year are not annualized) (as of June 30, 2024) | |
| | | | |
| | | Since Inception | |
| | | (Aug 21, 2023) | |
| NAV | | | (44.26 | )% |
| Price | | | (44.22 | )% |
| S&P 500 Total Return Index | | | (0.43 | )% |
Fund Statistics (as of June 30, 2024) |
| | | |
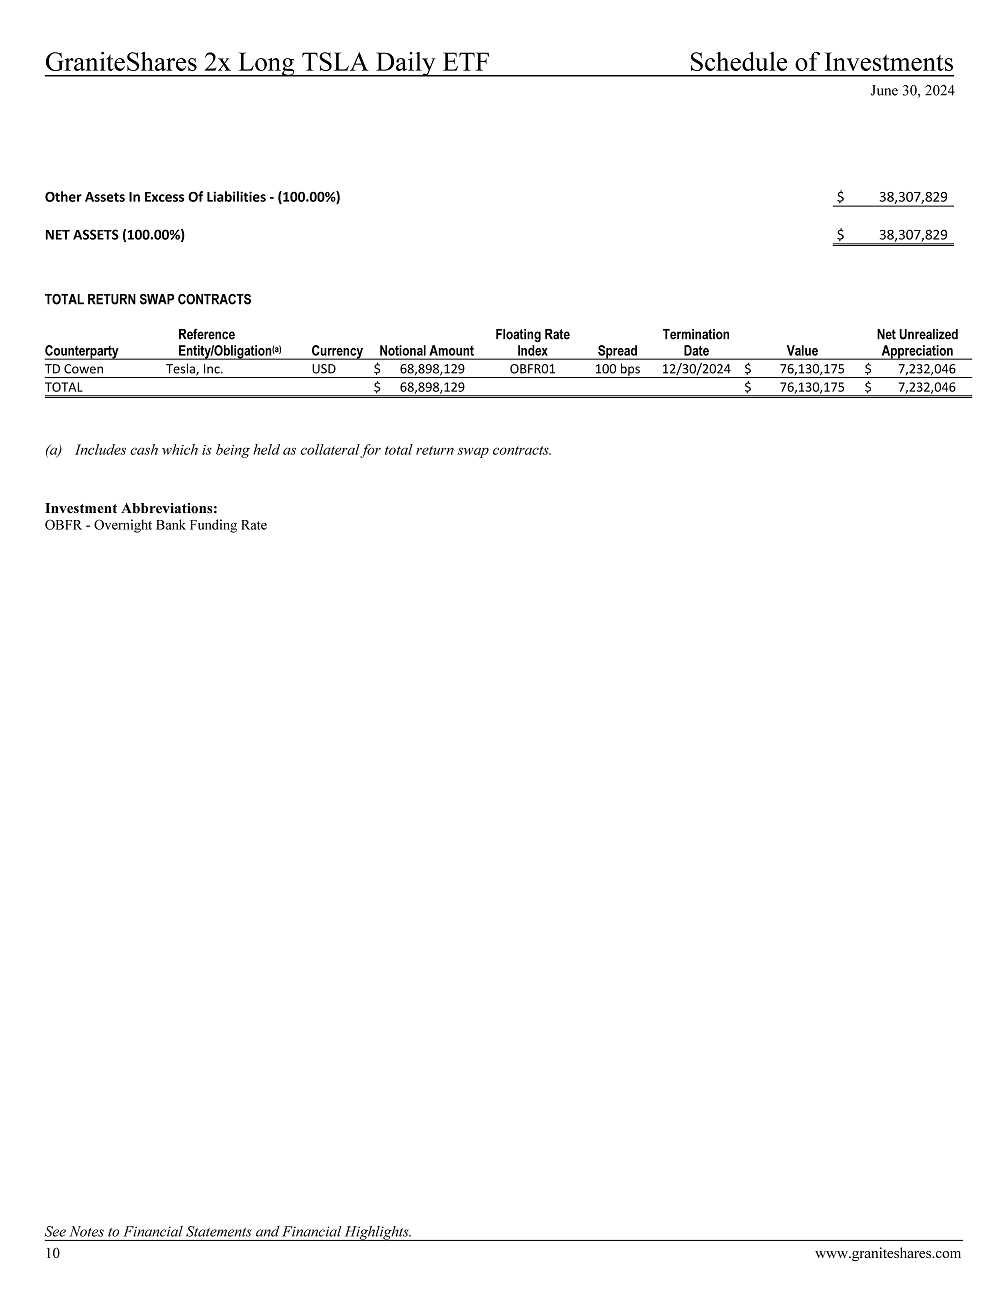
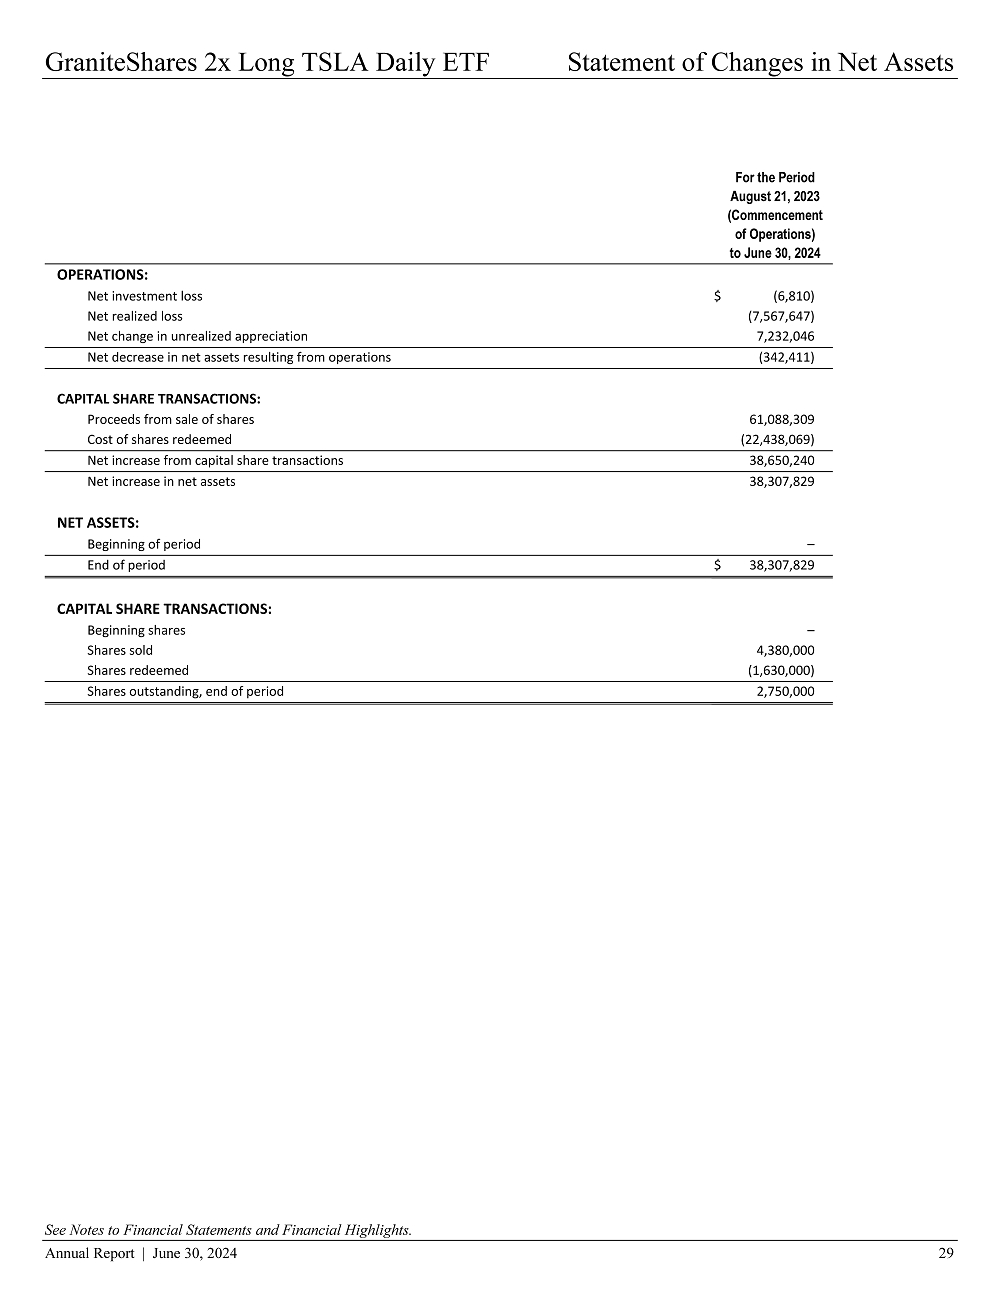
| Total Net Assets | | $ | 38,307,829 | |
| Advisory Fees Paid | | $ | 103,559 | |
| Portfolio Turnover | | | 0 | % |
What does the Fund invest in? The Fund enters into one or more swap agreements with major financial institutions for a specified period whereby the Fund and the financial institution will agree to exchange the return (or differentials in rates of return) earned or realized on the common stock of Tesla Inc. The Fund may invest in (1) U.S. Government securities, such as bills, notes and bonds issued by the U.S. Treasury; (2) money market funds; (3) short term bond ETFs and/or (4) corporate debt securities, such as commercial paper and other short-term unsecured promissory notes issued by businesses that are rated investment grade or of comparable quality as collateral for the Fund’s swap agreements |
| | | | | | |
| Top 10 Holdings | | | | Sector Breakdown | |
| | | | | | |
| TSLA Equity Swap | 77.54% | | | Total Return Swap | 77.54% |
| Cash | 22.46% | | | Cash | 22.46% |
| Top Ten Holdings | 100.00% | | | | |
| | | | | | |
Material Fund Changes There were no material fund changes during the year. Changes in or Disagreements with Accountants There were no disagreements reported by the accountants. Householding If you wish to receive a copy of this document at a new address, contact (844) 476 8747 or send an email to info@graniteshares.com |
| | |
GraniteShares 2x Long TSLA Daily ETF | |
| NASDAQ: TSLR | Annual Shareholder Report – June 30, 2024 |
| | |
| | |
| | |
| | |
| | |
Past performance does not guarantee futures results. Call (844) 476 8747 or send an email to info@graniteshares.com for current performance questions. If you wish to view additional information about the Fund, including but not limited to the financial statements and holdings, please visit www.graniteshares.com Phone: (844) 476 8747 – email: info@graniteshares.com |
Item 2. Code of Ethics.
| | (a) | The registrant, as of the end of the period covered by this report, has adopted a code of ethics that applies to the registrant’s principal executive officer, principal financial officer, principal accounting officer or controller, or persons performing similar functions, regardless of whether these individuals are employed by the registrant or a third party. |
| | (c) | There have been no amendments, during the period covered by this report, to a provision of the code of ethics that applies to the registrant’s principal executive officer, principal financial officer, principal accounting officer or controller, or persons performing similar functions, regardless of whether these individuals are employed by the registrant or a third party, and that relates to any element of the code of ethics description. |
| | (d) | The registrant has not granted any waivers, including an implicit waiver, from a provision of the code of ethics that applies to the registrant’s principal executive officer, principal financial officer, principal accounting officer or controller, or persons performing similar functions, regardless of whether these individuals are employed by the registrant or a third party, that relates to one or more of the items set forth in paragraph (b) of this item’s instructions. |
Item 3. Audit Committee Financial Expert.
As of the end of the period covered by the report, the registrant’s board of trustees has determined that Seddik Meziani is qualified to serve as an audit committee financial expert serving on its audit committee and that he is “independent,” as defined by Item 3 of Form N-CSR.
Item 4. Principal Accountant Fees and Services.
Audit Fees
| | (a) | The aggregate fees billed for each of the last two fiscal years for professional services rendered by the principal accountant for the audit of the registrant’s annual financial statements or services that are normally provided by the accountant in connection with statutory and regulatory filings or engagements for those fiscal years are $78,000 for 2023 and $114,000 for 2024. |
Audit-Related Fees
| | (b) | The aggregate fees billed in each of the last two fiscal years for assurance and related services by the principal accountant that are reasonably related to the performance of the audit of the registrant’s financial statements and are not reported under paragraph (a) of this Item are $0 for 2023 and $0 for 2024. |
Tax Fees
| | (c) | The aggregate fees billed in each of the last two fiscal years for professional services rendered by the principal accountant for tax compliance, tax advice, and tax planning are $13,500 for 2023 and $20,500 for 2024. |
All Other Fees
| | (d) | The aggregate fees billed in each of the last two fiscal years for products and services provided by the principal accountant, other than the services reported in paragraphs (a) through (c) of this Item are $0 for 2023 and $0 for 2024. |
| | | |
| | (e)(1) | The Audit Committee of the Trust’s Board of Trustees is responsible for, among other things, the appointment, compensation and oversight of the work of the Trust’s auditor. As part of this responsibility, and to ensure that the Auditor’s independence is not impaired, the Audit Committee (1) pre-approves the audit and non-audit services provided to the Trust by the Auditor, and (2) all non-audit services provided to the Trust’s investment adviser and advisory affiliates (that directly relate to the Trust’s operations and financial reporting). except that (a) services provided to a sub-adviser whose role is primarily portfolio management and is sub-contracted or overseen by another investment adviser, and (b) de minimis non-audit services, shall not require pre-approval. |
| | | |
| | (e)(2) | The percentage of services described in each of paragraphs (b) through (d) of this Item that were approved by the audit committee pursuant to paragraph (c)(7)(i)(C) of Rule 2-01 of Regulation S-X are as follows: |
(b) Not applicable.
(c) 0%
(d) Not applicable, no expenses for the period considered.
The percentage of hours expended on the principal accountant’s engagement to audit the registrant’s financial statements for the most recent fiscal year that were attributed to work performed by persons other than the principal accountant’s full-time, permanent employees was 0.
| | (g) | The aggregate non-audit fees billed by the registrant’s accountant for services rendered to the registrant, and rendered to the registrant’s investment adviser (not including any sub-adviser whose role is primarily portfolio management and is subcontracted with or overseen by another investment adviser), and any entity controlling, controlled by, or under common control with the adviser that provides ongoing services to the registrant for each of the last two fiscal years of the registrant was $0 for 2023 and $0 for 2024. |
| | | |
| | (h) | Not applicable. |
Item 5. Audit Committee of Listed Registrants.
| | (a) | The registrant has a separately designated audit committee consisting of all the independent directors of the registrant. The members of the audit committee are: Steven J. Smyser and Seddik Meziani. |
| | | |
| | (b) | Not applicable. |
Item 6. Investments.
| | (a) | Schedule of Investments in securities of unaffiliated issuers as of the close of the reporting period is included as part of the report to shareholders filed under Item 1 of this form. |
| | | |
| | (b) | Not applicable. |
Item 7. Financial Statements and Financial Highlights for Open-End Management Investment Companies.


Item 8. Changes in and Disagreements with Accountants for Open-End Management Investment Companies.
Changes in and Disagreements with Accountants is included as part of the Financial Statements and Financial Highlights filed under Item 7 of this Report.
Item 9. Proxy Disclosures for Open-End Management Investment Companies
Proxy Disclosures is included as part of the Financial Statements and Financial Highlights filed under Item 7 of this Report.
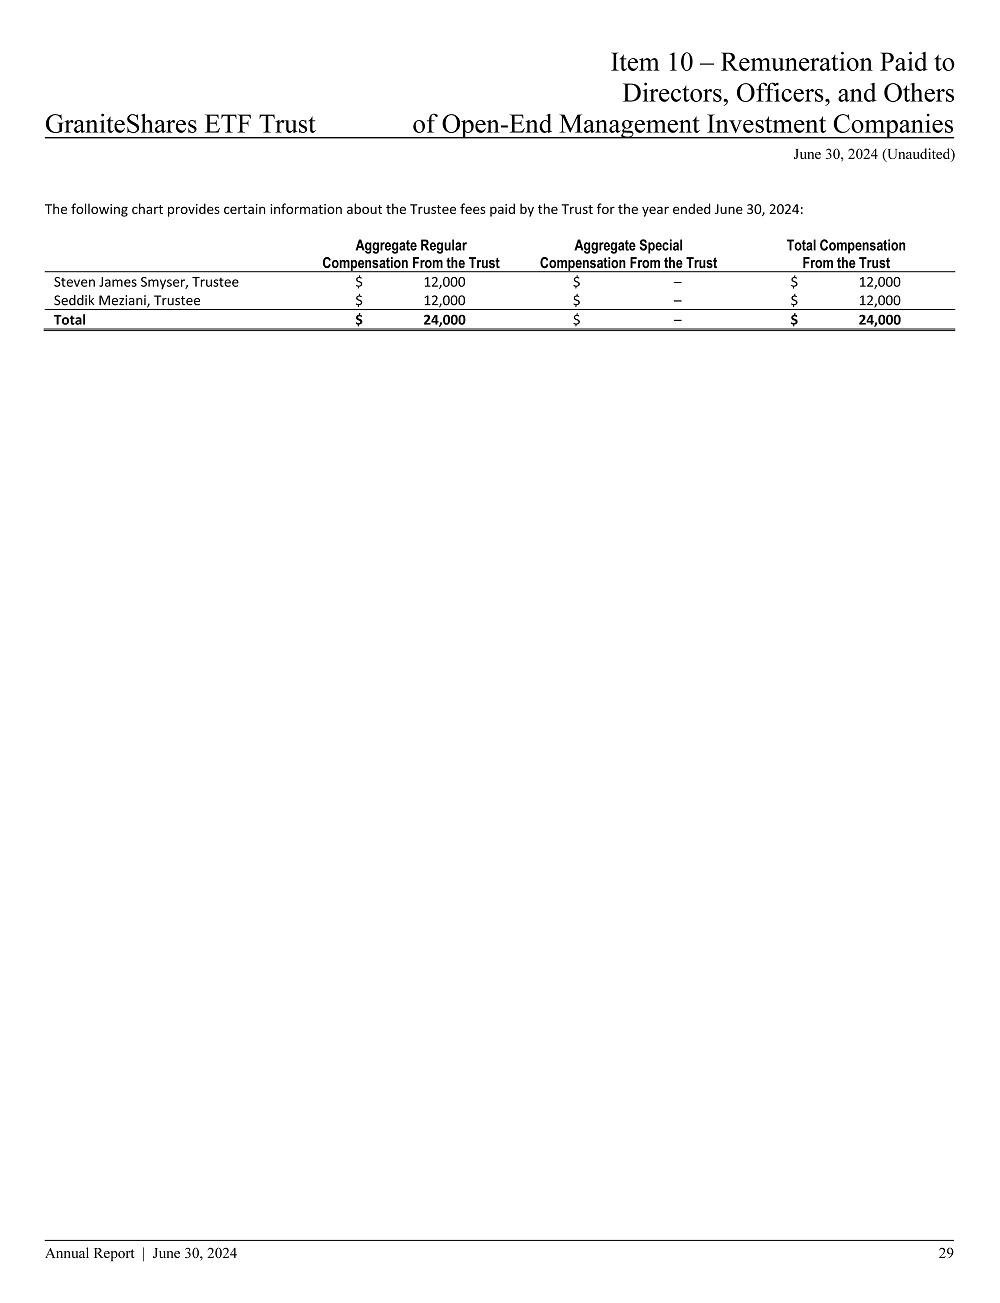
Item 10. Remuneration Paid to Directors, Officers, and Others of Open-End Management Investment Companies.
Remuneration Paid to Directors, Officers, and Others is included as part of the Financial Statements and Financial Highlights filed under Item 7 of this Report.
Item 11. Statement Regarding Basis for Approval of Investment Advisory Contract.
Statement Regarding Basis for approval of Investment Advisory Contract is included as part of the Financial Statements and Financial Highlights filed under Item 7 of this Report.
Item 12. Disclosure of Securities Lending Activities for Closed-End Management Investment Companies.
Not applicable.
Item 13. Portfolio Managers of Closed-End Management Investment Companies.
Not applicable.
Item 14. Purchases of Equity Securities by Closed-End Management Investment Company and Affiliated Purchasers.
Not applicable.
Item 15. Submission of Matters to a Vote of Security Holders.
There have been no material changes to the procedures by which the shareholders may recommend nominees to the registrant’s Board of Trustees, where those changes were implemented after the registrant last provided disclosure in response to the requirements of Item 407(c)(2)(iv) of Regulation S-K (17 CFR 229.407) (as required by Item 22(b)(15) of Schedule 14A (17 CFR 240.14a-101)), or this Item.
Item 16. Controls and Procedures.
| | (a) | The registrant’s principal executive and principal financial officers, or persons performing similar functions, have concluded that the registrant’s disclosure controls and procedures (as defined in Rule 30a-3(c) under the Investment Company Act of 1940, as amended (the “1940 Act”) (17 CFR 270.30a-3(c))) are effective, as of a date within 90 days of the filing date of the report that includes the disclosure required by this paragraph, based on their evaluation of these controls and procedures required by Rule 30a-3(b) under the 1940 Act (17 CFR 270.30a-3(b)) and Rules 13a-15(b) or 15d-15(b) under the Securities Exchange Act of 1934, as amended (17 CFR 240.13a-15(b) or 240.15d-15(b)). |
| | | |
| | | There have been no changes in the registrant’s internal controls over financial reporting that occurred during the registrant’s last fiscal quarter that has materially affected, or are reasonably likely to materially affect, the registrant’s internal control over financial reporting. |
Item 17. Disclosure of Securities Lending Activities for Closed-End Management Investment Companies.
Not applicable.
Item 18. Recovery of Erroneously Awarded Compensation.
| | (a) | Not applicable. |
| | | |
| | (b) | Not applicable. |
Item 19. Exhibits.
SIGNATURES
Pursuant to the requirements of the Securities Exchange Act of 1934 and the Investment Company Act of 1940, the registrant has duly caused this report to be signed on its behalf by the undersigned, thereunto duly authorized.
| (Registrant) | GraniteShares ETF Trust |
| | |
| By (Signature and Title)* | /s/ William Rhind |
| | William Rhind, Trustee, President and Chief Financial Officer |
| | (principal executive officer and principal financial officer) |
| | |
| Date | September 5, 2024 |
Pursuant to the requirements of the Securities Exchange Act of 1934 and the Investment Company Act of 1940, this report has been signed below by the following persons on behalf of the registrant and in the capacities and on the dates indicated.
| By (Signature and Title)* | /s/ William Rhind |
| | William Rhind, Trustee, President and Chief Financial Officer |
| | (principal executive officer and principal financial officer) |
| | |
| Date | September 5, 2024 |
* Print the name and title of each signing officer under his or her signature.