UNITED STATES
SECURITIES AND EXCHANGE COMMISSION
Washington, D.C. 20549
FORM 10-Q
☒ QUARTERLY REPORT PURSUANT TO SECTION 13 OR 15(d) OF THE SECURITIES EXCHANGE ACT OF 1934
For the quarterly period ended June 30, 2024
OR
☐ TRANSITION REPORT PURSUANT TO SECTION 13 OR 15(d) OF THE SECURITIES EXCHANGE ACT OF 1934
For the transition period from to
Commission file number 001-40833
INPOINT COMMERCIAL REAL ESTATE INCOME, INC.
(Exact name of registrant as specified in its charter)
| |
Maryland | 32-0506267 |
(State or other jurisdiction of incorporation or organization) | (I.R.S. Employer Identification No.) |
| |
2901 Butterfield Road Oak Brook, Illinois | 60523 |
(Address of principal executive offices) | (Zip Code) |
Registrant’s telephone number, including area code: (800) 826-8228
Securities registered pursuant to Section 12(b) of the Act:
| | | | |
Title of each class | | Trading Symbol(s) | | Name of each exchange on which registered |
6.75% Series A Cumulative Redeemable Preferred Stock, par value $0.001 | | ICR PR A | | New York Stock Exchange |
Indicate by check mark whether the registrant (1) has filed all reports required to be filed by Section 13 or 15(d) of the Securities Exchange Act of 1934 during the preceding 12 months (or for such shorter period that the registrant was required to file such reports), and (2) has been subject to such filing requirements for the past 90 days. Yes ☒ No ☐
Indicate by check mark whether the registrant has submitted electronically every Interactive Data File required to be submitted pursuant to Rule 405 of Regulation S-T (§232.405 of this chapter) during the preceding 12 months (or for such shorter period that the registrant was required to submit such files). Yes ☒ No ☐
Indicate by check mark whether the registrant is a large accelerated filer, an accelerated filer, a non-accelerated filer, a smaller reporting company, or an emerging growth company. See the definitions of “large accelerated filer,” “accelerated filer,” “smaller reporting company,” and “emerging growth company” in Rule 12b-2 of the Exchange Act.
| | | |
Large accelerated filer | ☐ | Accelerated filer | ☐ |
| | | |
Non-accelerated filer | ☒ | Smaller Reporting Company | ☒ |
| | | |
Emerging Growth Company | ☒ | | |
If an emerging growth company, indicate by check mark if the registrant has elected not to use the extended transition period for complying with any new or revised financial accounting standards provided pursuant to Section 13(a) of the Exchange Act. ☒
Indicate by check mark whether the registrant is a shell company (as defined in Rule 12b-2 of the Exchange Act). Yes ☐ No ☒
As of August 8, 2024, the Registrant had the following shares of common stock outstanding: 8,562,777 shares of Class P common stock, 290,345 shares of Class T common stock, 469,168 shares of Class I common stock, 745,881 shares of Class A common stock, 48,015 shares of Class D common stock and no shares of Class S common stock.
TABLE OF CONTENTS
INPOINT COMMERCIAL REAL ESTATE INCOME, INC.
CONSOLIDATED BALANCE SHEETS
(Dollar amounts in thousands, except per share amounts)
| | | | | | | | |
| | June 30, 2024
(unaudited) | | | December 31, 2023 | |
ASSETS | | | | | | |
Cash and cash equivalents | | $ | 44,557 | | | $ | 54,143 | |
Commercial mortgage loans: | | | | | | |
Commercial mortgage loans at cost | | | 705,624 | | | | 743,852 | |
Allowance for credit losses | | | (21,218 | ) | | | (21,849 | ) |
Commercial mortgage loans at cost, net | | | 684,406 | | | | 722,003 | |
Deferred debt finance costs | | | 1,148 | | | | 604 | |
Accrued interest receivable | | | 3,810 | | | | 3,283 | |
Prepaid expenses and other assets | | | 271 | | | | 312 | |
Total assets | | $ | 734,192 | | | $ | 780,345 | |
LIABILITIES AND EQUITY | | | | | | |
Liabilities: | | | | | | |
Repurchase agreements | | $ | 422,944 | | | $ | 457,438 | |
Credit facility payable | | | — | | | | 9,498 | |
Loan participations sold, net | | | 56,226 | | | | 57,226 | |
Due to related parties | | | 1,671 | | | | 2,028 | |
Accrued interest payable | | | 2,215 | | | | 1,792 | |
Distributions payable | | | 1,051 | | | | 1,050 | |
Accrued expenses and other liabilities | | | 493 | | | | 762 | |
Total liabilities | | | 484,600 | | | | 529,794 | |
| | | | | | |
Commitments and contingencies (Note 8) | | | | | | |
| | | | | | |
Stockholders’ Equity: | | | | | | |
Preferred stock, $0.001 par value, 50,000,000 shares authorized: | | | | | | |
6.75% Series A Cumulative Redeemable Preferred Stock, $0.001 par value, 4,025,000 shares
authorized and 3,544,553 shares issued and outstanding as of June 30, 2024 and
December 31, 2023 | | | 4 | | | | 4 | |
Class P common stock, $0.001 par value, 500,000,000 shares authorized, 8,562,777 shares issued
and outstanding as of June 30, 2024 and December 31, 2023 | | | 9 | | | | 9 | |
Class A common stock, $0.001 par value, 500,000,000 shares authorized, 745,881 and 745,887
shares issued and outstanding as of June 30, 2024 and December 31, 2023, respectively | | | 1 | | | | 1 | |
Class T common stock, $0.001 par value, 500,000,000 shares authorized, 290,345 shares issued
and outstanding as of June 30, 2024 and December 31, 2023 | | | — | | | | — | |
Class S common stock, $0.001 par value, 500,000,000 shares authorized, 0 shares issued
and outstanding as of as of June 30, 2024 and December 31, 2023 | | | — | | | | — | |
Class D common stock, $0.001 par value, 500,000,000 shares authorized, 48,015 shares issued
and outstanding as of June 30, 2024 and December 31, 2023 | | | — | | | | — | |
Class I common stock, $0.001 par value, 500,000,000 shares authorized, 469,168 shares issued
and outstanding as of June 30, 2024 and December 31, 2023 | | | — | | | | — | |
Additional paid in capital | | | 339,525 | | | | 339,581 | |
Accumulated deficit | | | (89,947 | ) | | | (89,044 | ) |
Total stockholders’ equity | | | 249,592 | | | | 250,551 | |
Total liabilities and stockholders’ equity | | $ | 734,192 | | | $ | 780,345 | |
The accompanying notes are an integral part of these consolidated financial statements.
INPOINT COMMERCIAL REAL ESTATE INCOME, INC.
CONSOLIDATED STATEMENTS OF OPERATIONS
(Unaudited, dollar amounts in thousands, except per share amounts)
| | | | | | | | | | | | | | | | |
| | Three months ended June 30, | | | Six months ended June 30, | |
| | 2024 | | | 2023 | | | 2024 | | | 2023 | |
Income: | | | | | | | | | | | | |
Interest income | | $ | 14,983 | | | $ | 17,332 | | | $ | 30,095 | | | $ | 34,186 | |
Less: Interest expense | | | (9,356 | ) | | | (10,708 | ) | | | (18,832 | ) | | | (20,937 | ) |
Net interest income | | | 5,627 | | | | 6,624 | | | | 11,263 | | | | 13,249 | |
Revenue from real estate | | | — | | | | 5,326 | | | | — | | | | 8,247 | |
Total income | | | 5,627 | | | | 11,950 | | | | 11,263 | | | | 21,496 | |
Operating expenses: | | | | | | | | | | | | |
Advisory fee | | | 799 | | | | 861 | | | | 1,604 | | | | 1,742 | |
Amortization of debt finance costs | | | 369 | | | | 507 | | | | 772 | | | | 878 | |
Directors compensation | | | 19 | | | | 21 | | | | 39 | | | | 40 | |
Professional service fees | | | 212 | | | | 186 | | | | 493 | | | | 377 | |
Real estate operating expenses | | | — | | | | 4,722 | | | | — | | | | 7,910 | |
Provision for asset impairment | | | — | | | | 6,934 | | | | — | | | | 6,934 | |
Depreciation and amortization | | | — | | | | 193 | | | | — | | | | 514 | |
Other expenses | | | 324 | | | | 475 | | | | 715 | | | | 828 | |
Total operating expenses | | | 1,723 | | | | 13,899 | | | | 3,623 | | | | 19,223 | |
Other income (loss): | | | | | | | | | | | | |
Reversal of (provision for) credit losses | | | 1,086 | | | | (13,364 | ) | | | 749 | | | | (12,965 | ) |
Total other income (loss) | | | 1,086 | | | | (13,364 | ) | | | 749 | | | | (12,965 | ) |
Net income (loss) before income taxes | | | 4,990 | | | | (15,313 | ) | | | 8,389 | | | | (10,692 | ) |
Income tax provision | | | — | | | | 22 | | | | — | | | | 22 | |
Net income (loss) | | | 4,990 | | | | (15,335 | ) | | | 8,389 | | | | (10,714 | ) |
Series A Preferred Stock dividends | | | (1,496 | ) | | | (1,496 | ) | | | (2,991 | ) | | | (2,991 | ) |
Gain on repurchase and retirement of preferred stock | | | — | | | | — | | | | — | | | | 21 | |
Net income (loss) attributable to common stockholders | | $ | 3,494 | | | $ | (16,831 | ) | | $ | 5,398 | | | $ | (13,684 | ) |
Net income (loss) attributable to common stockholders per share basic and diluted | | $ | 0.35 | | | $ | (1.66 | ) | | $ | 0.53 | | | $ | (1.35 | ) |
Weighted average number of shares of common stock | | | | | | | | | | | | |
Basic | | | 10,116,191 | | | | 10,114,470 | | | | 10,116,186 | | | | 10,113,849 | |
Diluted | | | 10,116,975 | | | | 10,114,470 | | | | 10,116,748 | | | | 10,113,849 | |
The accompanying notes are an integral part of these consolidated financial statements.
INPOINT COMMERCIAL REAL ESTATE INCOME, INC.
CONSOLIDATED STATEMENTS OF CHANGES IN STOCKHOLDERS’ EQUITY
(Unaudited, dollar amounts in thousands)
| | | | | | | | | | | | | | | | | | | | | | | | | | | | | | |
For the Three Months Ended June 30, 2024 | Par Value
Preferred Stock | | Par Value
Common Stock | | | | | | | |
| Series A | | Class P | | Class A | | Class T | | Class S | | Class D | | Class I | | Additional
Paid in
Capital | | Accumulated Deficit | | Total
Stockholders’
Equity | |
Balance as of March 31, 2024 | $ | 4 | | $ | 9 | | $ | 1 | | $ | — | | $ | — | | $ | — | | $ | — | | $ | 339,554 | | $ | (90,291 | ) | $ | 249,277 | |
Offering costs | | — | | | — | | | — | | | — | | | — | | | — | | | — | | | (36 | ) | | — | | | (36 | ) |
Net income | | — | | | — | | | — | | | — | | | — | | | — | | | — | | | — | | | 4,990 | | | 4,990 | |
Common stock distributions declared | | — | | | — | | | — | | | — | | | — | | | — | | | — | | | — | | | (3,150 | ) | | (3,150 | ) |
Preferred stock distributions declared | | — | | | — | | | — | | | — | | | — | | | — | | | — | | | — | | | (1,496 | ) | | (1,496 | ) |
Equity-based compensation | | — | | | — | | | — | | | — | | | — | | | — | | | — | | | 7 | | | — | | | 7 | |
Balance at June 30, 2024 | $ | 4 | | $ | 9 | | $ | 1 | | $ | — | | $ | — | | $ | — | | $ | — | | $ | 339,525 | | $ | (89,947 | ) | $ | 249,592 | |
| | | | | | | | | | | | | | | | | | | | | | | | | | | | | | |
For the Three Months Ended June 30, 2023 | Par Value
Preferred Stock | | Par Value
Common Stock | | | | | | | |
| Series A | | Class P | | Class A | | Class T | | Class S | | Class D | | Class I | | Additional
Paid in
Capital | | Accumulated Deficit | | Total
Stockholders’
Equity | |
Balance as of March 31, 2023 | $ | 4 | | $ | 9 | | $ | 1 | | $ | — | | $ | — | | $ | — | | $ | — | | $ | 339,718 | | $ | (66,049 | ) | $ | 273,683 | |
Offering costs | | — | | | — | | | — | | | — | | | — | | | — | | | — | | | (63 | ) | | — | | | (63 | ) |
Net loss | | — | | | — | | | — | | | — | | | — | | | — | | | — | | | — | | | (15,335 | ) | | (15,335 | ) |
Common stock distributions declared | | — | | | — | | | — | | | — | | | — | | | — | | | — | | | — | | | (3,150 | ) | | (3,150 | ) |
Preferred stock distributions declared | | — | | | — | | | — | | | — | | | — | | | — | | | — | | | — | | | (1,496 | ) | | (1,496 | ) |
Equity-based compensation | | — | | | — | | | — | | | — | | | — | | | — | | | — | | | 8 | | | — | | | 8 | |
Balance at June 30, 2023 | $ | 4 | | $ | 9 | | $ | 1 | | $ | — | | $ | — | | $ | — | | $ | — | | $ | 339,663 | | $ | (86,030 | ) | $ | 253,647 | |
The accompanying notes are an integral part of these consolidated financial statements.
INPOINT COMMERCIAL REAL ESTATE INCOME, INC.
CONSOLIDATED STATEMENTS OF CHANGES IN STOCKHOLDERS’ EQUITY
(Unaudited, dollar amounts in thousands)
| | | | | | | | | | | | | | | | | | | | | | | | | | | | | | |
For the Six Months Ended June 30, 2024 | Par Value
Preferred
Stock | | Par Value
Common Stock | | | | | | | |
| Series A | | Class P | | Class A | | Class T | | Class S | | Class D | | Class I | | Additional
Paid in
Capital | | Accumulated Deficit | | Total
Stockholders’
Equity | |
Balance as of December 31, 2023 | $ | 4 | | $ | 9 | | $ | 1 | | $ | — | | $ | — | | $ | — | | $ | — | | $ | 339,581 | | $ | (89,044 | ) | $ | 250,551 | |
Offering costs | | — | | | — | | | — | | | — | | | — | | | — | | | — | | | (71 | ) | | — | | | (71 | ) |
Net income | | — | | | — | | | — | | | — | | | — | | | — | | | — | | | — | | | 8,389 | | | 8,389 | |
Common stock distributions declared | | — | | | — | | | — | | | — | | | — | | | — | | | — | | | — | | | (6,301 | ) | | (6,301 | ) |
Preferred stock distributions declared | | — | | | — | | | — | | | — | | | — | | | — | | | — | | | — | | | (2,991 | ) | | (2,991 | ) |
Equity-based compensation | | — | | | — | | | — | | | — | | | — | | | — | | | — | | | 15 | | | — | | | 15 | |
Balance at June 30, 2024 | $ | 4 | | $ | 9 | | $ | 1 | | $ | — | | $ | — | | $ | — | | $ | — | | $ | 339,525 | | $ | (89,947 | ) | $ | 249,592 | |
| | | | | | | | | | | | | | | | | | | | | | | | | | | | | | |
For the Six Months Ended June 30, 2023 | Par Value
Preferred
Stock | | Par Value
Common Stock | | | | | | | |
| Series A | | Class P | | Class A | | Class T | | Class S | | Class D | | Class I | | Additional
Paid in
Capital | | Accumulated Deficit | | Total
Stockholders’
Equity | |
Balance as of December 31, 2022 | $ | 4 | | $ | 9 | | $ | 1 | | $ | — | | $ | — | | $ | — | | $ | — | | $ | 339,470 | | $ | (60,927 | ) | $ | 278,557 | |
Cumulative effect of adoption of ASU 2016-13 | | | | | | | | | | | | | | | | — | | | (5,122 | ) | | (5,122 | ) |
Total stockholders’ equity at beginning of period, as adjusted | | 4 | | | 9 | | | 1 | | | — | | | — | | | — | | | — | | | 339,470 | | | (66,049 | ) | | 273,435 | |
Proceeds from issuance of common stock | | — | | | — | | | — | | | — | | | — | | | — | | | — | | | 342 | | | — | | | 342 | |
Repurchase and retirement of preferred stock | | — | | | — | | | — | | | — | | | — | | | — | | | — | | | (104 | ) | | 21 | | | (83 | ) |
Offering costs | | — | | | — | | | — | | | — | | | — | | | — | | | — | | | (145 | ) | | — | | | (145 | ) |
Net loss | | — | | | — | | | — | | | — | | | — | | | — | | | — | | | — | | | (10,714 | ) | | (10,714 | ) |
Common stock distributions declared | | — | | | — | | | — | | | — | | | — | | | — | | | — | | | — | | | (6,297 | ) | | (6,297 | ) |
Preferred stock distributions declared | | — | | | — | | | — | | | — | | | — | | | — | | | — | | | — | | | (2,991 | ) | | (2,991 | ) |
Distribution reinvestment | | — | | | — | | | — | | | — | | | — | | | — | | | — | | | 85 | | | — | | | 85 | |
Equity-based compensation | | — | | | — | | | — | | | — | | | — | | | — | | | — | | | 15 | | | — | | | 15 | |
Balance at June 30, 2023 | $ | 4 | | $ | 9 | | $ | 1 | | $ | — | | $ | — | | $ | — | | $ | — | | $ | 339,663 | | $ | (86,030 | ) | $ | 253,647 | |
The accompanying notes are an integral part of these consolidated financial statements.
INPOINT COMMERCIAL REAL ESTATE INCOME, INC.
CONSOLIDATED STATEMENTS OF CASH FLOWS
(Unaudited, dollar amounts in thousands)
| | | | | | | | |
| | Six months ended June 30, | |
| | 2024 | | | 2023 | |
Cash flows from operating activities | | | | | | |
Net income (loss) | | $ | 8,389 | | | $ | (10,714 | ) |
Adjustments to reconcile net income (loss) to cash provided by operations: | | | | | | |
(Reversal of) provision for credit losses | | | (749 | ) | | | 12,965 | |
Depreciation and amortization expense | | | — | | | | 514 | |
Reduction in the carrying amount of the right-of-use asset | | | — | | | | 30 | |
Provision for asset impairment | | | — | | | | 6,934 | |
Amortization of equity-based compensation | | | 15 | | | | 15 | |
Amortization of debt finance costs to operating expense | | | 772 | | | | 878 | |
Amortization of debt finance costs to interest expense | | | — | | | | 3 | |
Amortization of origination fees | | | — | | | | (15 | ) |
Amortization of loan extension fees | | | (227 | ) | | | (371 | ) |
Changes in assets and liabilities: | | | | | | |
Accrued interest receivable | | | (527 | ) | | | (76 | ) |
Accrued expenses and other liabilities | | | (152 | ) | | | (3,060 | ) |
Accrued interest payable | | | 423 | | | | 206 | |
Due to related parties | | | (70 | ) | | | (24 | ) |
Prepaid expenses and other assets | | | 42 | | | | (941 | ) |
Net cash provided by operating activities | | | 7,916 | | | | 6,344 | |
Cash flows from investing activities: | | | | | | |
Origination/funding of commercial loans | | | (5,387 | ) | | | (13,597 | ) |
Loan extension fees received on commercial loans | | | 164 | | | | 126 | |
Principal repayments of commercial loans | | | 43,410 | | | | 66,112 | |
Escrow deposit on real estate held for sale | | | — | | | | 1,250 | |
Real estate capital expenditures | | | — | | | | (496 | ) |
Net cash provided by investing activities | | | 38,187 | | | | 53,395 | |
Cash flows from financing activities: | | | | | | |
Proceeds from issuance of common stock | | | — | | | | 342 | |
Repurchase of preferred stock | | | — | | | | (83 | ) |
Payment of offering costs | | | (90 | ) | | | (164 | ) |
Proceeds from repurchase agreements | | | 8,201 | | | | 359,951 | |
Principal repayments of repurchase agreements | | | (42,695 | ) | | | (372,764 | ) |
Principal repayments of credit facility | | | (9,498 | ) | | | — | |
Proceeds from sale of loan participations | | | — | | | | 435 | |
Principal repayments of loan participations | | | (1,000 | ) | | | (21,423 | ) |
Debt finance costs | | | (1,316 | ) | | | (1,607 | ) |
Distributions paid to common stockholders | | | (6,300 | ) | | | (6,209 | ) |
Distributions paid to preferred stockholders | | | (2,991 | ) | | | (2,991 | ) |
Net cash used in financing activities | | | (55,689 | ) | | | (44,513 | ) |
Net change in cash, cash equivalents and restricted cash | | | (9,586 | ) | | | 15,226 | |
Cash, cash equivalents and restricted cash at beginning of period | | | 54,143 | | | | 29,408 | |
Cash, cash equivalents and restricted cash at end of period | | $ | 44,557 | | | $ | 44,634 | |
Supplemental disclosure of cash flow information: | | | | | | |
Amortization of deferred exit fees due to related party | | $ | (268 | ) | | $ | (89 | ) |
Interest paid | | $ | 18,408 | | | $ | 20,918 | |
Accrued stockholder servicing fee due to related party | | $ | (19 | ) | | $ | (19 | ) |
Distribution reinvestment | | $ | — | | | $ | 85 | |
The accompanying notes are an integral part of these consolidated financial statements.
InPoint Commercial Real Estate Income, Inc.
Notes to Consolidated Financial Statements
June 30, 2024
(Unaudited, dollar amounts in thousands, except per share amounts)
Note 1 – Organization and Business Operations
InPoint Commercial Real Estate Income, Inc. (the “Company”) was incorporated in Maryland on September 13, 2016 to originate, acquire and manage a diversified portfolio of commercial real estate (“CRE”) investments primarily comprised of (i) CRE debt, including (a) primarily floating-rate first mortgage loans, and (b) subordinate mortgage and mezzanine loans, and participations in such loans and (ii) floating-rate CRE securities, such as commercial mortgage-backed securities (“CMBS”), and senior unsecured debt of publicly traded real estate investment trusts (“REITs”). Substantially all of the Company’s business is conducted through InPoint REIT Operating Partnership, LP (the “Operating Partnership”), a Delaware limited partnership. The Company is the sole general partner and directly or indirectly holds all of the limited partner interests in the Operating Partnership. The Company has elected to be taxed as a REIT for U.S. federal income tax purposes.
The Company is externally managed by Inland InPoint Advisor, LLC (the “Advisor”), a Delaware limited liability company formed in August 2016 that is a wholly owned indirect subsidiary of Inland Real Estate Investment Corporation (“IREIC”), a member of The Inland Real Estate Group of Companies, Inc. The Advisor is responsible for coordinating the management of the day-to-day operations and originating, acquiring and managing the Company’s CRE investment portfolio, subject to the supervision of the Company’s board of directors (the “Board”). The Advisor performs its duties and responsibilities as the Company’s fiduciary pursuant to an amended and restated advisory agreement dated July 1, 2021 among the Company, the Advisor and the Operating Partnership (the “Advisory Agreement”).
The Advisor has delegated certain of its duties to SPCRE InPoint Advisors, LLC (the “Sub-Advisor”), a Delaware limited liability company formed in September 2016 that is a wholly owned subsidiary of Sound Point CRE Management, LP, pursuant to a second amended and restated sub-advisory agreement between the Advisor and the Sub-Advisor dated July 1, 2021. Among other duties, the Sub-Advisor has the authority to identify, negotiate, acquire and originate the Company’s investments and provide portfolio management, disposition, property management and leasing services to the Company. Notwithstanding such delegation to the Sub-Advisor, the Advisor retains ultimate responsibility for the performance of all the matters entrusted to it under the Advisory Agreement, including those duties which the Advisor has not delegated to the Sub-Advisor, such as (i) valuation of the Company’s assets and calculation of the Company’s net asset value (“NAV”); (ii) management of the Company’s day-to-day operations; (iii) preparation of stockholder reports and communications and arrangement of the Company’s annual stockholder meetings; and (iv) monitoring the Company’s ongoing compliance with the REIT qualification requirements for U.S. federal income tax purposes.
On October 25, 2016, the Company commenced a private offering (the “Private Offering”) of up to $500,000 in shares of Class P common stock (“Class P Shares”). The Company issued 10,258,094 Class P Shares in the Private Offering, resulting in gross proceeds of $276,681 and terminated the Private Offering on June 28, 2019.
On March 22, 2019, the Company filed a registration statement on Form S-11 (File No. 333-230465) (the “2019 Registration Statement”) with the Securities and Exchange Commission (the “SEC”) to register up to $2,350,000 in shares of common stock (the “IPO”).
On May 3, 2019, the SEC declared effective the 2019 Registration Statement and the Company commenced the IPO. The purchase price per share for each class of common stock in the IPO (Class A, Class I, Class D, Class S and Class T) varied and generally equaled the prior month’s NAV per share, as determined monthly, plus applicable upfront selling commissions and dealer manager fees. Inland Securities Corporation (the “Dealer Manager”), an affiliate of the Advisor, served as the Company’s exclusive dealer manager for the IPO on a best efforts basis.
On September 22, 2021, the Company completed an underwritten public offering of 3,500,000 shares of its 6.75% Series A Cumulative Redeemable Preferred Stock, par value $0.001 per share (the “Series A Preferred Stock”), with a liquidation preference of $25.00 per share (the “Preferred Stock Offering”). In addition, on October 15, 2021, Raymond James & Associates, Inc., as a representative of the underwriters, partially exercised their over-allotment option to purchase an additional 100,000 shares of Series A Preferred Stock. The Series A Preferred Stock were issued and sold pursuant to an effective registration statement on Form S-11 (File No. 333-258802) filed with the SEC. The Company received net proceeds in the Preferred Stock Offering of $86,310, after underwriter’s discount and issuance costs, and contributed the net proceeds to the Operating Partnership in exchange for an equivalent number of Series A units in the Operating Partnership (with economic terms that mirror those of the Series A Preferred Stock). For more information on the Preferred Stock Offering, see “Note 6 – Stockholders’ Equity.”
InPoint Commercial Real Estate Income, Inc.
Notes to Consolidated Financial Statements
June 30, 2024
(Unaudited, dollar amounts in thousands, except per share amounts)
On April 28, 2022, the Company filed a registration statement on Form S-11 (File No. 333-264540) (the “2022 Registration Statement”) with the SEC to register up to $2,200,000 in shares of common stock, which was declared effective by the SEC on November 2, 2022 (the “Second Public Offering” and collectively with the IPO, the “Public Offerings”).
In light of the pace of fundraising in the Second Public Offering and the amount of monthly redemption requests pursuant to the share repurchase plan (the “SRP”), which were in excess of such fundraising, on January 30, 2023, the Board approved, effective immediately, the suspension of the operation of the SRP. In connection with such suspension, the Board also approved the suspension of the sale of shares in the primary portion of the Second Public Offering (the “Primary Offering”), effective immediately, and the suspension of the sale of shares pursuant to the distribution reinvestment plan (the “DRP”), effective as of February 10, 2023. The Primary Offering, the SRP, and the DRP shall each remain suspended unless and until such time as the Board approves their resumption.
Please refer to “Note 14 – Subsequent Events” for updates to the Company’s business after June 30, 2024.
Note 2 – Summary of Significant Accounting Policies
Disclosures discussing all significant accounting policies are set forth in the Company’s Annual Report on Form 10-K for the year ended December 31, 2023, as filed with the SEC on March 15, 2024 (the “Annual Report”), under the heading “Note 2 – Summary of Significant Accounting Policies.” See below for discussion of changes to the Company’s significant accounting policies for the six months ended June 30, 2024.
Basis of Accounting
The accompanying consolidated financial statements and related footnotes have been prepared in conformity with U.S. generally accepted accounting principles (“GAAP”) and require management to make estimates and assumptions that affect the reported amounts of assets and liabilities as of the date of the financial statements and the reported amounts of income and expenses during the reported periods. Actual results could differ from such estimates.
In the opinion of management, the accompanying unaudited consolidated financial statements reflect all adjustments, which are normal and recurring in nature, necessary for fair financial statement presentation.
Cash, Cash Equivalents and Restricted Cash
Cash and cash equivalents include funds on deposit with financial institutions, including demand deposits with financial institutions with original maturities of three months or less. The account balance may exceed the Federal Deposit Insurance Corporation (“FDIC”) insurance coverage limits and, as a result, there could be a concentration of credit risk related to amounts on deposit in excess of FDIC insurance coverage limits. The Company believes that the risk will not be significant, as the Company does not anticipate the financial institutions’ non-performance.
Restricted cash represents cash the Company is required to hold in a segregated account as additional collateral on real estate securities repurchase agreements. As of June 30, 2024 and December 31, 2023, no restricted cash was held by the Company.
Allowance for Credit Losses
On January 1, 2023, the Company adopted Accounting Standards Update 2016-13, “Financial Instruments – Credit Losses (Topic 326): Measurement of Credit Losses on Financial Instruments” (“ASU 2016-13”), which requires companies to estimate a current expected credit loss (“CECL”) for the recognition of credit losses on financial instruments, including commercial mortgage loans, in their consolidated financial statements. The allowance for credit losses is adjusted each period for changes in expected credit losses. This replaces prior GAAP which required losses to be recognized as incurred. The Company adopted ASU 2016-13 using the modified retrospective method, therefore, the results for reporting periods prior to January 1, 2023 remain unadjusted and reported in accordance with previously applicable GAAP. In connection with the adoption of ASU 2016-13, the Company recorded a $5,122 increase to accumulated deficit with offsets on the consolidated balance sheet as noted below.
The following table illustrates the impact of adoption ASU 2016-13:
InPoint Commercial Real Estate Income, Inc.
Notes to Consolidated Financial Statements
June 30, 2024
(Unaudited, dollar amounts in thousands, except per share amounts)
| | | | | | | | | | | | |
| | January 1, 2023 | |
| | As Reported Under ASU 2016-13 | | | As Reported Pre-Adoption | | | Impact of Adoption | |
Assets: | | | | | | | | | |
Allowance for credit losses | | $ | 8,375 | | | $ | 3,588 | | | $ | 4,787 | |
Liabilities: | | | | | | | | | |
Accrued expenses and other liabilities | | $ | 8,187 | | | $ | 7,852 | | | $ | 335 | |
The allowance for credit losses is recorded in accordance with ASU 2016-13, and is a valuation account that is deducted from the amortized cost basis of loans held-for-investment on the Company’s consolidated balance sheets. Changes to the allowance for credit losses are recognized through net income (loss) on the Company’s consolidated statements of operations. The allowance is based on relevant information about past events, including historical loss experience, current portfolio, market conditions and reasonable and supportable forecasts for the duration of each respective loan. All loans held-for-investment within the Company’s portfolio have some amount of expected loss to reflect the GAAP principal underlying the CECL model that all loans have some inherent risk of loss, regardless of credit quality, subordinate capital or other mitigating factors.
The Company’s loans typically include commitments to fund incremental proceeds to its borrowers over the life of the loan. Those future funding commitments are also subject to an allowance for credit losses. The allowance for credit losses related to future loan fundings is recorded as a component of “Accrued expenses and other liabilities” on the Company’s consolidated balance sheets, and not as an offset to the related loan balance. This allowance for credit losses is estimated using the same process outlined below for the Company’s outstanding loan balances, and changes in this component of the allowance for credit losses similarly flow through the Company’s consolidated statements of operations.
The allowance for credit losses is estimated on a quarterly basis and represents management’s estimates of current expected credit losses in the Company’s investment portfolio. Pools of loans with similar risk characteristics are collectively evaluated while loans that no longer share risk characteristics with loan pools are evaluated individually. Estimating an allowance for credit losses is inherently subjective, as it requires management to exercise significant judgment in establishing appropriate factors used to determine the allowance and a variety of subjective assumptions, including (i) determination of relevant historical loan loss data sets, (ii) the expected timing and amount of future loan fundings and repayments, (iii) the current credit quality of loans and operating performance of loan collateral and the Company’s expectations of performance, and (iv) selecting the forecast for macroeconomic conditions.
The Company estimates the analytical portion of its allowance for credit losses by using a probability-weighted quantitative analytical model that considers the likelihood of default and loss-given-default for each individual loan. The analytical model incorporates a third-party licensed database for over 100,000 commercial real estate loans. The Company licenses certain macroeconomic financial forecasts from a third-party to inform its view of the potential future impact that broader macroeconomic conditions may have on the performance of the loans held-for-investment. These macroeconomic factors include unemployment rates, interest rates, price indices for commercial property and other factors. The Company may use one or more of these forecasts in the process of estimating its allowance for credit losses. Selection of these economic forecasts requires significant judgment about future events that, while based on the information available to the Company as of the balance sheet date, are ultimately unknowable with certainty, and the actual economic conditions impacting the Company’s portfolio could vary significantly from the estimates the Company made for the periods presented. Significant inputs to the Company’s estimate of the allowance for credit losses include the reasonable and supportable forecast period and loan specific factors such as debt service coverage ratio, or DSCR, loan-to-value ratio, or LTV, remaining contractual loan term, property type and others. In addition, the Company also considers relevant loan-specific qualitative factors to estimate its allowance for credit losses.
Accounting Pronouncements Recently Issued but Not Yet Effective
In November 2023, the Financial Accounting Standards Board (the “FASB”) issued ASU No. 2023-07, Segment Reporting (Topic 280): Improvements to Reportable Segment Disclosures, which requires a public entity to disclose significant segment expenses and other segment items on an annual and interim basis and to provide in interim periods all disclosures about a reportable segment’s profit or loss and assets that are currently required annually. Public entities with a single reportable segment are required to provide the new disclosures and all the disclosures required under ASC 280. ASU 2023-07 is effective for fiscal years beginning after December 15, 2023 and interim periods within fiscal years beginning after December 15, 2024, and early adoption is permitted. The amendments should be applied retrospectively to all periods presented in the financial statements, unless it is impracticable. The Company is currently evaluating the impact of ASU 2023-07 on the Company’s consolidated financial statements.
InPoint Commercial Real Estate Income, Inc.
Notes to Consolidated Financial Statements
June 30, 2024
(Unaudited, dollar amounts in thousands, except per share amounts)
In December 2023, the FASB issued ASU 2023-09, Income Taxes (Topic 740): Improvements to Income Tax Disclosures. ASU 2023-09 improves the transparency of income tax disclosures related to rate reconciliation and income taxes. ASU 2023-07 is effective for annual periods beginning after December 15, 2024. Early adoption is permitted for annual financial statements that have not yet been issued or made available for issuance. The amendments should be applied prospectively, however retrospective application is permitted. The Company is currently evaluating the impact of ASU 2023-09 on the Company’s consolidated financial statements.
Note 3 – Commercial Mortgage Loans Held for Investment
The following tables show a summary of the Company’s commercial mortgage loans held for investment as of June 30, 2024 and December 31, 2023:
June 30, 2024
| | | | | | | | | | | | | | | | | | | | | |
Loan Type (1) | Number
of Loans | | Principal
Balance | | Unamortized (fees)/costs, net | | Allowance for credit losses | | Carrying
Value | | Weighted Average
Interest Rate (2) | | Weighted Average
Years to Maturity (3) | |
First mortgage loans | | 31 | | $ | 691,356 | | $ | 768 | | $ | (17,189 | ) | $ | 674,935 | | | 7.8 | % | | 0.6 | |
Credit loans | | 2 | | | 13,500 | | | — | | | (4,029 | ) | | 9,471 | | | 9.6 | % | | 1.9 | |
Total and average | | 33 | | $ | 704,856 | | $ | 768 | | $ | (21,218 | ) | $ | 684,406 | | | 7.9 | % | | 0.6 | |
December 31, 2023
| | | | | | | | | | | | | | | | | | | | | |
Loan Type (1) | Number
of Loans | | Principal
Balance | | Unamortized (fees)/costs, net | | Allowance for credit losses | | Carrying
Value | | Weighted Average
Interest Rate (2) | | Weighted Average
Years to Maturity (3) | |
First mortgage loans | | 34 | | $ | 729,380 | | $ | 972 | | $ | (21,809 | ) | $ | 708,543 | | | 8.8 | % | | 0.9 | |
Credit loans | | 2 | | | 13,500 | | | — | | | (40 | ) | | 13,460 | | | 9.6 | % | | 2.4 | |
Total and average | | 36 | | $ | 742,880 | | $ | 972 | | $ | (21,849 | ) | $ | 722,003 | | | 8.8 | % | | 0.9 | |
(1)First mortgage loans are first position mortgage loans and credit loans are mezzanine and subordinated loans.
(2)Weighted average interest rate is based on the loan spreads plus the applicable indices as of the last interest reset date, which is typically the 15th of each month. On June 15, 2024, the one-month term USD Secured Overnight Financing Rate (“SOFR”) rate reset to 5.33%. On December 15, 2023, the SOFR rate reset to 5.36%. Weighted average interest rate excludes maturity default interest and interest on loans placed on nonaccrual status.
(3)Weighted average years to maturity excludes allowable extensions on the loans.
For the six months ended June 30, 2024, the activity in the Company’s commercial mortgage loans, held-for-investment portfolio was as follows:
| | | | | | | | | | | | |
| | Commercial mortgage loans at cost | | | Allowance for credit losses | | | Carrying Value | |
Balance at Beginning of Year | | $ | 743,852 | | | $ | (21,849 | ) | | $ | 722,003 | |
Loan originations/advances | | | 5,387 | | | | — | | | | 5,387 | |
Principal repayments | | | (43,410 | ) | | | — | | | | (43,410 | ) |
Amortization of loan origination and deferred exit fees | | | 287 | | | | — | | | | 287 | |
Origination fees and extension fees received on commercial loans | | | (492 | ) | | | — | | | | (492 | ) |
Reversal of credit losses | | | — | | | | 631 | | | | 631 | |
Balance at End of Period | | $ | 705,624 | | | $ | (21,218 | ) | | $ | 684,406 | |
Allowance for Credit Losses
The following table presents the activity in the Company’s allowance for credit losses for the six months ended June 30, 2024:
InPoint Commercial Real Estate Income, Inc.
Notes to Consolidated Financial Statements
June 30, 2024
(Unaudited, dollar amounts in thousands, except per share amounts)
| | | | | | | | | | | | |
| | Commercial Mortgage Loans | | | Unfunded Loan Commitments (1) | | | Total | |
Balance at beginning of period | | $ | (21,849 | ) | | $ | (289 | ) | | $ | (22,138 | ) |
Reversal of credit losses | | | 631 | | | | 118 | | | | 749 | |
Ending allowance for credit losses | | $ | (21,218 | ) | | $ | (171 | ) | | $ | (21,389 | ) |
(1)The reserve for expected credit losses related to unfunded loan commitments is recorded in “accrued expenses and other liabilities” on the consolidated balance sheets following the adoption of ASU 2016-13 on January 1, 2023.
The following table presents the activity in the Company’s allowance for credit losses for the six months ended June 30, 2023:
| | | | | | | | | | | | |
| | Commercial Mortgage Loans | | | Unfunded Loan Commitments (1) | | | Total | |
Balance at beginning of period | | $ | (3,588 | ) | | $ | — | | | $ | (3,588 | ) |
Adoption of ASU 2016-13 | | | (4,787 | ) | | | (335 | ) | | | (5,122 | ) |
Balance at beginning of period after adoption | | | (8,375 | ) | | | (335 | ) | | | (8,710 | ) |
Provision for credit losses |
| | (12,962 | ) | | | (3 | ) | | | (12,965 | ) |
Ending allowance for credit losses |
| $ | (21,337 | ) | | $ | (338 | ) | | $ | (21,675 | ) |
(1)The reserve for expected credit losses related to unfunded loan commitments is recorded in “accrued expenses and other liabilities” on the consolidated balance sheets following the adoption of ASU 2016-13 on January 1, 2023.
As of June 30, 2024, the Company had a total CECL reserve of $21,389, which included an asset-specific component of $16,740 related to seven loans. During the six months ended June 30, 2024, the Company decreased the CECL reserve by $749. This CECL reserve reflects certain loans assessed for impairment in the Company’s portfolio as well as reserves determined based on an analysis of macroeconomic conditions.
During the six months ended June 30, 2024, the Company recorded a net increase of $474 in the asset-specific component of the CECL reserve. As of June 30, 2024, the asset-specific component relates to three loans secured by office properties and four loans secured by multifamily properties. Since December 31, 2023, the Company observed an improvement in the valuation of the properties securing four loans resulting in a reduction in the asset-specific reserve of $7,231. This was offset by the addition of $7,705 in asset-specific reserve related to four additional loans.
As of June 30, 2023, the Company had a total CECL reserve of $21,675, which included an asset specific component of $11,591 related to five loans. During the six-months ended June 30, 2023, the Company increased the CECL reserve by $18,087, which included $5,122 from adoption of ASU 2016-13 and $12,965 in provision for credit losses bringing the total CECL reserve to $21,675. This CECL reserve reflects certain loans assessed for impairment in the Company’s portfolio as well as reserves determined based on an analysis of macroeconomic conditions. During the six-months ended June 30, 2023, the Company recorded a net increase of $11,591 in the asset-specific component of the CECL reserve. The increase was primarily due to four loans secured by office properties and one loan secured by a multifamily property. While all loans were current on their debt service, the Company observed a decline in the estimated fair value of the collateral since the quarter ended March 31, 2023 due to macroeconomic conditions making the value of the collateral less than the outstanding balances on these loans as of June 30, 2023.
Credit Characteristics
As part of the Company’s process for monitoring the credit quality of its investments, it performs a quarterly asset review of the investment portfolio and assigns risk ratings to each of its loans and certain securities it may own, such as CMBS. Risk factors include payment status, lien position, borrower financial resources and investment in collateral, collateral type, project economics and geographic location, as well as national and regional economic factors. To determine the likelihood of loss, the loans are rated on a 5-point scale as follows:
InPoint Commercial Real Estate Income, Inc.
Notes to Consolidated Financial Statements
June 30, 2024
(Unaudited, dollar amounts in thousands, except per share amounts)
| |
Investment Grade | Investment Grade Definition |
1 | Investment exceeding fundamental performance expectations and/or capital gain expected. Trends and risk factors since time of investment are favorable. |
2 | Performing consistent with expectations and a full return of principal and interest expected. Trends and risk factors are neutral to favorable. |
3 | Performing investment requiring closer monitoring. Trends and risk factors show some deterioration. Collection of principal and interest is still expected. |
4 | Underperforming investment with the potential of some interest loss but still expecting a positive return on investment. Trends and risk factors are negative. |
5 | Underperforming investment with expected loss of interest and some principal. |
All investments are assigned an initial risk rating of 2 at origination or acquisition.
As of June 30, 2024, 16 loans had a risk rating of 2, nine had a risk rating of 3, four had a risk rating of 4 and four had a risk rating of 5. As of December 31, 2023, 24 loans had a risk rating of 2, seven had a risk rating of 3, three had a risk rating of 4 and two had a risk rating of 5.
As of June 30, 2024, the Company has established an asset-specific CECL reserve of $16,740 related to seven loans. Below is a summary of the status of each of the loans:
•A senior loan secured by a multifamily property located in Portland, OR with an outstanding balance of $29,476 and no unfunded commitment was extended in December 2023 to May 9, 2024 to provide the sponsor time to stabilize the rent roll and eventually sell the property. The Company established an interest reserve through maturity that was added to the principal balance in the amount of $1,750. The borrower was unable to sell the property or pay-off the loan at maturity. The Company has begun foreclosure proceedings that are expected to conclude in October 2024. The loan is on nonaccrual status and the Company has recorded an asset-specific CECL reserve of $6,900 on this loan as of June 30, 2024. The loan has a risk rating of 5 as of June 30, 2024.
•A senior loan secured by an office property in Reston, VA with an outstanding loan balance of $13,113, no unfunded commitment and a maturity date of March 9, 2024. The Company has been unsuccessful in negotiating a loan extension with the sponsor. The loan was placed on nonaccrual status as of February 1, 2024. During June 2024, the Company received a letter of intent to purchase the loan at par and the loan sale agreement was signed on August 5, 2024. The Company expects to close the sale in the third quarter of 2024 and, therefore, removed the $3,187 asset-specific CECL reserve that was recorded as of March 31, 2024. The loan has a risk rating of 5 as of June 30, 2024.
•A senior loan secured by two office properties located in Addison, TX with an outstanding balance of $24,411 and no unfunded commitment was in maturity default since September 9, 2023. The loan was on nonaccrual status and the Company had recorded an asset-specific CECL reserve of $281 on this loan as of June 30, 2024. The loan has a risk rating of 5 as of June 30, 2024. On July 2, 2024, the Company foreclosed on the two properties securing the loan. The Company intends to hold these properties as real estate held for use with the intent to eventually sell when the market improves.
•A senior loan secured by an office property located in Charlotte, NC with an outstanding balance of $22,616, no unfunded commitment and a maturity date of October 9, 2025 for which the Company has recorded an asset-specific CECL reserve of $1,854 as of June 30, 2024 as the estimated value of the property securing the loan was below the loan balance. The loan has a risk rating of 3 as of June 30, 2024.
•A senior loan secured by a multifamily property located in Converse, TX with an outstanding balance of $25,696, an unfunded commitment of $114 and a maturity date of November 9, 2024 for which the Company has recorded an asset-specific CECL reserve of $178 as of June 30, 2024 as the estimated value of the property securing the loan was below the loan balance. The loan has a risk rating of 2 as of June 30, 2024.
•A senior loan secured by a multifamily property located in Atlanta, GA with an outstanding balance of $39,967, an unfunded commitment of $33 and a maturity date of December 9, 2024 for which the Company has recorded an asset-specific CECL reserve of $2,530 as of June 30, 2024 as the estimated value of the property securing the loan was below the loan balance. The loan has a risk rating of 2 as of June 30, 2024.
InPoint Commercial Real Estate Income, Inc.
Notes to Consolidated Financial Statements
June 30, 2024
(Unaudited, dollar amounts in thousands, except per share amounts)
•A senior loan secured by a multifamily property located in Shenandoah, TX with an outstanding balance of $29,070, an unfunded commitment of $815 and a maturity date of March 9, 2025 for which the Company has recorded an asset-specific CECL reserve of $997 as of June 30, 2024 as the estimated value of the property securing the loan was below the loan balance. The loan has a risk rating of 2 as of June 30, 2024.
•A credit loan secured by an office property located in Las Vegas, NV with an outstanding balance of $6,000, no unfunded commitment and a maturity date of October 6, 2024 for which the Company has recorded an asset-specific CECL reserve of $4,000 as of June 30, 2024. The office property has a single tenant that will vacate the property at the end of its lease term, which is after the loan maturity date. The Company believes the sponsor will have difficulty refinancing the loan at maturity without a long-term tenant and, as such, has recorded an asset-specific CECL reserve. The loan has a risk rating of 5 as of June 30, 2024. The loan was placed on nonaccrual status effective July 1, 2024.
During the three and six months ended June 30, 2024, the Company recognized $0 and $123, respectively, in interest income related to the nonaccrual status loans. During the three and six months ended June 30, 2024, there was no reversal of interest income as a result of placing the loans on nonaccrual status. For the three and six months ended June 30, 2024, the total interest income forgone on the loans on nonaccrual status was $1,602 and $3,082, respectively.
Loan Modifications
The Company may amend or modify a loan based on its specific facts and circumstances. These modifications are often in the form of a term extension to provide the borrower additional time to refinance or sell the collateral property in order to repay the principal balance of the loan. Such extensions are generally made at the loan’s contractual interest rate and may require an extension fee be paid to the Company. During the three and six months ended June 30, 2024, the Company made one such modification which is disclosable under ASU 2022-02, Troubled Debt Restructurings and Vintage Disclosures, as it was considered an other-than-insignificant payment delay for a borrower experiencing financial difficulty. In this instance, the Company granted a two-year term extension, which can be further extended by one year subject to certain terms and conditions, for a senior loan secured by an office property located in Charlotte, NC described above. The Company waived maturity default interest of $738 on the loan. No principal was forgiven as a result of the modification. The modification provides for payment-in-kind of any accrued interest that exceeds a per annum rate of 4%. The loan’s modified terms were included in the determination of the CECL reserve. The loan had an amortized cost basis of $20,762, which is net of $1,854 of asset-specific CECL reserve on the loan, representing 3.0% of the Company’s commercial mortgage loans as of June 30, 2024. During the three and six months ended June 30, 2023, the Company made no such modifications which are disclosable under ASU 2022-02, Troubled Debt Restructurings and Vintage Disclosures.
Note 4 – Repurchase Agreements and Credit Facilities
Commercial Mortgage Loans
On February 15, 2018, the Company, through a wholly owned subsidiary, entered into a master repurchase agreement (the “Atlas Repo Facility”) with Column Financial, Inc. as administrative agent for certain of its affiliates. As the Company’s business has grown, it has increased the borrowing limit and extended the maturity. The most recent extension was in November 2023 for a twelve-month term and the maximum advance amount was reduced to $100,000. On February 8, 2023, Column Financial, Inc. and affiliated parties sold and assigned their interest in the Atlas Repo Facility to Atlas Securitized Products Investments 2, L.P. (“Atlas”) with no changes to the terms of the Atlas Repo Facility. Advances under the Atlas Repo Facility accrue interest at a per annum annual rate equal to SOFR plus 2.50% to 3.00% with a 0.15% to 0.25% floor. The Company paid off the outstanding balance on the Atlas Repo Facility in May 2023 and had no outstanding balance as of June 30, 2024. As there were no borrowings outstanding, the Company was not subject to any financial covenants.
On May 6, 2019, the Company, through a wholly owned subsidiary, entered into an uncommitted master repurchase agreement (the “JPM Repo Facility”) with JPMorgan Chase Bank, National Association (“JPM”). The JPM Repo Facility provides up to $150,000 in advances that the Company expects to use to finance the acquisition or origination of eligible loans and participation interests therein. Advances made prior to December 2021 under the JPM Repo Facility accrue interest at per annum rates equal to the sum of (i) the applicable one-month USD London Interbank Offered Rate (“LIBOR”) index rate plus (ii) a margin of between 1.75% to 2.50% with no floor, depending on the attributes of the purchased assets. Advances made subsequent to December 2021 under the JPM Repo Facility accrue interest at per annum rates equal to the sum of SOFR plus an agreed upon margin. As of June 30, 2024, all of the advances made under the JPM Repo Facility were indexed to SOFR and have margins between 1.85% and 2.85% with a floor between 0.00% to 2.00%. In May 2022, the maturity date of the JPM Repo Facility was extended to May 6, 2023. On May 5, 2023, the Company entered into an
InPoint Commercial Real Estate Income, Inc.
Notes to Consolidated Financial Statements
June 30, 2024
(Unaudited, dollar amounts in thousands, except per share amounts)
amendment that extended the maturity date to May 6, 2026, with the option to extend the maturity date further to May 6, 2028 subject to two optional one-year extensions. The amendment also increased the maximum facility amount to $526,076. The Company used the increased capacity to pay off the balance on the Atlas Repo Facility. The JPM Repo Facility is subject to certain financial covenants. The Company was in compliance with all financial covenant requirements as of June 30, 2024 and December 31, 2023.
On March 10, 2021, the Company, through a wholly owned subsidiary, entered into a loan and security agreement and a promissory note (collectively, the “WA Credit Facility”) with Western Alliance Bank (“Western Alliance”). The WA Credit Facility provides for loan advances up to the lesser of $75,000 or the borrowing base. The borrowing base consists of eligible assets pledged to and accepted by Western Alliance in its discretion up to the lower of (i) 60% to 70% of loan-to-unpaid balance or (ii) 45% to 50% of the loan-to-appraised value (depending on the property type underlying the asset, for both (i) and (ii)). Assets that would otherwise be eligible become ineligible after being pledged as part of the borrowing base for 36 months. Advances under the WA Credit Facility accrue interest at an annual rate equal to one-month LIBOR plus 3.25% with a floor of 0.75%. The initial maturity date of the WA Credit Facility was March 10, 2023. On March 9, 2023, the Company extended the maturity date of the WA Credit Facility to March 10, 2025, modified that loan advances are up to the lesser of $40,000 or the borrowing base, and changed the index rate from LIBOR to SOFR. In addition, the spread increased to 3.50% and the floor to 2.50%. The Company has an option to convert the loan made pursuant to the WA Credit Facility upon its initial maturity to a term loan with the same interest rate and floor and a maturity of two years in exchange for, among other things, a conversion fee of 0.25% of the outstanding amount at the time of conversion. The WA Credit Facility requires maintenance of an average unrestricted aggregate deposit account balance with Western Alliance of not less than $3,750, until the calendar quarter ending on June 30, 2023 and not less than $5,000 commencing with the calendar quarter ending on September 30, 2023. Failure to meet the minimum deposit balance will result in, among other things, the interest rate of the WA Credit Facility increasing by 0.50% per annum for each quarter in which the compensating balances are not maintained. The Company paid off the outstanding balance on the WA Credit Facility in May 2024 and had no outstanding balance as of June 30, 2024. As there were no borrowings outstanding, the Company was not subject to any financial covenants.
The JPM Repo Facility, Atlas Repo Facility and WA Credit Facility (collectively, the “Facilities”) are used to finance eligible loans and each act in the manner of a revolving credit facility that can be repaid as the Company’s assets are paid off and re-drawn as advances against new assets.
The details of the Facilities as of June 30, 2024 and December 31, 2023 are as follows:
| | | | | | | | | | | | | | | | | | | | | | |
June 30, 2024 | | | | | | | | | | | | | Weighted Average | |
| Committed Financing | | | Amount
Outstanding (1) | | | Accrued
Interest
Payable | | | Collateral
Pledged | | | Interest
Rate | | Days to
Maturity | |
| | | | | | | | | | | | | | | | |
Atlas Repo Facility | $ | 100,000 | | | $ | — | | | $ | — | | | $ | — | | | | — | | | — | |
JPM Repo Facility | | 526,076 | | | | 422,944 | | | | 1,181 | | | | 578,485 | | | | 7.75 | % | | 1,406 | |
Total Repurchase Facilities — commercial mortgage loans | | 626,076 | | | | 422,944 | | | | 1,181 | | | | 578,485 | | | | 7.75 | % | | 1,406 | |
WA Credit Facility | | 40,000 | | | | — | | | | — | | | | — | | | | — | | | — | |
| $ | 666,076 | | | $ | 422,944 | | | $ | 1,181 | | | $ | 578,485 | | | | 7.75 | % | | 1,406 | |
| | | | | | | | | | | | | | | | | | | | | | |
December 31, 2023 | | | | | | | | | | | | | Weighted Average | |
| Committed Financing | | | Amount
Outstanding (1) | | | Accrued
Interest
Payable | | | Collateral
Pledged | | | Interest
Rate | | Days to
Maturity | |
Atlas Repo Facility | $ | 100,000 | | | $ | — | | | $ | — | | | $ | — | | | | — | | | — | |
JPM Repo Facility | | 526,076 | | | | 457,438 | | | | 1,385 | | | | 644,201 | | | | 7.78 | % | | 1,588 | |
Total Repurchase Facilities — commercial mortgage loans | | 626,076 | | | | 457,438 | | | | 1,385 | | | | 644,201 | | | | 7.78 | % | | 1,588 | |
WA Credit Facility | | 40,000 | | | | 9,498 | | | | 42 | | | | 13,647 | | | 9.34% (2) | | | 435 | |
| $ | 666,076 | | | $ | 466,936 | | | $ | 1,427 | | | $ | 657,848 | | | | 7.81 | % | | 1,565 | |
(1)Excluding $0 of unamortized debt issuance costs as of June 30, 2024 and December 31, 2023.
InPoint Commercial Real Estate Income, Inc.
Notes to Consolidated Financial Statements
June 30, 2024
(Unaudited, dollar amounts in thousands, except per share amounts)
(2)Includes 0.50% additional interest rate during the third and fourth quarters of 2023 as the minimum deposit balance was not met by the Company as of June 30, 2023.
Note 5 – Loan Participations Sold, Net
On November 15, 2021, the Company sold a non-recourse senior participation interest in nine first mortgage loans to a third party. Under the loan participation agreement, in the event of default by the underlying mortgagor, any amounts paid are first allocated to the third party before any amounts are allocated to the Company’s subordinate interest. The Company, as the directing participant in the loan participation agreement, is entitled to exercise, without the consent of the third party, each of the consent approval and control rights under the applicable underlying mortgage loan documents with a few exceptions. The Company requires the third party’s approval for any modification or amendment to the loan, a bankruptcy plan for an underlying mortgagor where the third party would incur an out-of-pocket loss, or any transfer of the underlying mortgaged property if the Company’s approval is required by the underlying mortgage documents. The Company remains the directing participant unless certain conditions are met related to losses on the property or if the mortgagor is an affiliate of the Company. In the former case, the Company may post cash or short-term U.S. government securities as collateral to retain the rights of the directing participant.
The third party, as the senior participation interest holder, receives interest and principal payments from the borrower until they receive the amounts to which they are entitled. All expenses or losses on the underlying mortgages are allocated first to the Company and then to the third party. If the underlying mortgage is in default, the Company will have the option to purchase the third party’s participation interest and remove it from the loan participation agreement.
The financing or transfer of a portion of a loan by the non-recourse sale of a senior interest in the loan through a participation agreement generally does not qualify as a sale under GAAP. Therefore, in this instance, the Company presents the whole loan as an asset and the loan participation sold as a liability on the consolidated balance sheet until the loan is repaid. The obligation to pay principal and interest on these liabilities is generally based on the performance of the related loan obligation. The gross presentation of loan participations sold does not impact stockholders’ equity or net income.
The following tables detail the Company’s loan participations sold as of June 30, 2024 and December 31, 2023:
| | | | | | | | | | | | | | | | | | | | |
| | June 30, 2024 | |
Loan Participations Sold | | Count | | | Principal Balance | | | Book Value | | | Yield/Cost (1) | | Guarantee (2) | | Weighted Average Maximum Maturity (4) | |
Total Loans | | | 4 | | | $ | 70,282 | | | $ | 68,262 | | | SOFR+3.5% | | n/a | | | 0.19 | |
Senior participations (3) | | | 4 | | | $ | 56,226 | | | $ | 56,226 | | | SOFR+2.0% | | n/a | | | 0.19 | |
| | | | | | | | | | | | | | | | | | | | |
| | December 31, 2023 | |
Loan Participations Sold | | Count | | | Principal Balance | | | Book Value | | | Yield/Cost (1) | | Guarantee (2) | | Weighted Average Maximum Maturity (4) | |
Total Loans | | | 4 | | | $ | 71,532 | | | $ | 65,435 | | | SOFR+3.5% | | n/a | | | 0.11 | |
Senior participations (3) | | | 4 | | | $ | 57,226 | | | $ | 57,226 | | | SOFR+2.0% | | n/a | | | 0.11 | |
____________ | | | | | | | | | | | | | | | | |
(1)The yield/cost is the present value of all future principal and interest payments on the loan or participation interest and does not include any origination fees or deferred commitment fees. The yield/cost excludes maturity default interest and interest on loans placed on nonaccrual status.
(2)As of June 30, 2024 and December 31, 2023, the loan participations sold were non-recourse to the Company.
(3)During the six months ended June 30, 2024 and 2023, the Company recorded $1,456 and $2,988 of interest expense related to loan participations sold, respectively.
(4)Based on the furthest maximum maturity date of all the loans subject to the participation agreement.
InPoint Commercial Real Estate Income, Inc.
Notes to Consolidated Financial Statements
June 30, 2024
(Unaudited, dollar amounts in thousands, except per share amounts)
Note 6 – Stockholders’ Equity
Preferred Stock Offering
On September 22, 2021, the Company issued and sold 3,500,000 shares of the Series A Preferred Stock at a public offering price of $25.00 per share. In addition, on October 15, 2021, Raymond James & Associates, Inc., as representative of the underwriters, partially exercised their over-allotment option to purchase an additional 100,000 shares of Series A Preferred Stock. The Series A Preferred Stock were issued and sold pursuant to an effective registration statement on Form S-11 (File No. 333-258802) filed with the SEC. The Company received net proceeds of approximately $86,310, after underwriter’s discount and issuance costs, and contributed the net proceeds to the Operating Partnership in exchange for an equivalent number of Series A units in the Operating Partnership.
Dividends on the Series A Preferred Stock are cumulative and payable quarterly in arrears at a rate per annum equal to 6.75% per annum of the $25.00 liquidation preference (the “Initial Rate”). Subject to certain exceptions, upon a Downgrade Event (as such terms are defined in the Articles Supplementary designating the Series A Preferred Stock (the “Articles Supplementary”)) or where any shares of the Series A Preferred Stock remain outstanding after September 22, 2026, the Series A Preferred Stock will thereafter accrue cumulative cash dividends at a rate higher than the Initial Rate.
Subject to certain exceptions, upon the occurrence of a Change of Control, each holder of shares of Series A Preferred Stock will have the right to convert some or all of the Series A Preferred Stock held by such holder into a number of the Company’s shares of Class I common stock as provided for in the Articles Supplementary.
The Company may not redeem the Series A Preferred Stock prior to September 22, 2026, except in limited circumstances relating to maintaining the Company’s qualification as a REIT and in connection with a Change of Control. On and after September 22, 2026, the Company may, at its option, redeem the Series A Preferred Stock, in whole or from time-to-time in part, at a price of $25.00 per share of Series A Preferred Stock plus an amount equal to accrued and unpaid dividends (whether or not declared), if any. The Series A Preferred Stock has no maturity date and will remain outstanding indefinitely unless redeemed by the Company or converted by the holder pursuant to its terms (as set forth in the Articles Supplementary).
On August 11, 2022, the Board authorized and approved a share repurchase program (the “Series A Preferred Repurchase Program”) pursuant to which the Company was permitted to repurchase up to the lesser of 1,000,000 shares or $15,000 of the outstanding shares of the Company’s Series A Preferred Stock through December 31, 2022. On November 10, 2022, the Board approved to extend the Series A Preferred Repurchase Program through December 31, 2023. Under the Series A Preferred Repurchase Program, repurchases of shares of the Company’s Series A Preferred Stock were to be made at management’s discretion from time to time through open market purchases, privately-negotiated transactions, block purchases or otherwise in accordance with applicable federal securities laws. During the three and six months ended June 30, 2024, the Company repurchased and retired zero shares of Series A Preferred Stock. During the three and six months ended June 30, 2023, the Company repurchased and retired zero shares and 4,143 shares, respectively, of Series A Preferred Stock resulting in a gain of zero and $21, respectively, from these repurchases. On January 30, 2023, the Board approved the termination of the Series A Preferred Repurchase Program.
The Series A Preferred Stock is listed on the New York Stock Exchange under the symbol ICR PR A.
Share Activity for Common Stock and Preferred Stock
The following tables detail the change in the Company’s outstanding shares of all classes of common and preferred stock, including restricted common stock:
| | | | | | | | | | | | | | | | | | | | | |
| Preferred Stock | | Common Stock | |
Six months ended June 30, 2024 | Series A | | Class P | | Class A | | Class T | | Class S | | Class D | | Class I | |
Beginning balance | | 3,544,553 | | | 8,562,777 | | | 745,887 | | | 290,345 | | | — | | | 48,015 | | | 469,168 | |
Administrative correction | | — | | | — | | | (6 | ) | | — | | | — | | | — | | | — | |
Ending balance | | 3,544,553 | | | 8,562,777 | | | 745,881 | | | 290,345 | | | — | | | 48,015 | | | 469,168 | |
InPoint Commercial Real Estate Income, Inc.
Notes to Consolidated Financial Statements
June 30, 2024
(Unaudited, dollar amounts in thousands, except per share amounts)
| | | | | | | | | | | | | | | | | | | | | |
| Preferred Stock | | Common Stock | |
Six months ended June 30, 2023 | Series A | | Class P | | Class A | | Class T | | Class S | | Class D | | Class I | |
Beginning balance | | 3,548,696 | | | 8,562,777 | | | 743,183 | | | 286,341 | | | — | | | 47,888 | | | 452,667 | |
Issuance of shares | | — | | | — | | | 1,445 | | | 3,453 | | | — | | | — | | | 12,386 | |
Distribution reinvestment | | — | | | — | | | 1,259 | | | 551 | | | — | | | 127 | | | 2,393 | |
Repurchase and retirement of preferred stock | | (4,143 | ) | | — | | | — | | | — | | | — | | | — | | | — | |
Ending balance | | 3,544,553 | | | 8,562,777 | | | 745,887 | | | 290,345 | | | — | | | 48,015 | | | 467,446 | |
Distributions – Common Stock and Series A Preferred Stock
The table below presents the aggregate annualized and monthly distributions declared on common stock by record date for all classes of shares.
| | | | | | | | |
Record date | | Aggregate annualized gross distribution declared per share | | | Aggregate monthly gross distribution declared per share | |
January 31, 2023 | | $ | 1.2500 | | | $ | 0.1042 | |
February 28, 2023 | | $ | 1.2500 | | | $ | 0.1042 | |
March 31, 2023 | | $ | 1.2500 | | | $ | 0.1042 | |
April 30, 2023 | | $ | 1.2500 | | | $ | 0.1042 | |
May 31, 2023 | | $ | 1.2500 | | | $ | 0.1042 | |
June 30, 2023 | | $ | 1.2500 | | | $ | 0.1042 | |
July 31, 2023 | | $ | 1.2500 | | | $ | 0.1042 | |
August 31, 2023 | | $ | 1.2500 | | | $ | 0.1042 | |
September 30, 2023 | | $ | 1.2500 | | | $ | 0.1042 | |
October 31, 2023 | | $ | 1.2500 | | | $ | 0.1042 | |
November 30, 2023 | | $ | 1.2500 | | | $ | 0.1042 | |
December 31, 2023 | | $ | 1.2500 | | | $ | 0.1042 | |
January 30, 2024 | | $ | 1.2500 | | | $ | 0.1042 | |
February 29, 2024 | | $ | 1.2500 | | | $ | 0.1042 | |
March 31, 2024 | | $ | 1.2500 | | | $ | 0.1042 | |
April 30, 2024 | | $ | 1.2500 | | | $ | 0.1042 | |
May 31, 2024 | | $ | 1.2500 | | | $ | 0.1042 | |
June 30, 2024 | | $ | 1.2500 | | | $ | 0.1042 | |
The gross distribution was reduced each month for Class D and Class T of the Company’s common stock for applicable class-specific stockholder servicing fees to arrive at a lower net distribution amount paid to those classes. For a description of the stockholder servicing fees applicable to Class D, Class S and Class T shares of the Company’s common stock, please see “Note 10 – Transactions with Related Parties” below. Since the IPO and through June 30, 2024, the Company had not issued any shares of Class S common stock.
InPoint Commercial Real Estate Income, Inc.
Notes to Consolidated Financial Statements
June 30, 2024
(Unaudited, dollar amounts in thousands, except per share amounts)
The following table shows the monthly net distribution per share for shares of Class D and Class T common stock.
| | | | | | | | |
Record date | | Monthly net distribution declared per share of Class D common stock | | | Monthly net distribution declared per share of Class T common stock | |
January 31, 2023 | | $ | 0.1000 | | | $ | 0.0900 | |
February 28, 2023 | | $ | 0.1004 | | | $ | 0.0914 | |
March 31,2023 | | $ | 0.1001 | | | $ | 0.0903 | |
April 30,2023 | | $ | 0.1002 | | | $ | 0.0907 | |
May 31, 2023 | | $ | 0.1001 | | | $ | 0.0903 | |
June 30, 2023 | | $ | 0.1004 | | | $ | 0.0912 | |
July 31, 2023 | | $ | 0.1005 | | | $ | 0.0916 | |
August 31, 2023 | | $ | 0.1005 | | | $ | 0.0915 | |
September 30, 2023 | | $ | 0.1006 | | | $ | 0.0920 | |
October 31, 2023 | | $ | 0.1005 | | | $ | 0.0916 | |
November 30, 2023 | | $ | 0.1006 | | | $ | 0.0920 | |
December 31, 2023 | | $ | 0.1005 | | | $ | 0.0916 | |
January 30, 2024 | | $ | 0.1006 | | | $ | 0.0919 | |
February 29, 2024 | | $ | 0.1008 | | | $ | 0.0927 | |
March 31, 2024 | | $ | 0.1006 | | | $ | 0.0920 | |
April 30, 2024 | | $ | 0.1007 | | | $ | 0.0925 | |
May 31, 2024 | | $ | 0.1006 | | | $ | 0.0921 | |
June 30, 2024 | | $ | 0.1008 | | | $ | 0.0925 | |
Series A Preferred Stock dividends are paid quarterly in arrears based on an annualized distribution rate of 6.75% of the $25.00 per share liquidation preference, or $1.6875 per share per annum.
The tables below present the aggregate distributions declared per share for each applicable class of common stock and preferred stock during the six months ended June 30, 2024 and 2023. The tables exclude distributions declared for any month for a class of shares of stock when there were no shares of that class outstanding on the applicable record date.
| | | | | | | | | | | | | | | | | | | | | |
| Preferred Stock | | Common Stock | |
Six months ended June 30, 2024 | Series A | | Class P | | Class A | | Class T | | Class S | | Class D | | Class I | |
Aggregate gross distributions declared per share | $ | 0.8438 | | $ | 0.6252 | | $ | 0.6252 | | $ | 0.6252 | | $ | — | | $ | 0.6252 | | $ | 0.6252 | |
Stockholder servicing fee per share | N/A | | N/A | | N/A | | | 0.0715 | | | — | | | 0.0211 | | $ | — | |
Net distributions declared per share | $ | 0.8438 | | $ | 0.6252 | | $ | 0.6252 | | $ | 0.5537 | | $ | — | | $ | 0.6041 | | $ | 0.6252 | |
| | | | | | | | | | | | | | |
| Preferred Stock | | Common Stock | |
Six months ended June 30, 2023 | Series A | | Class P | | Class A | | Class T | | Class S | | Class D | | Class I | |
Aggregate gross distributions declared per share | $ | 0.8438 | | $ | 0.6252 | | $ | 0.6252 | | $ | 0.6252 | | $ | — | | $ | 0.6252 | | $ | 0.6252 | |
Stockholder servicing fee per share | N/A | | N/A | | N/A | | | 0.0813 | | | — | | | 0.0240 | | N/A | |
Net distributions declared per share | $ | 0.8438 | | $ | 0.6252 | | $ | 0.6252 | | $ | 0.5439 | | $ | — | | $ | 0.6012 | | $ | 0.6252 | |
As of June 30, 2024 and December 31, 2023, distributions declared but not yet paid amounted to $1,051 and $1,050, respectively.
Note 7 – Net Income Per Share Attributable to Common Stockholders
Basic earnings per share attributable to common stockholders (“EPS”) is computed by dividing net income attributable to common stockholders by the weighted average number of common shares outstanding for the period. Diluted EPS is computed by dividing net income attributable to common stockholders by the common shares plus common share equivalents. The Company’s common share equivalents are unvested restricted shares. The Company excludes antidilutive restricted shares from the calculation of weighted-average shares for diluted earnings per share. There were 784 and 562 antidilutive restricted shares for the three and six months ended June 30, 2024, respectively. There were zero antidilutive restricted shares for both the three and six months ended June 30, 2023. For further information about the Company’s restricted shares, see “Note 11 – Equity-Based Compensation.”
InPoint Commercial Real Estate Income, Inc.
Notes to Consolidated Financial Statements
June 30, 2024
(Unaudited, dollar amounts in thousands, except per share amounts)
The following table is a summary of the basic and diluted net income per share attributable to common stockholders computation for the three and six months ended June 30, 2024 and 2023:
| | | | | | | | | | | | | | | | |
| | Three months ended June 30, | | | Six months ended June 30, | |
| | 2024 | | | 2023 | | | 2024 | | | 2023 | |
Net income (loss) attributable to common stockholders | | $ | 3,494 | | | $ | (16,831 | ) | | $ | 5,398 | | | $ | (13,684 | ) |
Weighted average shares outstanding, basic | | | 10,116,191 | | | | 10,114,470 | | | | 10,116,186 | | | | 10,113,849 | |
Dilutive effect of restricted stock | | | 784 | | | | — | | | | 562 | | | | — | |
Weighted average shares outstanding, diluted | | | 10,116,975 | | | | 10,114,470 | | | | 10,116,748 | | | | 10,113,849 | |
Net income (loss) attributable to common stockholders per share, basic and diluted | | $ | 0.35 | | | $ | (1.66 | ) | | $ | 0.53 | | | $ | (1.35 | ) |
Note 8 – Commitments and Contingencies
In the ordinary course of business, the Company may become subject to litigation, claims and regulatory matters. The Company has no knowledge of material legal or regulatory proceedings pending or known to be contemplated against the Company at this time.
The Company has made a commitment to advance additional funds under certain of its CRE loans if the borrower meets certain conditions. As of June 30, 2024, the Company had 19 such loans with a total remaining future funding commitment of $16,577. As of December 31, 2023, the Company had 27 such loans with a total remaining future funding commitment of $31,021. The Company could advance future funds at its discretion if requested by the borrower and the borrower meets certain requirements as specified in individual loan agreements.
Note 9 – Segment Reporting
The Company has one reportable segment as defined by GAAP for the six months ended June 30, 2024 and 2023.
Note 10 – Transactions with Related Parties
As of June 30, 2024, the Advisor had invested $1,000 in the Company through the purchase of 40,040 Class P shares. The purchase price per Class P share for the Advisor’s investment was equal to $25.00. The Advisor has agreed that, for so long as it or its affiliate is serving as the Company’s advisor, (i) it will not sell or transfer at least 8,000 of the Class P shares that it has purchased, accounting for $200 of its investment, to an unaffiliated third party and (ii) repurchase requests made for these Class P shares will only be accepted (a) on the last business day of a calendar quarter, (b) after all repurchase requests from all other stockholders for such quarter have been accepted and (c) to the extent that such repurchases do not cause total repurchases in the quarter in which they are being repurchased to exceed that quarter’s repurchase cap.
As of June 30, 2024, Sound Point Capital Management, LP (“Sound Point”), an affiliate of the Sub-Advisor, had invested $3,000 in the Company through the purchase of 120,000 Class P shares. The purchase price per Class P share for the Sub-Advisor’s investment was $25.00. Sound Point has agreed that, for so long as the Sub-Advisor or its affiliate is serving as the Company’s sub-advisor, repurchase requests made for these Class P shares will only be accepted (a) on the last business day of a calendar quarter, (b) after all repurchase requests from all other stockholders for such quarter have been accepted and (c) to the extent that such repurchases do not cause total repurchases in the quarter in which they are being repurchased to exceed that quarter’s repurchase cap.
InPoint Commercial Real Estate Income, Inc.
Notes to Consolidated Financial Statements
June 30, 2024
(Unaudited, dollar amounts in thousands, except per share amounts)
The following table summarizes the Company’s related party transactions for the three and six months ended June 30, 2024 and 2023 and the amount due to related parties as of June 30, 2024 and December 31, 2023:
| | | | | | | | | | | | | | | | | | | | | | | | |
| | Three months ended
June 30, | | | Six months ended
June 30, | | | Payable as of
June 30, | | | Payable as of
December 31, | |
| | 2024 | | | 2023 | | | 2024 | | | 2023 | | | 2024 | | | 2023 | |
Organization and offering expense reimbursement (1) | | $ | 2 | | | $ | (1 | ) | | $ | 2 | | | $ | — | | | $ | — | | | $ | 2 | |
Selling commissions and dealer manager fee (2) | | | — | | | | — | | | | — | | | | 4 | | | | — | | | | — | |
Advisory fee (3) | | | 799 | | | | 861 | | | | 1,604 | | | | 1,742 | | | | 266 | | | | 271 | |
Loan fees(4) | | | 26 | | | | 89 | | | | 84 | | | | 180 | | | | 981 | | | | 1,313 | |
Accrued stockholder servicing fee (5) | | | — | | | | — | | | | — | | | | 4 | | | | 424 | | | | 442 | |
Total | | $ | 827 | | | $ | 949 | | | $ | 1,690 | | | $ | 1,930 | | | $ | 1,671 | | | $ | 2,028 | |
(1)The Company reimburses the Advisor, the Sub-Advisor and their respective affiliates for costs and other expenses related to the Public Offerings, provided the Advisor has agreed to reimburse the Company to the extent that the organization and offering expenses that the Company incurs exceeds 15% of its gross proceeds from the Public Offerings.
(2)For the Public Offerings, the Dealer Manager was entitled to receive (a) upfront selling commissions of up to 6.0%, and upfront dealer manager fees of up to 1.25%, of the transaction price of each Class A share sold in the primary offering, however such amounts may vary at certain participating broker-dealers provided that the sum will not exceed 7.25% of the transaction price; (b) upfront selling commissions of up to 3.0%, and upfront dealer manager fees of 0.5%, of the transaction price of each Class T share sold in the primary offering, however such amounts may vary at certain participating broker-dealers provided that the sum will not exceed 3.5% of the transaction price; and (c) upfront selling commissions of up to 3.5% of the transaction price of each Class S share sold in the primary offering. No upfront selling commissions or dealer manager fees are paid with respect to purchases of Class D shares, Class I shares or shares of any class sold pursuant to the Company’s DRP. All upfront selling commissions and dealer manager fees were reallowed (paid) by the Dealer Manager to participating broker-dealers.
(3)The Advisor is entitled to receive an advisory fee comprised of two separate components: (a) a fixed component payable monthly and (b) a performance component payable annually. The fixed component of the advisory fee is paid in an amount equal to 1/12th of 1.25% of the Company’s average NAV for each month, paid monthly in arrears. The performance component of the advisory fee is calculated and paid annually, such that for any year in which the Company’s total return per share exceeds 7% per annum, the Advisor will receive 20% of the excess total return allocable to shares of the Company’s common stock; provided that in no event will the performance fee exceed 15% of the aggregate total return allocable to shares of the Company’s common stock for such year. In addition, if the NAV per share decreases below $25 for any class of shares during the measurement period, any subsequent increase in NAV per share to $25 (or such other adjusted number) will not be included in the calculation of the performance component with respect to that class. The Advisor pays fees to the Sub-Advisor for the services it delegates to the Sub-Advisor or may direct the Company to pay a portion of the fees otherwise payable to the Advisor directly to the Sub-Advisor.
(4)The Company pays the Advisor all new loan origination and administrative fees related to CRE loans held for investment, to the extent that such fees are paid by the borrower. Pursuant to the Sub-Advisory Agreement, the Advisor generally will reallow a portion of loan fees and all administrative fees to the Sub-Advisor.
(5)Subject to the Financial Industry Regulatory Authority, Inc. limitations on underwriting compensation, the Company pays the Dealer Manager selling commissions over time as stockholder servicing fees for ongoing services rendered to stockholders by participating broker-dealers or broker-dealers servicing stockholders’ accounts as follows: (a) for Class T shares only, 0.85% per annum of the NAV of the Class T shares; (b) for Class S shares only, 0.85% per annum of the aggregate NAV for the Class S shares; and (c) for Class D shares only, 0.25% per annum of the aggregate NAV for the Class D shares. The Company will cease paying the stockholder servicing fee with respect to any Class T share, Class S share or Class D share held in a stockholder’s account upon the occurrence of certain events. The Company accrues the full cost of the stockholder servicing fee as an offering cost at the time the Company sells Class T, Class S, and Class D shares. The Dealer Manager does not retain any of these fees, all of which are retained by, or reallowed (paid) to, participating broker-dealers and servicing broker-dealers for ongoing stockholder services performed by such broker-dealers.
InPoint Commercial Real Estate Income, Inc.
Notes to Consolidated Financial Statements
June 30, 2024
(Unaudited, dollar amounts in thousands, except per share amounts)
Expense Limitation Agreement
Pursuant to an expense limitation agreement (the “Expense Limitation Agreement”) dated July 1, 2021, the Advisor and Sub-Advisor agree to waive reimbursement of or pay, on a quarterly basis, certain of the Company’s ordinary operating expenses for each class of shares to the extent necessary to ensure that the ordinary operating expenses do not exceed 1.5% of the average monthly net assets on an annualized basis (the “1.5% Expense Limit”). Amounts waived or paid by the Advisor or Sub-Advisor pursuant to the Expense Limitation Agreement are subject to conditional repayment on a quarterly basis by the Company during the three years following the quarter in which the expenses were incurred, but only to the extent such repayment does not cause the Company to exceed its then-current expenses limitation, if any, for such quarter. Any waiver or reimbursement by the Advisor or Sub-Advisor not repaid by the Company within the three-year period will be deemed permanently waived and not subject to repayment under the Expense Limitation Agreement. During the six months ended June 30, 2024, the amount of ordinary operating expenses either submitted for reimbursement by the Advisor and Sub-Advisor or incurred by the Company directly that was subject to the Expense Limitation Agreement did not exceed the 1.5% Expense Limit.
Separately from the limitation on ordinary operating expenses under the Expense Limitation Agreement, the Advisor and Sub-Advisor voluntarily chose not to seek reimbursement for certain expenses that they incurred or paid on behalf of the Company during the six months ended June 30, 2024, and for which they may have been entitled to be reimbursed. The Advisory Agreement and Sub-Advisory Agreement provide that expenses will be submitted monthly to the Company for reimbursement, and the amount of expenses submitted for reimbursement in any particular month is not necessarily indicative of the total amount of expenses actually incurred by the Advisor and Sub-Advisor in providing services to the Company and for which reimbursement could have been received by the Advisor and Sub-Advisor.
Revolving Credit Liquidity Letter Agreements
IREIC, the Company’s sponsor, and Sound Point have agreed under separate letter agreements dated July 20, 2021, and July 15, 2021, respectively, to make revolving credit loans to the Company in an aggregate principal amount outstanding at any one time not to exceed $5,000 and $15,000, respectively (the “IREIC-Sound Point Commitments”) from time to time until the Termination Date (defined below) of the letter agreements. These letter agreements are identical to each other in all material respects other than the commitment amounts. Use of the IREIC-Sound Point Commitments is limited to satisfying requirements to maintain cash or cash equivalents under the Company’s repurchase and other borrowing arrangements. The “Termination Date” is the earliest of (i) the Maturity Date (defined below) (ii) the first date on which the Company’s balance sheet equity is equal to or greater than $500,000, (iii) the date IREIC or one of its affiliates is no longer the Company’s advisor or Sound Point or one of its affiliates is no longer the Company’s sub-advisor and (iv) such earlier date on which the commitment will terminate as provided in the letter agreements, for example, because of an event of default. The “Maturity Date” is one year from the date of the agreement, and the Maturity Date will be automatically extended every year for an additional year, unless (a) the lender delivers notice of termination 60 days prior to an anniversary of the letter agreements or (b) an Event of Default (defined below) has occurred and is continuing. Each revolving loan will bear interest at 6.00% per annum. Interest is payable in arrears when principal is paid or repaid and on the Termination Date. Each of the following constitutes an “Event of Default” under the letter agreements: (y) the Company fails to perform or observe any covenant or condition to be performed or observed under the letter agreement (including the obligation to repay a loan in full on the Termination Date) and such failure is not remedied within three business days of its receipt of notice thereof; or (z) the Company becomes insolvent or the subject of any bankruptcy proceeding.
Note 11 – Equity-Based Compensation
With each stock grant, the Company awards each of its three independent directors an equal number of restricted shares. The table below summarizes total stock grants as of June 30, 2024 with a vesting date after January 1, 2023.
| | | | | | | | | | | | | | | | |
Grant Date | Class of common stock granted | Total number of shares granted | | Grant Date Fair Value Per Share | | Total Fair Value of Grant | | Proportion of total shares that vest annually | | Vesting Date Year 1 | Vesting Date Year 2 | Vesting Date Year 3 |
December 1, 2020 | Class I | | 1,393 | | $ | 21.54 | | $ | 30 | | | 1/3 | | 12/1/2021 | 12/1/2022 | 12/1/2023 |
October 14, 2021 | Class I | | 1,477 | | $ | 20.31 | | $ | 30 | | | 1/3 | | 10/14/2022 | 10/14/2023 | 10/14/2024 |
October 3, 2022 | Class I | | 1,534 | | $ | 19.55 | | $ | 30 | | | 1/3 | | 10/3/2023 | 10/3/2024 | 10/3/2025 |
September 29, 2023 | Class I | | 1,722 | | $ | 17.42 | | $ | 30 | | | 1/3 | | 9/29/2024 | 9/29/2025 | 9/29/2026 |
InPoint Commercial Real Estate Income, Inc.
Notes to Consolidated Financial Statements
June 30, 2024
(Unaudited, dollar amounts in thousands, except per share amounts)
Under the Company’s Independent Director Restricted Share Plan (the “RSP”), restricted shares generally vest over a three-year vesting period from the date of the grant, subject to the specific terms of the grant. Restricted shares are included in common stock outstanding on the grant date. The grant-date value of the restricted shares is amortized over the vesting period representing the requisite service period. Compensation expense associated with the restricted shares issued to the independent directors was $7 and $15, in the aggregate, for the three and six months ended June 30, 2024, respectively. Compensation expense associated with the restricted shares issued to the independent directors was $8 and $15, in the aggregate, for the three and six months ended June 30, 2023, respectively. As of June 30, 2024, the Company had $38 of unrecognized compensation expense related to the unvested restricted shares, in the aggregate. The weighted average remaining period that compensation expense related to unvested restricted shares will be recognized is 0.95 years. There were no restricted shares that vested during the six months ended June 30, 2024 and 2023.
A summary table of the status of the restricted shares granted under the RSP is presented below:
| | | | | | | | |
| | Restricted Shares | | | Weighted Average Grant Date Fair Value Per Share | |
Outstanding at December 31, 2023 | | | 3,237 | | | $ | 18.53 | |
Granted | | | — | | | | — | |
Vested | | | — | | | | — | |
Converted | | | — | | | | — | |
Forfeited | | | — | | | | — | |
Outstanding at June 30, 2024 | | | 3,237 | | | $ | 18.53 | |
Note 12 – Fair Value of Financial Instruments
GAAP requires the disclosure of fair value information about financial instruments, whether or not they are recognized at fair value in the consolidated balance sheets, for which it is practicable to estimate that value. The following table details the carrying amount and estimated fair value of the Company’s financial instruments at the dates below:
| | | | | | | | | | | | | | | |
| June 30, 2024 | | | December 31, 2023 | |
| Carrying
Amount | | | Estimated Fair
Value | | | Carrying
Amount | | | Estimated Fair
Value | |
Financial assets | | | | | | | | | | | |
Cash and cash equivalents | $ | 44,557 | | | $ | 44,557 | | | $ | 54,143 | | | $ | 54,143 | |
Commercial mortgage loans, net | | 684,406 | | | | 684,406 | | | | 722,003 | | | | 722,003 | |
Total | $ | 728,963 | | | $ | 728,963 | | | $ | 776,146 | | | $ | 776,146 | |
Financial liabilities | | | | | | | | | | | |
Repurchase agreements — commercial mortgage
loans | $ | 422,944 | | | $ | 422,944 | | | $ | 457,438 | | | $ | 457,438 | |
Credit facility payable | | — | | | | — | | | | 9,498 | | | | 9,498 | |
Loan participations — sold | | 56,226 | | | | 56,226 | | | | 57,226 | | | | 57,226 | |
Total | $ | 479,170 | | | $ | 479,170 | | | $ | 524,162 | | | $ | 524,162 | |
The following describes the Company’s methods for estimating the fair value for financial instruments:
•The estimated fair values of restricted cash, cash and cash equivalents were based on the bank balance and was a Level 1 fair value measurement.
•The estimated fair value of commercial mortgage loans, net is a Level 3 fair value measurement. The majority of the loans are floating rate and as such the interest rates on such loans reflect the current interest rate spreads. Additionally, since the loans have a short duration to maturity (0.6 years), are not delinquent or impaired (except for three loans impaired as of June 30, 2024 and two loans impaired as of December 31, 2023, for which an asset-specific CECL reserve has been recorded) and are expected to return to par, the Advisor determined the amortized cost, less allowance for credit losses, is the best estimate of fair value for all loans. The allowance for credit losses includes the analytical portion as well as the asset-specific component of the CECL reserve.
InPoint Commercial Real Estate Income, Inc.
Notes to Consolidated Financial Statements
June 30, 2024
(Unaudited, dollar amounts in thousands, except per share amounts)
For the impaired loans, the CECL reserve was recorded based on the Company’s estimation of the fair value of the loans’ aggregate underlying collateral as of June 30, 2024 and December 31, 2023, as applicable. These loans are therefore measured at fair value on a nonrecurring basis using significant unobservable inputs and are classified as Level 3 assets in the fair value hierarchy. The Company estimated the fair value of these loans by considering a variety of inputs including property performance, market data, and comparable sales, as applicable. The significant unobservable input used is the exit capitalization rate assumption used to forecast the future sale price of the underlying real estate collateral, which ranged from 5.75% to 9.40% and had weighted average of 7.76%.
•The estimated fair values of repurchase agreements – commercial mortgage loans, credit facility payable and loan participations sold are Level 3 fair value measurements based on expected present value techniques. This method discounts future estimated cash flows using rates the Company determined best reflect current market interest rates that would be offered for repurchase agreements, credit facilities and loan participations sold with similar characteristics and credit quality. The carrying value of these instruments approximates fair value as the fair value of these instruments is not materially sensitive to shifts in market interest rates because of the floating interest rates on these instruments.
Note 13– Leases
Prior to September 28, 2023, the Company was the lessee under one ground lease. The ground lease, which commenced on April 1, 1999, was assumed as part of the Renaissance O’Hare property acquired through a deed-in-lieu of foreclosure transaction on August 20, 2020. The lease was classified as a finance lease. Upon the sale of the property on September 28, 2023, the Company was no longer obligated under the ground lease.
Upon assumption of the lease on August 20, 2020, the Company recorded a lease liability of $16,827 and a right-of-use asset of $5,549 on its consolidated balance sheet. The lease liability was based on the present value of the ground lease’s future payments using an interest rate of 11.37%, which the Company considered reasonable and an estimate of the Company’s incremental borrowing rate.
For the three and six months ended June 30, 2023, total finance lease cost recorded to real estate operating expenses on the Company’s consolidated statements of operations was comprised as follows:
| | | | | | | | | |
| | | Three months ended
June 30, 2023 | | | Six months ended
June 30, 2023 | |
Amortization of right-of-use assets | | | $ | 12 | | | $ | 30 | |
Interest on lease liabilities | | | | 500 | | | | 997 | |
Total finance lease cost | | | $ | 512 | | | $ | 1,027 | |
Note 14– Subsequent Events
The Company has evaluated subsequent events through August 9, 2024, the date the consolidated financial statements were issued, and determined that there have not been any events that have occurred that would require adjustments to disclosures in the consolidated financial statements except for the following transactions:
Foreclosure
On July 2, 2024, the Company acquired, through non-judicial foreclosure transactions, two office properties located in Addison, TX. The properties previously collateralized a senior loan with an outstanding balance of $24,411 and no unfunded commitment as of June 30, 2024. The loan was on nonaccrual status and the Company had recorded an asset-specific CECL reserve of $281 on this loan as of June 30, 2024. The transactions were accounted for as asset acquisitions under ASC 805.
InPoint Commercial Real Estate Income, Inc.
Notes to Consolidated Financial Statements
June 30, 2024
(Unaudited, dollar amounts in thousands, except per share amounts)
Common Stock Distributions
On July 30, 2024, the Company announced that the Board authorized distributions to stockholders of record as of July 31, 2024, payable on or about August 19, 2024 for each class of its common stock in the amount per share set forth below:
| | | | | | | | | | | | | | | | | | | | | | | | |
| | Common Stock | |
| | Class P | | | Class A | | | Class T | | | Class S | | | Class D | | | Class I | |
Aggregate gross distributions declared per share | | $ | 0.1042 | | | $ | 0.1042 | | | $ | 0.1042 | | | $ | — | | | $ | 0.1042 | | | $ | 0.1042 | |
Stockholder servicing fee per share | | N/A | | | N/A | | | | 0.0121 | | | | — | | | | 0.0036 | | | N/A | |
Net distributions declared per share | | $ | 0.1042 | | | $ | 0.1042 | | | $ | 0.0921 | | | $ | — | | | $ | 0.1006 | | | $ | 0.1042 | |
Item 2. Management’s Discussion and Analysis of Financial Condition and Results of Operations
Forward-Looking Statements
Certain statements in this Quarterly Report on Form 10-Q constitute “forward-looking statements” within the meaning of Section 27A of the Securities Act of 1933, as amended (the “Securities Act”), and Section 21E of the Securities Exchange Act of 1934, as amended (the “Exchange Act”). Words such as “may,” “could,” “should,” “expect,” “intend,” “plan,” “goal,” “seek,” “anticipate,” “believe,” “estimate,” “predict,” “variables,” “potential,” “continue,” “expand,” “maintain,” “create,” “strategies,” “likely,” “will,” “would” and variations of these terms and similar expressions, or the negative of these terms or similar expressions, are intended to identify forward-looking statements.
These forward-looking statements are not historical facts but reflect the intent, belief or current expectations of the management of InPoint Commercial Real Estate Income, Inc. (which we refer to herein as the “Company,” “we,” “our” or “us”) based on their knowledge and understanding of the business and industry, the economy and other future conditions. These statements are not guarantees of future performance, and we caution stockholders not to place undue reliance on forward-looking statements. Actual results may differ materially from those expressed or forecasted in the forward-looking statements due to a variety of risks, uncertainties and other factors, including but not limited to the factors listed and described under “Risk Factors” in this Quarterly Report on Form 10-Q and in our Annual Report on Form 10-K for the year ended December 31, 2023, as filed with the SEC on March 15, 2024 (the “Annual Report”), some of which are briefly summarized below:
•We have paid past distributions from sources other than cash flows from operating activities, including from offering proceeds, which reduces the amount of cash we ultimately have to invest in assets, and some of our distributions have not been covered by net income; if we cannot generate sufficient cash flow from operations to fully fund distributions, some or all of our distributions may again be paid from these other sources, and if our net income does not cover our distributions, those distributions will dilute our stockholders’ equity;
•There is no current public trading market for our common stock, and we do not expect that such a market will ever develop. Therefore, repurchase of shares by us will likely be the only way for stockholders to dispose of their shares, and our SRP is currently suspended;
•Even if our stockholders are able to sell their shares pursuant to our SRP in the future, or otherwise, they may not be able to recover the amount of their investment in our shares;
•Our Advisor and our Sub-Advisor may face conflicts of interest in allocating personnel and resources between their affiliates;
•None of our agreements with our Advisor, our Sub-Advisor or any affiliates of our Advisor or Sub-Advisor were negotiated at arm’s-length; and
•If we fail to continue to qualify as a REIT, our operations and distributions to stockholders will be adversely affected.
Forward-looking statements in this Quarterly Report on Form 10-Q reflect our management’s view only as of the date of this Quarterly Report on Form 10-Q and may ultimately prove to be incorrect or false. We undertake no obligation to update or revise forward-looking statements to reflect changed assumptions, the occurrence of unanticipated events or changes to future operating results except as required by applicable law. We intend for these forward-looking statements to be covered by the applicable safe harbor provisions created by Section 27A of the Securities Act and Section 21E of the Exchange Act.
The following discussion and analysis relate to the three and six months ended June 30, 2024 and 2023 and as of June 30, 2024 and December 31, 2023. You should read the following discussion and analysis along with our unaudited consolidated financial statements and the related notes included in this Quarterly Report on Form 10-Q.
All dollar amounts are stated in thousands unless otherwise noted, except share data.
Overview
We are a Maryland corporation formed on September 13, 2016 to originate, acquire and manage an investment portfolio of CRE investments primarily comprised of (i) CRE debt, including (a) primarily floating-rate first mortgage loans, and (b) subordinate mortgage and mezzanine loans, and participations in such loans, and (ii) floating-rate CRE securities such as CMBS and senior unsecured debt of publicly traded REITs. Substantially all of our business is conducted through our Operating Partnership, of which we are the sole general partner. We are externally managed by our Advisor, an indirect subsidiary of IREIC. Our Advisor has engaged the Sub-Advisor, a subsidiary of Sound Point CRE Management, LP, to perform certain services on behalf of the Advisor for us.
We have operated in a manner that allows us to qualify as a REIT for U.S. federal income tax purposes commencing with the taxable year ended December 31, 2017.
For a discussion of the history of the Company and its Private Offering, IPO, Second Public Offering and Preferred Stock Offering, please see “Note 1 – Organization and Business Operations” in the notes to our consolidated financial statements above. The IPO and the Second Public Offering are collectively referred to herein as the “Public Offerings”.
Recent Developments
In response to inflationary pressures, in 2022 the Federal Reserve began raising its federal funds rate target range and indicated that, due to the persistent high rate of inflation, it would continue to increase rates until a 2% inflation rate is achieved. The Federal Reserve has also been conducting monetary tightening by increasing the sale of bonds it had purchased on the open market. During the third quarter of 2023, the Federal Reserve paused its increase in interest rates to evaluate the impact that the rate increases have had on inflation. Market consensus has been predicting that the Federal Reserve may begin reducing rates in 2024, however the Federal Reserve has not signaled when a decrease may happen. The economic data from the first half of 2024 has shown that inflation continues to be above the Federal Reserve’s 2.0% target. We expect that the commercial real estate market will continue to experience pressure due to the current interest rate environment, and it may take several quarters and/or rate decreases for the market to improve.
We did not originate any new loans in 2023 or during the first six months of 2024 as we chose to focus on maintaining our liquidity. We anticipate this to continue through the remainder of 2024. The commercial real estate lending market tightened as the Federal Reserve raised rates and lenders concerns over property performance increased. Concerns over office properties continue as tenants evaluate the amount of space they need with more employees working from home. In general, property valuations have decreased as capitalization rates for commercial real estate assets have increased with overall interest rates.
We continue to evaluate all loans on a quarterly basis and assign our internal risk rating with the majority of our loans continuing to perform as expected. While there has been some increase in competition for new loans in the first six months of 2024, refinancing risk continues to be a focus. As such, for our CECL reserve, we have placed additional focus on loans with maturity dates up to nine months from the quarter end to determine if the collateral value would be sufficient to cover the outstanding loan principal balance and have recorded an asset-specific CECL reserve when necessary.
Q2 2024 Highlights
Operating Results:
•Net income attributable to common stockholders was $3.5 million, or $0.35 per share, during the three months ended June 30, 2024, which included $1.1 million in reversal of credit losses.
•During the second quarter of 2024, we paid an annual gross distribution rate of $1.25 per common share, which represents an annualized rate of 7.5% on our aggregate NAV of $16.5986 as of June 30, 2024. Holders of Class D and Class T shares of common stock received less than the gross distribution amount after the deduction of stockholder servicing fees applicable to those classes.
Loan Portfolio:
•We originated no loans during the three months ended June 30, 2024.
•We had $1.9 million in advances on previously originated loans and loan repayments of $11.2 million resulting in a 1.2% decrease in our loan portfolio to $684.4 million during the three months ended June 30, 2024. The decrease is net of $1.1 million of reversal of credit losses.
•30 out of our 33 loans were current on their contractual interest payments with no interest deferrals during the three months ended June 30, 2024.
•3 out of our 33 loans were placed on nonaccrual status. After being placed on nonaccrual status, any cash collected, including any interest payments, on such loans is applied against their principal balance.
Significant Accounting Policies and Use of Estimates
Disclosures discussing all significant accounting policies are set forth in our Annual Report under the heading “Note 2 – Summary of Significant Accounting Policies.” See “Note 2 – Summary of Significant Accounting Policies” for a discussion of changes to our significant accounting policies for the three months ended June 30, 2024.
Portfolio
Our strategy is to originate, acquire and manage an investment portfolio of CRE debt that is primarily floating rate and diversified based on the type and location of collateral securing the underlying CRE debt.
The charts below summarize our debt investments portfolio as a percentage of par value by type of rate, our total investment portfolio by investment type and our loan portfolio by collateral type and geographical region as of June 30, 2024 and December 31, 2023:
Floating vs. Fixed Rate Debt Investments:
| |
June 30, 2024 | December 31, 2023 |
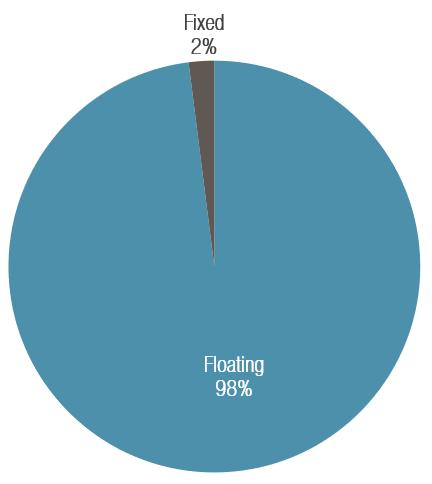
|
|
All Investments by Type:
| |
June 30, 2024 | December 31, 2023 |
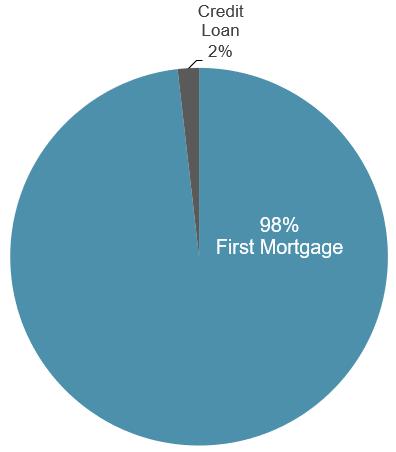
|
|
Loans by Property Type:
| |
June 30, 2024
|
December 31, 2023
|
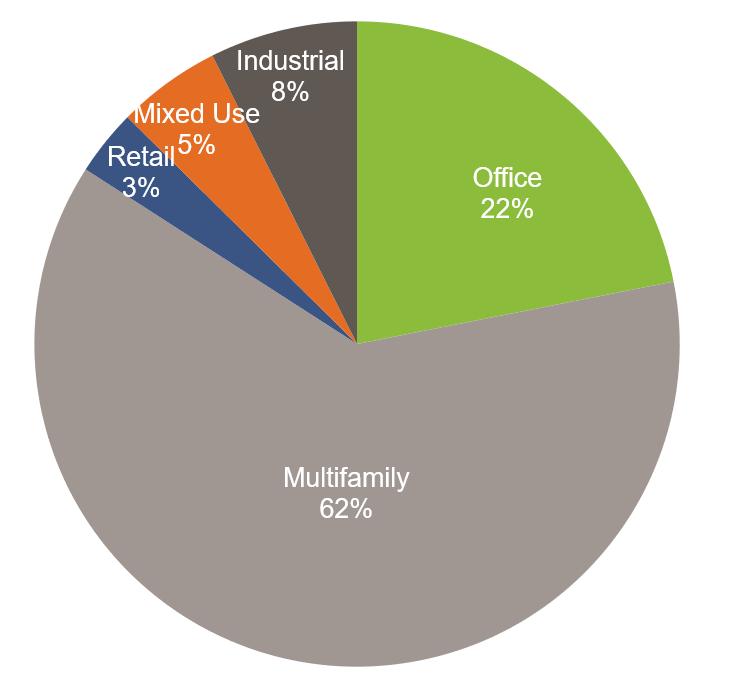
| 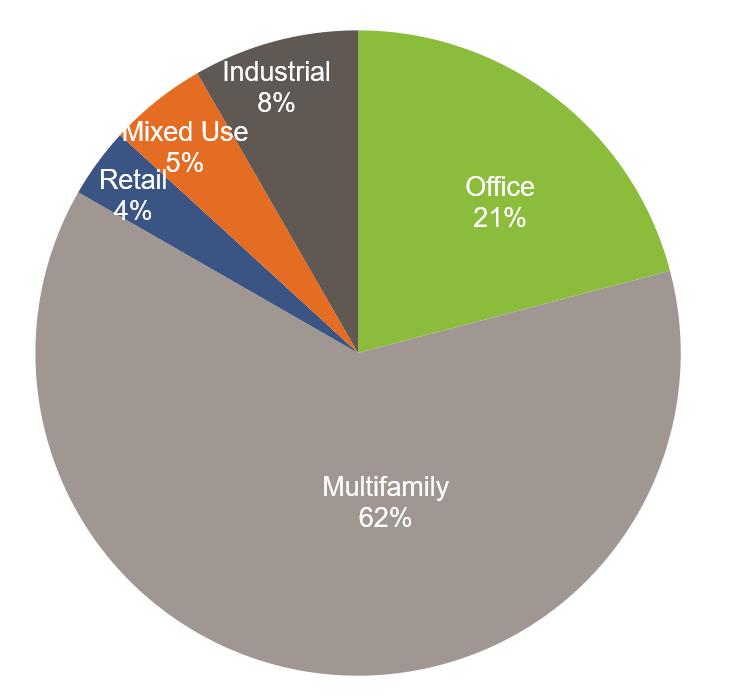
|
Loans by Region:
| |
June 30, 2024 | December 31, 2023 |
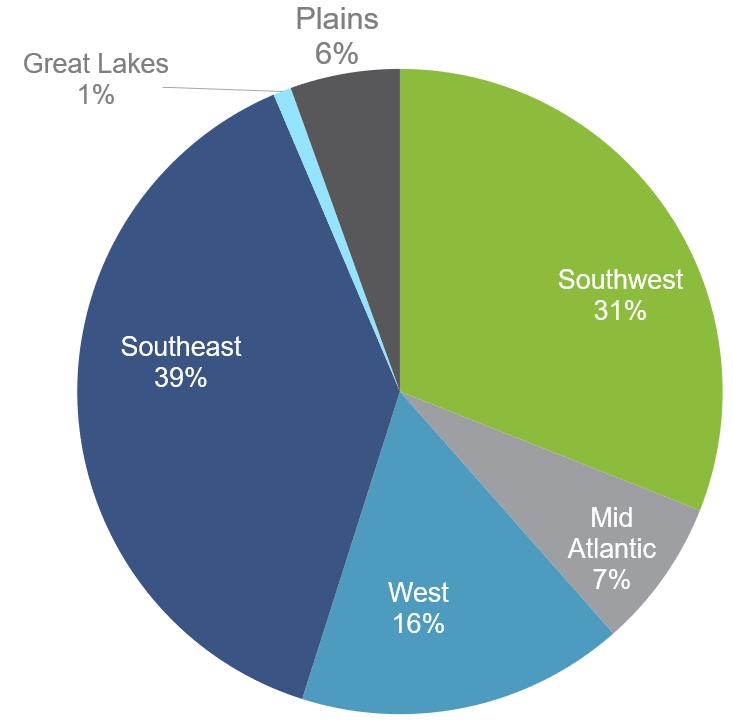
| 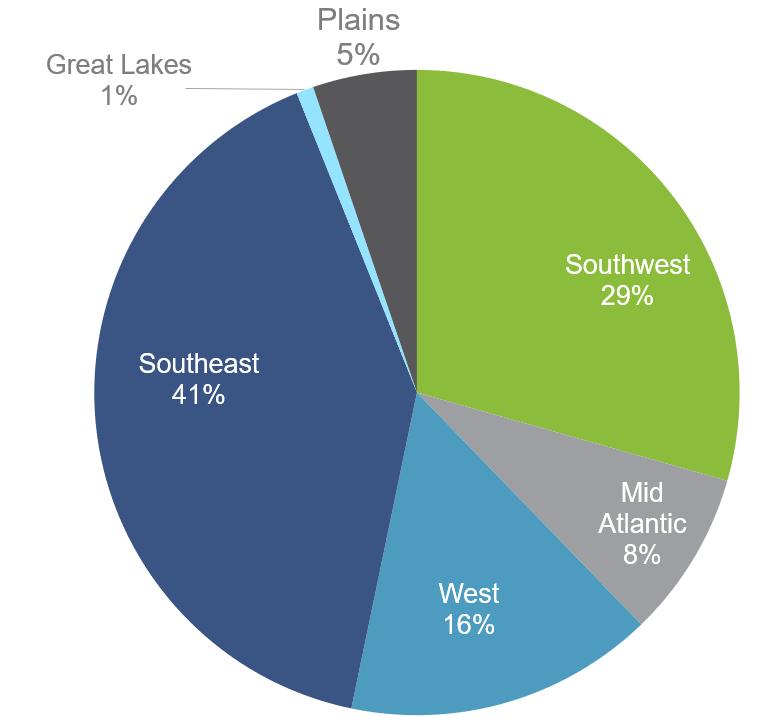
|
An investment’s region is defined according to the below map based on the location of underlying property.
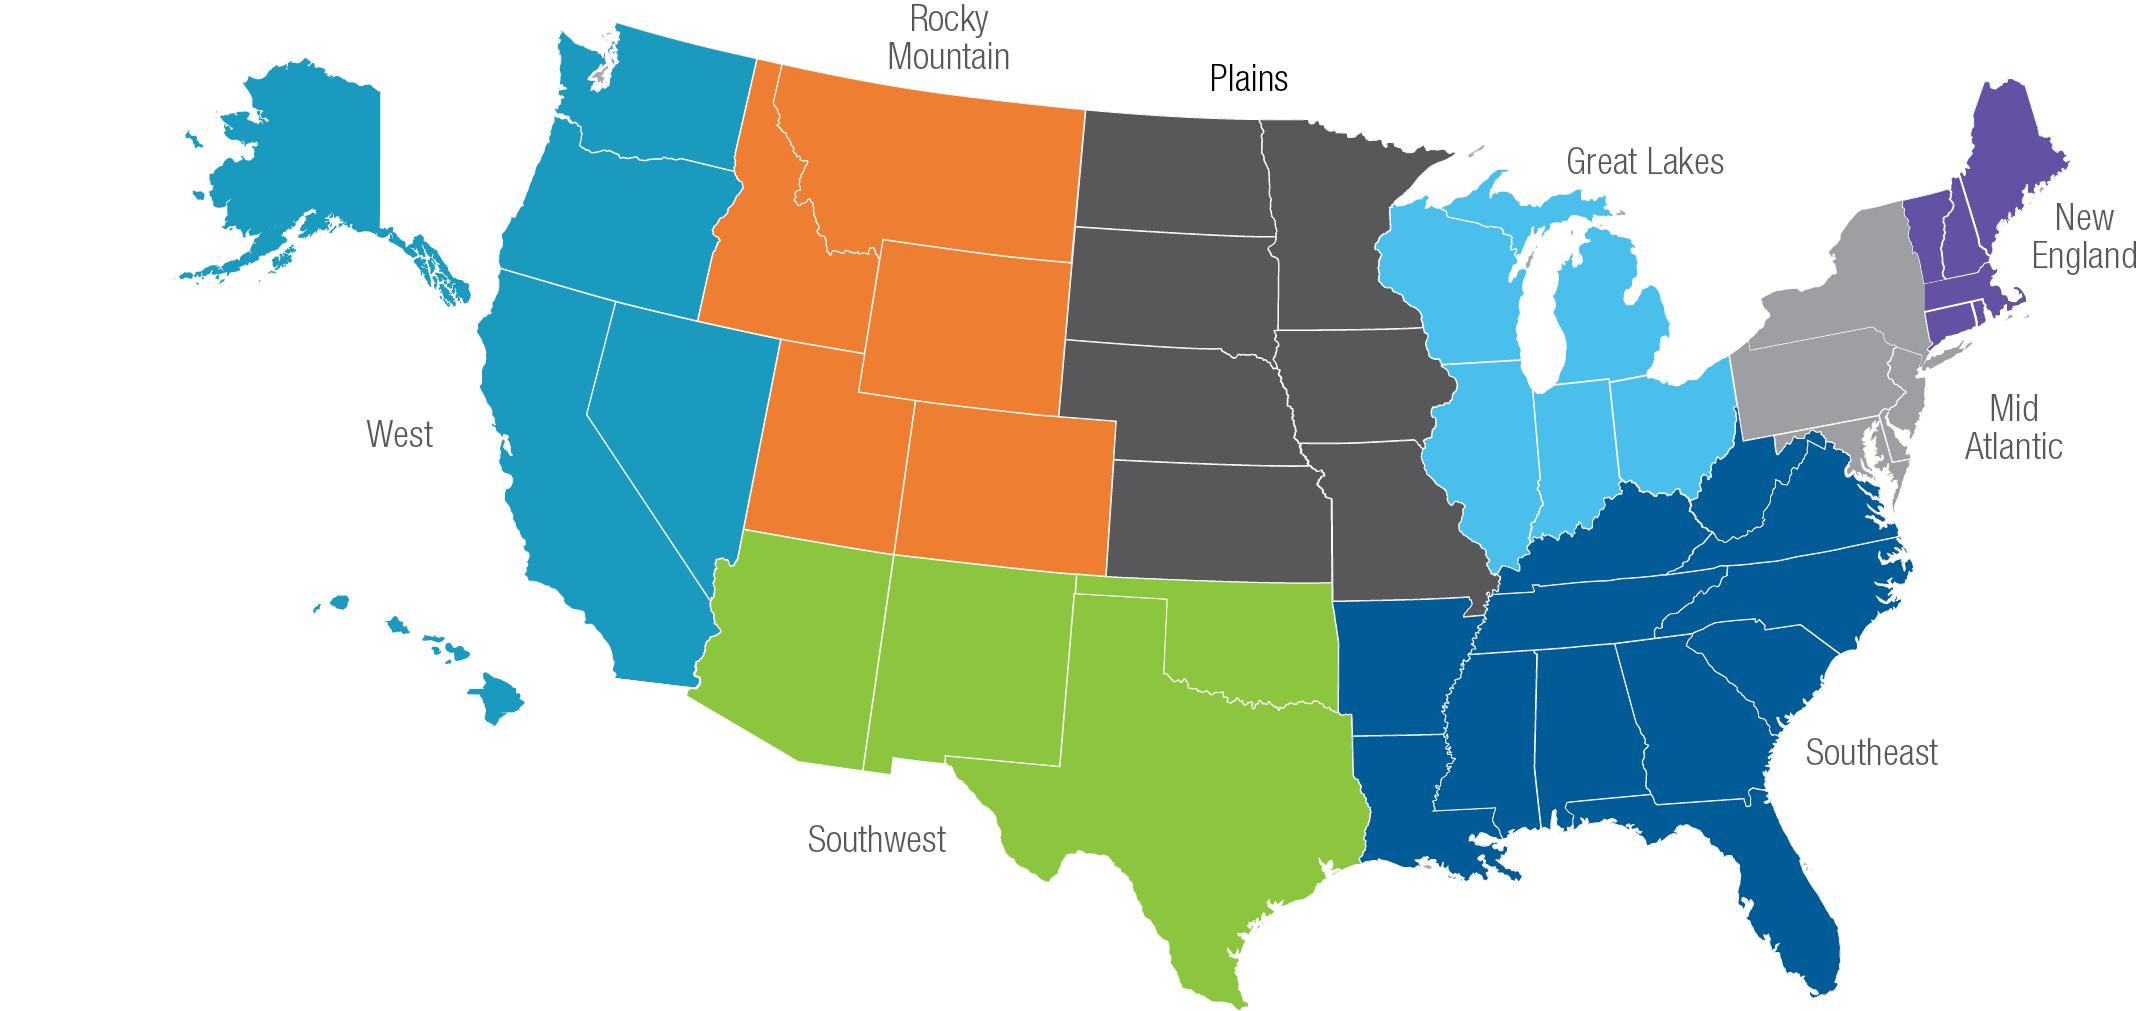
The changes in our loan portfolio by property type and by region as of June 30, 2024 compared to December 31, 2023 were primarily due to loans that were repaid by borrowers in ordinary course.
Commercial Mortgage Loans Held for Investment
| | | | | | | |
| As of
June 30, 2024 | | | As of
December 31, 2023 | |
Principal balance of first mortgage loans | $ | 691,356 | | | $ | 729,380 | |
Number of first mortgage loans | | 31 | | | | 34 | |
Principal balance of credit loans | $ | 13,500 | | | | 13,500 | |
Number of credit loans | | 2 | | | | 2 | |
Total balance of loans | $ | 704,856 | | | $ | 742,880 | |
Total number of loans | | 33 | | | | 36 | |
All-in yield (1) | | 7.9 | % | | | 8.1 | % |
Weighted average years to maximum maturity | | 2.1 | | | | 2.5 | |
____________ | | | | | |
(1)All-in yield is the present value of all future principal and interest payments on the loan and does not include any origination fees or deferred commitment fees. All-in yield also excludes the all-in yield for loans placed on nonaccrual status. All-in yield is calculated using the spread plus the values of the indices as of June 30, 2024.
The decrease in the size of our portfolio is primarily due to loan payoffs with no new loans originated during the six months ended June 30, 2024. The decrease in the all-in yield was primarily driven by the three loans placed on nonaccrual status.
The table below presents select loan information for each of our commercial mortgage loans as of June 30, 2024:
| | | | | | | | | | | | | | | | | | |
| Origination
Date | Loan
Type (1) | Principal
Balance (2) | | Cash Coupon (2)(3) | All-in
Yield (2)(3) | | Maximum Maturity (4) | State | Property
Type | LTV (5) | | Risk
Rating (6) | |
1 | 12/12/17 | First mortgage | $ | 13,450 | | SOFR+4.70% | | 10.0 | % | 4/9/23 (7) | HI | Office | | 67.0 | % | | 4 | |
2 | 9/7/18 | First mortgage | | 24,411 | | SOFR+3.75% | (3) | | 9/9/23 (8) | TX | Office | | 73.0 | % | | 5 | |
3 | 5/31/19 | First mortgage | | 9,806 | | SOFR+3.25% | | 8.6 | % | 9/9/24 (9) | CA | Multifamily | | 69.9 | % | | 4 | |
4 | 6/18/19 | First mortgage | | 45,983 | | SOFR+2.75% | | 8.1 | % | 7/9/26 | TX | Office | | 72.2 | % | | 3 | |
5 | 8/15/19 | First mortgage | | 7,934 | | SOFR+4.20% | | 9.5 | % | 11/9/24 | TN | Office | | 44.6 | % | | 4 | |
6 | 9/27/19 | First mortgage | | 13,626 | | SOFR+3.10% | | 8.4 | % | 10/9/24 | CA | Office | | 74.5 | % | | 3 | |
7 | 10/4/19 | First mortgage | | 22,616 | | SOFR+2.90% | | 8.2 | % | 10/9/26 | NC | Office | | 60.9 | % | | 3 | |
8 | 2/28/20 | First mortgage | | 9,850 | | SOFR+3.50% | | 8.8 | % | 3/9/25 | FL | Retail | | 77.7 | % | | 2 | |
9 | 3/5/21 | First mortgage | | 13,113 | | SOFR+5.00% | (3) | | 3/9/26 (10) | VA | Office | | 56.8 | % | | 5 | |
10 | 3/12/21 | First mortgage | | 20,135 | | SOFR+4.00% | | 9.4 | % | 3/9/25 | MS | Industrial | | 63.5 | % | | 3 | |
11 | 5/26/21 | First mortgage | | 16,135 | | SOFR+3.10% | | 8.5 | % | 6/9/26 | NV | Multifamily | | 79.6 | % | | 2 | |
12 | 7/1/21 | First mortgage | | 6,430 | | SOFR+4.50% | | 9.9 | % | 7/9/26 | OH | Mixed Use | | 78.9 | % | | 4 | |
13 | 10/8/21 | First mortgage | | 29,476 | | SOFR+3.20% | (3) | | 5/9/24 (11) | OR | Multifamily | | 72.2 | % | | 5 | |
14 | 10/15/21 | First mortgage | | 23,740 | | SOFR+2.95% | | 8.4 | % | 11/9/26 | VA | Multifamily | | 76.7 | % | | 2 | |
15 | 11/12/21 | First mortgage | | 25,696 | | SOFR+2.90% | | 8.3 | % | 11/9/26 (12) | TX | Multifamily | | 73.2 | % | | 2 | |
16 | 11/16/21 | First mortgage | | 24,581 | | SOFR+3.05% | | 8.5 | % | 12/9/26 | TX | Multifamily | | 73.7 | % | | 3 | |
17 | 11/17/21 | First mortgage | | 25,529 | | SOFR+2.85% | | 8.3 | % | 12/9/26 | SC | Multifamily | | 71.5 | % | | 3 | |
18 | 12/9/21 | First mortgage | | 39,967 | | SOFR+3.05% | | 8.5 | % | 12/9/26 (13) | GA | Multifamily | | 71.7 | % | | 2 | |
19 | 12/15/21 | First mortgage | | 25,529 | | SOFR+3.20% | | 8.6 | % | 1/9/27 | OR | Multifamily | | 70.2 | % | | 2 | |
20 | 1/14/22 | First mortgage | | 38,933 | | SOFR+3.40% | | 8.7 | % | 1/9/27 | MO | Multifamily | | 80.0 | % | | 3 | |
21 | 1/20/22 | First mortgage | | 13,403 | | SOFR+3.65% | | 9.0 | % | 2/9/27 | NC | Retail | | 62.6 | % | | 2 | |
22 | 1/26/22 | First mortgage | | 15,496 | | SOFR+3.55% | | 8.9 | % | 2/9/27 | NJ | Industrial | | 63.1 | % | | 3 | |
23 | 1/28/22 | First mortgage | | 14,847 | | SOFR+3.30% | | 8.6 | % | 2/9/27 | NC | Multifamily | | 69.9 | % | | 2 | |
24 | 2/25/22 | First mortgage | | 30,000 | | SOFR+3.04% | | 8.4 | % | 3/9/27 | NY | Mixed Use | | 66.7 | % | | 2 | |
25 | 3/1/22 | First mortgage | | 29,070 | | SOFR+3.40% | | 8.7 | % | 3/9/27 (14) | TX | Multifamily | | 77.7 | % | | 2 | |
26 | 3/25/22 | First mortgage | | 16,852 | | SOFR+3.30% | | 8.6 | % | 4/9/27 | FL | Industrial | | 69.7 | % | | 2 | |
27 | 4/7/22 | First mortgage | | 14,747 | | SOFR+3.25% | | 8.6 | % | 4/9/27 | SC | Multifamily | | 69.0 | % | | 2 | |
28 | 4/19/22 | First mortgage | | 20,235 | | SOFR+3.40% | | 8.7 | % | 5/9/26 | TX | Multifamily | | 76.3 | % | | 2 | |
29 | 6/13/22 | First mortgage | | 49,607 | | SOFR+3.45% | | 8.8 | % | 6/9/27 | TX | Multifamily | | 73.1 | % | | 2 | |
30 | 9/1/22 | First mortgage | | 27,869 | | SOFR+3.90% | | 9.2 | % | 9/9/27 | NC | Multifamily | | 63.4 | % | | 2 | |
31 | 11/17/22 | First mortgage | | 22,290 | | SOFR+3.90% | | 9.2 | % | 12/9/27 | AL | Multifamily | | 69.6 | % | | 3 | |
32 | 9/29/17 | Credit | | 7,500 | | 9.20% | | 9.2 | % | 10/11/27 | NJ | Office | | 79.9 | % | | 2 | |
33 | 10/4/19 | Credit | | 6,000 | | 10.00% | | 10.0 | % | 10/6/24 (15) | NV | Office | | 75.2 | % | | 5 | |
| | | $ | 704,856 | | | | 7.9 | % | | | | | 71.1 | % | | |
(1)First mortgage loans are first position mortgage loans and credit loans are mezzanine and subordinated loans.
(2)As of June 30, 2024, an 80% undivided senior interest in each of loan numbers 1, 2, 3, and 7, which includes the right to receive priority interest payments at a rate of one-month term USD Secured Overnight Financing Rate (“SOFR”)+2.00%, was sold by our Operating Partnership pursuant to a Loan Participation Agreement dated November 15, 2021. Our Operating Partnership has retained a 20% undivided subordinate interest in each of these loans.
(3)Cash coupon is the stated rate on the loan. All-in yield is the present value of all future principal and interest payments on the loan and does not include any origination fees or deferred commitment fees. Loan numbers 2, 9 and 13 are on nonaccrual basis as of June 30, 2024 and excluded from the total. The total is the weighted average of the stated yield, excluding any default interest, as of June 30, 2024. Our first mortgage loans are all floating rate and each contains a minimum SOFR floor. As of June 30, 2024, the weighted average SOFR floor was 0.69%.
(4)Maximum maturity assumes all extension options are exercised by the borrower, however loans may be repaid prior to such date.
(5)Loan-to-value (“LTV”) was determined at loan origination and is not updated for subsequent property valuations or loan modifications. The total is the weighted average LTV.
(6)Risk rating is the internal risk rating assigned by the Sub-Advisor. See “Note 3 – Commercial Mortgage Loans Held for Investment,” which is included in our notes to consolidated financial statements included in this Quarterly Report on Form 10-Q.
(7)The loan matured on April 9, 2023 and is currently accruing default interest. The Company is negotiating an extension to allow the borrower to obtain long-term financing. The Company expects to complete the loan extension in the third quarter of 2024. The property securing the loan is class A office and is 91% occupied as of May 31, 2024. The Company has reviewed the loan and based on the current estimated LTV does not believe the loan is impaired.
(8)The loan matured on September 9, 2023. The Company reviewed the loan and based on the estimated LTV recorded a $0.3 million asset-specific CECL reserve as of June 30, 2024. On July 2, 2024, the Company acquired the legal title to the two underlying properties through non-judicial foreclosure transactions.
(9)The loan matured on June 9, 2024 and the Company agreed to extend the loan maturity date until September 9, 2024. The borrower paid an extension fee, and contributed funds into reserves for interest, taxes and insurance. The borrower is currently marketing the asset for sale. Once the sale is complete, the proceeds will be used to pay-off the loan. The Company has reviewed the loan and based on the current estimated LTV does not believe the loan is impaired.
(10)The loan matured on March 9, 2024. The Company has been unsuccessful in negotiating a loan extension with the sponsor. The loan is on nonaccrual status. During June 2024, the Company received a letter of intent to purchase the loan at par and the loan sale agreement was signed on August 5, 2024. The Company expects to close the sale in the third quarter of 2024 and, therefore, removed the $3.2 million asset-specific CECL reserve that was recorded as of March 31, 2024.
(11)The loan matured on May 9, 2024. The Company was unable to negotiate an additional loan extension or pay-off with the sponsor. The Company has begun the foreclosure process with respect to the underlying property and expects to complete the process in October 2024. The loan is on nonaccrual status and based on the estimated LTV, the Company recorded a $6.9 million asset-specific CECL reserve as of June 30, 2024.
(12)The loan matures on November 9, 2024. The Company plans to negotiate an extension with the sponsor prior to the maturity date. The Company has reviewed the loan and based on the estimated LTV recorded a $0.2 million asset-specific CECL reserve as of June 30, 2024.
(13)The loan matures on December 9, 2024. The Company plans to negotiate an extension with the sponsor prior to the maturity date. The Company has reviewed the loan and based on the estimated LTV recorded a $2.5 million asset-specific CECL reserve as of June 30, 2024.
(14)The loan matures on March 9, 2025. The Company plans to negotiate an extension with the sponsor prior to the maturity date. The Company has reviewed the loan and based on the estimated LTV recorded a $1.0 million asset-specific CECL reserve as of June 30, 2024.
(15)The loan has no unfunded commitment and matures on October 6, 2024. The borrower is current on all debt service payments. The property is occupied by a single tenant that is exiting the property at the end of its lease. The Company believes that the sponsor will have difficulty refinancing or repaying the loan at maturity without a long-term tenant. The Company has recorded a $4.0 million asset-specific CECL reserve on this loan as of June 30, 2024. The loan was placed on nonaccrual status effective July 1, 2024.
The following table allocates the loan principal balance and the net loan exposure based on our internal risk ratings as of June 30, 2024:
| | | | | | | | | |
Risk Rating | Number of Loans | | Principal Balance | | Net Loan Exposure (1) | |
1 | | — | | $ | — | | $ | — | |
2 | | 16 | | | 365,047 | | | 359,536 | |
3 | | 9 | | | 229,189 | | | 206,914 | |
4 | | 4 | | | 37,620 | | | 18,672 | |
5 | | 4 | | | 73,000 | | | 42,290 | |
Total | | 33 | | $ | 704,856 | | $ | 627,412 | |
Add: Unamortized (fees)/costs, net | | | $ | 768 | | | |
Less: Allowance for credit losses | | | | (21,218 | ) | | |
Commercial mortgage loans at cost, net | | | $ | 684,406 | | | |
(1) Net loan exposure excludes the amount of loan participation sold. See “Note 5 – Loan Participations Sold, Net.” Further, net loan exposure is calculated net of the CECL reserve recorded on the loans. See “Note 3 – Commercial Mortgage Loans Held for Investment – Allowance for Credit Losses.”
We entered into master repurchase agreements to fund our loan portfolio. As of June 30, 2024 and December 31, 2023, we had total borrowings of $422,944 (which is net of $0 unamortized debt issuance costs) and $457,438 (which is net of $0 of unamortized debt issuance costs), respectively. During the six months ended June 30, 2024 and the year ended December 31, 2023, we had weighted average borrowings of $499,552 and $562,396 and weighted average borrowing costs of 7.5% and 7.4%, respectively.
Results of Operations
Comparison of the Three Months Ended June 30, 2024 to the Three Months Ended June 30, 2023
Net Interest Income
Net interest income is generated on our interest-earning assets less related interest-bearing liabilities. The following table presents the average balance of interest-earning assets less related interest-bearing liabilities, associated interest income and expense and corresponding yield earned and incurred for the periods indicated:
| | | | | | | | | | | | | | | | | | | | | | | | |
| Three months ended
June 30, | | |
| 2024 | | | 2023 |
| Average
Carrying
Value (1) | | | Interest
Income/
Expense (2)(3) | | | Weighted Average
Yield/Financing
Cost (4) | | | Average
Carrying
Value (1) | | | Interest
Income/
Expense (2)(3) | | | Weighted Average
Yield/Financing
Cost (4) | | |
Interest-earning assets: | | | | | | | | | | | | | | | | | | |
Commercial mortgage loans | $ | 708,783 | | | $ | 14,401 | | | | 8.0 | % | | $ | 793,337 | | | $ | 17,202 | | | | 8.6 | % | |
Total/Weighted Average | $ | 708,783 | | | $ | 14,401 | | | | 8.0 | % | | $ | 793,337 | | | $ | 17,202 | | | | 8.6 | % | |
Interest-bearing liabilities: | | | | | | | | | | | | | | | | | | |
Repurchase agreements—
commercial mortgage loans | $ | 428,604 | | | $ | 8,393 | | | | 7.7 | % | | $ | 469,170 | | | $ | 8,765 | | | | 7.4 | % | |
Credit facility—loans | | 5,949 | | | | 133 | | | | 8.8 | % | | | 18,380 | | | | 396 | | | | 8.5 | % | |
Loan participations sold, net | | 57,006 | | | | 830 | | | | 5.8 | % | | | 78,423 | | | | 1,547 | | | | 7.8 | % | |
Total/Weighted Average | $ | 491,559 | | | $ | 9,356 | | | | 7.5 | % | | $ | 565,973 | | | $ | 10,708 | | | | 7.5 | % | |
Net interest income/spread | | | | $ | 5,045 | | | | 0.5 | % | | | | | $ | 6,494 | | | | 1.1 | % | |
Average leverage % (5) | | | | | 226.3 | % | | | | | | 248.9 | % | | | | | | | |
Weighted average levered yield (6) | | | | | | | | 9.2 | % | | | | | | | | | 11.3 | % | |
(1)Based on principal amount for repurchase agreements. Amounts are calculated based on the average daily balance.
(2)Includes the effect of amortization of premium or accretion of discount.
(3)Interest income excludes $582 and $130 for the three months ended June 30, 2024 and 2023, respectively, related to bank deposits not included in the investment portfolio.
(4)Calculated as annualized interest income or expense divided by average carrying value.
(5)Calculated by dividing total average interest-bearing liabilities by total average equity (total average interest-earning assets less total average liabilities).
(6)Calculated by taking the sum of (i) the net interest spread multiplied by the average leverage and (ii) the weighted average yield on interest-earning assets.
The change in our average interest-earning assets and interest-bearing liabilities was due to loan maturities. The change in the weighted average levered yield was primarily due to the three loans that were placed on nonaccrual status.
Revenue from Real Estate
During the three months ended June 30, 2023, the Renaissance O’Hare generated $5,326 in revenue. We sold the Renaissance O’Hare in September 2023.
Net Operating Expenses
Net operating expenses for the three months ended June 30, 2024 and 2023 consisted of the following:
| | | | | | | | |
| | Three months ended
June 30, | |
| | 2024 | | | 2023 | |
Advisory fee | | $ | 799 | | | $ | 861 | |
Amortization of debt finance costs | | | 369 | | | | 507 | |
Directors compensation | | | 19 | | | | 21 | |
Professional service fees | | | 212 | | | | 186 | |
Real estate operating expenses | | | — | | | | 4,722 | |
Provision for asset impairment | | | — | | | | 6,934 | |
Depreciation and amortization | | | — | | | | 193 | |
Other expenses | | | 324 | | | | 475 | |
Net operating expenses | | $ | 1,723 | | | $ | 13,899 | |
Net operating expenses for the three months ended June 30, 2024 and 2023 were $1,723 and $13,899, respectively. The primary driver of the decrease in net operating expenses was the sale of Renaissance O’Hare in September 2023.
Net Income
For the three months ended June 30, 2024 and 2023, our net income (loss) was $4,990 and $(15,335), respectively. The increase in net income was primarily due to a reversal of credit losses of $1,086 in 2024 compared to $13,364 in provision for credit losses in 2023 and $6,934 in provision for asset impairment related to the sale of Renaissance O’Hare in 2023 with no comparable activity in 2024.
Comparison of the Six Months Ended June 30, 2024 to the Six Months Ended June 30, 2023
Net Interest Income
Net interest income is generated on our interest-earning assets less related interest-bearing liabilities. The following table presents the average balance of interest-earning assets less related interest-bearing liabilities, associated interest income and expense and corresponding yield earned and incurred for the periods indicated:
| | | | | | | | | | | | | | | | | | | | | | | |
| Six months ended June 30, | |
| 2024 | | | 2023 | |
| Average
Carrying
Value (1) | | | Interest
Income/
Expense (2)(3) | | | Weighted
Average
Yield/Financing
Cost (4) | | | Average
Carrying
Value (1) | | | Interest
Income/
Expense (2)(3) | | | Weighted
Average
Yield/Financing
Cost (4) | |
Interest-earning assets: | | | | | | | | | | | | | | | | | |
Commercial mortgage loans | $ | 714,388 | | | $ | 28,875 | | | | 8.0 | % | | $ | 812,736 | | | $ | 33,993 | | | | 8.3 | % |
Total/Weighted Average | $ | 714,388 | | | $ | 28,875 | | | | 8.0 | % | | $ | 812,736 | | | $ | 33,993 | | | | 8.3 | % |
Interest-bearing liabilities: | | | | | | | | | | | | | | | | | |
Repurchase agreements — commercial mortgage loans | $ | 434,711 | | | $ | 17,031 | | | | 7.7 | % | | $ | 477,217 | | | $ | 17,191 | | | | 7.2 | % |
Credit facility—loans | | 7,725 | | | | 345 | | | | 8.8 | % | | | 18,381 | | | | 758 | | | | 8.2 | % |
Loan participations sold, net | | 57,116 | | | | 1,456 | | | | 5.0 | % | | | 83,258 | | | | 2,988 | | | | 7.1 | % |
Total/Weighted Average | $ | 499,552 | | | $ | 18,832 | | | | 7.5 | % | | $ | 578,856 | | | $ | 20,937 | | | | 7.2 | % |
Net interest income/spread | | | | $ | 10,043 | | | | 0.5 | % | | | | | $ | 13,056 | | | | 1.1 | % |
Average leverage % (5) | | | | | 232.5 | % | | | | | | 247.5 | % | | | | | | |
Weighted average levered yield (6) | | | | | | | | 9.2 | % | | | | | | | | | 11.1 | % |
(1)Based on principal amount for repurchase agreements. Amounts are calculated based on the average daily balance.
(2)Includes the effect of amortization of premium or accretion of discount.
(3)Interest income excludes $1,220 and $193 for the six months ended June 30, 2024 and 2023, respectively, related to bank deposits not included in the investment portfolio.
(4)Calculated as annualized interest income or expense divided by average carrying value.
(5)Calculated by dividing total average interest-bearing liabilities by total average equity (total average interest-earning assets less total average liabilities).
(6)Calculated by taking the sum of (i) the net interest spread multiplied by the average leverage and (ii) the weighted average yield on interest-earning assets.
The change in our average interest-earning assets and interest-bearing liabilities was due to loan maturities. The change in the weighted average levered yield was primarily due to the three loans that were placed on nonaccrual status.
Revenue from Real Estate
During the six months ended June 30, 2023, the Renaissance O’Hare generated $8,247 in revenue. We sold the Renaissance O’Hare in September 2023.
Net Operating Expenses
Net operating expenses for the six months ended June 30, 2024 and 2023 consisted of the following:
| | | | | | | | |
| | Six months ended June 30, | |
| | 2024 | | | 2023 | |
Advisory fee | | $ | 1,604 | | | $ | 1,742 | |
Amortization of debt finance costs | | | 772 | | | | 878 | |
Directors compensation | | | 39 | | | | 40 | |
Professional service fees | | | 493 | | | | 377 | |
Real estate operating expenses | | | — | | | | 7,910 | |
Provision for asset impairment | | | — | | | | 6,934 | |
Depreciation and amortization | | | — | | | | 514 | |
Other expenses | | | 715 | | | | 828 | |
Net operating expenses | | $ | 3,623 | | | $ | 19,223 | |
Net operating expenses for the six months ended June 30, 2024 and 2023 were $3,623 and $19,223, respectively. The primary driver of the decrease in net operating expenses was the sale of Renaissance O’Hare in September 2023.
Net Income
For the six months ended June 30, 2024 and 2023, our net income (loss) was $8,389 and $(10,714), respectively. The increase in net income was primarily due to a reversal of credit losses of $749 in 2024 compared to $12,965 in provision for credit losses in 2023 and $6,934 in provision for asset impairment related to the sale of Renaissance O’Hare in 2023 with no comparable activity in 2024.
Non-GAAP Financial Measures
Funds from Operations and Modified Funds from Operations
We use Funds from Operations (“FFO”), a widely accepted metric, to evaluate our performance. FFO provides a supplemental measure to compare our performance and operations to other REITs. Due to certain unique operating characteristics of real estate companies, the National Association of Real Estate Investment Trusts (“NAREIT”) has promulgated a standard known as FFO, which it believes more accurately reflects the operating performance of a REIT. As defined by NAREIT, FFO means net income (loss) attributable to common stockholders computed in accordance with GAAP, excluding gains (or losses) from sales of operating property, plus depreciation and amortization and after adjustments for unconsolidated entities. In addition, NAREIT has further clarified the FFO definition to add-back impairment write-downs of depreciable real estate or of investments in unconsolidated entities that are driven by measurable decreases in the fair value of depreciable real estate and to exclude the earnings impacts of cumulative effects of accounting changes. We have adopted the NAREIT definition for computing FFO.
Due to the unique features of publicly registered, non-listed REITs, the Institute for Portfolio Alternatives (“IPA”), an industry trade group, published a standardized measure known as Modified Funds from Operations (“MFFO”), which the IPA has promulgated as a supplemental measure for publicly registered non-listed REITs and which may be another appropriate supplemental measure to reflect the operating performance of a non-listed REIT.
The IPA defines MFFO as FFO adjusted for acquisition fees and expenses, amounts relating to straight line rents and amortization of premiums on debt investments, non-recurring impairments of real estate-related investments, mark-to-market adjustments included in net income, non-recurring gains or losses included in net income from the extinguishment or sale of debt, hedges, foreign exchange, derivatives or securities holdings where trading of such holdings is not a fundamental attribute of the business plan, unrealized gains or losses resulting from consolidation from, or deconsolidation to, equity accounting, and after adjustments for consolidated and unconsolidated partnerships and joint ventures.
We define MFFO in accordance with the concepts established by the IPA and adjust FFO for certain items, such as amortization of premium and discounts on real estate securities. We purchase real estate securities at a premium or discount to par value, and in accordance with GAAP, record the amortization of premium/accretion of the discount to interest income. We believe that excluding the amortization of premiums and discounts provides better insight to the expected contractual cash flows. We also adjust FFO for gains or losses on preferred stock repurchases because we do not consider these gains or losses to be a measure of our operating performance. In addition, we adjust FFO for unrealized gains or losses on real estate securities. Any mark-to-market or fair value adjustments are based on general market or overall industry conditions and may be temporary in nature.
Because MFFO may be a recognized measure of operating performance within the non-listed REIT industry, MFFO and the adjustments used to calculate it may be useful in order to evaluate our performance against other non-listed REITs. Like FFO, MFFO is not equivalent to our net income or loss as determined under GAAP, as detailed in the table below, and MFFO may not be a useful measure of the impact of long-term operating performance on value if we continue to acquire a significant amount of investments.
Our presentation of FFO and MFFO may not be comparable to other similarly titled measures presented by other REITs. We believe that the use of FFO and MFFO provides a more complete understanding of our operating performance to stockholders and to management, and when compared year over year, reflects the impact on our operations from trends in operating costs, general and administrative expenses, and interest costs. Neither FFO nor MFFO is intended to be an alternative to “net income” or to “cash flows from operating activities” as determined by GAAP as a measure of our capacity to pay distributions. Management uses FFO and MFFO to compare our operating performance to that of other REITs and to assess our operating performance.
Neither the SEC, any other regulatory body nor NAREIT has passed judgment on the acceptability of the adjustments that we use to calculate FFO or MFFO. In the future, the SEC, another regulatory body or NAREIT may decide to standardize the allowable adjustments across the non-listed REIT industry and we would have to adjust our calculation and characterization of FFO or MFFO.
Our FFO and MFFO are calculated as follows:
| | | | | | | | | | | | | | | |
| Three months ended June 30, | | | Six months ended June 30, | |
| 2024 | | | 2023 | | | 2024 | | | 2023 | |
Net income (loss) attributable to common stockholders | $ | 3,494 | | | $ | (16,831 | ) | | $ | 5,398 | | | $ | (13,684 | ) |
Depreciation and amortization | | — | | | | 193 | | | | — | | | | 514 | |
Provision for asset impairment | | — | | | | 6,934 | | | | — | | | | 6,934 | |
Funds from operations (FFO) attributable to common stockholders | $ | 3,494 | | | $ | (9,704 | ) | | $ | 5,398 | | | $ | (6,236 | ) |
| | | | | | | | | | | |
Amortization of debt financing costs | $ | 369 | | | $ | 507 | | | $ | 772 | | | $ | 878 | |
Non-cash adjustment for ground lease | | — | | | | 109 | | | | — | | | | 221 | |
(Reversal of) provision for credit losses | | (1,086 | ) | | | 13,364 | | | | (749 | ) | | | 12,965 | |
Adjustment for gain on repurchase and retirement of preferred stock | | — | | | | — | | | | — | | | | (21 | ) |
Modified funds from operations (MFFO) attributable to common stockholders | $ | 2,777 | | | $ | 4,276 | | | $ | 5,421 | | | $ | 7,807 | |
Net Asset Value
Our NAV for each class of shares is based on the net asset values of our investments, the addition of any other assets (such as cash on hand) and the deduction of any liabilities, including the allocation/accrual of any performance participation and any stockholder servicing fees applicable to such class of shares. The Advisor is responsible for reviewing and confirming our NAV, as well as overseeing the process around the calculation of our NAV, in each case, as calculated by the independent valuation advisor. See “Valuation Guidelines” below for further information regarding our valuation policies used to determine our NAV.
The following table provides a breakdown of the major components of our total net asset value attributable to common stock as of June 30, 2024 ($ and shares in thousands):
| | | |
Components of NAV | As of
June 30, 2024 | |
Commercial mortgage loans | $ | 688,884 | |
Cash and cash equivalents and restricted cash | | 44,557 | |
Other assets | | 6,173 | |
Repurchase agreements - commercial mortgage loans | | (422,944 | ) |
Loan participations sold | | (56,226 | ) |
Due to related parties | | (1,671 | ) |
Distributions payable | | (1,051 | ) |
Interest payable | | (2,215 | ) |
Accrued stockholder servicing fees (1) | | (221 | ) |
Other liabilities | | (325 | ) |
Preferred stock | | (87,050 | ) |
Net asset value attributable to common stock | $ | 167,911 | |
Number of outstanding common shares | | 10,116 | |
(1)Stockholder servicing fees only apply to Class T, Class S, and Class D shares. For purposes of NAV, we recognize the stockholder servicing fee as a reduction of NAV on a monthly basis as such fee is paid. Under GAAP, we accrue the full cost of the stockholder servicing fee as an offering cost at the time we sell Class T, Class S, and Class D shares. As of June 30, 2024, we had accrued under GAAP $645 of stockholder servicing fees payable to the Dealer Manager related to the Class T and Class D shares sold. As of June 30, 2024, we had not sold any Class S shares and, therefore, we had not accrued any stockholder servicing fees payable to the Dealer Manager related to Class S shares. The Dealer Manager does not retain any of these fees, all of which are retained by, or reallowed (paid) to, participating broker-dealers and servicing broker-dealers for ongoing stockholder services performed by such broker-dealers.
The following table provides a breakdown of our total net asset value attributable to common stock and NAV per share by share class as of June 30, 2024 ($ and shares in thousands, except per share data):
| | | | | | | | | | | | | | | | | | | | | | | | | | | |
| Common Stock | |
NAV Per Share | Class P | | | Class A | | | Class T | | | Class S | | | Class D | | | Class I | | | Total | |
Monthly NAV | $ | 142,033 | | | $ | 12,409 | | | $ | 4,852 | | | $ | — | | | $ | 799 | | | $ | 7,805 | | | $ | 167,911 | |
Number of outstanding shares | | 8,563 | | | | 746 | | | | 290 | | | | — | | | | 48 | | | | 469 | | | | 10,116 | |
NAV per share as of June 30, 2024 | $ | 16.5873 | | | $ | 16.6372 | | | $ | 16.7125 | | | $ | — | | | $ | 16.6355 | | | $ | 16.6358 | | | $ | 16.5986 | |
The following table reconciles stockholders’ equity per our consolidated balance sheet to our NAV ($ in thousands):
| | | |
Reconciliation of Stockholders’ Equity to NAV | As of
June 30, 2024 | |
Stockholders’ equity per GAAP | $ | 249,592 | |
Adjustments: | | |
Unamortized stockholder servicing fee and other expenses | | 422 | |
Unamortized offering costs | | 299 | |
Credit losses reserve adjustment | | 4,649 | |
Net asset value | $ | 254,962 | |
Preferred Stock Adjustments: | | |
Preferred stock liquidation value | | (88,614 | ) |
Unamortized preferred stock offering costs | | 1,563 | |
Net asset value attributable to common stock | $ | 167,911 | |
Valuation Guidelines
Our Board, including a majority of our independent directors, has adopted valuation guidelines that contain a comprehensive set of methodologies to be used by our Advisor, with the assistance of our Sub-Advisor, and our independent valuation advisor in connection with estimating the values of our assets and liabilities for purposes of our NAV calculation. From time to time, our Board, including a majority of our independent directors, may adopt changes to the valuation guidelines if it (1) determines that such changes are likely to result in a more accurate reflection of NAV or a more efficient or less costly procedure for the determination of NAV without having a material adverse effect on the accuracy of such determination or (2) otherwise reasonably believes a change is appropriate for the determination of NAV. In connection with carrying out its responsibility to determine our NAV, our Advisor may delegate certain tasks to our Sub-Advisor. Our Advisor, however, is ultimately responsible for the NAV determination process.
The calculation of our NAV is intended to be a calculation of the value of our assets less our outstanding liabilities for the purpose of establishing a purchase and repurchase price for our shares of common stock and may differ from our financial statements. NAV is not a measure used under GAAP and the valuations of and certain adjustments made to our assets and liabilities used in the determination of NAV will differ from GAAP.
Our Advisor calculates the fair value of our assets in accordance with our valuation guidelines. Because these fair value calculations involve significant professional judgment in the application of both observable and unobservable attributes, the calculated fair value of our assets may differ from their actual realizable value or future fair value. Furthermore, no rule or regulation requires that we calculate NAV in a certain way. While we believe our NAV calculation methodologies are consistent with standard industry principles, there is no established practice among public REITs, whether listed or not, for calculating NAV in order to establish a purchase and repurchase price. As a result, other public REITs may use different methodologies or assumptions to determine NAV.
Our Independent Valuation Advisor
With the approval of our Board, including a majority of our independent directors, we have engaged BDO USA, P.C. to serve as our independent valuation advisor. Our Advisor, with the approval of our Board, including a majority of our independent directors, may engage additional independent valuation advisors in the future as our portfolio grows. At the end of each month, the independent valuation advisor reviews the calculation of our monthly NAV. The independent valuation advisor is not responsible for our NAV, and performs its services based solely on information received from us, our Advisor and our Sub-Advisor. Our Advisor, and not the independent valuation advisor, is ultimately responsible for the determination of our NAV.
Our independent valuation advisor may be replaced at any time, in accordance with agreed-upon notice requirements, by a majority vote of our Board, including a majority of our independent directors. We will promptly disclose any changes to the identity or role of the
independent valuation advisor in reports we publicly file with the SEC. Our independent valuation advisor discharges its responsibilities in accordance with our valuation guidelines. Our Board is not involved in the monthly valuation of our assets and liabilities, but periodically receives and reviews such information about the valuation of our assets and liabilities as it deems necessary to exercise its oversight responsibility.
We have agreed to pay fees to our independent valuation advisor upon its delivery to us of its review reports. We have also agreed to indemnify our independent valuation advisor against certain liabilities arising out of this engagement. The compensation we pay to our independent valuation advisor is not based on the estimated values of our loans or our NAV.
Our independent valuation advisor may from time to time in the future perform other commercial real estate and financial advisory services for our Advisor or Sub-Advisor and their affiliates, so long as such other services do not adversely affect the independence of the independent valuation advisor.
Valuation of Investments
The majority of our investments consist of CRE debt intended to be held to maturity. We may also invest in real estate and other real estate-related assets and liquid non-real estate-related assets. Real estate-related assets include CRE securities, such as CMBS and CRE CLOs, and unsecured debt of publicly traded REITs. Our liquid non-real estate-related assets may include credit rated government and corporate debt securities, publicly traded equity securities and cash and cash equivalents.
Our Advisor seeks to determine the fair value of investments as of the last day of each month. Fair value determinations are based upon all available inputs that our Advisor deems relevant, including, but not limited to, indicative dealer quotes, values of like securities, discounted cash flow analysis, and valuations prepared by third-party valuation services. However, determination of fair value involves subjective judgments and estimates.
•Mortgage Loans, Participations in Mortgage Loans and Mezzanine Loans. Our Advisor estimates the fair value of our loan portfolio in accordance with the methodologies contained in our valuation guidelines approved by our Board. In general, the loan portfolio will be valued at amortized cost, subject to impairment testing. As of January 1, 2023, we are required under GAAP to record a Current Expected Credit Loss (“CECL”) reserve on the CRE debt portfolio that will be adjusted at least quarterly. The analytical portion (which is based on a probability-weighted quantitative analytical model that considers the likelihood of default and loss-given-default for each individual loan) of the CECL reserve is excluded from the value of the loans. The value of the loans does include any specific reserves for collateral-dependent loans included in the CECL reserve amount. We believe this methodology is consistent with institutional valuation practices and provides an appropriate valuation for purposes of establishing a purchase and repurchase price for our shares of common stock as it relates to assets that are intended to be held to maturity.
•Real Estate-Related Securities and Derivatives. Our real estate-related securities investments will generally focus on non-distressed public and private real estate debt, including, but not limited to, CMBS and other forms of debt. Additionally, we may make open market purchases of common stock in public equity REITs. We may also invest in derivatives. Our principal investments in derivative instruments may include investments in interest rate swaps, interest rate cap or floor contracts, futures or forward contracts, options or repurchase agreements. Our real estate-related securities and derivative investments are recorded at fair market value in our financial statements, in accordance with ASC Topic 820. The valuation of these assets is obtained from market quotations obtained from third-party pricing service providers or broker-dealers. Pursuant to the valuation guidelines adopted by our Board, if market quotations are not readily available (or are otherwise not reliable for a particular investment), the fair value is determined in good faith by our Advisor. Due to the inherent uncertainty of these estimates, estimates of fair value may differ from the values that would have been used had a ready market for these investments existed and the differences could be material. Market quotes are considered not readily available in circumstances where there is an absence of current or reliable market-based data (e.g., trade information, bid/ask information, or broker-dealer quotations). Our Board has delegated to our Advisor the responsibility for monitoring significant events that may materially affect the values of our real estate-related securities and derivative investments and for determining whether the value of the applicable investments should be reevaluated in light of such significant events.
•Valuation of Liquid Non-Real Estate-Related Assets. Our liquid non-real estate-related assets are recorded at fair market value in our financial statements, in accordance with ASC Topic 820. The valuation of these assets is based on market prices obtained from third-party pricing services or as published in nationally recognized sources such as Bloomberg.
Valuation of Properties
•Wholly Owned Properties. For real properties we own, our Advisor has developed a valuation plan with the objective of having each of our wholly owned properties valued at least annually by an appraisal, except for newly acquired properties as described below, with appraisals scheduled over the course of a year. We rely on property-level information provided by our Advisor, including but not limited to (1) historical and projected operating revenues and expenses of the property, (2) lease agreements with respect to the property and (3) information regarding recent or planned capital expenditures. Appraisals will be performed in accordance with the Internal Revenue Code of Ethics and the Uniform Standards of Professional Appraisal Practices, the real estate appraisal industry standards created by The Appraisal Foundation. Each appraisal must be reviewed, approved and signed by an individual with the professional designation of MAI (Member of the Appraisal Institute). Newly acquired wholly owned properties will initially be valued at cost and thereafter will join the annual appraisal cycle during the year following the first full calendar year in which we own the property. Development assets, if any, will be valued at cost plus capital expenditures and will join the annual appraisal cycle upon stabilization. Acquisition costs and expenses incurred in connection with the acquisition of multiple wholly owned properties that are not directly related to any single wholly owned property generally will be allocated among the applicable wholly owned properties pro rata based on relative values. Properties purchased as a portfolio or held in a joint venture that acquires properties over time may be valued as a single asset. Each individual appraisal report for our assets will be addressed solely to our company to assist in providing our monthly portfolio valuation.
Our valuation reports will not be addressed to the public and may not be relied upon by any other person to establish an estimated value of our common stock and will not constitute a recommendation to any person to purchase or sell any shares of our common stock. In preparing our NAV calculation, our Advisor will not solicit third-party indications of interest for our common stock in connection with possible purchases thereof or the acquisition of all or any part of our company. Real estate appraisals are reported on a free and clear basis (for example no mortgage), irrespective of any property-level financing that may be in place. The primary methodology used to value properties is the income approach, whereby value is derived by determining the present value of an asset’s stream of future cash flows (for example, discounted cash flow analysis). Consistent with industry practices, the income approach incorporates subjective judgments regarding comparable rental and operating expense data, the capitalization or discount rate, and projections of future rent and expenses based on appropriate evidence. Other methodologies that may also be used to value properties include sales comparisons and replacement cost approaches. Because the appraisals involve subjective judgments, the fair value of our assets, which is included in our NAV, may not reflect the liquidation value or net realizable value of our properties.
•Properties Held Through Joint Ventures. Properties held through joint ventures will be valued in a manner that is consistent with the guidelines described above for wholly owned properties. Once the value of a property held by the joint venture is determined by an independent appraisal, the value of our interest in the joint venture is then determined by applying the distribution provisions of the applicable joint venture agreements to the value of the underlying property held by the joint venture.
Liabilities
We include the fair value of our liabilities as part of our NAV calculation. Our liabilities generally include portfolio-level credit facilities, the fees payable to our Advisor and the Dealer Manager, accounts payable, accrued operating expenses, property-level mortgages, reserves for future liabilities and other liabilities. All liabilities are valued using widely accepted methodologies specific to each type of liability. Our debt is typically valued at fair value in accordance with GAAP. Our aggregate monthly NAV will be reduced to reflect the accrual of the liability to pay any declared (and unpaid) distributions for all classes of common stock. Liabilities allocable to a specific class of shares will only be included in the NAV calculation for that class.
NAV and NAV Per Share Calculation
Each class of our common stock, including Class P common stock that was not offered to the public, has an undivided interest in our assets and liabilities, other than class-specific liabilities. Our NAV is calculated by the independent valuation advisor for each of these classes. Our Advisor is responsible for reviewing and confirming our NAV, and overseeing the process around the calculation of our NAV, in each case, as calculated by the independent valuation advisor. Because stockholder servicing fees allocable to a specific class of shares will only be included in the NAV calculation for that class, the NAV per share for our share classes may differ.
At the end of each month, before taking into consideration class-specific expense accruals for that month, any change in our aggregate NAV (whether an increase or decrease) is allocated among each class of shares based on each class’s relative percentage of the previous aggregate NAV plus issuances of shares that were effective on the first business day of such month and issuances of shares under our DRP and less repurchases under our SRP during such month. The NAV calculation is generally available within 15 calendar days after the end of the applicable month. Changes in our monthly NAV include, without limitation, accruals of our net portfolio income, interest expense, the management fee, any accrued performance fee, distributions, unrealized/realized gains and losses on assets, provisions for
credit losses recorded on specific loans, any applicable organization and offering costs and any expense reimbursements. Changes in our monthly NAV also include material non-recurring events, such as capital expenditures and material property acquisitions and dispositions occurring during the month. On an ongoing basis, our Advisor will adjust the accruals to reflect actual operating results and the outstanding receivable, payable and other account balances resulting from the accumulation of monthly accruals for which financial information is available.
For the purpose of calculating our NAV, offering costs are expenses we incur as we raise proceeds in our public and private offerings. For GAAP purposes, these costs are deducted from equity when incurred. For the NAV calculation, all of the offering costs from our public and private offerings incurred through July 17, 2019 (the “NAV Pricing Date”) were added back to equity and amortized into equity monthly over the 60 months beginning with the first full month that follows the NAV Pricing Date. Following the NAV Pricing Date, offering costs are included in the NAV calculation as and when incurred.
Following the aggregation of the NAV of our investments, the addition of any other assets (such as cash on hand) and the deduction of any other liabilities, the independent valuation advisor will incorporate any class-specific adjustments to our NAV, including additional issuances and repurchases of our common stock and accruals of class-specific stockholder servicing fees. For each applicable class of shares, the stockholder servicing fees will be calculated as a percentage of the aggregate NAV for such class of shares. NAV per share for each class is calculated by dividing such class’s NAV at the end of each month by the number of shares outstanding for that class at the end of such month.
The combination of the Class A NAV, Class T NAV, Class S NAV, Class D NAV, Class I NAV and Class P NAV equals the value of our assets less our liabilities, which include certain class-specific liabilities. Our Advisor calculates the value of our investments as directed by our valuation guidelines based upon values received from various sources, including independent valuation services. Our Advisor, with assistance from our Sub-Advisor, is responsible for information received from third parties that is used in calculating our NAV.
Limits on the Calculation of Our Per Share NAV
The overarching principle of our valuation guidelines is to produce reasonable estimated values for each of our investments (and other assets and liabilities). However, the majority of our assets will consist of real estate loans and, as with any real estate valuation protocol and as described above, the valuation of our loans (and other assets and liabilities) will be based on a number of judgments, assumptions and opinions about future events that may or may not prove to be correct. The use of different judgments, assumptions or opinions would likely result in a different estimate of the value of our real estate loans (and other assets and liabilities). Any resulting potential disparity in our NAV per share may be in favor of stockholders whose shares are repurchased, existing stockholders or new purchasers of our common stock, as the case may be, depending on the circumstances at the time (for cases in which our transaction price is based on NAV).
Additionally, while the methodologies contained in our valuation guidelines are designed to operate reliably within a wide variety of circumstances, it is possible that in certain unanticipated situations or after the occurrence of certain extraordinary events (such as a significant disruption in relevant markets, a terrorist attack or an act of nature), our ability to calculate NAV may be impaired or delayed, including, without limitation, circumstances where there is a delay in accessing or receiving information from vendors or other reporting agents upon which we may rely upon in determining the monthly value of our NAV. In these circumstances, a more accurate valuation of our NAV could be obtained by using different assumptions or methodologies. Accordingly, in special situations when, in our Advisor’s reasonable judgment, the administration of the valuation guidelines would result in a valuation that does not represent a fair and accurate estimate of the value of our investment, alternative methodologies may be applied, provided that our Advisor must notify our Board at the next scheduled board meeting of any alternative methodologies utilized and their impact on the overall valuation of our investment. We include no discounts to our NAV for the illiquid nature of our shares, including the limitations under our SRP and our ability to suspend or terminate our SRP at any time. Our NAV generally does not consider exit costs that would likely be incurred if our assets and liabilities were liquidated or sold. While we may use market pricing concepts to value individual components of our NAV, our per share NAV is not derived from the market pricing information of open-end real estate funds listed on stock exchanges. Our NAV does not represent the fair value of our assets less liabilities under GAAP.
Liquidity and Capital Resources
Liquidity is a measurement of our ability to meet potential cash requirements, including ongoing commitments to pay distributions to our stockholders, fund investments, originate loans, repay borrowings, and other general business needs including the payment of our operating and administrative expenses. Our primary sources of funds for liquidity consist of any future follow-on public offerings of common stock, net cash provided by operating activities, proceeds from repurchase agreements and other financing arrangements and future issuances of equity and/or debt securities.
Our primary sources of liquidity include $44.6 million in cash, $243 million in available capacity on our borrowing facilities, and $20 million in available borrowing capacity from our revolving credit letter agreements with IREIC and Sound Point. We may seek additional sources of liquidity from syndicated financing in the form of collateralized loan obligations, sale of loan participations, other borrowings, including additional repurchase agreement facilities and borrowings not related to a specific investment and future offerings of equity and debt securities.
Our primary liquidity needs include originating new loans and acquiring assets in accordance with our investment objectives, our commitments to repay the principal and interest on our borrowings and pay other financing costs, financing our assets, making advances on our future funding obligations, making distributions to our stockholders, funding redemptions under our SRP, funding our operations which includes paying fees and expenses to our Advisor and Sub-Advisor, payment of offering costs in connection with public offerings of common stock, and other general business needs.
Cash Flow Analysis
| | | | | | | | |
| | Six months ended June 30, | |
| | 2024 | | | 2023 | |
Net cash provided by operating activities | | $ | 7,916 | | | $ | 6,344 | |
Net cash provided by investing activities | | | 38,187 | | | | 53,395 | |
Net cash used in financing activities | | | (55,689 | ) | | | (44,513 | ) |
Net (decrease) increase in cash and cash equivalents | | $ | (9,586 | ) | | $ | 15,226 | |
We experienced a net decrease in cash and cash equivalents of $9,586 for the six months ended June 30, 2024 compared to a net increase of $15,226 for the six months ended June 30, 2023. During the six months ended June 30, 2024, we funded $5,387 in mortgage loans, received $43,410 in principal payments from our loans, paid down $43,992, which is net of draws of $8,201, on our borrowing facilities, and paid distributions of $9,291.
Repurchase Agreements and Credit Facilities
On February 15, 2018, we, through our wholly owned subsidiary, entered into a master repurchase agreement (the “Atlas Repo Facility”) with Column Financial, Inc. as administrative agent for certain of its affiliates. As our business has grown, we have increased the borrowing limit and extended the maturity. The most recent extension was in November 2023 for a twelve-month term and the maximum advance amount was reduced to $100,000. On February 8, 2023, Column Financial, Inc. and affiliated parties sold and assigned their interest in the Atlas Repo Facility to Atlas Securitized Products Investments 2, L.P. with no changes to the terms of the Atlas Repo Facility. Advances under the Atlas Repo Facility for current loans accrue interest at a per annum rate equal to SOFR plus 2.50% to 3.00% with a 0.15% to 0.25% floor. We paid off the outstanding balance on the Atlas Repo Facility in May 2023 and had no outstanding balance as of June 30, 2024. As there was no outstanding balance on the Atlas Repo Facility, we were not subject to any financial covenants.
On May 6, 2019, we, through our wholly owned subsidiary, entered into an uncommitted master repurchase agreement (the “JPM Repo Facility”) with JPMorgan Chase Bank, National Association (“JPM”). The JPM Repo Facility provides up to $150,000 in advances that we expect to use to finance the acquisition or origination of eligible loans and participation interests therein. Advances made prior to December 2021 under the JPM Repo Facility accrue interest at per annum rates equal to the sum of (i) the applicable LIBOR index rate plus (ii) a margin of between 1.75% to 2.50% with no floor, depending on the attributes of the purchased assets. Advances made subsequent to December 2021 under the JPM Repo Facility accrue interest at per annum rates equal to the sum of SOFR plus an agreed upon margin. As of June 30, 2024, all of the advances made under the JPM Repo Facility were indexed to SOFR and have margins between 1.85% and 2.85% with a floor between 0.00% and 2.00%. In May 2022, the maturity date of the JPM Repo Facility was extended to May 6, 2023. On May 5, 2023, we entered into an amendment that extended the maturity date to May 6, 2026, with the option to extend the maturity date further to May 6, 2028 subject to two optional one-year extensions. The amendment also increased the maximum facility amount to $526,076. We used the increased capacity to pay off the balance on the Atlas Repo Facility. The JPM
Repo Facility is subject to certain financial covenants. We were in compliance with all financial covenant requirements as of June 30, 2024 and December 31, 2023.
On March 10, 2021, we, through our wholly owned subsidiary, entered into a credit facility with Western Alliance Bank (the “WA Credit Facility,” together with the Atlas Repo Facility and the JPM Repo Facility, the “Facilities”). The WA Credit Facility provides for loan advances up to the lesser of $75,000 or the borrowing base. The borrowing base consists of eligible assets pledged to and accepted by Western Alliance in its discretion up to the lower of (i) 60% to 70% of loan-to-unpaid balance or (ii) 45% to 50% of the loan-to-appraised value (depending on the property type underlying the asset, for both (i) and (ii)). Assets that would otherwise be eligible become ineligible after being pledged as part of the borrowing base for 36 months. Advances under the WA Credit Facility accrue interest at an annual rate equal to one-month LIBOR plus 3.25% with a floor of 0.75%. The initial maturity date of the WA Credit Facility was March 10, 2023. On March 9, 2023, we extended the maturity date of the WA Credit Facility to March 10, 2025, modified that loan advances are up to the lesser of $40,000 or the borrowing base, and changed the index rate from LIBOR to SOFR. In addition, the spread increased to 3.50% and the floor to 2.50%. We have an option to convert the loan made pursuant to the WA Credit Facility upon its initial maturity to a term loan with the same interest rate and floor and a maturity of two years in exchange for, among other things, a conversion fee of 0.25% of the outstanding amount at the time of conversion. The WA Credit Facility requires maintenance of an average unrestricted aggregate deposit account balance with Western Alliance of not less than $3,750 until the calendar quarter ending on June 30, 2023 and not less than $5,000 commencing with the calendar quarter ending on September 30, 2023. Failure to meet the minimum deposit balance will result in, among other things, the interest rate of the WA Credit Facility increasing by 0.50% per annum for each quarter in which the compensating balances are not maintained. We paid off the outstanding balance on the WA Credit Facility in May 2024 and had no outstanding balance as of June 30, 2024. As there were no borrowings outstanding, we were not subject to any financial covenants.
The Facilities are used to finance eligible loans and act in the manner of a revolving credit facility that can be repaid as our assets are paid off and re-drawn as advances against new assets.
The tables below show our Facilities as of June 30, 2024 and December 31, 2023:
| | | | | | | | | | | | | | | | | | | | | | |
June 30, 2024 | | | | | | | | | | | | | Weighted Average | |
| Committed Financing | | | Amount
Outstanding (1) | | | Accrued
Interest
Payable | | | Collateral
Pledged | | | Interest
Rate | | Days to
Maturity | |
| | | | | | | | | | | | | | | | |
Atlas Repo Facility | $ | 100,000 | | | $ | — | | | $ | — | | | $ | — | | | | — | | | — | |
JPM Repo Facility | | 526,076 | | | | 422,944 | | | | 1,181 | | | | 578,485 | | | | 7.75 | % | | 1,406 | |
Total Repurchase Facilities — commercial mortgage loans | | 626,076 | | | | 422,944 | | | | 1,181 | | | | 578,485 | | | | 7.75 | % | | 1,406 | |
WA Credit Facility | | 40,000 | | | | — | | | | — | | | | — | | | | — | | | — | |
| $ | 666,076 | | | $ | 422,944 | | | $ | 1,181 | | | $ | 578,485 | | | | 7.75 | % | | 1,406 | |
| | | | | | | | | | | | | | | | | | | | | | |
December 31, 2023 | | | | | | | | | | | | | Weighted Average | |
| Committed Financing | | | Amount
Outstanding (1) | | | Accrued
Interest
Payable | | | Collateral
Pledged | | | Interest
Rate | | Days to
Maturity | |
Atlas Repo Facility | $ | 100,000 | | | $ | — | | | $ | — | | | $ | — | | | | — | | | — | |
JPM Repo Facility | | 526,076 | | | | 457,438 | | | | 1,385 | | | | 644,201 | | | | 7.78 | % | | 1,588 | |
Total Repurchase Facilities — commercial mortgage loans | | 626,076 | | | | 457,438 | | | | 1,385 | | | | 644,201 | | | | 7.78 | % | | 1,588 | |
WA Credit Facility | | 40,000 | | | | 9,498 | | | | 42 | | | | 13,647 | | | 9.34% (2) | | | 435 | |
| $ | 666,076 | | | $ | 466,936 | | | $ | 1,427 | | | $ | 657,848 | | | | 7.81 | % | | 1,565 | |
(1)Excludes $0 of unamortized debt issuance costs as of June 30, 2024 and December 31, 2023.
(2)Includes 0.50% additional interest rate during the third and fourth quarters of 2023 as the minimum deposit balance was not met by us as of June 30, 2023.
Loan Participations Sold
On November 15, 2021, we sold a non-recourse senior participation interest in nine first mortgage loans to a third party. Under the loan participation agreement, in the event of default by the underlying mortgagor, any amounts paid are first allocated to the third party before
any amounts are allocated to our subordinate interest. As the directing participant in the loan participation agreement, we are entitled to exercise, without the consent of the third party, each of the consent approval and control rights under the applicable underlying mortgage loan documents with a few exceptions. We require the third party’s approval for any modification or amendment to the loan, a bankruptcy plan for an underlying mortgagor where the third party would incur an out-of-pocket loss, or any transfer of the underlying mortgaged property if our approval is required by the underlying mortgage documents. We remain the directing participant unless certain conditions are met related to losses on the property or if the mortgagor is one of our affiliates. In the former case, we may post cash or short-term U.S. government securities as collateral to retain the rights of the directing participant.
The third party, as the senior participation interest holder, receives interest and principal payments from the borrower until they receive the amounts to which they are entitled. All expenses or losses on the underlying mortgages are allocated first to us and then to the third party. If the underlying mortgage is in default, we will have the option to purchase the third party’s participation interest and remove it from the loan participation agreement.
The following table details our loan participations sold as of June 30, 2024 and December 31, 2023:
| | | | | | | | | | | | | | | | | | | | |
| | June 30, 2024 | |
Loan Participations Sold | | Count | | | Principal Balance | | | Book Value | | | Yield/Cost (1) | | Guarantee (2) | | Weighted Average Maximum Maturity (4) | |
Total Loans | | | 4 | | | $ | 70,282 | | | $ | 68,262 | | | SOFR+3.5% | | n/a | | | 0.19 | |
Senior participations (3) | | | 4 | | | $ | 56,226 | | | $ | 56,226 | | | SOFR+2.0% | | n/a | | | 0.19 | |
| | | | | | | | | | | | | | | | | | | | |
| | December 31, 2023 | |
Loan Participations Sold | | Count | | | Principal Balance | | | Book Value | | | Yield/Cost (1) | | Guarantee (2) | | Weighted Average Maximum Maturity (4) | |
Total Loans | | | 4 | | | $ | 71,532 | | | $ | 65,435 | | | SOFR+3.5% | | n/a | | | 0.11 | |
Senior participations (3) | | | 4 | | | $ | 57,226 | | | $ | 57,226 | | | SOFR+2.0% | | n/a | | | 0.11 | |
____________ | | | | | | | | | | | | | | | | |
(1)The yield/cost is the present value of all future principal and interest payments on the loan or participation interest and does not include any origination fees or deferred commitment fees. The yield/cost excludes maturity default interest and interest on loans placed on nonaccrual status.
(2)As of June 30, 2024 and December 31, 2023, the loan participations sold were non-recourse to us.
(3)During the six months ended June 30, 2024 and 2023, we recorded $1,456 and $2,988 of interest expense related to loan participations sold, respectively.
(4)Based on the furthest maximum maturity date of all the loans subject to the participation agreement.
Revolving Credit Liquidity Letter Agreements
IREIC, our sponsor, and Sound Point have agreed under separate letter agreements dated July 20, 2021, and July 15, 2021, respectively, to make revolving credit loans to us in an aggregate principal amount outstanding at any one time not to exceed $5,000 and $15,000, respectively (the “IREIC-Sound Point Commitments”) from time to time. Use of the IREIC-Sound Point Commitments is limited to satisfying requirements to maintain cash or cash equivalents under our repurchase and other borrowing arrangements.
Distributions
Common Stock
The table below presents the aggregate annualized and monthly distributions declared by record date for all classes of shares of common stock since January 1, 2023. The amount of distributions that we may pay in the future is not certain.
| | | | | | | | |
Record date | | Aggregate annualized gross distribution declared per share | | | Aggregate monthly gross distribution declared per share | |
January 31, 2023 | | $ | 1.2500 | | | $ | 0.1042 | |
February 28, 2023 | | $ | 1.2500 | | | $ | 0.1042 | |
March 31, 2023 | | $ | 1.2500 | | | $ | 0.1042 | |
April 30, 2023 | | $ | 1.2500 | | | $ | 0.1042 | |
May 31, 2023 | | $ | 1.2500 | | | $ | 0.1042 | |
June 30, 2023 | | $ | 1.2500 | | | $ | 0.1042 | |
July 31, 2023 | | $ | 1.2500 | | | $ | 0.1042 | |
August 31, 2023 | | $ | 1.2500 | | | $ | 0.1042 | |
September 30, 2023 | | $ | 1.2500 | | | $ | 0.1042 | |
October 31, 2023 | | $ | 1.2500 | | | $ | 0.1042 | |
November 30, 2023 | | $ | 1.2500 | | | $ | 0.1042 | |
December 31, 2023 | | $ | 1.2500 | | | $ | 0.1042 | |
January 30, 2024 | | $ | 1.2500 | | | $ | 0.1042 | |
February 29, 2024 | | $ | 1.2500 | | | $ | 0.1042 | |
March 31, 2024 | | $ | 1.2500 | | | $ | 0.1042 | |
April 30, 2024 | | $ | 1.2500 | | | $ | 0.1042 | |
May 31, 2024 | | $ | 1.2500 | | | $ | 0.1042 | |
June 30, 2024 | | $ | 1.2500 | | | $ | 0.1042 | |
The gross distribution was reduced each month for Class D and Class T of our common stock for applicable class-specific stockholder servicing fees to arrive at a lower net distribution amount paid to those classes. For a description of the stockholder servicing fees applicable to Class D, Class S and Class T shares of our common stock, please see “Note 10 – Transactions with Related Parties” in the notes to our consolidated financial statements included in this Quarterly Report on Form 10-Q. Since the IPO and through June 30, 2024, we have not issued any shares of Class S common stock.
The following table shows our monthly net distribution per share for shares of Class D and Class T common stock since January 1, 2023.
| | | | | | | | |
Record date | | Monthly net distribution declared per share of Class D common stock | | | Monthly net distribution declared per share of Class T common stock | |
January 31, 2023 | | $ | 0.1000 | | | $ | 0.0900 | |
February 28, 2023 | | $ | 0.1004 | | | $ | 0.0914 | |
March 31,2023 | | $ | 0.1001 | | | $ | 0.0903 | |
April 30,2023 | | $ | 0.1002 | | | $ | 0.0907 | |
May 31, 2023 | | $ | 0.1001 | | | $ | 0.0903 | |
June 30, 2023 | | $ | 0.1004 | | | $ | 0.0912 | |
July 31, 2023 | | $ | 0.1005 | | | $ | 0.0916 | |
August 31, 2023 | | $ | 0.1005 | | | $ | 0.0915 | |
September 30, 2023 | | $ | 0.1006 | | | $ | 0.0920 | |
October 31, 2023 | | $ | 0.1005 | | | $ | 0.0916 | |
November 30, 2023 | | $ | 0.1006 | | | $ | 0.0920 | |
December 31, 2023 | | $ | 0.1005 | | | $ | 0.0916 | |
January 30, 2024 | | $ | 0.1006 | | | $ | 0.0919 | |
February 29, 2024 | | $ | 0.1008 | | | $ | 0.0927 | |
March 31, 2024 | | $ | 0.1006 | | | $ | 0.0920 | |
April 30, 2024 | | $ | 0.1007 | | | $ | 0.0925 | |
May 31, 2024 | | $ | 0.1006 | | | $ | 0.0921 | |
June 30, 2024 | | $ | 0.1008 | | | $ | 0.0925 | |
Series A Preferred Stock
Series A Preferred Stock dividends are paid quarterly in arrears based on an annualized distribution rate of 6.75% of the $25.00 per share liquidation preference, or $1.6875 per share per annum. The table below shows the aggregate annualized and quarterly distributions declared on the Series A Preferred Stock by record date since January 1, 2023.
| | | | | | |
Record date | Aggregate annualized gross distribution declared per share | | Aggregate quarterly gross distribution declared per share | |
March 15, 2023 | $ | 1.6875 | | $ | 0.421875 | |
June 15, 2023 | $ | 1.6875 | | $ | 0.421875 | |
September 15, 2023 | $ | 1.6875 | | $ | 0.421875 | |
December 15, 2023 | $ | 1.6875 | | $ | 0.421875 | |
March 15, 2024 | $ | 1.6875 | | $ | 0.421875 | |
June 15, 2024 | $ | 1.6875 | | $ | 0.421875 | |
Sources of Distributions to Common Stockholders
| | | | | | | | |
| | Six months ended June 30, | |
| | 2024 | | | 2023 | |
Distributions to Holders of Common Stock | | | | | | |
Paid in cash | | $ | 6,300 | | | $ | 6,209 | |
Reinvested in shares | | | — | | | | 85 | |
Total distributions | | $ | 6,300 | | | $ | 6,294 | |
Net cash provided by operating activities | | $ | 7,916 | | | $ | 6,344 | |
During the six months ended June 30, 2024 and 2023, 100% of our distributions were paid from cash flows from operating activities generated during the period.
Critical Accounting Policies
There have been no material changes to our critical accounting policies set forth in our Annual Report on Form 10-K under the heading “Summary of Critical Accounting Policies and Estimates.”
Commercial Mortgage Loans Held for Investment and Allowance for Credit Losses
Loans held-for-investment are anticipated to be held until maturity, and reported at cost, net of allowance for credit losses, any unamortized acquisition premiums or discounts, loan fees and origination costs, as applicable. In accordance with ASU 2016-13, Financial Instruments - Credit Losses (Topic 326): Measurement of Credit Losses on Financial Instruments, or ASU 2016-13, we use a probability-weighted quantitative analytical model to estimate and recognize an allowance for credit losses on loans held-for-investment and their related unfunded commitments. We employed quarterly updated macroeconomic forecasts, which reflect expectations for overall economic output, interest rates, values of real estate properties and other factors, geopolitical instability and the Federal Reserve monetary policy impact on the overall U.S. economy and commercial real estate markets generally. These estimates may change in future periods based on available future macroeconomic data and might result in a material change in our future estimates of expected credit losses for our loan portfolio.
We consider loan investments that are both (i) expected to be substantially repaid through the operation or sale of the underlying collateral, and (ii) for which the borrower is experiencing financial difficulty, to be “collateral-dependent” loans. For loans that we determine foreclosure of the collateral is probable, we measure the expected losses based on the difference between the fair value of the collateral and the amortized cost basis of the loan as of the measurement date. For collateral-dependent loans that we determine foreclosure is not probable, we apply a practical expedient to estimate expected losses using the difference between the collateral’s fair value (less costs to sell the asset if repayment is expected through the sale of the collateral) and the amortized cost basis of the loan.
For loans assigned a risk rating of “5,” we have determined that the recovery of the loan’s principal is collateral-dependent. Accordingly, these loans are assessed individually, and we elected to apply a practical expedient in accordance with ASU 2016-13. While utilizing the practical expedient for collateral-dependent loans, we estimate the fair value of the loan’s underlying collateral using the discounted cash flow method of valuation, less the estimated cost to foreclose and sell the property when applicable. The estimation of the fair value of the collateral property also involves using various Level 3 unobservable inputs, which are inherently uncertain and subjective, and are in part developed based on discussions with various market participants and management’s best estimates, which may vary depending on the information available and market conditions as of the valuation date. Selecting the appropriate inputs and assumptions requires significant judgment and consideration of various factors that are specific to the underlying collateral property being assessed. Our estimate of the fair value of the collateral property is sensitive to both the valuation methodology selected and inputs used in the analysis. As a result, the fair value of the collateral property used in determining the expected credit losses is subject to uncertainty and any actual losses, if incurred, could differ materially from the estimated provision for credit losses.
Interest income on loans held-for-investment is recognized at the loan coupon rate. Any premiums or discounts, loan fees, contractual exit fees and origination costs are amortized or accreted into interest income over the lives of the loans using the effective interest method. Generally, loans held-for-investment are placed on nonaccrual status when delinquent for more than 90 days or when determined not to be probable of full collection. Interest income recognition is suspended when loans are placed on nonaccrual status. Interest accrued, but not collected, at the date loans are placed on nonaccrual is reversed and subsequently recognized only to the extent it is received in cash or until it qualifies for return to accrual status. However, when there is doubt regarding the ultimate collectability of loan principal, all cash received is applied to reduce the carrying value of such loans. Loans held-for-investment are restored to accrual status only when contractually current or the collection of future payments is reasonably assured. We may make exceptions to placing a loan on nonaccrual status if the loan has sufficient collateral value and is in the process of collection or has been modified.
The allowance for credit losses is recorded in accordance with ASU 2016-13, and is a valuation account that is deducted from the amortized cost basis of loans held-for-investment on our consolidated balance sheets. Changes to the allowance for credit losses are recognized through net income (loss) on our consolidated statements of operations. The allowance is based on relevant information about past events, including historical loss experience, current portfolio, market conditions and reasonable and supportable forecasts for the duration of each respective loan. All loans held-for-investment within our portfolio have some amount of expected loss to reflect the GAAP principal underlying the CECL model that all loans have some inherent risk of loss, regardless of credit quality, subordinate capital or other mitigating factors.
Our loans typically include commitments to fund incremental proceeds to our borrowers over the life of the loan. Those future funding commitments are also subject to an allowance for credit losses. The allowance for credit losses related to future loan fundings is recorded as a component of “Accrued expenses and other liabilities” on our consolidated balance sheets, and not as an offset to the related loan balance. This allowance for credit losses is estimated using the same process outlined below for our outstanding loan balances, and changes in this component of the allowance for credit losses similarly flow through our consolidated statements of operations.
The allowance for credit losses is estimated on a quarterly basis and represents management’s estimates of current expected credit losses in our investment portfolio. Pools of loans with similar risk characteristics are collectively evaluated while loans that no longer share risk characteristics with loan pools are evaluated individually. Estimating an allowance for credit losses is inherently subjective, as it requires management to exercise significant judgment in establishing appropriate factors used to determine the allowance and a variety of subjective assumptions, including (i) determination of relevant historical loan loss data sets, (ii) the expected timing and amount of future loan fundings and repayments, (iii) the current credit quality of loans and operating performance of loan collateral and our expectations of performance, (iv) selecting the forecast for macroeconomic conditions and (v) determining the reasonable and supportable forecast period.
We estimate the analytical portion of our allowance for credit losses by using a probability-weighted quantitative analytical model that considers the likelihood of default and loss-given-default for each individual loan. The analytical model incorporates a third-party licensed database for over 100,000 commercial real estate loans. We license certain macroeconomic financial forecasts from a third-party to inform our view of the potential future impact that broader macroeconomic conditions may have on the performance of the loans held-for-investment. These macroeconomic factors include unemployment rates, interest rates, price indices for commercial property and other factors. We may use one or more of these forecasts in the process of estimating our allowance for credit losses. Selection of these economic forecasts requires significant judgment about future events that, while based on the information available to us as of the balance sheet date, are ultimately unknowable with certainty, and the actual economic conditions impacting our portfolio could vary significantly from the estimates we made for the periods presented. Significant inputs to our estimate of the allowance for credit losses include the reasonable and supportable forecast period and loan specific factors such as debt service coverage ratio, or DSCR, loan-to-value ratio, or LTV, remaining contractual loan term, property type and others. In addition, we also consider relevant loan-specific qualitative factors to estimate our allowance for credit losses.
Off-Balance Sheet Arrangements
As of June 30, 2024, we had no off-balance sheet arrangements that were reasonably likely to have a material current or future effect on our financial condition, changes in financial condition, revenues or expenses, results of operations, liquidity, capital expenditures or capital resources excluding future loan advance commitments as disclosed in “Note 8 – Commitments and Contingencies.
Subsequent Events
For information related to subsequent events, reference is made to “Note 14 – Subsequent Events,” which is included in our notes to consolidated financial statements included in this Quarterly Report on Form 10-Q.
Our Corporate Information
Our principal executive offices are located at 2901 Butterfield Rd., Oak Brook, Illinois 60523, our telephone number is (866) 694-6526 and our website is www.inland-investments.com/inpoint. From time to time, we may use our website as a distribution channel for material company information, including, for example, our position on any third-party tender offers for our securities. Our website is not incorporated by reference in or otherwise a part of this Quarterly Report on Form 10-Q. We will provide without charge a copy of this Quarterly Report on Form 10-Q upon written request delivered to our principal executive offices. We electronically file our Annual Report on Form 10-K, Quarterly Reports on Form 10-Q, Current Reports on Form 8-K, proxy statements and all amendments to those reports with the SEC. The SEC maintains an Internet site at www.sec.gov that contains reports, proxy and information statements and other information regarding issuers that file electronically.
Item 3. Quantitative and Qualitative Disclosures About Market Risk
Credit Risk
Our investments are subject to a high degree of credit risk. Credit risk is the exposure to loss from loan defaults. Default rates are subject to a wide variety of factors, including, but not limited to, borrower financial condition, property performance, property management, supply/demand factors, construction trends, consumer behavior, regional economics, interest rates, the strength of the U.S. economy, and other factors beyond our control. All loans are subject to some risk of default. We manage credit risk through the underwriting process and investment structuring process, acquiring our investments at the appropriate discount to face value, if any, and establishing loss assumptions. We also carefully monitor the performance of the loans, as well as external factors that may affect their value.
Adverse economic conditions could negatively impact the commercial properties underlying our investments resulting in potential borrower delinquencies or defaults. If we fail to repay the lender at maturity, the lender has the right to immediately sell the collateral and pursue us for any shortfall if the sales proceeds are inadequate to cover the repurchase agreement financing.
Interest Rate Risk
Our market risk arises primarily from interest rate risk relating to interest rate fluctuations. Many factors including governmental monetary and tax policies, domestic and international economic and political considerations and other factors that are beyond our control contribute to interest rate risk. To meet our short and long-term liquidity requirements, we may borrow funds at fixed and variable rates. Our interest rate risk management objectives are to limit the impact of interest rate changes in earnings and cash flows and to lower our overall borrowing costs. To achieve these objectives, from time to time, we may enter into interest rate hedge contracts such as swaps, collars and treasury lock agreements in order to mitigate our interest rate risk with respect to various debt instruments. While hedging activities may insulate us against adverse changes in interest rates, they may also limit our ability to participate in benefits of lower interest rates with respect to our portfolio of investments with fixed interest rates. During the six months ended June 30, 2024 and 2023, we did not engage in interest rate hedging activities. We do not hold or issue derivative contracts for trading or speculative purposes. We do not have any foreign denominated investments, and thus, we are not exposed to foreign currency fluctuations.
As of both June 30, 2024 and December 31, 2023, our debt investment portfolio was 98% variable rate investments based on SOFR for various terms. Borrowings under our master repurchase agreements were short-term and at a variable rate. Both our investment portfolio and borrowings have minimum levels for SOFR known as interest rate floors. The floors were established when the loans and borrowings were originated based on market conditions. The following table quantifies the potential changes in interest income net of interest expense should interest rates increase or decrease by 25 or 50 basis points, assuming that our current balance sheet was to remain constant and no actions were taken to alter our existing interest rate sensitivity. The change from December 31, 2023 to June 30, 2024 was primarily due to the changes in the portfolio relating to payoffs, paydowns and draws.
| | | | | | | |
| Estimated Percentage Change in Interest Income Net of Interest Expense | |
Change in Rates | June 30, 2024 | | | December 31, 2023 | |
(-) 50 Basis Points | | (4.30 | )% | | | (4.18 | )% |
(-) 25 Basis Points | | (2.15 | )% | | | (2.09 | )% |
Base Interest Rate | | 0.00 | % | | | 0.00 | % |
(+) 25 Basis Points | | 2.15 | % | | | 2.09 | % |
(+) 50 Basis Points | | 4.30 | % | | | 4.18 | % |
For this analysis, SOFR was assumed to not fall below zero.
Item 4. Controls and Procedures
Controls and Procedures
Our management has evaluated, with the participation of our principal executive and principal financial officers, the effectiveness of our disclosure controls and procedures (as defined in Rules 13a-15(e) and 15d-15(e) under the Exchange Act) as of the end of the period covered by this Quarterly Report on Form 10-Q. Based on that evaluation, the principal executive and principal financial officers have concluded that our disclosure controls and procedures were effective as of the end of the period covered by this Quarterly Report on Form 10-Q.
Changes in Internal Control over Financial Reporting
There were no changes to our internal control over financial reporting (as defined in Exchange Act Rule 13a-15(f) or Rule 15d-15(f)) during the three months ended June 30, 2024 that have materially affected, or are reasonably likely to materially affect, our internal control over financial reporting.
Part II - Other Information
Item 1. Legal Proceedings
In the ordinary course of business, we may become subject to litigation. We have no knowledge of material legal proceedings pending or known to be contemplated against us at this time.
Item 1A. Risk Factors
The following risk factors amend and supplement the risk factors set forth in our Annual Report on Form 10-K for the year ended December 31, 2023.
Tenant defaults may have a material adverse effect on our office property holdings.
We own two office properties in Texas that we recently acquired through foreclosure. Going forward, we will receive revenues and income from rental income from these two office properties. As such, our business, financial condition and results of operations could be adversely affected if our tenants default on their rental payments or other lease obligations. Rental payment defaults, including those caused by the current economic climate or tenant liquidity limitations resulting from adverse developments affecting our tenants, could have an impact on our results of operations.
Our ability to manage our assets is also subject to federal bankruptcy laws and state laws that limit creditors’ rights and remedies available to real property owners to collect delinquent rents. If a tenant becomes insolvent or bankrupt, we cannot be sure that we could recover the premises from the tenant promptly or from a trustee or debtor-in-possession in any bankruptcy proceeding relating to that tenant. We also cannot be sure that we would receive any rent in the proceeding sufficient to cover our expenses and future income expectations with respect to the premises. If a tenant becomes bankrupt, the federal bankruptcy code will apply and, in some instances, may restrict the amount and recoverability of our claims against the tenant. A tenant’s default on its lease obligations may have a material adverse effect on our business, financial condition and results of operations.
Our real estate portfolio is comprised of two office assets we recently acquired through foreclosure, which have generally experienced a decrease in demand and value. Office assets may experience a further decrease in demand and value and such decrease in demand could have a material adverse effect on us. Further, our ability to sell any of our office assets may be limited in the current economic climate.
Our real estate portfolio is comprised entirely of two office assets we recently acquired through foreclosure, which have generally experienced a decrease in occupancy and value. Current economic conditions could lead our office tenants electing not to renew their leases, or to renew their leases for less space than they currently occupy, which could further increase vacancy rates and decrease rental income. Remote and hybrid work practices are likely to continue in a post-pandemic environment. As a result of the increased bargaining power of tenants, we may be required to spend increased amounts for property improvements. Additionally, if substantial office space reconfiguration is required, it may be more attractive for our tenants to pursue relocating to other office space than renewing their leases and renovating their existing space, which could have a material adverse effect on us.
Additionally, in the event of a default, a termination of, or failure to renew a lease, we may experience delays in enforcing our rights as landlord and may incur substantial costs in protecting our investment and re-letting the property or experience a further decrease in value
of a property if we determine to sell such property while it is vacant. In addition, there is no assurance that we will be able to lease the property for the rent previously received or sell the property without incurring a loss due to its being vacant.
Item 2. Unregistered Sales of Equity Securities and Use of Proceeds
Recent Sales of Unregistered Equity Securities
We did not have any recent sales of unregistered securities during the period covered by this Quarterly Report on Form 10-Q.
Use of Proceeds
On May 3, 2019, our 2019 Registration Statement on Form S-11 (File No. 333-230465) for our IPO of common stock of up to $2,350,000 in shares of Class A, Class T, Class S, Class D and Class I common stock, was declared effective under the Securities Act. Inland Securities Corporation served as our dealer manager for the common stock IPO. On April 28, 2022, we filed 2022 Registration Statement on Form S-11 (File No. 333-264540) with the SEC, for our Second Public Offering, to register up to $2,200,000 in shares of common stock, which was declared effective by the SEC on November 2, 2022.
As of June 30, 2024, we had received net offering proceeds of $42.8 million from the IPO and Second Public Offering. The following table summarizes certain information about the Public Offerings’ proceeds ($ in thousands):
| | | | | | | | | | | | | | | | | | |
| Class A
Shares | | Class T
Shares | | Class S
Shares | | Class D
Shares | | Class I
Shares | | Total | |
Primary shares sold | | 794,715 | | | 464,881 | | | — | | | 53,815 | | | 489,069 | | | 1,802,480 | |
Gross proceeds from primary offerings | $ | 19,695 | | $ | 11,309 | | $ | — | | $ | 1,237 | | $ | 10,999 | | $ | 43,240 | |
Reinvestments of distributions | | 619 | | | 304 | | | — | | | 93 | | | 658 | | | 1,674 | |
Total gross proceeds | | 20,314 | | | 11,613 | | | — | | | 1,330 | | | 11,657 | | | 44,914 | |
Selling commissions and dealer manager fees | | 1,142 | | | 313 | | | — | | | — | | | — | | | 1,455 | |
Stockholder servicing fees | | — | | | 547 | | | — | | | 98 | | | — | | | 645 | |
Total expenses | | 1,142 | | | 860 | | | — | | | 98 | | | — | | | 2,100 | |
Net offering proceeds (1) | $ | 19,172 | | $ | 10,753 | | $ | — | | $ | 1,232 | | $ | 11,657 | | $ | 42,814 | |
(1)Excludes company-level offering costs of $6,421.
We primarily used the net offering proceeds from the Public Offerings to originate commercial real estate loans and purchase real estate securities on a levered basis, subject to our investment guidelines and to the extent consistent with maintaining our REIT qualification, and other general corporate purposes.
In light of the pace of fundraising in the Second Public Offering and the amount of monthly redemption requests pursuant to the SRP, which were in excess of such fundraising, on January 30, 2023, the Board approved, effective immediately, the suspension of the operation of the SRP. In connection with such suspension, the Board also approved the suspension of the sale of shares in the primary portion of the Second Public Offering (the “Primary Offering”), effective immediately, and the suspension of the sale of shares pursuant to the DRP, effective as of February 10, 2023. The Primary Offering, the SRP, and the DRP shall each remain suspended unless and until such time as the Board approves their resumption.
On September 15, 2021, our registration statement on Form S-11 (File No. 333-258802) for our Preferred Stock Offering of up to 3,500,000 shares of Series A Preferred Stock was declared effective under the Securities Act. Raymond James & Associates acted as representative of the underwriters. On September 22, 2021, we issued and sold 3,500,000 shares of our Series A Preferred Stock at a public offering price of $25.00 per share. In addition, on October 15, 2021, the underwriters partially exercised their over-allotment option and purchased an additional 100,000 shares of Series A Preferred Stock. The Series A Preferred Stock is listed on the New York Stock Exchange with the ticker symbol ICR PR A.
As of June 30, 2024, we received net offering proceeds of $86.3 million from our Preferred Stock Offering. The following table summarizes certain information about the proceeds from our Preferred Stock Offering ($ in thousands):
| | | |
| Series A
Preferred Stock | |
Primary shares sold | | 3,600,000 | |
Gross proceeds from primary offering | $ | 90,000 | |
Underwriting discounts and commissions | | 2,835 | |
Other expenses | | 855 | |
Total expenses | | 3,690 | |
Net offering proceeds | $ | 86,310 | |
We contributed the net proceeds from the Preferred Stock Offering to our Operating Partnership, which in turn used the net proceeds to originate first mortgage loans and acquire other targeted assets in a manner consistent with our investment strategies and investment guidelines and for general corporate purposes.
Repurchases of Common Stock
We adopted an SRP, effective May 3, 2019, whereby on a monthly basis, stockholders who have held our shares of common stock for at least one year may request that we repurchase all or any portion of their shares. Due to the illiquid nature of investments in real estate, we may not have sufficient liquid resources to fund repurchase requests. Because there is no public market for our shares, stockholders may have difficulty selling their shares if we choose to repurchase only some, or even none, of the shares that have been requested to be repurchased in any particular month, in our discretion, or if our Board modifies, suspends or terminates the SRP.
In addition, we established limitations on the amount of funds we may use for repurchases during any calendar month and quarter. We may repurchase fewer shares than have been requested in any particular month to be repurchased under our SRP, or none at all, in our discretion at any time. In addition, the total amount of aggregate repurchases of shares will be limited to no more than 2% of our aggregate NAV per month and no more than 5% of our aggregate NAV per calendar quarter.
In light of the pace of fundraising in the Second Public Offering and the amount of monthly redemption requests pursuant to the SRP, which were in excess of such fundraising, on January 30, 2023, our Board unanimously approved, effective immediately, the suspension of the operation of the SRP.
During the six months ended June 30, 2024, we repurchased no shares of our common stock.
Repurchases of Series A Preferred Stock
Subject to certain exceptions, we may not redeem our Series A Preferred Stock until on or after September 22, 2026. Preferred stockholders may only convert their Series A Preferred Shares into Class I common stock if there is a Change of Control and we do not redeem the shares within 120 days of the Change of Control event. For the six months ended June 30, 2024, there were no redemptions of our Series A Preferred Stock and no conversions of our Series A Preferred Stock to common stock.
On August 11, 2022, the Board authorized and approved a share repurchase program (the “Series A Preferred Repurchase Program”) pursuant to which we were permitted to repurchase up to the lesser of 1,000,000 shares or $15 million of the outstanding shares of our Series A Preferred Stock through December 31, 2022. On November 10, 2022, the Board approved to extend the Series A Preferred Repurchase Program through December 31, 2023. Under the Series A Preferred Repurchase Program, repurchases of shares of our Series A Preferred Stock were to be made at management’s discretion from time to time through open market purchases, privately-negotiated transactions, block purchases or otherwise in accordance with applicable federal securities laws. On January 30, 2023, our Board approved the termination of the Series A Preferred Repurchase Program.
Item 3. Defaults Upon Senior Securities
None.
Item 4. Mine Safety Disclosures
Not Applicable.
Item 5. Other Information
Trading Arrangements
During the quarter ended June 30, 2024, none of the Company’s directors or executive officers adopted or terminated any contract, instruction or written plan for the purchase or sale of the Company’s securities that was intended to satisfy the affirmative defense conditions of Rule 10b5-1(c) or any “non-Rule 10b5-1 trading arrangement.”
Item 6. Exhibits
The representations, warranties and covenants made by us in any agreement filed as an exhibit to this Quarterly Report on Form 10-Q are made solely for the benefit of the parties to the agreement, including, in some cases, for the purpose of allocating risk among the parties to the agreement, and should not be deemed to be representations, warranties or covenants to, or with, you. Moreover, these representations, warranties and covenants should not be relied upon as accurately describing or reflecting the current state of our affairs.
The exhibits filed in response to Item 601 of Regulation S-K are listed on the Exhibit Index attached hereto and are incorporated herein by reference.
| | |
Exhibit No. | | Description |
| | |
3.1 | | Articles of Amendment and Restatement of InPoint Commercial Real Estate Income, Inc. (filed as Exhibit 3.1 to the Registrant’s Registration Statement on Form 10 filed May 2, 2017 and incorporated by reference) |
3.2 | | Articles of Amendment of InPoint Commercial Real Estate Income, Inc. (filed as Exhibit 3.1 to the Registrant’s Current Report on Form 8-K filed April 30, 2019 and incorporated by reference) |
3.3 | | Articles Supplementary of InPoint Commercial Real Estate Income, Inc. (filed as Exhibit 3.2 to the Registrant’s Current Report on Form 8-K filed April 30, 2019 and incorporated by reference) |
3.4 | | Certificate of Correction of InPoint Commercial Real Estate Income, Inc. (filed as Exhibit 3.4 to the Registrant’s Quarterly Report on Form 10-Q filed August 14, 2019 and incorporated by reference) |
3.5 | | Articles Supplementary of InPoint Commercial Real Estate Income, Inc. designating the Series A Preferred Stock (filed as Exhibit 3.5 to the Registrant’s Form 8-A filed September 22, 2021 and incorporated by reference) |
3.6 | | Bylaws of InPoint Commercial Real Estate Income, Inc. (filed as Exhibit 3.2 to the Registrant’s Registration Statement on Form 10 filed May 2, 2017 and incorporated by reference) |
4.1 | | Amended and Restated Distribution Reinvestment Plan (filed as Exhibit 4.1 to the Registrant’s Registration Statement on Form S-11 filed April 11, 2022 and incorporated by reference) |
4.2 | | Form of certificate representing the Series A Preferred Stock (filed as Exhibit 4.1 to the Registrant’s Form 8-A filed September 22, 2021 and incorporated by reference) |
31.1* | | Certification of the Principal Executive Officer of the Registrant, pursuant to Securities Exchange Act Rule 13a-14 and 15d-14 as adopted pursuant to Section 302 of the Sarbanes‑Oxley Act of 2002 |
31.2* | | Certification of the Principal Financial Officer of the Registrant, pursuant to Securities Exchange Act Rule 13a-14 and 15d-14 as adopted pursuant to Section 302 of the Sarbanes‑Oxley Act of 2002 |
32.1* | | Certification of the Principal Executive Officer of the Registrant pursuant to 18 U.S.C. Section 1350 as adopted pursuant to Section 906 of the Sarbanes‑Oxley Act of 2002 |
32.2* | | Certification of the Principal Financial Officer of the Registrant pursuant to 18 U.S.C. Section 1350 as adopted pursuant to Section 906 of the Sarbanes‑Oxley Act of 2002 |
101.INS | | Inline XBRL Instance Document – the instance document does not appear in the Interactive Data File because XBRL tags are embedded within the Inline XBRL document. |
101.SCH | | Inline XBRL Taxonomy Extension Schema with Embedded Linkbases Document |
104 | | Cover Page Interactive Data File (embedded within the Inline XBRL document) |
* Filed as part of this Quarterly Report on Form 10-Q
SIGNATURES
Pursuant to the requirements of the Securities Exchange Act of 1934, as amended, the registrant has duly caused this report to be signed on its behalf by the undersigned, thereunto duly authorized.
| | |
| INPOINT COMMERCIAL REAL ESTATE INCOME, INC. |
| |
| By: | /s/ Mitchell A. Sabshon |
| Name: | Mitchell A. Sabshon |
| Title: | Chief Executive Officer and Chairman |
| | (principal executive officer) |
| Date: | August 9, 2024 |
| |
| By: | /s/ Catherine L. Lynch |
| Name: | Catherine L. Lynch |
| Title: | Chief Financial Officer |
| | (principal financial officer) |
| Date: | August 9, 2024 |