2024 Annual Stockholder’s Meeting September 12, 2024 | 1:30 PM CST This presentation is neither an offer to sell nor the solicitation of an offer to buy any security, which can be made only by a prospectus that has been filed or registered with appropriate state and federal regulatory agencies and sold only by broker dealers and registered investment advisors authorized to do so. There is no assurance that we will achieve our investment objectives. Past performance is not a guarantee of future results. Exhibit 99.1
Disclaimers The words “we,” “us,” “our” and the “Company” refer to InPoint Commercial Real Estate Income, Inc. Unless otherwise noted, all data herein is as of June 30, 2024. Cautionary note regarding forward-looking statements This presentation includes forward-looking statements, including, statements about our plans, strategies and objectives. You can generally identify forward-looking statements by our use of terms such as “may,” “will,” “expect,” “intend,” “anticipate,” “estimate,” “believe,” “continue” or other similar words. These statements include our plans and objectives for future operations, including plans and objectives relating to future growth and availability of funds, and are based on current expectations that involve numerous risks and uncertainties. Assumptions relating to these statements involve judgments with respect to, among other things, future economic, competitive and market conditions and future business decisions, all of which are difficult or impossible to accurately predict and many of which are beyond our control. Although we believe the assumptions underlying the forward-looking statements, and the forward-looking statements themselves, are reasonable, any of the assumptions could be inaccurate and, therefore, there can be no assurance that these forward-looking statements will prove to be accurate. Our actual results, performance and achievements may be materially different from that expressed or implied by these forward-looking statements. In light of the significant uncertainties, some of which are summarized in the following slide captioned “Risk Factors,” inherent in forward-looking statements, the inclusion of this information should not be regarded as a representation by us or any other person that our objectives and plans will be achieved.
You should carefully review the “Risk Factors” section of our Annual Report on Form 10-K and subsequent Quarterly Reports on Form 10-Q for a discussion of the risks and uncertainties that we believe are material to our business, operating results, prospects and financial condition. Some of the more significant risks are summarized below. Except as otherwise required by federal or state securities laws, we do not undertake to publicly update or revise any forward-looking statements, whether as a result of new information, future events or otherwise. We have paid past distributions from sources other than cash flows from operating activities, including from offering proceeds, which reduces the amount of cash we ultimately have to invest in assets, and some of our distributions have not been covered by net income; if we cannot generate sufficient cash flow from operations to fully fund distributions, some or all of our distributions may again be paid from these other sources, and if our net income does not cover our distributions, those distributions will dilute our stockholders’ equity. There is no current public trading market for our common stock, and we do not expect that such a market will ever develop. Therefore, repurchase of shares by us will likely be the only way for stockholders to dispose of their shares, and our share repurchase plan (“SRP”) is currently suspended. Even if our stockholders are able to sell their shares pursuant to our SRP in the future, or otherwise, they may not be able to recover the amount of their investment in our shares. Inland InPoint Advisor, LLC (our “Advisor”) and SPCRE InPoint Advisors, LLC (our “Sub-Advisor”) may face conflicts of interest in allocating personnel and resources between their affiliates. None of our agreements with our Advisor, our Sub-Advisor or any affiliates of our Advisor or Sub-Advisor were negotiated at arm’s-length. Our real estate portfolio is comprised of two office assets we recently acquired through foreclosure, which have generally experienced a decrease in demand and value. Office assets may experience a further decrease in demand and value and such decrease in demand could have a material adverse effect on us. Further, our ability to sell any of our office assets may be limited in the current economic climate. If we fail to continue to qualify as a real estate investment trust, or “REIT,” our operations and distributions to stockholders will be adversely affected. Risk Factors
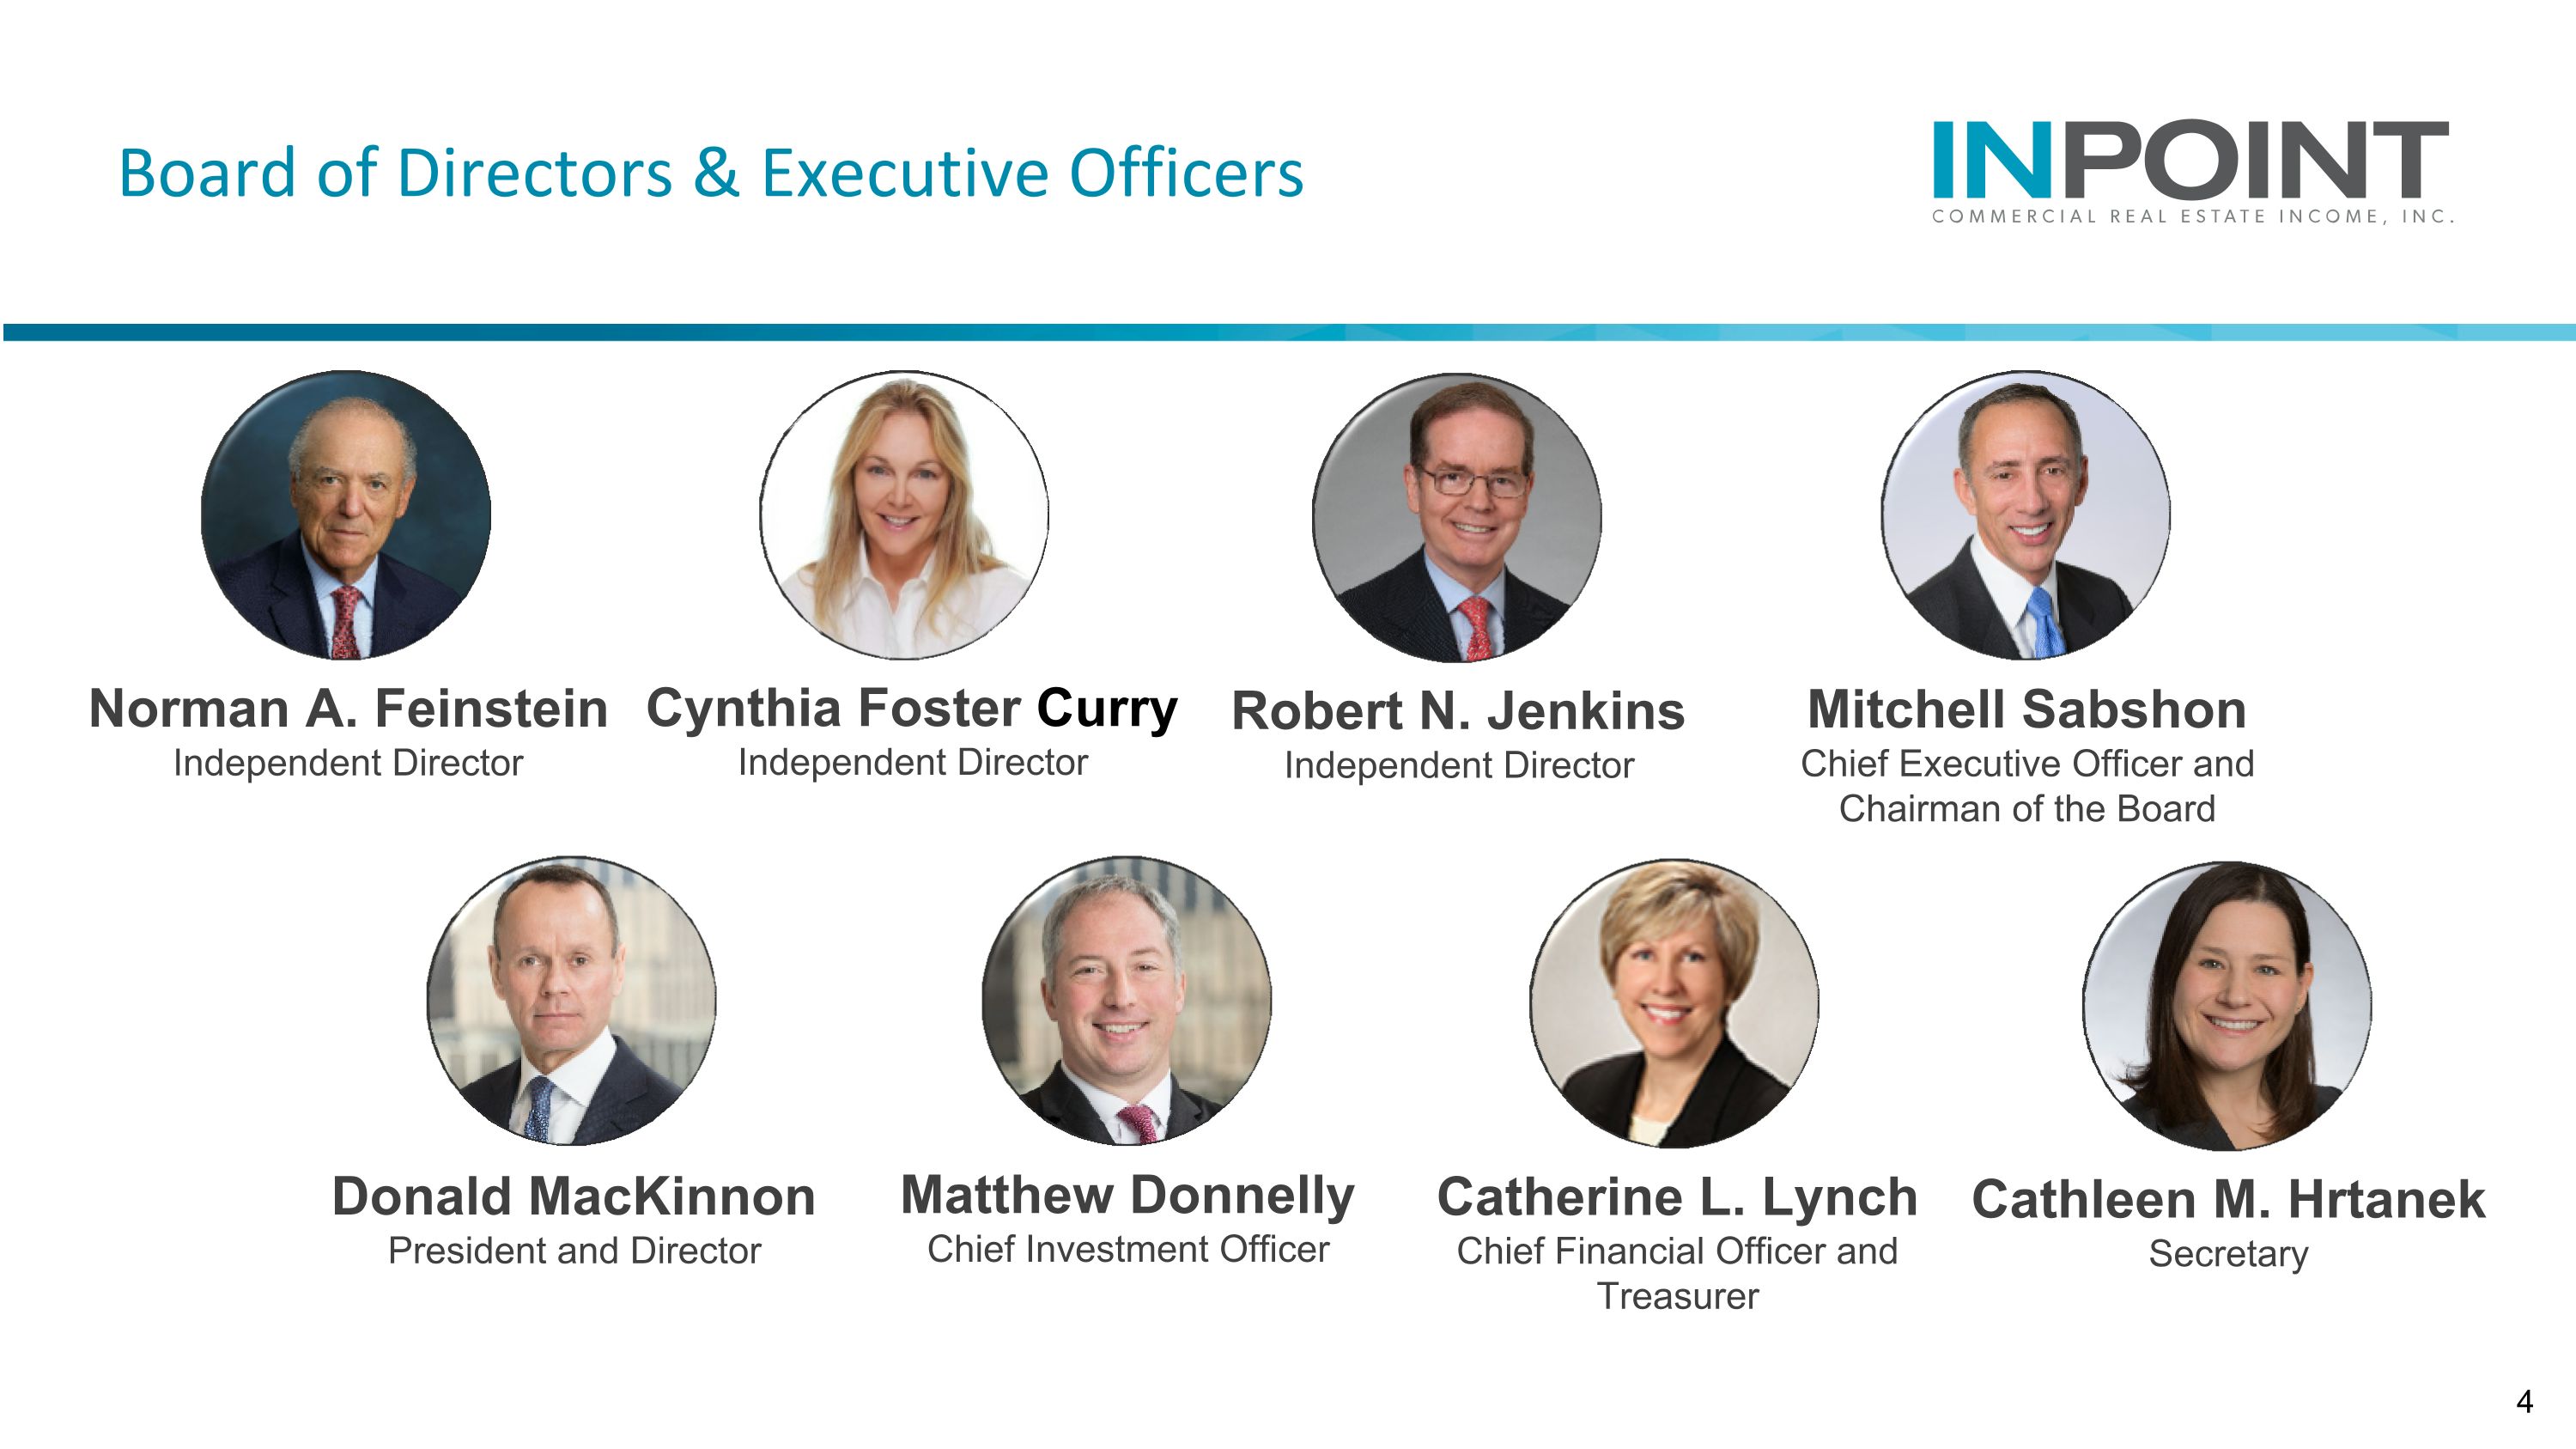
Mitchell Sabshon Chief Executive Officer and Chairman of the Board Catherine L. Lynch Chief Financial Officer and Treasurer Donald MacKinnon President and Director Board of Directors & Executive Officers Cathleen M. Hrtanek Secretary Matthew Donnelly Chief Investment Officer Cynthia Foster Curry Independent Director Norman A. Feinstein Independent Director Robert N. Jenkins Independent Director
5 Donald MacKinnon President and Director

Economic Update Federal funds rate has remained unchanged since July 2023 at a range of 5.25% to 5.50% Current U.S. annual inflation rate was 3% for 12 months ending June, compared to previous rate of 3.3%, remaining above Fed's 2% target Market speculation about potential rate cuts starting in September 2024 Current interest rate environment will continue to put pressure on �commercial real estate market Higher rates have slowed market activity, and it may take several quarters and potential rate reductions before we see significant improvements
Commercial Mortgage Market Update Industry reports suggest that there is a record $929 billion of U.S. commercial and multifamily mortgage maturities due in 2024, $570 billion due in 2025, and $460 billion in 2026 Certain investors will be impacted by mortgage loan refinancing challenges under current market conditions Current market conditions will not likely be problematic for new investors Those with existing CRE investments with near-term maturities may experience difficulty repaying or refinancing, resulting in banks reducing CRE lending to brace for loans potentially not being repaid
Portfolio Highlights Our overall loan credit quality continues to be good during this difficult CRE market. During 2024, we had three loans pay-off with an outstanding principal of $37.1 million. In addition, we had $6.4 million in paydowns. This was partially offset by $5.4 million in advances on our existing loans. 30 out of our 33 loans were current on contractual interest payments and just 3 loans on nonaccrual status as of June 30, 2024. We extended 7 loans during 2024 and continue to work with our existing borrowers generally receiving additional capital support for loans that we have extended.
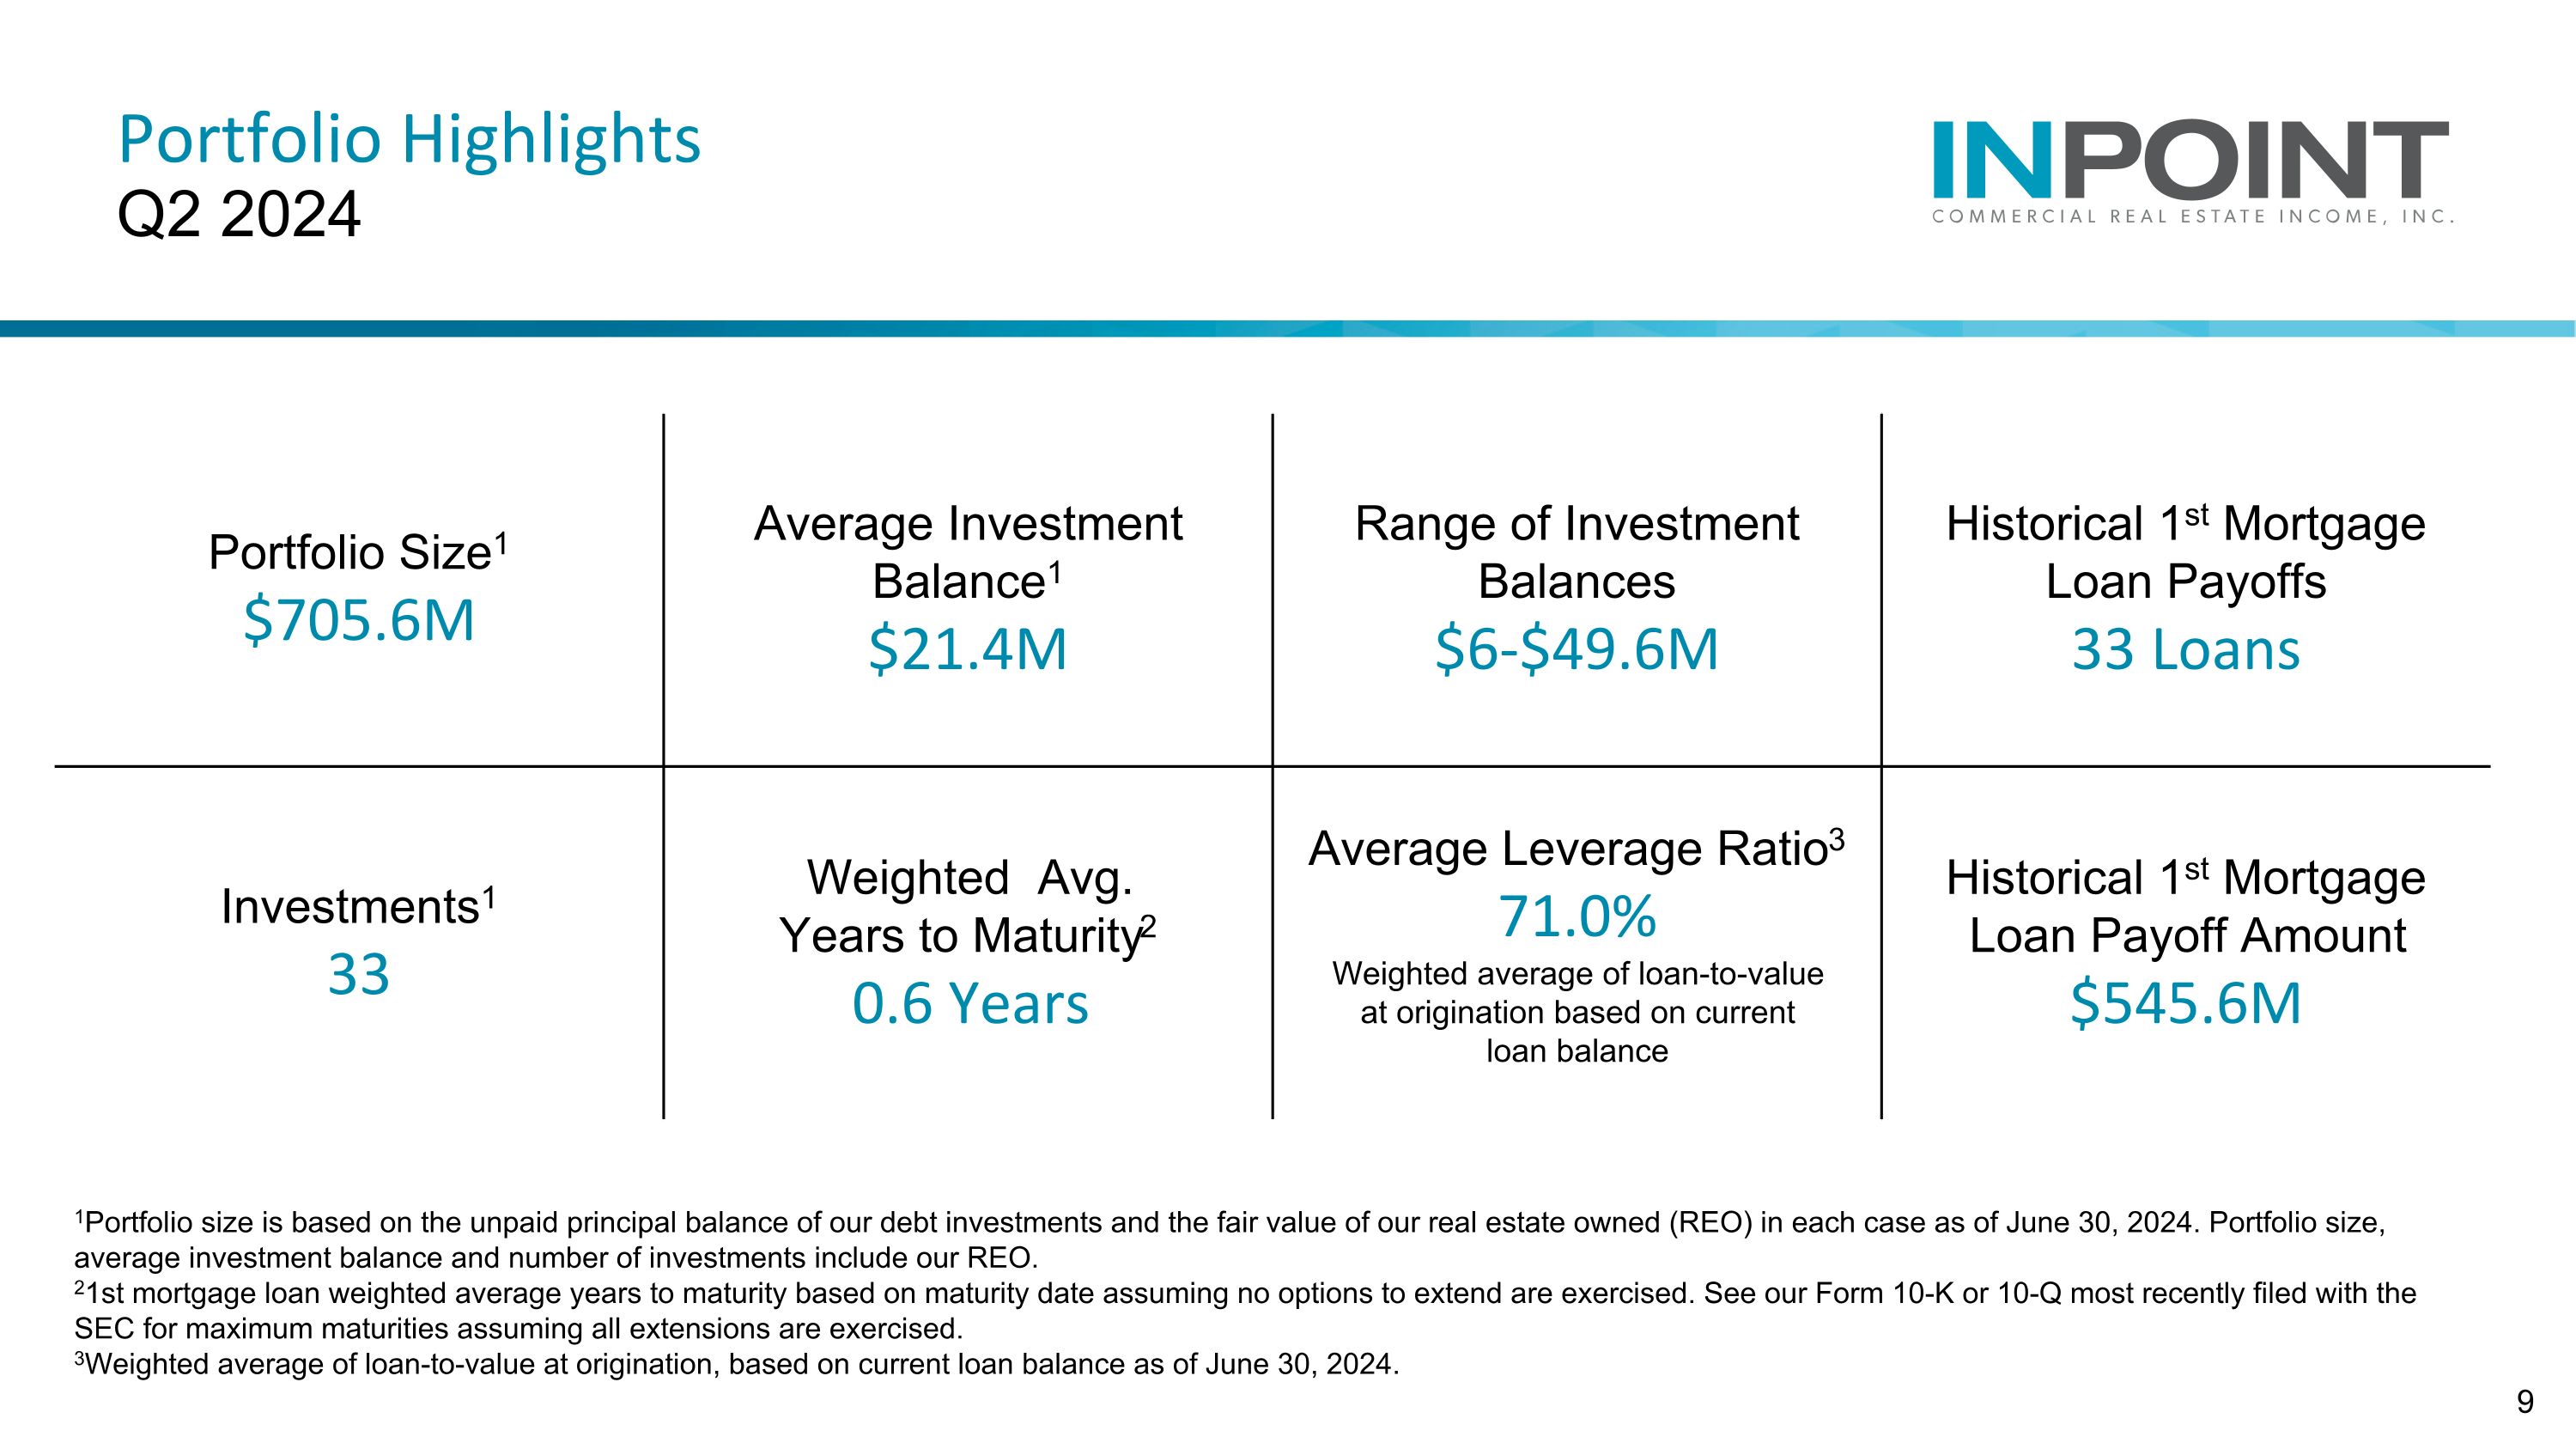
Portfolio Highlights�Q2 2024 1Portfolio size is based on the unpaid principal balance of our debt investments and the fair value of our real estate owned (REO) in each case as of June 30, 2024. Portfolio size, average investment balance and number of investments include our REO. 21st mortgage loan weighted average years to maturity based on maturity date assuming no options to extend are exercised. See our Form 10-K or 10-Q most recently filed with the SEC for maximum maturities assuming all extensions are exercised. 3Weighted average of loan-to-value at origination, based on current loan balance as of June 30, 2024. Portfolio Size1 $705.6M Average Investment Balance1�$21.4M Range of Investment Balances�$6-$49.6M Historical 1st Mortgage �Loan Payoffs 33 Loans Investments1�33 Weighted Avg. �Years to Maturity2�0.6 Years Average Leverage Ratio3�71.0%�Weighted average of loan-to-value �at origination based on current �loan balance Historical 1st Mortgage Loan Payoff Amount�$545.6M
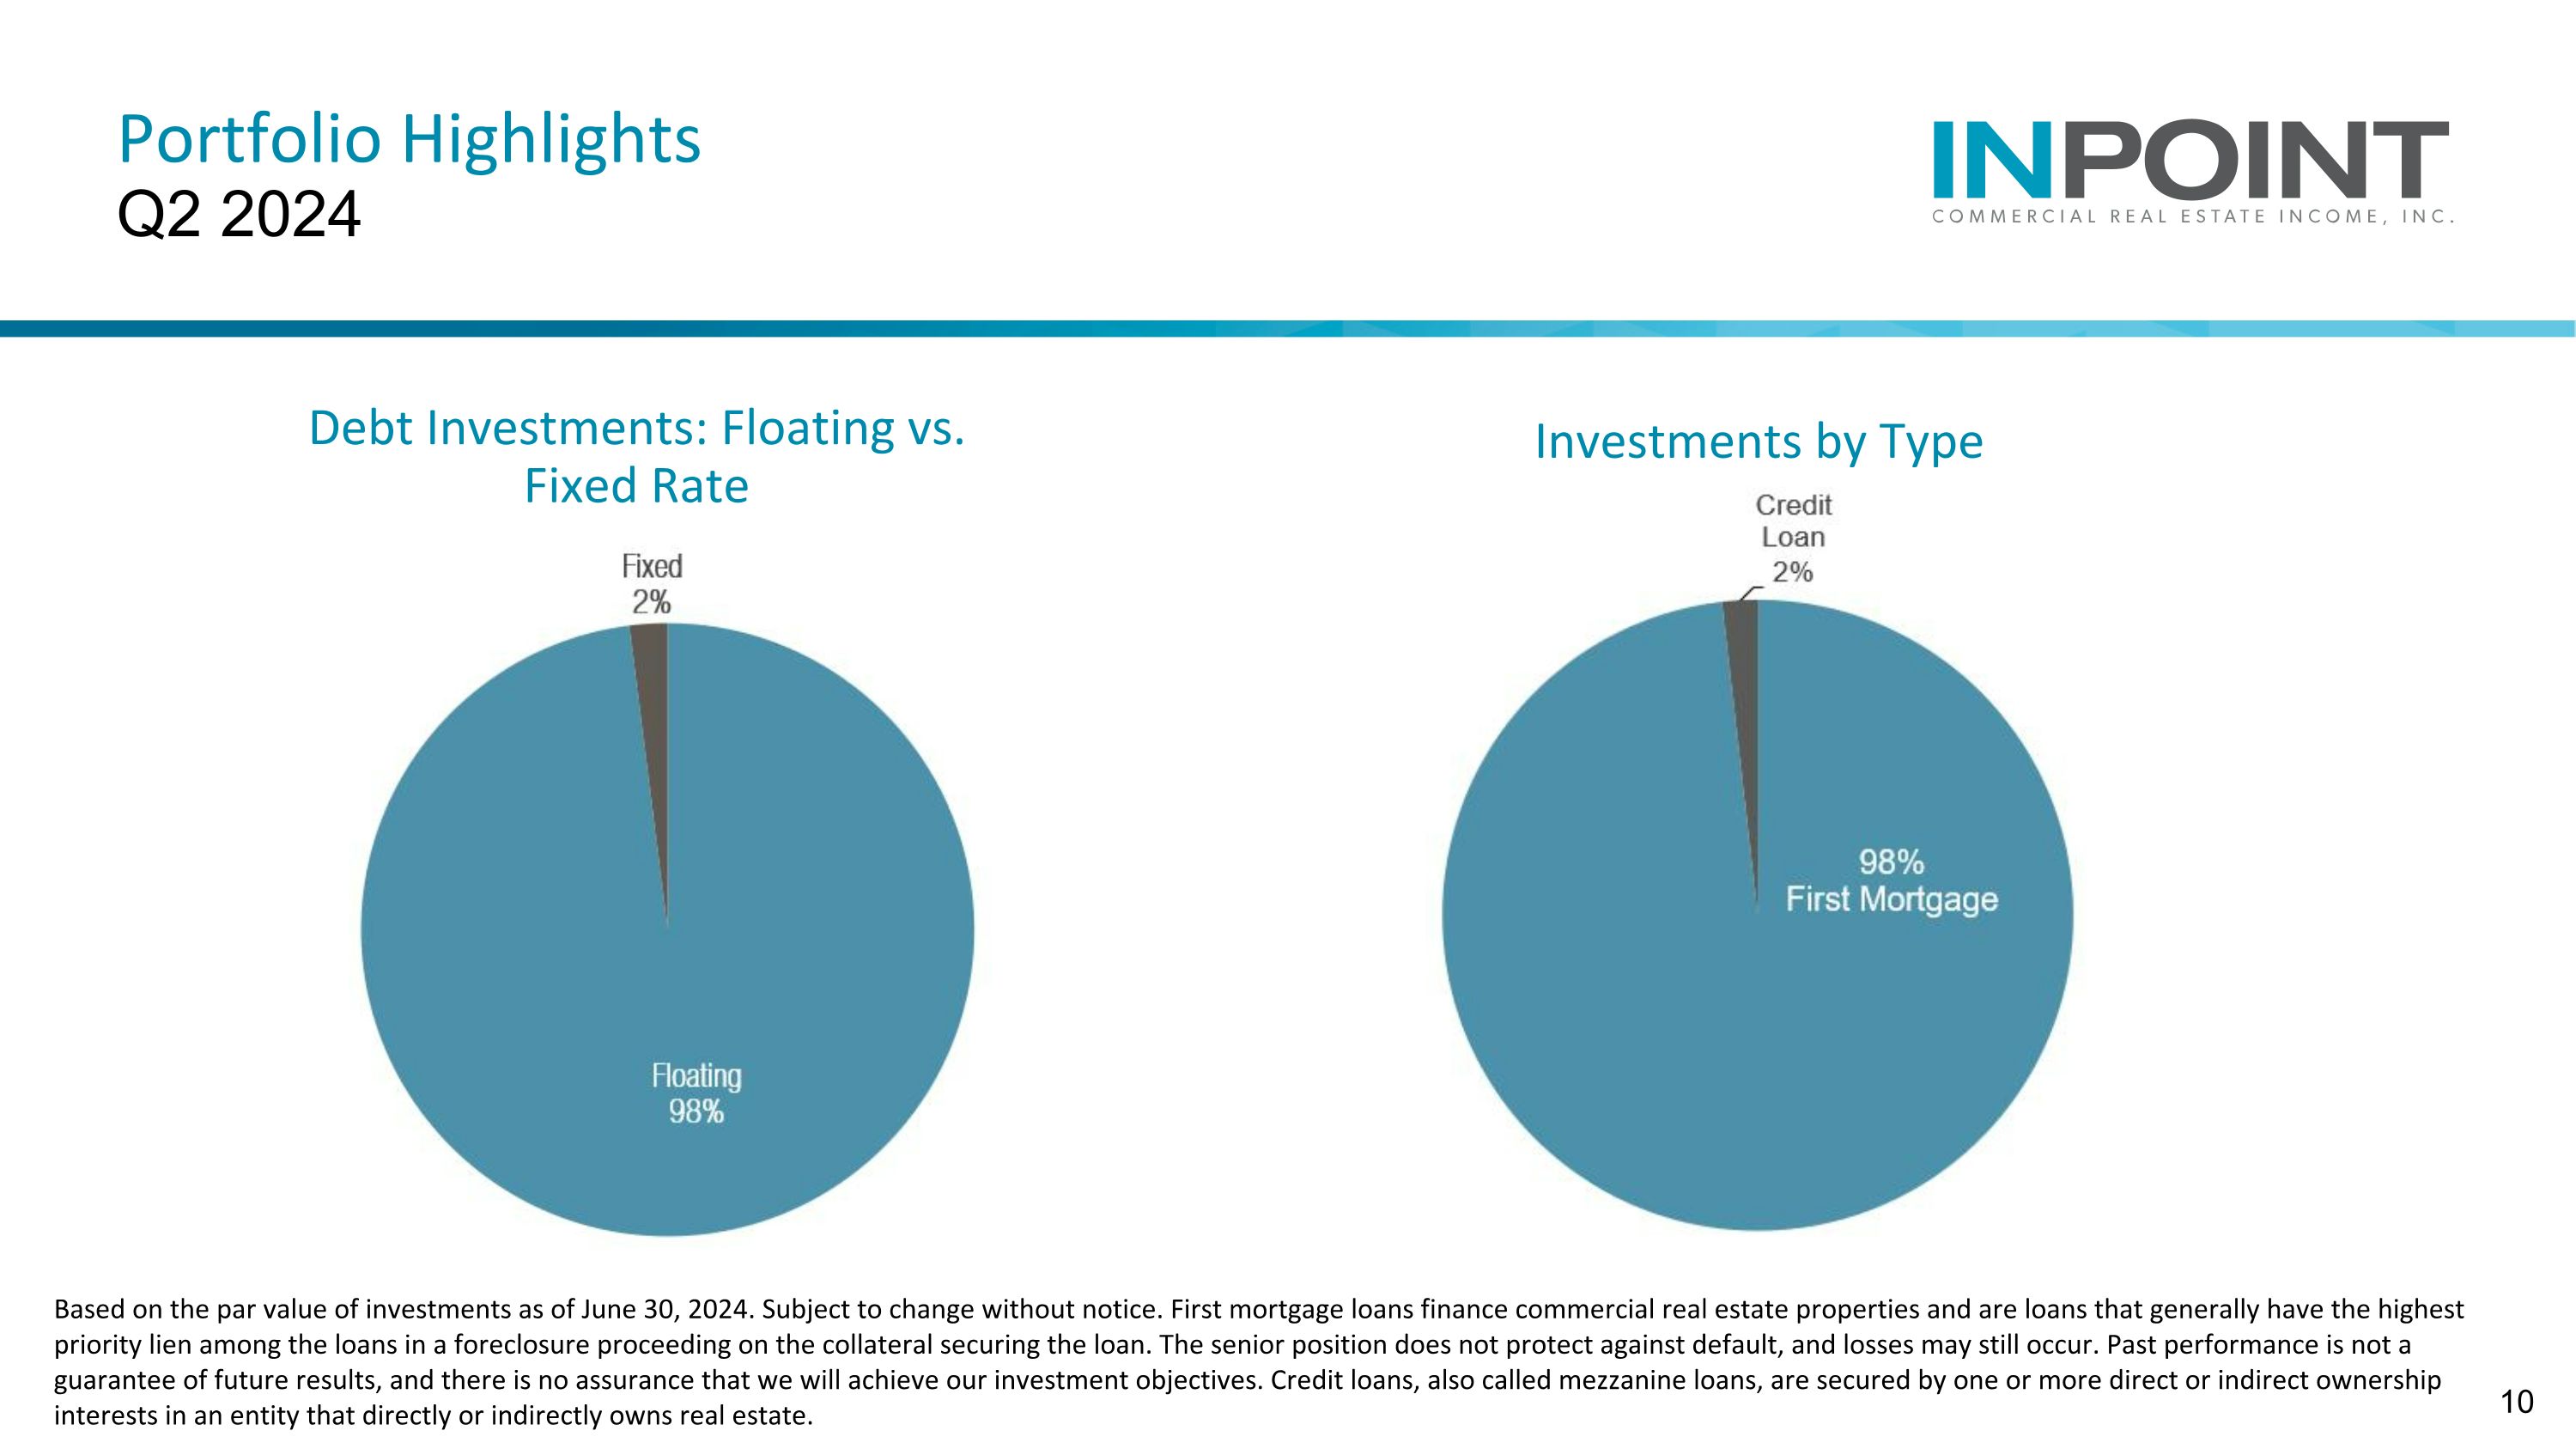
1st Mortgage 1st Mortgage Loans Based on the par value of investments as of June 30, 2024. Subject to change without notice. First mortgage loans finance commercial real estate properties and are loans that generally have the highest priority lien among the loans in a foreclosure proceeding on the collateral securing the loan. The senior position does not protect against default, and losses may still occur. Past performance is not a guarantee of future results, and there is no assurance that we will achieve our investment objectives. Credit loans, also called mezzanine loans, are secured by one or more direct or indirect ownership interests in an entity that directly or indirectly owns real estate. Debt Investments: Floating vs. Fixed Rate Investments by Type Portfolio Highlights�Q2 2024
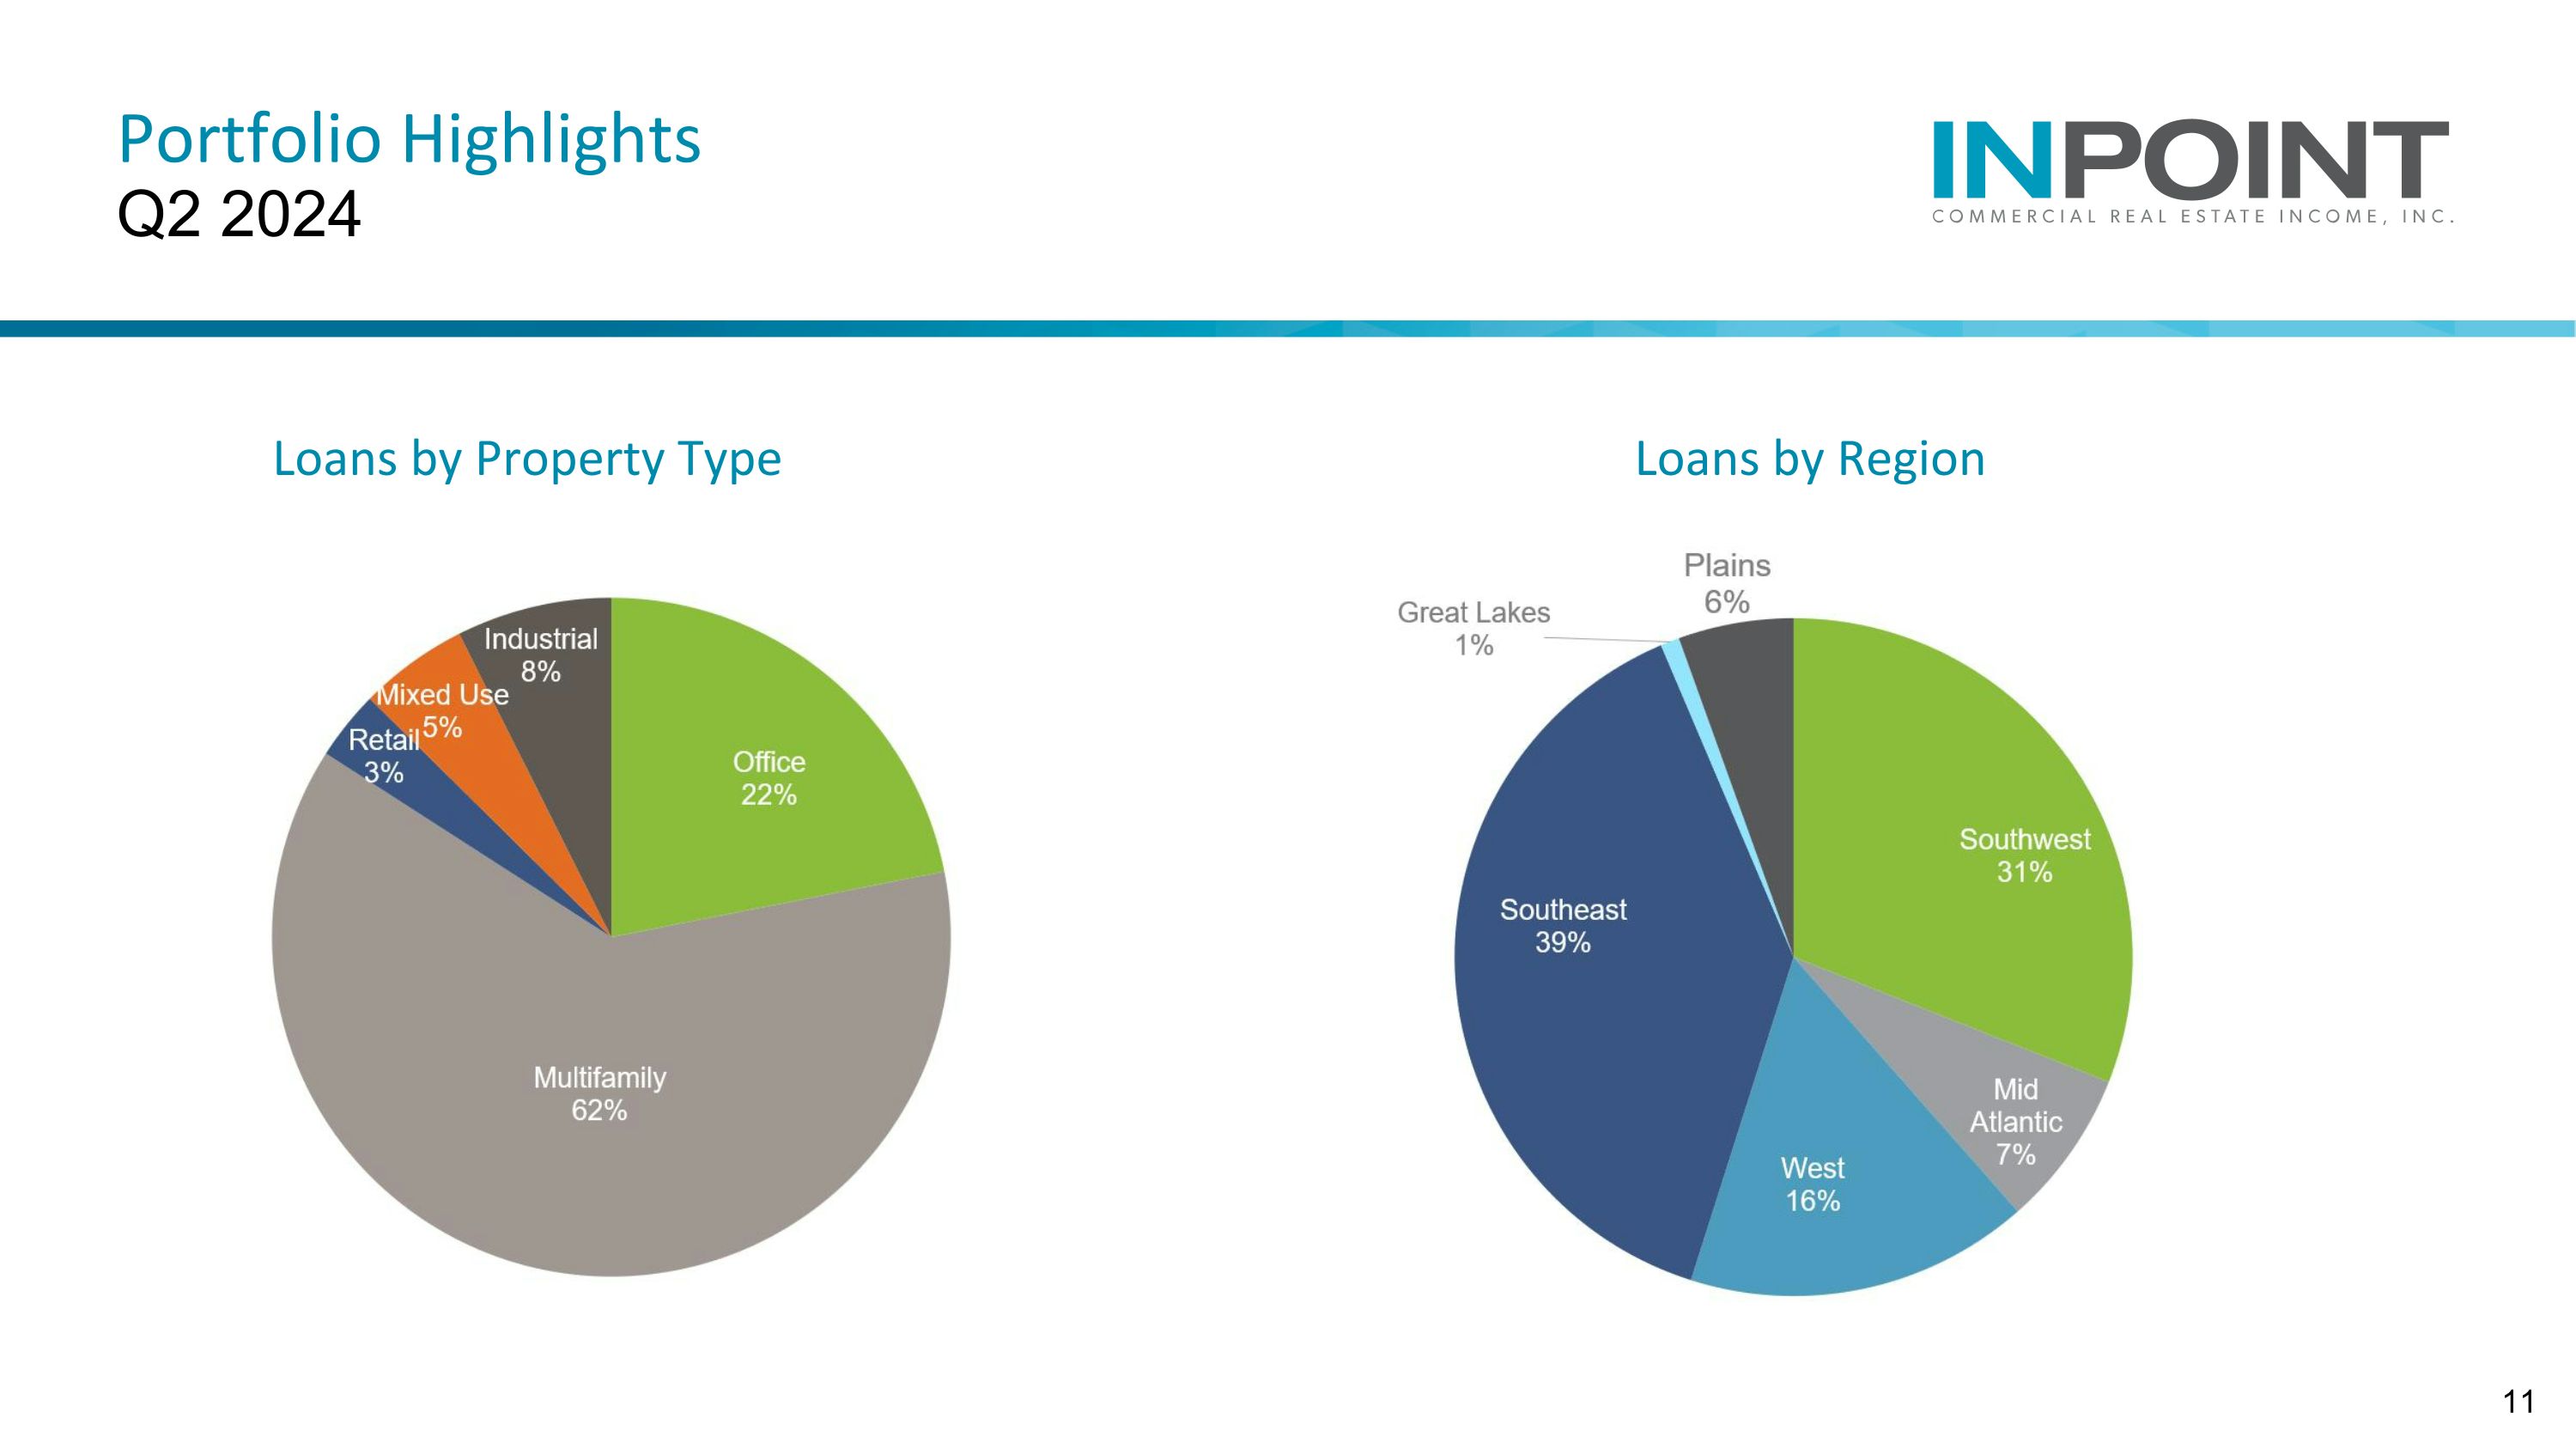
Floating Rate Loans by Property Type Loans by Region Portfolio Highlights�Q2 2024
12 Catherine L. Lynch Chief Financial Officer and Treasurer
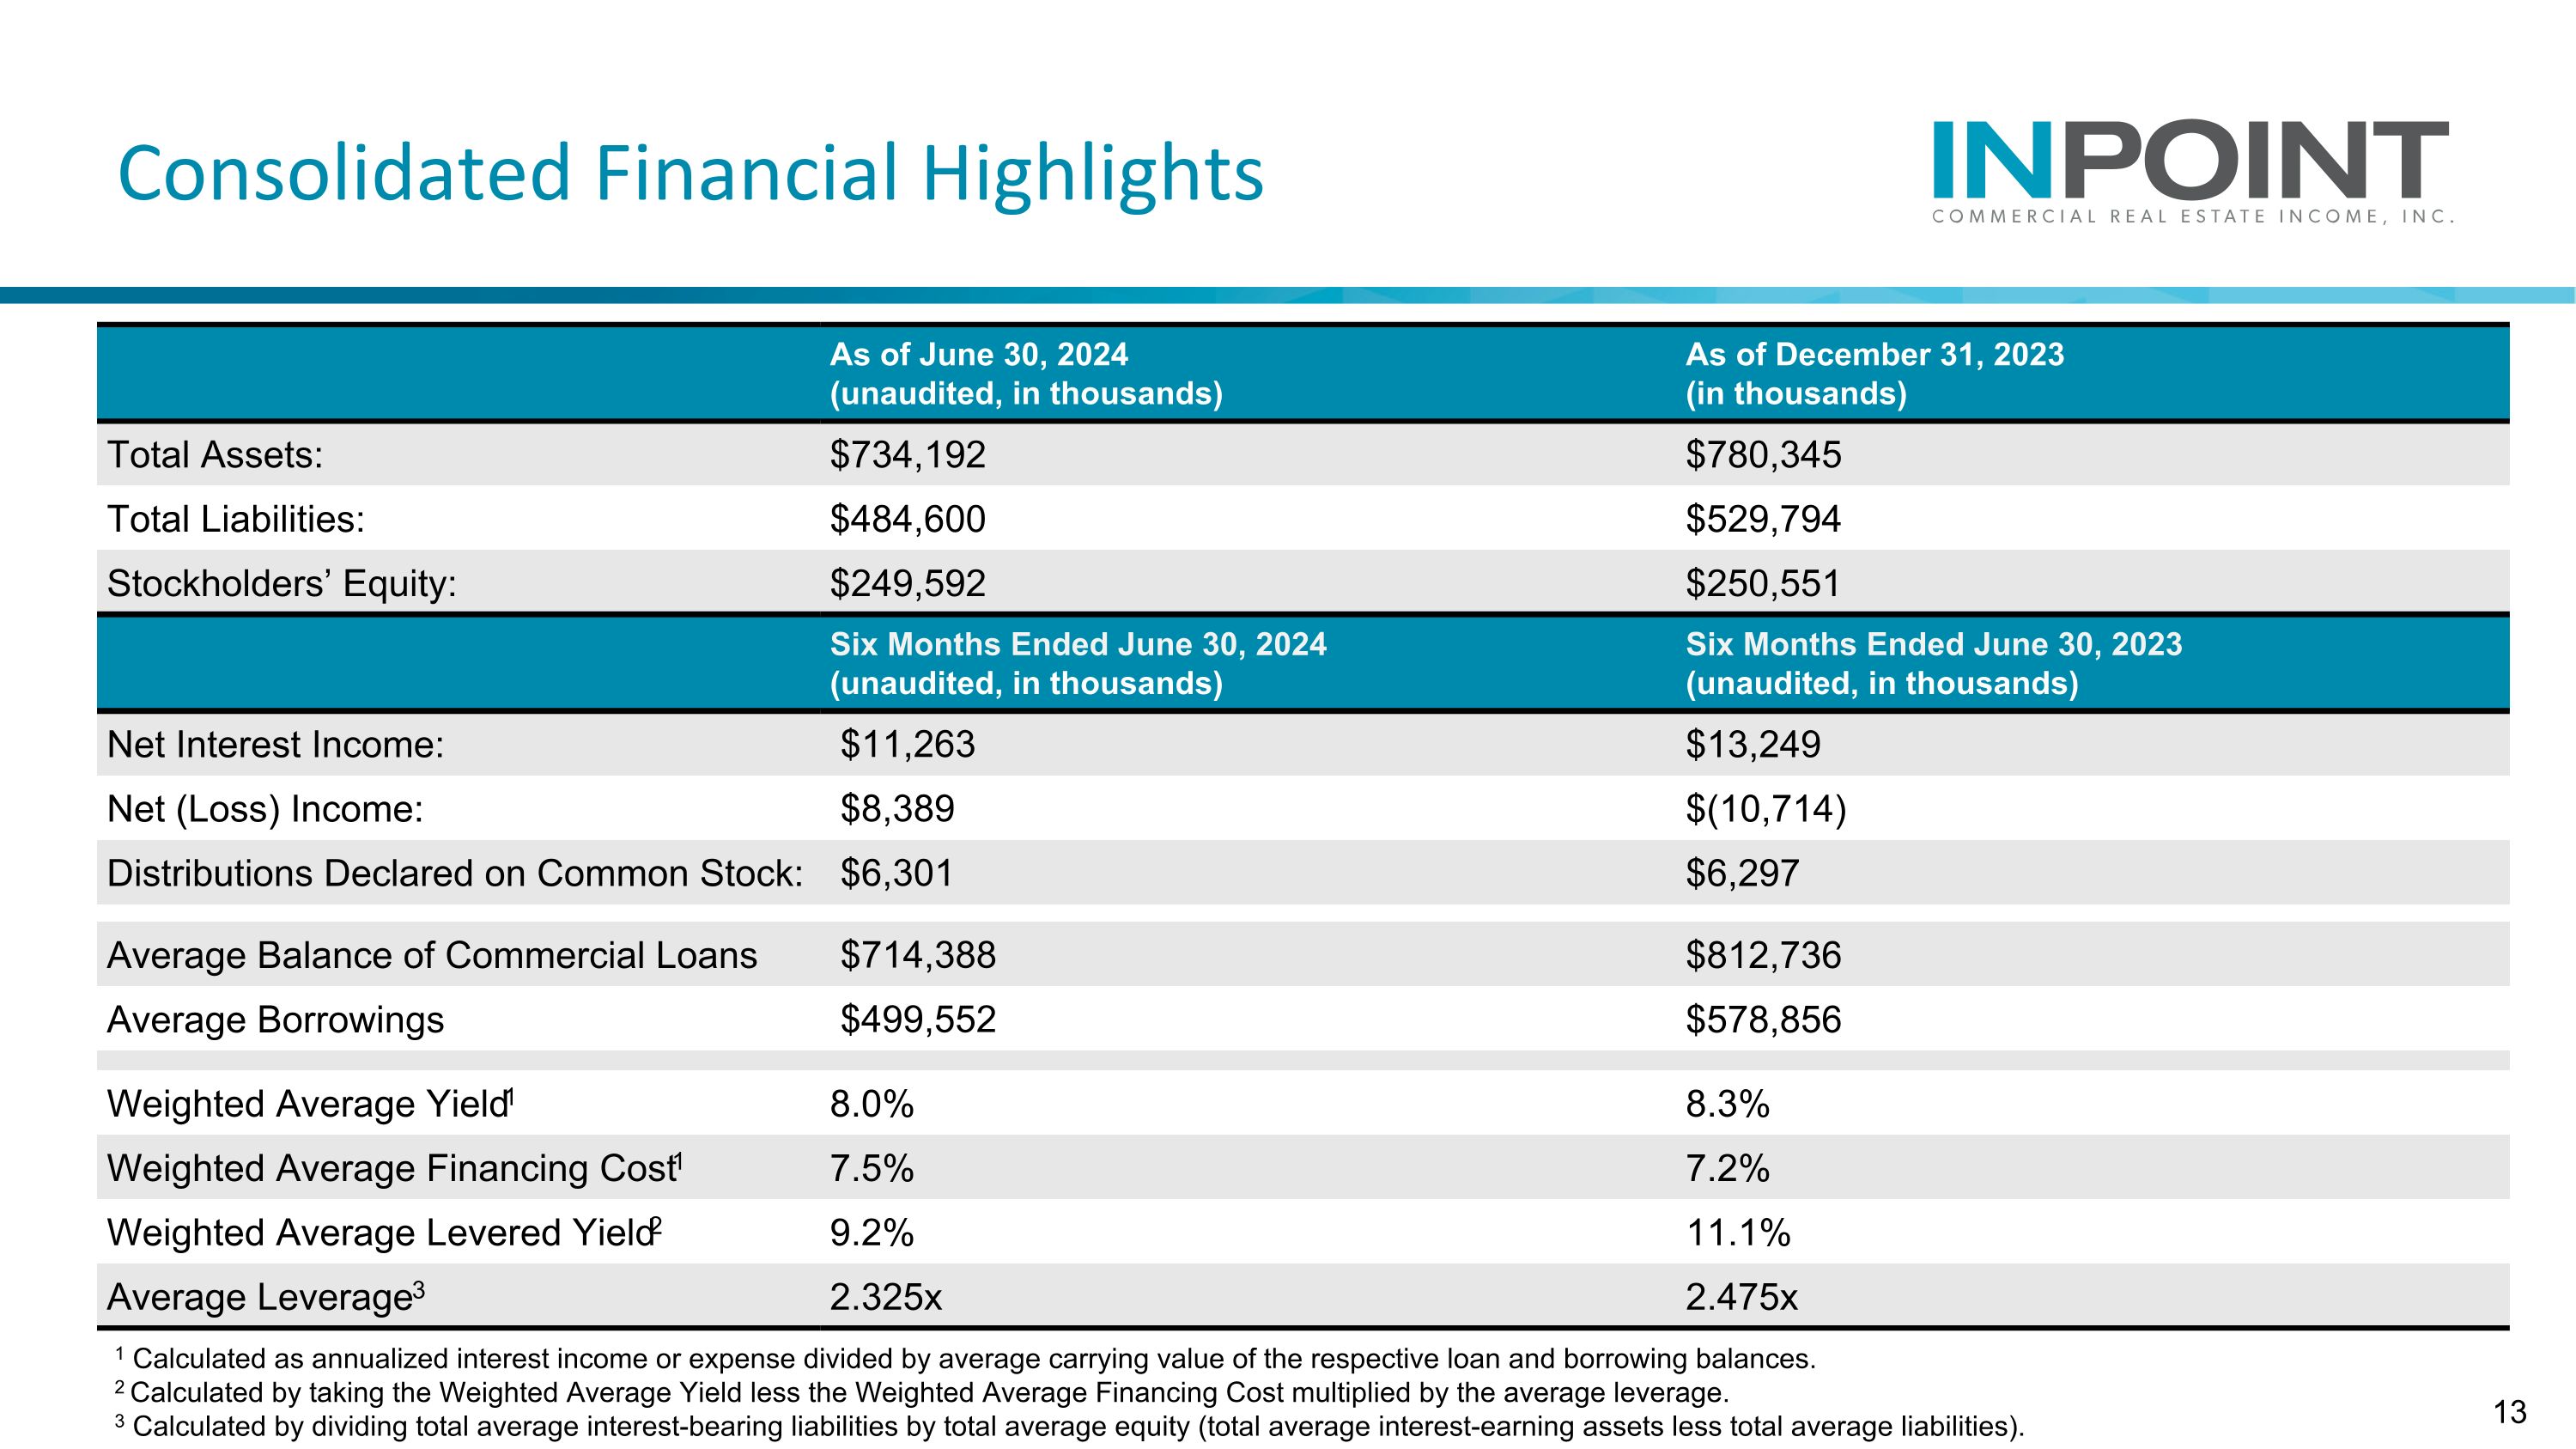
Consolidated Financial Highlights Multifamily Office As of June 30, 2024 �(unaudited, in thousands) As of December 31, 2023 �(in thousands) Total Assets: $734,192 $780,345 Total Liabilities: $484,600 $529,794 Stockholders’ Equity: $249,592 $250,551 Six Months Ended June 30, 2024 �(unaudited, in thousands) Six Months Ended June 30, 2023 �(unaudited, in thousands) Net Interest Income: $11,263 $13,249 Net (Loss) Income: $8,389 $(10,714) Distributions Declared on Common Stock: $6,301 $6,297 Average Balance of Commercial Loans $714,388 $812,736 Average Borrowings $499,552 $578,856 Weighted Average Yield1 8.0% 8.3% Weighted Average Financing Cost1 7.5% 7.2% Weighted Average Levered Yield2 9.2% 11.1% Average Leverage3 2.325x 2.475x 1 Calculated as annualized interest income or expense divided by average carrying value of the respective loan and borrowing balances. 2 Calculated by taking the Weighted Average Yield less the Weighted Average Financing Cost multiplied by the average leverage. 3 Calculated by dividing total average interest-bearing liabilities by total average equity (total average interest-earning assets less total average liabilities).
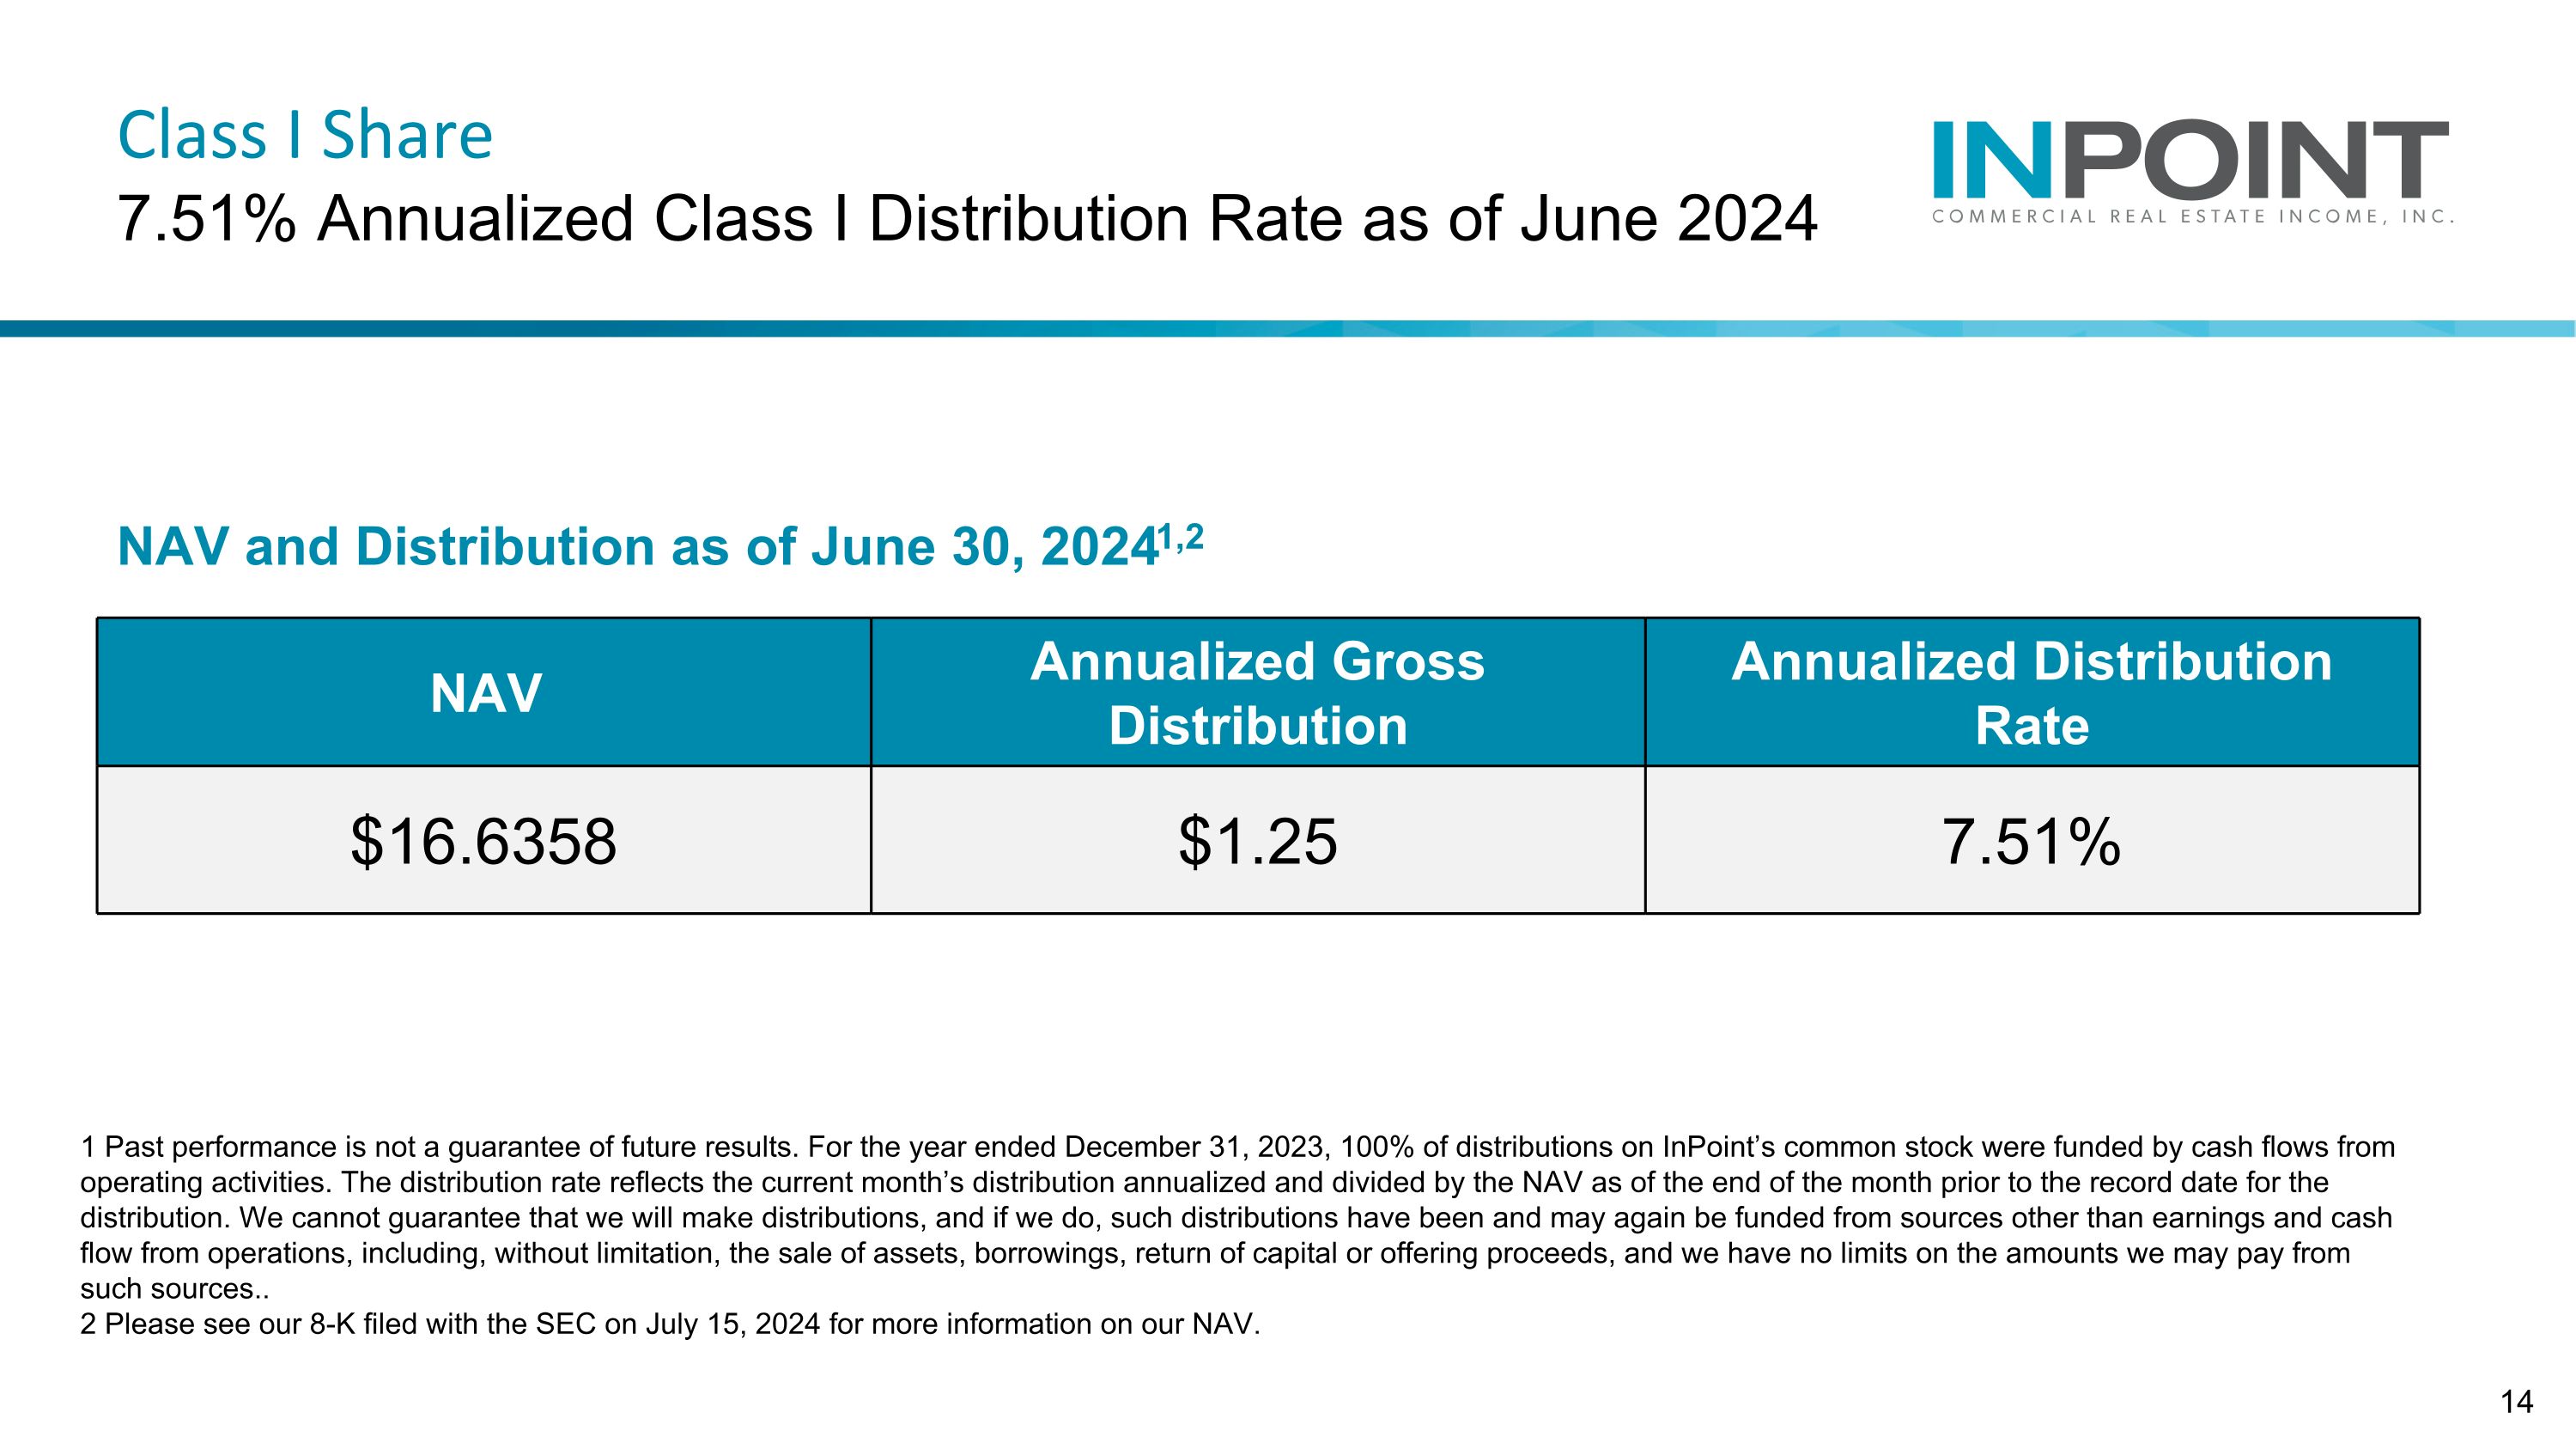
Class I Share 7.51% Annualized Class I Distribution Rate as of June 2024 1 Past performance is not a guarantee of future results. For the year ended December 31, 2023, 100% of distributions on InPoint’s common stock were funded by cash flows from operating activities. The distribution rate reflects the current month’s distribution annualized and divided by the NAV as of the end of the month prior to the record date for the distribution. We cannot guarantee that we will make distributions, and if we do, such distributions have been and may again be funded from sources other than earnings and cash flow from operations, including, without limitation, the sale of assets, borrowings, return of capital or offering proceeds, and we have no limits on the amounts we may pay from such sources.. 2 Please see our 8-K filed with the SEC on July 15, 2024 for more information on our NAV. NAV and Distribution as of June 30, 20241,2 NAV Annualized Gross Distribution Annualized Distribution �Rate $16.6358 $1.25 7.51%


