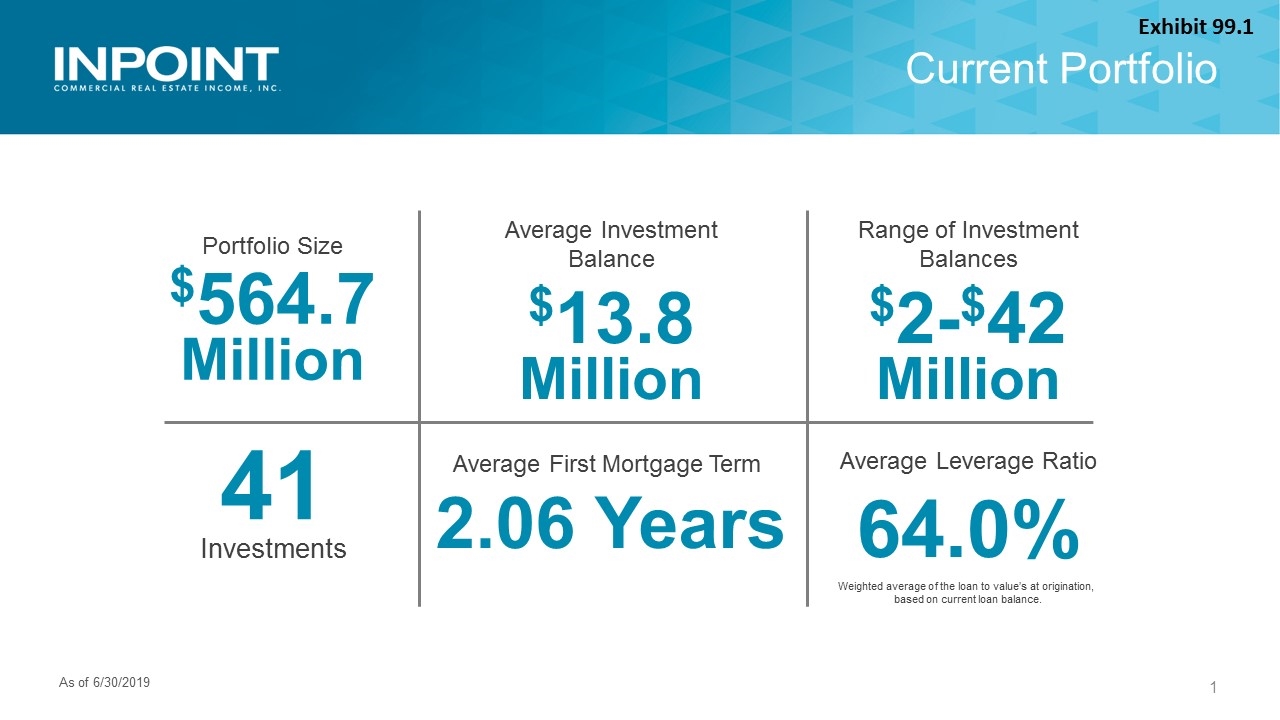
Current Portfolio Portfolio Size $564.7 Million Average Leverage Ratio 64.0% Range of Investment Balances $2-$42 Million Average First Mortgage Term 2.06 Years 41 Investments Average Investment Balance $13.8 Million Weighted average of the loan to value’s at origination, based on current loan balance. As of 6/30/2019 Exhibit 99.1
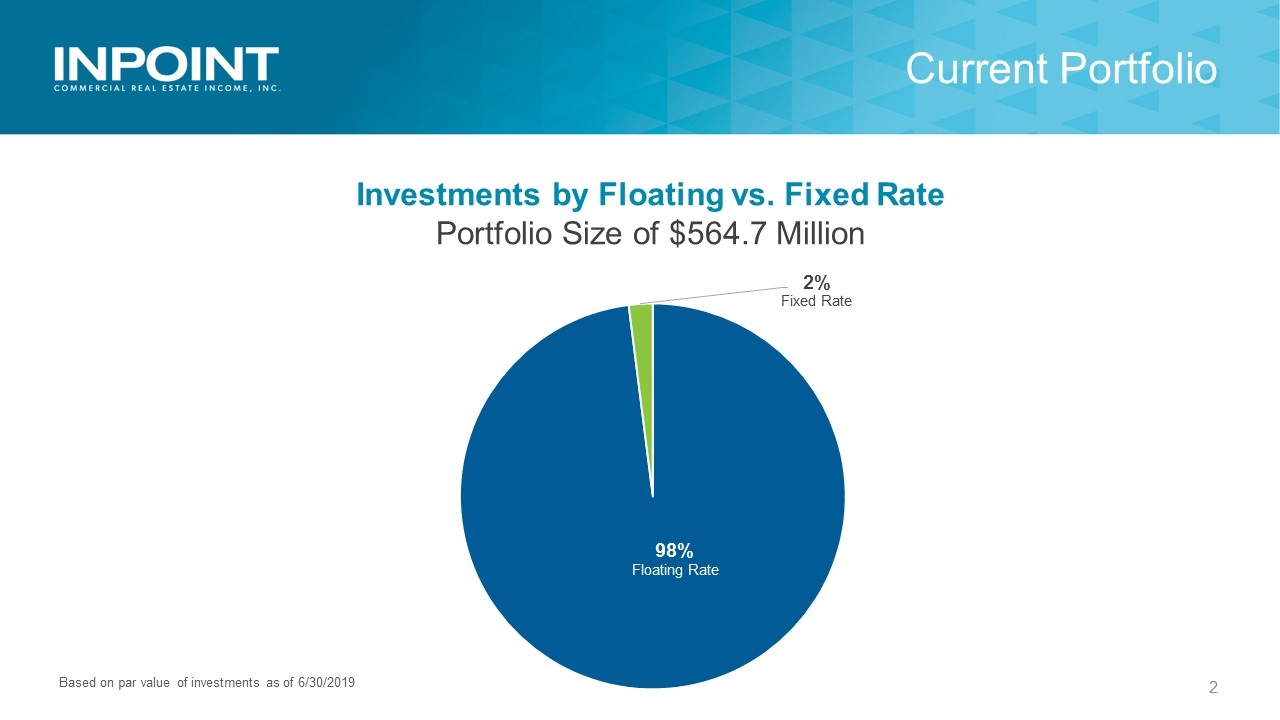
Current Portfolio Investments by Floating vs. Fixed Rate Portfolio Size of $564.7 Million Fixed Rate Floating Rate Based on par value of investments as of 6/30/2019
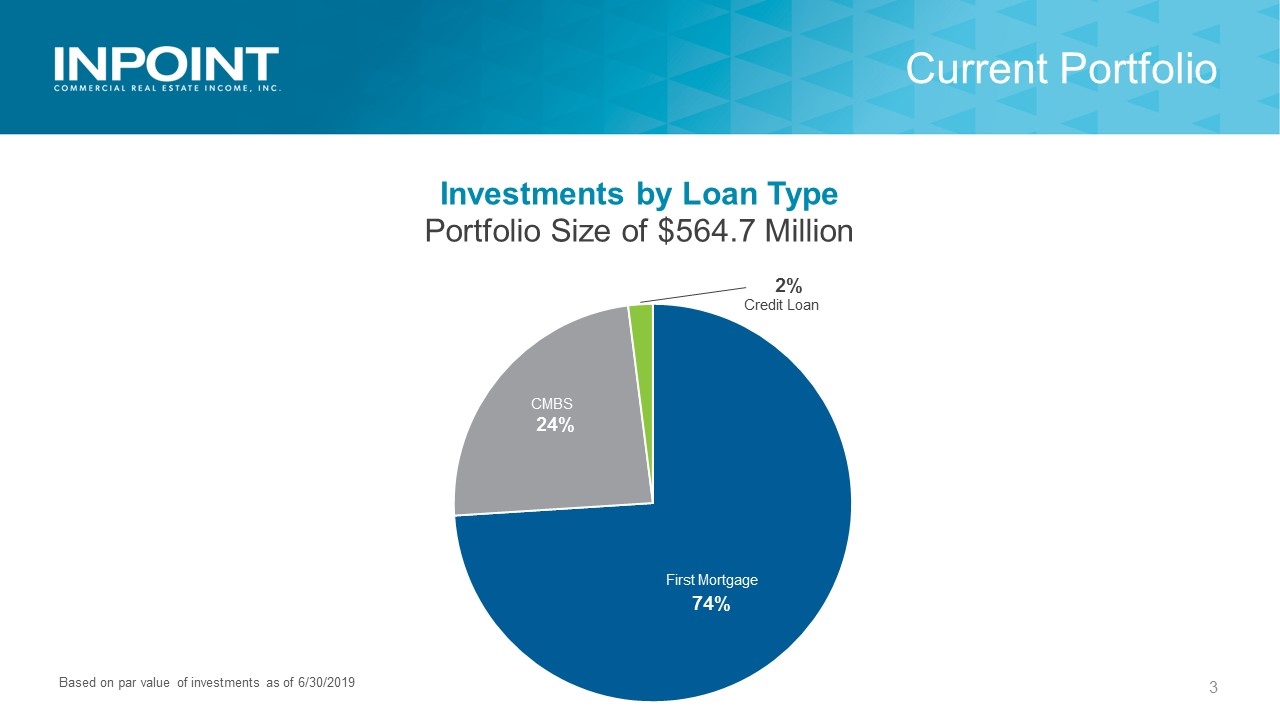
Current Portfolio Investments by Loan Type Portfolio Size of $564.7 Million CMBS First Mortgage Credit Loan Based on par value of investments as of 6/30/2019
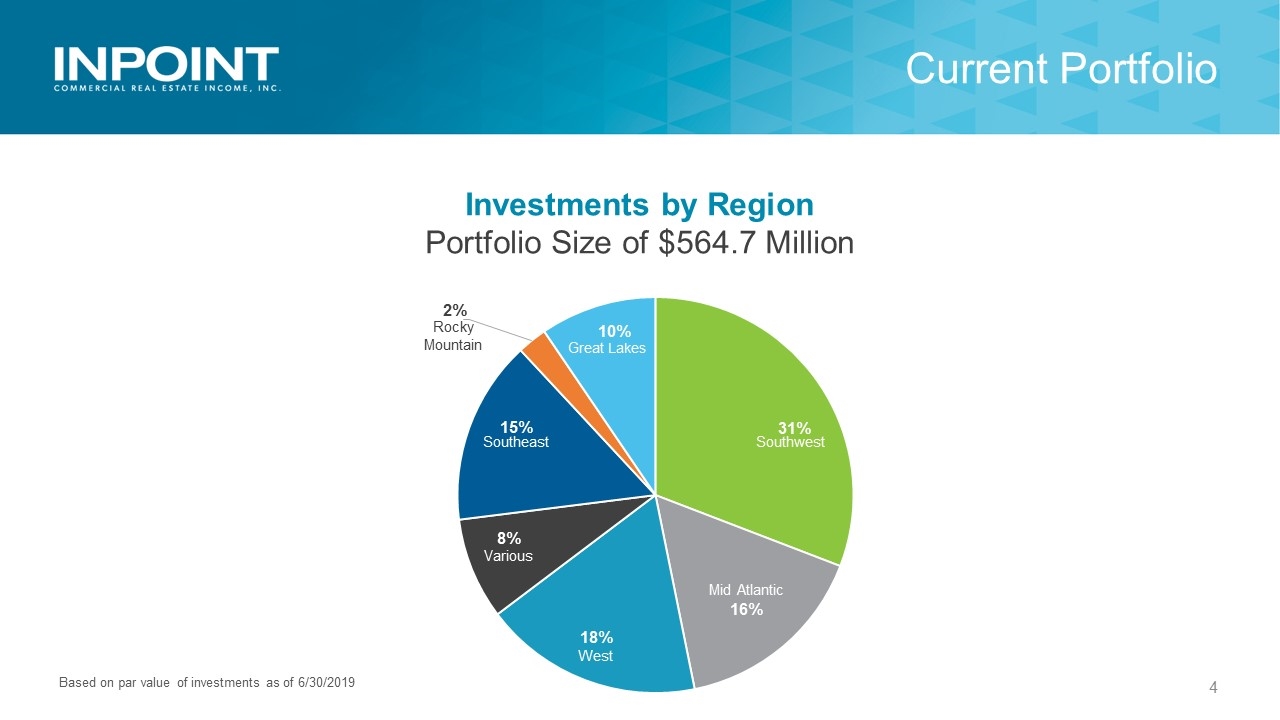
Current Portfolio Investments by Region Portfolio Size of $564.7 Million Southwest West Southeast Mid Atlantic Various Rocky Mountain Based on par value of investments as of 6/30/2019
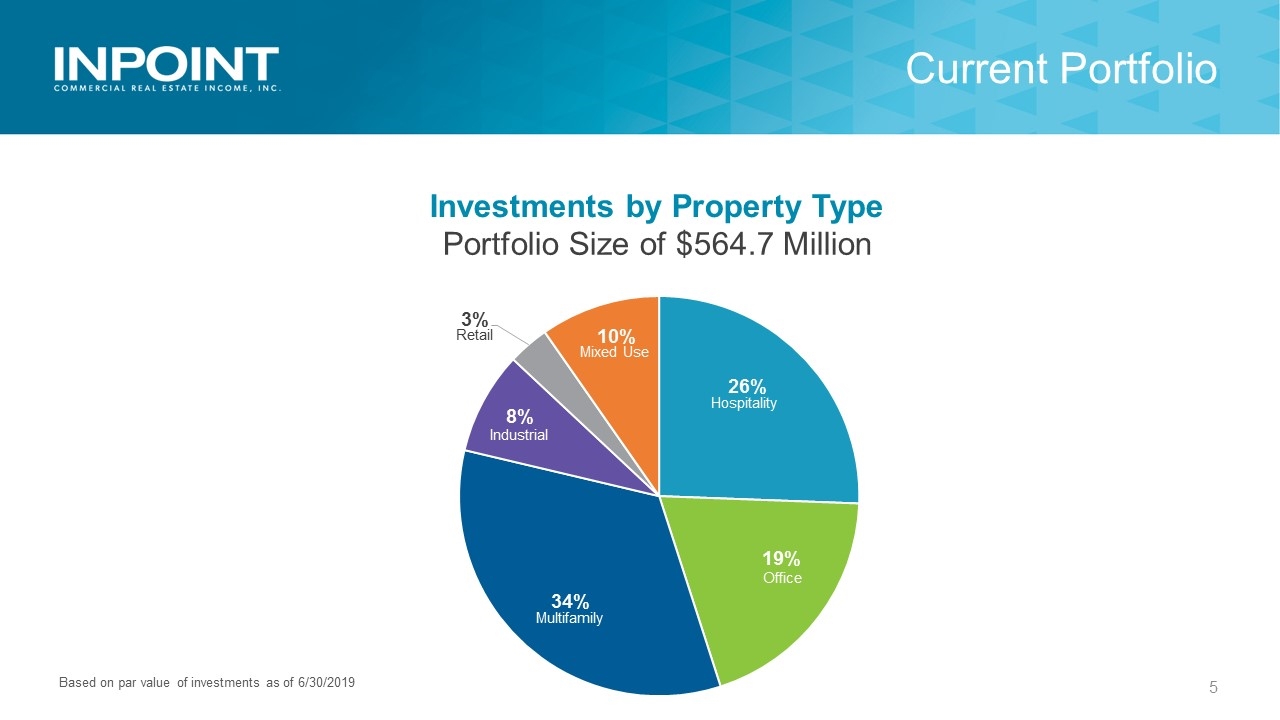
Investments by Property Type Current Portfolio Portfolio Size of $564.7 Million Multifamily Hospitality Office Retail Mixed Use Based on par value of investments as of 6/30/2019
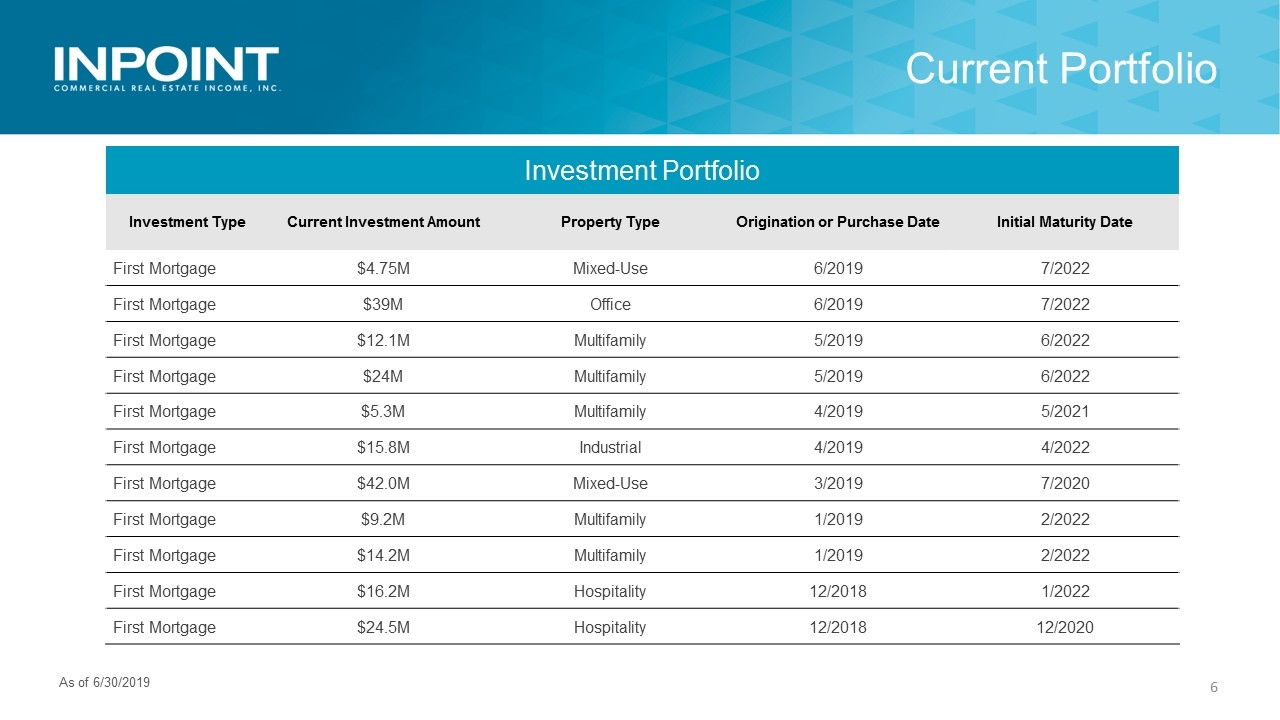
Current Portfolio Investment Portfolio Investment Type Current Investment Amount Property Type Origination or Purchase Date Initial Maturity Date First Mortgage $4.75M Mixed-Use 6/2019 7/2022 First Mortgage $39M Office 6/2019 7/2022 First Mortgage $12.1M Multifamily 5/2019 6/2022 First Mortgage $24M Multifamily 5/2019 6/2022 First Mortgage $5.3M Multifamily 4/2019 5/2021 First Mortgage $15.8M Industrial 4/2019 4/2022 First Mortgage $42.0M Mixed-Use 3/2019 7/2020 First Mortgage $9.2M Multifamily 1/2019 2/2022 First Mortgage $14.2M Multifamily 1/2019 2/2022 First Mortgage $16.2M Hospitality 12/2018 1/2022 First Mortgage $24.5M Hospitality 12/2018 12/2020 As of 6/30/2019
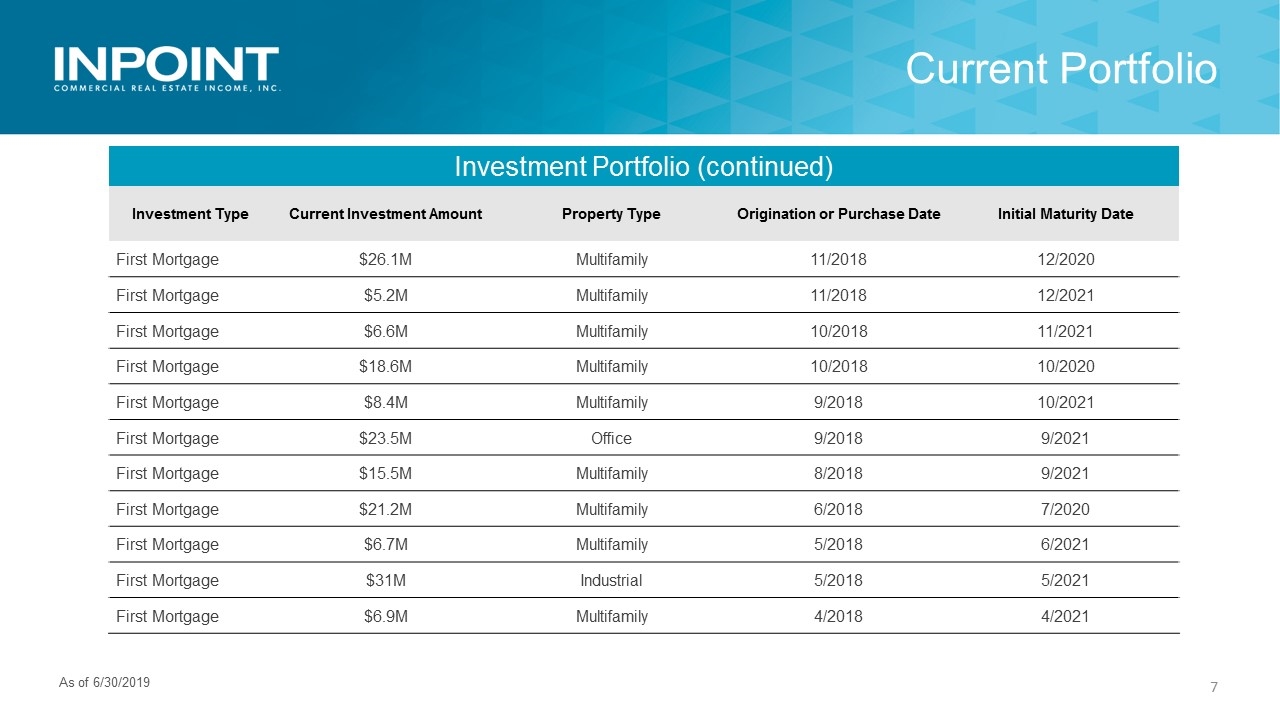
Current Portfolio Investment Portfolio (continued) Investment Type Current Investment Amount Property Type Origination or Purchase Date Initial Maturity Date First Mortgage $26.1M Multifamily 11/2018 12/2020 First Mortgage $5.2M Multifamily 11/2018 12/2021 First Mortgage $6.6M Multifamily 10/2018 11/2021 First Mortgage $18.6M Multifamily 10/2018 10/2020 First Mortgage $8.4M Multifamily 9/2018 10/2021 First Mortgage $23.5M Office 9/2018 9/2021 First Mortgage $15.5M Multifamily 8/2018 9/2021 First Mortgage $21.2M Multifamily 6/2018 7/2020 First Mortgage $6.7M Multifamily 5/2018 6/2021 First Mortgage $31M Industrial 5/2018 5/2021 First Mortgage $6.9M Multifamily 4/2018 4/2021 As of 6/30/2019
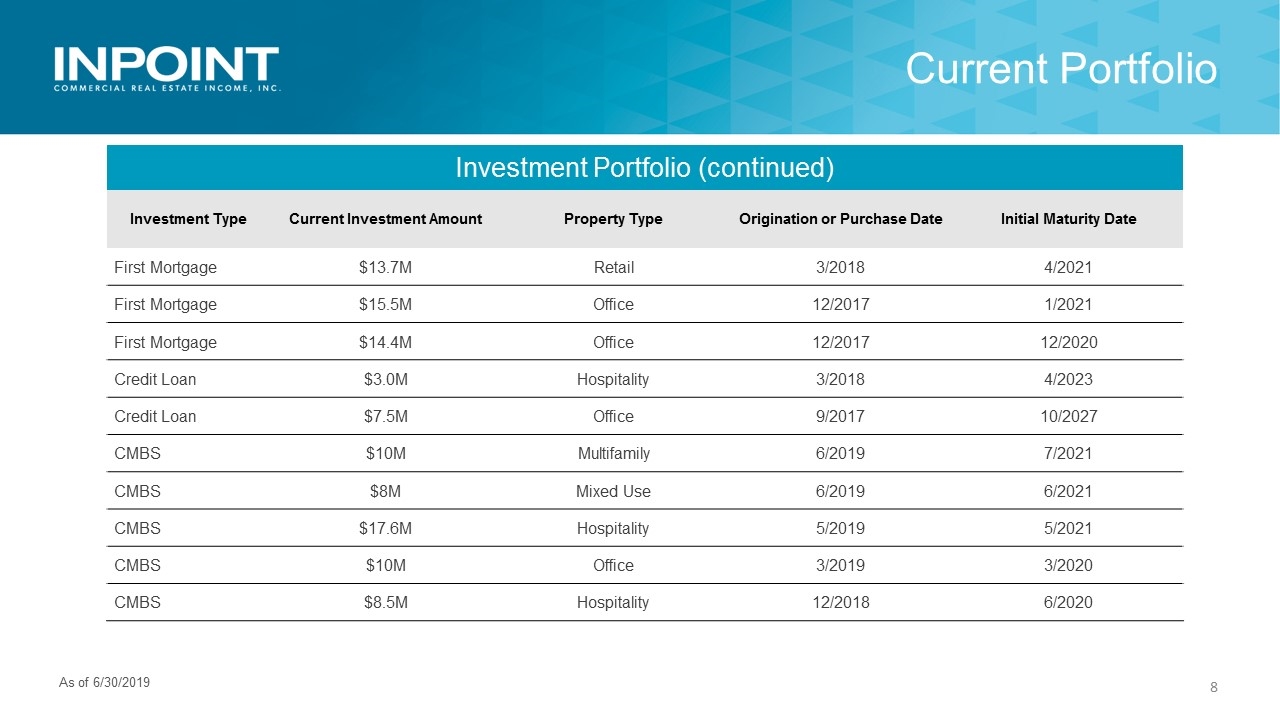
Current Portfolio Investment Portfolio (continued) Investment Type Current Investment Amount Property Type Origination or Purchase Date Initial Maturity Date First Mortgage $13.7M Retail 3/2018 4/2021 First Mortgage $15.5M Office 12/2017 1/2021 First Mortgage $14.4M Office 12/2017 12/2020 Credit Loan $3.0M Hospitality 3/2018 4/2023 Credit Loan $7.5M Office 9/2017 10/2027 CMBS $10M Multifamily 6/2019 7/2021 CMBS $8M Mixed Use 6/2019 6/2021 CMBS $17.6M Hospitality 5/2019 5/2021 CMBS $10M Office 3/2019 3/2020 CMBS $8.5M Hospitality 12/2018 6/2020 As of 6/30/2019
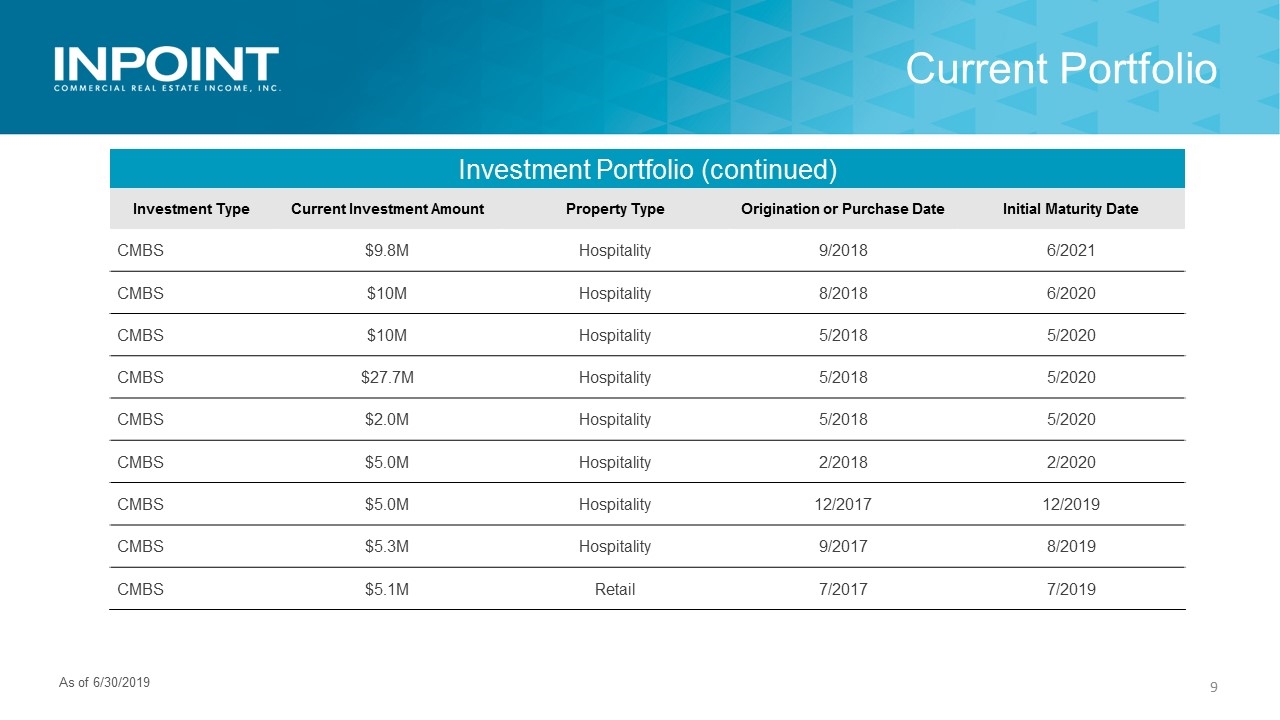
Current Portfolio Investment Portfolio (continued) Investment Type Current Investment Amount Property Type Origination or Purchase Date Initial Maturity Date CMBS $9.8M Hospitality 9/2018 6/2021 CMBS $10M Hospitality 8/2018 6/2020 CMBS $10M Hospitality 5/2018 5/2020 CMBS $27.7M Hospitality 5/2018 5/2020 CMBS $2.0M Hospitality 5/2018 5/2020 CMBS $5.0M Hospitality 2/2018 2/2020 CMBS $5.0M Hospitality 12/2017 12/2019 CMBS $5.3M Hospitality 9/2017 8/2019 CMBS $5.1M Retail 7/2017 7/2019 As of 6/30/2019


