Inpoint Commercial Real Estate Income (ICR-PA)
Filed: 29 Apr 21, 2:04pm
Filed Pursuant to Rule 424(b)(3)
Registration No. 333-230465
INPOINT COMMERCIAL REAL ESTATE INCOME, INC.
SUPPLEMENT NO. 2 DATED APRIL 29, 2021 TO THE
PROSPECTUS DATED MARCH 19, 2021
This Prospectus Supplement No. 2 (this “Supplement”) is part of and should be read in conjunction with the prospectus of InPoint Commercial Real Estate Income, Inc. dated March 19, 2021 (the “Prospectus”) and Supplement No. 1 dated April 15, 2021. Unless otherwise defined herein, capitalized terms used in this Supplement shall have the same meanings as in the Prospectus.
The purpose of this Supplement is as follows:
| • | To provide updated portfolio metrics regarding the status of our investments as of March 31, 2021. |
Portfolio Metrics as of March 31, 2021
Attached hereto as Appendix A are portfolio metrics regarding the status of our investments as of March 31, 2021.
Appendix A
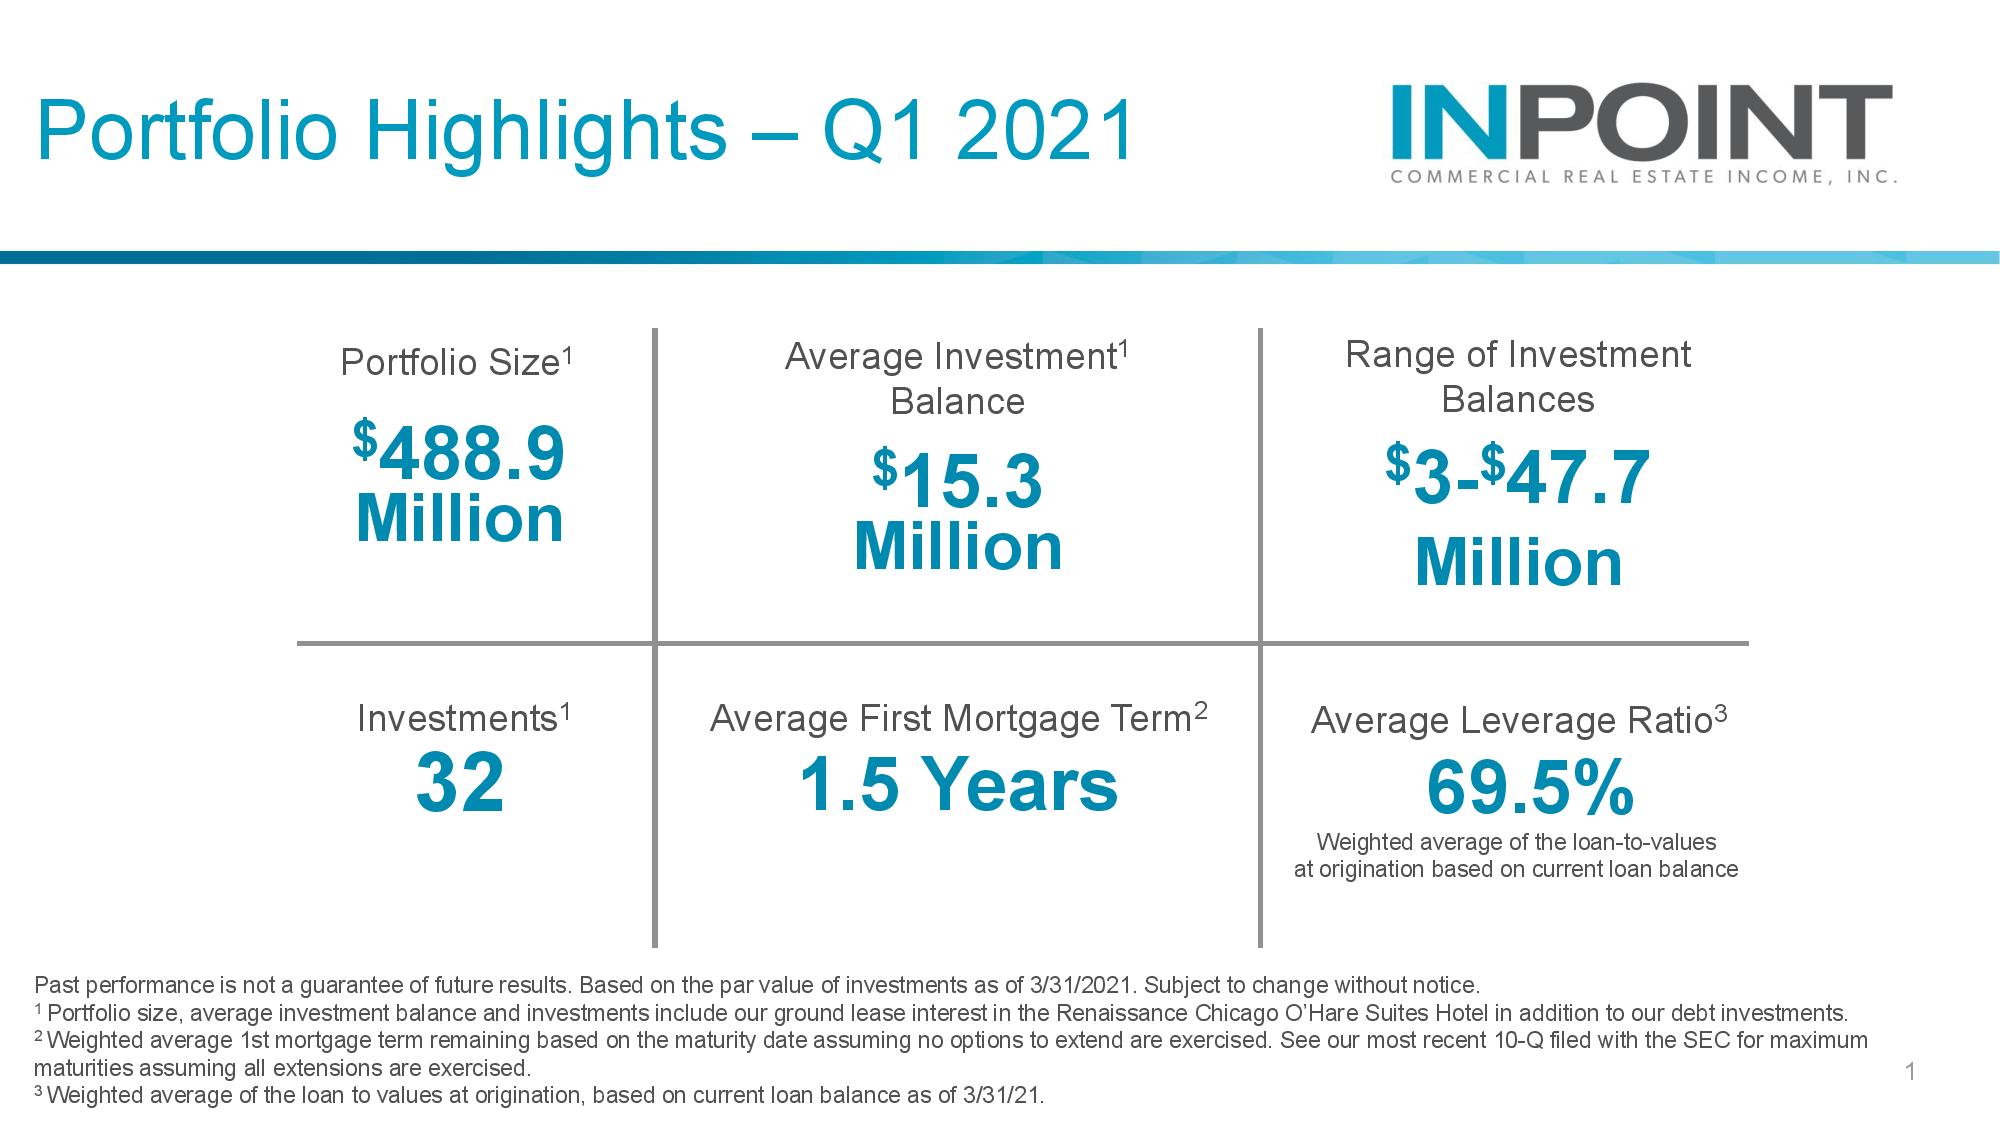
Portfolio Highlights - Q1 2021 INPOINT COMMERCIAL REAL ESTATE INCOME, INC. Portfolio Size1 $488.9 Million Average Investment1 Balance $15.3 Million Range of Investment Balances $3-$47.7 Million Investments1 32 Average First Mortgage Term2 1.5 Years Average Leverage Ratio3 69.5% Weighted average of the loan-to-values at origination based on current loan balance Past performance is not a guarantee of future results. Based on the par value of investments as of 3/31/2021. Subject to change without notice.1 Portfolio size, average investment balance and investments include our ground lease interest in the Renaissance Chicago O’Hare Suites Hotel in addition to our debt investments. 2 Weighted average 1st mortgage term remaining based on the maturity date assuming no options to extend are exercised. See our most recent 10-Q filed with the SEC for maximum maturities assuming all extensions are exercised. 3 Weighted average of the loan to values at origination, based on current loan balance as of 3/31/21. 1

Portfolio Composition INPOINT COMMERCIAL REAL ESTATE INCOME, INC. Debt Investments: Floating vs. Fixed Rate 4% Fixed Rate 96% Floating Rate Based on the par value of investments as of 3/31/2021. Subject to change without notice. 2

Portfolio Composition INPOINT COMMERCIAL REAL ESTATE INCOME, INC. All Investments by Type 3% REO 3% Credit Loan 94% First Mortgage Based on the par value of investments as of 3/31/2021. Subject to change without notice. First mortgage loans finance commercial real estate properties and are loans that generally have the highest priority lien among the loans in a foreclosure proceeding on the collateral securing the loan. The senior position does not protect against default, and losses may still occur. Credit loans, also called mezzanine loans, are secured by one or more direct or indirect ownership interests in an entity that directly or indirectly owns real estate. CMBS or commercial mortgage-backed securities, are securities collateralized (bundled and sold as bonds) by loans secured by commercial real estate property. REO, which stands for "real estate owned," represents real estate we have acquired through foreclosure, deed-in-lieu of foreclosure, or purchase. 3

Portfolio Composition INPOINT COMMERCIAL REAL ESTATE INCOME, INC. Loans by Region 24% Southeast 22% West 12% Mid Atlantic 37% Southwest Based on the par value of investments as of 3/31/2021. Loans by Region does not include REO. Subject to change without notice. 4

Portfolio Composition INPOINT COMMERCIAL REAL ESTATE INCOME, INC. Loans by Property Type 1% Mixed Use 4% Hospitality 6% Retail 14% Industrial 34% Multifamily 41% Office Based on the par value of investments as of 3/31/2021. Loans by Property Type does not include REO. Subject to change without notice. 5