Inpoint Commercial Real Estate Income (ICR-PA)
Filed: 12 Jul 21, 4:16pm
Filed Pursuant to Rule 424(b)(3)
Registration No. 333-230465
INPOINT COMMERCIAL REAL ESTATE INCOME, INC.
SUPPLEMENT NO. 6 DATED JULY 12, 2021 TO THE
PROSPECTUS DATED MARCH 19, 2021
This prospectus supplement no. 6 (this “Supplement”) is part of and should be read in conjunction with the base prospectus of InPoint Commercial Real Estate Income, Inc. dated March 19, 2021, prospectus supplement no. 1 dated April 15, 2021, prospectus supplement no. 2 dated April 29, 2021, prospectus supplement no. 3 dated May 17, 2021, prospectus supplement no. 4 dated June 15, 2021, and prospectus supplement no. 5 dated July 8, 2021 (collectively, the “prospectus”). Unless otherwise defined herein, capitalized terms used in this Supplement shall have the same meanings as in the prospectus.
The purposes of this Supplement are as follows:
| • | to disclose each of our commercial mortgage loans entered into since June 14, 2021; and |
| • | to provide an operations and portfolio summary update. |
Commercial Mortgage Loans Held for Investment
The following information supplements the table of select loan information on page 73 of our prospectus to add each of our commercial mortgage loans entered into since June 14, 2021 as of July 9, 2021 ($ in thousands):
Since June 14, 2021 as of July 9, 2021
Origination Date |
| Loan Type (1) |
| Principal Balance |
|
| Cash Coupon (2) |
| All-in Yield (2) |
|
| Maximum Maturity (3) |
| State |
| Property Type |
| LTV (4) |
| |||
7/1/21 |
| First mortgage |
| $ | 6,430 |
|
| L+4.50% |
| 5.00% |
|
| 7/1/26 |
| OH |
| Mixed Use |
|
| 79 | % | |
|
|
|
|
|
|
|
|
|
|
|
|
|
|
|
|
|
|
|
|
|
|
|
(1) | First mortgage loans are first position mortgage loans. |
(2) | Cash coupon is the stated rate on the loan. All-in yield is the present value of all future principal and interest payments on the loan and does not include any origination fees or deferred commitment fees. Our first mortgage loans are all floating rate and each contains a minimum LIBOR floor. |
(3) | Maximum maturity assumes all extension options are exercised by the borrower; however, loans may be repaid prior to such date. |
(4) | Loan-to-value (“LTV”) was determined at loan origination and is not updated for subsequent property valuations or loan modifications. |
Operations Update
The section “Selected Information Regarding our Operations—Operations Update” that begins on p. 118 of the base prospectus is updated and supplemented as follows.
As the country continues to recover from the impacts of COVID-19, InPoint Commercial Real Estate Income, Inc.’s (“we,” the “REIT” or “InPoint”) management team has been hard at work executing our plans, highlighted by:
| • | Increased distributions |
| • | Stabilized NAV per share during 2021, with a portfolio we believe is positioned well |
| • | Putting cash to work with new loans – ten first mortgage loans totaling $142 million originated since March 2021 |
| • | Portfolio of first mortgage loans that we believe has performed well – we have received monthly debt service and principal payments on all loans in accordance with their current terms, including any modifications made |
We are seeing continuing signs of improvement in the U.S. economy, and the Urban Land Institute, or ULI, has reported that U.S. gross domestic product is projected to grow by 6.5 percent in 2021, which would be the fastest growth rate since 1984. The CRE mortgage market has been active in the past several months, which may provide InPoint with new opportunities to originate loans. ULI reports that total U.S. CRE deal volume is expected to exceed $500 billion in 2021, which would be a significant increase from the longer-term annual average of $347 billion. We expect these new CRE acquisitions would generate new lending opportunities for us, as we believe many will be financed by the floating rate loans that we target.
Distributions Increase: On June 29, 2021, we declared a distribution in a gross amount equal to $0.1042 per share for stockholders of record as of June 30, 2021, which will be paid on or about July 19, 2021. The annualized rate of this distribution is approximately 6.2 percent based on the most recently reported aggregate NAV per share as of May 31, 2021. This distribution marks the sixth consecutive month we have increased our distributions.
Distributions Declared from December 2020 through June 2021
| Record Date | Payment Date | Gross Distribution Per Share* | Gross Distribution Per Share Annualized* | % Annualized based on prior month NAV* |
December 2020 | 12/31/2020 | 1/20/2021 | $0.0750 | $0.90 | 4.20% |
January 2021 | 1/31/2021 | 2/17/2021 | $0.0792 | $0.95 | 4.72% |
February 2021 | 2/28/2021 | 3/17/2021 | $0.0833 | $1.00 | 4.96% |
March 2021 | 3/31/2021 | 4/19/2021 | $0.0875 | $1.05 | 5.21% |
April 2021 | 4/30/2021 | 5/18/2021 | $0.0917 | $1.10 | 5.46% |
May 2021 | 5/31/2021 | 6/17/2021 | $0.0958 | $1.15 | 5.70% |
June 2021 | 6/30/2021 | 7/19/2021 | $0.1042 | $1.25 | 6.18% |
*Gross distributions are reduced for certain classes of our common stock for applicable stockholder servicing fees, resulting in a lower net distribution. See “Description of Common Stock—Distribution Policy” for more information.
Management Fees: Beginning January 2021, 50 percent of the management fee has been waived, continuing until July 1, 2021. Effective July 1, 2021, pursuant to the Second Amended and Restated Advisory Agreement, the fixed component of the advisor’s management fee has been reduced by up to 50 percent, adjusted from (a) 1/12th of 1.25 percent of average invested assets up to a limit of 1/12th of 2.5 percent of the average NAV to (b) 1/12th of 1.25 percent of the average NAV.
Expense Reimbursement: Effective July 1, 2021, the reimbursement of operating expenses has been updated to include reimbursement to advisors for ordinary operating expenses up to 1.5 percent of average monthly net assets. Ordinary operating expenses beyond the 1.5 percent limit can be paid by the Company in future periods for up to three years after they were incurred to the extent that the limit has not been reached for the future period. Before July 1, 2021, we did not reimburse advisors for overhead or personnel costs or fees payable to affiliates except for fees for legal and marketing services.
Stabilized NAV: Our NAV per share has been stable during 2021, and we believe our loan portfolio is well-positioned. Although our ownership of the Renaissance O’Hare hotel, which we acquired through a deed-in-lieu of foreclosure transaction in August 2020, has had a negative impact on our NAV during the COVID-19 pandemic, the Renaissance O’Hare has shown improved operating performance during 2021. For the month of May 2021, the occupancy rate was 44.8 percent, average daily rate was $87 and revenue per available room was $39.32. For the month of June 2021 through June 19, the occupancy rate was 53.3 percent, average daily rate was $90 and revenue per available room was $48.34.
Net Asset Values per Share from December 31, 2020 through May 31, 2021
NAV Date as of | Class A | Class T | Class D | Class I | Class S | Class P |
12/31/2020 | $20.1742 | $20.1732 | $20.1694 | $20.1749 | $20.1348 | $20.1283 |
1/31/2021 | $20.1869 | $20.1858 | $20.1821 | $20.1876 | $20.1474 | $20.1409 |
2/28/2021 | $20.1810 | $20.1799 | $20.1762 | $20.1817 | $20.1416 | $20.1350 |
3/31/2021 | $20.1903 | $20.1893 | $20.1855 | $20.1910 | $20.1508 | $20.1443 |
4/30/2021 | $20.1952 | $20.1941 | $20.1904 | $20.1959 | $20.1562 | $20.1491 |
5/31/2021 | $20.2474 | $20.2463 | $20.2426 | $20.2481 | $20.2071 | $20.2012 |
New Loan Originations: Since March 31, 2021, we have originated ten first mortgage loans that we believe are high-quality with an approximate principal balance of $142 million, and we are actively monitoring the market for favorable future lending opportunities. Five of these loans are secured by multifamily properties, two are secured by industrial properties, one is secured by an office property, and two are mixed-use. We had approximately $45 million of cash and cash equivalents as of July 1, 2021, approximately $30 million of which we maintain to satisfy the liquidity requirements of our debt obligations with the rest available to use for other purposes.
New Originations since March 2021
Origination Date | Location | Loan Type | Initial Loan Amount | |
March 2021 | Office | Reston, VA | First Mortgage | $13.0M |
March 2021 | Industrial | Byhalia, MS | First Mortgage | $19.3M |
April 2021 | Multifamily | Huntsville, AL | First Mortgage | $11.7M |
April 2021 | Multifamily | Huntsville, AL | First Mortgage | $9.2M |
April 2021 | Industrial | Carlstadt, NJ | First Mortgage | $9.1M |
May 2021 | Multifamily | Meriden, CT | First Mortgage | $27.0M |
May 2021 | Multifamily | Knoxville, TN | First Mortgage | $11.2M |
May 2021 | Multifamily | Las Vegas, NV | First Mortgage | $14.9M |
June 2021 | Mixed Use | Austin, TX | First Mortgage | $20.5M |
July 2021 | Mixed Use | Cincinnati, OH | First Mortgage | $6.4M |
The section “Investment Portfolio” that begins on p. 71 of the base prospectus is updated and supplemented as follows.
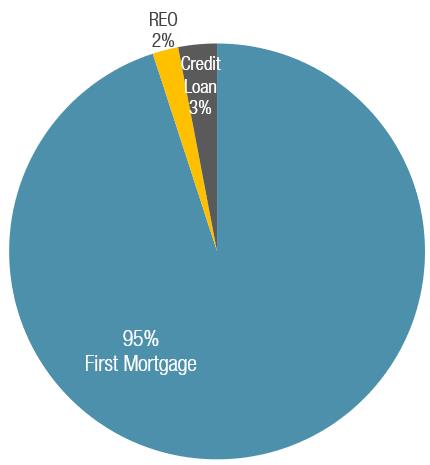
Portfolio Performance: As of June 30, 2021, more than 95 percent of our portfolio was invested in first mortgage loans. We believe our first mortgage loan portfolio performed well through the pandemic. Other than the loan secured by the ground lease of the Renaissance O’Hare hotel that we acquired from the borrower upon the borrower’s default, every loan has made monthly debt service and principal payments in accordance with their current terms, including payment modifications made to one hospitality loan and one retail loan, and extension modifications made to one office loan, one industrial loan and one multifamily loan.
As of June 30, 2021, our portfolio is comprised of 36 debt investments with total unpaid principal balances of $554.8 million and one owned property, the Renaissance O’Hare, with a fair value of approximately $14 million. Additional portfolio highlights as of June 30, 2021 include the following:
| • | Range of investment balances: $3 million - $47.7 million |
| • | Average investment balance: $15.4 million |
| • | Average loan-to-value ratio: 69.3 percent |
| • | Historical loan payoffs: 11 loans |
| • | Historical first mortgage loan payoff amount: $193.7 million |
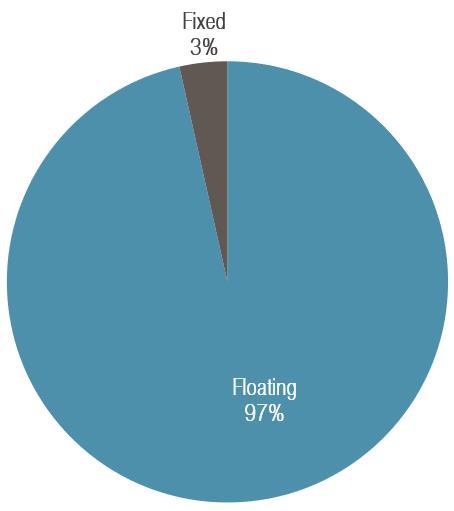
Debt Investments: Floating vs. Fixed Rate | All Investments by Type | ||
Floating Rate Fixed Rate | 97% 3% | First Mortgage Credit Loan Real Estate Owned | 95% 3% 2% |
|
| ||
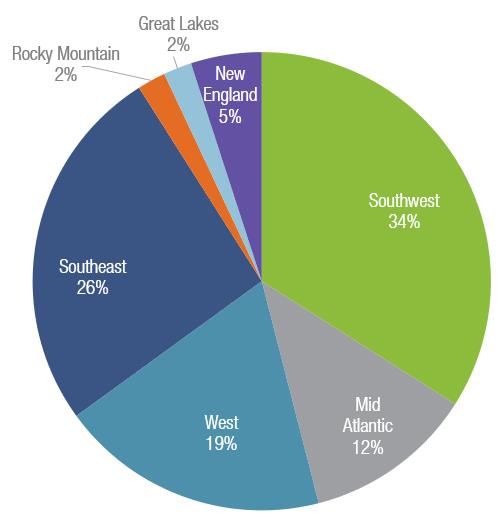
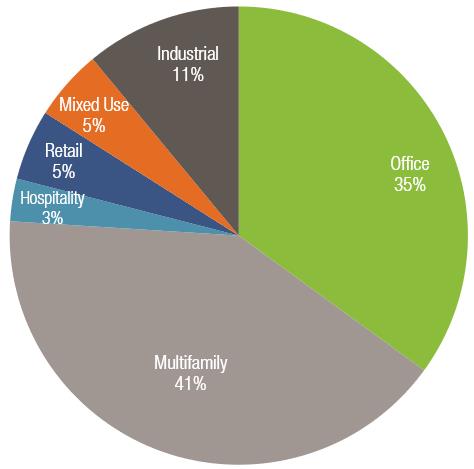
Loans by Region | Loans by Property Type | ||
Southwest Southeast West Mid-Atlantic New England Great Lakes Rocky Mountain | 34% 26% 19% 12% 5% 2% 2% | Multifamily Office Industrial Retail Mixed Use Hospitality | 41% 35% 11% 5% 5% 3% |
|
| ||