Inpoint Commercial Real Estate Income (ICR-PA)
Filed: 15 Oct 21, 4:24pm
Filed Pursuant to Rule 424(b)(3)
Registration No. 333-230465
INPOINT COMMERCIAL REAL ESTATE INCOME, INC.
SUPPLEMENT NO. 13 DATED OCTOBER 15, 2021 TO THE
PROSPECTUS DATED MARCH 19, 2021
This prospectus supplement no. 13 (this “Supplement”) is part of and should be read in conjunction with the base prospectus of InPoint Commercial Real Estate Income, Inc. dated March 19, 2021, prospectus supplement no. 1 dated April 15, 2021, prospectus supplement no. 2 dated April 29, 2021, prospectus supplement no. 3 dated May 17, 2021, prospectus supplement no. 4 dated June 15, 2021, prospectus supplement no. 5 dated July 8, 2021, prospectus supplement no. 6 dated July 12, 2021, prospectus supplement no. 7 dated July 15, 2021, prospectus supplement no. 8 dated August 16, 2021, prospectus supplement no. 9 dated September 7, 2021, prospectus supplement no. 10 dated September 15, 2021, prospectus supplement no. 11 dated September 15, 2021, and prospectus supplement no. 12 dated September 22, 2021 (collectively, the “prospectus”). Unless otherwise defined herein, capitalized terms used in this Supplement shall have the same meanings as in the prospectus.
The purposes of this Supplement are as follows:
| • | to disclose the transaction price as of November 1, 2021, the first business day of the month, for each class of our common stock being offered and sold in this offering; and |
| • | to disclose our NAV per share as of September 30, 2021; and |
| • | to provide portfolio metrics regarding the status of our investments as of September 30, 2021. |
Transaction Prices
The transaction price for each share class of our common stock for subscriptions to be accepted as of November 1, 2021, the first business day of the month, and for distribution reinvestments is as follows:
|
| Transaction Price (per share) |
| |
Class A |
| $ | 20.2568 |
|
Class T |
| $ | 20.2557 |
|
Class S |
| $ | 20.2168 |
|
Class D |
| $ | 20.2520 |
|
Class I |
| $ | 20.2575 |
|
As of September 30, 2021, we had not sold any Class S shares. The November 1, 2021 transaction price for our Class S shares is based on our aggregate NAV for all share classes as of September 30, 2021. The purchase price of our common stock for each share class equals the transaction price of such class, plus applicable upfront selling commissions and dealer manager fees. A detailed calculation of the NAV per share is set forth below. No transactions or events have occurred since September 30, 2021 that would have a material impact on our NAV per share.
September 30, 2021 NAV per Share
We calculate NAV per share in accordance with the valuation guidelines that have been approved by our board of directors. Our NAV per share, which is updated as of the last calendar day of each month, is posted on our website at www.inland-investments.com/inpoint. Please refer to “Net Asset Value Calculation and Valuation Guidelines” in the prospectus, as supplemented, for how our NAV is determined. The Advisor is ultimately responsible for determining our NAV. The valuation of our commercial real estate loan portfolio is reviewed by our independent valuation advisor. We have included a breakdown of the components of total net asset value attributable to common stock and NAV per share for September 30, 2021.
Our total net asset value attributable to common stock presented in the following table includes the NAV of our Class A, Class T, Class S, Class D, and Class I common stock being sold in this offering, as well as our Class P common stock, which is not being sold in this offering. As of September 30, 2021, we had not sold any Class S shares. The following table provides a breakdown of the major components of our total net asset value attributable to common stock as of September 30, 2021 ($ and shares in thousands, except per share data):
Components of NAV |
| September 30, 2021 |
| |
Commercial mortgage loans |
| $ | 524,847 |
|
Real estate owned, net |
|
| 14,000 |
|
Cash and cash equivalents and restricted cash |
|
| 134,837 |
|
Other assets |
|
| 6,722 |
|
Repurchase agreements - commercial mortgage loans |
|
| (343,180 | ) |
Credit facility payable |
|
| (14,350 | ) |
Reserve for negative impact of COVID on real estate owned (1) |
|
| (984 | ) |
Due to related parties |
|
| (2,225 | ) |
Distributions payable |
|
| (1,166 | ) |
Interest payable |
|
| (320 | ) |
Accrued stockholder servicing fees (2) |
|
| (98 | ) |
Other liabilities |
|
| (6,413 | ) |
Preferred stock |
|
| (84,251 | ) |
Net asset value attributable to common stock |
| $ | 227,419 |
|
Number of outstanding shares |
|
| 11,249 |
|
Aggregate NAV per share |
| $ | 20.2168 |
|
| (1) | As of December 31, 2020, we established as a component of the NAV calculation a $2,250 reserve for the estimated negative impact of COVID-19 during 2021 on real estate owned. The reduction in this reserve as of September 30, 2021 from August 31, 2021 resulted from the net loss on real estate owned set forth below. Because we had already established a reserve for losses, the monthly loss on real estate owned as of September 30, 2021 has no negative effect on the NAV. Below is a reconciliation of the reserve ($ in thousands): |
Beginning reserve balance as of August 31, 2021 |
| $ | (1,118 | ) |
Plus: Net loss on real estate owned for September: |
|
|
|
|
Revenue from real estate owned |
|
| 880 |
|
Real estate owned operating expense |
|
| (1,046 | ) |
Non-cash adjustment for ground lease |
|
| 32 |
|
Net loss from real estate owned |
|
| (134 | ) |
Reserve balance as of September 30, 2021 |
| $ | (984 | ) |
| (2) | Stockholder servicing fees only apply to Class T, Class S, and Class D shares. For purposes of NAV, we recognize the stockholder servicing fee as a reduction of NAV on a monthly basis as such fee is paid. Under accounting principles generally accepted in the United States of America (“GAAP”), we accrue the full cost of the stockholder servicing fee as an offering cost at the time we sell Class T, Class S, and Class D shares. As of September 30, 2021, we have accrued under GAAP $723 of stockholder servicing fees payable to the Dealer Manager related to the Class T and Class D shares sold. As of September 30, 2021, we have not sold any Class S shares and, therefore, we have not accrued any stockholder servicing fees payable to the Dealer Manager related to Class S shares. The Dealer Manager does not retain any of these fees, all of which are retained by, or reallowed (paid) to, participating broker-dealers and servicing broker-dealers for ongoing stockholder services performed by such broker-dealers. |
The following table provides a breakdown of our total net asset value attributable to common stock and NAV per share by share class as of September 30, 2021 ($ and shares in thousands, except per share data):
NAV Per Share |
| Class P |
|
| Class A |
|
| Class T |
|
| Class S |
|
| Class D |
|
| Class I |
|
| Total |
| |||||||
Net asset value attributable to common stock |
| $ | 197,345 |
|
| $ | 13,258 |
|
| $ | 8,092 |
|
| $ | — |
|
| $ | 948 |
|
| $ | 7,768 |
|
| $ | 227,419 |
|
Number of outstanding shares |
|
| 9,764 |
|
|
| 654 |
|
|
| 399 |
|
|
| — |
|
|
| 47 |
|
|
| 383 |
|
|
| 11,249 |
|
NAV per share as of September 30, 2021 |
| $ | 20.2106 |
|
| $ | 20.2568 |
|
| $ | 20.2557 |
|
| $ | — |
|
| $ | 20.2520 |
|
| $ | 20.2575 |
|
| $ | 20.2168 |
|
Portfolio Metrics as of September 30, 2021
Attached hereto as Appendix A are portfolio metrics regarding the status of our investments as of September 30, 2021.
Appendix A

Portfolio Highlights Q3 2021 Portfolio Size1 $535.3M Average Investment Balance1 $15.3M Range of Investment Balances $3-$47.7M Historical 1st Mortgage Loan Payoffs 14 Loans Investments1 35 1st Mortgage Weighted Avg. Years to Maturity2 1.5 Years Average Leverage Ratio3 69.8% Weighted average of loan-to-value at origination based on current loan balance Historical 1st Mortgage Loan Payoff Amount$238.2M 1Portfolio size is based on the unpaid principal balance of our debt investments and the fair value of our real estate owned (REO) in each case as of September 30, 2021. Portfolio size, average investment balance and number of investments include our REO. 21st mortgage loan weighted average years to maturity based on maturity date assuming no options to extend are exercised. See our Form 10-K or 10-Q most recently filed with the SEC for maximum maturities assuming all extensions are exercised. 3Weighted average of loan-to-value at origination, based on current loan balance as of September 30, 2021. 1 (Company Logo)
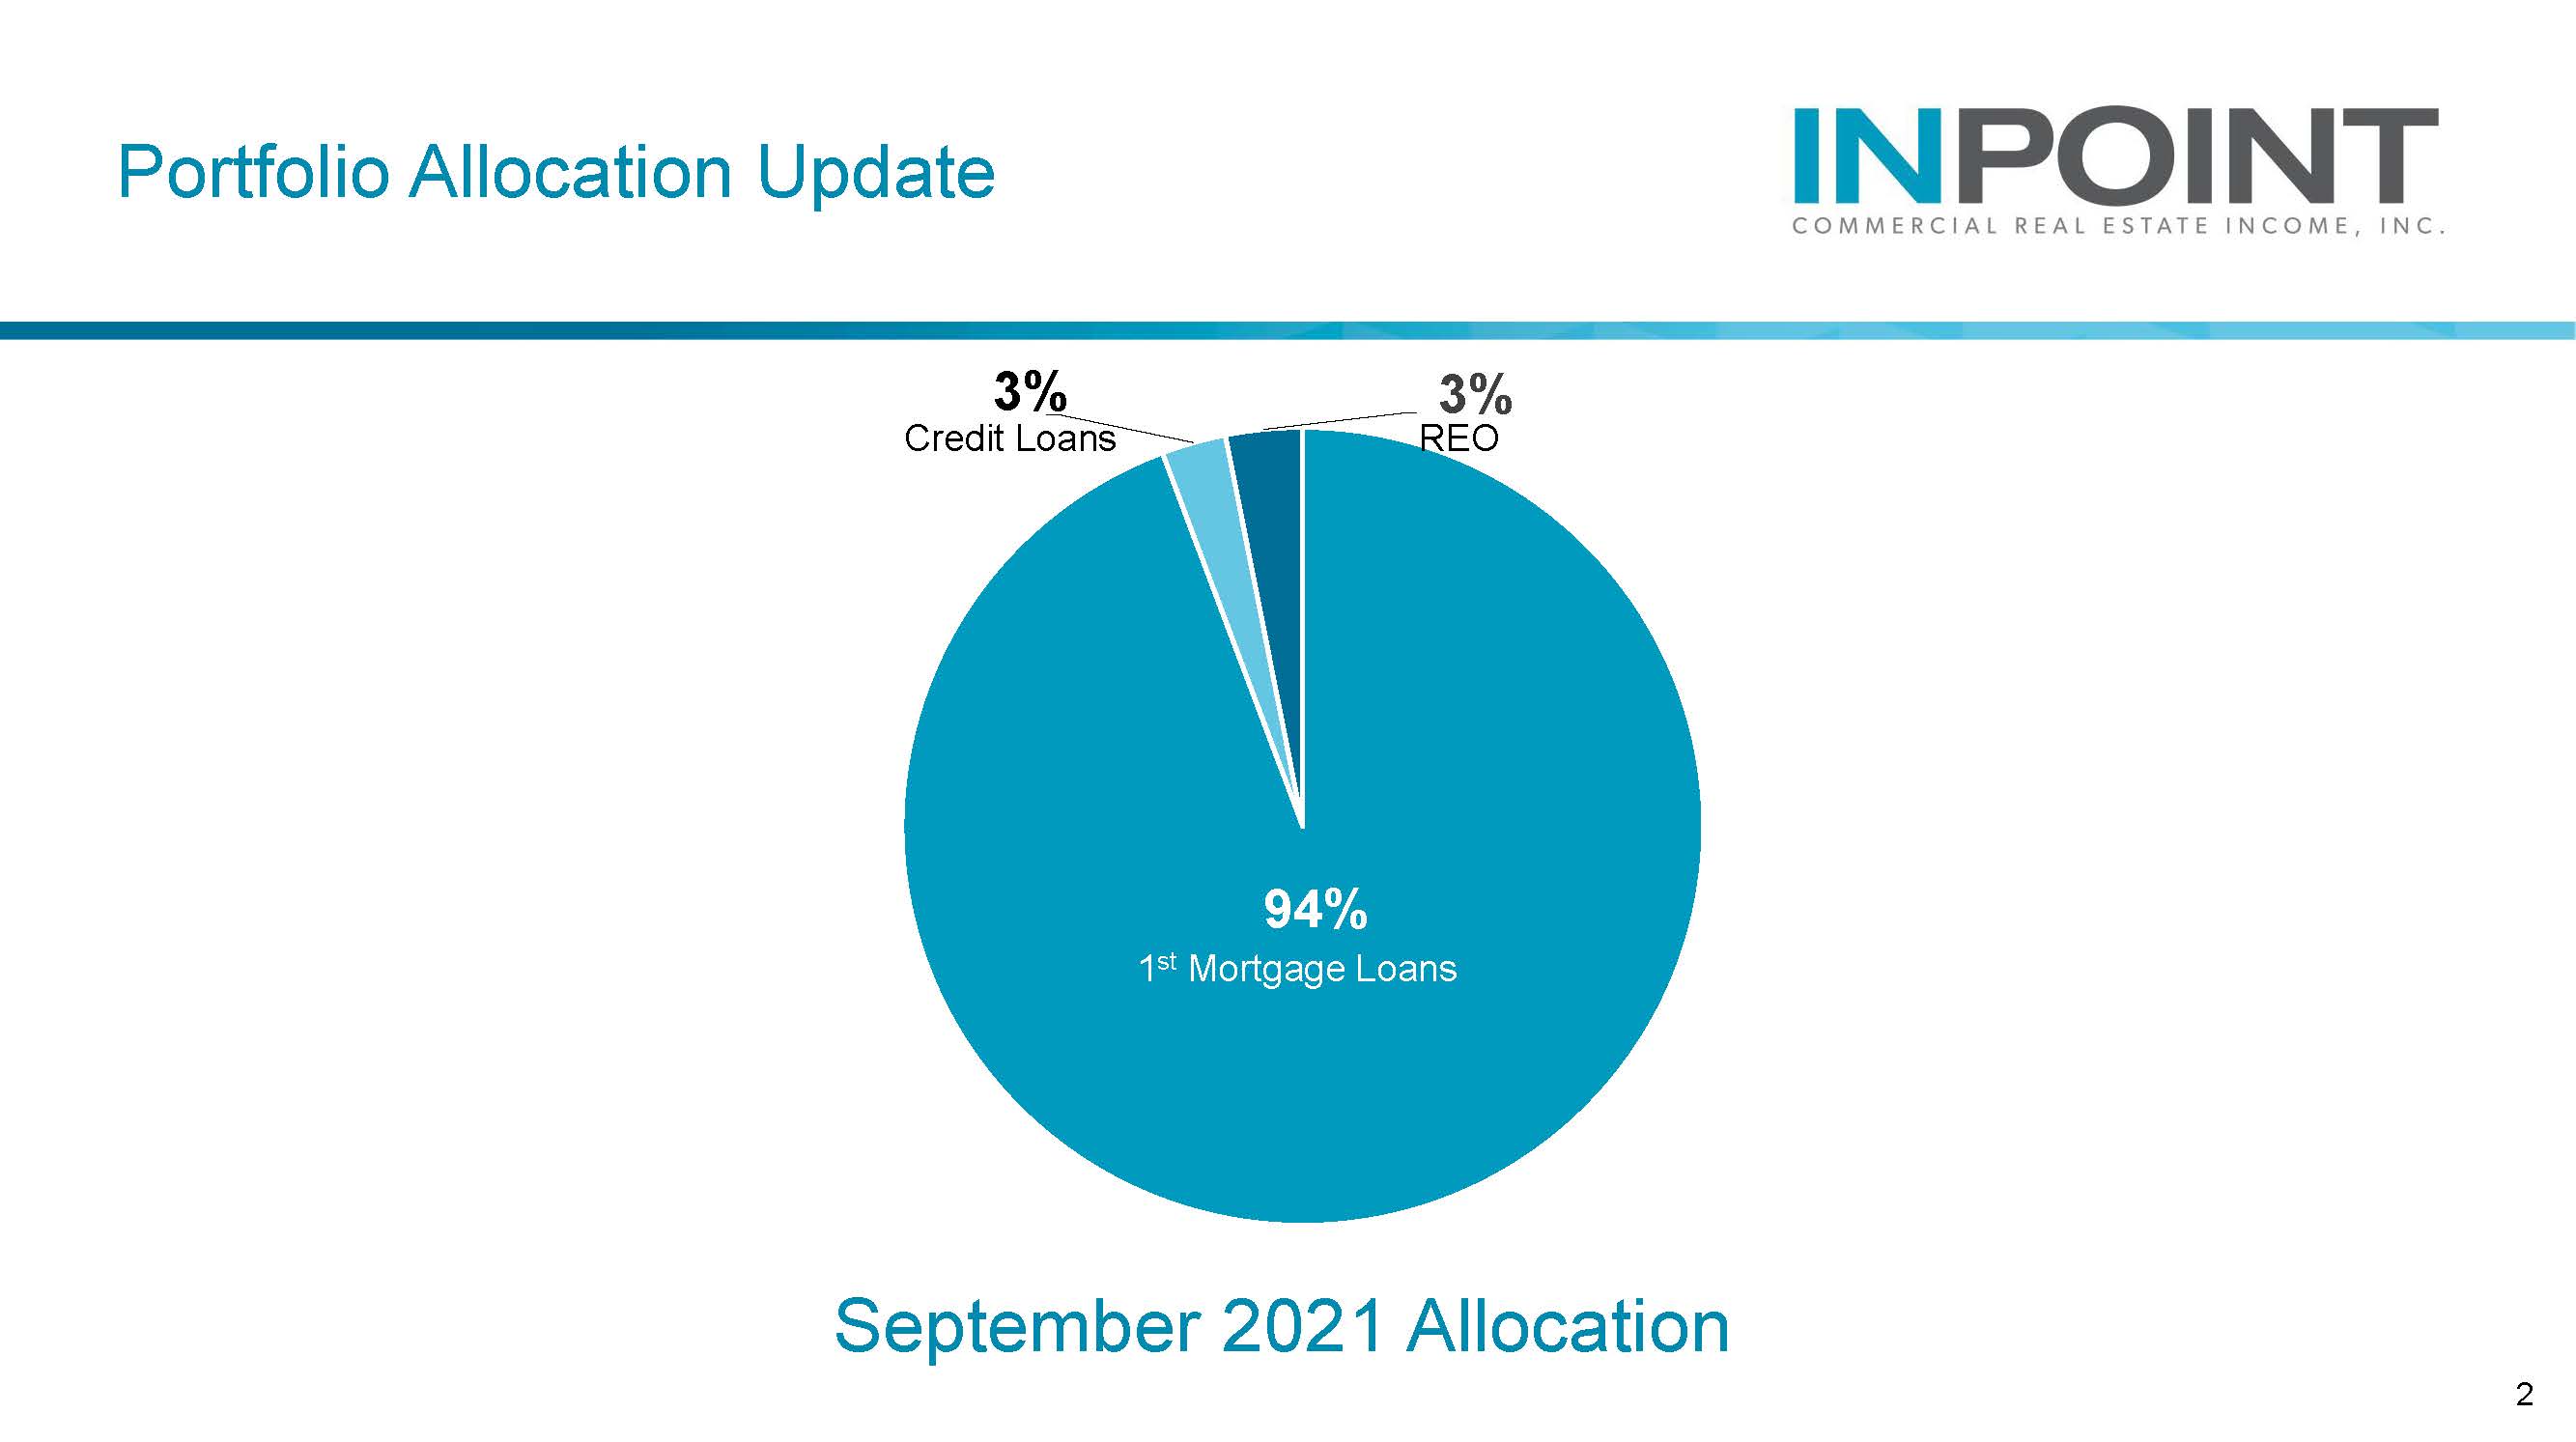
Portfolio Allocation Update 3% 3% Credit Loans REO 94% 1st Mortgage Loans September 2021 Allocation 2 (Company Logo)

Portfolio Highlights Loans by Floating vs. Fixed Rate 4% Fixed Rate 96% Floating Rate Based on the par value of investments as of 9/30/2021. Subject to change without notice.
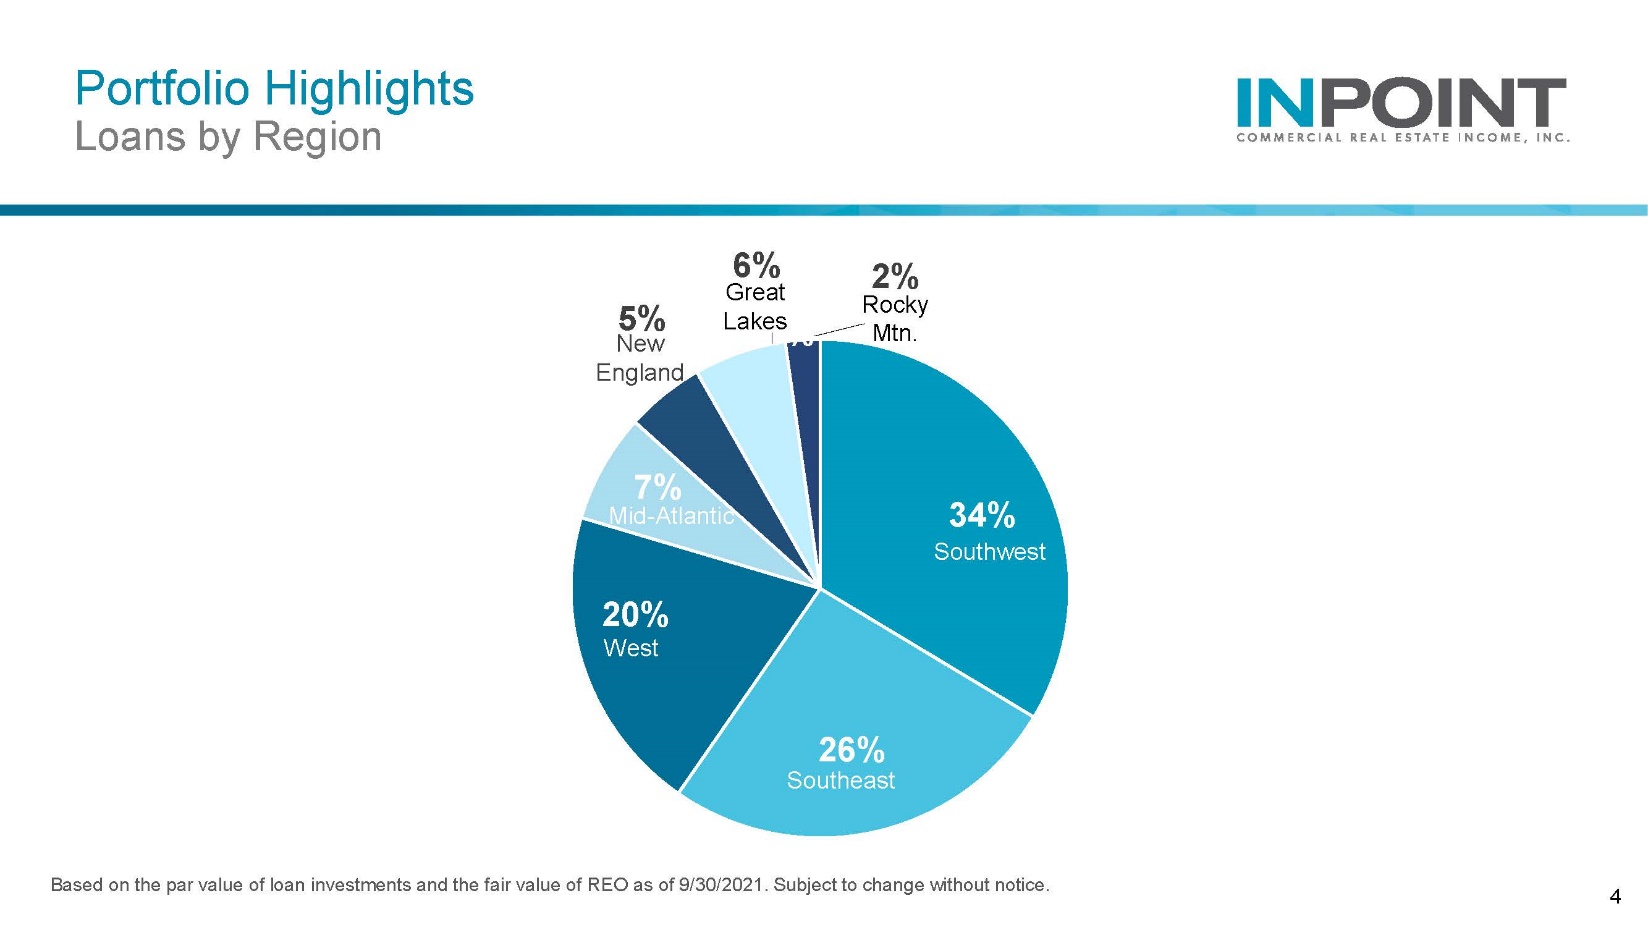
Portfolio Highlights Loans by Region 5% New England 6% Great Lakes 2% Rocky Mtn 7% Mid-Atlantic West 20% 34% Southwest 26% Southeast Based on the par value of loan investments and the fair value of REO as of 9/30/2021. Subject to change without notice. 4 (Company Logo)

Portfolio Highlights Loans by Property Type 6% Mixed Use 6% Hospitality 6% Retail 5% Industrial 37% Office 40% Multifamily Based on the par value of loan investments and the fair value of REO as of 9/30/2021. Subject to change without notice. 5 (Company Logo)