Exhibit 99.1
Dear Shareholders,
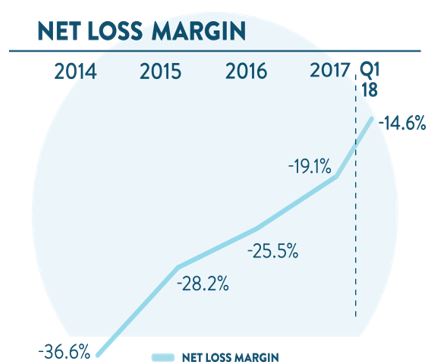
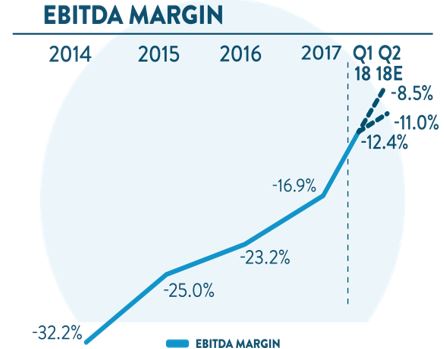
We’re pleased to announce our first quarter 2018 results. In the first quarter, we continued to execute our plan of delivering exceptional customer experiences while rapidly growing and improving our unit economics. Compared to Q1 2017, we grew retail units sold by 122%, we grew total revenue by 127%, and we increased total gross profit by 251%. We have been outgrowing public auto retailers in retail units in percentage terms for our entire history, but in the first quarter we also outgrew those peers in absolute organic retail units for the first time. We also launched 12 markets, a quarterly record, and further built out our logistics network, all while improving our net loss margin to (14.6%) from (24.2%) and our EBITDA margin to (12.4%) from (21.6%) in Q1 2017. We look forward to discussing our Q1 results and the outlook on today’s conference call.
Summary of Q1 2018 Results
Q1 2018: All financial comparisons stated below are versus Q1 2017, unless otherwise noted. Complete financial tables appear at the end of this letter.
| |
| • | Retail units sold totaled 18,464, an increase of 122% |
| |
| • | Revenue totaled $360.4 million, an increase of 127% |
| |
| • | Total gross profit was $34.2 million, an increase of 251% |
| |
| • | Total gross profit per unit was $1,854, an increase of $685 |
| |
| • | Net loss was $52.7 million, an increase of 37% |
| |
| • | EBITDA margin was (12.4%), an improvement from (21.6%) |
| |
| • | GAAP basic and diluted net loss per Class A share was $0.53 based on 18.3 million shares of Class A common stock outstanding; absent $1.38 million in accrued charges associated with our convertible preferred stock issuance, net loss per Class A share would have been $0.46. |
| |
| • | Adjusted net loss per Class A share, a non-GAAP measure, was $0.40, based on 137.2 million adjusted shares of Class A common stock outstanding, assuming the exchange of all outstanding LLC Units for shares of Class A common stock; absent $1.38 million in accrued charges associated with our convertible preferred stock issuance, adjusted net loss per Class A share would have been $0.39. |
| |
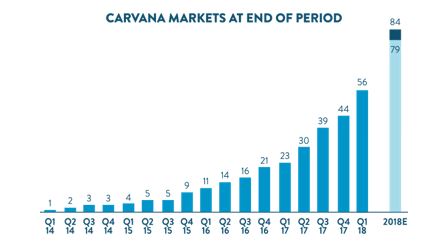
| • | We opened 12 new markets and 1 vending machine, bringing our end-of-quarter totals to 56 and 8, respectively |
| |
| • | We lowered our average days to sale to 70, from 72 last quarter and 93 in Q1 2017 |
Recent Events
We would also like to highlight several recent notable accomplishments:
| |
| • | On April 30, we closed a follow-on public offering of our Class A Common Stock, generating proceeds to Carvana of $173.3 million, net of fees but before estimated expenses. We believe these proceeds provide additional cushion and flexibility as we execute our operating plan. |
| |
| • | On April 12, we acquired Car360, which we believe will accelerate our 360-degree photo capabilities with 3D computer vision and augmented reality. Once integrated with our existing photo booths, Car360’s technology will create a more dynamic, immersive viewing experience for our customers. |
| |
| • | Thus far in Q2 we have opened 6 markets and 1 vending machine, bringing our totals as of May 9, 2018, to 62 and 9, respectively. |
| |
| • | In April we exceeded 2 million monthly unique visitors (MUV) to our website just nine months after reaching 1 million MUV. |
Q2 and 2018 Outlook
We anticipate continued rapid growth in units and revenue for both Q2 and the full year 2018 as we increase penetration in our existing markets, open new markets, and broaden our brand awareness with national advertising and additional vending machines. That rapid unit growth will drive continued progress on GPU and EBITDA margin.
Our Q2 guidance is as follows. All financial comparisons stated below are versus Q2 2017, unless otherwise noted.
| |
| • | Retail unit sales of 20,000 - 22,000, an increase of 87% - 106% |
| |
| • | Total revenue of $395 million - $435 million, an increase of 89% - 108% |
| |
| • | Total gross profit per unit of $2,000 - $2,200, an increase from $1,501 |
| |
| • | EBITDA margin of (11.0%) - (8.5%), an improvement from (16.1%) |
Our FY 2018 guidance is as follows. We are raising our guidance for units, revenue, and GPU, and reiterating our expectations for EBITDA margin. After a strong start to market launches we are raising the low end of our market openings range for the year. All financial comparisons stated below are versus FY 2017, unless otherwise noted.
| |
| • | Retail unit sales of 90,000 - 94,000, an increase of 103% - 112% |
| |
| • | Revenue of $1.75 billion - $1.85 billion, an increase of 104% - 115% |
| |
| • | Total gross profit per unit of $1,975 - $2,175, an increase from $1,539 |
| |
| • | EBITDA margin of (9.0%) - (7.0%), an improvement from (16.9%) |
| |
| • | 35 - 40 market openings, an increase from 23 market openings in 2017, bringing our end-of-year total to 79 - 84 markets and our total U.S. population coverage to at least 57% |
For more information regarding the non-GAAP financial measures discussed in this letter, please see the reconciliations of our non-GAAP measurements to their most directly comparable GAAP-based financial measurements included at the end of this letter. Guidance for EBITDA margin excludes depreciation and amortization expense and interest expense. We have not reconciled EBITDA guidance to GAAP net loss as a result of the uncertainty regarding, and the potential variability of, interest expense. Accordingly, a reconciliation of the non-GAAP financial measure guidance to the corresponding GAAP measure is not available without unreasonable effort. Depreciation and amortization expense, which is a component of the reconciliation between EBITDA and GAAP net loss, is expected to be between 1.2% and 1.4% of total revenues for both Q2 2018 and FY 2018.
Expansion
We launched 12 new markets in the first quarter, bringing our total markets to 56 as of March 31, 2018. Our Q1 markets continued to stretch the Carvana network from coast-to-coast, as we opened a cluster of Northeast markets in Connecticut and Massachusetts, and grew our West Coast presence with San Diego. We also established markets in the key Midwest and Mountain West cities of Kansas City and Denver. This expansion increases the total percentage of the U.S. population our markets collectively serve to 45.8%, up from 22.1% at the end of Q1 2017. With our growing population coverage, additional vending machines, and strong move into national cable advertising, we are establishing a national brand.
As we scale we constantly refine and tweak our operations in search of efficiencies. Some examples over the last year include the development of our “Hub in a Box” concept to launch markets, running butterfly routes with our multi-car haulers for optimal utilization, and integrating new outside advocate training into our expansion team’s role. Additionally, as we fill in markets within our existing logistics network, we achieve more leverage from our assets by increasing utilization and creating additional opportunities for backhauling.
For a complete list of our market opening history, estimated populations, and estimated total industry used vehicle sales by market please see: investors.carvana.com/resources/investor-materials
*2018E bar represents high and low end points of end-of-year total market guidance range.
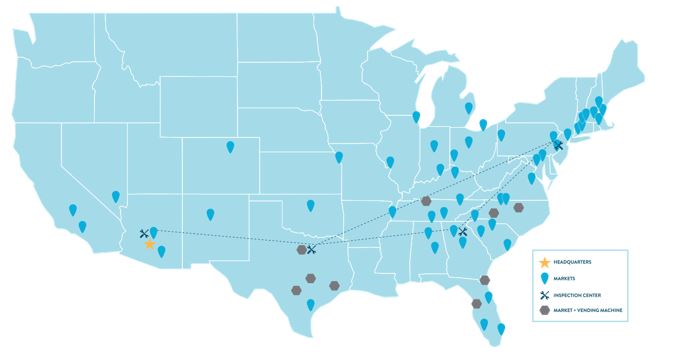
*Represents facilities and markets as of May 9, 2018
Vending Machine Openings
Providing a unique and amazing fulfillment experience is part of our customer-centric business model. We’ve highlighted in previous shareholder letters how our vending machines generate a variety of benefits for the company, as they drive incremental volume through increased brand awareness, provide an exciting and memorable pick-up experience for customers, and reduce our variable delivery costs. About half of our customers in vending machine markets choose pick-up over delivery. In Q1, we launched our eighth vending machine in Tampa, Florida, and early results reveal growth acceleration consistent with historic patterns in other markets. On May 9, 2018, we launched our ninth vending machine in Charlotte, our oldest market without a pickup option.
Carvana’s Car Vending Machines in Tampa, Florida and Charlotte, North Carolina
Carlypso Update and Car360 Acquisition
Carvana’s two technology-focused acquisitions, Carlypso and Car360, furthered our strategic goals by introducing pioneering technology and adding impressive entrepreneurs into the company to push the customer experience forward faster. Nearly a year after acquiring Carlypso, we believe we are the leaders in used vehicle data and have begun to rollout their technology across our platform. The Carlypso founders now lead our efforts in vehicle data and vehicle acquisition from customers, applying their entrepreneurial drive in a way that is yielding very encouraging early results. With Car360, we again believe we are not only acquiring industry-leading technology, but also a strong team that will focus on making what a customer sees when exploring Carvana’s inventory unlike anything else that exists today. We are obsessed with creating the best car buying experience possible for our customers and are always striving for improvement.
Management Objectives
As discussed in previous shareholder letters, our management team remains focused on delivering an exceptional and unparalleled customer experience while simultaneously growing the business rapidly and achieving our financial objectives. We firmly believe wowing the customer is the core of our model, by which all other metrics are driven. To realize our long-term vision, our three primary financial objectives remain unchanged: (1) Grow Retail Units and Revenue; (2) Increase Total Gross Profit Per Unit; and (3) Demonstrate Operating Leverage.
Objective #1: Grow Retail Units and Revenue
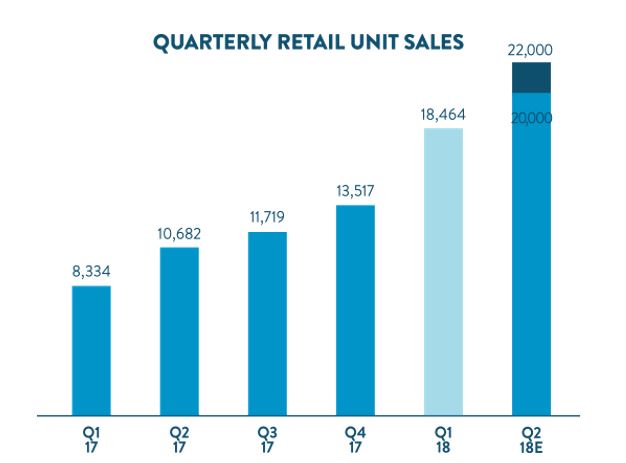
Q1 was another triple-digit growth quarter, as retail units sold increased to 18,464, up 122% from 8,334 in the prior year period. Revenue in Q1 grew to $360.4 million, up 127% from $159.1 million in Q1 2017. Our growth in the first quarter was broad based, driven by gains across our markets nationwide, reflecting increasing demand for our offering and our expansion model’s efficiency. At the same time, we remain at an extremely early stage with an average market age of just 14 months and average market penetration in Q1 at less than one fifth of our most mature market.
*Q2 2018E bars represent high and low end points of quarterly retail unit sales guidance ranges.
Our highly differentiated model puts the customer experience at the core of everything we do, and we are thrilled with the response we are seeing in the market. We believe that underlying demand is growing even faster than we can currently convert into unit sales. Accordingly, we are focused on relieving the pinch points in our operations that have emerged over the last several months due to rapid growth in order to satisfy this demand.
Objective #2: Increase Total Gross Profit Per Unit
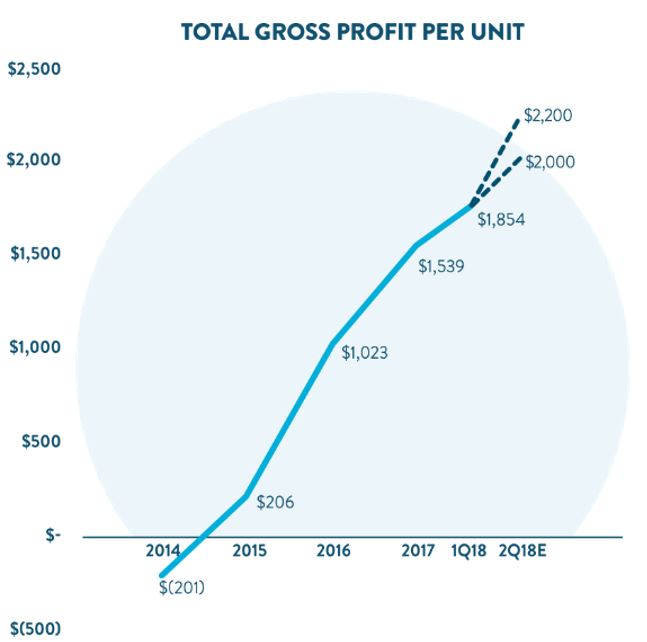
We achieved our highest ever quarterly total GPU in Q1 2018 of $1,854 per unit, an increase of $685 versus Q1 2017, and with the expectation of improvement in Q2, we are making significant progress towards our $3,000 mid-term target.
| |
| • | Retail - Retail GPU was $902 vs. $555 in Q1 2017. Our gains in retail used vehicle GPU were primarily driven by improvements in average days to sale, inventory management and reconditioning process efficiencies, among other items. |
| |
| • | Wholesale - Wholesale GPU was $73 vs. $19 in Q1 2017. Our gains in wholesale GPU were primarily driven by technology and process improvements in bidding for and subsequently selling wholesale cars. Wholesale gross profit per wholesale unit sold reached a company record at $579, vs. $120 in Q1 2017, while we simultaneously achieved record wholesale units sold. |
| |
| • | Other - Other GPU was $879 vs. $596 in Q1 2017. Our gains in other GPU were driven by higher upfront premiums on the sale of our finance receivables, which benefited from enhancements to our proprietary credit scoring and pricing model and the lapping of lower levels in Q1 2017 when we integrated a new finance partner. We also saw gains from the addition of GAP waiver coverage and small improvements in VSC. |
*Q2 2018E lines represent high and low end points of quarterly GPU guidance range.
Objective #3: Demonstrate Operating Leverage
In Q1, we continued to invest in infrastructure and staffing as we ramped into tax season. Despite the substantial investment, we achieved meaningful operating leverage from our 122% unit sales growth. Total SG&A as a percent of revenue was 23.1% in Q1, compared to 28.9% in Q1 2017 and 25.2% last quarter. Notwithstanding our investments in growth and opening 33 new markets over the last year, we reduced non-advertising SG&A by nearly $1k per unit.
Our customer acquisition costs by cohort continue to improve with newer markets launching at lower CACs. In fact, our 2018 cohort so far showed the lowest ever first quarter CAC for a cohort, a clear sign that our brand is beginning to take hold and that national advertising is proving effective.
Our net loss for the quarter was $52.7 million, as compared to $38.4 million in Q1 2017 and $47.2 million last quarter.
We consider EBITDA margin an important measure of the leverage in our business. EBITDA margin in Q1 2018 was (12.4%), an improvement from (21.6%) in Q1 2017 and (15.5%) last quarter. Our operating leverage was primarily driven by leveraging our fixed costs in both compensation and other SG&A. A reconciliation of EBITDA, a non-GAAP measure, to net loss, its most directly comparable GAAP measure, is provided in the appendix.
*Q2 2018E lines represent high and low end points of quarterly EBITDA Margin guidance range.
Ingraining a Culture of Customer Centricity
In these letters, our goal is to provide you with our results, our analysis of those results, and our near-term expectations for where we can take the business. While that discussion is extremely important, there is also a bigger picture with even larger considerations that we should keep in focus.
In the long run, our success will be determined by the quality of customer experiences we can deliver. Consistently providing exceptional customer experiences at increasing scales is hard, so how do we achieve it?
We believe that great customer experiences start with a better business model. A better business model attracts the types of people that are necessary to build a paradigm-changing company. Great people want meaning in their work, and straight-line visibility to how we improve our customers’ lives gives us that meaning. With great people you have a chance to build a great culture, and great cultures are the only way to deliver exceptional customer experiences as we continue to scale over time.
We are proud to definitively say that we have a great model and great people, which enables a great culture. We must constantly work to shape and maintain that culture and we will continue to put a lot of effort into it.
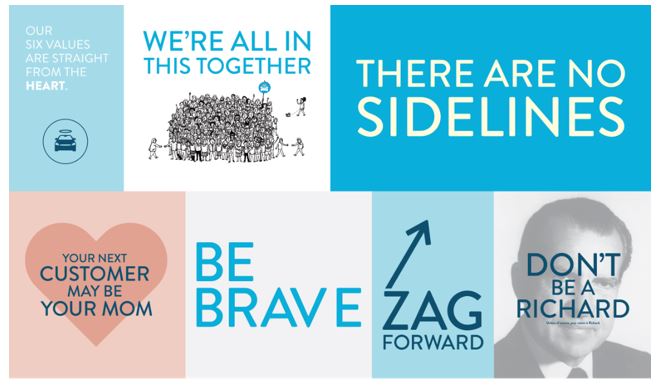
This takes many forms internally. The first are our Values. Values are often reduced to lifeless platitudes written on a poster. We believe ours are different. We thought about what customers demand, care about, enjoy, and are excited to come back for, and we designed our Values to steer us in those directions. We then tasked our Creative team with branding and presenting our Values internally as thoughtfully as they would an external marketing campaign. We hope that effort is evident and that, more importantly, it breathes life into our Values so that they impact us every day.
To be held accountable to our Values, we must measure the quality of customer experiences we are delivering. One useful construct was to create a program we call the Ideal Customer Experience (“ICE”) to more granularly measure our performance at each step of a customer’s experience. We are far from achieving our internal ICE targets, yet we hold a life-to-date rating of 4.7 out of 5.0 stars. This is an enviable rating for any business, but we are not satisfied. We hold ourselves to higher standards and we are currently performing well shy of our goals. There is a lot of room for improvement.
It’s also important to celebrate the best among us. We recently held our first Halo Awards, where we pick nominees across the company who exemplify our values; in this instance “There are no sidelines.” This was a true awards show held at our home office with a Carvana employee pit band, a tuxedo-wearing host, and custom trophies. We had nominees from People Operations, Market Operations, Customer Experience, Engineering, and Logistics. The inaugural Halo Award went to Erick Griffin, a Vehicle Transporter from Texas who consistently goes above and beyond to transport our cars on time and avoid us missing a customer’s scheduled delivery date. While some groups, including our Vehicle Transporters, may never directly interact with our customers, they are critically important to our customers’ experiences - Erick has demonstrated again and again that he lives our Values and we are grateful for him. Recognizing efforts like Erick’s and the other nominees’ helps remind our entire organization of what really matters.

Summary
Thank you for taking the time to read over our shareholder letter. We are very pleased with the performance of the business in the first quarter and look forward to a strong remainder of the year. Even more importantly, we are excited to see the broader trends in the business emerging so clearly. In the first quarter, we crossed over the 5th anniversary of our first market launch in Atlanta. We have achieved a lot in a short period of time and in the next 5 years, we are confident we can achieve significantly more.
Sincerely,
Ernie Garcia, III, Chairman and CEO
Mark Jenkins, CFO
Appendix
Conference Call Details
Carvana will host a conference call today, May 9, 2018, at 5:30 p.m. EDT (2:30 p.m. PDT) to discuss financial results. To participate in the live call, analysts and investors should dial (877) 270-2148 or (412) 902-6510, and ask for “Carvana Earnings.” A live audio webcast of the conference call along with supplemental financial information will also be accessible on the company's website at investors.carvana.com. Following the webcast, an archived version will be available on the website for one year. A telephonic replay of the conference call will be available until May 16, 2018, by dialing (877) 344-7529 or (412) 317-0088 and entering passcode 10119224#.
Forward Looking Statements
This letter contains forward-looking statements within the meaning of the Private Securities Litigation Reform Act of 1995. These forward-looking statements reflect Carvana’s current expectations and projections with respect to, among other things, its financial condition, results of operations, plans, objectives, future performance, and business. These statements may be preceded by, followed by or include the words "aim," "anticipate," "believe," "estimate," "expect," "forecast," "intend," "likely," "outlook," "plan," "potential," "project," "projection," "seek," "can," "could," "may," "should," "would," "will," the negatives thereof and other words and terms of similar meaning.
Forward-looking statements include all statements that are not historical facts. Such forward-looking statements are subject to various risks and uncertainties. Accordingly, there are or will be important factors that could cause actual outcomes or results to differ materially from those indicated in these statements. Among these factors are risks related to the “Risk Factors” identified in our Annual Report on Form 10-K for 2017 and our Quarterly Report on Form 10-Q for Q1 2018.
There is no assurance that any forward-looking statements will materialize. You are cautioned not to place undue reliance on forward-looking statements, which reflect expectations only as of this date. Carvana does not undertake any obligation to publicly update or review any forward-looking statement, whether as a result of new information, future developments, or otherwise.
Use of Non-GAAP Financial Measures
As appropriate, we supplement our results of operations determined in accordance with U.S. generally accepted accounting principles (“GAAP”) with certain non-GAAP financial measurements that are used by management, and which we believe are useful to investors, as supplemental operational measurements to evaluate our financial performance. These measurements should not be considered in isolation or as a substitute for reported GAAP results because they may include or exclude certain items as compared to similar GAAP-based measurements, and such measurements may not be comparable to similarly-titled measurements reported by other companies. Rather, these measurements should be considered as an additional way of viewing aspects of our operations that provide a more complete understanding of our business. We strongly encourage investors to review our consolidated financial statements included in publicly filed reports in their entirety and not rely solely on any one, single financial measurement or communication.
Reconciliations of our non-GAAP measurements to their most directly comparable GAAP-based financial measurements are included at the end of this letter.
Investor Relations Contact Information: Mike Levin, investors@carvana.com
CARVANA CO. AND SUBSIDIARIES
CONDENSED CONSOLIDATED BALANCE SHEETS
(Unaudited)
(In thousands)
|
| | | | | | | |
| March 31, 2018 | | December 31, 2017 |
| ASSETS | | | |
| Current assets: | | | |
| Cash and cash equivalents | $ | 121,497 |
| | $ | 172,680 |
|
| Restricted cash | 18,428 |
| | 14,443 |
|
| Accounts receivable, net | 20,969 |
| | 14,105 |
|
| Finance receivables held for sale, net | 62,490 |
| | 45,564 |
|
| Vehicle inventory | 299,780 |
| | 227,446 |
|
| Other current assets | 18,159 |
| | 15,480 |
|
| Total current assets | 541,323 |
| | 489,718 |
|
| Property and equipment, net | 176,259 |
| | 148,681 |
|
| Other assets | 3,152 |
| | 2,738 |
|
| Total assets | $ | 720,734 |
| | $ | 641,137 |
|
| LIABILITIES & STOCKHOLDERS' EQUITY | | |
|
| Current liabilities: | | |
|
| Accounts payable and accrued liabilities | $ | 62,483 |
| | $ | 50,306 |
|
| Accounts payable due to related party | 2,602 |
| | 1,802 |
|
| Floor plan facility | 348,533 |
| | 248,792 |
|
| Current portion of long-term debt | 6,138 |
| | 5,131 |
|
| Total current liabilities | 419,756 |
| | 306,031 |
|
| Long-term debt, excluding current portion | 66,788 |
| | 48,469 |
|
| Other liabilities | 7,250 |
| | 7,093 |
|
| Total liabilities | 493,794 |
| | 361,593 |
|
| Commitments and contingencies |
|
| |
|
|
| Stockholders' equity: | | | |
| Class A Convertible Preferred Stock, $0.01 par value, $1,000 liquidation value per share - 100 shares authorized, issued and outstanding as of March 31, 2018 and December 31, 2017 | 98,507 |
| | 97,127 |
|
| Preferred stock, $0.01 par value - 50,000 shares authorized; none issued and outstanding as of March 31, 2018 and December 31, 2017 | — |
| | — |
|
| Class A common stock, $0.001 par value - 500,000 shares authorized; 19,516 and 18,096 shares issued and outstanding as of March 31, 2018 and December 31, 2017, respectively | 20 |
| | 18 |
|
| Class B common stock, $0.001 par value - 125,000 shares authorized; 113,323 and 114,664 shares issued and outstanding as of March 31, 2018 and December 31, 2017, respectively | 113 |
| | 115 |
|
| Additional paid in capital | 41,603 |
| | 41,375 |
|
| Accumulated deficit | (19,942 | ) | | (12,899 | ) |
| Total stockholders' equity attributable to Carvana Co. | 120,301 |
| | 125,736 |
|
| Non-controlling interests | 106,639 |
| | 153,808 |
|
| Total stockholders' equity | 226,940 |
| | 279,544 |
|
| Total liabilities & stockholders' equity | $ | 720,734 |
| | $ | 641,137 |
|
CARVANA CO. AND SUBSIDIARIES
CONDENSED CONSOLIDATED STATEMENTS OF OPERATIONS
(Unaudited)
(In thousands, except per share amounts)
|
| | | | | | | |
| | Three Months Ended March 31, |
| | 2018 | | 2017 |
| Sales and operating revenues: | | | |
| Used vehicle sales, net | $ | 334,056 |
| | $ | 148,382 |
|
| Wholesale vehicle sales | 10,133 |
| | 5,726 |
|
| Other sales and revenues, including $4,111 and $1,758, respectively, from related parties | 16,233 |
| | 4,965 |
|
| Net sales and operating revenues | 360,422 |
| | 159,073 |
|
| Cost of sales | 326,188 |
| | 149,327 |
|
| Gross profit | 34,234 |
| | 9,746 |
|
| Selling, general and administrative expenses | 83,186 |
| | 45,908 |
|
| Interest expense, including $0 and $141, respectively, to related parties | 3,541 |
| | 2,059 |
|
| Other expense (income), net | 179 |
| | 218 |
|
| Net loss before income taxes | (52,672 | ) | | (38,439 | ) |
| Income tax provision | — |
| | — |
|
| Net loss | (52,672 | ) | | (38,439 | ) |
| Net loss attributable to non-controlling interests | 45,629 |
| | — |
|
| Net loss attributable to Carvana Co. | (7,043 | ) | | (38,439 | ) |
| Dividends on Class A convertible preferred stock | (1,345 | ) | | — |
|
| Accretion of beneficial conversion feature on Class A convertible preferred stock | (1,380 | ) | | — |
|
| Net loss attributable to Class A common stockholders | $ | (9,768 | ) | | $ | (38,439 | ) |
Net loss per share of Class A common stock, basic and diluted(1) | $ | (0.53 | ) | | $ | (0.28 | ) |
Weighted-average shares of Class A common stock, basic and diluted(1)(2) | 18,346 |
| | 15,000 |
|
(1) Amounts for periods prior to the initial public offering have been retrospectively adjusted to give effect to 15.0 million shares of Class A common stock issued in the initial public offering and the Organizational Transactions.
(2) Weighted-average shares of Class A common stock outstanding have been adjusted for unvested restricted stock awards.
CARVANA CO. AND SUBSIDIARIES
CONDENSED CONSOLIDATED STATEMENTS OF CASH FLOWS
(Unaudited)
(In thousands) |
| | | | | | | |
| | Three Months Ended March 31, |
| | 2018 | | 2017 |
| Cash Flows from Operating Activities: | | | |
| Net loss | $ | (52,672 | ) | | $ | (38,439 | ) |
| Adjustments to reconcile net loss to net cash used in operating activities: | | | |
| Depreciation and amortization expense | 4,605 |
| | 2,061 |
|
| Loss on disposal of property and equipment | 103 |
| | 200 |
|
| Provision for bad debt and finance receivable allowance | 597 |
| | 285 |
|
| Gain on loan sales | (9,891 | ) | | (2,942 | ) |
| Equity-based compensation expense | 1,510 |
| | 158 |
|
| Amortization and write-off of debt issuance costs | 323 |
| | 181 |
|
| Originations of finance receivables | (228,595 | ) | | (96,528 | ) |
| Proceeds from sale of finance receivables | 220,357 |
| | 99,144 |
|
| Changes in assets and liabilities: | | | |
| Accounts receivable | (6,969 | ) | | (2,470 | ) |
| Vehicle inventory | (72,030 | ) | | (14,044 | ) |
| Other current assets | (2,998 | ) | | 292 |
|
| Other assets | 297 |
| | (2,856 | ) |
| Accounts payable and accrued liabilities | 12,957 |
| | (2,690 | ) |
| Accounts payable to related party | 800 |
| | 2,508 |
|
| Other liabilities | 157 |
| | 2,254 |
|
| Net cash used in operating activities | (131,449 | ) | | (52,886 | ) |
| Cash Flows from Investing Activities: | | | |
| Purchases of property and equipment | (28,011 | ) | | (18,556 | ) |
| Net cash used in investing activities | (28,011 | ) | | (18,556 | ) |
| Cash Flows from Financing Activities: | | | |
| Proceeds from floor plan facility | 393,119 |
| | 147,390 |
|
| Payments on floor plan facility | (293,378 | ) | | (122,967 | ) |
| Proceeds from Verde Credit Facility | — |
| | 20,000 |
|
| Proceeds from long-term debt | 15,608 |
| | — |
|
| Payments on long-term debt | (1,309 | ) | | (260 | ) |
| Payments of debt issuance costs, including $0 and $1,000 to related parties, respectively | (141 | ) | | (1,000 | ) |
| Proceeds from exercise of stock options | 63 |
| | — |
|
| Tax withholdings related to restricted stock awards | (160 | ) | | — |
|
| Dividends paid | (1,528 | ) | | — |
|
| Payments of costs related to issuance of Class A Convertible Preferred Stock | (12 | ) | | — |
|
| Payments of costs related to initial public offering | — |
| | (1,376 | ) |
| Net cash provided by financing activities | 112,262 |
| | 41,787 |
|
| Net decrease in cash, cash equivalents and restricted cash | (47,198 | ) | | (29,655 | ) |
| Cash, cash equivalents and restricted cash at beginning of period | 187,123 |
| | 49,450 |
|
| Cash, cash equivalents and restricted cash at end of period | $ | 139,925 |
| | $ | 19,795 |
|
CARVANA CO. AND SUBSIDIARIES
RECONCILIATION OF GAAP TO NON-GAAP FINANCIAL MEASURES
(Unaudited)
(In thousands, except per share amounts)
Adjusted Net Loss and Adjusted Net Loss per Share
Adjusted net loss and adjusted net loss per share are supplemental measures of operating performance that do not represent and should not be considered alternatives to net loss and net loss per share, as determined under GAAP. We believe that by assuming the full exchange of all outstanding LLC Units, adjusted net loss and adjusted net loss per share supplement GAAP measures and enable us and our investors to more effectively evaluate our performance period-over-period and relative to our competitors that have different organizational and tax structures because the assumption eliminates the effect of any changes in net income attributable to Carvana Co. driven by increases in our ownership of Carvana Group, LLC, which are unrelated to our operating performance. A reconciliation of adjusted net loss to net loss attributable to Carvana Co., the most directly comparable GAAP measure, and the computation of adjusted net loss per share are as follows (in thousands, except per share amounts):
|
| | | | | |
| | Three Months Ended March 31, 2018 |
| Numerator: | |
| | Net loss attributable to Carvana Co. | $ | (7,043 | ) |
| | Net loss attributable to non-controlling interests | (45,629 | ) |
| | Dividends on Class A convertible preferred stock | (1,345 | ) |
| | Accretion of beneficial conversion feature on Class A convertible preferred stock | (1,380 | ) |
| | Adjusted net loss attributable to Carvana Co. Class A common stock | $ | (55,397 | ) |
| | | | |
| Denominator: | |
| | Weighted-average shares of Class A common stock outstanding(1) | 18,346 |
|
| | Adjustments: | |
| | | Weighted-average assumed exchange of LLC Units for shares of Class A common stock | 118,858 |
|
| | Adjusted shares of Class A common stock outstanding | 137,204 |
|
| Adjusted net loss per share | $ | (0.40 | ) |
(1) Excludes approximately 0.4 million nonvested restricted stock awards and units and 0.8 million vested and nonvested stock options outstanding at March 31, 2018, because they were determined to be anti-dilutive.
CARVANA CO. AND SUBSIDIARIES
RECONCILIATION OF GAAP TO NON-GAAP FINANCIAL MEASURES (continued)
(Unaudited)
(In thousands, except per share amounts)
EBITDA and EBITDA Margin
EBITDA and EBITDA Margin are non-GAAP supplemental measures of operating performance that do not represent and should not be considered an alternative to net loss or cash flow from operations, as determined by GAAP. EBITDA is defined as net loss before interest expense, income tax expense and depreciation and amortization expense. EBITDA Margin is EBITDA as a percentage of total revenues. We use EBITDA to measure the operating performance of our business and EBITDA Margin to measure our operating performance relative to our total revenues. We believe that EBITDA and EBITDA Margin are useful measures to us and to our investors because they exclude certain financial and capital structure items that we do not believe directly reflect our core operations and may not be indicative of our recurring operations, in part because they may vary widely across time and within our industry independent of the performance of our core operations. We believe that excluding these items enables us to more effectively evaluate our performance period-over-period and relative to our competitors. EBITDA and EBITDA Margin may not be comparable to similarly titled measures provided by other companies due to potential differences in methods of calculations. A reconciliation of EBITDA to net loss, the most directly comparable GAAP measure, and calculation of EBITDA Margin is as follows (in thousands):
|
| | | | | | | | | | | | | | | | | | | |
| | Three Months Ended |
| | Mar 31, 2017 | | Jun 30, 2017 | | Sep 30, 2017 | | Dec 31, 2017 | | Mar 31, 2018 |
| Net loss | $ | (38,439 | ) | | $ | (38,870 | ) | | $ | (39,769 | ) | | $ | (47,238 | ) | | $ | (52,672 | ) |
| Depreciation and amortization expense | 2,061 |
| | 2,584 |
| | 3,101 |
| | 3,822 |
| | 4,605 |
|
| Interest expense | 2,059 |
| | 2,507 |
| | 838 |
| | 2,255 |
| | 3,541 |
|
| EBITDA | $ | (34,319 | ) | | $ | (33,779 | ) | | $ | (35,830 | ) | | $ | (41,161 | ) | | $ | (44,526 | ) |
| | | | | | | | | | |
| Total revenues | $ | 159,073 |
| | $ | 209,365 |
| | $ | 225,379 |
| | $ | 265,053 |
| | $ | 360,422 |
|
| Net Loss Margin | (24.2 | )% | | (18.6 | )% | | (17.6 | )% | | (17.8 | )% | | (14.6 | )% |
| EBITDA Margin | (21.6 | )% | | (16.1 | )% | | (15.9 | )% | | (15.5 | )% | | (12.4 | )% |
|
| | | | | | | | | | | | | | | |
| | Years Ended |
| | 2014 | | 2015 | | 2016 | | 2017 |
| Net loss | $ | (15,238 | ) | | $ | (36,780 | ) | | $ | (93,112 | ) | | $ | (164,316 | ) |
| Depreciation and amortization expense | 1,705 |
| | 2,800 |
| | 4,658 |
| | 11,568 |
|
| Interest expense | 108 |
| | 1,412 |
| | 3,587 |
| | 7,659 |
|
| EBITDA | $ | (13,425 | ) | | $ | (32,568 | ) | | $ | (84,867 | ) | | $ | (145,089 | ) |
| | | | | | | | |
| Total revenues | $ | 41,679 |
| | $ | 130,392 |
| | $ | 365,148 |
| | $ | 858,870 |
|
| Net Loss Margin | (36.6 | )% | | (28.2 | )% | | (25.5 | )% | | (19.1 | )% |
| EBITDA Margin | (32.2 | )% | | (25.0 | )% | | (23.2 | )% | | (16.9 | )% |
CARVANA CO. AND SUBSIDIARIES
RESULTS OF OPERATIONS
(Unaudited)
(In thousands, except per unit amounts)
|
| | | | | | | | | | | |
| | | Three Months Ended March 31, | | |
| | | 2018 | | 2017 | | Change |
| | | | | | | |
| | | (dollars in thousands, except per unit amounts) | | |
| Net sales and operating revenues: | | | | | | |
| Used vehicle sales, net | | $ | 334,056 |
|
| $ | 148,382 |
| | 125.1 | % |
| Wholesale vehicle sales | | 10,133 |
|
| 5,726 |
| | 77.0 | % |
Other sales and revenues (1) | | 16,233 |
|
| 4,965 |
| | 226.9 | % |
| Total net sales and operating revenues | | $ | 360,422 |
|
| $ | 159,073 |
| | 126.6 | % |
| Gross profit: | |
|
|
| | |
| Used vehicle gross profit | | $ | 16,646 |
|
| $ | 4,626 |
| | 259.8 | % |
| Wholesale vehicle gross profit | | 1,355 |
|
| 155 |
| | 774.2 | % |
Other gross profit (1) | | 16,233 |
|
| 4,965 |
| | 226.9 | % |
| Total gross profit | | $ | 34,234 |
|
| $ | 9,746 |
| | 251.3 | % |
| Market information: | |
|
|
| | |
| Markets, beginning of period | | 44 |
|
| 21 |
| | 109.5 | % |
| Market launches | | 12 |
|
| 2 |
| | 500.0 | % |
| Markets, end of period | | 56 |
|
| 23 |
| | 143.5 | % |
| Unit sales information: | |
|
|
| | |
| Used vehicle unit sales | | 18,464 |
| | 8,334 |
| | 121.6 | % |
| Wholesale vehicle unit sales | | 2,342 |
| | 1,288 |
| | 81.8 | % |
| Per unit selling prices: | |
|
|
| | |
| Used vehicles | | $ | 18,092 |
|
| $ | 17,804 |
| | 1.6 | % |
| Wholesale vehicles | | $ | 4,327 |
|
| $ | 4,446 |
| | (2.7 | )% |
Per unit gross profit: (2) | |
|
|
| | |
| Used vehicle gross profit | | $ | 902 |
|
| $ | 555 |
| | 62.5 | % |
| Wholesale vehicle gross profit | | $ | 579 |
|
| $ | 120 |
| | 382.5 | % |
| Other gross profit | | $ | 879 |
|
| $ | 596 |
| | 47.5 | % |
| Total gross profit | | $ | 1,854 |
|
| $ | 1,169 |
| | 58.6 | % |
| | | | | | | |
| (1) Includes $4,111 and $1,758 of other sales and revenues from related parties for the three months ended March 31, 2018 and 2017, respectively. |
| (2) All gross profit per unit amounts are per used vehicle sold, except wholesale vehicle gross profit, which is per wholesale vehicle sold. |
Components of SG&A
(Unaudited)
|
| | | | | | | | | | | | | | | | | | | | |
| | | Three Months Ended |
| | | Mar 31, 2017 | | Jun 30, 2017 | | Sep 30, 2017 | | Dec 31, 2017 | | Mar 31, 2018 |
| | | | | | | | | | | |
| | | (in thousands) |
Compensation and benefits (1) | | $ | 16,303 |
| | $ | 18,789 |
| | $ | 19,404 |
| | $ | 22,219 |
| | $ | 24,987 |
|
| Advertising expense | | 11,439 |
| | 12,385 |
| | 15,475 |
| | 16,398 |
| | 25,009 |
|
Market occupancy costs (2) | | 983 |
| | 1,424 |
| | 1,734 |
| | 2,081 |
| | 2,510 |
|
Logistics (3) | | 2,808 |
| | 3,116 |
| | 3,905 |
| | 4,555 |
| | 6,318 |
|
Other costs (4) | | 14,375 |
| | 16,297 |
| | 18,158 |
| | 21,552 |
| | 24,362 |
|
| Total | | $ | 45,908 |
| | $ | 52,011 |
| | $ | 58,676 |
| | $ | 66,805 |
| | $ | 83,186 |
|
| | | | | | | | | | | |
| (1) Compensation and benefits includes all payroll and related costs, including benefits, payroll taxes and equity-based compensation, except those related to preparing vehicles for sale, which are included in cost of sales. |
| (2) Market occupancy costs includes rent, utilities, security, repairs and maintenance and depreciation of buildings and improvements, including vending machines and fulfillment centers, excluding the portion related to reconditioning vehicles, which is included in cost of sales, and excluding the portion related to corporate occupancy. |
| (3) Logistics includes fuel, maintenance and depreciation related to operating our own transportation fleet and third party transportation fees, except the portion related to inbound transportation, which is included in cost of sales. |
| (4) Other costs include all other selling, general and administrative expenses such as IT expenses, corporate occupancy, professional services and insurance, limited warranty and title and registration. |