Exhibit 99.1
Dear Shareholders,
We’re pleased to announce our second quarter 2018 results. This quarter we continued our trend of delivering exceptional customer experiences while rapidly growing and improving our unit economics. Compared to Q2 2017, we grew retail units sold by 111%, we grew total revenue by 127%, and we increased total gross profit by 206%. Maintaining triple-digit growth at our scale reflects both the highly differentiated nature of our business model and the tremendous efforts of our team.
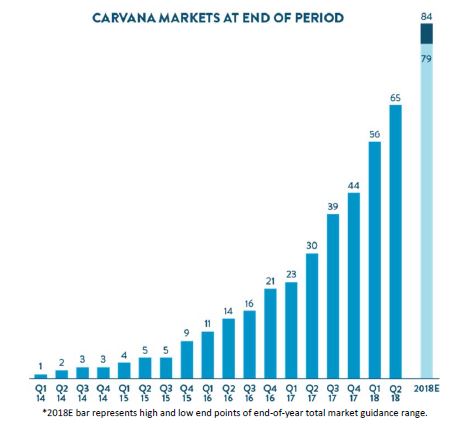
Units in Q2 exceeded our guidance as we continue to see expansion in market penetration in existing markets and quicker ramps in new markets. After opening 9 new markets in the quarter we now offer Carvana delivery to over half of the U.S. population.
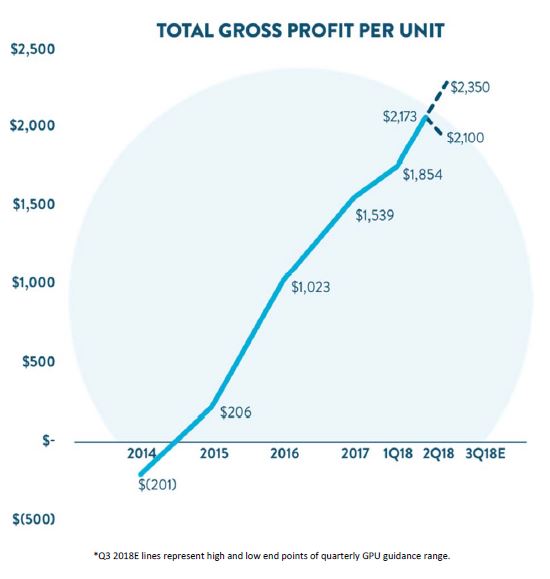
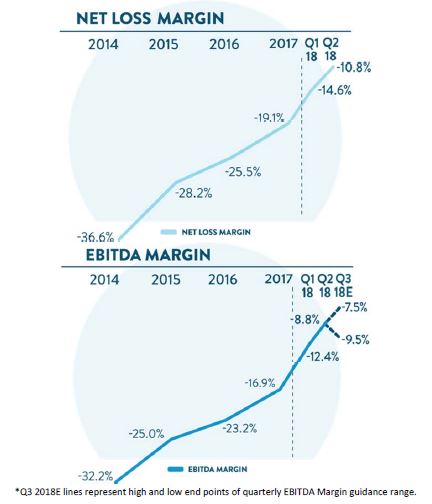
This quarter we achieved record total GPU of $2,173 giving us a clear line of sight to our $3,000 midterm goal and the path to profitability. Our GPU gains in Q2 along with further operating leverage in the business drove net loss margins to (10.8%) from (18.6%) in Q2 2017, and EBITDA margin to (8.8%) from (16.1%) in Q2 2017. We look forward to discussing our Q2 results and our outlook on today’s conference call.
Summary of Q2 2018 Results
Q2 2018: All financial comparisons stated below are versus Q2 2017, unless otherwise noted. Complete financial tables appear at the end of this letter.
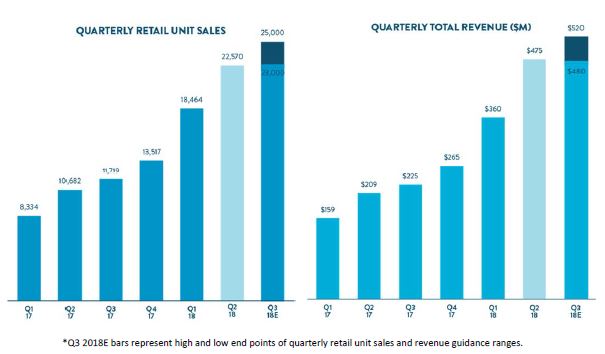
• Retail units sold totaled 22,570, an increase of 111%
• Revenue totaled $475.3 million, an increase of 127%
• Total gross profit was $49.0 million, an increase of 206%
• Total gross profit per unit was $2,173, an increase of $672
• Net loss was $51.3 million, an increase of 32%
• EBITDA margin was (8.8%), an improvement from (16.1%)
• GAAP basic and diluted net loss per Class A share was $0.41 based on 27.8 million shares of Class A common stock outstanding
• Adjusted net loss per Class A share, a non-GAAP measure, was $0.37, based on 142.7 million adjusted shares of Class A common stock outstanding, assuming the exchange of all outstanding LLC Units for shares of Class A common stock
• We opened 9 new markets and 4 vending machines during this quarter, bringing our end-of quarter totals to 65 and 12, respectively
• We lowered our average days to sale to 66, from 70 last quarter and 105 in Q2 2017
Recent Events
We would also like to highlight several recent notable accomplishments:
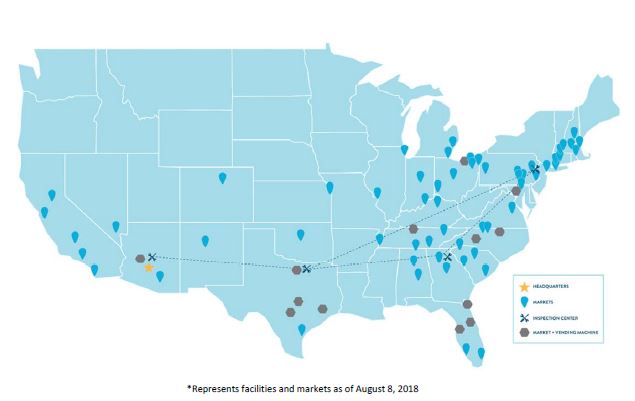
• Thus far in Q3 we have opened 8 markets and 1 vending machine, bringing our totals as of August 8, 2018, to 73 and 13, respectively
• We completed our planned takeover of the Philadelphia and Dallas inspection and reconditioning centers (IRCs) from DriveTime, making us the sole occupant of all four of our IRCs.
• We began construction of our fifth IRC near Indianapolis. This facility will markedly improve our ability to efficiently serve growing customer demand in the Midwest.
• On August 7, 2018, we earned a fee of approximately $4.0 million for facilitating the refinancing of a pool of Carvana originated finance receivables that we had previously sold. The fee will constitute Other Revenue in Q3 that will add about $160-$170 to Other GPU in the quarter. See “Monetizing Finance Receivables” section for additional detail.
Q3 and 2018 Outlook
We anticipate continued rapid growth in units and revenue for both Q3 and the full year 2018 as we increase penetration in our existing markets, open new markets, and broaden our brand awareness with national advertising and additional vending machines. That rapid unit growth will be coupled with continued progress on GPU while also demonstrating operating leverage.
Our Q3 guidance is as follows. All financial comparisons stated below are versus Q3 2017, unless otherwise noted.
• Retail unit sales of 23,000 – 25,000, an increase of 96% – 113%
• Total revenue of $480 million – $520 million, an increase of 113% – 131%
• Total gross profit per unit of $2,100 – $2,350, an increase from $1,742
• EBITDA margin of (9.5%) – (7.5%), an improvement from (15.9%)
Our FY 2018 guidance is as follows. We are raising our guidance for units, revenue, and GPU, while fine tuning our expectations for EBITDA margin to allow for additional investments in scalability. After a strong first half of market launches we expect to be at the high end of our market openings range for the year. All financial comparisons stated below are versus FY 2017, unless otherwise noted.
• Retail unit sales of 91,500 – 95,500, an increase of 107% – 116%
• Revenue of $1.85 billion – $1.95 billion, an increase of 115% – 127%
• Total gross profit per unit of $2,000 – $2,200, an increase from $1,539
• EBITDA margin toward the higher loss end of our expected (9.0%) – (7.0%) range, an improvement from (16.9%)
• Market openings at the high end of our 35 – 40 range, an increase from 23 market openings in 2017, bringing our end-of-year total towards the high end of 79 – 84 markets and our total U.S. population coverage to at least 57%
For more information regarding the non-GAAP financial measures discussed in this letter, please see the reconciliations of our non-GAAP measurements to their most directly comparable GAAP-based financial measurements included at the end of this letter. Guidance for EBITDA margin excludes depreciation and amortization expense and interest expense. We have not reconciled EBITDA guidance to GAAP net loss as a result of the uncertainty regarding, and the potential variability of, interest expense. Accordingly, a reconciliation of the non-GAAP financial measure guidance to the corresponding GAAP measure is not available without unreasonable effort. Depreciation and amortization expense, which is a component of the reconciliation between EBITDA and GAAP net loss, is expected to be between 1.1% and 1.4% of total revenues for both Q3 2018 and FY 2018.
Expansion
We launched 9 new markets in the second quarter, bringing our total markets to 65 as of June 30, 2018. Our Q2 markets continued to broaden the coverage of the Carvana network, as we launched in two significant population centers: New York City and the Bay Area with San Jose. This increases the total percentage of the U.S. population our markets collectively serve to 52.8%, up from 45.8% at the end of Q1 2018. We also opened a record 4 vending machines in the quarter in Charlotte, Washington DC, Orlando, and our home market of Phoenix. With our growing population coverage, additional vending machines, and significant shift into national advertising, the Carvana brand is reaching more people than ever before.
In addition, we secured a site near Indianapolis for our fifth IRC. Construction is underway and we have already assembled a leadership team to run the facility. Similar to our other four IRCs, at full utilization this facility will be capable of inspecting and reconditioning 50,000 vehicles a year. After the successful ramp of our Phoenix IRC in 2017 we have a repeatable playbook to launch these facilities and expect to be producing retail vehicles at the new IRC around the new year. In addition to increasing our overall vehicle production capacity, Indianapolis provides a key logistical center for us to better serve many of our Midwest markets that currently face extended delivery times given their distance from our existing facilities.
All else constant, opening IRCs reduces the distance we must ship a vehicle both when we acquire it and when we retail it. The reduction in distances combined with increasing utilization on our growing logistics network will create efficiencies that drive down expenses over time. We will continue to open additional IRCs and add to our hauler fleet in the future to stay ahead of customer demand and improve our national coverage.
For a complete list of our market opening history, estimated populations, and estimated total industry used vehicle sales by market please see: investors.carvana.com/resources/investor-materials
Investing for Scalability
Our primary goal is to deliver customers the best car buying experience possible, and our success in that mission thus far has generated extremely robust demand. While retail units grew 111% in the second quarter, we saw 142% growth in monthly unique visitors (MUV) to the website, indicating that demand continues to outstrip our ability to fulfill it. To maintain our high standards and grow units at these levels, we plan to better equip the business to absorb increased volumes gracefully. While Q3 and Q4 are always key investment periods for our business, this year we expect to commit greater resources to catching up to and getting in front of accelerating demand now and during the first half of 2019.
One element of this is increasing the flexibility of our operations to better handle our dynamic needs. For example, we are building out dedicated flex teams that can be deployed around the country to support our market operations as needed. Similarly, we intend to prioritize technology investments in process automation and tools to improve efficiency on our more manual processes. These investments will push us toward the higher loss end of our EBITDA guidance for 2018, but should put us in a better position to fulfill demand while ensuring that we maintain and improve our customer experiences.
Purchasing Vehicles Directly from Our Customers
Our core mission is to create a better way to buy a car. To truly build out a comprehensive and seamless online automotive retail experience, we are now focusing more on creating a better way to sell or trade a car as well. Though this is an emerging business line, the early developments are very encouraging. In Q2, vehicles purchased directly from our customers, both with and without a retail transaction, increased 264% compared to Q2 2017 and 92% sequentially.
Our team has done an exceptional job growing this business, nurturing customer interest, and leveraging our growing site traffic and brand. We believe this is all facilitated by an easy online process for selling or trading a car. We provide customers a firm offer for their vehicle online in just minutes. A customer need only provide their license plate or VIN and answer a few short questions, with no pictures required. This simple process is built off our core vehicle valuation algorithms that are constantly improving with machine learning and the vehicle data expertise we got from Carlypso. If the customer is trading in a car, we simply build it into their vehicle financing deal allowing them to search our entire inventory by monthly payment with trade-in value incorporated. If a customer is selling us their car, without purchasing one from us, we bring the check to their home at their convenience and pick up the vehicle. Either way, we provide a fair and hassle free experience that puts the customer experience first.
When we purchase vehicles from customers we either sell them at wholesale auction, which flows through our wholesale revenue line, or we recondition them for our retail business, in which case they contribute to retail GPU, as customer sourced vehicles are generally more profitable than the same vehicles sourced from auction. In the second quarter, the portion of retailed vehicles sourced from customers reached 11%, compared to 6% just last quarter. As we continue to test and iterate on this business, its growth and margins are likely to be variable in the near term, but our early wins give us confidence in the enormous long term opportunity that will come from creating a better way to sell and trade a car.
Monetizing Finance Receivables
On August 7, 2018, we earned a fee of approximately $4.0 million for facilitating the refinancing of a $236 million pool of Carvana originated finance receivables that we had previously sold. The refinancing provides the purchaser with more efficient financing than at the time of their initial purchase, and we are sharing in the value created. This transaction’s fundamental economics are patterned off of, and closely resemble, transactions regularly completed by certain large online lending platforms and other originators.
The fee will flow through our “Other Revenue” line item and increase our third quarter Other GPU by $160-$170. Measured on a “per receivable” refinanced basis, this Other Revenue would amount to approximately $275 per loan, and we believe there is additional opportunity to increase this in the future. In addition to the Q3 transaction, we expect to execute a similar arrangement in Q4 that will also add to Other GPU in Q4.
We believe this transaction demonstrates just one way we can better monetize the finance receivables originated on our website. As we grow, we expect to facilitate more of these refinancing transactions. As our monetization strategy evolves over time, we will update you with more precise expectations for how often and at what size these or similar transactions are likely to occur.
Management Objectives
As discussed in previous shareholder letters, our management team remains focused on delivering an exceptional and unparalleled customer experience while simultaneously growing the business rapidly and achieving our financial objectives. We firmly believe wowing the customer is the core of our model and drives all other metrics. To realize our long-term vision, our three primary financial objectives remain unchanged: (1) Grow Retail Units and Revenue; (2) Increase Total Gross Profit Per Unit; and (3) Demonstrate Operating Leverage.
Objective #1: Grow Retail Units and Revenue
We again recorded triple-digit growth in Q2, as retail units sold increased to 22,570, up 111% from 10,682 in the prior year period. Revenue in Q2 grew to $475.3 million, up 127% from $209.4 million in Q2 2017. Our growth in the second quarter was broad based, driven by gains across our markets nationwide, reflecting increasing demand for our offering and the efficiency of our expansion model. Revenue growth was partially buoyed by an increase in average selling prices (ASP) in Q2, which was driven in part by higher demand for more expensive vehicles and relatively faster turns of less expensive vehicles in the first quarter which led to lower availability in the second quarter. We expect ASPs to moderate as our inventory mix normalizes.
Despite all this growth, Carvana remains at an extremely early stage in attacking the opportunity in front of us, and while demand has been robust, consumer awareness and acceptance of our offering is still nascent, which has us extremely excited about the future. As discussed earlier, we are focused on optimally positioning our business to satisfy demand and scale while continuing to take the customer experience to new levels.
Objective #2: Increase Total Gross Profit Per Unit
We achieved our highest ever quarterly total GPU in Q2 2018 of $2,173 per unit, an increase of $672 versus Q2 2017, giving us a clear line of sight to achieving our $3,000 mid-term target.
• Retail – Retail GPU was $1,180 vs. $765 in Q2 2017. Our gains in retail vehicle GPU were primarily driven by lower average days to sale, which declined from 105 to 66.
• Wholesale – Wholesale GPU was $73 vs. $25 in Q2 2017. Our gains in wholesale GPU were primarily driven by technology and process improvements in bidding for and subsequently selling wholesale cars. Wholesale gross profit per wholesale unit sold was $452, vs. $169 in Q2 2017, while we simultaneously achieved record wholesale units sold (3,658 wholesale units, +132% year over year).
• Other – Other GPU was $919 vs. $711 in Q2 2017. Our gains in Other GPU were driven by recording a full quarter of selling GAP waiver coverage, making improvements in VSC, and earning higher upfront premiums on the sale of our finance receivables.
Objective #3: Demonstrate Operating Leverage
In Q2 we continued to invest in infrastructure and staffing to support the growth of the business. Nevertheless, we achieved solid operating leverage from our 111% unit sales growth. Total SG&A as a percent of revenue improved to 20.1% in Q2, compared to 24.8% in Q2 2017 and 23.1% last quarter. Notwithstanding our investments to support triple-digit growth and opening 35 new markets over the last year, we reduced non-advertising SG&A by $658 per unit.
Our customer acquisition costs by cohort continue to improve. Our newer markets are opening with lower initial CACs, our older cohorts continue to progress towards the CAC from our oldest and largest market, Atlanta, and Atlanta continues to demonstrate leverage in advertising. All of this gives us confidence in leveraging advertising expense over time and that our brand is only gaining strength.
Our net loss for the quarter was $51.3 million, as compared to $38.9 million in Q2 2017 and $52.7 million last quarter.
We consider EBITDA margin an important measure of the leverage in our business. EBITDA margin in Q2 2018 was (8.8%), an improvement from (16.1%) in Q2 2017 and (12.4%) last quarter. Our operating leverage was primarily driven by leveraging our fixed costs in both compensation and Other SG&A. A reconciliation of EBITDA, a non-GAAP measure, to net loss, its most directly comparable GAAP measure, is provided in the appendix.
Halo Awards
We recently held our second Halo Awards ceremony focusing on one of our core company values: “Your Next Customer May Be Your Mom.” By honoring employees from across the company for living our customer-centric values, we are able to continually reinforce our culture across the business. Of course, given the value, we also made sure to invite all of the award winners’ moms to join us for the ceremony at home office and share in the celebration.
Summary
Thank you for taking the time to read our shareholder letter. We are delivering on our promise to give customers the best experience available when buying a car, and that experience continues to power the business’s growth. We are pleased with our performance this quarter and, even more importantly, that we continue to lay the foundation for the many exciting years in front of us.
Sincerely,
Ernie Garcia, III, Chairman and CEO
Mark Jenkins, CFO
Appendix
Conference Call Details
Carvana will host a conference call today, August 8, 2018, at 5:30 p.m. EDT (2:30 p.m. PDT) to discuss financial results. To participate in the live call, analysts and investors should dial (833) 255-2830 or (412) 902-6715, and ask for “Carvana Earnings.” A live audio webcast of the conference call along with supplemental financial information will also be accessible on the company's website at investors.carvana.com. Following the webcast, an archived version will be available on the website for one year. A telephonic replay of the conference call will be available until August 15, 2018, by dialing (877) 344-7529 or (412) 317-0088 and entering passcode 10122530#.
Forward Looking Statements
This letter contains forward-looking statements within the meaning of the Private Securities Litigation Reform Act of 1995. These forward-looking statements reflect Carvana’s current expectations and projections with respect to, among other things, its financial condition, results of operations, plans, objectives, future performance, and business. These statements may be preceded by, followed by or include the words "aim," "anticipate," "believe," "estimate," "expect," "forecast," "intend," "likely," "outlook," "plan," "potential," "project," "projection," "seek," "can," "could," "may," "should," "would," "will," the negatives thereof and other words and terms of similar meaning.
Forward-looking statements include all statements that are not historical facts. Such forward-looking statements are subject to various risks and uncertainties. Accordingly, there are or will be important factors that could cause actual outcomes or results to differ materially from those indicated in these statements. Among these factors are risks related to the “Risk Factors” identified in our Annual Report on Form 10-K for 2017 and our Quarterly Report on Form 10-Q for Q2 2018.
There is no assurance that any forward-looking statements will materialize. You are cautioned not to place undue reliance on forward-looking statements, which reflect expectations only as of this date. Carvana does not undertake any obligation to publicly update or review any forward-looking statement, whether as a result of new information, future developments, or otherwise.
Use of Non-GAAP Financial Measures
As appropriate, we supplement our results of operations determined in accordance with U.S. generally accepted accounting principles (“GAAP”) with certain non-GAAP financial measurements that are used by management, and which we believe are useful to investors, as supplemental operational measurements to evaluate our financial performance. These measurements should not be considered in isolation or as a substitute for reported GAAP results because they may include or exclude certain items as compared to similar GAAP-based measurements, and such measurements may not be comparable to similarly-titled measurements reported by other companies. Rather, these measurements should be considered as an additional way of viewing aspects of our operations that provide a more complete understanding of our business. We strongly encourage investors to review our consolidated financial statements included in publicly filed reports in their entirety and not rely solely on any one, single financial measurement or communication.
Reconciliations of our non-GAAP measurements to their most directly comparable GAAP-based financial measurements are included at the end of this letter.
Investor Relations Contact Information: Mike Levin, investors@carvana.com
CARVANA CO. AND SUBSIDIARIES
CONDENSED CONSOLIDATED BALANCE SHEETS
(Unaudited)
(In thousands)
| | | | | | | | | | | |
| June 30, 2018 | | December 31, 2017 |
| ASSETS | | | |
| Current assets: | | | |
| Cash and cash equivalents | $ | 199,192 | | $ | 172,680 |
| Restricted cash | 18,356 | | 14,443 |
| Accounts receivable, net | 23,573 | | 14,105 |
| Finance receivables held for sale, net | 77,128 | | 45,564 |
| | | |
| | | |
| Vehicle inventory | 302,989 | | 227,446 |
| Other current assets | 22,255 | | 15,480 |
| Total current assets | 643,493 | | 489,718 |
| Property and equipment, net | 217,414 | | 148,681 |
| Intangible assets, net | 9,616 | | — |
| Goodwill | 6,868 | | — |
| Other assets | 4,372 | | 2,738 |
| Total assets | $ | 881,763 | | $ | 641,137 |
| LIABILITIES & STOCKHOLDERS' EQUITY | | | |
| Current liabilities: | | | |
| Accounts payable and accrued liabilities | $ | 81,880 | | $ | 50,306 |
| Accounts payable due to related party | 3,193 | | 1,802 |
| Floor plan facility | 347,087 | | 248,792 |
| Current portion of long-term debt | 6,664 | | 5,131 |
| Total current liabilities | 438,824 | | 306,031 |
| Long-term debt, excluding current portion | 76,873 | | 48,469 |
| Other liabilities | 6,957 | | 7,093 |
| Total liabilities | 522,654 | | 361,593 |
| Commitments and contingencies | | | |
| | | |
| Stockholders' equity: | | | |
| | | |
| Class A Convertible Preferred Stock, $0.01 par value, $1,000 liquidation value per share - 100 shares authorized, issued and outstanding as of June 30, 2018 and December 31, 2017 | 98,507 | | 97,127 |
| Preferred stock, $0.01 par value - 50,000 shares authorized; none issued and outstanding as of June 30, 2018 and December 31, 2017 | — | | — |
| Class A common stock, $0.001 par value - 500,000 shares authorized; 34,242 and 18,096 shares issued and outstanding as of June 30, 2018 and December 31, 2017, respectively | 34 | | 18 |
| Class B common stock, $0.001 par value - 125,000 shares authorized; 105,817 and 114,664 shares issued and outstanding as of June 30, 2018 and December 31, 2017, respectively | 106 | | 115 |
| Additional paid in capital | 95,008 | | 41,375 |
| Accumulated deficit | (29,907) | | (12,899) |
| Total stockholders' equity attributable to Carvana Co. | 163,748 | | 125,736 |
| Non-controlling interests | 195,361 | | 153,808 |
| Total stockholders' equity | 359,109 | | 279,544 |
| Total liabilities & stockholders' equity | $ | 881,763 | | $ | 641,137 |
| | | |
CARVANA CO. AND SUBSIDIARIES
CONDENSED CONSOLIDATED STATEMENTS OF OPERATIONS
(Unaudited)
(In thousands, except per share amounts)
| | | | | | | | | | | | | | | | | | | | | | | |
| Three Months Ended June 30, | | | | Six Months Ended June 30, | | |
| 2018 | | 2017 | | 2018 | | 2017 |
| Sales and operating revenues: | | | | | | | |
| Used vehicle sales, net | $ | 437,922 | | $ | 193,947 | | $ | 771,978 | | $ | 342,329 |
| Wholesale vehicle sales | 16,622 | | 7,818 | | 26,755 | | 13,544 |
| Other sales and revenues, including $5,544, $1,898, $9,655 and $3,656, respectively, from related parties | 20,742 | | 7,600 | | 36,975 | | 12,565 |
| Net sales and operating revenues | 475,286 | | 209,365 | | 835,708 | | 368,438 |
| Cost of sales | 426,251 | | 193,326 | | 752,439 | | 342,653 |
| Gross profit | 49,035 | | 16,039 | | 83,269 | | 25,785 |
| Selling, general and administrative expenses | 95,652 | | 52,011 | | 178,838 | | 97,919 |
| Interest expense, including $0, $1,241, $0 and $1,382, respectively, to related parties | 4,165 | | 2,507 | | 7,706 | | 4,566 |
| Other expense, net | 468 | | 391 | | 647 | | 609 |
| Net loss before income taxes | (51,250) | | (38,870) | | (103,922) | | (77,309) |
| Income tax provision | — | | — | | — | | — |
| Net loss | (51,250) | | (38,870) | | (103,922) | | (77,309) |
| Net loss attributable to non-controlling interests | (41,285) | | (24,328) | | (86,914) | | (24,328) |
| Net loss attributable to Carvana Co. | $ | (9,965) | | $ | (14,542) | | $ | (17,008) | | $ | (52,981) |
| Dividends on Class A convertible preferred stock | (1,375) | | — | | (2,720) | | — |
| Accretion of beneficial conversion feature on Class A convertible preferred stock | — | | — | | (1,380) | | — |
| Net loss attributable to Class A common stockholders | $ | (11,340) | | $ | (14,542) | | $ | (21,108) | | $ | (52,981) |
Net loss per share of Class A common stock, basic and diluted (1) | $ | (0.41) | | $ | (0.28) | | $ | (0.92) | | $ | (0.56) |
Weighted-average shares of Class A common stock, basic and diluted (1)(2) | 27,780 | | 15,026 | | 23,063 | | 15,013 |
| | | | | | | |
(1) Amounts for periods prior to the initial public offering have been retrospectively adjusted to give effect to 15.0 million shares of Class A common stock issued in the initial public offering and the Organizational Transactions.
(2) Weighted-average shares of Class A common stock outstanding have been adjusted for unvested restricted stock awards.
CARVANA CO. AND SUBSIDIARIES
CONDENSED CONSOLIDATED STATEMENTS OF CASH FLOWS
(Unaudited)
(In thousands)
| | | | | | | | | | | |
| Six Months Ended June 30, | | |
| 2018 | | 2017 |
| Cash Flows from Operating Activities: | | | |
| Net loss | $ | (103,922) | | $ | (77,309) |
| Adjustments to reconcile net loss to net cash used in operating activities: | | | |
| Depreciation and amortization expense | 9,862 | | 4,645 |
| Loss on disposal of property and equipment | 267 | | 565 |
| Provision for bad debt and finance receivable allowance | 1,131 | | 494 |
| Gain on loan sales | (22,313) | | (8,390) |
| | | |
| Equity-based compensation expense | 4,093 | | 2,102 |
| Amortization and write-off of debt issuance costs | 649 | | 1,250 |
| Originations of finance receivables | (525,885) | | (223,843) |
| Proceeds from sale of finance receivables | 513,820 | | 231,942 |
| | | |
| | | |
| Changes in assets and liabilities: | | | |
| Accounts receivable | (9,500) | | (8,293) |
| | | |
| | | |
| Vehicle inventory | (74,817) | | 11,668 |
| Other current assets | (7,397) | | (1,538) |
| Other assets | 270 | | (1,148) |
| Accounts payable and accrued liabilities | 33,002 | | 942 |
| Accounts payable to related party | 1,391 | | 285 |
| Other liabilities | (136) | | 5,337 |
| Net cash used in operating activities | (179,485) | | (61,291) |
| Cash Flows from Investing Activities: | | | |
| | | |
| Purchases of property and equipment | (73,425) | | (42,576) |
| Business acquisitions, net of cash acquired | (6,670) | | — |
| Net cash used in investing activities | (80,095) | | (42,576) |
| Cash Flows from Financing Activities: | | | |
| Proceeds from floor plan facility | 837,673 | | 397,082 |
| Payments on floor plan facility | (739,378) | | (395,555) |
| Proceeds from Verde Credit Facility | — | | 35,000 |
| Payments on Verde Credit Facility | — | | (35,000) |
| Proceeds from long-term debt | 25,670 | | 2,980 |
| Payments on long-term debt | (2,852) | | (641) |
| | | |
| | | |
| Payments of debt issuance costs, including $0 and $1,000 to related parties, respectively | (325) | | (1,000) |
| Net proceeds from issuance of Class A common stock | 172,287 | | 206,323 |
| Proceeds from exercise of stock options | 169 | | — |
| Tax withholdings related to restricted stock awards | (323) | | — |
| Dividends paid on Class A Convertible Preferred Stock | (2,904) | | — |
| Payments of costs related to issuance of Class A Convertible Preferred Stock | (12) | | — |
| | | |
| | | |
| Net cash provided by financing activities | 290,005 | | 209,189 |
| Net increase in cash, cash equivalents and restricted cash | 30,425 | | 105,322 |
| Cash, cash equivalents and restricted cash at beginning of period | 187,123 | | 49,450 |
| Cash, cash equivalents and restricted cash at end of period | $ | 217,548 | | $ | 154,772 |
| | | |
| | | |
| | | |
| | | |
| | | |
| | | |
| | | |
| | | |
| | | |
| | | |
| | | |
CARVANA CO. AND SUBSIDIARIES
RECONCILIATION OF GAAP TO NON-GAAP FINANCIAL MEASURES
(Unaudited)
Adjusted Net Loss and Adjusted Net Loss per Share
Adjusted net loss and adjusted net loss per share are supplemental measures of operating performance that do not represent and should not be considered alternatives to net loss and net loss per share, as determined under GAAP. We believe that by assuming the full exchange of all outstanding LLC Units, adjusted net loss and adjusted net loss per share supplement GAAP measures and enable us and our investors to more effectively evaluate our performance period-over-period and relative to our competitors that have different organizational and tax structures because the assumption eliminates the effect of any changes in net income attributable to Carvana Co. driven by increases in our ownership of Carvana Group, LLC, which are unrelated to our operating performance. A reconciliation of adjusted net loss to net loss attributable to Carvana Co., the most directly comparable GAAP measure, and the computation of adjusted net loss per share are as follows (in thousands, except per share amounts):
| | | | | | | | | | | | | | | | | | | | | | | | | | | | | |
| | | | | | | | | | | | | | |
| | | Three Months Ended June 30, | | | | | | | | | Six Months Ended June 30, | | |
| | | 2018 | | | 2017 | | | | | | 2018 | | 2017 |
| Numerator: | | | | | | | | | | | | | | |
| Net loss attributable to Carvana Co. | | $ | (9,965) | | | $ | (14,542) | | | | | | $ | (17,008) | | $ | (52,981) |
| Net loss attributable to non-controlling interests | | (41,285) | | | (24,328) | | | | | | (86,914) | | (24,328) |
| Dividends on Class A convertible preferred stock | | (1,375) | | | — | | | | | | (2,720) | | — |
| Accretion of beneficial conversion feature on Class A convertible preferred stock | | — | | | — | | | | | | (1,380) | | — |
| Adjusted net loss attributable to Carvana Co. Class A common stock | | $ | (52,625) | | | $ | (38,870) | | | | | | $ | (108,022) | | $ | (77,309) |
| | | | | | | | | | | | | | |
| Denominator: | | | | | | | | | | | | | | |
| Weighted-average shares of Class A common stock outstanding(1)(3) | | 27,780 | | | 15,026 | | | | | | 23,063 | | 15,013 |
| Adjustments: | | | | | | | | | | | | | |
| | Weighted-average assumed exchange of LLC Units for shares of Class A common stock (2) | 114,897 | | | 121,666 | | | | | | 116,878 | | 121,713 |
| | | | | | | | | | | | | | |
| Adjusted shares of Class A common stock outstanding | | 142,677 | | | 136,692 | | | | | | 139,941 | | 136,726 |
| Adjusted net loss per share | | | $ | (0.37) | | | $ | (0.28) | | | | | | $ | (0.77) | | $ | (0.57) |
| | | | | | | | | | | | | | |
(1) Amounts for periods prior to the initial public offering have been retrospectively adjusted to give effect to 15.0 million shares of Class A common stock issued in the initial public offering.
(2) Amounts for periods prior to the initial public offering have been retrospectively adjusted to include all LLC units outstanding at the initial public offering, including conversion of the Class C Redeemable Preferred Units into Class A Units on a one-for-one basis. Also assumes exchange of all outstanding LLC Units for shares of Class A common stock during each period presented.
(3) Excludes approximately 0.5 million nonvested restricted stock awards and units and 0.8 million vested and nonvested stock options outstanding at June 30, 2018, because they were determined to be anti-dilutive. Excludes approximately 0.5 million restricted stock awards and 0.5 million stock options outstanding at June 30, 2017, because they were determined to be anti-dilutive.
CARVANA CO. AND SUBSIDIARIES
RECONCILIATION OF GAAP TO NON-GAAP FINANCIAL MEASURES (continued)
(Unaudited)
EBITDA and EBITDA Margin
EBITDA and EBITDA Margin are non-GAAP supplemental measures of operating performance that do not represent and should not be considered an alternative to net loss or cash flow from operations, as determined by GAAP. EBITDA is defined as net loss before interest expense, income tax expense and depreciation and amortization expense. EBITDA Margin is EBITDA as a percentage of total revenues. We use EBITDA to measure the operating performance of our business and EBITDA Margin to measure our operating performance relative to our total revenues. We believe that EBITDA and EBITDA Margin are useful measures to us and to our investors because they exclude certain financial and capital structure items that we do not believe directly reflect our core operations and may not be indicative of our recurring operations, in part because they may vary widely across time and within our industry independent of the performance of our core operations. We believe that excluding these items enables us to more effectively evaluate our performance period-over-period and relative to our competitors. EBITDA and EBITDA Margin may not be comparable to similarly titled measures provided by other companies due to potential differences in methods of calculations. A reconciliation of EBITDA to net loss, the most directly comparable GAAP measure, and calculation of EBITDA Margin is as follows (in thousands):
| | | | | | | | | | | | | | | | | | | | | | | | | | | | | |
| | | | | | | | | | | | Three Months Ended | | | | | | | | | | | | |
| | | | | | | | | | | | Jun 30, 2017 | | Sep 30, 2017 | | Dec 31, 2017 | | Mar 31, 2018 | | Jun 30, 2018 | | | | |
| Net loss | | | | | | | | | | | | $ | (38,870) | | $ | (39,769) | | $ | (47,238) | | $ | (52,672) | | $ | (51,250) | | | | |
| Depreciation and amortization expense | | | | | | | | | | | | 2,584 | | 3,101 | | 3,822 | | 4,605 | | 5,257 | | | | |
| Interest expense | | | | | | | | | | | | 2,507 | | 838 | | 2,255 | | 3,541 | | 4,165 | | | | |
| EBITDA | | | | | | | | | | | | $ | (33,779) | | $ | (35,830) | | $ | (41,161) | | $ | (44,526) | | $ | (41,828) | | | | |
| | | | | | | | | | | | | | | | | | | | | | | | |
| Total revenues | | | | | | | | | | | | $ | 209,365 | | $ | 225,379 | | $ | 265,053 | | $ | 360,422 | | $ | 475,286 | | | | |
| Net Loss Margin | | | | | | | | | | | | (18.6) | % | | (17.6) | % | | (17.8) | % | | (14.6) | % | | (10.8) | % | | | | |
| EBITDA Margin | | | | | | | | | | | | (16.1) | % | | (15.9) | % | | (15.5) | % | | (12.4) | % | | (8.8) | % | | | | |
| | | | | | | | | | | | | | | | | | | | | | | |
| Years Ended December 31, | | | | | | |
| 2014 | | 2015 | | 2016 | | 2017 |
| Net loss | $ | (15,238) | | $ | (36,780) | | $ | (93,112) | | $ | (164,316) |
| Depreciation and amortization expense | 1,705 | | 2,800 | | 4,658 | | 11,568 |
| Interest expense | 108 | | 1,412 | | 3,587 | | 7,659 |
| EBITDA | $ | (13,425) | | $ | (32,568) | | $ | (84,867) | | $ | (145,089) |
| | | | | | | |
| Total revenues | $ | 41,679 | | $ | 130,392 | | $ | 365,148 | | $ | 858,870 |
| Net Loss Margin | (36.6) | % | | (28.2) | % | | (25.5) | % | | (19.1) | % |
| EBITDA Margin | (32.2) | % | | (25.0) | % | | (23.2) | % | | (16.9) | % |
CARVANA CO. AND SUBSIDIARIES
RESULTS OF OPERATIONS
(Unaudited)
| | | | | | | | | | | | | | | | | | | | | | | | | | | | | | | | | | | | | | |
| | Three Months Ended June 30, | | | | | | Six Months Ended June 30, | | | | | | | | | | |
| | 2018 | | 2017 | | Change | | 2018 | | 2017 | | Change | | | | | | |
| | | | | | | | | | | | | | | | | | |
| | (dollars in thousands, except per unit amounts) | | | | | | | | | | | | | | | | |
| Net sales and operating revenues: | | | | | | | | | | | | | | | | | | |
| Used vehicle sales, net | | $ | 437,922 | | $ | 193,947 | | 125.8 | % | | $ | 771,978 | | $ | 342,329 | | 125.5 | % | | | | | | |
| Wholesale vehicle sales | | 16,622 | | 7,818 | | 112.6 | % | | 26,755 | | 13,544 | | 97.5 | % | | | | | | |
Other sales and revenues (1) | | 20,742 | | 7,600 | | 172.9 | % | | 36,975 | | 12,565 | | 194.3 | % | | | | | | |
| Total net sales and operating revenues | | $ | 475,286 | | $ | 209,365 | | 127.0 | % | | $ | 835,708 | | $ | 368,438 | | 126.8 | % | | | | | | |
| Gross profit: | | | | | | | | | | | | | | | | | | |
| Used vehicle gross profit | | $ | 26,641 | | $ | 8,172 | | 226.0 | % | | $ | 43,287 | | $ | 12,798 | | 238.2 | % | | | | | | |
| Wholesale vehicle gross profit | | 1,652 | | 267 | | 518.7 | % | | 3,007 | | 422 | | 612.6 | % | | | | | | |
Other gross profit (1) | | 20,742 | | 7,600 | | 172.9 | % | | 36,975 | | 12,565 | | 194.3 | % | | | | | | |
| Total gross profit | | $ | 49,035 | | $ | 16,039 | | 205.7 | % | | $ | 83,269 | | $ | 25,785 | | 222.9 | % | | | | | | |
| Market information: | | | | | | | | | | | | | | | | | | |
| Markets, beginning of period | | 56 | | 23 | | 143.5 | % | | 44 | | 21 | | 109.5 | % | | | | | | |
| Market launches | | 9 | | 7 | | 28.6 | % | | 21 | | 9 | | 133.3 | % | | | | | | |
| Markets, end of period | | 65 | | 30 | | 116.7 | % | | 65 | | 30 | | 116.7 | % | | | | | | |
| Unit sales information: | | | | | | | | | | | | | | | | | | |
| Used vehicle unit sales | | 22,570 | | 10,682 | | 111.3 | % | | 41,034 | | 19,016 | | 115.8 | % | | | | | | |
| Wholesale vehicle unit sales | | 3,658 | | 1,580 | | 131.5 | % | | 6,000 | | 2,868 | | 109.2 | % | | | | | | |
| Per unit selling prices: | | | | | | | | | | | | | | | | | | |
| Used vehicles | | $ | 19,403 | | $ | 18,156 | | 6.9 | % | | $ | 18,813 | | $ | 18,002 | | 4.5 | % | | | | | | |
| Wholesale vehicles | | $ | 4,544 | | $ | 4,948 | | (8.2) | % | | $ | 4,459 | | $ | 4,722 | | (5.6) | % | | | | | | |
Per unit gross profit: (2) | | | | | | | | | | | | | | | | | | |
| Used vehicle gross profit | | $ | 1,180 | | $ | 765 | | 54.2 | % | | $ | 1,055 | | $ | 673 | | 56.8 | % | | | | | | |
| Wholesale vehicle gross profit | | $ | 452 | | $ | 169 | | 167.5 | % | | $ | 501 | | $ | 147 | | 240.8 | % | | | | | | |
| Other gross profit | | $ | 919 | | $ | 711 | | 29.3 | % | | $ | 901 | | $ | 661 | | 36.3 | % | | | | | | |
| Total gross profit | | $ | 2,173 | | $ | 1,501 | | 44.8 | % | | $ | 2,029 | | $ | 1,356 | | 49.6 | % | | | | | | |
| | | | | | | | | | | | | | | | | | |
(1) Includes $5,544 and $1,898 for the three months ended June 30, 2018 and 2017, respectively, and $9,655 and $3,656 for the six months ended June 30, 2018 and 2017, respectively, of other sales and revenues from related parties.
(2) All gross profit per unit amounts are per used vehicle sold, except wholesale vehicle gross profit, which is per wholesale vehicle sold.
CARVANA CO. AND SUBSIDIARIES
COMPONENTS OF SG&A
(Unaudited)
| | | | | | | | | | | | | | | | | | | | | | | | | | | | | | | | |
| | | | Three Months Ended | | | | | | | | | | |
| | | | Jun 30, 2017 | | Sep 30, 2017 | | Dec 31, 2017 | | Mar 31, 2018 | | Jun 30, 2018 | | |
| | | | | | | | | | | | | | |
| | | | (in thousands) | | | | | | | | | | |
Compensation and benefits (1) | | | | $ | 18,789 | | $ | 19,404 | | $ | 22,219 | | $ | 24,987 | | $ | 29,251 | | |
| Advertising expense | | | | 12,385 | | 15,475 | | 16,398 | | 25,009 | | 26,782 | | |
Market occupancy costs (2) | | | | 1,424 | | 1,734 | | 2,081 | | 2,510 | | 2,618 | | |
Logistics (3) | | | | 3,116 | | 3,905 | | 4,555 | | 6,318 | | 7,826 | | |
Other costs (4) | | | | 16,297 | | 18,158 | | 21,552 | | 24,362 | | 29,175 | | |
| Total | | | | $ | 52,011 | | $ | 58,676 | | $ | 66,805 | | $ | 83,186 | | $ | 95,652 | | |
| | | | | | | | | | | | | | |
| | | | | | | | | | | | | | |
| | | | | | | | | | | | | | |
| | | | | | | | | | | | | | |
| | | | | | | | | | | | | | |
| | | | | | | | | | | | | | |
| | | | | | | | | | | | | | |
| | | | | | | | | | | | | | |
| | | | | | | | | | | | | | |
| | | | | | | | | | | | | | |
| | | | | | | | | | | | | | |
(1) Compensation and benefits includes all payroll and related costs, including benefits, payroll taxes and equity-based compensation, except those related to preparing vehicles for sale, which are included in cost of sales.
(2) Market occupancy costs includes rent, utilities, security, repairs and maintenance and depreciation of buildings and improvements, including vending machines and fulfillment centers, excluding the portion related to reconditioning vehicles, which is included in cost of sales, and excluding the portion related to corporate occupancy.
(3) Logistics includes fuel, maintenance and depreciation related to operating our own transportation fleet and third party transportation fees, except the portion related to inbound transportation, which is included in cost of sales.
(4) Other costs include all other selling, general and administrative expenses such as IT expenses, corporate occupancy, professional services and insurance, limited warranty and title and registration.