Exhibit 99.1
Annual Key Metrics
2018 Highlights
| GROWTH | ||
•Fastest growing automotive retailer in 2018 by units (+49,856 retail units)
•Fastest organic growing public company in the technology, consumer, or retail sectors at our scale
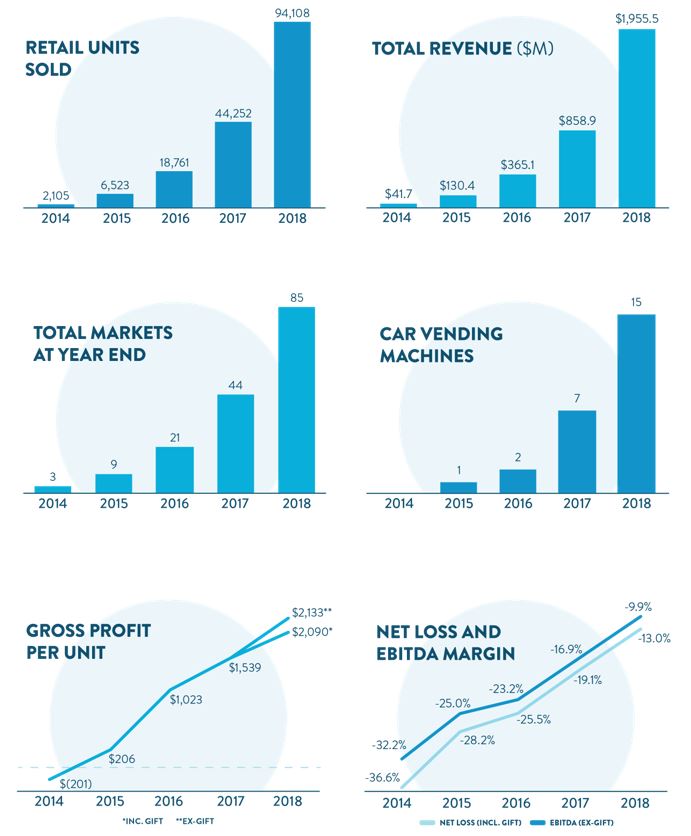
•Record retail units sold of 94,108, up 113% YoY
•Record market penetration in Atlanta, our first and oldest market, reaching 1.94% in 4Q18
•72 markets (86%) are ramping faster than Atlanta at the same market age
•Second cohort with greater than 1% quarterly market penetration (1.11% in 2014 cohort in 4Q18)
•Phoenix market fastest to 1% market penetration (16 months vs. 42 months for Atlanta)
•2018 cohort passed the 2017 cohort as the fastest ramping cohort in our history
•Total vehicles purchased from customers grew 229%
•Retail units sold that were sourced from customers grew 376%
•Launched a record 41 new markets and opened a record 8 vending machines
•Monthly Unique Visitors in FY 2018 grew to 2.3M, up 121% YoY
| PROFITABILITY | ||
•Levered our Net Loss margin (incl. Gift) by 6.1% in 2018
•Levered our EBITDA margin ex-Gift by 7.0% in 2018, an acceleration from 2017
•Achieved a record total GPU of $2,090 (incl. Gift) and $2,133 ex-Gift, an increase of $1,067 and $1,110, respectively, in the past two years
•Reduced CAC in Atlanta to $462 in FY 2018 from $543 in FY 2017
•2018 cohort passed the 2017 cohort for lowest first year CAC in our history
•Reduced average days to sale to 64 from 91 in 2017
•Added a new financial buyer to our financing platform that provided $450 million of fixed pool funding in 2018
Dear Shareholders,
We're pleased to announce our fourth quarter and full year 2018 results. We had another year of triple-digit unit and revenue growth while simultaneously making significant progress in GPU and accelerating our operating leverage. Our 128% revenue growth in 2018 to $1.96 billion from $859 million has few historical precedents and makes us one of the fastest growing technology, consumer, or retail companies at our scale. We believe this is a testament to the quality of our customer offering, the scalability of our business model, and our team’s strong execution.
Successfully executing our growth strategy at ever greater scale continues to give us confidence in our path to becoming the largest and most profitable auto retailer, with a goal of selling 2M+ vehicles per year. We have never been more confident in the outlook and prospects for the business and are focused on executing our expansion plan while driving towards profitability and continually improving our customer experience quality.
Summary of Q4 2018 and 2018 Results
Complete financial tables appear at the end of this letter. Throughout the letter we will refer to items as “including Gift” that include the impact of the compensation expense related to the 100k Milestone Gift to employees, in accordance with GAAP. We will also refer to several measures that are presented “ex-Gift,” which exclude the impact of the 100k Milestone Gift to employees and are non-GAAP metrics with reconciliations available at the end of this letter. For additional information please refer to the details provided in our Q3 2018 shareholder letter.
Q4 2018: We grew units and revenue by 105% and 121% respectively in Q4 YoY, marking our 20th consecutive quarter of triple-digit unit and revenue growth. While our growth remained at an extremely high level, we finished at the lower half of our guidance range due to a Cyber Monday promotion that was more similar to last year than to 2015 and 2016. EBITDA margin was below our guidance range by 30bps, equating to approximately $2 million dollars, due to the lower units and small incremental investments to prepare for a strong first half of 2019. Unless otherwise noted, all financial comparisons stated below are versus Q4 2017.
Q4 2018 GAAP Results
•Retail units sold totaled 27,750, an increase of 105%
•Revenue totaled $584.8 million, an increase of 121%
•Total gross profit, including Gift, was $56.1 million, an increase of 156%
•Net loss, including Gift, was $86.4 million, an increase of 83%
•Basic and diluted net loss, including Gift, per Class A share was $0.74 based on 39.4 million shares of Class A common stock outstanding
Q4 2018 Ex-Gift Results, non-GAAP
•Total gross profit per unit ex-Gift was $2,131, an increase of $512
•EBITDA margin ex-Gift was (10.8%), an improvement from (15.5%)
•Adjusted net loss per Class A share, was $0.55, based on 149.4 million adjusted shares of Class A common stock outstanding, assuming the exchange of all outstanding LLC Units for shares of Class A common stock
Q4 2018 Other Results
•We opened 7 new markets and 1 vending machine, bringing our end-of-quarter totals to 85 and 15, respectively
•We lowered our average days to sale to 59, from 63 last quarter and 72 in Q4 2017
FY 2018: All financial comparisons stated below are versus 2017, unless otherwise noted. Complete financial tables appear at the end of this letter.
FY 2018 GAAP Results
•Retail units sold totaled 94,108, an increase of 113%
•Revenue totaled $1.96 billion, an increase of 128%
•Total gross profit, including Gift, was $196.7 million, an increase of 189%
•Net loss, including Gift, was $254.7 million, an increase of 55%
•Basic and diluted net loss, including Gift, per Class A share was $2.24 based on 30.0 million shares of Class A common stock outstanding
FY 2018 Ex-Gift Results, non-GAAP
•Total gross profit per unit ex-Gift was $2,133, an increase of $594
•EBITDA margin ex-Gift was (9.9%), an improvement from (16.9%)
•Adjusted net loss per Class A share, was $1.73, based on 143.8 million adjusted shares of Class A common stock outstanding, assuming the exchange of all outstanding LLC Units for shares of Class A common stock
2019 Outlook
We anticipate another year of rapid unit and revenue growth with significant improvement in GPU and EBITDA margins. This year, we have made the decision to move to annual guidance that we will update quarterly. This decision was primarily made because our management team evaluates and runs the business with a long term perspective focusing on providing the best customer experience while driving toward the goals outlined in our long term model. We aim to give the market the information necessary to evaluate the business while more closely aligning our shareholder’s perspective with that of our own. Within 2019 we expect quarters to follow a seasonal pattern largely similar to that seen in 2018, with one notable difference being an expected delay in tax refunds this year.
Our FY 2019 guidance is as follows. All financial comparisons stated below are versus FY 2018, unless otherwise noted.
•Retail unit sales of 160,000 – 165,000, an increase of 70% – 75%
•Revenue of $3.4 billion – $3.5 billion, an increase of 74% – 79%
•Total gross profit per unit ex-Gift of $2,450 – $2,650, an increase from $2,133
•EBITDA margin ex-Gift of (5.5%) – (3.5%), an improvement from (9.9%)
•50-60 market openings, an increase from 41 market openings in 2018, bringing our end-of-year total to 135-145 markets and our total U.S. population coverage to at least 65%
For more information regarding the non-GAAP financial measures discussed in this letter, please see the reconciliations of our non-GAAP measurements to their most directly comparable GAAP-based financial measurements included at the end of this letter. Guidance for GPU ex-Gift excludes compensation expense from the 100k Milestone Gift that is capitalized to inventory and ultimately reflected in cost of sales. We have not reconciled GPU ex-Gift guidance to GAAP gross profit as a result of the uncertainty regarding, and the potential variability of, the stock price of our class A common shares, which will directly impact the amount of expense ultimately incurred as a result of the 100k Milestone Gift granted during FY 2019. Accordingly, a reconciliation of the non-GAAP financial measure guidance to the corresponding GAAP measure is not available without unreasonable effort. Guidance for EBITDA margin ex-Gift excludes depreciation and amortization expense, interest expense, and expenses related to the 100k Milestone Gift. We have not reconciled EBITDA margin ex-Gift guidance to GAAP net loss as a result of the uncertainty regarding, and the potential variability of, interest expense and expenses related to the 100k Milestone Gift. Accordingly, a reconciliation of the non-GAAP financial measure guidance to the corresponding GAAP measure is not available without unreasonable effort. Depreciation and amortization expense, which is a component of the reconciliation between EBITDA margin and GAAP net loss, is expected to be between 1.0% and 1.4% of total revenues for FY 2019.
Markets and Cohorts
We delivered continued improvements in our markets during 2018, with penetration increasing in our existing markets and our newly launched markets off to the best start in our history. Atlanta, our oldest and largest market, along with our other market cohorts continued to show impressive growth while simultaneously leveraging advertising expenditures.
Market Penetration
The charts below show the market penetration and advertising expense per unit of our six annual market cohorts (2013 through 2018) by quarters since launch. The charts align performance of all markets in a cohort with their first quarter in operation and include data in quarters where all markets in a cohort were active (e.g. there is one data point for the 2018 cohort, five for the 2017 cohort, etc.). Additional details on methodology are provided in our Annual Report on Form 10-K.
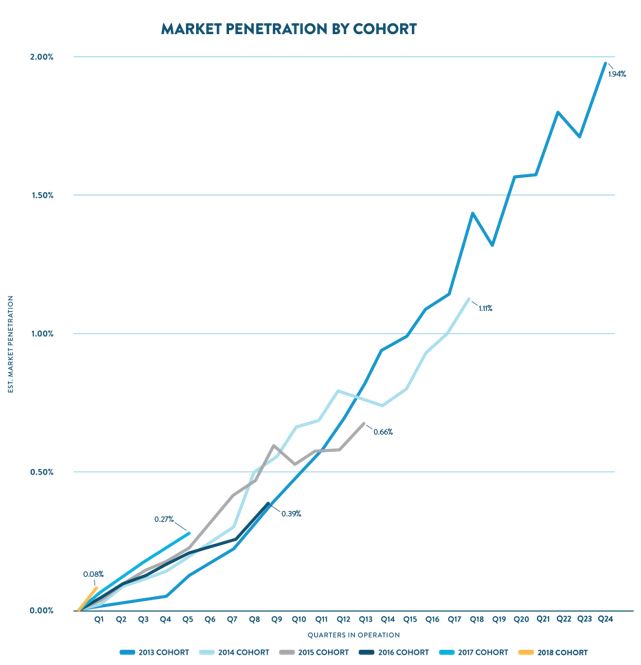
Our 2013 cohort (Atlanta) continued to show impressive YoY unit growth of 30% and 26% in FY 2018 and Q4 2018, respectively, reaching market penetration in Q4 of 1.94% vs. 1.54% in Q4 2017. For the year, we reduced our advertising cost per unit in Atlanta to $462 in FY 2018 vs. $543 in FY 2017.
Our 2014 cohort, which includes Nashville and Charlotte, became the second cohort with greater than 1% market penetration, reaching 1.11% vs. 0.72% in the prior year. Growth in the 2014 cohort accelerated to 54% in Q4 YoY, while Q4 CAC declined by 35% YoY, reflecting continued growth in brand awareness, the launch of a new vending machine in Charlotte, and a shift to more efficient marketing mix versus the prior year.
Our 2015 cohort, which includes Houston, experienced slower year over year growth than our other cohorts in Q4 2018. This cohort saw large replacement demand following Hurricane Harvey in Q4 2017, making for a difficult comparison this Q4.
Our 2016 cohort grew by approximately 105% in Q4 YoY, reflecting a second consecutive year of same-market triple-digit growth, while Q4 advertising expense per unit simultaneously fell by 53% YoY.
Our 2017 and 2018 cohorts continued their strong starts, with the 2018 cohort becoming the fastest ramping cohort ever, supplanting our 2017 cohort which is now the second fastest. In the 2017 cohort, Phoenix reached a market penetration of 1.0% in just 16 months, making it the fastest market ever to that level. In the 2018 cohort, Charleston, SC and Montgomery, AL became the fastest markets to reach 0.5% quarterly market penetration, achieving that milestone in their second quarter.
Within cohorts, markets continue to follow familiar trends. From a market penetration perspective smaller markets tend to ramp faster than larger ones, markets that are closer to existing markets tend to ramp faster than those far away, and markets with a vending machine tend to ramp faster than those without.
Our cohort curves give us confidence that we can sustainably grow our business. In Q4 2018, 72 out of 84 markets, or 86% of markets are ramping faster than Atlanta at the same age. This pattern demonstrates the desirability of our customer offering across geographies and demographics.
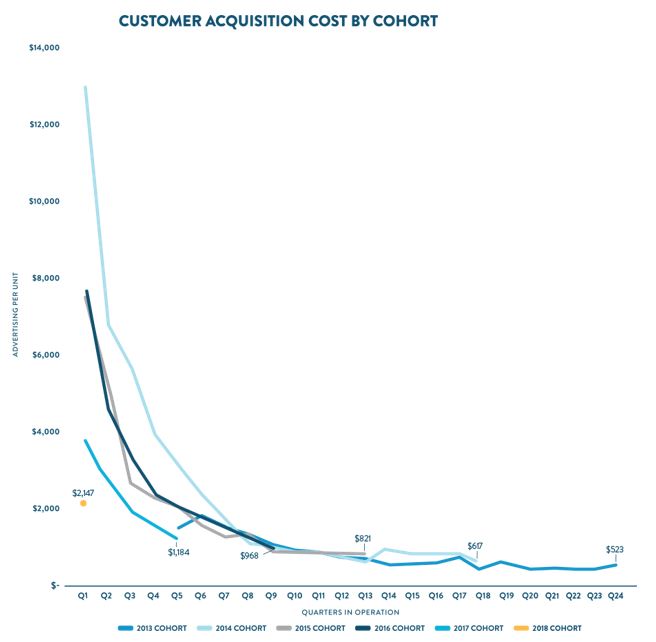
Customer Acquisition Costs
Similar to cohort market penetration, cohort advertising expense per unit steadily improved both within and across cohorts. For the full year, advertising expense per unit sold in all cohorts declined year-over-year, including steep declines in our 2015 cohort to $771 from $1,154, 2016 cohort to $1,114 from $2,204, and 2017 cohort to $1,298 from $2,730, respectively. For the full year, the 2018 cohort advertising expense per unit was $1,717, which was significantly lower than the $2,730 CAC expense that the 2017 cohort achieved during its first year. As displayed in the quarterly cohort graph below, our 2018 cohort had the lowest first quarter advertising expense per unit in our history, we believe due largely to the benefits of national advertising, a larger average inventory size at launch, and a constantly improving product offering. We believe the overall trends in advertising expense per unit bodes well for the replicability of our market rollout model, as well as our ability to leverage advertising expense over time.
Expansion
We launched 7 new markets in the fourth quarter and 41 for the full year bringing our total markets to 85 as of December 31, 2018. This increases the total percentage of the U.S. population our markets collectively serve to 58.6%, up from 41.2% at the end of FY 2017. We also opened 1 vending machine in the quarter in Indianapolis, bringing our year-end total to 15. We continue to see noticeable increases in market penetration following the launch of a vending machine and are excited to launch several more in 2019.

Carvana’s New Car Vending Machine in Indianapolis, Indiana
We view our coast-to-coast logistics network and capital- and headcount-light market opening model as a key competitive advantage and expect to leverage that advantage in 2019. With our infrastructure in place, we expect to set another record in 2019 with 50-60 market openings. These 50-60 markets will largely utilize our existing network, leading to faster launch timelines and lower incremental capital expenditures than previous market launches. We expect our markets to cover at least 65% of the population by year end.
For a complete list of our market opening history, estimated populations, and estimated total industry used vehicle sales by market please see: investors.carvana.com/resources/investor-materials.
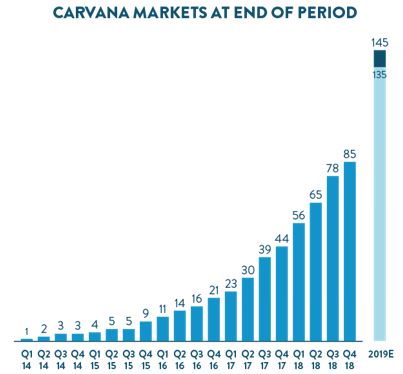
*2019E bar represents end-of-year total market guidance.
Inspection & Reconditioning Centers
As our rapid growth continues, we expect Inspection & Reconditioning Centers (IRCs) to play an important role in our strategy. Increasing sales means we can hold a broader selection of inventory at any given average days to sale. Additional IRCs enable us to produce and hold more cars to support growth in sales and inventory. Building out our logistics and IRC network will lead to better selection, shorter shipping distances, and faster shipping times, which we expect to result in higher conversion and lower shipping costs.
We expect our IRC footprint to evolve in several ways as we expand. Historically, each of our first five IRCs, including Indianapolis, included three production lines, each of which can be run on two (or optionally, 2.5-3) shifts per day, amounting to six production shifts per facility. At full utilization, we estimate six production shifts to equate to approximately 50,000 units per year of production capacity, or 250,000 units total across the five facilities.
We expect two refinements to this baseline in 2019. First, both our Phoenix and Indianapolis facilities have the ability to expand to 4 production lines (or 8 production shifts at two daily shifts per line), bringing their total capacity at full utilization to approximately 67k units per year. We plan to invest in expanding both facilities in 2019 in preparation for 2020.
Second, in 2019 we plan to launch two IRCs with 2 production lines each (or 4 daily production shifts) and begin construction on a third with up to 4 production lines (or up to 8 daily production shifts), bringing our targeted total after these additions to 8 IRCs with a total annual capacity at full utilization of approximately 400k units.
The two 2-line IRCs – one in Cleveland and a second we will announce this spring – were previously operated by DriveTime. We expect both IRCs to have total capacity at full utilization of approximately 33k units per year. Following the transition at each location, we will be the sole occupant of both facilities and pay all associated rent and facilities expenses, similar to our other IRC leases.
We expect capital expenditures for new IRC facilities to be approximately $10-12 million per line. This per line total is approximately $1.5 million per line higher than our previous expectations based on enhancements that we are implementing to increase throughput and improve long-term scalability.
Over time, we plan to finance our new IRC real estate investments primarily with sale-leasebacks. To give a sense of magnitude, at full utilization and assuming an 8% annual lease capitalization rate, the total rent expense associated with these IRC investments would be approximately $48-58 per vehicle produced.
For additional details on our IRCs, please see: investors.carvana.com/resources/investor-materials.
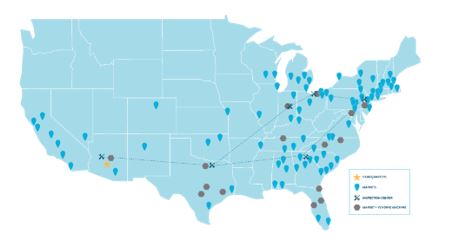
*Represents facilities and markets as of February 27, 2019
Management Objectives
As discussed in previous shareholder letters, our management team focuses on delivering an exceptional and unparalleled customer experience while simultaneously growing the business rapidly and achieving our financial objectives. We firmly believe wowing the customer is the core of our model and drives all other metrics. To realize our long-term vision, our three primary financial objectives remain unchanged: (1) Grow Retail Units and Revenue; (2) Increase Total Gross Profit Per Unit; and (3) Demonstrate Operating Leverage. We believe continued focus on these goals will lead to a strong long-term financial model.
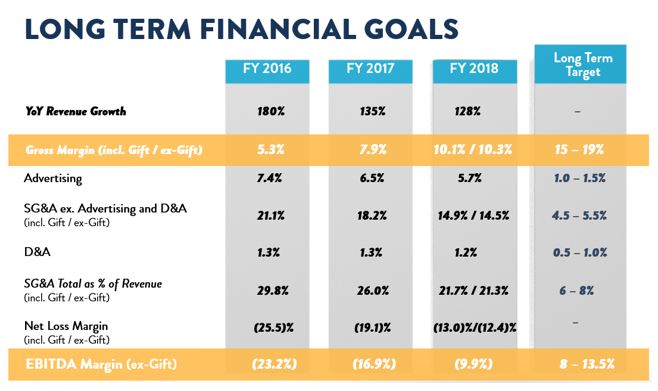
Below we present our long-term financial model that we introduced at our Analyst Day on November 29, 2018. We believe this is the appropriate frame through which to evaluate our results and progress towards each of our financial objectives.
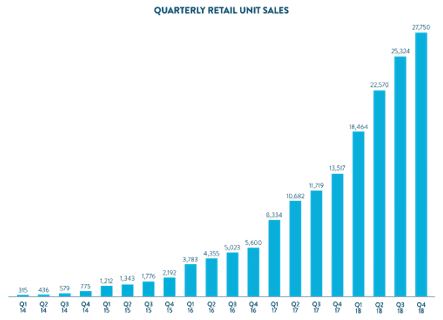
Objective #1: Grow Retail Units and Revenue
We again recorded triple-digit growth in Q4, as retail units sold increased to 27,750, up 105% from 13,517 in the prior year period. Revenue in Q4 grew to $584.8 million, up 121% from $265.1 million in Q4 2017. Our growth in the fourth quarter was broad based, driven by gains across our markets nationwide.
Our 2013 cohort grew by 2,690 units in the full year 2018 vs 2017, while the 2014 cohort grew by 1,287 units, 2015 by 3,915 units, 2016 by 6,646 units, and 2017 by 16,850 units. In its first year, the 2018 cohort contributed 7,132 units, or approximately 8% of total. Out of market sales grew by 11,336 units. Out of market sales primarily consist of sales in smaller cities and towns around our core markets that are fulfilled on our first party network.
Buying Cars from Customers
We also saw substantial gains in our business of sourcing cars from customers in 2018. Total vehicles acquired from customers grew by 229% in 2018 vs. 2017. Wholesale units sold, which are primarily sourced from customers, increased by 132% to 15,125 in 2018 from 6,509 in 2017. Similarly, retail units sold sourced from customers increased by 376% 2018 vs. 2017.
Objective #2: Increase Total Gross Profit Per Unit
We achieved another strong quarter of total GPU growth on our way toward our $3,000 midterm goal. Items “including Gift” reflect the impact of the compensation expense related to the 100k Milestone Gift to employees, in accordance with GAAP. Ex-Gift items exclude the compensation expense impact of the 100k Milestone Gift to employees and are non-GAAP metrics.
For Q4 2018:
•Total
◦Total GPU (incl. Gift): $2,023 vs. $1,619 in Q4 2017
◦Total GPU ex-Gift: $2,131 vs. $1,619 in Q4 2017
•Retail
◦Retail GPU (incl. Gift): $810 vs. $751 in Q4 2017
◦Retail GPU ex-Gift: $914 vs. $751 in Q4 2017
◦Gains in retail vehicle GPU were primarily driven by lower average days to sale, which declined from 72 to 59
•Wholesale
◦Wholesale GPU (incl. Gift) was $36 vs. $50 in Q4 2017
◦Wholesale GPU ex-Gift was $40 vs. $50 in Q4 2017
◦Changes in wholesale GPU were driven by higher wholesale unit volume (+156%) relative to retail units (+105%), offset by lower gross profit per wholesale unit sold ($212 incl. Gift and $236 ex-Gift vs. $364 in Q4 2017).
•Other
◦Other GPU was $1,177 vs. $819 in Q4 2017
◦Gains in Other GPU were driven by higher attachment of financing and VSC, as well as the $2.4 million fee we received for facilitating the refinancing of a previously sold pool of finance receivables. We plan to continue executing refinancing or similar transactions going forward as we expand our financing monetization program. We also recognized an expected $1.9 million excess reserve reimbursement based on the historical performance of our VSCs sold to date versus reserves held by the VSC provider. At current performance we expect to earn approximately $10-$15 per retail unit in excess reserve reimbursements on our VSC product going forward.
For FY 2018:
•Total
◦Total GPU (incl. Gift): $2,090 vs. $1,539 in FY 2017
◦Total GPU ex-Gift: $2,133 vs. $1,539 in FY 2017
◦Our GPU improvements for the year were broad-based, including improvements on retail used vehicles, wholesale vehicles, and other products. Our gains in retail used vehicle GPU were primarily driven by reducing average days to sale (approximately $270). Our gains in other GPU were driven by higher upfront premiums on the sale of our finance receivables, the addition of our refinancing transactions increasing loan monetization, higher penetration of VSCs, and a full year with GAP waiver coverage. We also saw small gains in wholesale gross profit, driven by higher volumes and increased GPU per wholesale unit. We expect further gains in all three gross profit components in 2019.
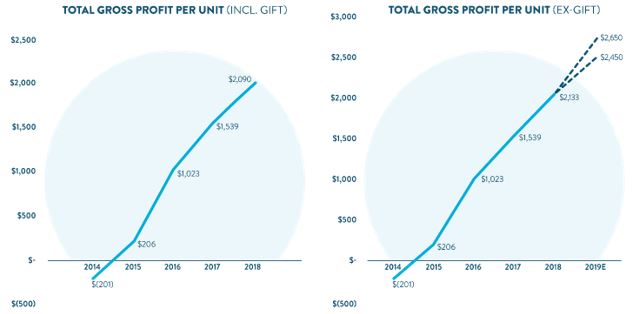
*2019E lines represent high and low end points of annual GPU ex-Gift guidance range.
Objective #3: Demonstrate Operating Leverage
We demonstrated meaningful operating leverage in 2018 and expect another strong year in 2019 as we progress toward our long-term SG&A goals.
For Q4 2018:
•Total SG&A levered by 2.9% incl. Gift and 3.0% ex-Gift, primarily reflecting benefits from scale
•Compensation and benefits levered by 0.8% incl. Gift and 1.0% ex-Gift, primarily reflecting benefits from scale
•Advertising levered by 0.7%, reflecting leverage in existing markets offset by new markets
•Logistics and market occupancy was approximately flat, reflecting our coast-to-coast network expansion (see detail below)
•Other SG&A levered by 1.4%, primarily reflecting benefits from scale
For FY 2018:
•Total SG&A levered by 4.3% incl. Gift and 4.7% ex-Gift, primarily reflecting benefits from scale
•Compensation and benefits levered by 1.8% incl. Gift and 2.2% ex-Gift, primarily reflecting benefits from scale
•Advertising levered by 0.8%, reflecting leverage in existing markets offset by new markets
•Logistics and market occupancy was approximately flat, reflecting our coast-to-coast network expansion (see detail below)
•Other SG&A levered by 1.7%, primarily reflecting benefits from scale
We achieved meaningful operating leverage in 2018 while continuing to make significant investments focused on long-term growth, scalability, and customer experience. For example, we completed two acquisitions, Car360 and Propel AI, and made significant investments in technology infrastructure and management bench strength throughout the year to prepare us for continued high rates of growth. We are excited about our progress integrating these investments into our business and believe they will deliver substantial benefits in the years to come.
We also nearly doubled markets for the second consecutive year and broadened our geographic footprint from Boston in the Northeast to San Diego in the Southwest. SG&A expenses that are correlated with new market openings levered despite this expansion, with reductions in advertising and market occupancy expense as a percent of revenue partially offset by increases in logistics expense. We expect these expenses to lever over time as our markets scale, as seen in our cohort advertising expense per unit curves.
Logistics expense delevered by 12 basis points in 2018, largely due to ramping our Phoenix IRC beginning in late 2017. We expect logistics expense as a percent of revenue to stay elevated in 2019 while our nationwide logistics network is serviced by just a handful of IRCs, but to decline over time as we add density to our IRC network and decrease the average miles traveled from our IRCs to our customers.
For the full year 2019, we expect to again make significant gains in improving our EBITDA margin ex-Gift as the underlying leverage in our cohorts becomes more visible at the corporate level.
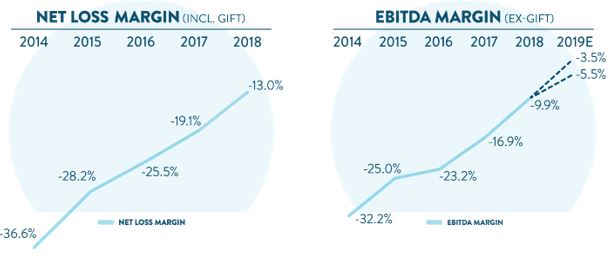
*2019E lines represent high and low end points of annual EBITDA Margin ex-Gift guidance range.
Summary
Four weeks ago, we celebrated the 6th anniversary of launching a whole new way to buy a car to customers in Atlanta, Ga. In that time, we have accomplished a lot. We have progressed from an idea germinating in the minds of a few passionate people, to a product customers love, to an incredible business with even more incredible prospects. In that first year we sold fewer than 250 cars including a blockbuster month in December where we chalked up 42 deliveries. Since then, we have grown at triple digit rates every single quarter. That growth is pretty profound and it comes from two powerful forces: our customers’ love for our product, and our people’s love for building and delivering it. Our team is energized, focused, and executing at the highest level in our history. If we do our jobs from here, those same two forces will drive us to our goal of selling 2m+ units per year.
Sincerely,
Ernie Garcia, III, Chairman and CEO
Mark Jenkins, CFO
Appendix
Conference Call Details
Carvana will host a conference call today, Feb. 27, 2019, at 5:30 p.m. EST (2:30 p.m. PST) to discuss financial results. To participate in the live call, analysts and investors should dial (833) 255-2830 or (412) 902-6715, and ask for “Carvana Earnings.” A live audio webcast of the conference call along with supplemental financial information will also be accessible on the company's website at investors.carvana.com. Following the webcast, an archived version will also be available on the Investor Relations section of the company’s website. A telephonic replay of the conference call will be available until March 6, 2019, by dialing (877) 344-7529 or (412) 317-0088 and entering passcode 10128179#.
Forward Looking Statements
This letter contains forward-looking statements within the meaning of the Private Securities Litigation Reform Act of 1995. These forward-looking statements reflect Carvana’s current expectations and projections with respect to, among other things, its financial condition, results of operations, plans, objectives, future performance, and business. These statements may be preceded by, followed by or include the words "aim," "anticipate," "believe," "estimate," "expect," "forecast," "intend," "likely," "outlook," "plan," "potential," "project," "projection," "seek," "can," "could," "may," "should," "would," "will," the negatives thereof and other words and terms of similar meaning.
Forward-looking statements include all statements that are not historical facts. Such forward-looking statements are subject to various risks and uncertainties. Accordingly, there are or will be important factors that could cause actual outcomes or results to differ materially from those indicated in these statements. Among these factors are risks related to the “Risk Factors” identified in our Annual Report on Form 10-K for 2018.
There is no assurance that any forward-looking statements will materialize. You are cautioned not to place undue reliance on forward-looking statements, which reflect expectations only as of this date. Carvana does not undertake any obligation to publicly update or review any forward-looking statement, whether as a result of new information, future developments, or otherwise.
Use of Non-GAAP Financial Measures
As appropriate, we supplement our results of operations determined in accordance with U.S. generally accepted accounting principles (“GAAP”) with certain non-GAAP financial measurements that are used by management, and which we believe are useful to investors, as supplemental operational measurements to evaluate our financial performance. These measurements should not be considered in isolation or as a substitute for reported GAAP results because they may include or exclude certain items as compared to similar GAAP-based measurements, and such measurements may not be comparable to similarly-titled measurements reported by other companies. Rather, these measurements should be considered as an additional way of viewing aspects of our operations that provide a more complete understanding of our business. We strongly encourage investors to review our consolidated financial statements included in publicly filed reports in their entirety and not rely solely on any one, single financial measurement or communication.
Reconciliations of our non-GAAP measurements to their most directly comparable GAAP-based financial measurements are included at the end of this letter.
Investor Relations Contact Information: Mike Levin, investors@carvana.com
CARVANA CO. AND SUBSIDIARIES
CONSOLIDATED BALANCE SHEETS
(In thousands, except per share amounts)
| December 31, | |||||||||||||||||
| 2018 | 2017 | ||||||||||||||||
| ASSETS | |||||||||||||||||
| Current assets: | |||||||||||||||||
| Cash and cash equivalents | $ | 78,861 | $ | 172,680 | |||||||||||||
| Restricted cash | 9,848 | 14,443 | |||||||||||||||
| Accounts receivable, net | 33,120 | 14,105 | |||||||||||||||
| Finance receivables held for sale, net | 105,200 | 45,564 | |||||||||||||||
| Vehicle inventory | 412,243 | 227,446 | |||||||||||||||
| Other current assets | 23,582 | 15,480 | |||||||||||||||
| Total current assets | 662,854 | 489,718 | |||||||||||||||
| Property and equipment, net | 296,839 | 148,681 | |||||||||||||||
| Intangible assets, net | 8,869 | — | |||||||||||||||
| Goodwill | 9,353 | — | |||||||||||||||
| Other assets, including $1,895 and $0, respectively, due from related parties | 13,098 | 2,738 | |||||||||||||||
| Total assets | $ | 991,013 | $ | 641,137 | |||||||||||||
| LIABILITIES & STOCKHOLDERS' EQUITY | |||||||||||||||||
| Current liabilities: | |||||||||||||||||
| Accounts payable and accrued liabilities | $ | 117,524 | $ | 50,306 | |||||||||||||
| Accounts payable due to related party | 3,891 | 1,802 | |||||||||||||||
| Floor plan facility | 196,963 | 248,792 | |||||||||||||||
| Current portion of other long-term debt | 11,133 | 5,131 | |||||||||||||||
| Total current liabilities | 329,511 | 306,031 | |||||||||||||||
Senior unsecured notes(1) | 342,869 | — | |||||||||||||||
| Other long-term debt, excluding current portion | 82,480 | 48,469 | |||||||||||||||
| Other liabilities | 8,725 | 7,093 | |||||||||||||||
| Total liabilities | 763,585 | 361,593 | |||||||||||||||
| Commitments and contingencies | |||||||||||||||||
| Stockholders' equity: | |||||||||||||||||
| Class A Convertible Preferred Stock, $0.01 par value, $1,000 liquidation value per share - 0 and 100 shares authorized, issued and outstanding as of December 31, 2018 and 2017, respectively | — | 97,127 | |||||||||||||||
| Preferred stock, $.01 par value - 50,000 and 49,900 shares authorized, and none issued and outstanding as of December 31, 2018 and 2017, respectively | — | — | |||||||||||||||
| Class A common stock, $0.001 par value - 500,000 shares authorized, 41,208 and 18,096 shares issued and outstanding as of December 31, 2018 and 2017, respectively | 41 | 18 | |||||||||||||||
| Class B common stock, $0.001 par value - 125,000 shares authorized, 104,336 and 114,664 shares issued and outstanding as of December 31, 2018 and 2017, respectively | 104 | 115 | |||||||||||||||
| Additional paid in capital | 147,916 | 41,375 | |||||||||||||||
| Accumulated deficit | (74,653) | (12,899) | |||||||||||||||
| Total stockholders' equity attributable to Carvana Co. | 73,408 | 125,736 | |||||||||||||||
| Non-controlling interests | 154,020 | 153,808 | |||||||||||||||
| Total stockholders' equity | 227,428 | 279,544 | |||||||||||||||
| Total liabilities & stockholders' equity | $ | 991,013 | $ | 641,137 | |||||||||||||
(1) As of December 31, 2018, a related party held $15.0 million of the senior unsecured notes.
CARVANA CO. AND SUBSIDIARIES
CONSOLIDATED STATEMENTS OF OPERATIONS
(In thousands, except per share amounts)
| Three Months Ended December 31, | Years Ended December 31, | ||||||||||||||||||||||||||||||||||||||||||||||
| 2018 | 2017 | 2018 | 2017 | ||||||||||||||||||||||||||||||||||||||||||||
| (unaudited) | |||||||||||||||||||||||||||||||||||||||||||||||
| Sales and operating revenues: | |||||||||||||||||||||||||||||||||||||||||||||||
| Used vehicle sales, net | $ | 526,798 | $ | 246,473 | $ | 1,785,045 | $ | 796,915 | |||||||||||||||||||||||||||||||||||||||
Wholesale vehicle sales(3) | 25,389 | 7,511 | 73,584 | 28,514 | |||||||||||||||||||||||||||||||||||||||||||
| Other sales and revenues, including $9,221, $2,877, $25,572 and $460, respectively, from related parties | 32,651 | 11,069 | 96,838 | 33,441 | |||||||||||||||||||||||||||||||||||||||||||
| Net sales and operating revenues | 584,838 | 265,053 | 1,955,467 | 858,870 | |||||||||||||||||||||||||||||||||||||||||||
| Cost of sales | 528,704 | 243,163 | 1,758,758 | 790,779 | |||||||||||||||||||||||||||||||||||||||||||
| Gross profit | 56,134 | 21,890 | 196,709 | 68,091 | |||||||||||||||||||||||||||||||||||||||||||
| Selling, general and administrative expenses | 130,652 | 66,805 | 425,258 | 223,400 | |||||||||||||||||||||||||||||||||||||||||||
| Interest expense, including $333, $0, $370 and $1,382, respectively, to related parties | 11,663 | 2,255 | 25,018 | 7,659 | |||||||||||||||||||||||||||||||||||||||||||
| Other expense, net | 223 | 68 | 1,178 | 1,348 | |||||||||||||||||||||||||||||||||||||||||||
| Net loss before income taxes | (86,404) | (47,238) | (254,745) | (164,316) | |||||||||||||||||||||||||||||||||||||||||||
| Income tax provision | — | — | — | — | |||||||||||||||||||||||||||||||||||||||||||
| Net loss | (86,404) | (47,238) | (254,745) | (164,316) | |||||||||||||||||||||||||||||||||||||||||||
| Net loss attributable to non-controlling interests | (57,700) | (41,758) | (192,991) | (101,475) | |||||||||||||||||||||||||||||||||||||||||||
| Net loss attributable to Carvana Co. | (28,704) | (5,480) | (61,754) | (62,841) | |||||||||||||||||||||||||||||||||||||||||||
| Dividends on Class A convertible preferred stock | (256) | (413) | (4,206) | (413) | |||||||||||||||||||||||||||||||||||||||||||
| Accretion of beneficial conversion feature on Class A convertible preferred stock | — | (1,237) | (1,380) | (1,237) | |||||||||||||||||||||||||||||||||||||||||||
| Net loss attributable to Class A common stockholders | $ | (28,960) | $ | (7,130) | $ | (67,340) | $ | (64,491) | |||||||||||||||||||||||||||||||||||||||
Net loss per share of Class A common stock, basic and diluted(1) | $ | (0.74) | $ | (0.45) | $ | (2.24) | $ | (1.31) | |||||||||||||||||||||||||||||||||||||||
Weighted-average shares of Class A common stock, basic and diluted(1)(2) | 39,392 | 15,891 | 30,043 | 15,241 | |||||||||||||||||||||||||||||||||||||||||||
(1) Amounts for periods prior to the initial public offering have been retrospectively adjusted to give effect to 15.0 million shares of Class A common stock issued in the initial public offering and the Organizational Transactions.
(2) Weighted-average shares of Class A common stock outstanding have been adjusted for unvested restricted stock awards.
(3) Wholesale vehicle sales revenue relates to 4,717 and 1,844 during the three months ended December 31, 2018 and 2017, respectively, and 15,125 and 6,509 wholesale units sold during the years ended December 31, 2018 and 2017, respectively.
CARVANA CO. AND SUBSIDIARIES
CONSOLIDATED STATEMENTS OF CASH FLOWS
(In thousands)
| For the Years Ended December 31, | |||||||||||||||||||||||||||||
| 2018 | 2017 | 2016 | |||||||||||||||||||||||||||
| Cash Flows from Operating Activities: | |||||||||||||||||||||||||||||
| Net loss | $ | (254,745) | $ | (164,316) | $ | (93,112) | |||||||||||||||||||||||
| Adjustments to reconcile net loss to net cash used in operating activities: | |||||||||||||||||||||||||||||
| Depreciation and amortization expense | 23,539 | 11,568 | 4,658 | ||||||||||||||||||||||||||
| Loss on disposal of property and equipment | 575 | 958 | — | ||||||||||||||||||||||||||
| Provision for bad debt and valuation allowance | 1,917 | 1,375 | 1,348 | ||||||||||||||||||||||||||
| Gain on loan sales, including $0, $0 and $269 from related parties, respectively | (51,729) | (21,697) | (7,446) | ||||||||||||||||||||||||||
| Equity-based compensation expense | 24,095 | 5,611 | 555 | ||||||||||||||||||||||||||
| Amortization and write-off of debt issuance costs | 2,305 | 1,646 | — | ||||||||||||||||||||||||||
| Originations of finance receivables | (1,259,539) | (529,153) | (224,169) | ||||||||||||||||||||||||||
| Proceeds from sale of finance receivables | 1,633,519 | 527,265 | 269,262 | ||||||||||||||||||||||||||
| Purchase of finance receivables | (387,445) | — | — | ||||||||||||||||||||||||||
| Proceeds from sale of finance receivables to related party | — | — | 13,015 | ||||||||||||||||||||||||||
| Purchase of finance receivables from related party | — | — | (74,589) | ||||||||||||||||||||||||||
| Changes in assets and liabilities: | |||||||||||||||||||||||||||||
| Accounts receivable | (19,212) | (8,715) | (3,492) | ||||||||||||||||||||||||||
| Vehicle inventory | (183,068) | (40,839) | (117,468) | ||||||||||||||||||||||||||
| Other current assets | (7,291) | (6,605) | (7,157) | ||||||||||||||||||||||||||
| Other assets, including $1,895, $0 and $0 due from related parties, respectively | (4,958) | (1,019) | — | ||||||||||||||||||||||||||
| Accounts payable and accrued liabilities | 66,461 | 16,986 | 17,922 | ||||||||||||||||||||||||||
| Accounts payable to related party | 2,089 | (82) | (19,552) | ||||||||||||||||||||||||||
| Other liabilities | (853) | 7,093 | — | ||||||||||||||||||||||||||
| Net cash used in operating activities | (414,340) | (199,924) | (240,225) | ||||||||||||||||||||||||||
| Cash Flows from Investing Activities: | |||||||||||||||||||||||||||||
| Purchases of property and equipment | (143,668) | (78,490) | (39,539) | ||||||||||||||||||||||||||
| Business acquisitions, net of cash acquired | (6,670) | — | — | ||||||||||||||||||||||||||
| Net cash used in investing activities | (150,338) | (78,490) | (39,539) | ||||||||||||||||||||||||||
| Cash Flows from Financing Activities: | |||||||||||||||||||||||||||||
| Proceeds from floor plan facility | 1,848,051 | 949,144 | 410,562 | ||||||||||||||||||||||||||
| Payments on floor plan facility | (1,899,880) | (865,665) | (287,551) | ||||||||||||||||||||||||||
Proceeds from issuance of senior unsecured notes, including $25,000(1), $0, and $0 from related parties, respectively | 350,000 | — | — | ||||||||||||||||||||||||||
| Proceeds from Verde Credit Facility | — | 35,000 | — | ||||||||||||||||||||||||||
| Payments on Verde Credit Facility | — | (35,000) | — | ||||||||||||||||||||||||||
| Proceeds from long-term debt | 49,063 | 32,698 | — | ||||||||||||||||||||||||||
| Payments on long-term debt | (35,522) | (2,259) | (284) | ||||||||||||||||||||||||||
| Payments of debt issuance costs, including $0, $1,000 and $0 to related parties, respectively | (11,390) | (2,055) | (728) | ||||||||||||||||||||||||||
| Net proceeds from issuance of Class A common stock | 172,287 | 206,198 | (398) | ||||||||||||||||||||||||||
| Net proceeds from issuance of Class A Convertible Preferred Stock | (12) | 98,682 | — | ||||||||||||||||||||||||||
| Proceeds from exercise of stock options | 795 | 48 | — | ||||||||||||||||||||||||||
| Tax withholdings related to restricted stock awards | (2,509) | (704) | — | ||||||||||||||||||||||||||
| Proceeds from issuance of Class C redeemable preferred units | — | — | 162,446 | ||||||||||||||||||||||||||
| Class C redeemable preferred units issuance costs | — | — | (82) | ||||||||||||||||||||||||||
| Dividends paid | (4,619) | — | — | ||||||||||||||||||||||||||
| Net cash provided by financing activities | 466,264 | 416,087 | 283,965 | ||||||||||||||||||||||||||
| Net (decrease) increase in cash and cash equivalents | (98,414) | 137,673 | 4,201 | ||||||||||||||||||||||||||
| Cash, cash equivalents and restricted cash at beginning of period | 187,123 | 49,450 | 45,249 | ||||||||||||||||||||||||||
| Cash, cash equivalents and restricted cash at end of period | $ | 88,709 | $ | 187,123 | $ | 49,450 | |||||||||||||||||||||||
(1) A related party initially acquired $25.0 million of the senior unsecured notes, of which it subsequently disposed of $10.0 million, and held $15.0 million as of December 31, 2018.
CARVANA CO. AND SUBSIDIARIES
RECONCILIATION OF GAAP TO NON-GAAP FINANCIAL MEASURES
(Unaudited)
Adjusted Net Loss and Adjusted Net Loss per Share
Adjusted net loss and adjusted net loss per share are supplemental measures of operating performance that do not represent and should not be considered alternatives to net loss and net loss per share, as determined under GAAP. We believe that by assuming the full exchange of all outstanding LLC Units and excluding the expense associated with the 100k Milestone Gift for the reasons described above, adjusted net loss and adjusted net loss per share supplement GAAP measures and enable us and our investors to more effectively evaluate our performance period-over-period and relative to our competitors that have different organizational and tax structures because the assumption eliminates the effect of any changes in net income attributable to Carvana Co. driven by increases in our ownership of Carvana Group, LLC as well as the expense associated with the 100k Milestone Gift, which are unrelated to our operating performance. A reconciliation of adjusted net loss to net loss attributable to Carvana Co., the most directly comparable GAAP measure, and the computation of adjusted net loss per share are as follows (in thousands, except per share amounts):
| Three Months Ended | |||||||||||||||||||||||||||||||||||||||||||||||||||||||||||||||||||||||||||||||||||||||||||||||||||||
| Mar 31, 2017 | Jun 30, 2017 | Sep 30, 2017 | Dec 31, 2017 | Mar 31, 2018 | Jun 30, 2018 | Sep 30, 2018 | Dec 31, 2018 | ||||||||||||||||||||||||||||||||||||||||||||||||||||||||||||||||||||||||||||||||||||||||||||||
| Numerator: | |||||||||||||||||||||||||||||||||||||||||||||||||||||||||||||||||||||||||||||||||||||||||||||||||||||
| Net loss attributable to Carvana Co. | $ | (38,439) | $ | (14,542) | $ | (4,380) | $ | (5,480) | $ | (7,043) | $ | (9,965) | $ | (16,042) | $ | (28,704) | |||||||||||||||||||||||||||||||||||||||||||||||||||||||||||||||||||||||||||||||||||||
| Net loss attributable to non-controlling interests | — | (24,328) | (35,389) | (41,758) | (45,629) | (41,285) | (48,377) | (57,700) | |||||||||||||||||||||||||||||||||||||||||||||||||||||||||||||||||||||||||||||||||||||||||||||
| Dividends on Class A convertible preferred stock | — | — | — | (413) | (1,345) | (1,375) | (1,230) | (256) | |||||||||||||||||||||||||||||||||||||||||||||||||||||||||||||||||||||||||||||||||||||||||||||
| Accretion of beneficial conversion feature on Class A convertible preferred stock | — | — | — | (1,237) | (1,380) | — | — | — | |||||||||||||||||||||||||||||||||||||||||||||||||||||||||||||||||||||||||||||||||||||||||||||
| 100k Milestone Gift | — | — | — | — | — | — | 7,761 | 4,060 | |||||||||||||||||||||||||||||||||||||||||||||||||||||||||||||||||||||||||||||||||||||||||||||
| Net loss attributable to Carvana Co. Class A common stockholders, basic and diluted | $ | (38,439) | $ | (38,870) | $ | (39,769) | $ | (48,888) | $ | (55,397) | $ | (52,625) | $ | (57,888) | $ | (82,600) | |||||||||||||||||||||||||||||||||||||||||||||||||||||||||||||||||||||||||||||||||||||
| Denominator: | |||||||||||||||||||||||||||||||||||||||||||||||||||||||||||||||||||||||||||||||||||||||||||||||||||||
Weighted-average shares of Class A common stock outstanding(1)(3) | 15,000 | 15,026 | 15,045 | 15,891 | 18,346 | 27,780 | 34,655 | 39,392 | |||||||||||||||||||||||||||||||||||||||||||||||||||||||||||||||||||||||||||||||||||||||||||||
| Adjustments: | |||||||||||||||||||||||||||||||||||||||||||||||||||||||||||||||||||||||||||||||||||||||||||||||||||||
Assumed exchange of LLC Units for shares of Class A common stock (2) | 121,760 | 121,666 | 121,989 | 121,057 | 118,858 | 114,897 | 111,157 | 109,974 | |||||||||||||||||||||||||||||||||||||||||||||||||||||||||||||||||||||||||||||||||||||||||||||
| Adjusted shares of Class A common stock outstanding | 136,760 | 136,692 | 137,034 | 136,948 | 137,204 | 142,677 | 145,812 | 149,366 | |||||||||||||||||||||||||||||||||||||||||||||||||||||||||||||||||||||||||||||||||||||||||||||
| Adjusted net loss per share | $ | (0.28) | $ | (0.28) | $ | (0.29) | $ | (0.36) | $ | (0.40) | $ | (0.37) | $ | (0.40) | $ | (0.55) | |||||||||||||||||||||||||||||||||||||||||||||||||||||||||||||||||||||||||||||||||||||
(1) Amounts for periods prior to the initial public offering have been retrospectively adjusted to give effect to 15.0 million shares of Class A common stock issued in the initial public offering.
(2) Amounts for periods prior to the initial public offering have been retrospectively adjusted to include all LLC units outstanding at the initial public offering, including conversion of the Class C Redeemable Preferred Units into Class A Units on a one-for-one basis. Also assumes exchange of all outstanding LLC Units for shares of Class A common stock during each period presented.
(3) Excludes portions of unvested restricted stock awards and vested and unvested stock options outstanding because they were determined to be anti-dilutive.
CARVANA CO. AND SUBSIDIARIES
RECONCILIATION OF GAAP TO NON-GAAP FINANCIAL MEASURES (continued)
(Unaudited)
Gross Profit ex-Gift and Gross Profit per Unit ex-Gift
Gross Profit ex-Gift and Gross Profit per Unit ex-Gift are non-GAAP supplemental measures of operating performance that do not represent and should not be considered an alternative to gross profit, as determined by GAAP. Gross Profit ex-Gift is defined as gross profit before compensation expense related to the 100k Milestone Gift included in cost of sales. Gross Profit per Unit ex-Gift is Gross Profit ex-Gift divided by units sold. We use Gross Profit ex-Gift to measure the operating performance of our business and Gross Profit per Unit ex-Gift to measure our operating performance relative to our units sold. We believe that Gross Profit ex-Gift and Gross Profit per Unit ex-Gift are useful measures to us and to our investors because they exclude the expense associated with the 100k Milestone Gift recognized in cost of sales. We expect the 100k Milestone Gift to be a one-time award program for which we will recognize varying amounts of expense through the first half of 2020, and therefore we believe the related expense does not reflect our core operations, is not included in our past operations, and may not be indicative of our future operations. Additionally, the shares issued to settle the 100k Milestone Gift are offset by share contributions from Mr. Garcia to the Company, therefore we expect the impact on shares outstanding to be zero. We believe that excluding it enables us to more effectively evaluate our performance period-over-period and relative to our competitors. A reconciliation the Gross Profit ex-Gift amounts to each corresponding gross profit amount, which are the most directly comparable GAAP measures and include expenses attributable to the Gift, and calculations of each Gross Profit per Unit ex-Gift amount are as follows (dollars in thousands, except per unit amounts):
| Three Months Ended December 31, 2018 | ||||||||||||||||||||||||||||||||||||||||||||
| GAAP | Less: Gift | Ex-gift | Gross Profit per Unit ex-Gift | |||||||||||||||||||||||||||||||||||||||||
| Used vehicle unit sales | 27,750 | |||||||||||||||||||||||||||||||||||||||||||
| Wholesale vehicle unit sales | 4,717 | |||||||||||||||||||||||||||||||||||||||||||
| Sales and operating revenues: | ||||||||||||||||||||||||||||||||||||||||||||
| Used vehicle sales, net | $ | 526,798 | $ | — | $ | 526,798 | ||||||||||||||||||||||||||||||||||||||
| Wholesale vehicle sales | 25,389 | — | 25,389 | |||||||||||||||||||||||||||||||||||||||||
| Other sales and revenues, including $9,221 from related parties | 32,651 | — | 32,651 | |||||||||||||||||||||||||||||||||||||||||
| Net sales and operating revenues | 584,838 | — | 584,838 | |||||||||||||||||||||||||||||||||||||||||
| Cost of sales | 528,704 | (3,002) | 525,702 | |||||||||||||||||||||||||||||||||||||||||
Used vehicle gross profit (1) | 22,482 | (2,889) | 25,371 | $ | 914 | |||||||||||||||||||||||||||||||||||||||
Wholesale vehicle gross profit (2) | 1,001 | (113) | 1,114 | $ | 236 | |||||||||||||||||||||||||||||||||||||||
Other gross profit (1) | 32,651 | — | 32,651 | $ | 1,177 | |||||||||||||||||||||||||||||||||||||||
Total gross profit (1) | 56,134 | (3,002) | 59,136 | $ | 2,131 | |||||||||||||||||||||||||||||||||||||||
| Selling, general and administrative expenses | 130,652 | 1,058 | 129,594 | |||||||||||||||||||||||||||||||||||||||||
| Interest expense, including $333 to related parties | 11,663 | — | 11,663 | |||||||||||||||||||||||||||||||||||||||||
| Other expense, net | 223 | — | 223 | |||||||||||||||||||||||||||||||||||||||||
| Net loss before income taxes | (86,404) | (4,060) | (82,344) | |||||||||||||||||||||||||||||||||||||||||
| Income tax provision | — | — | — | |||||||||||||||||||||||||||||||||||||||||
| Net loss | $ | (86,404) | $ | (4,060) | $ | (82,344) | ||||||||||||||||||||||||||||||||||||||
| (1) Used vehicle, other and total gross profit per unit amounts are per used vehicle sold. | ||||||||||||||||||||||||||||||||||||||||||||
| (2) Wholesale vehicle gross profit per unit amounts are per wholesale vehicle sold. | ||||||||||||||||||||||||||||||||||||||||||||
CARVANA CO. AND SUBSIDIARIES
RECONCILIATION OF GAAP TO NON-GAAP FINANCIAL MEASURES (continued)
(Unaudited)
| Year Ended December 31, 2018 | ||||||||||||||||||||||||||||||||||||||||||||
| GAAP | Less: Gift | Ex-gift | Gross Profit per Unit ex-Gift | |||||||||||||||||||||||||||||||||||||||||
| Used vehicle unit sales | 94,108 | |||||||||||||||||||||||||||||||||||||||||||
| Wholesale vehicle unit sales | 15,125 | |||||||||||||||||||||||||||||||||||||||||||
| Sales and operating revenues: | ||||||||||||||||||||||||||||||||||||||||||||
| Used vehicle sales, net | $ | 1,785,045 | $ | — | $ | 1,785,045 | ||||||||||||||||||||||||||||||||||||||
| Wholesale vehicle sales | 73,584 | — | 73,584 | |||||||||||||||||||||||||||||||||||||||||
| Other sales and revenues, including $25,572 from related parties | 96,838 | — | 96,838 | |||||||||||||||||||||||||||||||||||||||||
| Net sales and operating revenues | 1,955,467 | — | 1,955,467 | |||||||||||||||||||||||||||||||||||||||||
| Cost of sales | 1,758,758 | (4,003) | 1,762,761 | |||||||||||||||||||||||||||||||||||||||||
Used vehicle gross profit (1) | 94,319 | (3,870) | 98,189 | $ | 1,043 | |||||||||||||||||||||||||||||||||||||||
Wholesale vehicle gross profit (2) | 5,552 | (133) | 5,685 | $ | 376 | |||||||||||||||||||||||||||||||||||||||
Other gross profit (1) | 96,838 | — | 96,838 | $ | 1,029 | |||||||||||||||||||||||||||||||||||||||
Total gross profit (1) | 196,709 | (4,003) | 200,712 | $ | 2,133 | |||||||||||||||||||||||||||||||||||||||
| Selling, general and administrative expenses | 425,258 | 7,818 | 417,440 | |||||||||||||||||||||||||||||||||||||||||
| Interest expense, including $370 to related parties | 25,018 | — | 25,018 | |||||||||||||||||||||||||||||||||||||||||
| Other expense, net | 1,178 | — | 1,178 | |||||||||||||||||||||||||||||||||||||||||
| Net loss before income taxes | (254,745) | (11,821) | (242,924) | |||||||||||||||||||||||||||||||||||||||||
| Income tax provision | — | — | — | |||||||||||||||||||||||||||||||||||||||||
| Net loss | $ | (254,745) | $ | (11,821) | $ | (242,924) | ||||||||||||||||||||||||||||||||||||||
| (1) Used vehicle, other and total gross profit per unit amounts are per used vehicle sold. | ||||||||||||||||||||||||||||||||||||||||||||
| (2) Wholesale vehicle gross profit per unit amounts are per wholesale vehicle sold. | ||||||||||||||||||||||||||||||||||||||||||||
CARVANA CO. AND SUBSIDIARIES
RECONCILIATION OF GAAP TO NON-GAAP FINANCIAL MEASURES (continued)
(Unaudited)
EBITDA and EBITDA Margin
EBITDA ex-Gift and EBITDA Margin ex-Gift are non-GAAP supplemental measures of operating performance that do not represent and should not be considered an alternative to net loss or cash flow from operations, as determined by GAAP. EBITDA ex-Gift is defined as net loss before interest expense, income tax expense, depreciation and amortization expense, and the expense related to the 100k Milestone Gift. EBITDA Margin ex-Gift is EBITDA ex-Gift as a percentage of total revenues. We use EBITDA ex-Gift to measure the operating performance of our business and EBITDA Margin ex-Gift to measure our operating performance relative to our total revenues. We believe that EBITDA ex-Gift and EBITDA Margin ex-Gift are useful measures to us and to our investors because they exclude certain financial and capital structure items and the expense associated with the 100k Milestone Gift, that we do not believe directly reflect our core operations and may not be indicative of our recurring operations, in part because they may vary widely across time and within our industry independent of the performance of our core operations. In particular, we expect the 100k Milestone Gift to be a one-time award program for which we will recognize varying amounts of expense through the first half of 2020, and therefore we believe the related expense does not reflect our core operations, is not included in our past operations, and may not be indicative of our future operations. Additionally, the shares issued to settle the 100k Milestone Gift are offset by share contributions from Mr. Garcia to the Company, therefore we expect the impact on shares outstanding to be zero. We believe that excluding these items enables us to more effectively evaluate our performance period-over-period and relative to our competitors. EBITDA ex-Gift and EBITDA Margin ex-Gift may not be comparable to similarly titled measures provided by other companies due to potential differences in methods of calculations. A reconciliation of EBITDA ex-Gift to net loss (which includes Gift expense), the most directly comparable GAAP measure, and calculation of EBITDA Margin ex-Gift is as follows (dollars in thousands):
| Three Months Ended | |||||||||||||||||||||||||||||||||||||||||||||||||||||||||||||||||||||||||||||||||||||||||||||||||||||||||||
| Mar 31, 2017 | Jun 30, 2017 | Sep 30, 2017 | Dec 31, 2017 | Mar 31, 2018 | Jun 30, 2018 | Sep 30, 2018 | Dec 31, 2018 | ||||||||||||||||||||||||||||||||||||||||||||||||||||||||||||||||||||||||||||||||||||||||||||||||||||
| Net loss | $ | (38,439) | $ | (38,870) | $ | (39,769) | $ | (47,238) | $ | (52,672) | $ | (51,250) | $ | (64,419) | $ | (86,404) | |||||||||||||||||||||||||||||||||||||||||||||||||||||||||||||||||||||||||||||||||||||||||||
| Depreciation and amortization expense | 2,061 | 2,584 | 3,101 | 3,822 | 4,605 | 5,257 | 6,439 | 7,238 | |||||||||||||||||||||||||||||||||||||||||||||||||||||||||||||||||||||||||||||||||||||||||||||||||||
| Interest expense | 2,059 | 2,507 | 838 | 2,255 | 3,541 | 4,165 | 5,649 | 11,663 | |||||||||||||||||||||||||||||||||||||||||||||||||||||||||||||||||||||||||||||||||||||||||||||||||||
| 100k Milestone Gift | — | — | — | — | — | — | 7,761 | 4,060 | |||||||||||||||||||||||||||||||||||||||||||||||||||||||||||||||||||||||||||||||||||||||||||||||||||
| EBITDA ex-Gift | $ | (34,319) | $ | (33,779) | $ | (35,830) | $ | (41,161) | $ | (44,526) | $ | (41,828) | $ | (44,570) | $ | (63,443) | |||||||||||||||||||||||||||||||||||||||||||||||||||||||||||||||||||||||||||||||||||||||||||
| Total revenues | $ | 159,073 | $ | 209,365 | $ | 225,379 | $ | 265,053 | $ | 360,422 | $ | 475,286 | $ | 534,921 | $ | 584,838 | |||||||||||||||||||||||||||||||||||||||||||||||||||||||||||||||||||||||||||||||||||||||||||
| Net Loss Margin | (24.2) | % | (18.6) | % | (17.6) | % | (17.8) | % | (14.6) | % | (10.8) | % | (12.0) | % | (14.8) | % | |||||||||||||||||||||||||||||||||||||||||||||||||||||||||||||||||||||||||||||||||||||||||||
| EBITDA Margin | (21.6) | % | (16.1) | % | (15.9) | % | (15.5) | % | (12.4) | % | (8.8) | % | (8.3) | % | (10.8) | % | |||||||||||||||||||||||||||||||||||||||||||||||||||||||||||||||||||||||||||||||||||||||||||
CARVANA CO. AND SUBSIDIARIES
RECONCILIATION OF GAAP TO NON-GAAP FINANCIAL MEASURES (continued)
(Unaudited)
| For the Year Ended December 31, | ||||||||||||||||||||||||||||||||
| 2018 | 2017 | 2016 | ||||||||||||||||||||||||||||||
| Net loss | $ | (254,745) | $ | (164,316) | $ | (93,112) | ||||||||||||||||||||||||||
| Depreciation and amortization expense | 23,539 | 11,568 | 4,658 | |||||||||||||||||||||||||||||
| Interest expense | 25,018 | 7,659 | 3,587 | |||||||||||||||||||||||||||||
| 100k Milestone Gift | 11,821 | — | — | |||||||||||||||||||||||||||||
| EBITDA ex-Gift | $ | (194,367) | $ | (145,089) | $ | (84,867) | ||||||||||||||||||||||||||
| Total revenues | $ | 1,955,467 | $ | 858,870 | $ | 365,148 | ||||||||||||||||||||||||||
| Net Loss Margin | (13.0) | % | (19.1) | % | (25.5) | % | ||||||||||||||||||||||||||
| EBITDA Margin ex-Gift | (9.9) | % | (16.9) | % | (23.2) | % | ||||||||||||||||||||||||||
CARVANA CO. AND SUBSIDIARIES
RESULTS OF OPERATIONS
(Unaudited)
| Three Months Ended | ||||||||||||||||||||||||||||||||||||||||||||||||||||||||||||||||||||||||||||||||||||||||||||||||||
| Mar 31, 2017 | Jun 30, 2017 | Sep 30, 2017 | Dec 31, 2017 | Mar 31, 2018 | Jun 30, 2018 | Sep 30, 2018 | Dec 31, 2018 | |||||||||||||||||||||||||||||||||||||||||||||||||||||||||||||||||||||||||||||||||||||||||||
| (dollars in thousands, except per unit amounts) | ||||||||||||||||||||||||||||||||||||||||||||||||||||||||||||||||||||||||||||||||||||||||||||||||||
| Net sales and operating revenues: | ||||||||||||||||||||||||||||||||||||||||||||||||||||||||||||||||||||||||||||||||||||||||||||||||||
| Used vehicle sales, net | $ | 148,382 | $ | 193,947 | $ | 208,113 | $ | 246,473 | $ | 334,056 | $ | 437,922 | $ | 486,269 | $ | 526,798 | ||||||||||||||||||||||||||||||||||||||||||||||||||||||||||||||||||||||||||||||||||
| Wholesale vehicle sales | 5,726 | 7,818 | 7,459 | 7,511 | 10,133 | 16,622 | 21,440 | 25,389 | ||||||||||||||||||||||||||||||||||||||||||||||||||||||||||||||||||||||||||||||||||||||||||
Other sales and revenues (1) | 4,965 | 7,600 | 9,807 | 11,069 | 16,233 | 20,742 | 27,212 | 32,651 | ||||||||||||||||||||||||||||||||||||||||||||||||||||||||||||||||||||||||||||||||||||||||||
| Total net sales and operating revenues | $ | 159,073 | $ | 209,365 | $ | 225,379 | $ | 265,053 | $ | 360,422 | $ | 475,286 | $ | 534,921 | $ | 584,838 | ||||||||||||||||||||||||||||||||||||||||||||||||||||||||||||||||||||||||||||||||||
| Gross profit (incl. Gift): | ||||||||||||||||||||||||||||||||||||||||||||||||||||||||||||||||||||||||||||||||||||||||||||||||||
| Used vehicle gross profit | $ | 4,626 | $ | 8,172 | $ | 9,859 | $ | 10,149 | $ | 16,645 | $ | 26,641 | $ | 28,549 | $ | 22,482 | ||||||||||||||||||||||||||||||||||||||||||||||||||||||||||||||||||||||||||||||||||
| Wholesale vehicle gross profit | 155 | 267 | 751 | 672 | 1,355 | 1,652 | 1,544 | 1,001 | ||||||||||||||||||||||||||||||||||||||||||||||||||||||||||||||||||||||||||||||||||||||||||
Other gross profit (1) | 4,965 | 7,600 | 9,806 | 11,069 | 16,234 | 20,742 | 27,213 | 32,651 | ||||||||||||||||||||||||||||||||||||||||||||||||||||||||||||||||||||||||||||||||||||||||||
| Total gross profit | $ | 9,746 | $ | 16,039 | $ | 20,416 | $ | 21,890 | $ | 34,234 | $ | 49,035 | $ | 57,306 | $ | 56,134 | ||||||||||||||||||||||||||||||||||||||||||||||||||||||||||||||||||||||||||||||||||
Gross profit ex-Gift: (3) | ||||||||||||||||||||||||||||||||||||||||||||||||||||||||||||||||||||||||||||||||||||||||||||||||||
| Used vehicle gross profit | $ | 4,626 | $ | 8,172 | $ | 9,859 | $ | 10,149 | $ | 16,645 | $ | 26,641 | $ | 29,530 | $ | 25,371 | ||||||||||||||||||||||||||||||||||||||||||||||||||||||||||||||||||||||||||||||||||
| Wholesale vehicle gross profit | 155 | 267 | 751 | 672 | 1,355 | 1,652 | 1,564 | 1,114 | ||||||||||||||||||||||||||||||||||||||||||||||||||||||||||||||||||||||||||||||||||||||||||
Other gross profit (1) | 4,965 | 7,600 | 9,806 | 11,069 | 16,234 | 20,742 | 27,213 | 32,651 | ||||||||||||||||||||||||||||||||||||||||||||||||||||||||||||||||||||||||||||||||||||||||||
| Total gross profit ex-Gift | $ | 9,746 | $ | 16,039 | $ | 20,416 | $ | 21,890 | $ | 34,234 | $ | 49,035 | $ | 58,307 | $ | 59,136 | ||||||||||||||||||||||||||||||||||||||||||||||||||||||||||||||||||||||||||||||||||
| Market information: | ||||||||||||||||||||||||||||||||||||||||||||||||||||||||||||||||||||||||||||||||||||||||||||||||||
| Markets, beginning of period | 21 | 23 | 30 | 39 | 44 | 56 | 65 | 78 | ||||||||||||||||||||||||||||||||||||||||||||||||||||||||||||||||||||||||||||||||||||||||||
| Market launches | 2 | 7 | 9 | 5 | 12 | 9 | 13 | 7 | ||||||||||||||||||||||||||||||||||||||||||||||||||||||||||||||||||||||||||||||||||||||||||
| Markets, end of period | 23 | 30 | 39 | 44 | 56 | 65 | 78 | 85 | ||||||||||||||||||||||||||||||||||||||||||||||||||||||||||||||||||||||||||||||||||||||||||
| Unit sales information: | ||||||||||||||||||||||||||||||||||||||||||||||||||||||||||||||||||||||||||||||||||||||||||||||||||
| Used vehicle unit sales | 8,334 | 10,682 | 11,719 | 13,517 | 18,464 | 22,570 | 25,324 | 27,750 | ||||||||||||||||||||||||||||||||||||||||||||||||||||||||||||||||||||||||||||||||||||||||||
| Wholesale vehicle unit sales | 1,288 | 1,580 | 1,797 | 1,844 | 2,342 | 3,658 | 4,408 | 4,717 | ||||||||||||||||||||||||||||||||||||||||||||||||||||||||||||||||||||||||||||||||||||||||||
| Per unit selling prices: | ||||||||||||||||||||||||||||||||||||||||||||||||||||||||||||||||||||||||||||||||||||||||||||||||||
| Used vehicles | $ | 17,804 | $ | 18,156 | $ | 17,759 | $ | 18,234 | $ | 18,092 | $ | 19,403 | $ | 19,202 | $ | 18,984 | ||||||||||||||||||||||||||||||||||||||||||||||||||||||||||||||||||||||||||||||||||
| Wholesale vehicles | $ | 4,446 | $ | 4,948 | $ | 4,151 | $ | 4,073 | $ | 4,327 | $ | 4,544 | $ | 4,864 | $ | 5,382 | ||||||||||||||||||||||||||||||||||||||||||||||||||||||||||||||||||||||||||||||||||
Per unit gross profit incl. Gift:(2) | ||||||||||||||||||||||||||||||||||||||||||||||||||||||||||||||||||||||||||||||||||||||||||||||||||
| Used vehicle gross profit | $ | 555 | $ | 765 | $ | 841 | $ | 751 | $ | 902 | $ | 1,180 | $ | 1,127 | $ | 810 | ||||||||||||||||||||||||||||||||||||||||||||||||||||||||||||||||||||||||||||||||||
| Wholesale vehicle gross profit | $ | 120 | $ | 169 | $ | 418 | $ | 364 | $ | 579 | $ | 452 | $ | 350 | $ | 212 | ||||||||||||||||||||||||||||||||||||||||||||||||||||||||||||||||||||||||||||||||||
| Other gross profit | $ | 596 | $ | 711 | $ | 837 | $ | 819 | $ | 879 | $ | 919 | $ | 1,075 | $ | 1,177 | ||||||||||||||||||||||||||||||||||||||||||||||||||||||||||||||||||||||||||||||||||
| Total gross profit | $ | 1,169 | $ | 1,501 | $ | 1,742 | $ | 1,619 | $ | 1,854 | $ | 2,173 | $ | 2,263 | $ | 2,023 | ||||||||||||||||||||||||||||||||||||||||||||||||||||||||||||||||||||||||||||||||||
Per unit gross profit ex-Gift:(2)(3) | ||||||||||||||||||||||||||||||||||||||||||||||||||||||||||||||||||||||||||||||||||||||||||||||||||
| Used vehicle gross profit | $ | 555 | $ | 765 | $ | 841 | $ | 751 | $ | 902 | $ | 1,180 | $ | 1,166 | $ | 914 | ||||||||||||||||||||||||||||||||||||||||||||||||||||||||||||||||||||||||||||||||||
| Wholesale vehicle gross profit | $ | 120 | $ | 169 | $ | 418 | $ | 364 | $ | 579 | $ | 452 | $ | 355 | $ | 236 | ||||||||||||||||||||||||||||||||||||||||||||||||||||||||||||||||||||||||||||||||||
| Other gross profit | $ | 596 | $ | 711 | $ | 837 | $ | 819 | $ | 879 | $ | 919 | $ | 1,075 | $ | 1,177 | ||||||||||||||||||||||||||||||||||||||||||||||||||||||||||||||||||||||||||||||||||
| Total gross profit | $ | 1,169 | $ | 1,501 | $ | 1,742 | $ | 1,619 | $ | 1,854 | $ | 2,173 | $ | 2,302 | $ | 2,131 | ||||||||||||||||||||||||||||||||||||||||||||||||||||||||||||||||||||||||||||||||||
| (1) Includes a portion of other sales and revenues from related parties. | ||||||||||||||||||||||||||||||||||||||||||||||||||||||||||||||||||||||||||||||||||||||||||||||||||
| (2) All gross profit per unit amounts are per used vehicle sold, except wholesale vehicle gross profit, which is per wholesale vehicle sold. | ||||||||||||||||||||||||||||||||||||||||||||||||||||||||||||||||||||||||||||||||||||||||||||||||||
| (3) Ex-Gift amounts exclude the expense related to the 100k Milestone Gift. See "Reconciliation of GAAP to Non-GAAP Financial Measures" for a reconciliation to the most directly comparable GAAP-based measure, when applicable. | ||||||||||||||||||||||||||||||||||||||||||||||||||||||||||||||||||||||||||||||||||||||||||||||||||
Components of SG&A
(Unaudited)
| Three Months Ended | ||||||||||||||||||||||||||||||||||||||||||||||||||||||||||||||||||||||||||||||||||||||||||||||||||
| Mar 31, 2017 | Jun 30, 2017 | Sep 30, 2017 | Dec 31, 2017 | Mar 31, 2018 | Jun 30, 2018 | Sep 30, 2018 | Dec 31, 2018 | |||||||||||||||||||||||||||||||||||||||||||||||||||||||||||||||||||||||||||||||||||||||||||
| (in thousands) | ||||||||||||||||||||||||||||||||||||||||||||||||||||||||||||||||||||||||||||||||||||||||||||||||||
Compensation and benefits (1) | $ | 16,303 | $ | 18,789 | $ | 19,404 | $ | 22,219 | $ | 24,987 | $ | 29,251 | $ | 34,411 | $ | 43,065 | ||||||||||||||||||||||||||||||||||||||||||||||||||||||||||||||||||||||||||||||||||
| 100k Milestone Gift | — | — | — | — | — | — | 6,760 | 1,058 | ||||||||||||||||||||||||||||||||||||||||||||||||||||||||||||||||||||||||||||||||||||||||||
| Advertising expense | 11,439 | 12,385 | 15,475 | 16,398 | 25,009 | 26,782 | 27,467 | 31,971 | ||||||||||||||||||||||||||||||||||||||||||||||||||||||||||||||||||||||||||||||||||||||||||
Market occupancy costs (2) | 983 | 1,424 | 1,734 | 2,081 | 2,510 | 2,618 | 3,110 | 3,859 | ||||||||||||||||||||||||||||||||||||||||||||||||||||||||||||||||||||||||||||||||||||||||||
Logistics (3) | 2,808 | 3,116 | 3,905 | 4,555 | 6,318 | 7,826 | 9,913 | 11,140 | ||||||||||||||||||||||||||||||||||||||||||||||||||||||||||||||||||||||||||||||||||||||||||
Other overhead costs (4) | 14,375 | 16,297 | 18,158 | 21,552 | 24,362 | 29,175 | 34,107 | 39,559 | ||||||||||||||||||||||||||||||||||||||||||||||||||||||||||||||||||||||||||||||||||||||||||
| Total | $ | 45,908 | $ | 52,011 | $ | 58,676 | $ | 66,805 | $ | 83,186 | $ | 95,652 | $ | 115,768 | $ | 130,652 | ||||||||||||||||||||||||||||||||||||||||||||||||||||||||||||||||||||||||||||||||||
| (1) Compensation and benefits includes all payroll and related costs, including benefits, payroll taxes and equity-based compensation, except those related to preparing vehicles for sale, which are included in cost of sales, those related to the development of software products for internal use, which are capitalized to software and depreciated over the estimated useful lives of the related assets, and those related to the 100k Milestone Gift. | ||||||||||||||||||||||||||||||||||||||||||||||||||||||||||||||||||||||||||||||||||||||||||||||||||
| (2) Market occupancy costs includes occupancy costs of our vending machines and hubs. It excludes occupancy costs related to reconditioning vehicles which are included in cost of sales and the portion related to corporate occupancy which are included in other costs. | ||||||||||||||||||||||||||||||||||||||||||||||||||||||||||||||||||||||||||||||||||||||||||||||||||
| (3) Logistics includes fuel, maintenance and depreciation related to operating our own transportation fleet and third party transportation fees, except the portion related to inbound transportation, which is included in cost of sales. | ||||||||||||||||||||||||||||||||||||||||||||||||||||||||||||||||||||||||||||||||||||||||||||||||||
| (4) Other costs include all other selling, general and administrative expenses such as IT expenses, corporate occupancy, professional services and insurance, limited warranty and title and registration. | ||||||||||||||||||||||||||||||||||||||||||||||||||||||||||||||||||||||||||||||||||||||||||||||||||
Liquidity Resources
(Unaudited)
| December 31, | |||||||||||||||||
| 2018 | 2017 | ||||||||||||||||
| (in thousands) | |||||||||||||||||
| Cash and cash equivalents | $ | 78,861 | $ | 172,680 | |||||||||||||
Availability under Floor Plan Facility(1) | 253,601 | 458 | |||||||||||||||
Availability under sale-leaseback agreements(2)(3) | 77,359 | 47,240 | |||||||||||||||
| Total liquidity resources available | $ | 409,821 | $ | 220,378 | |||||||||||||
(1) Based on pledging all eligible vehicles.
(2) Under the Master Sale-Leaseback Agreement, the total sales price of properties the Company has sold and is leasing back at any point in time is limited to $75.0 million. We are also party to other sale-leaseback arrangements.
(3) We have $132.4 million and $47.2 million of total unpledged gross real estate assets as of December 31, 2018 and 2017, respectively.