Exhibit 99.1
Dear Shareholders,
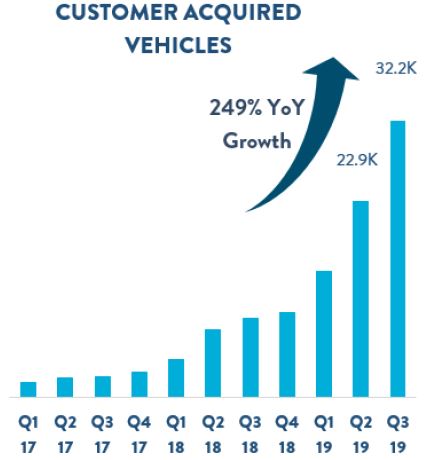
We’re pleased to announce strong third quarter 2019 results. We grew retail units by 83% and delivered our 23rd straight quarter of triple digit revenue growth. Our offering to buy vehicles from customers continues to resonate. When combining retail sales with standalone vehicle purchases from customers we grew our total transactions by 143% year-over-year in Q3, bringing our total customers served in the quarter to over 72k up from over 60k just last quarter.
Growth in total vehicles acquired from customers accelerated in Q3 2019 to 249% year-over-year, versus 188% last quarter. While this offering fundamentally strengthens our platform in the long-run, its exceptional growth exceeded our expectations, which led to some operational constraints and required additional investments. We have experienced and resolved similar pinch points in the past, and we are quickly adapting the business to support this exciting growth.
In addition to rapid growth in buying cars from customers, we continue to see strong trends in unit economics, with GPU up by approximately $700 year-over-year, net loss and EBITDA margin improved by over 3.2%, and continued strong trends in our cohort economics.
Our focus remains on our long-term goals of selling 2 million+ vehicles per year and becoming the largest and most profitable automotive retailer, and we are working diligently to achieve those goals while improving upon what we believe is already the best customer experience for buying or selling a car.
Summary of Q3 2019 Results
Complete financial tables appear at the end of this letter. We refer to items as “including Gift” that include the impact of the compensation expense related to the 100k Milestone Gift to employees, in accordance with GAAP. We also refer to several measures presented “ex-Gift,” which exclude the 100k Milestone Gift impact and are non-GAAP metrics with reconciliations available at the end of this letter. For additional information please refer to the details provided in our Q3 2018 shareholder letter. Unless otherwise noted, all financial comparisons stated below are versus Q3 2018.
Q3 2019:
Q3 2019 GAAP Results
•Retail units sold totaled 46,413 an increase of 83%
•Revenue totaled $1.095 billion, an increase of 105%
•Total gross profit, including Gift, was $137.5 million, an increase of 140%
•Net loss, including Gift, was $92.2 million, an increase of 43%
•Basic and diluted net loss, including Gift, per Class A share was $0.78 based on 49.8 million shares of Class A common stock outstanding
Q3 2019 Ex-Gift Results, non-GAAP
•Total gross profit per unit ex-Gift was $2,996, an increase of $694
•EBITDA margin ex-Gift was (5.1%), an improvement from (8.3%)
•Adjusted net loss per Class A share, was $0.56, based on 155.5 million adjusted shares of Class A common stock outstanding, assuming the exchange of all outstanding LLC Units for shares of Class A common stock
Q3 2019 Other Results
•Opened 9 new markets and four vending machines, bringing our end-of-quarter totals to 146 and 22, respectively
•Completed our third auto loan securitization, selling $600 million of principal balances and continuing to increase the number of investors participating across the capital structure
Recent Events
We would also like to highlight a recent notable accomplishment:
•Increased our floor plan line with Ally to $950 million from $650 million, adding significant flexibility to expand our inventory selection and buy more cars from customers
2019 Outlook
We are increasing our guidance for units, revenue, and GPU and fine tuning guidance for EBITDA margin based on our strong results so far this year and the investments we are making to support the rapid growth in buying cars from customers.
Our FY 2019 guidance is as follows. All financial comparisons stated below are versus FY 2018, unless otherwise noted.
•Retail unit sales of 174,000 – 176,000, an increase of 85% – 87%
•Revenue of $3.85 billion – $3.95 billion, an increase of 97% – 102%
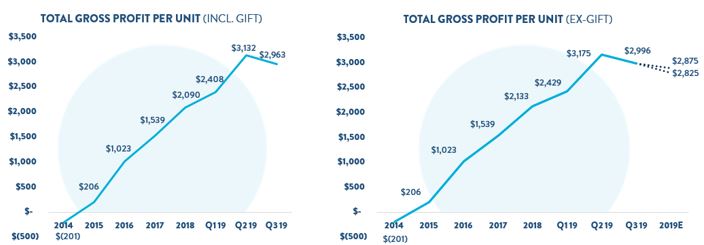
•Total gross profit per unit ex-Gift of $2,825 – $2,875, an increase from $2,133
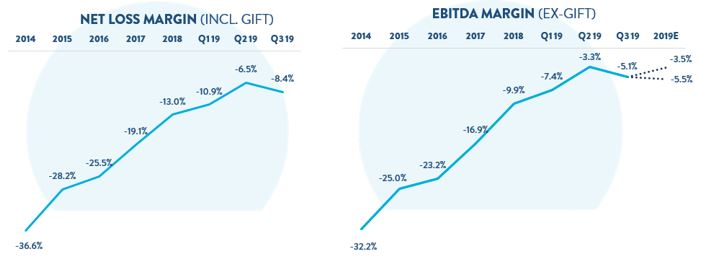
•EBITDA margin ex-Gift toward the higher loss end of our (5.5%) – (3.5%) range, an improvement from (9.9%)
For more information regarding the non-GAAP financial measures discussed in this letter, please see the reconciliations of our non-GAAP measurements to their most directly comparable GAAP-based financial measurements included at the end of this letter. Guidance for GPU ex-Gift excludes compensation expense from the 100k Milestone Gift that is capitalized to inventory and ultimately reflected in cost of sales. We have not reconciled GPU ex-Gift guidance to GAAP gross profit as a result of the uncertainty regarding, and the potential variability of, the stock price of our class A common shares, which will directly impact the amount of expense ultimately incurred as a result of the 100k Milestone Gift granted during FY 2019. Guidance for EBITDA margin ex-Gift excludes depreciation and amortization expense, interest expense, and expenses related to the 100k Milestone Gift. We have not reconciled EBITDA margin ex-Gift guidance to GAAP net loss as a result of the uncertainty regarding, and the potential variability of, interest expense and expenses related to the 100k Milestone Gift. Accordingly, reconciliations of the non-GAAP financial measure guidance above to the corresponding GAAP measures are not available without unreasonable effort. Depreciation and amortization expense, which is a component of the reconciliation between EBITDA margin and GAAP net loss, is expected to be between 1.0% and 1.2% of total revenues for FY 2019.
A Platform for Buying and Selling Cars
Our offering of buying cars from customers continues to make exciting progress. In the third quarter, we grew total cars purchased from customers by 249%, a 13x increase in just two years.
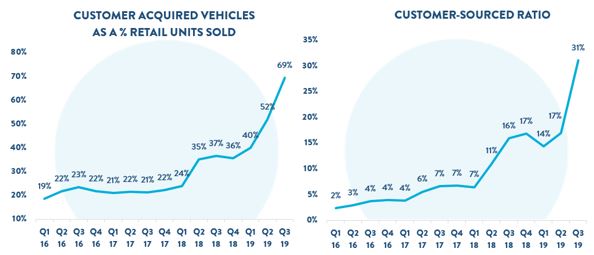
The 249% growth in Q3 led to purchasing over 32k vehicles from customers which equates to 69% as many cars as we sold to customers, up from 37% in Q3 2018. We are also increasingly sourcing our retail cars from customers. In the third quarter, we sourced 31% of our retail units sold from customers, up from 17% in the second quarter, and 7% two years ago.
This exceptional progress in buying cars from customers is significant in two important ways. The first is that it fundamentally strengthens our platform. Used car sales are simply customers swapping cars with one another through the elaborate mechanism of all of the institutions associated with automotive retail. As we build and integrate more elements of that system, we can create efficiencies and deliver a continually improving customer experience through a more robust platform that also has better unit economics.
Secondly, the speed of this progress demonstrates the power inherent in our platform. We have only intently focused on our offering of buying cars from customers for the last year and have already reached a transaction volume that took us 6 years to achieve in the retail business. This is a testament to the team we have assembled and the brand, technology, and infrastructure we have built.
Proven Expansion Model
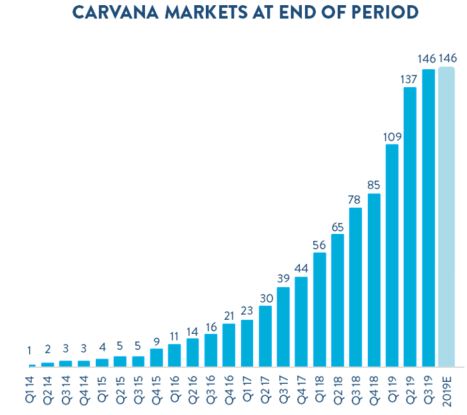
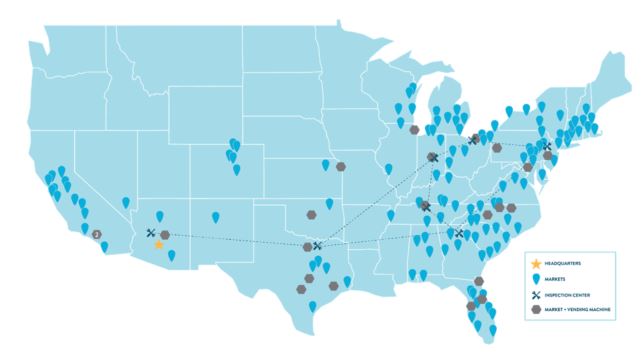
In addition to launching and rapidly scaling new customer offerings, our business model has proven that it can expand quickly into new markets and regions. We launched 9 new markets in the third quarter to reach a total of 146 as of September 30, 2019. We also opened four new vending machines in the quarter, bringing our total to 22, including two in greater Los Angeles. Our 9 new market openings in Q3 complete a record year of market expansion with 61 new markets adding 8.3% to our population coverage and increasing the total percentage of the U.S. population in our markets to 66.9%, up from 58.6% at the end of FY 2018. In the fourth quarter we plan to focus our operational efforts on alleviating pinch points and preparing the business for another significant growth year in 2020 and therefore do not anticipate opening additional markets in 2019.
In the past, we have discussed a target market framework that covered 80% of the U.S. population. Based on the success of our 2019 cohort, which included many smaller markets than we have historically launched, we now believe we can efficiently serve 90%+ of the U.S. population in our markets over time. In addition, we believe we can efficiently serve another 5% of the U.S. population in smaller cities and towns through delivery from our nearby markets, ultimately bringing the total share of the population we serve to 95%.
As we expand deeper into the city size distribution, we expect growth in population coverage to be more important than growth in number of markets. Rather than continue to guide on number of markets, in 2020 we plan to guide on total population coverage, which we define as the percent of the total U.S. population where we have (a) commenced our suite of local advertising, and (b) launched access to Carvana-branded home delivery through our in-house logistics network.
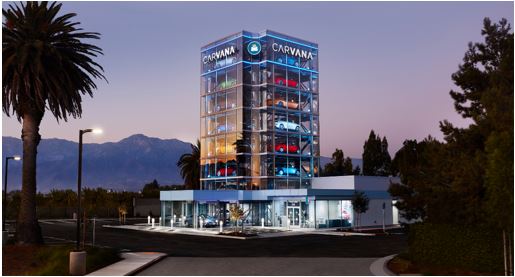
Carvana's Car Vending Machine in Ontario, California
Continuing the march toward our long-term goal of selling 2 million+ vehicles per year requires a multi-year expansion plan. This means ensuring that our entire operational chain can expand quickly enough to fulfill the strong and growing demand for our offering. In particular, we are building a pipeline of potential IRC sites, which are the longest lead-time component of our model. Our real estate, reconditioning, logistics, wholesale, and purchasing teams have aligned to build out an institutional process for identifying and developing sites that are optimized for supporting our customers and logistics network. We have begun construction on our 8th IRC that should begin vehicle production in 2020, a four-line facility in North Carolina capable of producing ~67k vehicles annually at full utilization. In addition, we have identified five
more sites where we expect to launch four-line facilities over time. We believe this is just one of many essential points of progress in laying the foundation to achieving our long-term goals.
IRCs deliver economies of scale that are a powerful force in our model. In particular, new IRCs create benefits in sales volumes and logistics expenses in surrounding markets. As a recent example, we opened two IRC’s earlier this year in Indianapolis and Cleveland. Since the fourth quarter of 2018, the ten markets nearest these IRCs have seen their average logistics expense per unit drop by 20% and their sales grow more than twice as fast as comparable markets as a result of customer reaction to faster delivery times.
For a complete list of our market opening history, estimated populations, and estimated total industry used vehicle sales by market, along with additional details on our IRCs, please see: https://investors.carvana.com/resources/investor-materials.
*2019E bar represents end-of-year total market guidance.
*Represents facilities and markets as of November 6, 2019
Strong Unit Economics
Our investments in growth and customer experience are underpinned by robust unit economics in our markets. As of Q3 80% of our markets, accounting for 97% of retail unit sales, had greater gross profit than advertising and in-market operating expenses, and 14 markets, accounting for 35% of retail unit sales, were generating positive EBITDA ex-Gift after fully allocating all centralized logistics and corporate expenses.1 Moreover, markets are achieving these milestones faster over time. For example, Atlanta achieved positive EBITDA ex-Gift on a fully allocated basis 21 quarters after launch, while our newer markets are reaching that point in just 10 to 14 quarters.
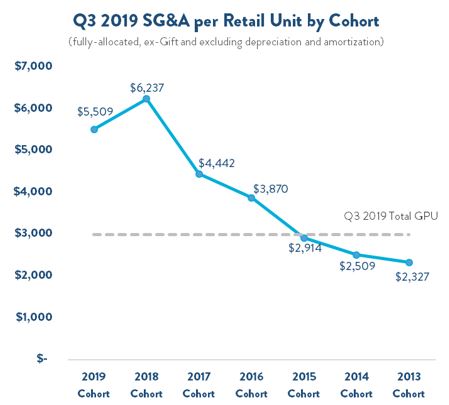
The strong unit economics at the market level are driven by continued gains in GPU, which are visible at the company level, and significant operating leverage within markets, which has been less visible when aggregated to the company level. The operating leverage dynamics appear in the chart below, which shows fully allocated SG&A expenses per unit (ex-Gift and excluding depreciation and amortization) in Q3 2019 in each of our market cohorts. SG&A was $208.0 million in total and $194.4 million ex-Gift and excluding depreciation and amortization in Q3 2019.
This chart has several exciting implications. The most important is that our business is already generating meaningfully positive unit economics in our older cohorts, even when fully burdened with expenses that are simultaneously driving our extreme growth. This is demonstrated by comparing fully allocated operating expenses in our oldest cohorts to our GPU.
The next most important is that our cohorts demonstrate significant operating leverage over time. Cohort expenses improve through increased scale as well as efficiency gains from technology, and are partially offset by our investments in new product offerings, such as buying cars from customers.
1Advertising and in-market operating expenses are allocated to the market in which they occur, logistics expenses are allocated based on the number of vehicle miles traveled to each market, and corporate expenses are allocated to markets based on market population.
Expenses lever with scale for several reasons. First, we have historically seen substantial advertising leverage in our markets after launch as awareness accumulates and we generate word of mouth. Second, in-market expenses tend to lever over time as markets scale, employee tenure grows, vending machines open, and our local processes mature. Third, logistics expenses per unit tend to decline over time at the cohort level as our IRC footprint expands, placing more cars closer to our customers. Finally, corporate expenses per unit tend to fall as a cohort ages and market penetration increases, spreading these expenses across a larger number of units.
We believe these trends make our path to profitability clear and cement our focus on executing our plan.
Management Objectives
As discussed in previous shareholder letters, our management team focuses on delivering an exceptional and unparalleled customer experience while simultaneously growing the business rapidly and achieving our financial objectives. We firmly believe wowing the customer is the core of our model and drives all other metrics. To realize our long-term vision, our three primary financial objectives remain unchanged: (1) Grow Retail Units and Revenue; (2) Increase Total Gross Profit Per Unit; and (3) Demonstrate Operating Leverage.
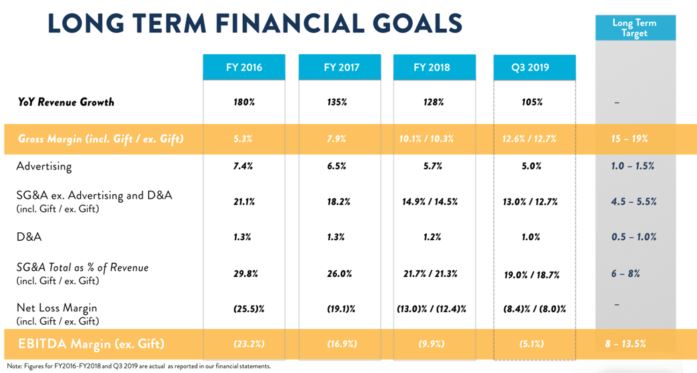
Below we present our long-term financial model that we introduced at our Analyst Day on November 29, 2018. We believe this is the appropriate frame through which to evaluate our results and progress towards each of our financial objectives.
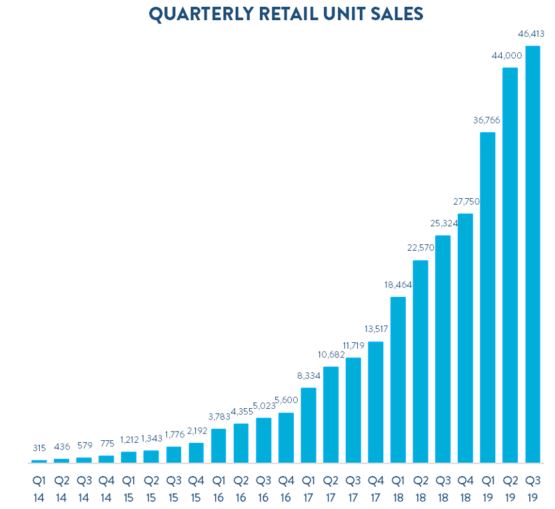
Objective #1: Grow Retail Units and Revenue
We grew units and revenue significantly again in Q3. Retail units sold increased to 46,413, up 83% from 25,324 in Q3 2018. Revenue in Q3 grew to $1.095 billion, up 105% from $534.9 million. Our growth in the third quarter was broad-based, driven by gains across our markets nationwide.
Total vehicles acquired from customers grew by 249% in Q3 2019. Wholesale units sold, which are sourced primarily from customers, increased by 165% to 11,698 in Q3 2019 from 4,408 in Q3 2018. Growth in vehicles acquired from customers also fed our retail inventory, diversifying our selection and improving acquisition prices. In Q3, 31% of retail units sold were sourced from customers, up from 16% in Q3 2018 and 17% last quarter.
Objective #2: Increase Total Gross Profit Per Unit
We achieved GPU of nearly $3,000 in the third quarter driven by strong performance across the board. Our team continues to make progress on a number of key GPU drivers to achieve our long-term financial goals, most notably buying cars from customers and monetizing our finance platform.
For Q3 2019:
•Total
◦Total GPU (incl. Gift): $2,963 vs. $2,263 in Q3 2018
◦Total GPU ex-Gift: $2,996 vs. $2,302 in Q3 2018
•Retail
◦Retail GPU (incl. Gift): $1,305 vs. $1,127 in Q3 2018
◦Retail GPU ex-Gift: $1,335 vs. $1,166 in Q3 2018
◦Gains in Retail GPU were primarily driven by a greater number of customer-sourced vehicles, incremental shipping revenue, and lower IRC and transport costs
•Wholesale
◦Wholesale GPU (incl. Gift) was $120 vs. $61 in Q3 2018
◦Wholesale GPU ex-Gift was $123 vs. $62 in Q3 2018
◦Changes in Wholesale GPU were driven by higher wholesale unit volume (+165%) relative to retail units (+83%), and higher gross profit per wholesale unit sold ($476 incl. Gift and $488 ex-Gift vs. $350 and $355 incl. Gift and ex-Gift in Q3 2018)
•Other
◦Other GPU was $1,539 vs. $1,075 in Q3 2018
◦Gains in Other GPU were driven by improved loan monetization from our third auto loan securitization, as well as higher attachment of VSC and GAP waiver coverage. Total finance GPU, including gain on loan sale and interest income net of securitization fees and expenses, was $1,078 in Q3 compared to $705 in Q3 2018. The remainder of Other GPU increased to $461 in Q3 from $370 in Q3 2018.
*2019E lines represent high and low end points of annual GPU ex-Gift guidance range.
Objective #3: Demonstrate Operating Leverage
We continued to demonstrate meaningful leverage in the business while also making incremental investments required to support 249% growth in buying cars from customers. Net loss margin incl. Gift levered by 3.6% and EBITDA margin ex-Gift levered by 3.2%.
For Q3 2019:
•Total SG&A levered by 2.6% incl. Gift and 1.6% ex-Gift, primarily reflecting benefits from scale offset by investments to support buying cars from customers and to relieve operational pinch points
•Compensation and benefits levered by 1.9% incl. Gift and 0.9% ex-Gift, primarily reflecting benefits from scale offset by additional hiring to support buying cars from customers
•Advertising levered by 0.1%, reflecting leverage in existing markets, shifting mix towards older markets, and lower initial CACs in new markets, offset by the introduction of advertising focused on buying cars from customers
•Logistics and market occupancy levered by 0.6%, reflecting improving efficiency and volumes through our fulfillment network
•Other SG&A as a percent of revenue was unchanged, primarily reflecting benefits from scale offset by additional investments in technology
*2019E lines represent high and low end points of annual EBITDA Margin ex-Gift guidance range.
Summary
In Q3 we took another meaningful step on our path to selling 2 million+ cars per year and becoming the largest and most profitable automotive retailer. The most notable accomplishment in the quarter was our 249% growth in buying cars from customers. This offering is now nearly 70% as large as our core business in transaction volume despite only recently receiving significant direct investment and attention. The gains we are making are fundamentally strengthening our platform, and the speed at which we are making those gains speak to the strength of the platform we already have.
Looking forward, we are well-positioned to achieve our goals. We have an incredible team of passionate people. We are acutely focused on delivering the best customer experiences when buying or selling a car. We are building a differentiated and powerful platform. We are demonstrating significant leverage that is driven by the strong unit economics of our business model. And with the confidence that comes from all the above, we are firmly focused on the long term.
It is still early days for Carvana. Our customer offering is second-to-none, the opportunity is enormous, the data is clear, and we are executing.
Sincerely,
Ernie Garcia, III, Chairman and CEO
Mark Jenkins, CFO
Appendix
Conference Call Details
Carvana will host a conference call today, November 6, 2019, at 5:30 p.m. EST (2:30 p.m. PST) to discuss financial results. To participate in the live call, analysts and investors should dial (833) 255-2830 or (412) 902-6715, and ask for “Carvana Earnings.” A live audio webcast of the conference call along with supplemental financial information will also be accessible on the company's website at investors.carvana.com. Following the webcast, an archived version will also be available on the Investor Relations section of the company’s website. A telephonic replay of the conference call will be available until November 13, 2019, by dialing (877) 344-7529 or (412) 317-0088 and entering passcode 10135799#.
Forward Looking Statements
This letter contains forward-looking statements within the meaning of the Private Securities Litigation Reform Act of 1995. These forward-looking statements reflect Carvana’s current expectations and projections with respect to, among other things, its financial condition, results of operations, plans, objectives, future performance, and business. These statements may be preceded by, followed by or include the words "aim," "anticipate," "believe," "estimate," "expect," "forecast," "intend," "likely," "outlook," "plan," "potential," "project," "projection," "seek," "can," "could," "may," "should," "would," "will," the negatives thereof and other words and terms of similar meaning.
Forward-looking statements include all statements that are not historical facts. Such forward-looking statements are subject to various risks and uncertainties. Accordingly, there are or will be important factors that could cause actual outcomes or results to differ materially from those indicated in these statements. Among these factors are risks related to the “Risk Factors” identified in our Annual Report on Form 10-K for 2018 and our Quarterly Report on Form 10-Q for Q3 2019.
There is no assurance that any forward-looking statements will materialize. You are cautioned not to place undue reliance on forward-looking statements, which reflect expectations only as of this date. Carvana does not undertake any obligation to publicly update or review any forward-looking statement, whether as a result of new information, future developments, or otherwise.
Use of Non-GAAP Financial Measures
As appropriate, we supplement our results of operations determined in accordance with U.S. generally accepted accounting principles (“GAAP”) with certain non-GAAP financial measurements that are used by management, and which we believe are useful to investors, as supplemental operational measurements to evaluate our financial performance. These measurements should not be considered in isolation or as a substitute for reported GAAP results because they may include or exclude certain items as compared to similar GAAP-based measurements, and such measurements may not be comparable to similarly-titled measurements reported by other companies. Rather, these measurements should be considered as an additional way of viewing aspects of our operations that provide a more complete understanding of our business. We strongly encourage investors to review our consolidated financial statements included in publicly filed reports in their entirety and not rely solely on any one, single financial measurement or communication.
Reconciliations of our non-GAAP measurements to their most directly comparable GAAP-based financial measurements are included at the end of this letter.
Investor Relations Contact Information: Mike Levin, investors@carvana.com
CARVANA CO. AND SUBSIDIARIES
CONDENSED CONSOLIDATED BALANCE SHEETS
(Unaudited)
(In thousands)
| | | | | | | | | | | |
| September 30, 2019 | | December 31, 2018 |
| ASSETS | | | |
| Current assets: | | | |
| Cash and cash equivalents | $ | 94,943 | | | $ | 78,861 | |
| Restricted cash | 13,531 | | | 9,848 | |
| Accounts receivable, net | 59,043 | | | 33,120 | |
| Finance receivables held for sale, net | 180,856 | | | 105,200 | |
| | | |
| | | |
| Vehicle inventory | 629,798 | | | 412,243 | |
| Beneficial interests in securitizations | 75,832 | | | — | |
| Other current assets | 43,955 | | | 23,582 | |
| Total current assets | 1,097,958 | | | 662,854 | |
| Property and equipment, net | 457,157 | | | 296,839 | |
| Operating lease right-of-use assets, including $41,224 and $0, respectively, from leases with related parties | 95,388 | | | — | |
| Intangible assets, net | 7,680 | | | 8,869 | |
| Goodwill | 9,353 | | | 9,353 | |
| Other assets, including $4,301 and $1,895, respectively, due from related parties | 16,785 | | | 13,098 | |
| Total assets | $ | 1,684,321 | | | $ | 991,013 | |
| LIABILITIES & STOCKHOLDERS' EQUITY | | | |
| Current liabilities: | | | |
| Accounts payable and accrued liabilities, including $6,759 and $3,891, respectively, due to related parties | $ | 191,598 | | | $ | 121,415 | |
| Short-term revolving facilities | 262,191 | | | 196,963 | |
| Current portion of long-term debt | 40,246 | | | 11,133 | |
| Other current liabilities, including $4,358 and $0, respectively, from leases with related parties | 13,418 | | | — | |
| Total current liabilities | 507,453 | | | 329,511 | |
| Long-term debt, excluding current portion, including $15,000 held by a related party | 776,580 | | | 425,349 | |
| | | |
| Operating lease liabilities, excluding current portion, including $38,893 and $0, respectively, from leases with related parties | 87,266 | | | — | |
| Other liabilities | 1,844 | | | 8,725 | |
| Total liabilities | 1,373,143 | | | 763,585 | |
| Commitments and contingencies | | | |
| | | |
| Stockholders' equity: | | | |
| | | |
| | | |
| Preferred stock, $0.01 par value - 50,000 shares authorized; none issued and outstanding as of September 30, 2019 and December 31, 2018 | — | | | — | |
| Class A common stock, $0.001 par value - 500,000 shares authorized; 50,296 and 41,208 shares issued and outstanding as of September 30, 2019 and December 31, 2018, respectively | 50 | | | 41 | |
| Class B common stock, $0.001 par value - 125,000 shares authorized; 101,250 and 104,336 shares issued and outstanding as of September 30, 2019 and December 31, 2018, respectively | 101 | | | 104 | |
| Additional paid-in capital | 274,210 | | | 147,916 | |
| Accumulated deficit | (168,829) | | | (74,653) | |
| Total stockholders' equity attributable to Carvana Co. | 105,532 | | | 73,408 | |
| Non-controlling interests | 205,646 | | | 154,020 | |
| Total stockholders' equity | 311,178 | | | 227,428 | |
| Total liabilities & stockholders' equity | $ | 1,684,321 | | | $ | 991,013 | |
CARVANA CO. AND SUBSIDIARIES
CONDENSED CONSOLIDATED STATEMENTS OF OPERATIONS
(Unaudited)
(In thousands, except per share amounts)
| | | | | | | | | | | | | | | | | | | | | | | |
| Three Months Ended September 30, | | | | Nine Months Ended September 30, | | |
| 2019 | | 2018 | | 2019 | | 2018 |
| Sales and operating revenues: | | | | | | | |
| Used vehicle sales, net | $ | 931,016 | | | $ | 486,269 | | | $ | 2,470,630 | | | $ | 1,258,247 | |
| Wholesale vehicle sales | 92,430 | | | 21,440 | | | 188,474 | | | 48,195 | |
| Other sales and revenues, including $15,824, $6,696, $40,386 and $16,351, respectively, from related parties | 71,408 | | | 27,212 | | | 177,205 | | | 64,187 | |
| | | | | | | |
| Net sales and operating revenues | 1,094,854 | | | 534,921 | | | 2,836,309 | | | 1,370,629 | |
| Cost of sales, including $997, $1,286, $3,487 and $3,543 respectively, to related parties | 957,311 | | | 477,615 | | | 2,472,441 | | | 1,230,054 | |
| Gross profit | 137,543 | | | 57,306 | | | 363,868 | | | 140,575 | |
| Selling, general and administrative expenses, including $4,264, $2,085, $9,884 and $6,019 respectively, to related parties | 207,970 | | | 115,768 | | | 545,054 | | | 294,606 | |
| | | | | | | |
| Interest expense, including $332, $0, $998 and $0, respectively, to related parties | 20,990 | | | 5,649 | | | 55,953 | | | 13,355 | |
| Other expense, net | 827 | | | 308 | | | 1,760 | | | 955 | |
| Net loss before income taxes | (92,244) | | | (64,419) | | | (238,899) | | | (168,341) | |
| Income tax provision | — | | | — | | | — | | | — | |
| Net loss | (92,244) | | | (64,419) | | | (238,899) | | | (168,341) | |
| Net loss attributable to non-controlling interests | (53,227) | | | (48,377) | | | (144,723) | | | (135,291) | |
| Net loss attributable to Carvana Co. | (39,017) | | | (16,042) | | | (94,176) | | | (33,050) | |
| Dividends on Class A convertible preferred stock | — | | | (1,230) | | | — | | | (3,950) | |
| Accretion of beneficial conversion feature on Class A convertible preferred stock | — | | | — | | | — | | | (1,380) | |
| Net loss attributable to Class A common stockholders | $ | (39,017) | | | $ | (17,272) | | | $ | (94,176) | | | $ | (38,380) | |
| Net loss per share of Class A common stock, basic and diluted | $ | (0.78) | | | $ | (0.50) | | | $ | (2.06) | | | $ | (1.43) | |
Weighted-average shares of Class A common stock, basic and diluted (1) | 49,787 | | | 34,655 | | | 45,726 | | | 26,927 | |
(1) Weighted-average shares of Class A common stock outstanding have been adjusted for unvested restricted stock awards.
CARVANA CO. AND SUBSIDIARIES
CONDENSED CONSOLIDATED STATEMENTS OF CASH FLOWS
(Unaudited)
(In thousands)
| | | | | | | | | | | |
| Nine Months Ended September 30, | | |
| 2019 | | 2018 |
| Cash Flows from Operating Activities: | | | |
| Net loss | $ | (238,899) | | | $ | (168,341) | |
| Adjustments to reconcile net loss to net cash used in operating activities: | | | |
| Depreciation and amortization expense | 27,505 | | | 16,301 | |
| Equity-based compensation expense | 25,366 | | | 17,981 | |
| Loss on disposal of property and equipment | 1,046 | | | 542 | |
| Provision for bad debt and valuation allowance | 7,030 | | | 1,375 | |
| Amortization and write-off of debt issuance costs and bond premium | 3,569 | | | 1,055 | |
| Gain on loan sales | (99,408) | | | (35,655) | |
| | | |
| Originations of finance receivables | (1,877,336) | | | (872,382) | |
| Proceeds from sale of finance receivables, net | 2,027,689 | | | 1,114,304 | |
| Purchase of finance receivables | (161,781) | | | (253,041) | |
| Principal payments received on finance receivables held for sale | 54,623 | | | — | |
| Unrealized loss on beneficial interest in securitization | 219 | | | — | |
| Changes in assets and liabilities: | | | |
| Accounts receivable | (27,907) | | | (9,434) | |
| Vehicle inventory | (213,762) | | | (110,312) | |
| Other current assets | (23,161) | | | (11,879) | |
| Other assets | (2,594) | | | (420) | |
| Operating lease right-of-use assets | (18,896) | | | — | |
| | | |
| | | |
| Operating lease liabilities | 16,952 | | | — | |
| Accounts payable and accrued liabilities | 65,452 | | | 46,537 | |
| Other liabilities | (382) | | | (506) | |
| Net cash used in operating activities | (434,675) | | | (263,875) | |
| Cash Flows from Investing Activities: | | | |
| | | |
| Purchases of property and equipment, including $6,282 and $0, respectively, from related parties | (151,380) | | | (107,228) | |
| Principal payments received on beneficial interests in securitizations | 2,577 | | | — | |
| Business acquisitions, net of cash acquired | — | | | (6,670) | |
| Net cash used in investing activities | (148,803) | | | (113,898) | |
| Cash Flows from Financing Activities: | | | |
| Proceeds from short-term revolving facilities | 3,093,039 | | | 1,297,419 | |
| Payments on short-term revolving facilities | (3,133,186) | | | (1,196,819) | |
| Proceeds from issuance of long-term debt | 367,349 | | | 396,179 | |
| Payments on long-term debt | (11,087) | | | (8,817) | |
| Payments of debt issuance costs | (8,423) | | | (6,309) | |
| Net proceeds from issuance of Class A common stock | 297,611 | | | 172,287 | |
| Proceeds from exercise of stock options | 1,492 | | | 642 | |
| Tax withholdings related to restricted stock awards | (3,552) | | | (1,376) | |
| Dividends paid on Class A Convertible Preferred Stock | — | | | (4,279) | |
| Payments of costs related to issuance of Class A Convertible Preferred Stock | — | | | (12) | |
| | | |
| Net cash provided by financing activities | 603,243 | | | 648,915 | |
| Net increase in cash, cash equivalents and restricted cash | 19,765 | | | 271,142 | |
| Cash, cash equivalents and restricted cash at beginning of period | 88,709 | | | 187,123 | |
| Cash, cash equivalents and restricted cash at end of period | $ | 108,474 | | | $ | 458,265 | |
| | | |
CARVANA CO. AND SUBSIDIARIES
RECONCILIATION OF GAAP TO NON-GAAP FINANCIAL MEASURES
(Unaudited)
Adjusted Net Loss and Adjusted Net Loss per Share
Adjusted net loss and adjusted net loss per share are supplemental measures of operating performance that do not represent and should not be considered alternatives to net loss and net loss per share, as determined under GAAP. We believe that by assuming the full exchange of all outstanding LLC Units and excluding the expense associated with the 100k Milestone Gift for the reasons described below, adjusted net loss and adjusted net loss per share supplement GAAP measures and enable us and our investors to more effectively evaluate our performance period-over-period and relative to our competitors that have different organizational and tax structures because the assumption eliminates the effect of any changes in net income attributable to Carvana Co. driven by increases in our ownership of Carvana Group, LLC as well as the expense associated with the 100k Milestone Gift, which are unrelated to our operating performance. A reconciliation of adjusted net loss to net loss attributable to Carvana Co., the most directly comparable GAAP measure, and the computation of adjusted net loss per share are as follows (in thousands, except per share amounts):
| | | | | | | | | | | | | | | | | | | | | | | | | | | | | |
| | | Three Months Ended September 30, | | | | Nine Months Ended September 30, | | |
| | | 2019 | | 2018 | | 2019 | | 2018 |
| Numerator: | | | | | | | | | |
| Net loss attributable to Carvana Co. | | $ | (39,017) | | | $ | (16,042) | | | $ | (94,176) | | | $ | (33,050) | |
| Net loss attributable to non-controlling interests | | (53,227) | | | (48,377) | | | (144,723) | | | (135,291) | |
| Dividends on Class A convertible preferred stock | | — | | | (1,230) | | | — | | | (3,950) | |
| Accretion of beneficial conversion feature on Class A convertible preferred stock | | — | | | — | | | — | | | (1,380) | |
| 100k Milestone Gift | | 4,426 | | | 7,761 | | | 10,726 | | | 7,761 | |
| Adjusted net loss attributable to Carvana Co. Class A common stock | | $ | (87,818) | | | $ | (57,888) | | | $ | (228,173) | | | $ | (165,910) | |
| | | | | | | | | |
| Denominator: | | | | | | | | | |
| Weighted-average shares of Class A common stock outstanding(1) | | 49,787 | | | 34,655 | | | 45,726 | | | 26,927 | |
| Adjustments: | | | | | | | | |
| | Weighted-average assumed exchange of LLC Units for shares of Class A common stock | 105,733 | | | 111,157 | | | 107,016 | | | 114,971 | |
| Adjusted shares of Class A common stock outstanding | | 155,520 | | | 145,812 | | | 152,742 | | | 141,898 | |
| Adjusted net loss per share | | | $ | (0.56) | | | $ | (0.40) | | | $ | (1.49) | | | $ | (1.17) | |
(1) Excludes approximately 0.8 million nonvested restricted stock awards and units and 1.2 million vested and nonvested stock options outstanding at September 30, 2019, because they were determined to be anti-dilutive. Excludes approximately 0.6 million nonvested restricted stock awards and units and 0.8 million vested and nonvested stock options outstanding at September 30, 2018, because they were determined to be anti-dilutive.
CARVANA CO. AND SUBSIDIARIES
RECONCILIATION OF GAAP TO NON-GAAP FINANCIAL MEASURES (continued)
(Unaudited)
Gross Profit ex-Gift and Gross Profit per Unit ex-Gift
Gross Profit ex-Gift and Gross Profit per Unit ex-Gift are non-GAAP supplemental measures of operating performance that do not represent and should not be considered an alternative to gross profit, as determined by GAAP. Gross Profit ex-Gift is defined as gross profit before compensation expense related to the 100k Milestone Gift included in cost of sales. Gross Profit per Unit ex-Gift is Gross Profit ex-Gift divided by units sold. We use Gross Profit ex-Gift to measure the operating performance of our business and Gross Profit per Unit ex-Gift to measure our operating performance relative to our units sold. We believe that Gross Profit ex-Gift and Gross Profit per Unit ex-Gift are useful measures to us and to our investors because they exclude the expense associated with the 100k Milestone Gift recognized in cost of sales. We expect the 100k Milestone Gift to be a one-time award program for which we will recognize varying amounts of expense through the first half of 2020, and therefore we believe the related expense does not reflect our core operations, is not included in our past operations, and may not be indicative of our future operations. Additionally, the shares issued to settle the 100k Milestone Gift are offset by share contributions from Mr. Garcia to the Company, and therefore we expect the impact on shares outstanding to be zero. We believe that excluding it enables us to more effectively evaluate our performance period-over-period and relative to our competitors. For all periods prior to the three months ended September 30, 2018, gross profit ex-Gift equals gross profit. A reconciliation of the Gross Profit ex-Gift amounts to each corresponding gross profit amount, which are the most directly comparable GAAP measures and include expenses attributable to the 100k Milestone Gift, and calculations of each Gross Profit per Unit ex-Gift amount are as follows (dollars in thousands, except per unit amounts):
| | | | | | | | | | | | | | | | | | | | | | | | | | |
| | Three Months Ended | | | | | | Year Ended |
| | September 30, 2019 | | June 30, 2019 | | March 31, 2019 | | December 31, 2018 |
| | | | | | | | |
| Used vehicle gross profit | | $ | 60,563 | | | $ | 63,378 | | | $ | 47,122 | | | $ | 94,319 | |
| 100k Milestone Gift in used vehicle cost of sales | | 1,381 | | | 1,808 | | | 764 | | | 3,870 | |
| Used Vehicle Gross Profit ex-Gift | | $ | 61,944 | | | $ | 65,186 | | | $ | 47,886 | | | $ | 98,189 | |
| | | | | | | | |
| Used vehicle unit sales | | 46,413 | | | 44,000 | | | 36,766 | | | 94,108 | |
| Used Vehicle Gross Profit per Unit ex-Gift | | $ | 1,335 | | | $ | 1,482 | | | $ | 1,302 | | | $ | 1,043 | |
| | | | | | | | |
| Wholesale vehicle gross profit | | $ | 5,572 | | | $ | 6,993 | | | $ | 3,035 | | | $ | 5,552 | |
| 100k Milestone Gift in wholesale vehicle cost of sales | | 142 | | | 103 | | | 22 | | | 133 | |
| Wholesale Vehicle Gross Profit ex-Gift | | $ | 5,714 | | | $ | 7,096 | | | $ | 3,057 | | | $ | 5,685 | |
| | | | | | | | |
| Wholesale vehicle unit sales | | 11,698 | | | 10,756 | | | 6,701 | | | 15,125 | |
| Wholesale Vehicle Gross Profit per Unit ex-Gift | | $ | 488 | | | $ | 660 | | | $ | 456 | | | $ | 376 | |
| | | | | | | | |
| Total gross profit | | $ | 137,543 | | | $ | 137,793 | | | $ | 88,532 | | | $ | 196,709 | |
| 100k Milestone Gift in total cost of sales | | 1,523 | | | 1,911 | | | 786 | | | 4,003 | |
| Total Gross Profit ex-Gift | | $ | 139,066 | | | $ | 139,704 | | | $ | 89,318 | | | $ | 200,712 | |
| | | | | | | | |
| Used vehicle unit sales | | 46,413 | | | 44,000 | | | 36,766 | | | 94,108 | |
| Total Gross Profit per Unit ex-Gift | | $ | 2,996 | | | $ | 3,175 | | | $ | 2,429 | | | $ | 2,133 | |
CARVANA CO. AND SUBSIDIARIES
RECONCILIATION OF GAAP TO NON-GAAP FINANCIAL MEASURES (continued)
(Unaudited)
EBITDA ex-Gift and EBITDA Margin ex-Gift
EBITDA ex-Gift and EBITDA Margin ex-Gift are non-GAAP supplemental measures of operating performance that do not represent and should not be considered an alternative to net loss or cash flow from operations, as determined by GAAP. EBITDA ex-Gift is defined as net loss before interest expense, income tax expense, depreciation and amortization expense, and the expense related to the 100k Milestone Gift. EBITDA Margin ex-Gift is EBITDA ex-Gift as a percentage of total revenues. We use EBITDA ex-Gift to measure the operating performance of our business and EBITDA Margin ex-Gift to measure our operating performance relative to our total revenues. We believe that EBITDA ex-Gift and EBITDA Margin ex-Gift are useful measures to us and to our investors because they exclude certain financial and capital structure items and the expense associated with the 100k Milestone Gift, that we do not believe directly reflect our core operations and may not be indicative of our recurring operations, in part because they may vary widely across time and within our industry independent of the performance of our core operations. In particular, we expect the 100k Milestone Gift to be a one-time award program for which we will recognize varying amounts of expense through the first half of 2020, and therefore we believe the related expense does not reflect our core operations, is not included in our past operations, and may not be indicative of our future operations. Additionally, the shares issued to settle the 100k Milestone Gift are offset by share contributions from Mr. Garcia to the Company, therefore we expect the impact on shares outstanding to be zero. We believe that excluding these items enables us to more effectively evaluate our performance period-over-period and relative to our competitors. EBITDA ex-Gift and EBITDA Margin ex-Gift may not be comparable to similarly titled measures provided by other companies due to potential differences in methods of calculations. A reconciliation of EBITDA ex-Gift to net loss (which includes Gift expense), the most directly comparable GAAP measure, and calculation of EBITDA Margin ex-Gift is as follows (dollars in thousands):
| | | | | | | | | | | | | | | | | | | | | | | | | | | | | | | | | | |
| | | | Three Months Ended | | | | | | | | |
| | | | Sep 30, 2018 | | Dec 31, 2018 | | Mar 31, 2019 | | Jun 30, 2019 | | Sep 30, 2019 |
| Net loss | | | | $ | (64,419) | | | $ | (86,404) | | | $ | (82,596) | | | $ | (64,059) | | | $ | (92,244) | |
| Depreciation and amortization expense | | | | 6,439 | | | 7,238 | | | 7,943 | | | 8,887 | | | 10,675 | |
| Interest expense | | | | 5,649 | | | 11,663 | | | 15,648 | | | 19,315 | | | 20,990 | |
| 100k Milestone Gift | | | | 7,761 | | | 4,060 | | | 2,974 | | | 3,326 | | | 4,426 | |
| EBITDA ex-Gift | | | | $ | (44,570) | | | $ | (63,443) | | | $ | (56,031) | | | $ | (32,531) | | | $ | (56,153) | |
| | | | | | | | | | | | |
| Total revenues | | | | $ | 534,921 | | | $ | 584,838 | | | $ | 755,234 | | | $ | 986,221 | | | $ | 1,094,854 | |
| Net Loss Margin | | | | (12.0) | % | | (14.8) | % | | (10.9) | % | | (6.5) | % | | (8.4) | % |
| EBITDA Margin ex-Gift | | | | (8.3) | % | | (10.8) | % | | (7.4) | % | | (3.3) | % | | (5.1) | % |
| | | | | | | | | | | | | | | | | | | | | | | | | | | | | | | | |
| | Years Ended December 31, | | | | | | | | |
| | 2014 | | 2015 | | 2016 | | 2017 | | 2018 |
| Net loss | | $ | (15,238) | | | $ | (36,780) | | | $ | (93,112) | | | $ | (164,316) | | | $ | (254,745) | |
| Depreciation and amortization expense | | 1,705 | | | 2,800 | | | 4,658 | | | 11,568 | | | 23,539 | |
| Interest expense | | 108 | | | 1,412 | | | 3,587 | | | 7,659 | | | 25,018 | |
| 100k Milestone Gift | | | — | | | — | | | — | | | — | | | 11,821 | |
| EBITDA ex-Gift | | $ | (13,425) | | | $ | (32,568) | | | $ | (84,867) | | | $ | (145,089) | | | $ | (194,367) | |
| | | | | | | | | | |
| Total revenues | | $ | 41,679 | | | $ | 130,392 | | | $ | 365,148 | | | $ | 858,870 | | | $ | 1,955,467 | |
| Net Loss Margin | | (36.6) | % | | (28.2) | % | | (25.5) | % | | (19.1) | % | | (13.0) | % |
| EBITDA Margin ex-Gift | | (32.2) | % | | (25.0) | % | | (23.2) | % | | (16.9) | % | | (9.9) | % |
CARVANA CO. AND SUBSIDIARIES
RESULTS OF OPERATIONS
(Unaudited)
| | | | | | | | | | | | | | | | | | | | | | | | | | | | | | | | | | | | | | | | | | | | |
| | Three Months Ended September 30, | | | | | | Nine Months Ended September 30, | | | | | | | | | | |
| | 2019 | | 2018 | | Change | | 2019 | | 2018 | | Change | | | | | | |
| | | | | | | | | | | | | | | | | | |
| | (dollars in thousands, except per unit amounts) | | | | | | (dollars in thousands, except per unit amounts) | | | | | | | | | | |
| Net sales and operating revenues: | | | | | | | | | | | | | | | | | | |
| Used vehicle sales, net | | $ | 931,016 | | | $ | 486,269 | | | 91.5 | % | | $ | 2,470,630 | | | $ | 1,258,247 | | | 96.4 | % | | | | | | |
| Wholesale vehicle sales | | 92,430 | | | 21,440 | | | 331.1 | % | | 188,474 | | | 48,195 | | | 291.1 | % | | | | | | |
Other sales and revenues (1) | | 71,408 | | | 27,212 | | | 162.4 | % | | 177,205 | | | 64,187 | | | 176.1 | % | | | | | | |
| Total net sales and operating revenues | | $ | 1,094,854 | | | $ | 534,921 | | | 104.7 | % | | $ | 2,836,309 | | | $ | 1,370,629 | | | 106.9 | % | | | | | | |
| Gross profit (incl. Gift): | | | | | | | | | | | | | | | | | | |
| Used vehicle gross profit | | $ | 60,563 | | | $ | 28,550 | | | 112.1 | % | | $ | 171,063 | | | $ | 71,837 | | | 138.1 | % | | | | | | |
| Wholesale vehicle gross profit | | 5,572 | | | 1,544 | | | 260.9 | % | | 15,600 | | | 4,551 | | | 242.8 | % | | | | | | |
Other gross profit (1) | | 71,408 | | | 27,212 | | | 162.4 | % | | 177,205 | | | 64,187 | | | 176.1 | % | | | | | | |
| Total gross profit | | $ | 137,543 | | | $ | 57,306 | | | 140.0 | % | | $ | 363,868 | | | $ | 140,575 | | | 158.8 | % | | | | | | |
Gross profit ex-Gift:(3) | | | | | | | | | | | | | | | | | | |
| Used vehicle gross profit ex-Gift | | $ | 61,944 | | | $ | 29,531 | | | 109.8 | % | | $ | 175,016 | | | $ | 72,818 | | | 140.3 | % | | | | | | |
| Wholesale vehicle gross profit ex-Gift | | 5,714 | | | 1,564 | | | 265.3 | % | | 15,867 | | | 4,571 | | | 247.1 | % | | | | | | |
Other gross profit(1) | | 71,408 | | | 27,212 | | | 162.4 | % | | 177,205 | | | 64,187 | | | 176.1 | % | | | | | | |
| Total gross profit ex-Gift | | $ | 139,066 | | | $ | 58,307 | | | 138.5 | % | | $ | 368,088 | | | $ | 141,576 | | | 160.0 | % | | | | | | |
| Market information: | | | | | | | | | | | | | | | | | | |
| Markets, beginning of period | | 137 | | | 65 | | | 110.8 | % | | 85 | | | 44 | | | 93.2 | % | | | | | | |
| Market launches | | 9 | | | 13 | | | (30.8) | % | | 61 | | | 34 | | | 79.4 | % | | | | | | |
| Markets, end of period | | 146 | | | 78 | | | 87.2 | % | | 146 | | | 78 | | | 87.2 | % | | | | | | |
| Unit sales information: | | | | | | | | | | | | | | | | | | |
| Used vehicle unit sales | | 46,413 | | | 25,324 | | | 83.3 | % | | 127,179 | | | 66,358 | | | 91.7 | % | | | | | | |
| Wholesale vehicle unit sales | | 11,698 | | | 4,408 | | | 165.4 | % | | 29,155 | | | 10,408 | | | 180.1 | % | | | | | | |
| Per unit selling prices: | | | | | | | | | | | | | | | | | | |
| Used vehicles | | $ | 20,059 | | | $ | 19,202 | | | 4.5 | % | | $ | 19,426 | | | $ | 18,961 | | | 2.5 | % | | | | | | |
| Wholesale vehicles | | $ | 7,901 | | | $ | 4,864 | | | 62.4 | % | | $ | 6,465 | | | $ | 4,631 | | | 39.6 | % | | | | | | |
Per unit gross profit (incl. Gift):(2) | | | | | | | | | | | | | | | | | | |
| Used vehicle gross profit | | $ | 1,305 | | | $ | 1,127 | | | 15.8 | % | | $ | 1,345 | | | $ | 1,083 | | | 24.2 | % | | | | | | |
| Wholesale vehicle gross profit | | $ | 476 | | | $ | 350 | | | 36.0 | % | | $ | 535 | | | $ | 437 | | | 22.4 | % | | | | | | |
| Other gross profit | | $ | 1,539 | | | $ | 1,075 | | | 43.2 | % | | $ | 1,393 | | | $ | 967 | | | 44.1 | % | | | | | | |
| Total gross profit | | $ | 2,963 | | | $ | 2,263 | | | 30.9 | % | | $ | 2,861 | | | $ | 2,118 | | | 35.1 | % | | | | | | |
Per unit gross profit ex-Gift:(2)(3) | | | | | | | | | | | | | | | | | | |
| Used vehicle gross profit ex-Gift | | $ | 1,335 | | | $ | 1,166 | | | 14.5 | % | | $ | 1,376 | | | $ | 1,097 | | | 25.4 | % | | | | | | |
| Wholesale vehicle gross profit ex-Gift | | $ | 488 | | | $ | 355 | | | 37.5 | % | | $ | 544 | | | $ | 439 | | | 23.9 | % | | | | | | |
| Other gross profit | | $ | 1,539 | | | $ | 1,075 | | | 43.2 | % | | $ | 1,393 | | | $ | 967 | | | 44.1 | % | | | | | | |
| Total gross profit ex-Gift | | $ | 2,996 | | | $ | 2,302 | | | 30.1 | % | | $ | 2,894 | | | $ | 2,134 | | | 35.6 | % | | | | | | |
(1) Includes $15,824 and $6,696 for the three months ended September 30, 2019 and 2018, respectively, and $40,386 and $16,351 for the nine months ended September 30, 2019 and 2018, respectively, of other sales and revenues from related parties.
(2) All gross profit per unit amounts are per used vehicle sold, except wholesale vehicle gross profit, which is per wholesale vehicle sold.
(3) Ex-Gift amounts exclude the expense related to the 100k Milestone Gift. See "Non-GAAP Financial Metrics" for a reconciliation to the most directly comparable GAAP-based measure, when applicable.
CARVANA CO. AND SUBSIDIARIES
COMPONENTS OF SG&A
(Unaudited)
| | | | | | | | | | | | | | | | | | | | | | | | | | | | | | | | | | |
| | Three Months Ended | | | | | | | | | | |
| | Sep 30, 2018 | | Dec 31, 2018 | | Mar 31, 2019 | | Jun 30, 2019 | | Sep 30, 2019 | | |
| | | | | | | | | | | | |
| | (in thousands) | | | | | | | | | | |
Compensation and benefits (1) | | $ | 34,411 | | | $ | 43,065 | | | $ | 48,804 | | | $ | 54,184 | | | $ | 60,655 | | | |
| 100k Milestone Gift | | 6,760 | | | 1,058 | | | 2,188 | | | 1,415 | | | 2,903 | | | |
| Advertising | | 27,467 | | | 31,971 | | | 39,522 | | | 50,367 | | | 55,264 | | | |
Market occupancy (2) | | 3,110 | | | 3,859 | | | 4,370 | | | 4,720 | | | 5,517 | | | |
Logistics (3) | | 9,913 | | | 11,140 | | | 12,249 | | | 13,643 | | | 14,068 | | | |
Other (4) | | 34,107 | | | 39,559 | | | 48,108 | | | 57,514 | | | 69,563 | | | |
| Total | | $ | 115,768 | | | $ | 130,652 | | | $ | 155,241 | | | $ | 181,843 | | | $ | 207,970 | | | |
| | | | | | | | | | | | |
| | | | | | | | | | | | |
| | | | | | | | | | | | |
| | | | | | | | | | | | |
| | | | | | | | | | | | |
| | | | | | | | | | | | |
| | | | | | | | | | | | |
| | | | | | | | | | | | |
| | | | | | | | | | | | |
| | | | | | | | | | | | |
| | | | | | | | | | | | |
(1) Compensation and benefits includes all payroll and related costs, including benefits, payroll taxes and equity-based compensation, except those related to preparing vehicles for sale, which are included in cost of sales, those related to the development of software products for internal use, which are capitalized to software and depreciated over the estimated useful lives of the related assets, and those related to the 100k Milestone Gift.
(2) Market occupancy costs includes occupancy costs of our vending machine and hubs. It excludes occupancy costs related to reconditioning vehicles which are included in cost of sales and the portion related to corporate occupancy which are included in other costs.
(3) Logistics includes fuel, maintenance and depreciation related to operating our own transportation fleet and third party transportation fees, except the portion related to inbound transportation, which is included in cost of sales.
(4) Other costs include all other selling, general and administrative expenses such as IT expenses, corporate occupancy, professional services and insurance, limited warranty and title and registration.
Liquidity Resources
(Unaudited)
| | | | | | | | | | | |
| September 30, 2019 | | December 31, 2018 |
| | | |
| (in thousands) | | | |
| Cash and cash equivalents | $ | 94,943 | | | $ | 78,861 | |
Availability under short-term revolving facilities (1) | 408,544 | | | 253,601 | |
Availability under sale-leaseback agreements (2)(3) | 75,000 | | | 77,359 | |
| Committed liquidity resources available | $ | 578,487 | | | $ | 409,821 | |
(1) Based on pledging all eligible vehicles and finance receivables under the available capacity in the Floor Plan Facility and Finance Receivable Facilities.
(2) Under the Master Sale-Leaseback Agreement with VMRE, the total sales price of properties the Company has sold and is leasing back at any point in time is limited to $75.0 million. We are also party to other sale-leaseback arrangements.
(3) We had $177.7 million and $132.4 million of total unpledged gross real estate assets as of September 30, 2019 and December 31, 2018, respectively.
In addition, we had $10.6 million and $0.0 million of total unpledged beneficial interests in securitizations as of September 30, 2019 and December 31, 2018, respectively. On November 1, 2019, we amended our Floor Plan Facility to, among other things, increase the available capacity. Based on eligible inventory as of September 30, 2019, this would have added $73.6 million in available committed liquidity resources as of that date.