Exhibit 99.1
Dear Shareholders,
The first quarter was a challenging quarter for Carvana. While we continued to increase market share rapidly and continued laying the operational, technical, and cultural foundations to buy and sell millions of cars, several external and internal factors impacted our financial results.
Some of these impacted the used vehicle industry as a whole (e.g., Omicron, used vehicle prices, interest rates, other macro factors), and others were more specific to Carvana (e.g., reconditioning and logistics network disruptions).
The impact of these factors on retail unit sold volume was the primary driver of our results in Q1.
We generally prepare for sales volume 6-12 months in advance, meaning we built capacity in most of our business functions for significantly more volume than we fulfilled in Q1. With our costs relatively fixed in the short-term, the lower retail unit volume led to higher cost of goods sold per unit (e.g., reconditioning and inbound transport costs), leading to lower GPU, and higher SG&A per unit. These effects combined with rapidly rising interest rates and widening credit spreads led to lower EBITDA margin.
The sales results of other used vehicle dealers suggest Carvana is gaining meaningful market share in a difficult industry environment, despite operational constraints. In general, we believe the used vehicle market is a stable market that will average 40 million or more annual unit sales over time. We believe the factors currently impacting used vehicle industry sales are transitory, and we are well positioned to take advantage when the industry rebounds.
Our confidence in our growth trajectory is bolstered by the strong growth trends we are seeing in parts of the business that are less impacted by used vehicle affordability. Retail units sold to Carvana finance platform customers with a FICO score greater than 700 increased by ~50% YoY in Q1, despite the aforementioned industry headwinds and operational constraints.
In the long-term, our expectations are unchanged, and our enthusiasm is as high as ever. All the fundamentals that powered us forward over the last 9 years remain the same. Our customers love our offering, and we love building and relentlessly improving it for them.
We remain firmly on the path to changing the way people buy and sell cars and to becoming the largest and most profitable automotive retailer.
Summary of Q1 2022 Results
Q1 2022 Financial Results: All financial comparisons stated below are versus Q1 2021, unless otherwise noted. Complete financial tables appear at the end of this letter.
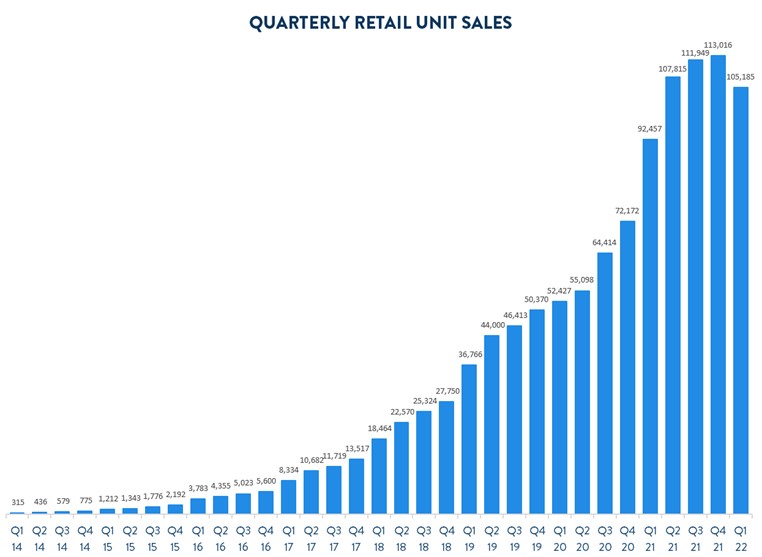
•Retail units sold totaled 105,185 an increase of 14%
•Revenue totaled $3.497 billion, an increase of 56%
•Total gross profit was $298 million, a decrease of 12%
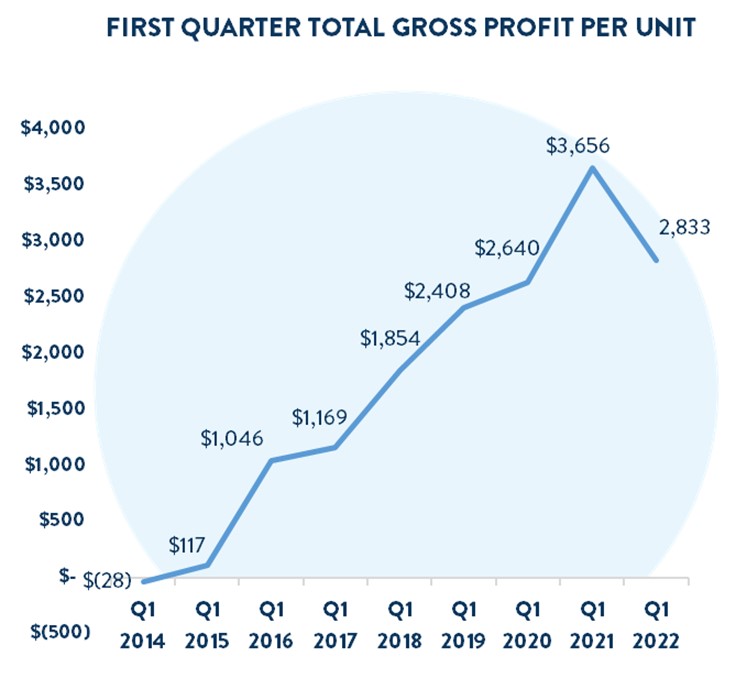
•Total gross profit per unit was $2,833 (incl. $76 gift impact), a decrease of $823
•Net loss was $506 million, an increase from $82 million
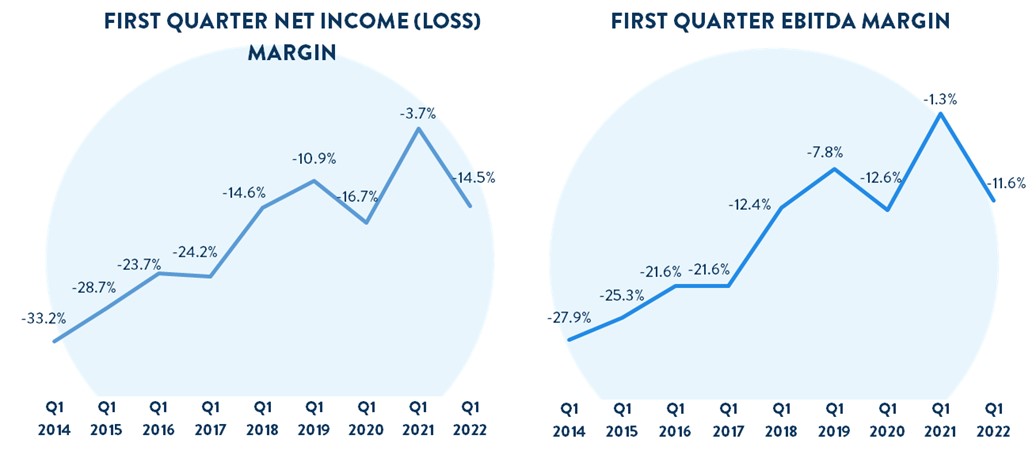
•EBITDA margin was (11.6%), a decrease from (1.3%)
◦EBITDA margin includes a (0.8%) impact from Ernie’s 1MM Unit Milestone Gift to employees
•Basic and diluted net loss, per Class A share was $2.89 based on 90.1 million shares of Class A common stock outstanding
Other Results and Recent Events:
•On February 24th, 2022, we announced an agreement to acquire the ADESA U.S. Physical Auction business from KAR Global for $2.2 billion. The transaction is expected to close in May 2022.
•In Q1 2022, we opened our 15th, 16th, and 17th inspection and reconditioning centers (IRCs) near Cincinnati, OH, Oklahoma City, OK, and San Antonio, TX.
Ernie’s 1 Million Unit Milestone Gift to Carvana Employees
In January 2022, in recognition of Carvana selling its 1 millionth vehicle in Q4, CEO Ernie Garcia committed to giving current employees 23 shares of his personal stock once they reach their two-year employment anniversary, a gift worth over $100 million at the announcement’s stock price. Similar to the 2018 100k Milestone Gift, Ernie wanted to recognize and reward all Carvana team members who have contributed time, dedication, and effort to helping Carvana reach these monumental achievements.
Because this gift is Ernie’s personal stock, it does not have a dilutive effect on existing shareholders. However, in accordance with U.S. GAAP the gift will be recorded as share-based compensation expense in our consolidated statement of operations. As a result, the gift had a ~$28 million impact on EBITDA in Q1 2022, and we expect it to have a ~$30 million impact on EBITDA in aggregate in the remaining three quarters of FY 2022.1
1 For additional information, please see the 1 Million Milestone Gift materials posted on our investor relations website.
Outlook
While we faced a uniquely difficult environment in the first quarter, we are already seeing positive trends across our key metrics.
In light of the current industry trends impacting customer affordability, high used vehicle prices, rapid movements in interest rates, rapid increases in fuel prices, and other macroeconomic uncertainty impacting the used vehicle market, at this time we are no longer providing specific numeric near-term guidance for the remainder of the year.
As we look forward, we expect to see the following trends:
•We expect to continue to gain significant market share in 2022 through continued growth in retail units and revenue.
•As discussed above, we generally prepare for sales volume 6-12 months in advance, meaning we built capacity in most of our business functions for significantly more volume than we fulfilled in Q1. Over the next several quarters, we expect to better align sales with expense levels through a combination of higher sales and expense efficiencies.
•We expect to continue to improve the efficiency of our logistics network over the next several quarters, speeding delivery times, reducing rescheduling and cancellation rates, and enabling broader inventory selection through increased inventory visibility.
•On GPU, we expect retail cost of goods sold per unit to return to more normalized levels over the next several quarters as we move further away from Omicron and logistics network disruptions.
•We also expect the spreads between loan origination interest rates and benchmark interest rates to return to more normalized levels as we move further away from the rapid increases in Q4 and Q1 and due to changes to our pricing cadence and hedging policy.
•As a result of all of the above, we expect meaningful sequential improvement in Q2 vs. Q1 in retail units sold, revenue, total GPU, SG&A per retail unit sold, and EBITDA margin.
In our last shareholder letter, we provided an expectation that we would achieve over $4,000 GPU and approximately EBITDA breakeven in the last three quarters of 2022 taken in aggregate. We now expect a return to over $4,000 GPU and positive EBITDA to be pushed back a few quarters and then to resume our march to our long-term financial model.
This outlook excludes any impacts from our acquisition of ADESA’s U.S. physical auction business.
For more information regarding the non-GAAP financial measures discussed in this letter, please see the reconciliations of our non-GAAP measurements to their most directly comparable GAAP-based financial measurements included at the end of this letter.
Update on Acquisition of ADESA U.S.
We are on track to close our acquisition of ADESA U.S. in May 2022 and excited about the role that ADESA U.S. will play in our path toward our long-term goals. Our rationale for the acquisition is threefold: (1) increase production capacity, (2) improve our logistics network, and (3) deepen our vertical integration.
#1 Increase production capacity
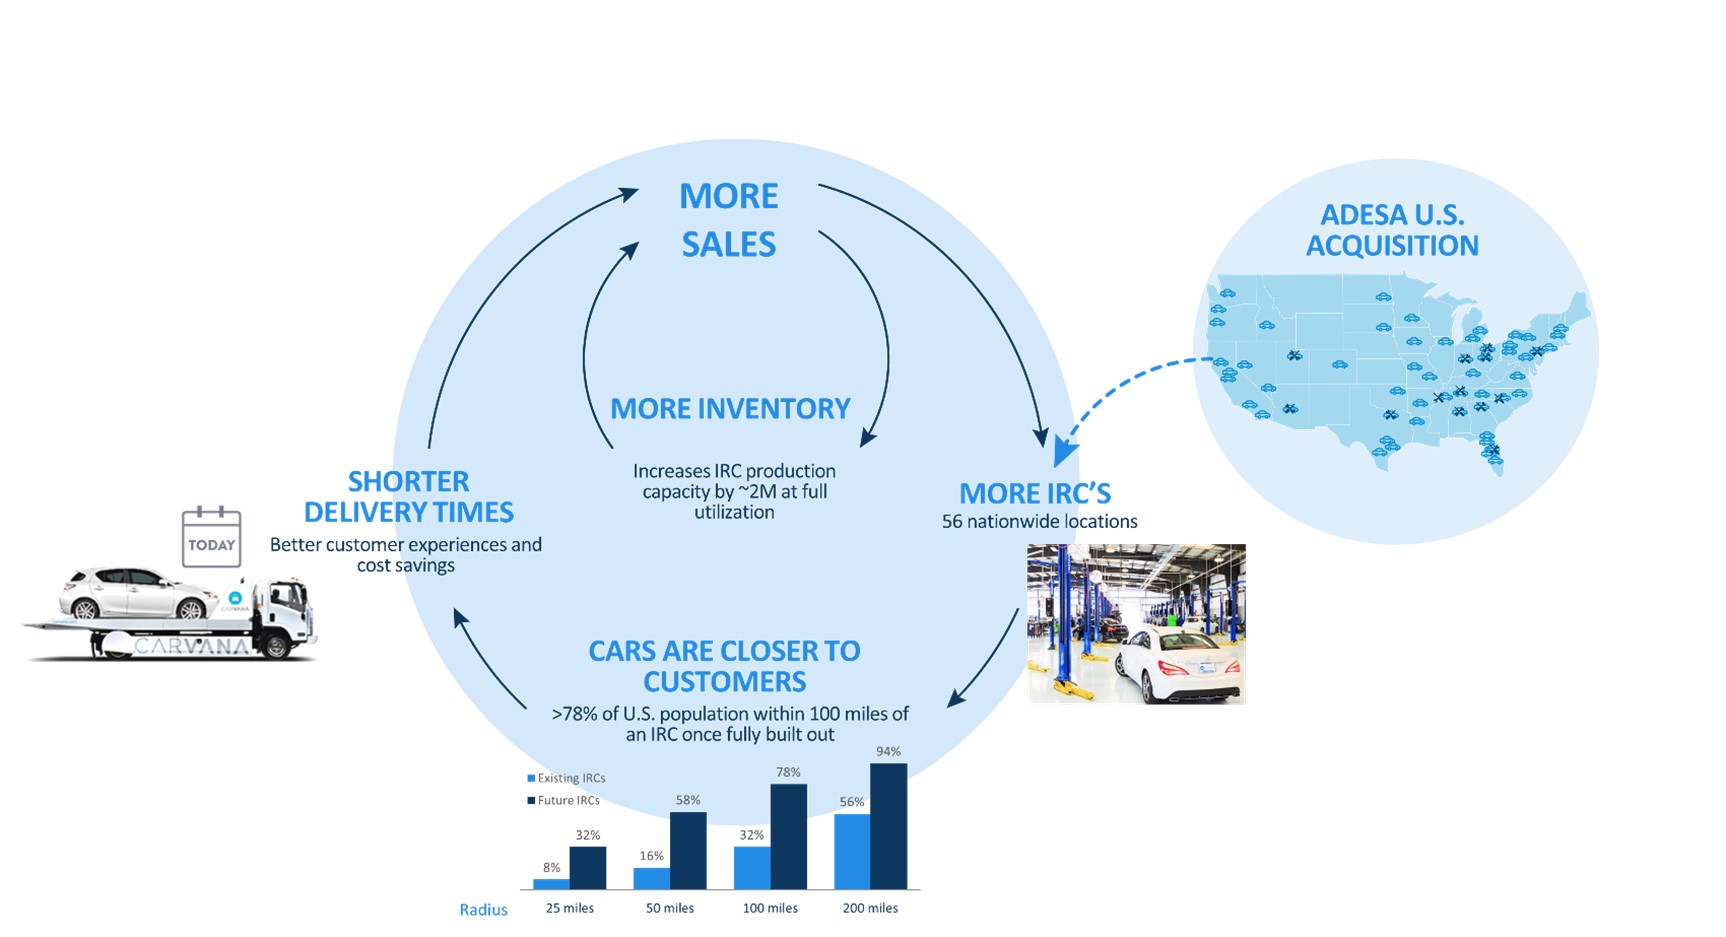
The ADESA U.S. footprint includes 56 sites with approximately 6.5 million square feet of buildings on more than 4,000 acres. We expect to be able to build out approximately 2 million units of annual reconditioning capacity in these locations while still operating the wholesale auction business. This is the equivalent of approximately 30 greenfield Carvana IRC locations in terms of production volume that we expect to unlock over time.
In addition, the ADESA U.S. locations currently have facilities capable of producing more than 200k cars per year, which will enable us to get meaningful production volume out of these locations more quickly without the need for additional real estate improvements.
#2 Improve our logistics network
Adding the ADESA U.S. footprint will dramatically improve our logistics network over time. With the addition of these locations, we will eventually have reconditioned, front-line inventory within 50 miles of 58% of the US population and will be within 200 miles of 94%.
This will have the benefit of reducing shipping distances, times, and costs, accelerating us to our long-term financial model. In fact, we estimate that sales that we complete today to customers within 200 miles of the IRC where their car is stored cost us $750 less in COGS and SG&A than our average sale. In addition, adding the ADESA U.S. locations will make our network more resilient and more robust to weather disruptions by having more routes connecting origin and destination points.
In addition, it unlocks the opportunity for same day and next day delivery to more customers than ever before.
#3 Deepen our vertical integration
As we have discussed in the past, the entire used car market and all the institutions that comprise it exist to help customers switch cars with one another. The more of this market that we can participate in and the more we can integrate those various functions, the more cost we can remove from the system and the simpler we can make experiences for all of our customers, both consumers and other buyers and sellers.
The most immediate and simplest of these benefits is the ability for us to more efficiently purchase cars directly from customers nationwide whether we plan to sell them ourselves or not. Today we frequently have our last mile delivery advocates pick these cars up from customer’s homes and transport them to a market hub and then transport these cars long distances from their origin to our nearest IRC where they are either reconditioned or held until they are wholesaled. With this acquisition, we can now position advocates at the auction locations and transport cars from our customer’s driveways directly to an ADESA U.S. location without any additional moves.
We expect there to be additional opportunities to reduce costs and improve the economics and experience of buying and selling cars for all of our customers over time.
Overall, we expect the acquisition of ADESA U.S. to accelerate the positive feedback that exists in our business. Demand enables us to invest in more inspection center capacity to drive more selection, and more inspection center locations reduce delivery times and costs. Finally, more selection, faster delivery times, and lower costs drive more demand starting the cycle over again.
For additional details on ADESA U.S., please see: https://investors.carvana.com/investor-resources/investor-materials
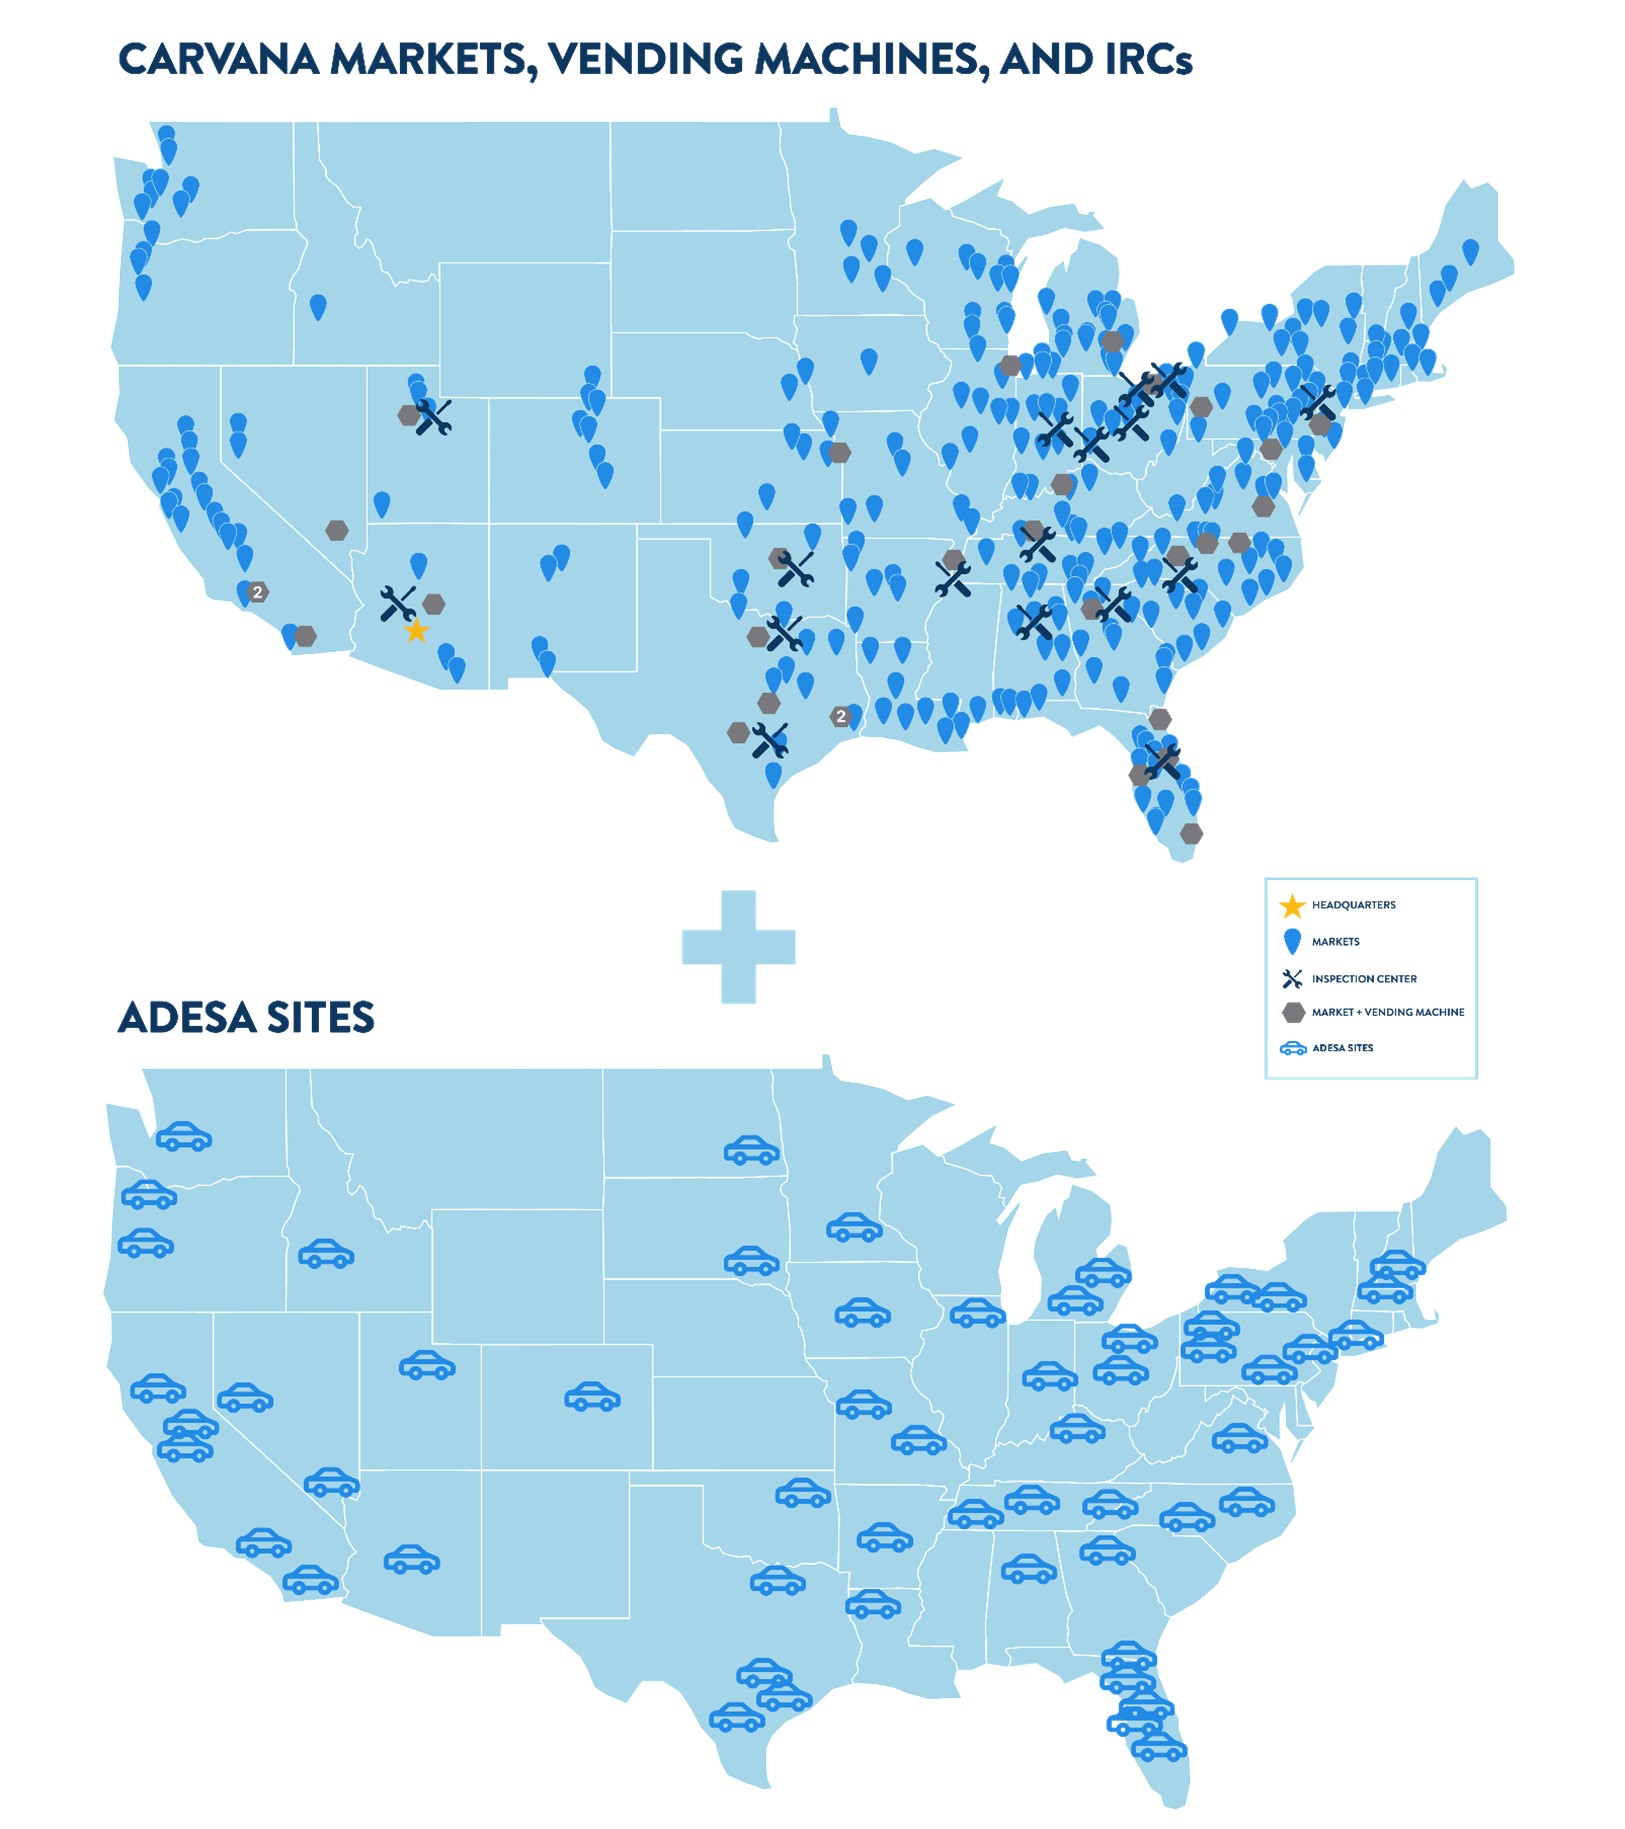
Expansion
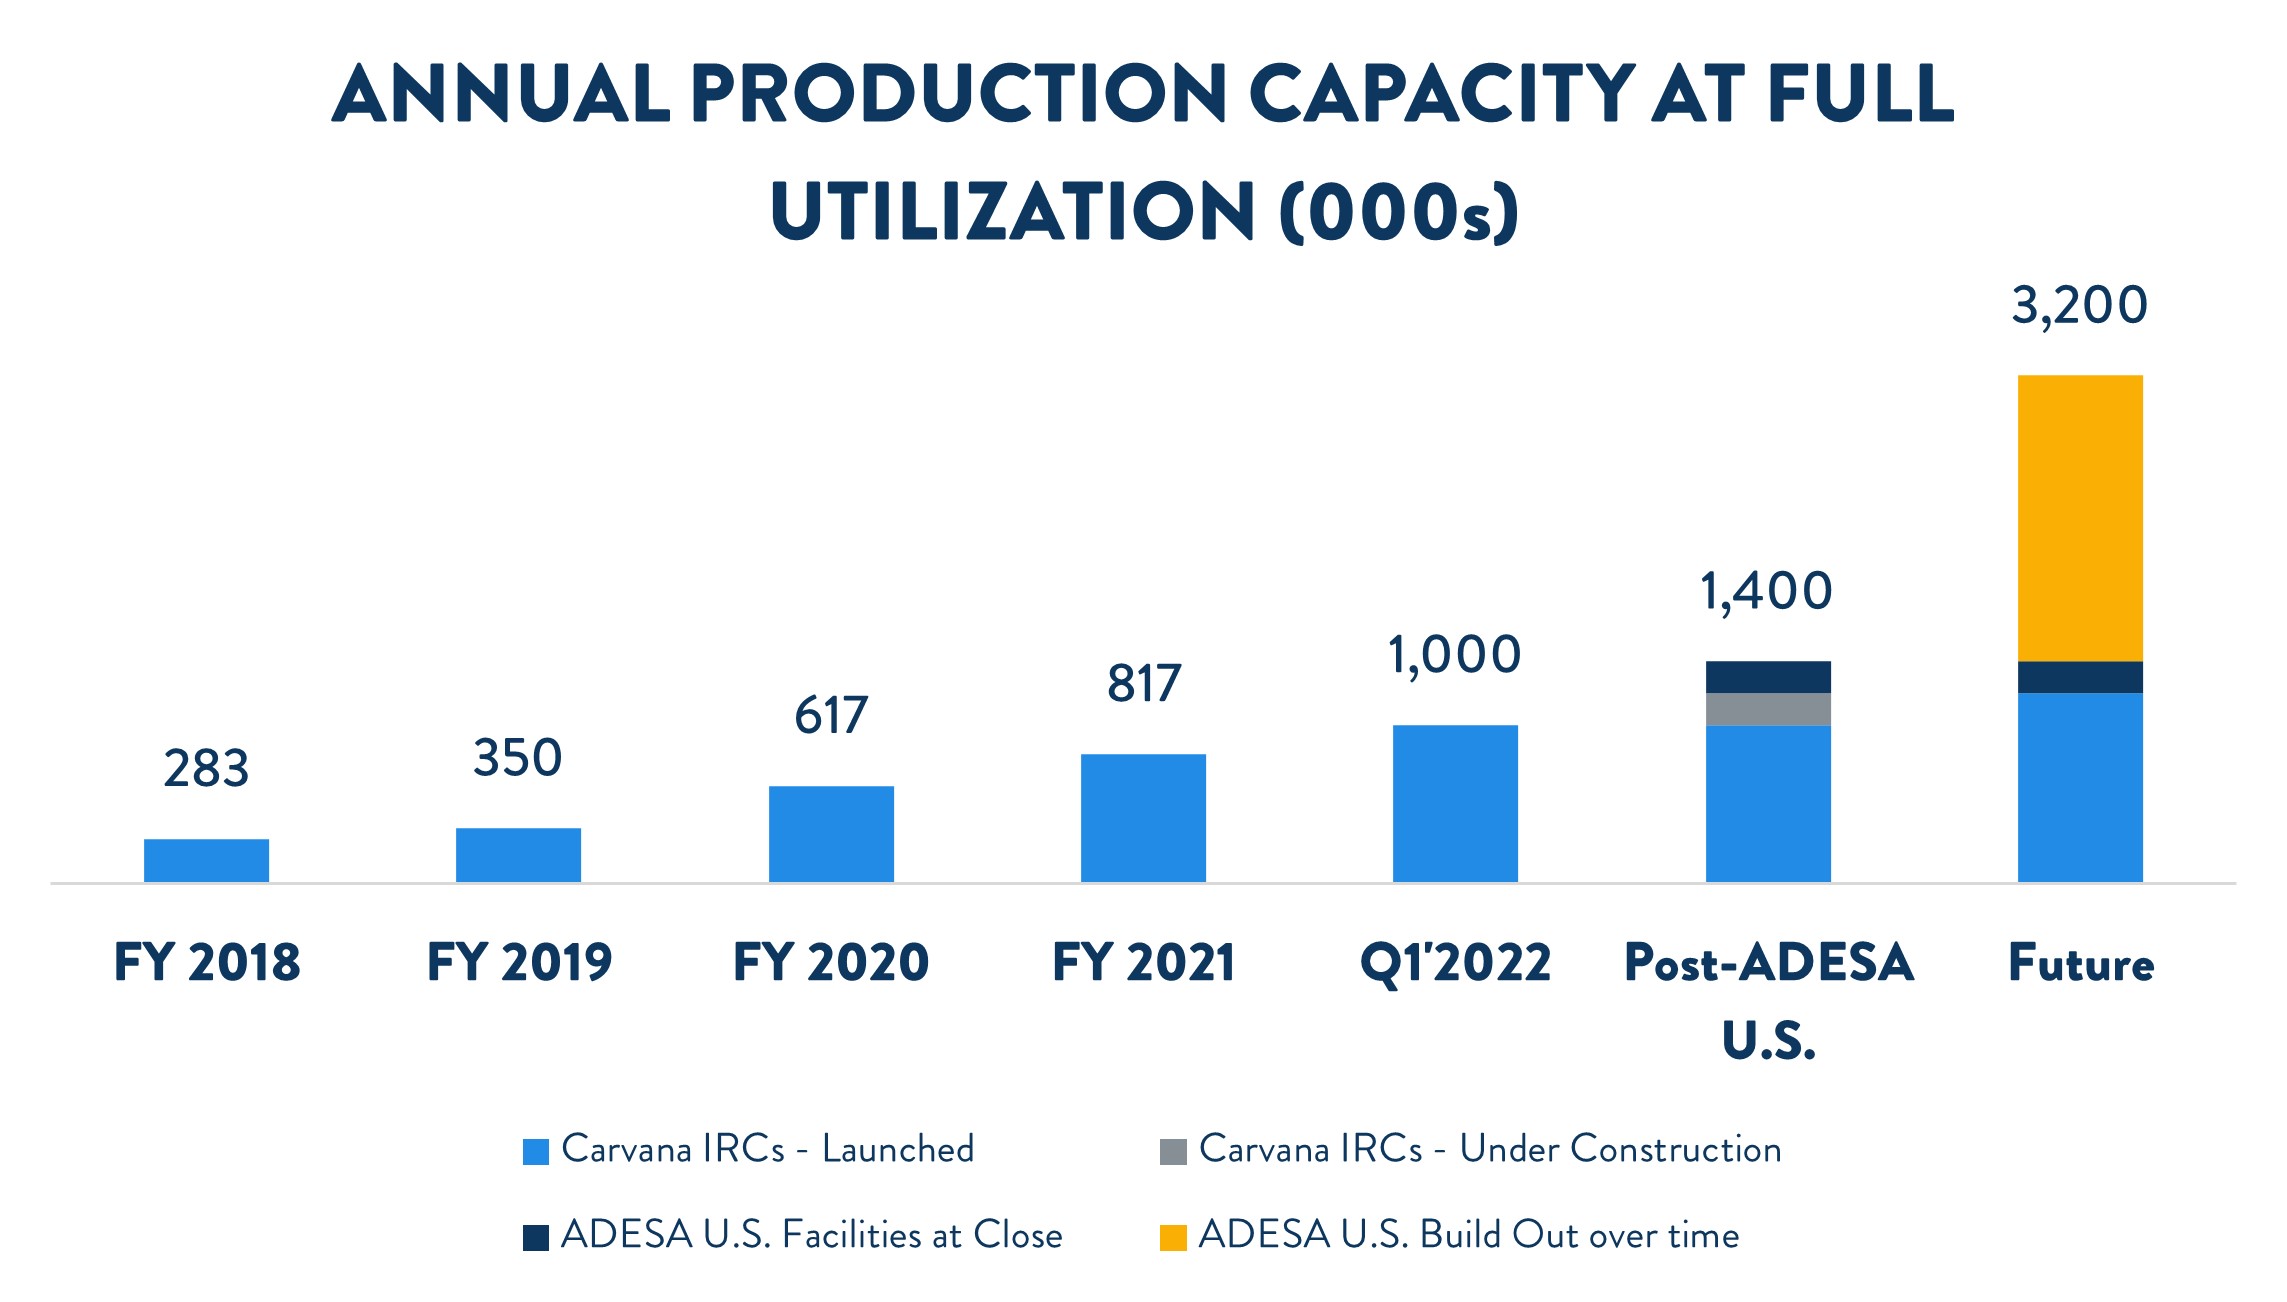
We continued making significant progress scaling our production capacity in Q1 2022. We opened our 15th, 16th and 17th IRCs in Cincinnati, OH, Oklahoma City, OK and San Antonio, TX, respectively, increasing total annual capacity at full utilization to approximately 1 million units at quarter-end.
Prior to the ADESA U.S. acquisition, we planned to open 8 new Carvana IRCs in 2021. We opened 1 in Q4 2021 and 3 in Q1 2022. We also plan to open 3 more in 2022, bringing our total to 7 out of 8. Following the acquisition of ADESA U.S., we have paused the construction of the remaining planned IRC to allow us to focus on integrating ADESA U.S. locations into our reconditioning and logistics network.
ADESA U.S.’s 56 locations currently have the physical capacity to produce more than 200k units per year when fully staffed with limited real estate improvements. Combining our own IRCs with ADESA U.S. locations, we expect total annual capacity at full utilization to be approximately 1.4 million units by the end of 2022.
Looking beyond 2022, we expect to focus our expansion efforts on developing ADESA U.S. sites on the path toward fully unlocking approximately 2M units of incremental annual production capacity at full utilization, as well as improving our logistics network and reducing delivery times and costs.
*As of April 20, 2022
For a complete list of our market opening history, estimated populations, and estimated total industry used vehicle sales by market, along with details on our IRCs, please see: https://investors.carvana.com/investor-resources/investor-materials
Management Objectives
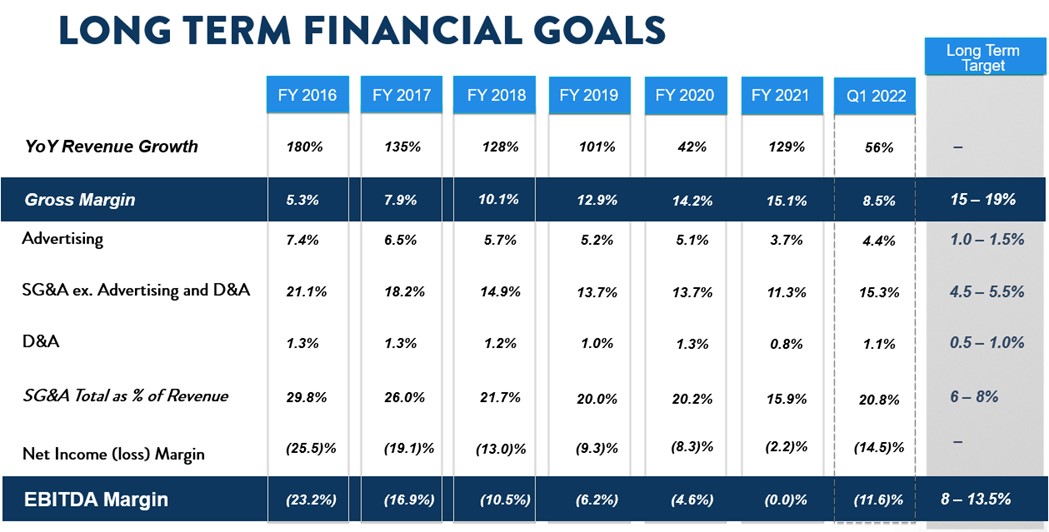
Our three primary financial objectives are: (1) Grow Retail Units and Revenue; (2) Increase Total Gross Profit Per Unit; and (3) Demonstrate Operating Leverage. We believe continued focus on these goals will lead to a strong long-term financial model.
Objective #1: Grow Retail Units and Revenue
Retail units sold in Q1 increased to 105,185, up 14% from 92,457 in Q1 2021. Q1 revenue grew to $3.497 billion, up 56% from $2.245 billion. Revenue grew faster than retail units due to higher used vehicle prices and higher wholesale volume from buying more cars from customers.
Our growth rate in Q1 was negatively impacted by several external and internal factors.
•High used vehicle prices had a significant impact on industry-wide used vehicle sales, since higher prices reduce affordability, leading some buyers to forgo or delay their purchases.
•Rapid increases in benchmark interest rates continued throughout the quarter, placing further pressure on affordability for customers.
•Increases in gasoline prices, continued higher economy-wide inflation, and dampening of consumer sentiment further impacted used vehicle buyers.
•Omicron and severe weather events caused significant and persistent disruptions in our logistics network. These disruptions created a backlog of network constraints that lasted longer than expected and had more significant impacts than expected. Logistics network constraints impacted volume through several channels:
◦Extended delivery times, which negatively impacts conversion to sale.
◦Elevated delivery rescheduling and cancellation rates, which led to many cases in which we lost and were unable to recover customers who had their delivery times pushed to a later date.
◦The need to meter inventory visibility in search results due to constraints along shipping routes, which negatively impacts conversion due to lower available selection.
In Q1 we grew retail units sold by 14%, despite negative impacts from both external and internal factors. Precisely quantifying the impact of the external factors (e.g., high used vehicle prices, rising interest rates, rising gas prices and inflation) is difficult, but we can approximate them by looking at populations of customers that are less impacted by affordability. For our customers with FICO scores over 700, growth was approximately 50% in Q1. These customers were also impacted by our operational constraints. Quantifying the impact of internal constraints is also difficult, but we believe they further significantly reduced sales in the first quarter. We continue to work on relieving these constraints.
Objective #2: Increase Total Gross Profit Per Unit
Q1 2022 was impacted by a variety of factors that joined together to create an outlier quarter on Total GPU.
•Total
◦Total GPU was $2,833 (incl. $76 gift impact; $2,909 excl. gift impact) vs. $3,656 in Q1 2021
•Retail
◦Retail GPU was $808 (incl. $76 gift impact; $884 excl. gift impact) vs. $1,211 in Q1 2021
◦The spread of Omicron, severe weather events, and related inefficiencies had a significant impact on Retail GPU in Q1. In particular, in Q1 2022 we saw:
▪A more than $600 per retail unit YoY increase in reconditioning and inbound transport costs primarily due to inefficiencies in the inspection and reconditioning centers and logistics network driven by Omicron, severe weather events, and the extended timelines required to recover from these events and to lower retail unit sold volume, which increased per unit costs.
▪A more than $100 per retail unit YoY decrease in shipping revenue driven by refunds to customers following extended delivery times.
▪These impacts were partially offset by gains in buying cars from customers.
◦We believe the factors impacting Q1 were transitory, and we expect to see costs move toward more normalized levels over the coming quarters as our logistics network normalizes and our expense levels are better balanced with sales volumes.
•Wholesale
◦Wholesale GPU was $219 vs. $227 in Q1 2021
◦Year-over-year changes in wholesale GPU were due to wholesale volume growth (units +93% YoY to 50,280), offset by a decrease in gross profit per wholesale unit sold to $457 from $806 in Q1 2021 due to higher wholesale market depreciation and higher inbound transport costs on wholesale units sold due to the factors described above.
•Other
◦Other GPU was $1,806 vs. $2,218 in Q1 2021
◦Year-over-year changes in Other GPU were primarily driven by higher benchmark interest rates at time of loan sale relative to origination interest rates and widening of credit spreads following the onset of the conflict between Russia and Ukraine, partially offset by the impact of higher industry-wide vehicle prices on average loan size.
▪Looking sequentially, the rapid rise in benchmark interest rates and widening credit spreads had a significant impact on the spread between funding costs and origination interest rates in Q1 vs. Q4. This increase in spread had a more than $600 impact on Other GPU in Q1. We expect this spread to move toward more normalized levels over the coming quarters.
▪Importantly, we believe Other GPU is impacted more by rapid changes in rates than the level of rates. The rise in benchmark interest rates in Q4 through Q1 was the largest and fastest we have seen in nearly 15 years, since mid-2008. We have made several changes that we expect to dampen the impact of future movements in benchmark interest rates. First, we have passed through a large portion of recent funding cost increases into origination APRs. Second, we have updated our pricing cadence to update APRs more quickly in response to rapid changes in benchmark interest rates. Third, we have increased our hedging of benchmark interest rate risk on originated loans. We are already seeing these changes impact loans originated in April, with the spread between originated APRs and benchmark interest rates meaningfully higher in April than in Q1.
Objective #3: Demonstrate Operating Leverage
The same factors that impacted retail units sold and total GPU in Q1 2022 also impacted SG&A as a percent of revenue, net loss margin, and EBITDA margin. Net loss margin increased by 10.8%, and EBITDA margin loss increased by 10.2% each driven by lower retail unit growth relative to expense growth and lower total GPU.
The same factors that impacted retail units sold (e.g., Omicron, severe weather events, logistics network constraints, high used vehicle prices, rising interest rates, other macro factors) had a significant impact on SG&A per retail unit sold in Q1. We generally prepare for sales volume 6-12 months in advance, meaning we built capacity in each of our business functions for significantly more volume than we fulfilled in Q1. With our costs relatively fixed in the short-term, the lower retail unit volume led to higher SG&A per unit.
Total SG&A as a percentage of revenue in Q1 increased by 3.1%, compensation and benefits increased by 1.7%, advertising was flat, logistics and market occupancy increased by 0.3%, and other SG&A increased by 1.1%.
Over the next several quarters, we expect to better align sales with expense levels through a combination of higher sales and expense efficiencies. We expect this to lead to a meaningful sequential decrease in SG&A per retail unit sold and improvement in EBITDA margin in Q2.
Summary
The first quarter was challenging.
As we have before, we will adjust to the new environment while also keeping our eyes on our long-term goals.
Difficult environments sharpen us. They reveal our weaknesses and force new perspectives. In that way, they present new opportunities. This environment is no different. It is an opportunity.
While the quarter was undoubtedly a step backwards in our financial results, we will work hard to make it the marker of an even larger step forward in achieving our goal of becoming the largest and most profitable automotive retailer.
The march continues.
Sincerely,
Ernie Garcia, III, Chairman and CEO
Mark Jenkins, CFO
Appendix
Conference Call Details
Carvana will host a conference call today, April 20, 2022, at 5:30 p.m. EST (2:30 p.m. PST) to discuss financial results. To participate in the live call, analysts and investors should dial (833) 255-2830 or (412) 902-6715, and ask for “Carvana Earnings.” A live audio webcast of the conference call along with supplemental financial information will also be accessible on the company's website at investors.carvana.com. Following the webcast, an archived version will also be available on the Investor Relations section of the company’s website. A telephonic replay of the conference call will be available until April 27, 2022, by dialing (877) 344-7529 or (412) 317-0088 and entering passcode 8325992#.
Forward Looking Statements
This letter contains forward-looking statements within the meaning of the Private Securities Litigation Reform Act of 1995. These forward-looking statements reflect Carvana’s current expectations and projections with respect to, among other things, its financial condition, results of operations, plans, objectives, future performance, and business. These statements may be preceded by, followed by or include the words "aim," "anticipate," "believe," "estimate," "expect," "forecast," "intend," "likely," "outlook," "plan," "potential," "project," "projection," "seek," "can," "could," "may," "should," "would," "will," the negatives thereof and other words and terms of similar meaning.
Forward-looking statements include all statements that are not historical facts. Such forward-looking statements are subject to various risks and uncertainties. Accordingly, there are or will be important factors that could cause actual outcomes or results to differ materially from those indicated in these statements. Among these factors are risks related to the “Risk Factors” identified in our Annual Report on Form 10-K for 2021.
There is no assurance that any forward-looking statements will materialize. You are cautioned not to place undue reliance on forward-looking statements, which reflect expectations only as of this date. Carvana does not undertake any obligation to publicly update or review any forward-looking statement, whether as a result of new information, future developments, or otherwise.
Use of Non-GAAP Financial Measures
As appropriate, we supplement our results of operations determined in accordance with U.S. generally accepted accounting principles (“GAAP”) with certain non-GAAP financial measurements that are used by management, and which we believe are useful to investors, as supplemental operational measurements to evaluate our financial performance. These measurements should not be considered in isolation or as a substitute for reported GAAP results because they may include or exclude certain items as compared to similar GAAP-based measurements, and such measurements may not be comparable to similarly-titled measurements reported by other companies. Rather, these measurements should be considered as an additional way of viewing aspects of our operations that provide a more complete understanding of our business. We strongly encourage investors to review our consolidated financial statements included in publicly filed reports in their entirety and not rely solely on any one, single financial measurement or communication.
Reconciliations of our non-GAAP measurements to their most directly comparable GAAP-based financial measurements are included at the end of this letter.
Investor Relations Contact Information: Mike Levin, investors@carvana.com
CARVANA CO. AND SUBSIDIARIES
CONDENSED CONSOLIDATED BALANCE SHEETS
(Unaudited)
(In millions, except number of shares, which are reflected in thousands, and par values) | | | | | | | | | | | |
| March 31, 2022 | | December 31, 2021 |
| ASSETS | | | |
| Current assets: | | | |
| Cash and cash equivalents | $ | 247 | | | $ | 403 | |
| Restricted cash | 295 | | | 233 | |
| Accounts receivable, net | 208 | | | 206 | |
| Finance receivables held for sale, net | 393 | | | 356 | |
| | | |
| | | |
| Vehicle inventory | 3,304 | | | 3,149 | |
| Beneficial interests in securitizations | 416 | | | 382 | |
| Other current assets, including $8 and $12, respectively, due from related parties | 207 | | | 163 | |
| Total current assets | 5,070 | | | 4,892 | |
| Property and equipment, net | 1,856 | | | 1,560 | |
| Operating lease right-of-use assets, including $16 and $17, respectively, from leases with related parties | 475 | | | 369 | |
| Intangible assets, net | 4 | | | 4 | |
| Goodwill | 9 | | | 9 | |
| Other assets, including $4 and $7, respectively, due from related parties | 171 | | | 181 | |
| Total assets | $ | 7,585 | | | $ | 7,015 | |
| LIABILITIES & STOCKHOLDERS' EQUITY | | | |
| Current liabilities: | | | |
| Accounts payable and accrued liabilities, including $28 and $27, respectively, due to related parties | $ | 748 | | | $ | 656 | |
| Short-term revolving facilities | 2,786 | | | 2,053 | |
| Current portion of long-term debt | 178 | | | 152 | |
| Other current liabilities, including $4 and $3, respectively, from leases with related parties | 29 | | | 29 | |
| Total current liabilities | 3,741 | | | 2,890 | |
| Long-term debt, excluding current portion | 3,286 | | | 3,208 | |
| | | |
| Operating lease liabilities, excluding current portion, including $12 and $13, respectively, from leases with related parties | 474 | | | 361 | |
| Other liabilities | 32 | | | 31 | |
| Total liabilities | 7,533 | | | 6,490 | |
| Commitments and contingencies | | | |
| | | |
| Stockholders' equity: | | | |
| | | |
| | | |
| Preferred stock, $0.01 par value - 50,000 shares authorized; none issued and outstanding as of March 31, 2022 and December 31, 2021 | — | | | — | |
| Class A common stock, $0.001 par value - 500,000 shares authorized; 90,062 and 89,930 shares issued and outstanding as of March 31, 2022 and December 31, 2021, respectively | — | | | — | |
| Class B common stock, $0.001 par value - 125,000 shares authorized; 82,900 shares issued and outstanding as of March 31, 2022 and December 31, 2021 | — | | | — | |
| Additional paid-in capital | 829 | | | 795 | |
| | | |
| Accumulated deficit | (749) | | | (489) | |
| Total stockholders' equity attributable to Carvana Co. | 80 | | | 306 | |
| Non-controlling interests | (28) | | | 219 | |
| Total stockholders' equity | 52 | | | 525 | |
| Total liabilities & stockholders' equity | $ | 7,585 | | | $ | 7,015 | |
CARVANA CO. AND SUBSIDIARIES
CONDENSED CONSOLIDATED STATEMENTS OF OPERATIONS
(Unaudited)
(In millions, except number of shares, which are reflected in thousands, and per share amounts)
| | | | | | | | | | | | | | | |
| Three Months Ended March 31, | | |
| 2022 | | 2021 | | | | |
| Sales and operating revenues: | | | | | | | |
| Used vehicle sales, net | $ | 2,732 | | | $ | 1,800 | | | | | |
| Wholesale vehicle sales, including $14 and $6, respectively, from related parties | 575 | | | 240 | | | | | |
| Other sales and revenues, including $48 and $42, respectively, from related parties | 190 | | | 205 | | | | | |
| | | | | | | |
| Net sales and operating revenues | 3,497 | | | 2,245 | | | | | |
| Cost of sales, including $9 and $1, respectively, to related parties | 3,199 | | | 1,907 | | | | | |
| Gross profit | 298 | | | 338 | | | | | |
| Selling, general and administrative expenses, including $6 and $6, respectively, to related parties | 727 | | | 397 | | | | | |
| | | | | | | |
| Interest expense | 64 | | | 30 | | | | | |
| Other expense (income), net | 13 | | | (7) | | | | | |
| Net loss before income taxes | (506) | | | (82) | | | | | |
| Income tax provision | — | | | — | | | | | |
| Net loss | (506) | | | (82) | | | | | |
| Net loss attributable to non-controlling interests | (246) | | | (46) | | | | | |
| Net loss attributable to Carvana Co. | $ | (260) | | | $ | (36) | | | | | |
| | | | | | | |
| | | | | | | |
| | | | | | | |
| | | | | | | |
| Net loss per share of Class A common stock, basic and diluted | $ | (2.89) | | | $ | (0.46) | | | | | |
| | | | | | | |
| | | | | | | |
Weighted-average shares of Class A common stock, basic and diluted (1) | 90,095 | | | 78,103 | | | | | |
| | | | | | | |
(1) Weighted-average shares of Class A common stock outstanding have been adjusted for unvested restricted stock awards.
CARVANA CO. AND SUBSIDIARIES
CONDENSED CONSOLIDATED STATEMENTS OF CASH FLOWS
(Unaudited)
(In millions) | | | | | | | | | | | |
| Three Months Ended March 31, |
| 2022 | | 2021 |
| Cash Flows from Operating Activities: | | | |
| Net loss | $ | (506) | | | $ | (82) | |
| Adjustments to reconcile net loss to net cash used in operating activities: | | | |
| Depreciation and amortization expense | 37 | | | 22 | |
| Equity-based compensation expense | 28 | | | 8 | |
| Loss on disposal of property and equipment | 1 | | | — | |
| Provision for bad debt and valuation allowance | 5 | | | 1 | |
| Amortization and write-off of debt issuance costs and bond premium | 6 | | | 2 | |
| Unrealized loss on warrants to acquire Root Class A common stock | 5 | | | — | |
| Unrealized (gain) loss on beneficial interests in securitization | 10 | | | (2) | |
| | | |
| Changes in finance receivable related assets: | | | |
| Originations of finance receivables | (1,985) | | | (1,427) | |
| Proceeds from sale of finance receivables, net | 1,906 | | | 1,368 | |
| | | |
| Gain on loan sales | (105) | | | (138) | |
| Principal payments received on finance receivables held for sale | 61 | | | 32 | |
| Other changes in assets and liabilities: | | | |
| Vehicle inventory | (133) | | | (397) | |
| Accounts receivable | (5) | | | (41) | |
| | | |
| Other assets | (43) | | | (29) | |
| Accounts payable and accrued liabilities | 117 | | | 151 | |
| Operating lease right-of-use assets | (106) | | | — | |
| | | |
| | | |
| Operating lease liabilities | 113 | | | — | |
| Other liabilities | 1 | | | — | |
| Net cash used in operating activities | (593) | | | (532) | |
| Cash Flows from Investing Activities: | | | |
| | | |
| Purchases of property and equipment | (220) | | | (82) | |
| | | |
| Principal payments received on and proceeds from sale of beneficial interests | 12 | | | 7 | |
| | | |
| Net cash used in investing activities | (208) | | | (75) | |
| Cash Flows from Financing Activities: | | | |
| Proceeds from short-term revolving facilities | 5,231 | | | 2,064 | |
| Payments on short-term revolving facilities | (4,498) | | | (1,981) | |
| Proceeds from issuance of long-term debt | 20 | | | 640 | |
| Payments on long-term debt | (36) | | | (14) | |
| Payments of debt issuance costs | — | | | (7) | |
| | | |
| Proceeds from equity-based compensation plans | 2 | | | — | |
| Tax withholdings related to restricted stock units and awards | (12) | | | (9) | |
| | | |
| | | |
| | | |
| Net cash provided by financing activities | 707 | | | 693 | |
| Net increase (decrease) in cash, cash equivalents and restricted cash | (94) | | | 86 | |
| Cash, cash equivalents and restricted cash at beginning of period | 636 | | | 329 | |
| Cash, cash equivalents and restricted cash at end of period | $ | 542 | | | $ | 415 | |
| | | |
CARVANA CO. AND SUBSIDIARIES
OUTSTANDING SHARES AND LLC UNITS
(Unaudited)
LLC Units (adjusted for the exchange ratio and participation thresholds) are considered potentially dilutive shares of Class A common stock because they are exchangeable into shares of Class A common stock, if the Company elects not to settle exchanges in cash. Weighted-average shares of Class A common stock and as-exchanged LLC Units, which were evaluated for potentially dilutive effects and were determined to be anti-dilutive, are as follows:
| | | | | | | | | | | | | | | |
| Three Months Ended March 31, | | |
| 2022 | | 2021 | | | | |
| | | | | | | |
| (in thousands) |
| Weighted-average shares of Class A common stock outstanding | 90,095 | | | 78,103 | | | | | |
| Weighted-average as-exchanged LLC Units for shares of Class A common stock | 84,952 | | | 96,569 | | | | | |
| 175,047 | | | 174,672 | | | | | |
| | | | | | | |
| | | | | | | |
CARVANA CO. AND SUBSIDIARIES
RECONCILIATION OF GAAP TO NON-GAAP FINANCIAL MEASURES (continued)
(Unaudited)
EBITDA, EBITDA Margin, Adjusted EBITDA and Adjusted EBITDA Margin
EBITDA, EBITDA Margin, Adjusted EBITDA and Adjusted EBITDA Margin are supplemental measures of operating performance that do not represent and should not be considered an alternative to net loss or cash flow from operations, as determined by U.S. GAAP. EBITDA is defined as net loss before interest expense, income tax expense, and depreciation and amortization expense. Adjusted EBITDA is defined as EBITDA plus other expense (income), net and other unusual items, as provided in the following table. EBITDA Margin is EBITDA as a percentage of total revenues. Adjusted EBITDA Margin is Adjusted EBITDA as a percentage of total revenues. We use EBITDA and Adjusted EBITDA to measure the operating performance of our business and EBITDA Margin and Adjusted EBITDA Margin to measure our operating performance relative to our total revenues. We believe these metrics are useful measures to us and to our investors because they exclude certain financial and capital structure items that we do not believe directly reflect our core operations and may not be indicative of our recurring operations, in part because they may vary widely across time and within our industry independent of the performance of our core operations. We believe that excluding these items enables us to more effectively evaluate our performance period-over-period and relative to our competitors. EBITDA, EBITDA Margin, Adjusted EBITDA and Adjusted EBITDA margin may not be comparable to similarly titled measures provided by other companies due to potential differences in methods of calculations. A reconciliation of EBITDA and Adjusted EBITDA to net loss, which is the most directly comparable U.S. GAAP measure, and calculation of EBITDA Margin and Adjusted EBITDA Margin is as follows:
| | | | | | | | | | | | | | | | | | | | | | | | | | | | | | | | |
| | | | Three Months Ended |
| (dollars in millions) | | | | Mar 31, 2021 | | Jun 30, 2021 | | Sep 30, 2021 | | Dec 31, 2021 | | Mar 31, 2022 |
| | | | | | | | | | | | |
| | | | |
| Net (loss) income | | | | $ | (82) | | | $ | 45 | | | $ | (68) | | | $ | (182) | | | $ | (506) | |
| Depreciation and amortization expense | | | | 22 | | | 24 | | | 26 | | | 33 | | | 37 | |
| Interest expense | | | | 30 | | | 43 | | | 48 | | | 55 | | | 64 | |
| | | | | | | | | | | | |
| Income tax provision | | | | — | | | — | | | — | | | 1 | | | — | |
| EBITDA | | | | $ | (30) | | | $ | 112 | | | $ | 6 | | | $ | (93) | | | $ | (405) | |
| | | | | | | | | | | | |
| Total revenues | | | | $ | 2,245 | | | $ | 3,336 | | | $ | 3,480 | | | $ | 3,753 | | | $ | 3,497 | |
| Net (loss) income margin | | | | (3.7) | % | | 1.3 | % | | (2.0) | % | | (4.8) | % | | (14.5) | % |
| EBITDA Margin | | | | (1.3) | % | | 3.4 | % | | 0.2 | % | | (2.5) | % | | (11.6) | % |
| | | | | | | | | | | | |
| EBITDA | | | | $ | (30) | | | $ | 112 | | | $ | 6 | | | $ | (93) | | | $ | (405) | |
| Other expense (income), net | | | | (7) | | | (6) | | | (3) | | | 22 | | | 13 | |
| CEO Milestone Gift in cost of sales | | | | — | | | — | | | — | | | — | | | 8 | |
| CEO Milestone Gift in SG&A | | | | — | | | — | | | — | | | — | | | 20 | |
| Adjusted EBITDA | | | | $ | (37) | | | $ | 106 | | | $ | 3 | | | $ | (71) | | | $ | (364) | |
| | | | | | | | | | | | |
| Total revenues | | | | $ | 2,245 | | | $ | 3,336 | | | $ | 3,480 | | | $ | 3,753 | | | $ | 3,497 | |
| Adjusted EBITDA Margin | | | | (1.6) | % | | 3.2 | % | | 0.1 | % | | (1.9) | % | | (10.4) | % |
| | | | | | | | | | | | | | | | | | | | | | | | | | | | | | | | | | | | | | | | | | | | |
| | | | Years Ended December 31, |
| (dollars in millions) | | | | 2015 | | 2016 | | 2017 | | 2018 | | 2019 | | 2020 | | 2021 |
| | | | | | | | | | | | | | | | |
| | | | | | |
| Net loss | | | | $ | (37) | | | $ | (93) | | | $ | (164) | | | $ | (255) | | | $ | (365) | | | $ | (462) | | | $ | (287) | |
| Depreciation and amortization expense | | | | 3 | | | 5 | | | 12 | | | 24 | | | 41 | | | 74 | | | 105 | |
| Interest expense | | | | 1 | | | 3 | | | 7 | | | 25 | | | 81 | | | 131 | | | 176 | |
| Income tax provision | | | | — | | | — | | | — | | | — | | | — | | | — | | | 1 | |
| EBITDA | | | | $ | (33) | | | $ | (85) | | | $ | (145) | | | $ | (206) | | | $ | (243) | | | $ | (257) | | | $ | (5) | |
| | | | | | | | | | | | | | | | |
| Total revenues | | | | $ | 130 | | | $ | 365 | | | $ | 859 | | | $ | 1,955 | | | $ | 3,940 | | | $ | 5,587 | | | $ | 12,814 | |
| Net loss margin | | | | (28.2) | % | | (25.5) | % | | (19.1) | % | | (13.0) | % | | (9.3) | % | | (8.3) | % | | (2.2) | % |
| EBITDA Margin | | | | (25.0) | % | | (23.2) | % | | (16.9) | % | | (10.5) | % | | (6.2) | % | | (4.6) | % | | (0.0) | % |
| | | | | | | | | | | | | | | | |
| EBITDA | | | | $ | (33) | | | $ | (85) | | | $ | (145) | | | $ | (206) | | | $ | (243) | | | $ | (257) | | | $ | (5) | |
| Other expense (income), net | | | | — | | | — | | | 1 | | | 1 | | | 4 | | | (1) | | | 6 | |
| CEO Milestone Gift in cost of sales | | | | — | | | — | | | — | | | 4 | | | 5 | | | 1 | | | — | |
| CEO Milestone Gift in SG&A | | | | — | | | — | | | — | | | 8 | | | 8 | | | — | | | — | |
| Adjusted EBITDA | | | | (33) | | | (85) | | | (144) | | | (193) | | | (226) | | | (257) | | | 1 | |
| | | | | | | | | | | | | | | | |
| Total revenues | | | | $ | 130 | | | $ | 365 | | | $ | 859 | | | $ | 1,955 | | | $ | 3,940 | | | $ | 5,587 | | | $ | 12,814 | |
| Adjusted EBITDA Margin | | | | (25.0) | % | | (23.2) | % | | (16.8) | % | | (9.9) | % | | (5.7) | % | | (4.6) | % | | 0.0 | % |
CARVANA CO. AND SUBSIDIARIES
RESULTS OF OPERATIONS
(Unaudited)
| | | | | | | | | | | | | | | | | | | | | | | | | | |
| | Three Months Ended March 31, | | | | | | |
| | 2022 | | 2021 | | Change | | | | | | |
| | | | | | | | | | | | |
| | (in millions, except unit and per unit amounts) | | | | | | |
| Net sales and operating revenues: | | | | | | | | | | |
| Used vehicle sales, net | | $ | 2,732 | | | $ | 1,800 | | | 51.8 | % | | | | | | |
Wholesale vehicle sales (1) | | 575 | | | 240 | | | 139.6 | % | | | | | | |
Other sales and revenues (2) | | 190 | | | 205 | | | (7.3) | % | | | | | | |
| Total net sales and operating revenues | | $ | 3,497 | | | $ | 2,245 | | | 55.8 | % | | | | | | |
| Gross profit: | | | | | | | | | | | | |
| Used vehicle gross profit | | $ | 85 | | | $ | 112 | | | (24.1) | % | | | | | | |
Wholesale vehicle gross profit (1) | | 23 | | | 21 | | | 9.5 | % | | | | | | |
Other gross profit (2) | | 190 | | | 205 | | | (7.3) | % | | | | | | |
Total gross profit (3) | | $ | 298 | | | $ | 338 | | | (11.8) | % | | | | | | |
| | | | | | | | | | | | |
| | | | | | | | | | | | |
| | | | | | | | | | | | |
| | | | | | | | | | | | |
| | | | | | | | | | | | |
| | | | | | | | | | | | |
| | | | | | | | | | | | |
| | | | | | | | | | | | |
| | | | | | | | | | | | |
| | | | | | | | | | | | |
| | | | | | | | | | | | |
| | | | | | | | | | | | |
| | | | | | | | | | | | |
| | | | | | | | | | | | |
| Unit sales information: | | | | | | | | | | | | |
| Used vehicle unit sales | | 105,185 | | | 92,457 | | | 13.8 | % | | | | | | |
| Wholesale vehicle unit sales | | 50,280 | | | 26,040 | | | 93.1 | % | | | | | | |
| Per unit selling prices: | | | | | | | | | | | | |
| Used vehicles | | $ | 25,973 | | | $ | 19,469 | | | 33.4 | % | | | | | | |
| Wholesale vehicles | | $ | 11,436 | | | $ | 9,217 | | | 24.1 | % | | | | | | |
| Per retail unit gross profit: | | | | | | | | | | | | |
| Used vehicle gross profit | | $ | 808 | | | $ | 1,211 | | | (33.3) | % | | | | | | |
| Wholesale vehicle gross profit | | 219 | | | 227 | | | (3.7) | % | | | | | | |
| Other gross profit | | 1,806 | | | 2,218 | | | (18.6) | % | | | | | | |
Total gross profit (3) | | $ | 2,833 | | | $ | 3,656 | | | (22.5) | % | | | | | | |
| | | | | | | | | | | | |
| | | | | | | | | | | | |
| | | | | | | | | | | | |
| | | | | | | | | | | | |
| | | | | | | | | | | | |
| Per wholesale unit gross profit: | | | | | | | | | | | | |
| Wholesale vehicle gross profit | | $ | 457 | | | $ | 806 | | | (43.2) | % | | | | | | |
| | | | | | | | | | | | |
| | | | | | | | | | | | |
| | | | | | | | | | | | |
| | | | | | | | | | | | |
| | | | | | | | | | | | |
_________________________
(1) Includes $14 and $6, respectively, of wholesale revenue from related parties.
(2) Includes $48 and $42, respectively, of other sales and revenues from related parties.
(3) For the three months ended March 31, 2022, we recognized $8 million of share-based compensation expense within used vehicle gross profit related to the CEO Milestone Gift. The corresponding impact to used vehicle per unit gross profit was $76 for the three months ended March 31, 2022.
CARVANA CO. AND SUBSIDIARIES
COMPONENTS OF SG&A
(Unaudited)
| | | | | | | | | | | | | | | | | | | | | | | | | | | | | | | | | | |
| | Three Months Ended | | |
| | Mar 31, 2021 | | Jun 30, 2021 | | Sep 30, 2021 | | Dec 31, 2021 | | Mar 31, 2022 | | |
| | | | | | | | | | | | |
| | (in millions) | | |
Compensation and benefits (1) | | $ | 126 | | | $ | 148 | | | $ | 181 | | | $ | 212 | | | $ | 236 | | | |
CEO Milestone Gift (2) | | — | | | — | | | — | | | — | | | 20 | | | |
| Advertising | | 100 | | | 119 | | | 126 | | | 134 | | | 155 | | | |
Market occupancy (3) | | 13 | | | 15 | | | 18 | | | 24 | | | 23 | | | |
Logistics (4) | | 30 | | | 34 | | | 40 | | | 44 | | | 56 | | | |
Other (5) | | 128 | | | 154 | | | 181 | | | 206 | | | 237 | | | |
| Total | | $ | 397 | | | $ | 470 | | | $ | 546 | | | $ | 620 | | | $ | 727 | | | |
| | | | | | | | | | | | |
| | | | | | | | | | | | |
| | | | | | | | | | | | |
| | | | | | | | | | | | |
| | | | | | | | | | | | |
| | | | | | | | | | | | |
| | | | | | | | | | | | |
| | | | | | | | | | | | |
| | | | | | | | | | | | |
| | | | | | | | | | | | |
_________________________
(1) Compensation and benefits includes all payroll and related costs, including benefits, payroll taxes, and equity-based compensation, except those related to preparing vehicles for sale, which are included in cost of sales, and those related to the development of software products for internal use, which are capitalized to software and depreciated over the estimated useful lives of the related assets.
(2) CEO Milestone Gift includes all equity-based compensation and payroll tax costs associated with the CEO's gift of personal stock to employees upon the company's one millionth vehicle sold, except those costs related to preparing vehicles for sale, which are included in cost of sales.
(3) Market occupancy costs includes occupancy costs of our vending machine and hubs. It excludes occupancy costs related to reconditioning vehicles which are included in cost of sales and the portion related to corporate occupancy which are included in other costs.
(4) Logistics includes fuel, maintenance and depreciation related to operating our own transportation fleet, and third-party transportation fees, except the portion related to inbound transportation, which is included in cost of sales.
(5) Other costs include all other selling, general and administrative expenses such as IT expenses, corporate occupancy, professional services and insurance, limited warranty, and title and registration.
CARVANA CO. AND SUBSIDIARIES
LIQUIDITY RESOURCES
(Unaudited)
We had the following liquidity resources available as of March 31, 2022 and 2021:
| | | | | | | | | | | |
| March 31,
2022 | | December 31,
2021 |
| | | |
| (in millions) |
| Cash and cash equivalents | $ | 247 | | | $ | 403 | |
Availability under short-term revolving facilities (1) | 483 | | | 438 | |
| | | |
| Committed liquidity resources available | $ | 730 | | | $ | 841 | |
Unpledged vehicle inventory not included above(2) | 1 | | | 665 | |
Unpledged real estate not included above(3) | 824 | | | 677 | |
Unpledged beneficial interests in securitizations(4) | 152 | | | 100 | |
Total liquidity resources(5) | $ | 1,707 | | | $ | 2,283 | |
_________________________
1.Availability under short-term revolving facilities is the available amount we can borrow under our existing vehicle inventory floor plan and finance receivable facilities based on the pledgable value of vehicle inventory and finance receivables on our balance sheet on the period end date, excluding the impact to restricted cash requirements. This is distinct from the total commitment amount of these facilities because it represents the currently borrowable amount, rather than committed future amounts that could be borrowed to finance future additional assets.
2.Unpledged vehicle inventory is the value of vehicle inventory on our balance sheet on the period end date beyond that covered by committed financing agreements. On February 1, 2022, we upsized our vehicle inventory floor plan commitment to $3.0 billion.
3.Unpledged real estate assets include IRC and vending machine real estate assets that have not been previously pledged or sold. Since our first sale-leaseback transaction in 2017, we have historically had flexible access to real estate financing and expect to continue to use various forms of real estate financing in the future.
4.Unpledged beneficial interests in securitizations includes retained beneficial interests in securitizations that have not been previously pledged or sold. We historically have financed the majority of our retained beneficial interests in securitizations and expect to continue to do so in the future.
5.Total liquidity resources is composed of cash and equivalents, availability under existing credit facilities, and additional unpledged assets, including vehicle inventory, finance receivables, real estate, and securities on our balance sheet that can be financed using traditional asset-based financing sources. To optimize our cost of capital, in any given period we may choose not to maximize borrowings on our short-term revolving facilities, maximize revolving commitment size, or immediately sale-leaseback or pledge real estate and retained beneficial interests in securitizations. This has the benefit of reducing interest expense and debt issuance costs and providing flexibility to minimize financing costs over time.