Exhibit 99.1
Dear Shareholders,
In the third quarter we achieved strong operational progress against a difficult industry and macroeconomic backdrop.
The difficult backdrop is visible in our sequential decrease in retail units and the resulting limited progress in SG&A per retail unit sold. The strong operational progress appears through our sequential reduction of Carvana-related SG&A expense by approximately $90 million and sequential improvement in Adjusted EBITDA.
Since the end of the third quarter, we have seen additional industry and economic headwinds that further pressure sales volume, and which are likely to put additional pressure on GPU. To manage the business through this period, we are seeking to rapidly decrease expenses while optimizing for volume flexibility to be able to adjust the business to changes in unit sales as quickly as possible.
While the current environment has drawn our focus to the near-term, the long-term remains extremely exciting. All the things that defined our opportunity a year ago are unchanged. We were always going to have to traverse difficult periods and cycles on our way to fulfilling our mission. Like other companies we admire in history, our goal is to be made better by the challenges we face. On the other side of this period, we plan to be a better company as a result of having gone through it.
While progress is rarely linear, we remain firmly on the path to changing the way people buy and sell cars and to becoming the largest and most profitable automotive retailer.
Summary of Q3 2022 Results
Q3 2022 Financial Results: All financial comparisons stated below are versus Q3 2021, unless otherwise noted. Complete financial tables appear at the end of this letter.
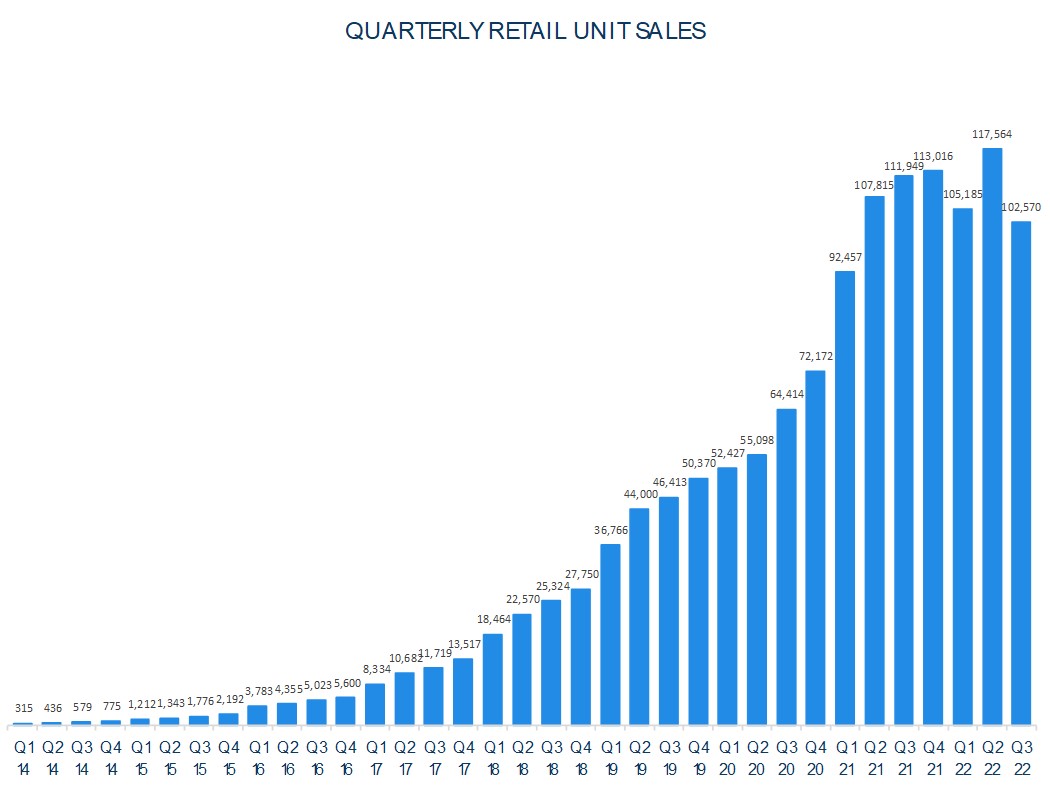
•Retail units sold totaled 102,570 a decrease of 8%
•Revenue totaled $3.386 billion, a decrease of 3%
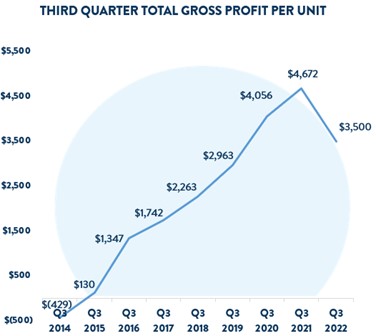
•Total gross profit was $359 million, a decrease of 31%
•Total gross profit per unit was $3,500, a decrease of $1,172
•Total gross profit per unit, excluding depreciation, amortization, and share-based compensation, was $3,870
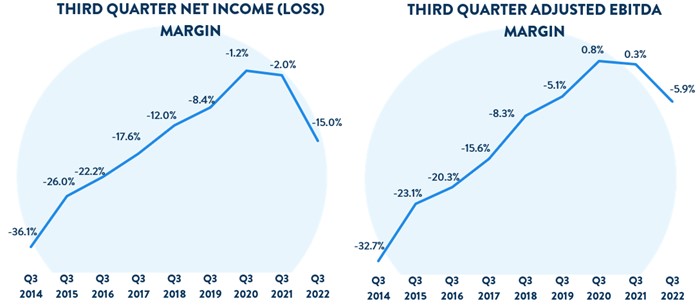
•Net loss margin was (15.0%), a decrease from (2.0%)
•Net loss margin included a (2.1%) non-cash impact from a change of the fair value of Root warrants
•Adjusted EBITDA margin1 was (5.9%), a decrease from 0.3%
•Adjusted EBITDA margin, excluding non-Gift share-based compensation, was (5.5%)
•Basic and diluted net loss per Class A share was $2.67 based on 105.9 million shares of Class A common stock outstanding
Other Results and Recent Events:
•On September 22, 2022, we amended and restated our floorplan facility with Ally to secure $2.2 billion of capacity through September 22, 2023, and $2.0 billion of capacity thereafter through March 22, 2024.
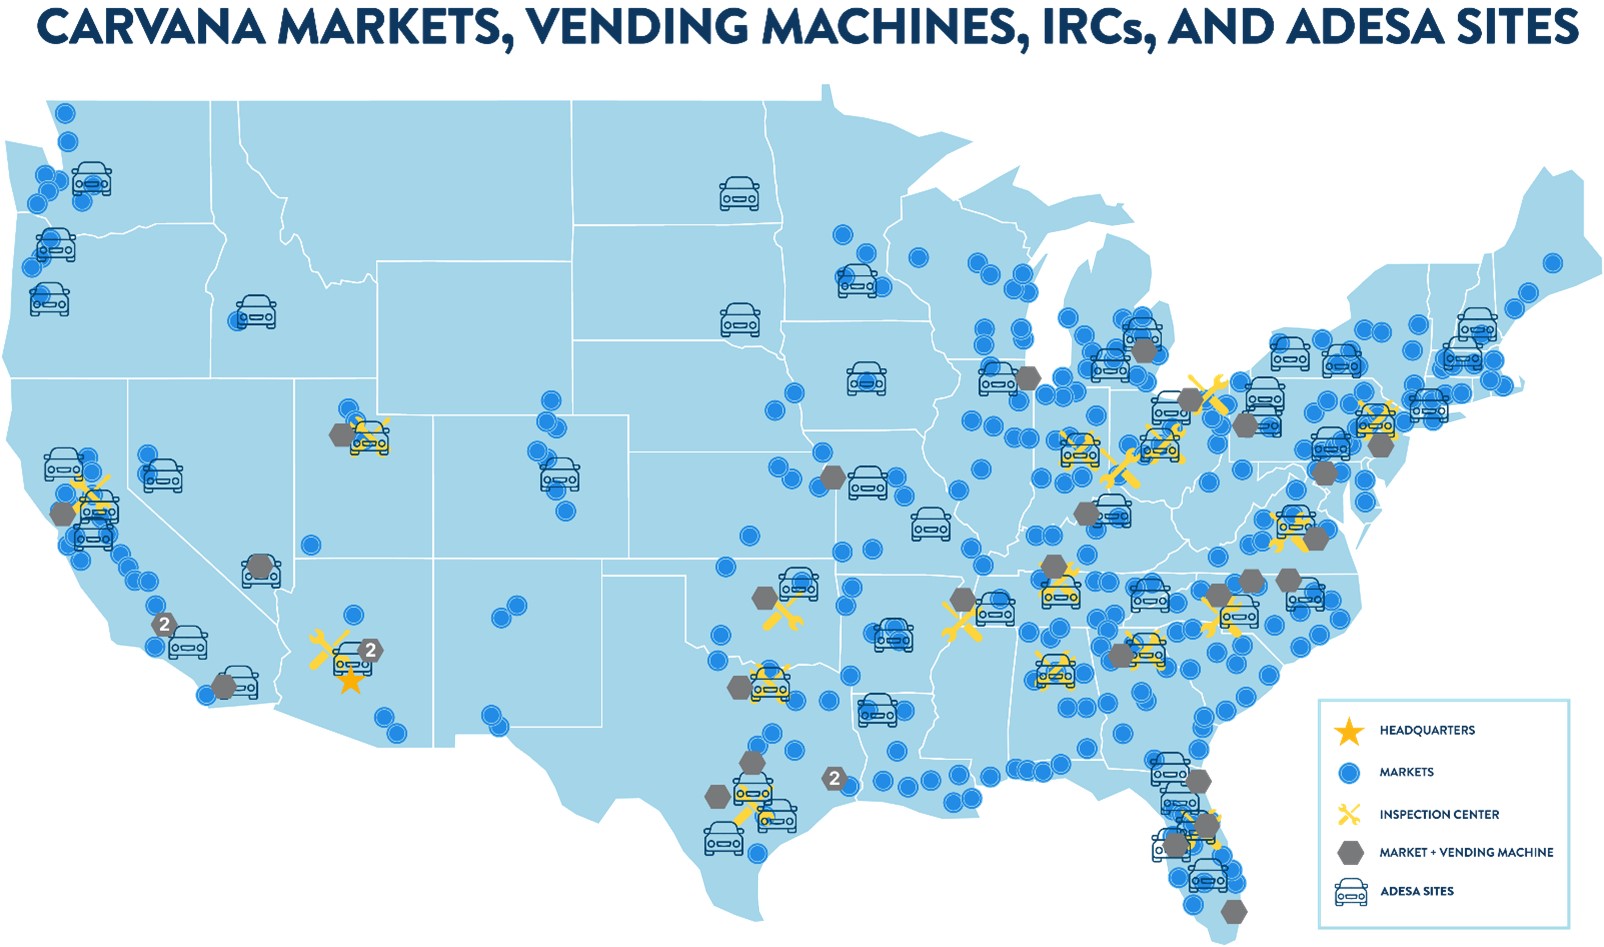
•We opened our second vending machine near Phoenix, AZ.
•We opened a new Carvana IRC near Richmond, VA.
•Following quarter-end, we opened a new Carvana IRC near Sacramento, CA.
1 Adjusted EBITDA margin excludes the impacts of the CEO’s Gift and Other Income and Expense
Outlook
We made strong progress reducing SG&A expenses in Q3 2022. In May 2022, we outlined a stretch goal of $4,000 SG&A expense per retail unit sold, excluding depreciation, amortization, share-based compensation, and ADESA expenses in Q4 2022. This equated to a stretch goal of $4,350 to $4,450 including ADESA expenses. We are making strong progress reducing SG&A expenses on an absolute dollar basis, but due to the current volume environment, we do not expect to reach this stretch goal on a per unit basis in Q4.
In Q4, we expect a sequential reduction in retail units sold and total GPU as the impacts of reduced used vehicle industry demand, increasing benchmark interest rates, higher used vehicle depreciation rates, and our profitability initiatives flow through. We also expect to continue our progress reducing SG&A expenses through our efficiency and cost initiatives.
Our goal is to manage the business to achieve >$4,000 total GPU and significant Adjusted EBITDA profitability at current volume levels, while also building in flexibility to achieve profitability at higher or lower volume levels.
Looking toward 2023, we are not providing a quantitative outlook at this time. In light of current industry and macroeconomic conditions, we believe forecasting the environment over the coming months and quarters is difficult, and we plan instead to provide more real time color on how certain key dynamics are likely to impact our results.
For more information regarding the non-GAAP financial measures discussed in this letter, please see the reconciliations of our non-GAAP measurements to their most directly comparable GAAP-based financial measurements included at the end of this letter.
The Current Environment
We are currently operating in a challenging industry and macroeconomic environment, while simultaneously adapting our business to drive profitability. This environment raises two key questions about our progress: (1) what are the drivers of our current retail units sold volume? and (2) what is our path to profitability and positive free cash flow?
Part 1: Units
Industry-wide used vehicle prices are up 7% YoY and up 43% since 2019 as of September 2022, based on industry data. At the same time, benchmark interest rates have increased on an absolute basis by 3.9% YoY and 2.6% since 2019, and credit spreads have increased 1% YoY and 0.8% since 2019. Putting these together, the monthly payment for a customer buying a typical car in 2022 has increased by 22% and 57% since 2021 and 2019, respectively. This increase in the cost of buying a used vehicle has significantly outpaced the increase in the cost of buying goods and services in the economy as a whole over the same periods.
As a result of these and other affordability headwinds, based on industry data sources industry-wide used vehicle sales declined by 10-15% YoY in Q3 2022. We gained market share against this industry backdrop despite taking numerous actions that are focused on driving profitability but reduce sales, other things being equal.
Our focus on profitability impacts retail unit volume in several ways. Historically, when we were primarily focused on growth, we incorporated the value of future sales, including from repeat customers and word of mouth, into our marketing budget and pricing decisions. As a result, we more frequently acquired sales that were less profitable in the immediate period but were expected to generate higher net present value over time. Currently, as we are primarily focused on profitability, we are intentionally acquiring fewer of these sales.
Additionally, the rapidly rising interest rate environment is creating a headwind to conversion and total GPU. Lower conversion and total GPU reduce the number of profitable sales, other things being equal, leading us to further reduce sales volume.
One example of this occurs in markets with lower profitability due to long distance from inventory (e.g., the Pacific Northwest). We have historically had strong success growing these types of markets over time, but in a profitability-focused or lower GPU environment it makes more sense to reduce advertising or take other actions to improve profitability, such as increasing long-distance shipping fees, in these markets.
As a result of our actions, markets in the central part of the country, excluding Illinois, which are closer to large inventory pools and experienced fewer adjustments, grew by 4% YoY in Q3 2022, significantly outpacing the industry. By comparison, markets in the eastern part of the country performed approximately in-line with the company as a whole, and markets in the western part of the country significantly underperformed the company as a whole.
In Q3, we estimate that the four largest drivers of our retail unit sold volume, outside of the significant decline in industry sales, were rising benchmark interest rates, reduced advertising, reduced inventory, and other actions we are taking to reduce and improve less profitable transactions. These drivers are described in more detail below.
1.First, we continued to see significant increases in benchmark interest rates in Q3 vs. Q2. On average through the quarter, the 2-year Treasury increased by 0.7% to 3.4% in Q3 from 2.7% in Q2. The price Carvana earns on loans sold through both our forward flow and securitization channels is strongly related to the spread between origination rates and the 2-year Treasury rate. Thus, we generally adjust origination rates in conjunction with movements in the 2-year Treasury rate. Meanwhile, we see evidence today that many lenders are increasing rates at a pace that appears to be more closely in line with increases in the Fed Funds rate, which has lagged increases in the 2-year Treasury rate so far this year. We believe different approaches to setting rates have resulted in a temporary sales headwind for Carvana. For example, sales to our cash customers, who aren’t directly impacted by interest rates, grew over 20% year over year. Over time, we believe different approaches to setting rates will converge as interest rates settle, leading to normalization of this headwind.
2.Second, we reduced advertising spend by -11% sequentially in Q3. As discussed above, a key driver of this reduction has been less advertising in distant markets with less profitable sales. More advertising positively impacts retail unit sales volume, other things being equal, by driving more users to our website.
3.Third, we reduced our website inventory by -10% sequentially in Q3. We are continuing to normalize our inventory size and expect to further reduce inventory in Q4. Larger inventory positively impacts conversion, other things being equal, since with larger inventory customers have a higher likelihood of finding a car that matches their preferences.
4.Fourth, we are testing or have rolled out several initiatives that increase sales profitability but have some offsetting sales impact, including requiring payment at the time a customer places their order instead of at delivery, incentivizing pickups and drop-offs at vending machines, and continuing inventory visibility metering on long-distance inventory.
The drivers described above had an impact on growth in Q3 but lay the groundwork for a more efficient and profitable business moving forward.
Part 2: Profitability
We reduced quarterly SG&A expenses by approximately $90 million in Q3 vs. Q2, excluding the impacts of consolidating a full quarter of ADESA expenses. We also levered SG&A per retail unit sold slightly excluding these impacts, despite lower retail units sold.
Our SG&A expense reductions in Q3 vs. Q2 were broad-based, including in payroll, advertising, logistics, and other SG&A expense. These expense reductions were primarily driven by our cost savings initiatives across all areas of the business, including increasing operational efficiency, standardizing processes across our nationwide network of locations, and focusing advertising on profitable transactions.
| | | | | |
| Dollars in millions, excluding ADESA | |
| Q2 2022 SG&A, GAAP | $ | 694 | |
| Q2 2022 SG&A ex D&A ex SBC | $ | 637 | |
| Sequential changes: | |
| RIF one-time expenses | (10) | |
| RIF recurring savings | (14) | |
| Other payroll savings | (20) | |
| Advertising | (14) | |
| Logistics | (14) | |
| Market occupancy | (1) | |
| Other SG&A | (19) | |
| D&A | (4) | |
| Total | $ | (96) | |
| Q3 2022 SG&A ex D&A ex SBC | $ | 541 | |
These expense reductions were driven by meaningful progress across our operating efficiency initiatives. More details are provided in the table below.
| | | | | | | | |
| Business Area | Key Initiatives | Recent Results |
| Retail cost of sales | •Reduce third-party production volume •Reduce third-party vendor services share •Reduce third-party inbound transport share •Internal benchmarking / performance mgmt
| •Units produced in Sep’22 were ~$200 lower non-vehicle cost than Q1 •Top IRCs with 25% of units produced in Sep’22 were ~$250 better than the average IRC |
| Wholesale cost of sales | •Utilize ADESA locations to reduce inbound transport cost and cycle time
| •Average inbound transport costs down 13% QoQ |
| Customer care | •Automation of manual tasks •Simplified advocate workflows •Enhanced customer communication •Reduction of duplicated or low value tasks •Internal benchmarking / performance mgmt
| •Customer verifications handled per hour +25% QoQ •Customer care calls per sale down 20% QoQ |
| Last-mile delivery | •Staffing and scheduling optimization •In-sourcing third-party pickups •Pairing retail and buying cars activities •Increasing vending machine utilization •Internal benchmarking / performance mgmt
| •VM utilization up +24% QoQ •Share of retail deliveries paired with buying car pickups more than doubled QoQ •Last mile deliveries per advocate hour up +7% QoQ |
| Logistics expense | •Staffing and scheduling optimization •Reduce average outbound miles •Reduce third-party shipping •Improve network load balancing •Improve trip and staging execution
| •Network utilization +8% QoQ •Average shipping miles down 10% QoQ (add’l 10% down since QE) •Logistics hubs with new management structure are ~10% more efficient than avg •Third-party spend per unit down >25% QoQ |
| Advertising | •Optimizing spend by mixing toward higher efficiency channels •Conversion drivers (co-signer offering, faster delivery times, lower rescheduling rates)
| •Decreases in conversion due to higher rates etc. offset by efficiency gains •Actively testing to further optimize •Oldest cohort $600 per retail unit below company average |
| Market occupancy | •Consolidate Carvana and ADESA locations in overlapping markets
| •Mkt occupancy expense down 4% QoQ
|
| Other SG&A | •Standardize limited warranty processes across locations •Consolidate corporate and customer care offices into smaller number of locations •Reduce discretionary spend
| •Limited warranty cost per unit down 24% QoQ
|
Integrating ADESA
We closed our acquisition of the ADESA U.S. physical auction business (“ADESA”) on May 9, 2022, and since then our teams have been closely working together on integrating Carvana operations into ADESA locations. We continued to make progress in Q3 and as of November 3, we have:
1)Embedded market hubs at 38 ADESA locations, up from 18 in August.
2)Begun landing directly at ADESA sites over 70% of the cars we buy from customers that we plan to sell wholesale, up from over 50% in August.
3)Continued to inspect and recondition over 500 units per week at ADESA sites that complement our existing IRC footprint, mostly in coastal locations.
Looking forward, we plan to continue adding Carvana operations to ADESA locations to improve our capabilities and provide better, faster, more cost-efficient customer experiences that require relatively low levels of capital investment.
In addition, we plan to preserve, and over time improve upon, the operations that successfully made ADESA the second largest used vehicle physical auction business in the U.S. by delivering the same great service their customers have come to expect from ADESA while also leveraging Carvana capabilities to further benefit their customers.
We are extremely happy with our integration progress so far which has only been possible because of the enthusiasm from the teams on both sides to work together. This progress and the visibility into more has us more excited than ever about the long-term strategic benefits of the Carvana and ADESA combination.
Expansion
In Q3 2022, we continued completing our in-progress IRC and vending machine construction projects and integrating our newly acquired ADESA U.S. locations.
In Q3, we launched one new Carvana IRC near Richmond, VA and one new vending machine in Phoenix, AZ.
In Q4, we launched a second Carvana IRC near Sacramento, CA, and we expect to complete construction on one additional Carvana IRC near Chicago, IL, which we plan to launch as a logistics and vehicle storage hub in Q4 and as a production location in the future as production needs require.
We expect the completion of the Chicago IRC to bring our total annual capacity at full utilization to ~1.4 million units by the end of 2022, giving us significant capacity for future growth.
In our May 2022 operating plan presentation, we provided a FY 2023 capital expenditure budget in the range of $100 to $200 million. We currently expect to be in the lower half of this range, with our primary focus on leveraging ADESA sites to enhance our logistics network and operating efficiency. We’re already starting to see benefits from the Carvana and ADESA combination and are even more excited about what that means for our business in the long-term.
*As of November 3, 2022
For a complete list of our market opening history, estimated populations, and estimated total industry used vehicle sales by market, along with details on our IRCs, please see: https://investors.carvana.com/investor-resources/investor-materials
Management Objectives
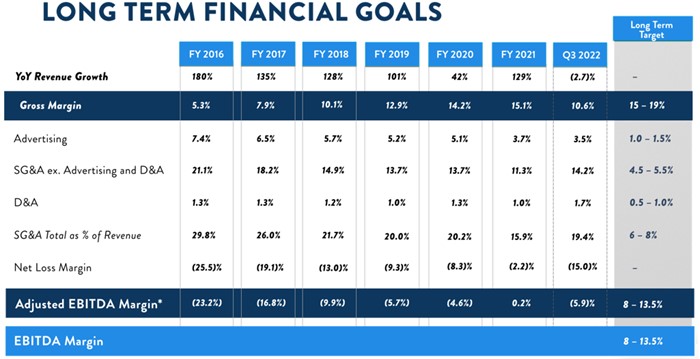
As discussed in our recent operating plan presentation, given the current industry, economy, and market environment, we have shifted our priorities to lowering expenses and driving positive free cash flow. However, this letter maintains our historical format built around the three objectives (1) Grow Retail Units and Revenue; (2) Increase Total Gross Profit Per Unit; and (3) Demonstrate Operating Leverage, to discuss our key results.
*Adjusted EBITDA Margin excludes the impacts of the CEO’s Gift and Other Income & Expense which we expect to be immaterial in the long-term
**Numbers may not foot due to rounding
Objective #1: Grow Retail Units and Revenue
Retail units sold in Q3 were 102,570, a reduction of 8% from 111,949 in Q3 2021. Q3 revenue was $3.386 billion, a reduction of 3% from $3.480 billion in Q3 2021.
As discussed earlier in this letter, retail unit volume in Q3 was impacted by a variety of internal and external factors, including industry-wide used vehicle prices, interest rates, other macroeconomic forces, and our own actions to drive profitability, including passing benchmark interests through to origination rates, reducing advertising, and lowering inventory size. For additional details, please see The Current Environment section of the letter.
Objective #2: Increase Total Gross Profit Per Unit
We sequentially improved total GPU in Q3 2022. This improvement was primarily driven by consolidating a full quarter of ADESA results and was achieved despite the headwinds from industry wide increases in used vehicle depreciation rates and benchmark interest rates.
•Total
◦Total GPU was $3,500 vs. $4,672 in Q3 2021 and $3,368 in Q2 2022
▪Total GPU includes $351 of depreciation and amortization and $19 of Gift share-based compensation expense. Total GPU excluding these expenses was $3,870 vs. $3,649 in Q2 2022, a sequential improvement of $221.2
•Retail
◦Retail GPU was $1,131 vs. $1,769 in Q3 2021 and $1,131 in Q2 20223
◦Year-over-year changes in retail GPU were primarily driven by higher reconditioning and inbound transport costs and higher retail depreciation rates compared to Q3 2021, partially offset by buying more cars from customers.
◦Sequential changes in retail GPU were primarily driven by higher spreads between retail prices and acquisition prices and lower retail costs of sales, offset by higher retail depreciation rates compared to Q2 2022.
•Wholesale
◦Wholesale GPU was $448 vs. $420 in Q3 2021 and $383 in Q2 20224
◦Year-over-year changes in wholesale GPU were driven by a $127 impact from the acquisition of ADESA offset by higher wholesale market depreciation rates and higher inbound transport costs on wholesale units sold compared to Q3 2021.
◦Sequential changes in wholesale GPU were primarily driven by a full quarter of ADESA operations and lower inbound transport costs on wholesale units sold, partially offset by higher wholesale market depreciation rates compared to Q2 2022.
•Other
◦Other GPU was $1,921 vs. $2,483 in Q3 2021 and $1,854 in Q2 2022
◦Year-over-year changes in Other GPU were primarily driven by higher benchmark interest rates at time of loan sale relative to origination interest rates, wider credit spreads, and a change in loan sales channel mix toward forward flow vs. securitization sales, partially offset by the impact of higher industry-wide vehicle prices on average loan size.
◦Sequential changes in Other GPU were primarily driven by higher origination rates relative to benchmark interest rates and improved securitization credit spreads relative to Q2, partially offset by lower ancillary product attachment rates. Looking toward Q4, we expect to maintain flexibility to optimize our channel mix as the quarter progresses.
2 We are providing Total GPU, Retail GPU, and Wholesale GPU with and excluding D&A and Gift share-based compensation expense. Historically, we have reported GPU including D&A expense, which has had the effect of reducing our GPU numbers, while ADESA historically has reported gross profit figures excluding D&A expense. For purposes of clarity, we are providing both.
3 Retail GPU included $117 of depreciation and amortization and $19 of Gift share-based compensation. Retail GPU excluding these expenses was $1,267, approximately flat vs. $1,276 in Q2 2022.
4 Wholesale GPU included $235 of depreciation and amortization. Wholesale GPU excluding this expense was $683 vs. $519 in Q2 2022, a sequential improvement of $164. Beginning in Q2 2022, wholesale gross profit and wholesale GPU includes gross profit from the sale of wholesale marketplace vehicles at our acquired ADESA locations. For additional details on the impact of ADESA on wholesale GPU, please see the Q3 2022 Financial Supplement Tables posted on our investor relations website.
Objective #3: Demonstrate Operating Leverage
On a sequential basis net loss margin increased by 3.7% and Adjusted EBITDA margin levered by 0.3%. On a year-over-year basis net loss margin increased by 13.0% and Adjusted EBITDA margin loss increased by 6.2%, each driven by the industry, economic, and internal factors described throughout this letter.
For Q3 2022, as a percentage of revenue:
•Total SG&A increased by 0.8% sequentially, compensation and benefits increased by 0.1%, advertising increased by 0.1%, logistics and market occupancy levered by 0.1%, and other SG&A increased by 0.7%.
•Total SG&A increased by 3.7% year-over-year, compensation and benefits increased 1.4%, advertising levered by 0.2%, logistics and market occupancy increased by 0.7%, and other SG&A increased by 1.8%.
For additional details on SG&A leverage please see our discussion earlier in this letter.
Summary
In the third quarter, we made some of the most significant operational progress we have ever made as a company. Unfortunately, the increasingly challenging environment presented headwinds that inhibited that progress, allowing only a portion to show in our financial results.
The environment has continued to get increasingly difficult since the end of the quarter and it is probable things will continue to get more difficult before they get easier. As we did this quarter, we will keep our heads down and sprint as quickly as we can to improve operationally against this backdrop.
Difficult periods feel endless when we are in them. They aren’t fun. They aren’t easy. But they do end. And when this one does, our goal is to look back over the progress we made and the way we improved the business with pride.
The march continues.
Sincerely,
Ernie Garcia, III, Chairman and CEO
Mark Jenkins, CFO
Appendix
Conference Call Details
Carvana will host a conference call today, November 3, 2022, at 5:30 p.m. EST (2:30 p.m. PST) to discuss financial results. To participate in the live call, analysts and investors should dial (833) 255-2830 or (412) 902-6715, and ask for “Carvana Earnings.” A live audio webcast of the conference call along with supplemental financial information will also be accessible on the company’s website at investors.carvana.com. Following the webcast, an archived version will also be available on the Investor Relations section of the company’s website. A telephonic replay of the conference call will be available until November 10, 2022, by dialing (877) 344-7529 or (412) 317-0088 and entering passcode 8157634#.
Forward Looking Statements
This letter contains forward-looking statements within the meaning of the Private Securities Litigation Reform Act of 1995. These forward-looking statements reflect Carvana’s current expectations and projections with respect to, among other things, its financial condition, results of operations, plans, objectives, future performance, and business. These statements may be preceded by, followed by or include the words “aim,” “anticipate,” “believe,” “estimate,” “expect,” “forecast,” “intend,” “likely,” “outlook,” “plan,” “potential,” “project,” “projection,” “seek,” “can,” “could,” “may,” “should,” “would,” “will,” the negatives thereof and other words and terms of similar meaning.
Forward-looking statements include all statements that are not historical facts. Such forward-looking statements are subject to various risks and uncertainties. Accordingly, there are or will be important factors that could cause actual outcomes or results to differ materially from those indicated in these statements. Among these factors are risks related to the “Risk Factors” identified in our Annual Report on Form 10-K for 2021 and our Quarterly Report on Form 10-Q for the first quarter of 2022.
There is no assurance that any forward-looking statements will materialize. You are cautioned not to place undue reliance on forward-looking statements, which reflect expectations only as of this date. Carvana does not undertake any obligation to publicly update or review any forward-looking statement, whether as a result of new information, future developments, or otherwise.
Use of Non-GAAP Financial Measures
As appropriate, we supplement our results of operations determined in accordance with U.S. generally accepted accounting principles (“GAAP”) with certain non-GAAP financial measurements that are used by management, and which we believe are useful to investors, as supplemental operational measurements to evaluate our financial performance. These measurements should not be considered in isolation or as a substitute for reported GAAP results because they may include or exclude certain items as compared to similar GAAP-based measurements, and such measurements may not be comparable to similarly-titled measurements reported by other companies. Rather, these measurements should be considered as an additional way of viewing aspects of our operations that provide a more complete understanding of our business. We strongly encourage investors to review our consolidated financial statements included in publicly filed reports in their entirety and not rely solely on any one, single financial measurement or communication.
Reconciliations of our non-GAAP measurements to their most directly comparable GAAP-based financial measurements are included at the end of this letter.
Investor Relations Contact Information: Mike Levin, investors@carvana.com
CARVANA CO. AND SUBSIDIARIES
CONDENSED CONSOLIDATED BALANCE SHEETS
(Unaudited)
(In millions, except number of shares, which are reflected in thousands, and par values) | | | | | | | | | | | |
| September 30, 2022 | | December 31, 2021 |
| ASSETS | | | |
| Current assets: | | | |
| Cash and cash equivalents | $ | 316 | | | $ | 403 | |
| Restricted cash | 161 | | | 233 | |
| Accounts receivable, net | 359 | | | 206 | |
| Finance receivables held for sale, net | 485 | | | 356 | |
| | | |
| | | |
| Vehicle inventory | 2,577 | | | 3,149 | |
| Beneficial interests in securitizations | 350 | | | 382 | |
| Other current assets, including $5 and $12, respectively, due from related parties | 221 | | | 163 | |
| Total current assets | 4,469 | | | 4,892 | |
| Property and equipment, net | 3,326 | | | 1,560 | |
| Operating lease right-of-use assets, including $14 and $17, respectively, from leases with related parties | 689 | | | 369 | |
| Intangible assets, net | 76 | | | 4 | |
| Goodwill | 847 | | | 9 | |
| Other assets, including $1 and $7, respectively, due from related parties | 214 | | | 181 | |
| Total assets | $ | 9,621 | | | $ | 7,015 | |
| LIABILITIES & STOCKHOLDERS' EQUITY | | | |
| Current liabilities: | | | |
| Accounts payable and accrued liabilities, including $19 and $27, respectively, due to related parties | $ | 1,009 | | | $ | 656 | |
| Short-term revolving facilities | 575 | | | 2,053 | |
| Current portion of long-term debt | 213 | | | 152 | |
| Other current liabilities, including $4 and $3, respectively, from leases with related parties | 81 | | | 29 | |
| Total current liabilities | 1,878 | | | 2,890 | |
| Long-term debt, excluding current portion | 6,616 | | | 3,208 | |
| | | |
| Operating lease liabilities, excluding current portion, including $10 and $13, respectively, from leases with related parties | 669 | | | 361 | |
| Other liabilities | 84 | | | 31 | |
| Total liabilities | 9,247 | | | 6,490 | |
| Commitments and contingencies | | | |
| | | |
| Stockholders' equity: | | | |
| | | |
| | | |
| Preferred stock, $0.01 par value - 50,000 shares authorized; none issued and outstanding as of September 30, 2022 and December 31, 2021 | — | | | — | |
| Class A common stock, $0.001 par value - 500,000 shares authorized; 105,932 and 89,930 shares issued and outstanding as of September 30, 2022 and December 31, 2021, respectively | — | | | — | |
| Class B common stock, $0.001 par value - 125,000 shares authorized; 82,900 shares issued and outstanding as of September 30, 2022 and December 31, 2021 | — | | | — | |
| Additional paid-in capital | 1,544 | | | 795 | |
| | | |
| Accumulated deficit | (1,270) | | | (489) | |
| Total stockholders' equity attributable to Carvana Co. | 274 | | | 306 | |
| Non-controlling interests | 100 | | | 219 | |
| Total stockholders' equity | 374 | | | 525 | |
| Total liabilities & stockholders' equity | $ | 9,621 | | | $ | 7,015 | |
CARVANA CO. AND SUBSIDIARIES
CONDENSED CONSOLIDATED STATEMENTS OF OPERATIONS
(Unaudited)
(In millions, except number of shares, which are reflected in thousands, and per share amounts)
| | | | | | | | | | | | | | | | | | | | | | | |
| Three Months Ended September 30, | | Nine Months Ended September 30, |
| 2022 | | 2021 | | 2022 | | 2021 |
| Sales and operating revenues: | | | | | | | |
| Retail vehicle sales, net | $ | 2,492 | | | $ | 2,650 | | | $ | 8,186 | | | $ | 6,954 | |
| Wholesale sales and revenues, including $6, $15, $27 and $37, respectively, from related parties | 697 | | | 552 | | | 1,976 | | | 1,349 | |
| Other sales and revenues, including $39, $52, $137 and $143, respectively, from related parties | 197 | | | 278 | | | 605 | | | 758 | |
| | | | | | | |
| Net sales and operating revenues | 3,386 | | | 3,480 | | | 10,767 | | | 9,061 | |
| Cost of sales, including $2, $17, $20 and $21, respectively, to related parties | 3,027 | | | 2,957 | | | 9,714 | | | 7,648 | |
| Gross profit | 359 | | | 523 | | | 1,053 | | | 1,413 | |
| Selling, general and administrative expenses, including $7, $7, $20 and $19, respectively, to related parties | 656 | | | 546 | | | 2,104 | | | 1,413 | |
| | | | | | | |
| Interest expense | 153 | | | 48 | | | 333 | | | 121 | |
| Other (income) expense, net | 58 | | | (3) | | | 68 | | | (16) | |
| Net loss before income taxes | (508) | | | (68) | | | (1,452) | | | (105) | |
| Income tax provision | — | | | — | | | 1 | | | — | |
| Net loss | (508) | | | (68) | | | (1,453) | | | (105) | |
| Net loss attributable to non-controlling interests | (225) | | | (36) | | | (672) | | | (59) | |
| Net loss attributable to Carvana Co. | $ | (283) | | | $ | (32) | | | $ | (781) | | | $ | (46) | |
| | | | | | | |
| | | | | | | |
| | | | | | | |
| | | | | | | |
| Net loss per share of Class A common stock, basic and diluted | $ | (2.67) | | | $ | (0.38) | | | $ | (7.88) | | | $ | (0.56) | |
| | | | | | | |
| | | | | | | |
Weighted-average shares of Class A common stock, basic and diluted (1) | 105,857 | | | 84,779 | | | 99,134 | | | 81,427 | |
| | | | | | | |
(1) Weighted-average shares of Class A common stock outstanding have been adjusted for unvested restricted stock awards.
CARVANA CO. AND SUBSIDIARIES
CONDENSED CONSOLIDATED STATEMENTS OF CASH FLOWS
(Unaudited)
(In millions) | | | | | | | | | | | |
| Nine Months Ended September 30, |
| 2022 | | 2021 |
| Cash Flows from Operating Activities: | | | |
| Net loss | $ | (1,453) | | | $ | (105) | |
| Adjustments to reconcile net loss to net cash used in operating activities: | | | |
| Depreciation and amortization expense | 179 | | | 72 | |
| Equity-based compensation expense | 57 | | | 28 | |
| Loss on disposal of property and equipment | 3 | | | 1 | |
| Provision for bad debt and valuation allowance | 11 | | | 16 | |
| Amortization and write-off of debt issuance costs | 20 | | | 8 | |
| Unrealized loss on warrants to acquire Root's Class A common stock | 77 | | | — | |
| Unrealized loss (gain) on beneficial interests in securitization | 1 | | | (6) | |
| | | |
| Changes in finance receivable related assets: | | | |
| Originations of finance receivables | (5,690) | | | (5,315) | |
| Proceeds from sale of finance receivables, net | 5,628 | | | 5,375 | |
| | | |
| Gain on loan sales | (361) | | | (528) | |
| Principal payments received on finance receivables held for sale | 146 | | | 136 | |
| Other changes in assets and liabilities: | | | |
| Vehicle inventory | 638 | | | (1,230) | |
| Accounts receivable | 40 | | | (111) | |
| | | |
| Other assets | (75) | | | (86) | |
| Accounts payable and accrued liabilities | 155 | | | 319 | |
| Operating lease right-of-use assets | (132) | | | (117) | |
| | | |
| | | |
| Operating lease liabilities | 178 | | | 121 | |
| Other liabilities | (7) | | | — | |
| Net cash used in operating activities | (585) | | | (1,422) | |
| Cash Flows from Investing Activities: | | | |
| | | |
| Purchases of property and equipment | (451) | | | (390) | |
| | | |
| Payments for acquisitions, net of cash acquired | (2,189) | | | — | |
| Principal payments received on and proceeds from sale of beneficial interests | 72 | | | 38 | |
| | | |
| Net cash used in investing activities | (2,568) | | | (352) | |
| Cash Flows from Financing Activities: | | | |
| Proceeds from short-term revolving facilities | 10,596 | | | 8,733 | |
| Payments on short-term revolving facilities | (12,074) | | | (8,318) | |
| Proceeds from issuance of long-term debt | 3,435 | | | 1,525 | |
| Payments on long-term debt | (111) | | | (46) | |
| Payments of debt issuance costs | (75) | | | (21) | |
| Net proceeds from issuance of Class A common stock | 1,227 | | | — | |
| Proceeds from equity-based compensation plans | 4 | | | 1 | |
| Tax withholdings related to restricted stock units and awards | (8) | | | (25) | |
| | | |
| | | |
| | | |
| Net cash provided by financing activities | 2,994 | | | 1,849 | |
| Net (decrease) increase in cash, cash equivalents and restricted cash | (159) | | | 75 | |
| Cash, cash equivalents and restricted cash at beginning of period | 636 | | | 329 | |
| Cash, cash equivalents and restricted cash at end of period | $ | 477 | | | $ | 404 | |
CARVANA CO. AND SUBSIDIARIES
OUTSTANDING SHARES AND LLC UNITS
(Unaudited)
LLC Units (adjusted for the exchange ratio and participation thresholds) are considered potentially dilutive shares of Class A common stock because they are exchangeable into shares of Class A common stock, if the Company elects not to settle exchanges in cash. Weighted-average shares of Class A common stock and as-exchanged LLC Units, which were evaluated for potentially dilutive effects and were determined to be anti-dilutive, are as follows:
| | | | | | | | | | | | | | | | | | | | | | | |
| Three Months Ended September 30, | | Nine Months Ended September 30, |
| 2022 | | 2021 | | 2022 | | 2021 |
| | | | | | | |
| (in thousands) |
| Weighted-average shares of Class A common stock outstanding | 105,857 | | | 84,779 | | | 99,134 | | | 81,427 | |
| Weighted-average as-exchanged LLC Units for shares of Class A common stock | 84,543 | | | 90,062 | | | 84,764 | | | 93,331 | |
| 190,400 | | | 174,841 | | | 183,898 | | | 174,758 | |
| | | | | | | |
| | | | | | | |
CARVANA CO. AND SUBSIDIARIES
RECONCILIATION OF GAAP TO NON-GAAP FINANCIAL MEASURES (continued)
(Unaudited)
Adjusted EBITDA, Adjusted EBITDA, excluding non-Gift share-based compensation, Adjusted EBITDA Margin, and Adjusted EBITDA Margin, excluding non-Gift share-based compensation
Adjusted EBITDA, Adjusted EBITDA, excluding non-Gift share-based compensation, Adjusted EBITDA Margin, and Adjusted EBITDA Margin, excluding non-Gift share-based compensation are supplemental measures of operating performance that do not represent and should not be considered an alternative to net (loss) income or cash flow from operations, as determined by U.S. GAAP. Adjusted EBITDA is defined as net (loss) income plus income tax expense, interest expense, other (income) expense, net, depreciation and amortization, and share-based compensation related to the CEO Milestone Gift, Following our acquisition of ADESA, we are also excluding depreciation and amortization expense which is expensed as part of cost of sales which has historically been only a small component of cost of sales. Adjusted EBITDA, excluding non-Gift share-based compensation is defined as Adjusted EBITDA plus share-based compensation unrelated to the CEO Milestone Gift. Adjusted EBITDA Margin is Adjusted EBITDA as a percentage of total revenues. Adjusted EBITDA Margin, excluding non-Gift share-based compensation is Adjusted EBITDA, excluding non-Gift share-based compensation as a percentage of total revenues. We use Adjusted EBITDA and Adjusted EBITDA, excluding non-Gift share-based compensation to measure the operating performance of our business and Adjusted EBITDA Margin and Adjusted EBITDA Margin, excluding non-Gift share-based compensation to measure our operating performance relative to our total revenues. We believe these metrics are useful measures to us and to our investors because they exclude certain financial and capital structure items that we do not believe directly reflect our core operations and may not be indicative of our recurring operations, in part because they may vary widely across time and within our industry independent of the performance of our core operations. We believe that excluding these items enables us to more effectively evaluate our performance period-over-period and relative to our competitors. Adjusted EBITDA, Adjusted EBITDA, excluding non-Gift share-based compensation, Adjusted EBITDA Margin, and Adjusted EBITDA Margin, excluding non-Gift share-based compensation may not be comparable to similarly titled measures provided by other companies due to potential differences in methods of calculations.
A reconciliation of Adjusted EBITDA and Adjusted EBITDA, excluding non-Gift share-based compensation to net loss, which is the most directly comparable U.S. GAAP measure, and calculation of Adjusted EBITDA Margin and Adjusted EBITDA Margin, excluding non-Gift share-based compensation is as follows:
| | | | | | | | | | | | | | | | | | | | | | | | | | | | | | | | | | |
| | | | | | Three Months Ended |
| (dollars in millions) | | | | | | Sep 30, 2021 | | Dec 31, 2021 | | Mar 31, 2022 | | Jun 30, 2022 | | Sep 30, 2022 |
| Net loss | | | | | | $ | (68) | | | $ | (182) | | | $ | (506) | | | $ | (439) | | | $ | (508) | |
| Income tax provision | | | | | | — | | | 1 | | | — | | | 1 | | | — | |
| Interest expense | | | | | | 48 | | | 55 | | | 64 | | | 116 | | | 153 | |
| Other (income) expense, net | | | | | | (3) | | | 22 | | | 13 | | | (3) | | | 58 | |
| Depreciation and amortization expense in cost of sales | | | | | | 6 | | | 7 | | | 8 | | | 27 | | | 36 | |
| Depreciation and amortization expense in SG&A | | | | | | 26 | | | 33 | | | 37 | | | 49 | | | 57 | |
| CEO Milestone Gift in cost of sales | | | | | | — | | | — | | | 8 | | | 6 | | | 2 | |
| CEO Milestone Gift in SG&A | | | | | | — | | | — | | | 20 | | | 4 | | | 2 | |
Adjusted EBITDA (1) | | | | | | $ | 9 | | | $ | (64) | | | $ | (356) | | | $ | (239) | | | $ | (200) | |
| Share-based compensation, excluding Gift | | | | | | 11 | | | 11 | | | 10 | | | 9 | | | 14 | |
Adjusted EBITDA, excluding non-Gift share-based compensation (1) | | | | | | $ | 20 | | | $ | (53) | | | $ | (346) | | | $ | (230) | | | $ | (186) | |
| | | | | | | | | | | | | | |
| Total revenues | | | | | | $ | 3,480 | | | $ | 3,753 | | | $ | 3,497 | | | $ | 3,884 | | | $ | 3,386 | |
| Net loss margin | | | | | | (2.0) | % | | (4.8) | % | | (14.5) | % | | (11.3) | % | | (15.0) | % |
Adjusted EBITDA Margin (2) | | | | | | 0.3 | % | | (1.7) | % | | (10.2) | % | | (6.2) | % | | (5.9) | % |
Adjusted EBITDA Margin, excluding non-Gift share-based compensation (2) | | | | | | 0.6 | % | | (1.4) | % | | (9.9) | % | | (5.9) | % | | (5.5) | % |
(1) For the three months ended June 30, 2022, includes $14 of expenses associated with the previously announced workforce reduction.
(2) For the three months ended June 30, 2022, includes 0.4% of expenses associated with the previously announced workforce reduction.
| | | | | | | | | | | | | | | | | | | | | | | | | | | | | | | | | | | | | | | | | | | | |
| | | | Years Ended December 31, |
| (dollars in millions) | | | | 2015 | | 2016 | | 2017 | | 2018 | | 2019 | | 2020 | | 2021 |
| Net loss | | | | $(37) | | $(93) | | $(164) | | $(255) | | $(365) | | $(462) | | $(287) |
| Income tax provision | | | | — | | — | | — | | — | | — | | — | | 1 |
| Interest expense | | | | 1 | | 3 | | 7 | | 25 | | 81 | | 131 | | 176 |
| Other (income) expense, net | | | | — | | — | | 1 | | 1 | | 4 | | (1) | | 6 |
| Depreciation and amortization expense in cost of sales | | | | — | | — | | — | | — | | — | | — | | 24 |
| Depreciation and amortization expense in SG&A | | | | 3 | | 5 | | 12 | | 24 | | 41 | | 74 | | 105 |
| CEO Milestone Gift in cost of sales | | | | — | | — | | — | | 4 | | 5 | | 1 | | — |
| CEO Milestone Gift in SG&A | | | | — | | — | | — | | 8 | | 8 | | — | | — |
| Adjusted EBITDA | | | | $(33) | | $(85) | | $(144) | | $(193) | | $(226) | | $(257) | | $25 |
| Share-based compensation, excluding Gift | | | | — | | — | | 6 | | 14 | | 23 | | 25 | | 39 |
| Adjusted EBITDA, excluding non-Gift share-based compensation | | | | $(33) | | $(85) | | $(138) | | $(179) | | $(203) | | $(232) | | $64 |
| | | | | | | | | | | | | | | | |
| Total revenues | | | | $130 | | $365 | | $859 | | $1,955 | | $3,940 | | $5,587 | | $12,814 |
| Net loss margin | | | | (28.5)% | | (25.5)% | | (19.1)% | | (13.0)% | | (9.3)% | | (8.3)% | | (2.2)% |
| Adjusted EBITDA Margin | | | | (25.0)% | | (23.2)% | | (16.8)% | | (9.9)% | | (5.7)% | | (4.6)% | | 0.2% |
| Adjusted EBITDA Margin, excluding non-Gift share-based compensation | | | | (25.0)% | | (23.2)% | | (16.1)% | | (9.2)% | | (5.2)% | | (4.2)% | | 0.5% |
| | | | | | | | | | | | | | | | | | | | | | | | | | | | | | | | | | | | | | | | | | | | | | | | | | | | | | | | |
| | | | Three Months Ended, |
| (dollars in millions) | | | | Q3 14 | | Q3 15 | | Q3 16 | | Q3 17 | | Q3 18 | | Q3 19 | | Q3 20 | | Q3 21 | | Q3 22 |
| Net loss | | | | $(4) | | $(8) | | $(23) | | $(41) | | $(64) | | $(93) | | $(18) | | $ | (68) | | | $ | (508) | |
| Income tax provision | | | | — | | — | | — | | — | | — | | — | | — | | — | | | — | |
| Interest expense | | | | — | | — | | 1 | | 1 | | 6 | | 21 | | 20 | | 48 | | | 153 | |
| Other (income) expense, net | | | | — | | — | | — | | 1 | | — | | 1 | | (9) | | (3) | | | 58 | |
| Depreciation and amortization expense in cost of sales | | | | — | | — | | — | | — | | — | | — | | — | | 6 | | | 36 | |
| Depreciation and amortization expense in SG&A | | | | — | | 1 | | 1 | | 3 | | 6 | | 11 | | 19 | | 26 | | | 57 | |
| CEO Milestone Gift in cost of sales | | | | — | | — | | — | | — | | 1 | | 1 | | — | | — | | | 2 | |
| CEO Milestone Gift in SG&A | | | | — | | — | | — | | — | | 7 | | 3 | | — | | — | | | 2 | |
| Adjusted EBITDA | | | | $(4) | | $(7) | | $(21) | | $(36) | | $(44) | | $(56) | | $12 | | $9 | | $(200) |
| Share-based compensation, excluding Gift | | | | — | | — | | — | | 2 | | 3 | | 6 | | 6 | | 11 | | | 14 | |
| Adjusted EBITDA, excluding non-Gift share-based compensation | | | | $(4) | | $(7) | | $(21) | | $(34) | | $(41) | | $(50) | | $18 | | $20 | | $(186) |
| | | | | | | | | | | | | | | | | | | | |
| Total revenues | | | | $12 | | $36 | | $99 | | $225 | | $535 | | $1,095 | | $1,544 | | $3,480 | | $3,386 |
| Net loss margin | | | | (36.1)% | | (26.0)% | | (22.2)% | | (17.6)% | | (12.0)% | | (8.4)% | | (1.2)% | | (2.0)% | | (15.0)% |
| Adjusted EBITDA Margin | | | | (32.7)% | | (23.1)% | | (20.3)% | | (15.6)% | | (8.3)% | | (5.1)% | | 0.8% | | 0.3% | | (5.9)% |
| Adjusted EBITDA Margin, excluding non-Gift share-based compensation | | | | (32.7)% | | (23.1)% | | (20.3)% | | (15.1)% | | (7.7)% | | (4.6)% | | 1.2% | | 0.6% | | (5.5)% |
CARVANA CO. AND SUBSIDIARIES
RESULTS OF OPERATIONS
(Unaudited)
| | | | | | | | | | | | | | | | | | | | | | | | | | | | | | | | | | | |
| Three Months Ended September 30, | | | | Nine Months Ended September 30, | | |
| 2022 | | 2021 | | Change | | 2022 | | 2021 | | Change |
| | | | | | | | | | | |
| (in millions, except unit and per unit amounts) | | | | (in millions, except unit and per unit amounts) | | |
| Net sales and operating revenues: | | | | | | | | | | |
| Retail vehicle sales, net | $ | 2,492 | | | $ | 2,650 | | | (6.0) | % | | $ | 8,186 | | | $ | 6,954 | | | 17.7 | % |
Wholesale sales and revenues (1) | 697 | | | 552 | | | 26.3 | % | | 1,976 | | | 1,349 | | | 46.5 | % |
Other sales and revenues (2) | 197 | | | 278 | | | (29.1) | % | | 605 | | | 758 | | | (20.2) | % |
| Total net sales and operating revenues | $ | 3,386 | | | $ | 3,480 | | | (2.7) | % | | $ | 10,767 | | | $ | 9,061 | | | 18.8 | % |
| Gross profit: | | | | | | | | | | | |
Retail vehicle gross profit (3) | $ | 116 | | | $ | 198 | | | (41.4) | % | | $ | 334 | | | $ | 528 | | | (36.7) | % |
Wholesale gross profit (1) | 46 | | | 47 | | | (2.1) | % | | 114 | | | 127 | | | (10.2) | % |
Other gross profit (2) | 197 | | | 278 | | | (29.1) | % | | 605 | | | 758 | | | (20.2) | % |
| Total gross profit | $ | 359 | | | $ | 523 | | | (31.4) | % | | $ | 1,053 | | | $ | 1,413 | | | (25.5) | % |
| | | | | | | | | | | |
| | | | | | | | | | | |
| | | | | | | | | | | |
| | | | | | | | | | | |
| | | | | | | | | | | |
| | | | | | | | | | | |
| | | | | | | | | | | |
| | | | | | | | | | | |
| | | | | | | | | | | |
| Unit sales information: | | | | | | | | | | | |
| Retail vehicle unit sales | 102,570 | | | 111,949 | | | (8.4) | % | | 325,319 | | | 312,221 | | | 4.2 | % |
| Wholesale vehicle unit sales | 47,763 | | | 50,204 | | | (4.9) | % | | 153,342 | | | 123,296 | | | 24.4 | % |
| | | | | | | | | | | |
| Per unit selling prices: | | | | | | | | | | | |
| Retail vehicles | 24,296 | | | 23,671 | | | 2.6 | % | | 25,163 | | | 22,273 | | | 13.0 | % |
| Wholesale vehicles | 14,593 | | | 10,995 | | | 32.7 | % | | 12,886 | | | 10,941 | | | 17.8 | % |
| | | | | | | | | | | |
| Per retail unit gross profit: | | | | | | | | | | | |
Retail vehicle gross profit (4) | $ | 1,131 | | | $ | 1,769 | | | (36.1) | % | | $ | 1,027 | | | $ | 1,691 | | | (39.3) | % |
| Wholesale gross profit | 448 | | | 420 | | | 6.7 | % | | 350 | | | 407 | | | (14.0) | % |
| | | | | | | | | | | |
| Other gross profit | 1,921 | | | 2,483 | | | (22.6) | % | | 1,860 | | | 2,428 | | | (23.4) | % |
| Total gross profit | $ | 3,500 | | | $ | 4,672 | | | (25.1) | % | | $ | 3,237 | | | $ | 4,526 | | | (28.5) | % |
| Per wholesale unit gross profit: | | | | | | | | | | | |
Wholesale vehicle gross profit (5) | $ | 691 | | | $ | 936 | | | (26.2) | % | | $ | 626 | | | $ | 1,030 | | | (39.2) | % |
| | | | | | | | | | | |
| Wholesale marketplace: | | | | | | | | | | | |
| Wholesale marketplace units sold | 193,061 | | | $ | — | | | NM | | 304,944 | | | $ | — | | | NM |
Wholesale marketplace revenues (6) | $ | 193 | | | $ | — | | | NM | | $ | 301 | | | $ | — | | | NM |
Wholesale marketplace gross profit (6) (7) | $ | 13 | | | $ | — | | | NM | | $ | 18 | | | $ | — | | | NM |
| | | | | | | | | | | |
| | | | | | | | | | | |
| | | | | | | | | | | |
| | | | | | | | | | | |
| | | | | | | | | | | |
_________________________
(1) Includes $6, $15, $27 and $37, respectively, of wholesale revenue from related parties.
(2) Includes $39, $52, $137 and $143, respectively, of other sales and revenues from related parties.
(3) For the three and nine months ended September 30, 2022, used vehicle gross profit includes $2 and $16, respectively, of share-based compensation expense related to the CEO Milestone Gift.
(4) For the three and nine months ended September 30, 2022, used vehicle per unit gross profit includes $19 and $49, respectively, of share-based compensation expense related to the CEO Milestone Gift.
(5) Wholesale marketplace revenues and wholesale marketplace gross profit are included in wholesale sales and revenues and wholesale gross profit, respectively.
(6) For the three and nine months ended September 30, 2022, wholesale marketplace gross profit includes $22 and $37, respectively, of depreciation and amortization expense.
NM = Not meaningful
CARVANA CO. AND SUBSIDIARIES
COMPONENTS OF SG&A
(Unaudited)
| | | | | | | | | | | | | | | | | | | | | | | | | | | | | | | | | | |
| | | | Three Months Ended | | |
| | | | Sep 30, 2021 | | Dec 31, 2021 | | Mar 31, 2022 | | Jun 30, 2022 | | Sep 30, 2022 | | |
| | | | | | | | | | | | | | |
| | | | (in millions) | | |
Compensation and benefits (1) | | | | $ | 181 | | | $ | 212 | | | $ | 236 | | | $ | 248 | | | $ | 221 | | | |
CEO Milestone Gift (2) | | | | — | | | — | | | 20 | | | 4 | | | 2 | | | |
| Advertising | | | | 126 | | | 134 | | | 155 | | | 131 | | | 117 | | | |
Market occupancy (3) | | | | 18 | | | 24 | | | 23 | | | 24 | | | 23 | | | |
Logistics (4) | | | | 40 | | | 44 | | | 56 | | | 71 | | | 57 | | | |
Other (5) | | | | 181 | | | 206 | | | 237 | | | 243 | | | 236 | | | |
| Total | | | | $ | 546 | | | $ | 620 | | | $ | 727 | | | $ | 721 | | | $ | 656 | | | |
| Depreciation and amortization | | | | 26 | | | 33 | | | 37 | | | 49 | | | 57 | | | |
| Share-based compensation, excluding Gift | | | | $ | 11 | | | $ | 11 | | | $ | 10 | | | 9 | | 14 | | |
| Total, excluding depreciation and amortization and share-based compensation | | | | $ | 509 | | | $ | 576 | | | $ | 660 | | | $ | 659 | | | $ | 583 | | | |
_________________________
(1) Compensation and benefits includes all payroll and related costs, including benefits, payroll taxes, and equity-based compensation, except those related to preparing vehicles for sale, which are included in cost of sales, and those related to the development of software products for internal use, which are capitalized to software and depreciated over the estimated useful lives of the related assets.
(2) CEO Milestone Gift includes all equity-based compensation and payroll tax costs associated with the CEO's gift of personal stock to employees upon the company's one millionth vehicle sold, except those costs related to preparing vehicles for sale, which are included in cost of sales.
(3) Market occupancy costs includes occupancy costs of our vending machine and hubs. It excludes occupancy costs related to reconditioning vehicles which are included in cost of sales and the portion related to corporate occupancy which are included in other costs.
(4) Logistics includes fuel, maintenance and depreciation related to operating our own transportation fleet, and third-party transportation fees, except the portion related to inbound transportation, which is included in cost of sales.
(5) Other costs include all other selling, general and administrative expenses such as IT expenses, corporate occupancy, professional services and insurance, limited warranty, and title and registration.
CARVANA CO. AND SUBSIDIARIES
LIQUIDITY RESOURCES
(Unaudited)
We had the following liquidity resources available as of September 30, 2022 and December 31, 2021:
| | | | | | | | | | | |
| September 30,
2022 | | December 31,
2021 |
| | | |
| (in millions) |
| Cash and cash equivalents | $ | 316 | | | $ | 403 | |
Availability under short-term revolving facilities (1) | 1,956 | | | 438 | |
| | | |
| Committed liquidity resources available | $ | 2,272 | | | $ | 841 | |
Unpledged vehicle inventory not included above(2) | 52 | | | 665 | |
Unpledged real estate not included above(3) | 1,995 | | | 677 | |
Unpledged beneficial interests in securitizations(4) | 67 | | | 100 | |
Total liquidity resources(5) | $ | 4,386 | | | $ | 2,283 | |
_________________________
1.Availability under short-term revolving facilities is the available amount we can borrow under our existing vehicle inventory floor plan and finance receivable facilities based on the pledgable value of vehicle inventory and finance receivables on our balance sheet on the period end date, excluding the impact to restricted cash requirements. This is distinct from the total commitment amount of these facilities because it represents the currently borrowable amount, rather than committed future amounts that could be borrowed to finance future additional assets.
2.Unpledged vehicle inventory is the value of vehicle inventory on our balance sheet on the period end date beyond that covered by committed financing agreements.
3.Unpledged real estate assets include IRC, ADESA locations and vending machine real estate assets that have not been previously pledged or sold. Since our first sale-leaseback transaction in 2017, we have historically had flexible access to real estate financing and expect to continue to use various forms of real estate financing in the future.
4.Unpledged beneficial interests in securitizations includes retained beneficial interests in securitizations that have not been previously pledged or sold. We historically have financed the majority of our retained beneficial interests in securitizations and expect to continue to do so in the future.
5.Total liquidity resources is composed of cash and equivalents, availability under existing credit facilities, and additional unpledged assets, including vehicle inventory, finance receivables, real estate, and securities on our balance sheet that can be financed using traditional asset-based financing sources. To optimize our cost of capital, in any given period we may choose not to maximize borrowings on our short-term revolving facilities, maximize revolving commitment size, or immediately sale-leaseback or pledge real estate and retained beneficial interests in securitizations. This has the benefit of reducing interest expense and debt issuance costs and providing flexibility to minimize financing costs over time.