Exhibit 99.1
Dear Shareholders,
The first quarter illuminated the path we are on to execute our three step plan to increase profitability and to return to growth. Our progress is highlighted by the fact that we achieved company-best first quarter GPU and Adjusted EBITDA margins. In addition, we completed our Q2 SG&A reduction goal one quarter early despite a difficult macroeconomic and industry environment as well as a tremendous amount of change that has been occurring in our business to adjust to the environment.
We are extremely proud of the direction and speed of this progress and we are extremely grateful to the incredible people inside Carvana that are working so hard to make it possible, but we still have a long way to go to achieve our goals and as a result we remain laser focused on the steps that remain in front of us.
As discussed previously, there are three steps in this plan:
1.Drive the business to positive Adjusted EBITDA.
2.Drive the business to significant positive unit economics.
3.After completing steps 1 and 2, return to growth.
We are well on our way to achieving step one and are using the same processes and focus inside the company that drove our rapid progress over the last six months to hit that goal and to rapidly move beyond it.
The last twelve months have made it harder to see, but we remain firmly on the path to changing the way people buy and sell cars and to becoming the largest and most profitable automotive retailer.
Summary of Q1 2023 Results
Q1 2023 Financial Results: All financial comparisons stated below are versus Q1 2022, unless otherwise noted. Complete financial tables appear at the end of this letter.
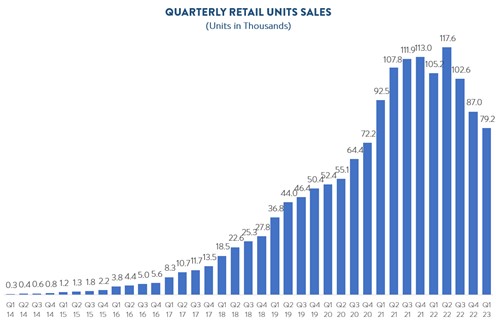
•Retail units sold totaled 79,240, a decrease of 25%
•Revenue totaled $2.606 billion, a decrease of 25%
•Total gross profit was $341 million, an increase of 14%
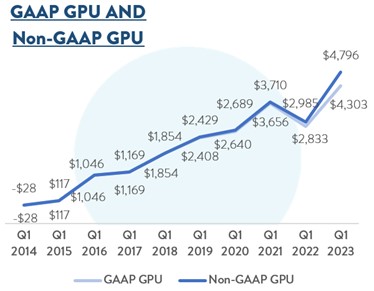
•Total gross profit per unit (“GPU”) was $4,303, an increase of $1,470
•Non-GAAP Total GPU was $4,796, an increase of $1,811
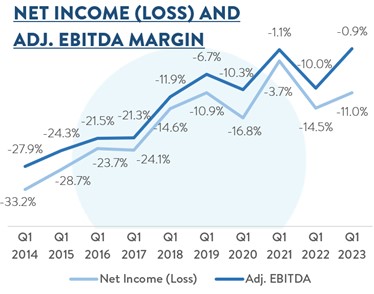
•Net loss margin was (11.0%), a sequential improvement from (50.8%)
•Adjusted EBITDA margin1 was (0.9%) a sequential improvement from (10.3%)
•Basic and diluted net loss, per Class A share was $1.51 based on 106 million shares of Class A common stock outstanding
Other Results and Recent Events:
•We recently launched three new vending machines in New York, Texas, and Illinois.
•Since the beginning of Q2 2023, we have sold or securitized approximately $1.3 billion of loan principal.
Path to Profitability
As stated in our last shareholder letter, our top management objective is to drive our business to positive free cash flow. This objective can be broken down into three steps:
1.Drive the business to positive Adjusted EBITDA.
2.Drive the business to significant positive unit economics.
3.After completing steps 1 and 2, return to growth.
Over the last twelve months, we have been focused on the first step of this three step plan. With our results in Q1 we are well on our way, and we expect to achieve positive Adjusted EBITDA in Q2 2023.
1 Consistent with our Q4 2022 reporting, Adjusted EBITDA is defined as net loss plus income tax expense, interest expense, other (income) expense, net, depreciation and amortization in cost of sales and SG&A, goodwill impairment, share-based compensation including the CEO Milestone Gift in cost of sales and SG&A, and restructuring costs, minus revenue related to our Root warrants. For additional information on Adjusted EBITDA and other Non-GAAP financial metrics referenced in this letter, please see our Q1 2023 Form 10-Q, and our Q1 2023 supplemental financial tables.
First Quarter Results
We made several moves to position the business for lower targeted retail unit volumes in the first half of 2023. In Q1, these actions drove significant sequential improvements to Total GPU and SG&A expenses, which together lay the foundation for step one of our three step plan: driving the business to positive Adjusted EBITDA.
•First, as planned, we continued reducing inventory, leading our retail inventory relative to sales to reach a level within our normalized range by the end of Q1.
•Second, we continued reducing our advertising expenses, leading to the lowest advertising expense per retail unit sold in company history.
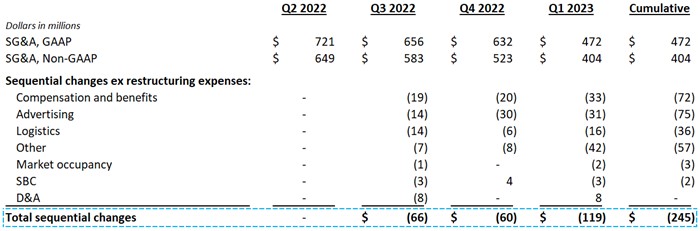
•Third, we hit our target of >$100 million of quarterly Non-GAAP SG&A expense savings (compared to Q4 2022) a quarter early, leading to a cumulative reduction of nearly $1 billion on an annualized basis since Q2 2022 on a GAAP and Non-GAAP basis.
•Fourth, we have continued to prioritize other profitability initiatives that will increase operating efficiency.
These actions, along with various macroeconomic and industry factors, simultaneously impacted retail units sold, GPU, SG&A expense, and Adjusted EBITDA in Q1. We discuss these effects in more detail below.
Part 1: Retail Units
Retail units sold totaled 79,240 in Q1, a sequential reduction of 9% and a year-over-year reduction of 25%.
Changes in Sequential Volume
Our sequential retail unit reduction of 9% was lower than the industry-wide 14% sequential growth in used vehicle sales based on industry data sources. As mentioned in our last shareholder letter, we entered Q1 2023 expecting lower retail unit volumes due to four key factors:
1.Inventory. We continued our strong pace of inventory reductions from Q4 with a 21% sequential decrease in Q1 and 55% less inventory on a YoY basis. Faster turn times improve Retail GPU by reducing exposure to depreciation; however, smaller inventory reduces customer selection, conversion rates, and sales.
2.Advertising. We continued the strong pace of advertising spend reductions with a sequential decrease of 36% and a 64% reduction on a YoY basis. These reductions impact retail units sold, but have driven us to our lowest customer acquisition cost per unit in Carvana’s history.
3.Interest Rates. Interest rates on originations were higher on average in Q1 2023 than Q4 2022 due to the combination of higher benchmark rates and wider credit spreads. The combined impact of these two factors was more pronounced on a year-over-year basis, resulting in a headwind to sales volumes in Q1.
4.Profitability Initiatives. During the last four quarters we made an intentional effort to focus on more profitable sales, highlighted by our annualized $1 billion SG&A expense reduction and our improvements in GPU. Several of our initiatives to support this goal, including payment at the time a customer places their order instead of at delivery, incentivizing pickups and drop-offs at vending machines and other locations, and continuing inventory visibility metering on long-distance inventory, have been aimed at deep funnel conversion and reducing operational costs, and all else constant, this has provided an additional headwind to growth sequentially and over the last four quarters.
Looking forward, we expect inventory size and advertising spend to begin to stabilize in Q2. In addition, while we expect to continue executing our profitability initiatives for at least several more quarters, we believe the pace of these new initiatives will eventually slow, reducing internally driven impacts to sales volume.
Part 2: Total GPU
Several notable items impacted Total GPU in Q1 2023. We believe the items outlined below are transitory or one-time in nature but warrant additional attention. Despite these factors, we expect to further improve Total GPU in Q2 2023.
1.Retail Inventory Allowance Adjustment. Retail GPU in Q1 benefitted from a $47 million retail inventory allowance adjustment as we successfully sold through the majority of our more aged retail inventory that we reserved against in Q4 2022. This benefitted Q1 Retail GPU by $593 per retail unit.
2.Impact of Aged Inventory. Retail GPU in Q1 was also impacted by our ongoing efforts to right-size our inventory relative to sales volumes. One way to highlight this impact is to isolate Retail GPU on vehicles sold within 90 days of acquisition. In Q1, retail vehicles sold within 90 days of acquisition date realized over $2,000 Retail GPU.
3.Wholesale Inventory Allowance Adjustment. Wholesale GPU in Q1 benefitted from a $4 million wholesale inventory allowance adjustment as we successfully sold through the majority of our more aged wholesale inventory that we reserved against in Q4 2022. This benefitted Q1 Wholesale GPU by $50 per retail unit.
4.Wholesale Market Appreciation. Wholesale GPU in Q1 also benefited from an appreciating environment. We estimate that abnormal appreciation in Q1 benefitted Wholesale GPU by $150.
Over the last quarter we made significant progress towards right-sizing inventory relative to expected sales volumes. Since December 2022, we have reduced inventory by 21%, and year-over-year inventory has declined by more than 55%.
At the end of Q1 we held approximately 57,000 units in retail inventory and sold 79,240 retail units, which implies a turn time of approximately 65 days, consistent with many historical periods. In contrast, average days to sale for vehicles sold in Q1 exceeded 120 days, largely a result of selling through our more aged vehicles. As our inventory size stabilizes, we expect average days to sale to decline toward implied turn time, leading to a mechanical benefit to GPU over the coming quarters.
Part 3: SG&A Expense
We made significant progress reducing SG&A expenses for the third consecutive quarter in Q1, reducing quarterly GAAP SG&A expense by $160 million (including $40 million of restructuring expenses recognized in Q4) and Non-GAAP SG&A expense by $119 million, following a $24 million and $60 million reduction in Q4 on a GAAP and Non-GAAP basis, respectively, completing our $1 billion annualized Non-GAAP SG&A expense reduction one quarter early.
Our improvements came across all SG&A line items. In advertising, through our testing we have reduced spend to a much lower level, resulting in the lowest advertising expense per unit in company history. Over the past twelve months, we have been actively testing our marketing channels to identify the most efficient and inefficient channels in this environment, allowing us to generate savings while minimizing impact on retail units sold. In logistics and last mile delivery, we have significantly reduced average miles traveled and increased our pickup rate in markets with a vending machine or other pickup location. Compensation and benefits also benefited from these and other efficiency initiatives as well as a reduction in corporate headcount. In other SG&A, we have lowered limited warranty expenses per unit, reduced our corporate and customer service facilities footprint, and trimmed inefficient spend through all areas of our corporate and technology infrastructure.
Though our SG&A expense reduction plan is ahead of the schedule we laid out in our last shareholder letter, we believe the cost reductions we've achieved over the past year are long lasting and sustainable and we believe we have further efficiencies to realize in all areas.
SG&A expense levered meaningfully in Q1 as weekly retail unit sales volumes stabilized throughout the quarter and the seasonal headwinds we encountered in the second half of 2022 transitioned into seasonal tailwinds. On a sequential basis, GAAP SG&A and Non-GAAP SG&A expense per retail unit sold in Q1 decreased by more than $1,300 (including $460 of restructuring expenses recognized in Q4) and $900, respectively.
Second Quarter Outlook
Our first quarter results demonstrated significant progress on our path to profitability. We exceeded our goal of driving $100 million of Non-GAAP SG&A reductions one quarter early, and we surpassed our previously communicated goal of >$4,000 GPU.
As a result of the rapid changes we are driving within the business, we are providing a more detailed outlook in this quarter than we have in the past or plan to in the future in order to provide a better foundation of understanding to our shareholders.
While the macroeconomic and industry environment continues to be uncertain, looking toward Q2 2023, we expect the following as long as the environment remains stable:
•On retail units, we currently expect a reduction in retail units sold in Q2 2023 compared to Q1 2023, as we continue to normalize our inventory size, optimize marketing spend, make progress on profitability initiatives, and seasonal tailwinds abate.
•On GPU, we currently expect Non-GAAP Total GPU above $5,000 in Q2 2023, consisting of Non-GAAP Retail GPU above $2,000, Non-GAAP Wholesale GPU above $1,000, and Non-GAAP Other GPU above $2,000. Additional details are provided in the following section.2
•On SG&A, we expect similar Non-GAAP SG&A expense in Q2 compared to Q1. We continue to see significant opportunities to further reduce Non-GAAP SG&A expenses over time.
•Finally, we expect to generate positive Adjusted EBITDA in Q2 2023, achieving the first step in our three step plan toward positive free cash flow.
Additional Details on GPU
Over the past twelve months, our teams have focused on driving operational efficiencies throughout our business. These efforts are beginning to flow through into our financial results. After a strong quarter in Q1, we expect to drive >$5,000 Non-GAAP Total GPU in Q2 2023 as long as the macroeconomic and industry environment remains stable. Our strong GPU performance is powered by three fundamental drivers.
1. More robust retail GPU model.
We expect >$2,000 of Non-GAAP Retail GPU in Q2 2023, driven primarily by our efforts to normalize inventory size, accelerate turn times, and generate revenue from additional services.
In FY 2021, we generated approximately $1,600 and $1,700 of GAAP and Non-GAAP Retail GPU, respectively. Since then, we have made fundamental improvements that we believe will drive higher Retail GPU on a sustainable basis.
•First, we have continued to improve our customer vehicle sourcing, with a higher share of retail units sourced from customers in Q1 2023 than in FY 2021.
•Second, we are generating more revenue from the unique services we offer our customers, including nationwide shipping and home delivery.
•Third, over time, we expect per unit reconditioning and inbound transport costs, excluding depreciation and amortization, to be below FY 2021 due to our continued focus on operating efficiency.3
We will discuss our plans for Retail GPU further in the coming quarters, as the fundamental improvements we have made flow through to our results.
2. Expanded wholesale platform.
We expect >$1,000 of Non-GAAP Wholesale GPU in Q2 2023, split between Carvana’s first-party wholesale vehicle sales and ADESA’s third-party wholesale marketplace.
In FY 2021, we generated approximately $450 of GAAP and Non-GAAP Wholesale GPU. Since then, we have made several fundamental improvements to our business that we believe will drive higher Wholesale GPU on a sustainable basis.
2 In order to clearly demonstrate our progress and highlight the most meaningful drivers within our business, we continue to use forecasted Non-GAAP financial measures (forecasted Non-GAAP Total GPU, Non-GAAP Retail GPU, Non-GAAP Wholesale GPU, and Non-GAAP Other GPU) as we look toward Q2 2023 and beyond. We have not provided a quantitative reconciliation of forecasted GAAP measures to forecasted Non-GAAP measures within this communication because we are unable, without making unreasonable efforts, to calculate one-time or restructuring expenses. These items could materially affect the computation of forward-looking GAAP GPU.
3 Of note, inspection and reconditioning center (IRC) facilities fixed cost leverage is not a large driver of Retail GPU. IRC facilities cost was ~$150 per retail unit in Q1 2023 compared to ~$70 per retail unit in Q1 2021.
•First, in May 2022, we acquired ADESA U.S., the second largest U.S. wholesale used vehicle auction marketplace. ADESA’s wholesale marketplace generated significant gross profit in Q1 2023, a long-term addition to total gross profit.
•Second, our acquisition of ADESA has improved the efficiency of our offering of buying cars from customers and selling them in the wholesale market. For example, since Q1 2022, we have reduced inbound transport costs on wholesale vehicles by ~$200 per wholesale unit sold (~$90 per retail unit sold), supported by ADESA locations.
•Third, we continue to invest in our wholesale platform through product and process improvements, with a continued goal of growing these businesses over time.
We will discuss our plans for Wholesale GPU further in the coming quarters, as the fundamental improvements we have made continue to flow through to our results.
3. Strong finance and ancillary product execution.
We expect >$2,000 Non-GAAP Other GPU in Q2 2023, primarily driven by a normalization of loan sale volumes. Since the beginning of Q2, we have sold or securitized $1.3 billion of loan principal.
In FY 2021, we generated approximately $2,450 of GAAP and Non-GAAP Other GPU. While we have not yet regained this level, in the medium term, we see significant opportunities to increase Other GPU by improving our cost of funds spread relative to mature securitization market participants, which has widened over the last few quarters, and by continuing to expand our ancillary product platform.
We will discuss our plans for Other GPU further in the coming quarters, as the fundamental improvements we have made continue to flow through to our results.
Summary
Our first quarter results and second quarter outlook reflect a return to our multi-year track record of driving GPU improvements. We believe the gains we are demonstrating in 2023 are sustainable and reflect the significant fundamental improvements we have made in the last twelve months. We also see further opportunities for more improvements in GPU in the future.
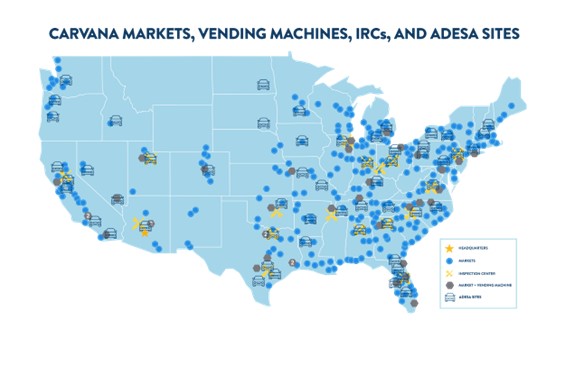
Expansion
On March 29, 2023, we opened our first vending machine in New York on Long Island near Garden City, bringing our national total in operation to 35 at quarter-end. After growing at a fast pace for much of our history, we have paused our expansion efforts outside of completing projects already underway as we focus our collective efforts on executing our profitability initiatives by leveraging our existing nationwide footprint.
*As of May 3, 2023
For a complete list of our market and vending machine opening history, estimated populations, and estimated total industry used vehicle sales by market, along with details on our IRCs, please see: https://investors.carvana.com/investor-resources/investor-materials
Management Objectives
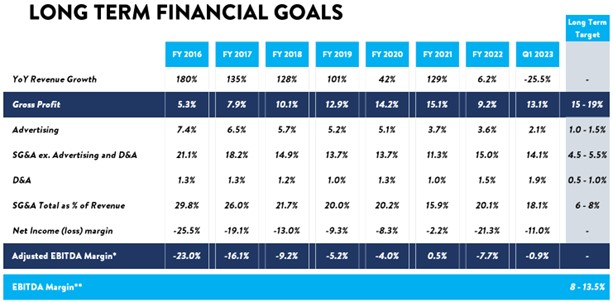
As discussed in our recent operating plan presentation, given the current industry, economy, and market environment, we have shifted our priorities to lowering expenses and driving positive free cash flow. However, this letter maintains our historical format built around the three objectives (1) Grow Retail Units and Revenue; (2) Increase Total Gross Profit Per Unit; and (3) Demonstrate Operating Leverage, to discuss our key results.
* Adjusted EBITDA is defined as net loss plus income tax expense, interest expense, other (income) expense, net, depreciation and amortization in cost of sales and SG&A, goodwill impairment, share-based compensation including the CEO Milestone Gift in cost of sales and SG&A, and restructuring costs, minus revenue related to our Root warrants. For additional information on Adjusted EBITDA and other Non-GAAP financial metrics referenced in this letter, please see our Q1 2023 Form 10-Q, and our Q1 2023 supplemental financial tables posted on our investor relations website.
** EBITDA Margin is calculated as GAAP Net Income (Loss) plus income tax expense, interest expense, and depreciation and amortization, divided by revenues.
Objective #1: Grow Retail Units and Revenue
Retail units sold totaled 79,240 in Q1, a sequential reduction of 9%. Revenue was $2.606 billion in Q1, a sequential reduction of 8%. For additional details on retail unit growth, please see the First Quarter Results section of the letter.
Objective #2: Increase Total Gross Profit Per Unit
Total GPU increased sequentially in Q1 2023, driven by a variety of factors described in more detail below and in the First Quarter Results section of this letter.
For Q1 2023
•Total
◦Total GPU was $4,303 vs. $2,833 in Q1 2022 and $2,219 in Q4 2022.
◦Non-GAAP Total GPU was $4,796 vs. $2,985 in Q1 2022 and $2,667 in Q4 2022.4
▪Total GPU included an aggregate $643 per retail unit sold benefit due to the retail and wholesale inventory allowance adjustments described in more detail below.
•Retail
◦Retail GPU was $1,388 vs. $808 in Q1 2022 and $425 in Q4 2022.
◦Non-GAAP Retail GPU was $1,591 vs. $950 in Q1 2022 and $632 in Q4 2022.
▪Retail GPU benefitted from a $593 impact from an adjustment to our retail inventory allowance as we successfully sold through the majority of our more aged retail inventory that we reserved against in Q4 2022.
◦Taking into account the impacts of the inventory allowances in Q4 and Q1, GAAP and Non-GAAP Retail GPU declined sequentially. This was primarily driven by increased average days to sale as we work to normalize our inventory, partially offset by wider spreads between wholesale and retail market prices, higher shipping revenue, and lower reconditioning and inbound transport costs.
◦Year-over-year changes in Retail GPU were primarily driven by the retail inventory allowance adjustment referenced above, wider spreads between wholesale and retail market prices, higher shipping revenue, and lower reconditioning and inbound transport costs, partially offset by higher average days to sale.
4 Consistent with our Q4 2022 reporting, we are presenting two metrics for total GPU and for each GPU component: GAAP gross profit per unit and non-GAAP gross profit per unit, which excludes the impacts of depreciation and amortization, share-based compensation, Root warrant revenue, and restructuring costs. For additional information, please see our Q1 2023 Form 10-Q, and our Q1 2023 supplemental financial tables.
•Wholesale
◦Wholesale GPU was $883 vs. $219 in Q1 20225 and $230 in Q4 2022
◦Non-GAAP Wholesale GPU was $1,236 vs. $229 in Q1 2022 and $551 in Q4 2022.
◦Wholesale Vehicle
▪Wholesale Vehicle GPU was $555 vs. $219 in Q1 2022 and $184 in Q4 2022.
▪Non-GAAP Wholesale Vehicle GPU was $580 vs. $229 in Q1 2022 and $218 in Q4 2022.
•Wholesale Vehicle GPU benefitted from a $50 impact from an adjustment to our wholesale inventory allowance as we successfully sold through the majority of our more aged wholesale inventory that we reserved against in Q4 2022.
▪Sequential and year-over-year improvements were driven by higher gross profit per wholesale unit sold, primarily driven by wholesale market appreciation, partially offset by a slightly lower ratio of wholesale units sold to retail units sold.
◦Wholesale Marketplace
▪Wholesale Marketplace GPU was $328 vs. $46 in Q4 2022.
▪Non-GAAP Wholesale Marketplace GPU was $656 vs. $333 in Q4 2022.
▪Sequential improvement was primarily driven by increased quarterly volume at ADESA.
•Other
◦Other GPU was $2,032 vs. $1,806 in Q1 2022 and $1,564 in Q4 2022.
◦Non-GAAP Other GPU was $1,969 vs. $1,806 in Q3 and $1,483 in Q4 2022.
◦Sequential improvement in Other GPU was primarily driven by a greater volume of loans sold in Q1 compared to Q4. In Q4, we shifted the timing of a sale of a pool of loans from December to January to align with the extension of our forward flow purchase agreement with Ally. This reduced Q4 Other GPU by $483, other things being equal. In Q1, we sold slightly less than a normalized volume of loans as a result of uncertainty in the securitization markets in March. The GPU impact of this less-than-normalized sale volume was largely offset by higher interest income and other improvements leading to an approximately normalized Other GPU in Q1.
◦Year-over-year improvement was primarily driven by better matching of our loan origination interest rates to benchmark interest rates.
5 Wholesale gross profit and wholesale GPU includes gross profit from the sale of wholesale marketplace vehicles at our acquired ADESA locations.
Objective #3: Demonstrate Operating Leverage
On a sequential basis, Q1 2023 net loss margin and Adjusted EBITDA margin improved by 39.8% and 9.4%, respectively. On a year-over-year basis Q1 2023 net loss margin and Adjusted EBITDA margin improved by 3.5% and 9.1%, respectively, each driven by our company-wide focus on improving profitability and reducing SG&A expenses as described throughout this letter.
For Q1 2023, as a percentage of revenue:
•All components of SG&A improved sequentially. Total SG&A decreased by 4.2%, compensation and benefits decreased by 0.7%, advertising decreased by 1.0%, logistics and market occupancy decreased by 0.5%, and other SG&A decreased by 2.0%.
•Total SG&A decreased by 2.7% year-over-year, compensation and benefits decreased 0.5%, advertising decreased by 2.3%, logistics and market occupancy decreased by 0.2%, and other SG&A increased by 0.3%.
For additional details on SG&A leverage please see our discussion earlier in this letter.
Summary
We still have a long way to get to where we want to be, but the first quarter was an important step.
It was the biggest externally-visible sign so far that what we are doing inside Carvana to adjust to this environment is working. It was a reminder of the power of our customer offering, our business model, and most importantly, of the power of people who care working hard toward a common goal.
More hard work is necessary and more hard work is continuing.
The first quarter was a big step in the right direction. There are more steps to come.
The march continues.
Ernie Garcia, III, Chairman and CEO
Mark Jenkins, CFO
Appendix
Conference Call Details
Carvana will host a conference call today, May 4, 2023, at 5:30 p.m. EST (2:30 p.m. PST) to discuss financial results. To participate in the live call, analysts and investors should dial (833) 255-2830 or (412) 902-6715. A live audio webcast of the conference call along with supplemental financial information will also be accessible on the company's website at investors.carvana.com. Following the webcast, an archived version will also be available on the Investor Relations section of the company’s website. A telephonic replay of the conference call will be available until May 11, 2023, by dialing (877) 344-7529 or (412) 317-0088 and entering passcode 3918810#.
Forward Looking Statements
This letter contains forward-looking statements within the meaning of the Private Securities Litigation Reform Act of 1995. These forward-looking statements reflect Carvana’s current expectations and projections with respect to, among other things, its financial condition, results of operations, plans, objectives, future performance, and business. These statements may be preceded by, followed by or include the words "aim," "anticipate," "believe," "estimate," "expect," "forecast," "intend," "likely," "outlook," "plan," "potential," "project," "projection," "seek," "can," "could," "may," "should," "would," "will," the negatives thereof and other words and terms of similar meaning.
Forward-looking statements include all statements that are not historical facts, including expectations regarding our operational and efficiency initiatives, expected gross profit per unit, forecasted results, and expectations regarding the effect of Carvana’s actions to improve performance. Such forward-looking statements are subject to various risks and uncertainties. Accordingly, there are or will be important factors that could cause actual outcomes or results to differ materially from those indicated in these statements. Among these factors are risks related to: the impact on our business from the larger automotive ecosystem and macroeconomic conditions, including consumer demand, global supply chain challenges, heightened inflation and rising interest rates; our ability to raise additional capital, the quality of the financial markets, and our substantial indebtedness; our history of losses and ability to achieve or maintain profitability in the future; the seasonal and other fluctuations in our quarterly operating results; our ability to compete in the highly competitive industry in which we participate; the changes in prices of new and used vehicles; our ability to sell our inventory expeditiously; and the other risks identified under the “Risk Factors” section in our Annual Report on Form 10-K for 2022.
There is no assurance that any forward-looking statements will materialize. You are cautioned not to place undue reliance on forward-looking statements, which reflect expectations only as of this date. Carvana does not undertake any obligation to publicly update or review any forward-looking statement, whether as a result of new information, future developments, or otherwise.
Use of Non-GAAP Financial Measures
As appropriate, we supplement our results of operations determined in accordance with U.S. generally accepted accounting principles (“GAAP”) with certain non-GAAP financial measurements that are used by management, and which we believe are useful to investors, as supplemental operational measurements to evaluate our financial performance. These measurements should not be considered in isolation or as a substitute for reported GAAP results because they may include or exclude certain items as compared to similar GAAP-based measurements, and such measurements may not be comparable to similarly-titled measurements reported by other companies. Rather, these measurements should be considered as an additional way of viewing aspects of our operations that provide a more complete understanding of our business. We strongly encourage investors to review our consolidated financial statements included in publicly filed reports in their entirety and not rely solely on any one, single financial measurement or communication.
Reconciliations of our non-GAAP measurements to their most directly comparable GAAP-based financial measurements are included at the end of this letter.
Investor Relations Contact Information: : Mike Mckeever, investors@carvana.com
CARVANA CO. AND SUBSIDIARIES
CONDENSED CONSOLIDATED BALANCE SHEETS
(Unaudited)
(In millions, except number of shares, which are reflected in thousands, and par values) | | | | | | | | | | | |
| March 31, 2023 | | December 31, 2022 |
| ASSETS | | | |
| Current assets: | | | |
| Cash and cash equivalents | $ | 488 | | | $ | 434 | |
| Restricted cash | 206 | | | 194 | |
| Accounts receivable, net | 342 | | | 253 | |
| Finance receivables held for sale, net | 1,606 | | | 1,334 | |
| | | |
| | | |
| Vehicle inventory | 1,485 | | | 1,876 | |
| Beneficial interests in securitizations | 312 | | | 321 | |
| Other current assets, including $6 and $6, respectively, due from related parties | 177 | | | 182 | |
| Total current assets | 4,616 | | | 4,594 | |
| Property and equipment, net | 3,195 | | | 3,244 | |
| Operating lease right-of-use assets, including $13 and $14, respectively, from leases with related parties | 519 | | | 536 | |
| Intangible assets, net | 65 | | | 70 | |
| | | |
| Other assets, including $1 and $1, respectively, due from related parties | 251 | | | 254 | |
| Total assets | $ | 8,646 | | | $ | 8,698 | |
| LIABILITIES & STOCKHOLDERS' DEFICIT | | | |
| Current liabilities: | | | |
| Accounts payable and accrued liabilities, including $13 and $16, respectively, due to related parties | $ | 864 | | | $ | 777 | |
| Short-term revolving facilities | 1,703 | | | 1,534 | |
| Current portion of long-term debt | 201 | | | 201 | |
| Other current liabilities, including $4 and $4, respectively, from leases with related parties | 82 | | | 80 | |
| Total current liabilities | 2,850 | | | 2,592 | |
| Long-term debt, excluding current portion | 6,553 | | | 6,574 | |
| | | |
| Operating lease liabilities, excluding current portion, including $9 and $9, respectively, from leases with related parties | 493 | | | 507 | |
| Other liabilities | 72 | | | 78 | |
| Total liabilities | 9,968 | | | 9,751 | |
| Commitments and contingencies | | | |
| | | |
| Stockholders' deficit: | | | |
| | | |
| | | |
| Preferred stock, $0.01 par value - 50,000 shares authorized; none issued and outstanding as of March 31, 2023 and December 31, 2022 | — | | | — | |
| Class A common stock, $0.001 par value - 500,000 shares authorized; 106,047 and 106,037 shares issued and outstanding as of March 31, 2023 and December 31, 2022, respectively | — | | | — | |
| Class B common stock, $0.001 par value - 125,000 shares authorized; 82,900 shares issued and outstanding as of March 31, 2023 and December 31, 2022 | — | | | — | |
| Additional paid-in capital | 1,576 | | | 1,558 | |
| | | |
| Accumulated deficit | (2,236) | | | (2,076) | |
| Total stockholders' deficit attributable to Carvana Co. | (660) | | | (518) | |
| Non-controlling interests | (662) | | | (535) | |
| Total stockholders' deficit | (1,322) | | | (1,053) | |
| Total liabilities & stockholders' deficit | $ | 8,646 | | | $ | 8,698 | |
CARVANA CO. AND SUBSIDIARIES
CONDENSED CONSOLIDATED STATEMENTS OF OPERATIONS
(Unaudited)
(In millions, except number of shares, which are reflected in thousands, and per share amounts)
| | | | | | | | | | | | | | | |
| Three Months Ended March 31, | | |
| 2023 | | 2022 | | | | |
| Sales and operating revenues: | | | | | | | |
| Retail vehicle sales, net | $ | 1,827 | | | $ | 2,732 | | | | | |
| Wholesale sales and revenues, including $5 and $14, respectively, from related parties | 618 | | | 575 | | | | | |
| Other sales and revenues, including $36 and $48, respectively, from related parties | 161 | | | 190 | | | | | |
| | | | | | | |
| Net sales and operating revenues | 2,606 | | | 3,497 | | | | | |
| Cost of sales, including $1 and $9, respectively, to related parties | 2,265 | | | 3,199 | | | | | |
| Gross profit | 341 | | | 298 | | | | | |
| Selling, general and administrative expenses, including $8 and $6, respectively, to related parties | 472 | | | 727 | | | | | |
| | | | | | | |
| Interest expense | 159 | | | 64 | | | | | |
| Other (income) expense, net | (2) | | | 13 | | | | | |
| Net loss before income taxes | (288) | | | (506) | | | | | |
| Income tax (benefit) provision | (2) | | | — | | | | | |
| Net loss | (286) | | | (506) | | | | | |
| Net loss attributable to non-controlling interests | (126) | | | (246) | | | | | |
| Net loss attributable to Carvana Co. | $ | (160) | | | $ | (260) | | | | | |
| | | | | | | |
| | | | | | | |
| | | | | | | |
| | | | | | | |
| Net loss per share of Class A common stock, basic and diluted | $ | (1.51) | | | $ | (2.89) | | | | | |
| | | | | | | |
| | | | | | | |
Weighted-average shares of Class A common stock outstanding, basic and diluted (1) | 106,011 | | | 90,095 | | | | | |
| | | | | | | |
(1) Weighted-average shares of Class A common stock outstanding have been adjusted for unvested restricted stock awards.
CARVANA CO. AND SUBSIDIARIES
CONDENSED CONSOLIDATED STATEMENTS OF CASH FLOWS
(Unaudited)
(In millions) | | | | | | | | | | | |
| Three Months Ended March 31, |
| 2023 | | 2022 |
| Cash Flows from Operating Activities: | | | |
| Net loss | $ | (286) | | | $ | (506) | |
| Adjustments to reconcile net loss to net cash used in operating activities: | | | |
| Depreciation and amortization expense | 93 | | | 37 | |
| Equity-based compensation expense | 15 | | | 28 | |
| Loss on disposal of property and equipment | 1 | | | 1 | |
| Provision for bad debt and valuation allowance | 10 | | | 5 | |
| Amortization and write-off of debt issuance costs | 8 | | | 6 | |
| Unrealized loss on warrants to acquire Root's Class A common stock | — | | | 5 | |
| Unrealized (gain) loss on beneficial interests in securitization | (1) | | | 10 | |
| | | |
| Changes in finance receivable related assets: | | | |
| Originations of finance receivables | (1,428) | | | (1,985) | |
| Proceeds from sale of finance receivables, net | 1,116 | | | 1,906 | |
| | | |
| Gain on loan sales | (64) | | | (105) | |
| Principal payments received on finance receivables held for sale | 73 | | | 61 | |
| Other changes in assets and liabilities: | | | |
| Vehicle inventory | 385 | | | (133) | |
| Accounts receivable | (91) | | | (5) | |
| | | |
| Other assets | 3 | | | (43) | |
| Accounts payable and accrued liabilities | 101 | | | 117 | |
| Operating lease right-of-use assets | 17 | | | (106) | |
| | | |
| | | |
| Operating lease liabilities | (12) | | | 113 | |
| Other liabilities | (6) | | | 1 | |
| Net cash used in operating activities | (66) | | | (593) | |
| Cash Flows from Investing Activities: | | | |
| | | |
| Purchases of property and equipment | (32) | | | (220) | |
| Proceeds from disposal of property and equipment | 12 | | | — | |
| Payments for acquisitions, net of cash acquired | (7) | | | — | |
| Principal payments received on and proceeds from sale of beneficial interests | 8 | | | 12 | |
| | | |
| Net cash used in investing activities | (19) | | | (208) | |
| Cash Flows from Financing Activities: | | | |
| Proceeds from short-term revolving facilities | 1,858 | | | 5,231 | |
| Payments on short-term revolving facilities | (1,689) | | | (4,498) | |
| Proceeds from issuance of long-term debt | 19 | | | 20 | |
| Payments on long-term debt | (37) | | | (36) | |
| | | |
| | | |
| Proceeds from equity-based compensation plans | — | | | 2 | |
| Tax withholdings related to restricted stock units and awards | — | | | (12) | |
| | | |
| | | |
| | | |
| Net cash provided by financing activities | 151 | | | 707 | |
| Net increase (decrease) in cash, cash equivalents and restricted cash | 66 | | | (94) | |
| Cash, cash equivalents and restricted cash at beginning of period | 628 | | | 636 | |
| Cash, cash equivalents and restricted cash at end of period | $ | 694 | | | $ | 542 | |
CARVANA CO. AND SUBSIDIARIES
OUTSTANDING SHARES AND LLC UNITS
(Unaudited)
LLC Units (adjusted for the exchange ratio and participation thresholds) are considered potentially dilutive shares of Class A common stock because they are exchangeable into shares of Class A common stock, if the Company elects not to settle exchanges in cash. Weighted-average shares of Class A common stock and as-exchanged LLC Units, which were evaluated for potentially dilutive effects and were determined to be anti-dilutive, are as follows:
| | | | | | | | | | | | | | | |
| Three Months Ended March 31, | | |
| 2023 | | 2022 | | | | |
| | | | | | | |
| (in thousands) |
| Weighted-average shares of Class A common stock outstanding | 106,011 | | | 90,095 | | | | | |
| Weighted-average as-exchanged LLC Units for shares of Class A common stock | 83,686 | | | 84,952 | | | | | |
| 189,697 | | | 175,047 | | | | | |
| | | | | | | |
| | | | | | | |
CARVANA CO. AND SUBSIDIARIES
RESULTS OF OPERATIONS
(Unaudited)
| | | | | | | | | | | | | | | | | | | | | | | |
| Three Months Ended March 31, | | | | | | |
| 2023 | | 2022 | | Change | | | | | | |
| | | | | | | | | | | |
| (in millions, except unit and per unit amounts) | | | | | | |
| Net sales and operating revenues: | | | | | | | | | | |
| Retail vehicle sales, net | $ | 1,827 | | | $ | 2,732 | | | (33.1) | % | | | | | | |
Wholesale sales and revenues (1) | 618 | | | 575 | | | 7.5 | % | | | | | | |
Other sales and revenues (2) | 161 | | | 190 | | | (15.3) | % | | | | | | |
| Total net sales and operating revenues | $ | 2,606 | | | $ | 3,497 | | | (25.5) | % | | | | | | |
| Gross profit: | | | | | | | | | | | |
Retail vehicle gross profit (3) | $ | 110 | | | $ | 85 | | | 29.4 | % | | | | | | |
Wholesale gross profit (1) | 70 | | | 23 | | | 204.3 | % | | | | | | |
Other gross profit (2) | 161 | | | 190 | | | (15.3) | % | | | | | | |
| Total gross profit | $ | 341 | | | $ | 298 | | | 14.4 | % | | | | | | |
| | | | | | | | | | | |
| | | | | | | | | | | |
| | | | | | | | | | | |
| | | | | | | | | | | |
| | | | | | | | | | | |
| | | | | | | | | | | |
| | | | | | | | | | | |
| | | | | | | | | | | |
| | | | | | | | | | | |
| Unit sales information: | | | | | | | | | | | |
| Retail vehicle unit sales | 79,240 | | | 105,185 | | | (24.7) | % | | | | | | |
| Wholesale vehicle unit sales | 35,110 | | | 50,280 | | | (30.2) | % | | | | | | |
| | | | | | | | | | | |
| Per unit selling prices: | | | | | | | | | | | |
| Retail vehicles | 23,056 | | | 25,973 | | | (11.2) | % | | | | | | |
Wholesale vehicles (4) | 11,592 | | | 11,436 | | | 1.4 | % | | | | | | |
| | | | | | | | | | | |
| Per retail unit gross profit: | | | | | | | | | | | |
Retail vehicle gross profit (5) | $ | 1,388 | | | $ | 808 | | | 71.8 | % | | | | | | |
| Wholesale gross profit | 883 | | | 219 | | | 303.2 | % | | | | | | |
| | | | | | | | | | | |
| Other gross profit | 2,032 | | | 1,806 | | | 12.5 | % | | | | | | |
| Total gross profit | $ | 4,303 | | | $ | 2,833 | | | 51.9 | % | | | | | | |
| Per wholesale unit gross profit: | | | | | | | | | | | |
Wholesale vehicle gross profit (6) | $ | 1,253 | | | $ | 457 | | | 174.2 | % | | | | | | |
| | | | | | | | | | | |
Wholesale marketplace: (7) | | | | | | | | | | | |
| Wholesale marketplace units sold | 213,764 | | | $ | — | | | NM | | | | | | |
| Wholesale marketplace revenues | $ | 211 | | | $ | — | | | NM | | | | | | |
Wholesale marketplace gross profit (8) | $ | 26 | | | $ | — | | | NM | | | | | | |
| | | | | | | | | | | |
| | | | | | | | | | | |
| | | | | | | | | | | |
| | | | | | | | | | | |
| | | | | | | | | | | |
(1) Includes $5 and $14, respectively, of wholesale sales and revenues from related parties.
(2) Includes $36 and $48, respectively, of other sales and revenues from related parties.
(3) Includes $0 and $8, respectively, of share-based compensation expense related to the CEO Milestone Gift.
(4) Excludes wholesale marketplace revenues and wholesale marketplace units sold.
(5) Includes $0 and $76, respectively, of share-based compensation expense related to the CEO Milestone Gift.
(6) Excludes wholesale marketplace gross profit and wholesale marketplace units sold.
(7) Represents results of ADESA and its subsidiaries, which the Company has designated as unrestricted subsidiaries. These amounts do not include units sold, revenues, or gross profit received from Company purchases and sales through the wholesale marketplace, which are eliminated in consolidation.
(8) Includes $26 and $0, respectively, of depreciation and amortization expense.
NM = Not Meaningful
CARVANA CO. AND SUBSIDIARIES
COMPONENTS OF SG&A
(Unaudited)
| | | | | | | | | | | | | | | | | | | | | | | | | | | | | | | | | | |
| | | | Three Months Ended | | |
| | | | Mar 31, 2022 | | Jun 30, 2022 | | Sep 30, 2022 | | Dec 31, 2022 | | Mar 31, 2023 | | |
| | | | | | | | | | | | | | |
| | | | (in millions) | | |
Compensation and benefits (1) | | | | $ | 236 | | | $ | 248 | | | $ | 221 | | | $ | 212 | | | $ | 177 | | | |
CEO Milestone Gift (2) | | | | 20 | | | 4 | | | 2 | | | — | | | (1) | | | |
| Advertising | | | | 155 | | | 131 | | | 117 | | | 87 | | | 56 | | | |
Market occupancy (3) | | | | 23 | | | 24 | | | 23 | | | 23 | | | 21 | | | |
Logistics (4) | | | | 56 | | | 71 | | | 57 | | | 51 | | | 35 | | | |
Other (5) | | | | 237 | | | 243 | | | 236 | | | 259 | | | 184 | | | |
| Total | | | | $ | 727 | | | $ | 721 | | | $ | 656 | | | $ | 632 | | | $ | 472 | | | |
| | | | | | | | | | | | | | |
| | | | | | | | | | | | | | |
| | | | | | | | | | | | | | |
_________________________
(1) Compensation and benefits includes all payroll and related costs, including benefits, payroll taxes, and equity-based compensation, except those related to preparing vehicles for sale, which are included in cost of sales, and those related to the development of software products for internal use, which are capitalized to software and depreciated over the estimated useful lives of the related assets.
(2) CEO Milestone Gift includes all equity-based compensation and payroll tax costs associated with the Gift, except those Gift costs related to preparing vehicles for sale, which are included in cost of sales.
(3) Market occupancy costs includes occupancy costs of our vending machine and hubs. It excludes occupancy costs related to reconditioning vehicles which are included in cost of sales and the portion related to corporate occupancy which are included in other costs.
(4) Logistics includes fuel, maintenance and depreciation related to operating our own transportation fleet, and third-party transportation fees, except the portion related to inbound transportation, which is included in cost of sales.
(5) Other costs include all other selling, general and administrative expenses such as IT expenses, corporate occupancy, professional services and insurance, limited warranty, and title and registration.
CARVANA CO. AND SUBSIDIARIES
LIQUIDITY RESOURCES
(Unaudited)
We had the following liquidity resources available as of March 31, 2023 and December 31, 2022:
| | | | | | | | | | | |
| March 31,
2023 | | December 31,
2022 |
| | | |
| (in millions) |
| Cash and cash equivalents | $ | 488 | | | $ | 434 | |
Availability under short-term revolving facilities (1) | 1,001 | | | 1,314 | |
| | | |
| Committed liquidity resources available | $ | 1,489 | | | $ | 1,748 | |
| | | |
Unpledged real estate not included above (2) | 1,973 | | | 1,971 | |
Unpledged beneficial interests in securitizations (3) | 65 | | | 69 | |
Total liquidity resources (4) | $ | 3,527 | | | $ | 3,788 | |
1.Availability under short-term revolving facilities is the available amount we can borrow under our existing vehicle inventory floor plan and finance receivable facilities based on the pledgable value of vehicle inventory and finance receivables on our balance sheet on the period end date, excluding the impact to restricted cash requirements. This is distinct from the total commitment amount of these facilities because it represents the currently borrowable amount, rather than committed future amounts that could be borrowed to finance future additional assets. We updated the calculation of availability under short-term revolving facilities at December 31, 2022 to reflect the available inventory borrowing base at the end of the day on Friday, December 30, 2022, inclusive of a draw made on the floor plan facility on the last business day of the year.
2.Unpledged real estate assets include IRC, ADESA locations and vending machine real estate assets that have not been previously pledged or sold. Since our first sale-leaseback transaction in 2017, we have historically had flexible access to real estate financing and expect to continue to use various forms of real estate financing in the future.
3.Unpledged beneficial interests in securitizations includes retained beneficial interests in securitizations that have not been previously pledged or sold. We historically have financed the majority of our retained beneficial interests in securitizations and expect to continue to do so in the future.
4.Total liquidity resources is composed of cash and equivalents, availability under existing credit facilities, and additional unpledged assets, including vehicle inventory, finance receivables, real estate, and securities on our balance sheet that can be financed using traditional asset-based financing sources. To optimize our cost of capital, in any given period we may choose not to maximize borrowings on our short-term revolving facilities, maximize revolving commitment size, or immediately sale-leaseback or pledge real estate and retained beneficial interests in securitizations. This has the benefit of reducing interest expense and debt issuance costs and providing flexibility to minimize financing costs over time.
CARVANA CO. AND SUBSIDIARIES
RECONCILIATION OF GAAP TO NON-GAAP FINANCIAL MEASURES (continued)
(Unaudited)
Adjusted EBITDA; Adjusted EBITDA margin; Gross profit, non-GAAP; Total gross profit per retail unit, non-GAAP; SG&A, non-GAAP; and Total SG&A per retail unit, non-GAAP
Adjusted EBITDA; Adjusted EBITDA margin; Gross profit, non-GAAP; Total gross profit per retail unit, non-GAAP; SG&A, non-GAAP; and Total SG&A per retail unit, non-GAAP are supplemental measures of operating performance that do not represent and should not be considered an alternative to net loss, gross profit, or SG&A, as determined by U.S. GAAP.
Adjusted EBITDA is defined as net loss plus income tax expense, interest expense, other (income) expense, net, depreciation and amortization in cost of sales and SG&A, share-based compensation including the CEO Milestone Gift in cost of sales and SG&A, and restructuring costs, minus revenue related to our Root warrants. Following the ADESA Acquisition, we are also excluding depreciation and amortization in cost of sales, which was historically only a small component of cost of sales. Adjusted EBITDA margin is Adjusted EBITDA as a percentage of total revenues.
Gross profit, non-GAAP is defined as GAAP gross profit plus depreciation and amortization in cost of sales and share-based compensation including the CEO Milestone Gift in cost of sales, minus revenue related to our Root warrants. Total gross profit per retail unit, non-GAAP is Gross profit, non-GAAP divided by retail vehicle unit sales.
SG&A, non-GAAP is defined as GAAP SG&A minus depreciation and amortization in SG&A, share-based compensation including the CEO Milestone Gift in SG&A, and restructuring costs. Total SG&A per retail unit, non-GAAP is SG&A, non-GAAP divided by retail vehicle unit sales.
We use these non-GAAP measures to measure the operating performance of our business as a whole and relative to our total revenues and retail vehicle unit sales. We believe that these metrics are useful measures to us and to our investors because they exclude certain financial, capital structure, and non-cash items that we do not believe directly reflect our core operations and may not be indicative of our recurring operations, in part because they may vary widely across time and within our industry independent of the performance of our core operations. We believe that excluding these items enables us to more effectively evaluate our performance period-over-period and relative to our competitors. Adjusted EBITDA; Adjusted EBITDA margin; Gross profit, non-GAAP; Total gross profit per retail unit, non-GAAP; SG&A, non-GAAP; and Total SG&A per retail unit, non-GAAP may not be comparable to similarly titled measures provided by other companies due to potential differences in methods of calculations.
A reconciliation of Adjusted EBITDA to net loss, Gross profit, non-GAAP to gross profit, and SG&A, non-GAAP to SG&A, which are the most directly comparable U.S. GAAP measures, and calculations of Adjusted EBITDA margin, Total gross profit per retail unit, non-GAAP, and Total SG&A per retail unit, non-GAAP is as follows:
| | | | | | | | | | | | | | | | | | | | | | | | | | | | | | | | | | |
| | | | | | For the Three Months Ended |
| (dollars in millions, except per unit amounts) | | | | | | Mar 31, 2022 | | Jun 30, 2022 | | Sep 30, 2022 | | Dec 31, 2022 | | Mar 31, 2023 |
| Net loss | | | | | | $ | (506) | | | $ | (439) | | | $ | (508) | | | $ | (1,441) | | | $ | (286) | |
| Income tax (benefit) provision | | | | | | — | | | 1 | | | — | | | — | | | (2) | |
| Interest expense | | | | | | 64 | | | 116 | | | 153 | | | 153 | | | 159 | |
| Other (income) expense, net | | | | | | 13 | | | (3) | | | 58 | | | 2 | | | (2) | |
| Depreciation and amortization expense in cost of sales | | | | | | 8 | | | 27 | | | 36 | | | 43 | | | 44 | |
| Depreciation and amortization expense in SG&A | | | | | | 37 | | | 49 | | | 57 | | | 57 | | | 49 | |
| Goodwill impairment | | | | | | — | | | — | | | — | | | 847 | | | — | |
| Share-based compensation expense in cost of sales | | | | | | 8 | | | 6 | | | 2 | | | — | | | — | |
| Share-based compensation expense in SG&A | | | | | | 28 | | | 13 | | | 16 | | | 12 | | | 15 | |
| Root warrant revenue | | | | | | — | | | — | | | — | | | (7) | | | (5) | |
Restructuring (1) | | | | | | — | | | 14 | | | — | | | 43 | | | 4 | |
| Adjusted EBITDA | | | | | | $ | (348) | | | $ | (216) | | | $ | (186) | | | $ | (291) | | | $ | (24) | |
| | | | | | | | | | | | | | |
| Total revenues | | | | | | $ | 3,497 | | | $ | 3,884 | | | $ | 3,386 | | | $ | 2,837 | | | $ | 2,606 | |
| Net loss margin | | | | | | (14.5) | % | | (11.3) | % | | (15.0) | % | | (50.8) | % | | (11.0) | % |
| Adjusted EBITDA margin | | | | | | (10.0) | % | | (5.6) | % | | (5.5) | % | | (10.3) | % | | (0.9) | % |
| | | | | | | | | | | | | | |
| Gross profit | | | | | | $ | 298 | | | $ | 396 | | | $ | 359 | | | $ | 193 | | | $ | 341 | |
| Depreciation and amortization expense in cost of sales | | | | | | 8 | | | 27 | | | 36 | | | 43 | | | 44 | |
| Share-based compensation expense in cost of sales | | | | | | 8 | | | 6 | | | 2 | | | — | | | — | |
| Root warrant revenue | | | | | | — | | | — | | | — | | | (7) | | | (5) | |
Restructuring (1) | | | | | | — | | | 4 | | | — | | | 3 | | | — | |
| Gross profit, non-GAAP | | | | | | $ | 314 | | | $ | 433 | | | $ | 397 | | | $ | 232 | | | $ | 380 | |
| | | | | | | | | | | | | | |
| Retail vehicle unit sales | | | | | | 105,185 | | | 117,564 | | | 102,570 | | | 86,977 | | | 79,240 | |
| Total gross profit per retail unit | | | | | | $ | 2,833 | | | $ | 3,368 | | | $ | 3,500 | | | $ | 2,219 | | | $ | 4,303 | |
| Total gross profit per retail unit, non-GAAP | | | | | | $ | 2,985 | | | $ | 3,683 | | | $ | 3,870 | | | $ | 2,667 | | | $ | 4,796 | |
| | | | | | | | | | | | | | |
| SG&A | | | | | | $ | 727 | | | $ | 721 | | | $ | 656 | | | $ | 632 | | | $ | 472 | |
| Depreciation and amortization expense in SG&A | | | | | | 37 | | | 49 | | | 57 | | | 57 | | | 49 | |
| Share-based compensation expense in SG&A | | | | | | 28 | | | 13 | | | 16 | | | 12 | | | 15 | |
Restructuring (1) | | | | | | — | | | 10 | | | — | | | 40 | | | 4 | |
| SG&A, non-GAAP | | | | | | $ | 662 | | | $ | 649 | | | $ | 583 | | | $ | 523 | | | $ | 404 | |
| | | | | | | | | | | | | | |
| Retail vehicle unit sales | | | | | | 105,185 | | | 117,564 | | | 102,570 | | | 86,977 | | | 79,240 | |
| Total SG&A per retail unit | | | | | | $ | 6,912 | | | $ | 6,133 | | | $ | 6,396 | | | $ | 7,266 | | | $ | 5,957 | |
| Total SG&A per retail unit, non-GAAP | | | | | | $ | 6,294 | | | $ | 5,520 | | | $ | 5,684 | | | $ | 6,013 | | | $ | 5,098 | |
(1) Restructuring includes costs related to our May 2022 and November 2022 reductions in force, as well as lease termination and other restructuring expenses.
| | | | | | | | | | | | | | | | | | | | | | | | | | | | | | | | | | | | | | | | |
| | | | | | For the Year Ended | | For the Three Months Ended |
| (dollars in millions, except per unit amounts) | | | | | | Dec 31, 2021 | | Mar 31, 2022 | | Jun 30, 2022 | | Sep 30, 2022 | | Dec 31, 2022 | | Mar 31, 2023 |
| Retail gross profit | | | | | | $ | 697 | | | $ | 85 | | | $ | 133 | | | $ | 116 | | | $ | 37 | | | $ | 110 | |
| Depreciation and amortization expense in cost of sales | | | | | | 20 | | | 7 | | | 11 | | | 12 | | | 15 | | | 16 | |
| Share-based compensation expense in cost of sales | | | | | | — | | | 8 | | | 6 | | | 2 | | | — | | | — | |
Restructuring (1) | | | | | | — | | | — | | | 4 | | | — | | | 3 | | | — | |
| Retail gross profit, non-GAAP | | | | | | $ | 717 | | | $ | 100 | | | $ | 154 | | | $ | 130 | | | $ | 55 | | | $ | 126 | |
| | | | | | | | | | | | | | | | |
| Retail vehicle unit sales | | | | | | 425,237 | | | 105,185 | | | 117,564 | | | 102,570 | | | 86,977 | | | 79,240 | |
| Retail gross profit per retail unit | | | | | | $ | 1,639 | | | $ | 808 | | | $ | 1,131 | | | $ | 1,131 | | | $ | 425 | | | $ | 1,388 | |
| Retail gross profit per retail unit, non-GAAP | | | | | | $ | 1,686 | | | $ | 950 | | | $ | 1,309 | | | $ | 1,268 | | | $ | 632 | | | $ | 1,591 | |
| | | | | | | | | | | | | | | | |
| Wholesale vehicle gross profit | | | | | | $ | 189 | | | $ | 23 | | | $ | 40 | | | $ | 33 | | | $ | 16 | | | $ | 44 | |
| Depreciation and amortization expense in cost of sales | | | | | | 4 | | | 1 | | | 1 | | | 2 | | | 3 | | | 2 | |
| Wholesale vehicle gross profit, non-GAAP | | | | | | $ | 193 | | | $ | 24 | | | $ | 41 | | | $ | 35 | | | $ | 19 | | | $ | 46 | |
| | | | | | | | | | | | | | | | |
| Retail vehicle unit sales | | | | | | 425,237 | | | 105,185 | | | 117,564 | | | 102,570 | | | 86,977 | | | 79,240 | |
| Wholesale vehicle gross profit per retail unit | | | | | | $ | 445 | | | $ | 219 | | | $ | 340 | | | $ | 321 | | | $ | 184 | | | $ | 555 | |
| Wholesale vehicle gross profit per retail unit, non-GAAP | | | | | | $ | 454 | | | $ | 229 | | | $ | 349 | | | $ | 340 | | | $ | 218 | | | $ | 580 | |
| | | | | | | | | | | | | | | | |
| Wholesale marketplace gross profit | | | | | | $ | — | | | $ | — | | | $ | 5 | | | $ | 13 | | | $ | 4 | | | $ | 26 | |
| Depreciation and amortization expense in cost of sales | | | | | | — | | | — | | | 15 | | | 22 | | | 25 | | | 26 | |
| Wholesale marketplace gross profit, non-GAAP | | | | | | $ | — | | | $ | — | | | $ | 20 | | | $ | 35 | | | $ | 29 | | | $ | 52 | |
| | | | | | | | | | | | | | | | |
| Retail vehicle unit sales | | | | | | 425,237 | | | 105,185 | | | 117,564 | | | 102,570 | | | 86,977 | | | 79,240 | |
| Wholesale marketplace gross profit per retail unit | | | | | | $ | — | | | $ | — | | | $ | 43 | | | $ | 127 | | | $ | 46 | | | $ | 328 | |
| Wholesale marketplace gross profit per retail unit, non-GAAP | | | | | | $ | — | | | $ | — | | | $ | 171 | | | $ | 341 | | | $ | 333 | | | $ | 656 | |
| | | | | | | | | | | | | | | | |
| Other gross profit | | | | | | $ | 1,043 | | | $ | 190 | | | $ | 218 | | | $ | 197 | | | $ | 136 | | | $ | 161 | |
| Root warrant revenue | | | | | | — | | | — | | | — | | | — | | | (7) | | | (5) | |
| Other gross profit, non-GAAP | | | | | | $ | 1,043 | | | $ | 190 | | | $ | 218 | | | $ | 197 | | | $ | 129 | | | $ | 156 | |
| | | | | | | | | | | | | | | | |
| Retail vehicle unit sales | | | | | | 425,237 | | | 105,185 | | | 117,564 | | | 102,570 | | | 86,977 | | | 79,240 | |
| Other gross profit per retail unit | | | | | | $ | 2,453 | | | $ | 1,806 | | | $ | 1,854 | | | $ | 1,921 | | | $ | 1,564 | | | $ | 2,032 | |
| Other gross profit per retail unit, non-GAAP | | | | | | $ | 2,453 | | | $ | 1,806 | | | $ | 1,854 | | | $ | 1,921 | | | $ | 1,483 | | | $ | 1,969 | |
(1) Restructuring includes costs related to our May 2022 and November 2022 reductions in force.
| | | | | | | | | | | | | | | | | | | | | | | | | | | | | | | | | | | | | | | | | | | | | | |
| | | | | | For the Years Ended December 31, |
| (dollars in millions, except per unit amounts) | | | | | | 2016 | | 2017 | | 2018 | | 2019 | | 2020 | | 2021 | | 2022 |
| Net loss | | | | | | $ | (93) | | | $ | (164) | | | $ | (255) | | | $ | (365) | | | $ | (462) | | | $ | (287) | | | $ | (2,894) | |
| Income tax provision | | | | | | — | | | — | | | — | | | — | | | — | | | 1 | | | 1 | |
| Interest expense | | | | | | 4 | | | 8 | | | 25 | | | 81 | | | 131 | | | 176 | | | 486 | |
| Other (income) expense, net | | | | | | — | | | 1 | | | 1 | | | 4 | | | (1) | | | 6 | | | 70 | |
| Depreciation and amortization expense in cost of sales | | | | | | — | | | — | | | — | | | — | | | 10 | | | 24 | | | 114 | |
| Depreciation and amortization expense in SG&A | | | | | | 4 | | | 11 | | | 24 | | | 41 | | | 74 | | | 105 | | | 200 | |
| Goodwill impairment | | | | | | — | | | — | | | — | | | — | | | — | | | — | | | 847 | |
| Share-based compensation expense in cost of sales | | | | | | — | | | — | | | 4 | | | 5 | | | 1 | | | — | | | 16 | |
| Share-based compensation expense in SG&A | | | | | | 1 | | | 6 | | | 21 | | | 30 | | | 25 | | | 39 | | | 69 | |
| Root warrant revenue | | | | | | — | | | — | | | — | | | — | | | — | | | — | | | (7) | |
Restructuring (1) | | | | | | — | | | — | | | — | | | — | | | — | | | — | | | 57 | |
| Adjusted EBITDA | | | | | | $ | (84) | | | $ | (138) | | | $ | (180) | | | $ | (204) | | | $ | (222) | | | $ | 64 | | | $ | (1,041) | |
| | | | | | | | | | | | | | | | | | |
| Total revenues | | | | | | $ | 365 | | | $ | 859 | | | $ | 1,955 | | | $ | 3,940 | | | $ | 5,587 | | | $ | 12,814 | | | $ | 13,604 | |
| Net loss margin | | | | | | (25.5) | % | | (19.1) | % | | (13.0) | % | | (9.3) | % | | (8.3) | % | | (2.2) | % | | (21.3) | % |
| Adjusted EBITDA margin | | | | | | (23.0) | % | | (16.1) | % | | (9.2) | % | | (5.2) | % | | (4.0) | % | | 0.5 | % | | (7.7) | % |
| | | | | | | | | | | | | | | | | | |
| Gross profit | | | | | | $ | 19 | | | $ | 68 | | | $ | 197 | | | $ | 506 | | | $ | 794 | | | $ | 1,929 | | | $ | 1,246 | |
| Depreciation and amortization expense in cost of sales | | | | | | — | | | — | | | — | | | — | | | 10 | | | 24 | | | 114 | |
| Share-based compensation expense in cost of sales | | | | | | — | | | — | | | 4 | | | 5 | | | 1 | | | — | | | 16 | |
| Root warrant revenue | | | | | | — | | | — | | | — | | | — | | | — | | | — | | | (7) | |
Restructuring (1) | | | | | | — | | | — | | | — | | | — | | | — | | | — | | | 7 | |
| Gross profit, non-GAAP | | | | | | $ | 19 | | | $ | 68 | | | $ | 201 | | | $ | 511 | | | $ | 805 | | | $ | 1,953 | | | $ | 1,376 | |
| | | | | | | | | | | | | | | | | | |
| Retail vehicle unit sales | | | | | | 18,761 | | | 44,252 | | | 94,108 | | | 177,549 | | | 244,111 | | | 425,237 | | | 412,296 | |
| Total gross profit per retail unit | | | | | | $ | 1,023 | | | $ | 1,539 | | | $ | 2,090 | | | $ | 2,852 | | | $ | 3,253 | | | $ | 4,537 | | | $ | 3,022 | |
| Total gross profit per retail unit, non-GAAP | | | | | | $ | 1,013 | | | $ | 1,537 | | | $ | 2,136 | | | $ | 2,878 | | | $ | 3,298 | | | $ | 4,593 | | | $ | 3,337 | |
| | | | | | | | | | | | | | | | | | |
| SG&A | | | | | | $ | 109 | | | $ | 223 | | | $ | 425 | | | $ | 787 | | | $ | 1,126 | | | $ | 2,033 | | | $ | 2,736 | |
| Depreciation and amortization expense in SG&A | | | | | | 4 | | | 11 | | | 24 | | | 41 | | | 74 | | | 105 | | | 200 | |
| Share-based compensation expense in SG&A | | | | | | 1 | | | 6 | | | 21 | | | 30 | | | 25 | | | 39 | | | 69 | |
Restructuring (1) | | | | | | — | | | — | | | — | | | — | | | — | | | — | | | 50 | |
| SG&A, non-GAAP | | | | | | $ | 104 | | | $ | 206 | | | $ | 380 | | | $ | 716 | | | $ | 1,027 | | | $ | 1,889 | | | $ | 2,417 | |
| | | | | | | | | | | | | | | | | | |
| Retail vehicle unit sales | | | | | | 18,761 | | | 44,252 | | | 94,108 | | | 177,549 | | | 244,111 | | | 425,237 | | | 412,296 | |
| Total SG&A per retail unit | | | | | | $ | 5,810 | | | $ | 5,039 | | | $ | 4,516 | | | $ | 4,433 | | | $ | 4,613 | | | $ | 4,781 | | | $ | 6,636 | |
| Total SG&A per retail unit, non-GAAP | | | | | | $ | 5,543 | | | $ | 4,655 | | | $ | 4,038 | | | $ | 4,033 | | | $ | 4,207 | | | $ | 4,442 | | | $ | 5,862 | |
(1) Restructuring includes costs related to our May 2022 and November 2022 reductions in force, as well as lease termination and other restructuring expenses.
| | | | | | | | | | | | | | | | | | | | | | | | | | | | | | | | | | | | | | | | | | | | | | | | | | | | | | | | | | | | | | | | |
| | | | | | For the Three Months Ended March 31, |
| (dollars in millions, except per unit amounts) | | | | | | 2014 | | 2015 | | 2016 | | 2017 | | 2018 | | 2019 | | 2020 | | 2021 | | 2022 | | 2023 |
| Net loss | | | | | | $ | (2) | | | $ | (7) | | | $ | (17) | | | $ | (38) | | | $ | (55) | | | $ | (81) | | | $ | (184) | | | $ | (82) | | | $ | (506) | | | $ | (286) | |
| Income tax benefit | | | | | | — | | | — | | | — | | | — | | | — | | | — | | | — | | | — | | | — | | | (2) | |
| Interest expense | | | | | | — | | | — | | | 1 | | | 2 | | | 3 | | | 16 | | | 29 | | | 30 | | | 64 | | | 159 | |
| Other (income) expense, net | | | | | | — | | | — | | | — | | | — | | | 1 | | | — | | | 17 | | | (7) | | | 13 | | | (2) | |
| Depreciation and amortization expense in cost of sales | | | | | | — | | | — | | | — | | | — | | | — | | | — | | | 2 | | | 5 | | | 8 | | | 44 | |
| Depreciation and amortization expense in SG&A | | | | | | 1 | | | — | | | — | | | 1 | | | 6 | | | 7 | | | 16 | | | 22 | | | 37 | | | 49 | |
| | | | | | | | | | | | | | | | | | | | | | | | |
| Share-based compensation expense in cost of sales | | | | | | — | | | — | | | — | | | — | | | — | | | 1 | | | 1 | | | — | | | 8 | | | — | |
| Share-based compensation expense in SG&A | | | | | | — | | | 1 | | | — | | | — | | | 1 | | | 5 | | | 6 | | | 8 | | | 28 | | | 15 | |
| Root warrant revenue | | | | | | — | | | — | | | — | | | — | | | — | | | — | | | — | | | — | | | — | | | (5) | |
| Restructuring | | | | | | — | | | — | | | — | | | — | | | — | | | — | | | — | | | — | | | — | | | 4 | |
| Adjusted EBITDA | | | | | | $ | (1) | | | $ | (6) | | | $ | (16) | | | $ | (35) | | | $ | (44) | | | $ | (52) | | | $ | (113) | | | $ | (24) | | | $ | (348) | | | $ | (24) | |
| | | | | | | | | | | | | | | | | | | | | | | | |
| Total revenues | | | | | | $ | 7 | | | $ | 23 | | | $ | 73 | | | $ | 160 | | | $ | 360 | | | $ | 756 | | | $ | 1,098 | | | $ | 2,245 | | | $ | 3,497 | | | $ | 2,606 | |
| Net loss margin | | | | | | (33.2) | % | | (28.7) | % | | (23.7) | % | | (24.1) | % | | (14.6) | % | | (10.9) | % | | (16.8) | % | | (3.7) | % | | (14.5) | % | | (11.0) | % |
| Adjusted EBITDA margin | | | | | | (27.9) | % | | (24.3) | % | | (21.5) | % | | (21.3) | % | | (11.9) | % | | (6.7) | % | | (10.3) | % | | (1.1) | % | | (10.0) | % | | (0.9) | % |
| | | | | | | | | | | | | | | | | | | | | | | | |
| Gross profit | | | | | | $ | — | | | $ | — | | | $ | 4 | | | $ | 10 | | | $ | 34 | | | $ | 88 | | | $ | 138 | | | $ | 338 | | | $ | 298 | | | $ | 341 | |
| Depreciation and amortization expense in cost of sales | | | | | | — | | | — | | | — | | | — | | | — | | | — | | | 2 | | | 5 | | | 8 | | | 44 | |
| Share-based compensation expense in cost of sales | | | | | | — | | | — | | | — | | | — | | | — | | | 1 | | | 1 | | | — | | | 8 | | | — | |
| Root warrant revenue | | | | | | — | | | — | | | — | | | — | | | — | | | — | | | — | | | — | | | — | | | (5) | |
| | | | | | | | | | | | | | | | | | | | | | | | |
| Gross profit, non-GAAP | | | | | | $ | — | | | $ | — | | | $ | 4 | | | $ | 10 | | | $ | 34 | | | $ | 89 | | | $ | 141 | | | $ | 343 | | | $ | 314 | | | $ | 380 | |
| | | | | | | | | | | | | | | | | | | | | | | | |
| Retail vehicle unit sales | | | | | | 315 | | | 1,212 | | | 3,783 | | | 8,334 | | | 18,464 | | | 36,766 | | | 52,427 | | | 92,457 | | | 105,185 | | | 79,240 | |
| Total gross profit per retail unit | | | | | | $ | (28) | | | $ | 117 | | | $ | 1,046 | | | $ | 1,169 | | | $ | 1,854 | | | $ | 2,408 | | | $ | 2,640 | | | $ | 3,656 | | | $ | 2,833 | | | $ | 4,303 | |
| Total gross profit per retail unit, non-GAAP | | | | | | $ | (28) | | | $ | 117 | | | $ | 1,046 | | | $ | 1,169 | | | $ | 1,854 | | | $ | 2,429 | | | $ | 2,689 | | | $ | 3,710 | | | $ | 2,985 | | | $ | 4,796 | |
| | | | | | | | | | | | | | | | | | | | | | | | |
| SG&A | | | | | | $ | 2 | | | $ | 7 | | | $ | 20 | | | $ | 46 | | | $ | 85 | | | $ | 153 | | | $ | 276 | | | $ | 397 | | | $ | 727 | | | $ | 472 | |
| Depreciation and amortization expense in SG&A | | | | | | 1 | | | — | | | — | | | 1 | | | 6 | | | 7 | | | 16 | | | 22 | | | 37 | | | 49 | |
| Share-based compensation expense in SG&A | | | | | | — | | | 1 | | | — | | | — | | | 1 | | | 5 | | | 6 | | | 8 | | | 28 | | | 15 | |
| Restructuring | | | | | | — | | | — | | | — | | | — | | | — | | | — | | | — | | | — | | | — | | | 4 | |
| SG&A, non-GAAP | | | | | | $ | 1 | | | $ | 6 | | | $ | 20 | | | $ | 45 | | | $ | 78 | | | $ | 141 | | | $ | 254 | | | $ | 367 | | | $ | 662 | | | $ | 404 | |
| | | | | | | | | | | | | | | | | | | | | | | | |
| Retail vehicle unit sales | | | | | | 315 | | | 1,212 | | | 3,783 | | | 8,334 | | | 18,464 | | | 36,766 | | | 52,427 | | | 92,457 | | | 105,185 | | | 79,240 | |
| Total SG&A per retail unit | | | | | | $ | 6,609 | | | $ | 5,476 | | | $ | 5,454 | | | $ | 5,520 | | | $ | 4,604 | | | $ | 4,161 | | | $ | 5,265 | | | $ | 4,294 | | | $ | 6,912 | | | $ | 5,957 | |
| Total SG&A per retail unit, non-GAAP | | | | | | $ | 5,552 | | | $ | 4,844 | | | $ | 5,186 | | | $ | 5,400 | | | $ | 4,224 | | | $ | 3,835 | | | $ | 4,846 | | | $ | 3,969 | | | $ | 6,294 | | | $ | 5,098 | |
| | | | | | | | | | | | | | | | | | | | | | | | |
| | | | | | | | | | | | | | | | | | | | | | | | |