Exhibit 99.1
Annual Results
2023 Highlights
•Achieved record company-level profitability
◦Record full year net income of $150 million1
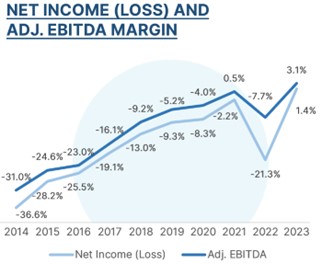
◦Record full year Adjusted EBITDA of $339 million
◦Record full year net income and Adjusted EBITDA per unit of $479 and $1,084, respectively
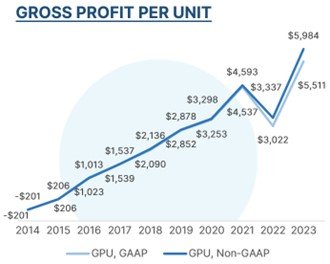
•Drove record Gross Profit Per Unit (“GPU”)
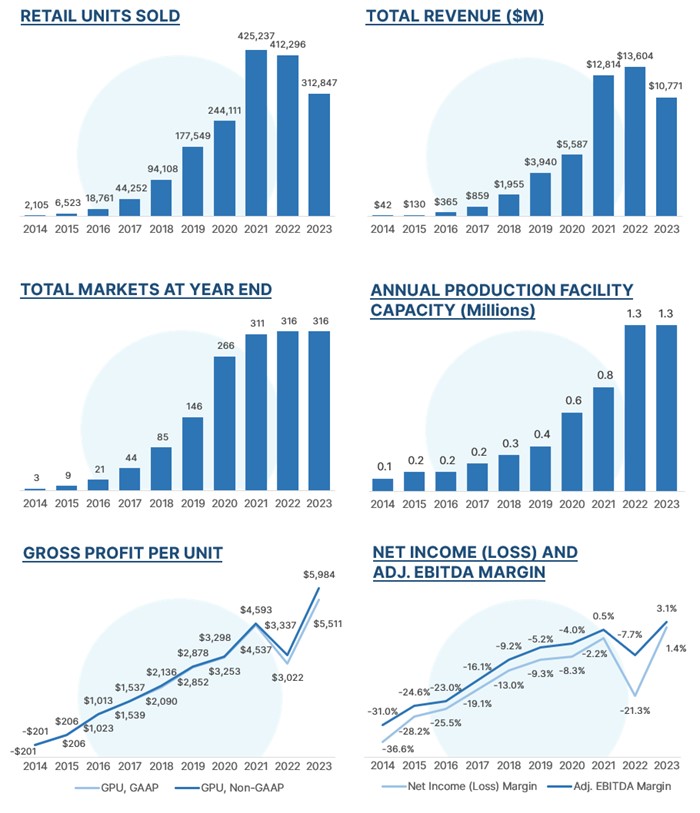
◦Record full year GAAP GPU of $5,511 and Non-GAAP GPU of $5,984
◦Set quarterly records for GAAP and Non-GAAP GPU in every quarter of 2023
•Delivered substantial cost efficiency improvements
◦Reduced GAAP SG&A by $940 million and Non-GAAP SG&A by $884 million year-over-year
◦Reduced GAAP SG&A and Non-GAAP SG&A expense per unit by 13% and 16%, respectively
◦Record low full year Advertising Expense per unit of $729
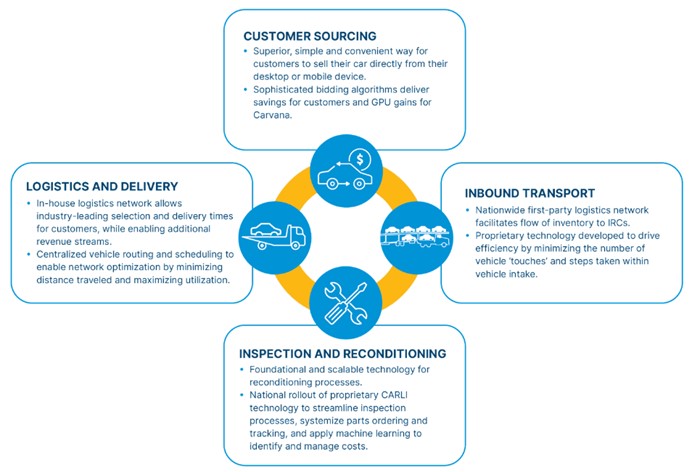
•Normalized inventory size and refined vehicle sourcing and reconditioning operations
◦Lowered average days to sale in Q4 by ~70 days from peak in Q1 2023
◦Sourced and sold over 250k retail units directly from customers in 2023
◦Reduced retail non-vehicle cost of sales per unit in Q4 by over $900 from our peak in 2022
◦Implemented proprietary CARLI technology across all inspection and reconditioning centers
•Optimized logistics network with focus on speed, quality, and cost
◦Reduced average delivery time ~25% year-over-year in Q4
◦Reduced average delivery miles ~30% year-over-year in Q4
◦Launched same day delivery in 10 markets in 2023
•Leveraged technology to improve and simplify customer experience
◦Average calls per sale down ~40% year-over-year in Q4
◦Average time per call down ~20% year-over-year in Q4
◦Average sales per customer advocate doubled year-over-year in Q4
| | |
| CUSTOMER EXPERIENCE & CULTURE |
•Customer Net Promoter Score (NPS) increased throughout 2023
•Top 10 on Forbes Best Employers list 2023 (third year in a row)
•90% of senior leadership (50 most senior employees) have been with Carvana since 2019 or earlier
1 Throughout this letter, we mention full year positive net income due to SEC disclosure rules that require equal or greater prominence of GAAP metrics with non-GAAP metrics such as Adjusted EBITDA. Our significant full year positive net income was assisted by a gain on debt extinguishment from our Q3 exchange offer, which is a non-recurring benefit.
Dear Shareholders,
2023 was an exceptional year for Carvana.
From a financial standpoint, it was the best year in our history by a meaningful margin.
We set new company records for full-year GAAP and Non-GAAP Total GPU at ~$5,500 and ~$6,000, beating our previous best in 2021 by nearly $1,000 and $1,400, respectively.
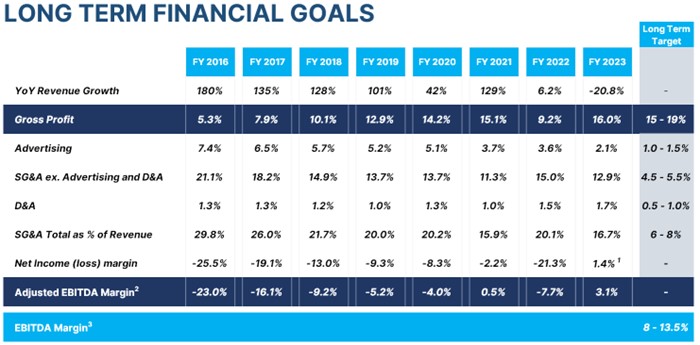
By year end, we had also removed over $1.1 billion of annualized SG&A expenses from the business since our peak in early 2022, driven primarily by our focus on efficiency.
These achievements came together to generate record Net Income and Adjusted EBITDA in FY 2023. Net Income totaled $150 million or 1.4% of revenue for the year, and Adjusted EBITDA totaled $339 million, or 3.1% of revenue. This record was not driven by growth – it was driven entirely by fundamental gains that accelerated as we remained focused on efficiency throughout the year.
Accordingly, in FY 2024, we expect these gains to lead to both growth in retail units and Adjusted EBITDA compared to FY 2023.
Carvana currently sits in its strongest position ever, for five reasons:
1.Our business is purpose-built to provide the best possible customer experiences. These experiences are what separate us. Over the last year, we have improved the efficiency of our business and we have also made our customer experiences simpler, faster, and as a result, better.
We are separating by more.
2.The financial power of our business model becomes clearer every quarter. Our unit economics are differentiated today and improving further. Our vertical integration is leading to the highest GPUs in the industry. While we do not have perfect visibility into our competitors’ fixed versus variable costs, we believe our variable costs are now at least similar to our largest competitors despite us being more deeply vertically integrated and therefore having more value-added functions than the competition. Our fixed costs per retail unit sold are clearly much higher than we expect them to be in the future.
Across every line item of our income statement, we still see significant opportunities for improvement from here.
3.Our automotive infrastructure is unmatched. We have reconditioning capacity to produce 1.3 million cars a year. We have 56 ADESA locations with capacity to recondition approximately 2 million additional units of annual volume once fully built out. We have the second largest wholesale used vehicle auction business in the US. The sum of these locations comprise ~6,500 acres with over 500,000 parking spots around the country. We have a logistics network with 33 logistics hubs that is custom built using proprietary tools to get cars directly to and from customers as quickly as possible. We pick up and deliver cars in 316 markets and can get to the door of over 80% of the US population. Growing into this infrastructure over time will reduce work per sale as we get closer on average to our customers.
We believe these dynamics lead to positive feedback for customer experiences, unit economics, and scale.
4.Competitively, we have never had more separation. Competitive separation is about (a) developing difficult to replicate capabilities that are valued by customers and that drive positive economics and (b) stacking them in a way that compounds their value. We have done exactly that. Building Carvana has required the development of an entirely new supply chain in automotive retail, an entirely new set of transaction capabilities, and an entirely new finance capability that is optimized for an e-commerce use case. The technology and operations that bind these capabilities together then require wrapping all of it in a cohesive plan that leads to an offering customers love. In this way, the whole is greater and more differentiated than the sum of its parts.
We are executing at the highest level in our history and adding to our stack.
5.We compete in a trillion-dollar market and we currently have approximately 1% market share.
The potential is clear.
The five points above bode well for an extremely bright future. Our job is to realize the enormous potential we have. We have to take these advantages and the hard-earned lessons we have gained along the way to achieve our goals of becoming the largest and most profitable automotive retailer and of buying and selling millions of cars.
That has always been and remains our plan.
Summary of Q4 2023 and 2023 Results
Q4 2023 Financial Results: All financial comparisons stated below are versus Q4 2022, unless otherwise noted. Complete financial tables appear at the end of this letter.
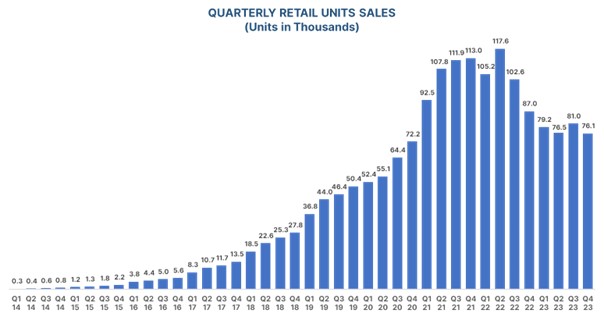
•Retail units sold totaled 76,090, a decrease of 13%
•Revenue totaled $2.424 billion, a decrease of 15%
•Total gross profit was $402 million, an increase of 108%
•Total gross profit per unit (“GPU”) was $5,283, an increase of $3,064
•Non-GAAP Total GPU was $5,730, an increase of $3,063
•Net income (loss) margin was (8.3)%, an increase from (50.8)%
•Adjusted EBITDA margin was 2.5%, an increase from (10.3)%
•Basic and diluted net earnings (loss) per Class A share was ($1.00), based on 114 million shares of Class A common stock outstanding
FY 2023 Financial Results: All financial comparisons stated below are versus 2022, unless otherwise noted. Complete financial tables appear at the end of this letter.
•Retail units sold totaled 312,847, a decrease of 24%
•Revenue totaled $10.771 billion, a decrease of 21%
•Total gross profit was $1.724 billion, an increase of 38%
•Total GPU was $5,511, an increase of $2,489
•Non-GAAP Total GPU was $5,984, an increase of $2,647
•Net income (loss) margin was 1.4%, an increase from (21.3)%
◦Net income for FY 2023 totaled $150 million and benefitted by $878 million gain on debt extinguishment as a result of our corporate debt exchange
•Adjusted EBITDA margin was 3.1%, an increase from (7.7)%
◦Adjusted EBITDA totaled $339 million
•Basic and diluted net earnings (loss) per Class A share were $4.12 and $0.75, respectively, based on 109 million and 201 million shares of Class A common stock outstanding, respectively2
Outlook
Our financial performance is beginning to clearly demonstrate the significant power of our business model.
While the macroeconomic and industry environment continues to be uncertain, looking toward the first quarter of 2024, we expect the following as long as the environment remains stable:
•Retail units sold slightly up on a year-over-year basis, and
•Adjusted EBITDA significantly above $100 million3.
Our confidence about driving significantly above $100 million of Adjusted EBITDA is driven by our results so far this quarter. We are seeing strength throughout the business and expect Retail GPU similar to Q4 (with potential for upside), sequential increases in Wholesale GPU and Other GPU, and a sequential reduction in SG&A expense per retail unit sold. This outlook does not anticipate any material one time benefits or costs.4
For FY 2024, we expect to grow retail units sold and Adjusted EBITDA compared to FY 2023.
2 See Note 14 in our Annual Report on Form 10-K for 2023 for a detailed calculation of basic and diluted net earnings (loss) per share.
3 In order to clearly demonstrate our progress and highlight the most meaningful drivers within our business, we continue to use forecasted Non-GAAP financial measures, including forecasted Adjusted EBITDA and forecasted Adjusted EBITDA per unit, as we look toward 2024. We have not provided a quantitative reconciliation of forecasted GAAP measures to forecasted Non-GAAP measures within this communication because we are unable, without making unreasonable efforts, to calculate one-time or restructuring expenses. These items could materially affect the computation of forward-looking Net Income (loss) and Net income (loss) per unit.
4 In January 2024, we acquired a portfolio of ~2,800 reconditioned used vehicles from Vroom, the majority of which we expect to sell over the next two quarters. When sold, these units will be included in retail units sold, retail revenue, and retail gross profit similar to other vehicles that we acquire and sell. Due to the relatively small size of the acquisition, we do not expect these units to have a meaningful impact on total retail units sold or Retail GPU in Q1.
Fourth Quarter Results
In Q4, we achieved record fourth quarter Total GPU and record fourth quarter Adjusted EBITDA, demonstrating the continuation of our strong results throughout 2023.
Retail units sold declined by 6% sequentially, in line with our outlook, and better than the industry on a sequential basis.
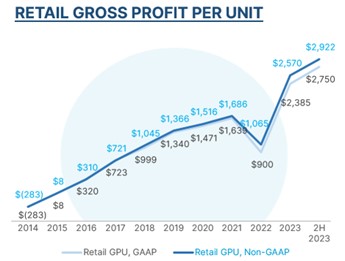
We set a new company record for GAAP and Non-GAAP Retail GPU at $2,812 and $2,970, respectively. This strength comes despite higher-than-normal fourth quarter retail depreciation. Our strength in Retail GPU continues to be driven by fundamental gains in several areas, including non-vehicle cost of sales, customer sourcing, inventory turn times, and revenues from additional services, highlighting the value of our vertically-integrated retail model.
We set a new record for fourth quarter Adjusted EBITDA in Q4 2023. That said, we believe our fundamental progress is even greater than our Q4 performance suggests for several reasons.
First, the fourth quarter is typically the weakest quarter for industry-wide used vehicle volume, retail and wholesale depreciation rates, and wholesale auction volume. These seasonal elements typically negatively impact retail units sold, Retail GPU, and Wholesale GPU in Q4.
Second, we sold ~$200 million less loan principal than we originated in Q4, primarily driven by the timing of loan sales within the quarter. This negatively impacted Other GPU, other things being equal.
Third, in line with industry-wide loan loss increases, we increased the expected losses on our loans in Q4, leading to lower premium on loans sold in the quarter. We have since passed through rate changes and credit tightening that we expect to offset higher loss expectations, leading to an expected increase in loan sale premium in Q1 into the Q2 and Q3 2023 area.
Finally, GAAP and Non-GAAP SG&A expenses increased by ~$6 million sequentially, leading to a sequential increase in SG&A expense per retail unit sold. This sequential increase was driven by a $4 million non-recurring benefit in Q3 and $4 million of non-recurring operations expenses in Q4.
Significant Progress on Our Three-Step Plan
One year ago, we introduced our Three-Step Plan for driving positive free cash flow. Based on our progress in 2023 and outlook for Q1 2024, this plan has proven to be highly successful at driving the business to profitability.
Step 1 of our plan was to drive the business to positive Adjusted EBITDA. This step focused on normalizing staffing, inventory, and advertising levels for the prevailing macroeconomic and industry environment, while also shifting our operational and technological focus to profitability and efficiency initiatives. By Q2 2023, we had removed over $1.1 billion in annualized expenses and achieved our goal of generating positive Adjusted EBITDA.
Step 2 of our plan is driving the business to significant Adjusted EBITDA per retail unit sold (also referred to as positive unit economics). This step has focused on driving fundamental gains in GPU and operational efficiency, flexibility, and scalability through process and technological improvements to increase profitability and provide a strong foundation for profitable growth.
Our efforts in Step 2 are working. Our outlook for Q1 calls for significantly more than $1,200 of Adjusted EBITDA per unit3 (with no expected material one time benefits or costs), despite carrying significant excess capacity and the resulting higher-than-normalized overhead expenses. Additionally, we still see meaningful opportunities to drive incremental fundamental efficiency gains with continued focus on Step 2 type initiatives.
Looking further forward, we expect Step 2 and Step 3 to start to blend together so that we can continue to work toward fundamental efficiency gains while also layering in initiatives that are more focused on growth. As this blend of Step 2 and Step 3 progresses, we expect to enter the much longer phase of driving profitable growth in pursuit of our goal of becoming the largest and most profitable automotive retailer and buying and selling millions of cars per year.
Vertically Integrated Platform Driving Strong Retail GPU
Over the past year, our shift in priorities and focus on driving operational efficiencies has achieved significant gains throughout the business that we believe will enable profitable growth in the future.
One area of the business where we have driven the biggest fundamental gains is Retail GPU. We recorded ~$750 higher GAAP Retail GPU and ~$900 higher Non-GAAP Retail GPU in FY 2023 compared to FY 2021, our prior high watermark. Compared to FY 2021, improvements to Retail GPU in the 2H 2023 were even greater with ~$1,100 higher GAAP GPU and ~$1,200 higher Non-GAAP Retail GPU.
Our strong Retail GPU results are driven by sustainable fundamental gains in our vertically-integrated and technology-driven platform for buying and selling vehicles.
Note on Comparing Carvana Retail GPU to Industry Peers
Over the past three quarters, we have produced Retail GPUs that are generally above historical precedents set by industry peers. When comparing our Retail GPU to industry peers, we believe there are certain definitional differences to consider:
1.Non-Cash Expenses: Due to our focus on driving positive cash flow, we report Non-GAAP Retail GPU, which excludes non-cash depreciation and amortization and share-based compensation expenses. We believe industry peers generally report on GAAP Retail GPU, which includes these non-cash expenses. Non-cash expenses in our retail cost of sales totaled ~$150 per retail unit in Q4.
2.Limited Warranty Expenses: We include expenses associated with our post-sale limited warranty in SG&A expense, and we believe industry peers generally include these expenses in cost of sales. Limited warranty and related expenses in our Other SG&A expense totaled ~$350 per retail unit in Q4.
3.Outbound Logistics Expenses: We include expenses associated with outbound logistics in SG&A expense, and we believe industry peers may include these expenses in cost of sales. We do not have access to peer data that allows us to quantify this impact on a comparable basis.
In aggregate, we believe the items outlined above are useful to note when comparing our Retail GPU to that of industry peers.
Management Objectives
Consistent with the priorities shared in the last several letters, our current focus remains centered on increasing efficiency and driving positive free cash flow. However, this letter maintains our historical format built around the three objectives (1) Grow Retail Units and Revenue; (2) Increase Total Gross Profit Per Unit; and (3) Demonstrate Operating Leverage, to discuss our key results.
1 Net Income margin in FY 2023 benefited from a one-time gain on debt extinguishment of ~$878 million.
2 Adjusted EBITDA is defined as net income (loss) plus income tax provision, interest expense, other (income) expense, net, depreciation and amortization in cost of sales and SG&A, goodwill impairment, share-based compensation including the CEO Milestone Gift in cost of sales and SG&A, and restructuring costs, minus revenue related to our Root warrants and gain on debt extinguishment. Adjusted EBITDA margin is Adjusted EBITDA as a percentage of total revenues. For additional information on Adjusted EBITDA and other Non-GAAP financial metrics referenced in this letter, please see the financial tables at the end of this letter and our Q4 2023 supplemental financial tables posted on our investor relations website.
3 EBITDA Margin is calculated as net income (loss) plus income tax provision, interest expense, and depreciation and amortization, divided by revenues.
Objective #1: Grow Retail Units and Revenue
Retail units sold totaled 76,090 in Q4, a sequential decrease of 6%. Revenue was $2.424 billion in Q4, a sequential decrease of 13%, primarily due to fewer retail units sold and lower average selling prices for both retail and wholesale vehicles.
Objective #2: Increase Total Gross Profit Per Unit
Year-over-year and sequential changes in Total GPU in Q4 2023 were driven by a variety of factors described below in more detail.
For Q4 2023
•Total
◦Total GPU was $5,283 vs. $2,219 in Q4 2022 and $5,952 in Q3 2023.
◦Non-GAAP Total GPU was $5,730 vs. $2,667 in Q4 2022 and $6,396 in Q3 2023.5
•Retail
◦Retail GPU was $2,812 vs. $425 in Q4 2022 and $2,692 in Q3 2023.
◦Non-GAAP Retail GPU was $2,970 vs. $632 in Q4 2022 and $2,877 in Q3 2023.
◦The sequential increase in Retail GPU was primarily driven by wider spreads between wholesale and retail market prices, lower average days to sale, and lower reconditioning and inbound transport costs, partially offset by higher retail depreciation rates.
◦Year-over-year changes in Retail GPU were primarily driven by the same factors, as well as a $598 per retail unit inventory allowance adjustment that negatively impacted Q4 2022.
•Wholesale
◦Wholesale GPU was $526 vs. $230 in Q4 20226 and $618 in Q3 2023.
◦Non-GAAP Wholesale GPU was $881 vs. $551 in Q4 2022 and $951 in Q3 2023.
◦Wholesale Vehicle
▪Wholesale Vehicle GPU was $368 vs. $184 in Q4 2022 and $347 in Q3 2023.
▪Non-GAAP Wholesale Vehicle GPU was $394 vs. $218 in Q4 2022 and $372 in Q3 2023.
▪Sequential improvement in Wholesale Vehicle GPU was driven by higher profit per wholesale vehicle partially offset by a decrease in the ratio of wholesale units sold to retail units sold.
5 Consistent with the last three quarters of financial reporting, we are presenting two metrics for total GPU and for each GPU component: GAAP gross profit per unit and non-GAAP gross profit per unit, which excludes the impacts of depreciation and amortization, share-based compensation, Root warrant revenue, and restructuring costs. For additional information, please see our Q4 2023 supplemental financial tables.
6 Wholesale gross profit and wholesale GPU includes gross profit from the sale of wholesale marketplace vehicles at our acquired ADESA locations.
▪Year-over-year improvement was primarily driven by a higher ratio of wholesale units sold to retail units sold, lower inbound transport costs, and a lower wholesale inventory allowance adjustment.
◦Wholesale Marketplace
▪Wholesale Marketplace GPU was $158 vs. $46 in Q4 2022 and $271 in Q3 2023.
▪Non-GAAP Wholesale Marketplace GPU was $487 vs. $333 in Q4 2022 and $579 in Q3 2023.
▪Sequential changes in Wholesale Marketplace GPU were primarily driven by lower seasonal volume in Q4, while year-over-year changes were primarily driven by increased marketplace unit volume in Q4 2023 compared to Q4 2022.
•Other
◦Other GPU was $1,945 vs. $1,564 in Q4 2022 and $2,642 in Q3 2023.
◦Non-GAAP Other GPU was $1,879 vs. $1,483 in Q4 2022 and $2,568 in Q3 2023.
◦The sequential decrease in Other GPU was primarily driven by selling ~$200 million less principal than we originated in Q4 and a lower spread between our origination interest rates and lending costs, partially offset by higher ancillary product revenue.
▪In addition, Other GPU in Q3 2023 benefitted from ~$400 per unit due to selling more principal than we originated.
◦Year-over-year improvement in Other GPU was primarily influenced by the higher volume of loans sold in Q4 2023 than in Q4 2022. Year-over-year improvement was also influenced by higher origination rates relative to benchmark interest rates, higher finance penetration, partially offset by a lower spread between our origination interest rates and lending costs.
For FY 2023
•Total
◦Total GPU was $5,511 vs. $3,022 in 2022. Total GPU increased $2,489 year-over-year.
◦Total Non-GAAP GPU was $5,984 vs. $3,337 in 2022. Total Non-GAAP GPU increased $2,647 year-over-year.
Objective #3: Demonstrate Operating Leverage
On a sequential basis, Q4 net income margin and Adjusted EBITDA margin decreased by 35.0% and 2.8%, respectively. The sequential decreases in both net income margin and Adjusted EBITDA margin were driven by seasonal factors and other one-time benefits recognized in Q3, including a gain on debt extinguishment benefit to net income margin.
On a year-over-year basis, Q4 2023 net income margin and Adjusted EBITDA margin improved by 42.5% and 12.8%, respectively, each driven by our company-wide focus on improving profitability as described earlier in this letter as well as the absence of one-time negative impacts present in our Q4 2022 results, specifically, material inventory allowance adjustments and goodwill impairment charges.
The Carvana Operations portion of SG&A expense totaled $2,024 per retail unit sold in Q4, a sequential increase compared to $1,951 in Q3. This increase was primarily driven by $4 million of non-recurring expenses in Q4.
The Overhead portion of SG&A expense totaled $150 million in Q4, in line with our quarterly run-rate of $145 to $150 million, a sequential increase of $9 million compared to Q3. This increase was primarily driven by $4 million of non-recurring benefits in Q3 and several miscellaneous expenses in Q4.
For Q4 2023, as a percentage of revenue:
•All components of SG&A increased sequentially. Total SG&A increased by 2.5% and non-advertising SG&A increased by 2.2%. Other SG&A increased by 1.1%, compensation and benefits increased by 0.9%, advertising increased by 0.4%, and both market occupancy and logistics increased by 0.1%.
•Year-over-year, all components of SG&A improved. Total SG&A decreased by 4.2% and non-advertising SG&A decreased by 3.4%. Other SG&A decreased by 1.8%, compensation and benefits decreased 0.8%, advertising and logistics both decreased by 0.7%, and market occupancy decreased by 0.1%.
For FY 2023, as a percentage of revenue:
•Year-over-year, all components of SG&A improved or were flat. Total SG&A decreased by 3.4% and non-advertising SG&A decreased by 1.9%, advertising decreased by 1.5%, compensation and benefits decreased by 0.8%, logistics decreased by 0.6%, other SG&A decreased by 0.5%, and market occupancy was flat.
Summary
Below is the closing we put in our Q1 2022 shareholder letter:
“The first quarter was challenging.
As we have before, we will adjust to the new environment while also keeping our eyes on our long-term goals.
Difficult environments sharpen us. They reveal our weaknesses and force new perspectives. In that way, they present new opportunities. This environment is no different. It is an opportunity.
While the quarter was undoubtedly a step backwards in our financial results, we will work hard to make it the marker of an even larger step forward in achieving our goal of becoming the largest and most profitable automotive retailer.”
We are incredibly proud of the last 2 years. We have adjusted. We have kept our eyes on our long-term goals. We are getting sharper. That said, we still have a long way to go.
We plan to become the largest and most profitable automotive retailer and buy and sell millions of cars per year. So we need to keep marching. And we will.
The march continues,
Ernie Garcia, III, Chairman and CEO
Mark Jenkins, CFO
Appendix
Conference Call Details
Carvana will host a conference call today, February 22, 2024, at 5:30 p.m. EST (2:30 p.m. PST) to discuss financial results. To participate in the live call, analysts and investors should dial (833) 255-2830 or (412) 902-6715. A live audio webcast of the conference call along with supplemental financial information will also be accessible on the company's website at investors.carvana.com. Following the webcast, an archived version will also be available on the Investor Relations section of the company’s website. A telephonic replay of the conference call will be available until Thursday, February, 29, 2024, by dialing (877) 344-7529 or (412) 317-0088 and entering passcode 6174832#.
Forward Looking Statements
This letter contains forward-looking statements within the meaning of the Private Securities Litigation Reform Act of 1995. These forward-looking statements reflect Carvana’s current expectations and projections with respect to, among other things, its financial condition, results of operations, plans, objectives, strategy, future performance, and business. These statements may be preceded by, followed by or include the words "aim," "anticipate," "believe," "estimate," "expect," "forecast," "intend," "likely," "outlook," "plan," "potential," "project," "projection," "seek," "can," "could," "may," "should," "would," "will," the negatives thereof and other words and terms of similar meaning.
Forward-looking statements include all statements that are not historical facts, including expectations regarding our operational and efficiency initiatives, our strategy, expected gross profit per unit, forecasted results, and expectations regarding the effect of Carvana’s actions to improve performance. Such forward-looking statements are subject to various risks and uncertainties. Accordingly, there are or will be important factors that could cause actual outcomes or results to differ materially from those indicated in these statements. Among these factors are risks related to: the larger automotive ecosystem, including consumer demand, global supply chain challenges, and other macroeconomic issues; our ability to raise additional capital and our substantial indebtedness; our history of losses and ability to maintain profitability in the future; our ability to effectively manage our historical rapid growth; our ability to maintain customer service quality and reputational integrity and enhance our brand; the seasonal and other fluctuations in our quarterly operating results; our relationship with DriveTime and its affiliates; our ability to compete in the highly competitive industry in which we participate; the changes in prices of new and used vehicles; our ability to acquire desirable inventory; our ability to sell our inventory expeditiously; and the other risks identified under the “Risk Factors” section in our Annual Report on Form 10-K for the fiscal year ended December 31, 2023.
There is no assurance that any forward-looking statements will materialize. You are cautioned not to place undue reliance on forward-looking statements, which reflect expectations only as of this date. Carvana does not undertake any obligation to publicly update or review any forward-looking statement, whether as a result of new information, future developments, or otherwise.
Use of Non-GAAP Financial Measures
As appropriate, we supplement our results of operations determined in accordance with U.S. generally accepted accounting principles (“GAAP”) with certain non-GAAP financial measurements that are used by management, and which we believe are useful to investors, as supplemental operational measurements to evaluate our financial performance. These measurements should not be considered in isolation or as a substitute for reported GAAP results because they may include or exclude certain items as compared to similar GAAP-based measurements, and such measurements may not be comparable to similarly-titled measurements reported by other companies. Rather, these measurements should be considered as an additional way of viewing aspects of our operations that provide a more complete understanding of our business. We strongly encourage investors to review our consolidated financial statements included in publicly filed reports in their entirety and not rely solely on any one, single financial measurement or communication.
Reconciliations of our non-GAAP measurements to their most directly comparable GAAP-based financial measurements are included at the end of this letter.
Investor Relations Contact Information: Mike McKeever, investors@carvana.com
CARVANA CO. AND SUBSIDIARIES
CONSOLIDATED BALANCE SHEETS
(In millions, except number of shares, which are reflected in thousands, and par values) | | | | | | | | | | | |
| December 31, |
| 2023 | | 2022 |
| ASSETS | | | |
| Current assets: | | | |
| Cash and cash equivalents | $ | 530 | | | $ | 434 | |
| Restricted cash | 64 | | | 194 | |
| Accounts receivable, net | 266 | | | 253 | |
| Finance receivables held for sale, net | 807 | | | 1,334 | |
| Vehicle inventory | 1,150 | | | 1,876 | |
| Beneficial interests in securitizations | 366 | | | 321 | |
| Other current assets, including $3 and $6, respectively, due from related parties | 138 | | | 182 | |
| Total current assets | 3,321 | | | 4,594 | |
| Property and equipment, net | 2,982 | | | 3,244 | |
| Operating lease right-of-use assets, including $10 and $14, respectively, from leases with related parties | 455 | | | 536 | |
| Intangible assets, net | 52 | | | 70 | |
| | | |
| Other assets, including $0 and $1, respectively, due from related parties | 261 | | | 254 | |
| Total assets | $ | 7,071 | | | $ | 8,698 | |
| LIABILITIES & STOCKHOLDERS' EQUITY (DEFICIT) | | | |
| Current liabilities: | | | |
| Accounts payable and accrued liabilities, including $7 and $16, respectively, due to related parties | $ | 596 | | | $ | 777 | |
| Short-term revolving facilities | 668 | | | 1,534 | |
| Current portion of long-term debt | 189 | | | 201 | |
| Other current liabilities, including $3 and $4, respectively, from leases with related parties | 83 | | | 80 | |
| Total current liabilities | 1,536 | | | 2,592 | |
| Long-term debt, excluding current portion | 5,416 | | | 6,574 | |
| Operating lease liabilities, excluding current portion, including $7 and $9, respectively, from leases with related parties | 433 | | | 507 | |
| Other liabilities, including $11 and $0, respectively, due to related parties | 70 | | | 78 | |
| Total liabilities | 7,455 | | | 9,751 | |
| Commitments and contingencies | | | |
| | | |
| Stockholders' deficit: | | | |
| | | |
| | | |
| Preferred stock, $0.01 par value - 50,000 shares authorized; none issued and outstanding as of December 31, 2023 and 2022, respectively | — | | | — | |
| Class A common stock, $0.001 par value - 500,000 shares authorized, 114,239 and 106,037 shares issued and outstanding as of December 31, 2023 and 2022, respectively | — | | | — | |
| Class B common stock, $0.001 par value - 125,000 shares authorized, 85,619 and 82,900 shares issued and outstanding as of December 31, 2023 and 2022, respectively | — | | | — | |
| Additional paid in capital | 1,869 | | | 1,558 | |
| Accumulated deficit | (1,626) | | | (2,076) | |
| Total stockholders' equity (deficit) attributable to Carvana Co. | 243 | | | (518) | |
| Non-controlling interests | (627) | | | (535) | |
| Total stockholders' deficit | (384) | | | (1,053) | |
| Total liabilities & stockholders' deficit | $ | 7,071 | | | $ | 8,698 | |
CARVANA CO. AND SUBSIDIARIES
CONSOLIDATED STATEMENTS OF OPERATIONS
(In millions, except number of shares, which are reflected in thousands, and per share amounts)
| | | | | | | | | | | | | | | | | | | | | | | |
| Three Months Ended December 31, | | Years Ended December 31, |
| 2023 | | 2022 | | 2023 | | 2022 |
| | | | | | | |
| (unaudited) | | | | |
| Sales and operating revenues: | | | | | | | |
| Retail vehicle sales, net | $ | 1,777 | | | $ | 2,068 | | | $ | 7,514 | | | $ | 10,254 | |
| Wholesale sales and revenues, including $5, $5, $19, and $32, respectively, from related parties | 499 | | | 633 | | | 2,504 | | | 2,609 | |
| Other sales and revenues, including $41, $39, $145, and $176, respectively, from related parties | 148 | | | 136 | | | 753 | | | 741 | |
| Net sales and operating revenues | 2,424 | | | 2,837 | | | 10,771 | | | 13,604 | |
| Cost of sales, including $1, $2, $4, and $22, respectively, to related parties | 2,022 | | | 2,644 | | | 9,047 | | | 12,358 | |
| Gross profit | 402 | | | 193 | | | 1,724 | | | 1,246 | |
| Selling, general and administrative expenses, including $7, $8, $33, and $33, respectively, to related parties | 439 | | | 632 | | | 1,796 | | | 2,736 | |
| Goodwill impairment | — | | | 847 | | | — | | | 847 | |
| Interest expense | 165 | | | 153 | | | 632 | | | 486 | |
| Gain on debt extinguishment | — | | | — | | | (878) | | | — | |
| Other (income) expense, net | — | | | 2 | | | (1) | | | 70 | |
| Net income (loss) before income taxes | (202) | | | (1,441) | | | 175 | | | (2,893) | |
| Income tax provision (benefit) | (2) | | | — | | | 25 | | | 1 | |
| Net income (loss) | (200) | | | (1,441) | | | 150 | | | (2,894) | |
| Net loss attributable to non-controlling interests | (86) | | | (635) | | | (300) | | | (1,307) | |
| Net income (loss) attributable to Carvana Co. | $ | (114) | | | $ | (806) | | | $ | 450 | | | $ | (1,587) | |
| | | | | | | |
| Net earnings (loss) per share of Class A common stock - basic | $ | (1.00) | | | $ | (7.61) | | | $ | 4.12 | | | $ | (15.74) | |
| Net earnings (loss) per share of Class A common stock - diluted | $ | (1.00) | | | $ | (7.61) | | | $ | 0.75 | | | $ | (15.74) | |
| | | | | | | |
Weighted-average shares of Class A common stock outstanding - basic (1) | 114,110 | | | 105,909 | | | 109,323 | | | 100,828 | |
| Weighted-average shares of Class A common stock outstanding - diluted | 114,110 | | | 105,909 | | | 200,578 | | | 100,828 | |
(1) Weighted-average shares of Class A common stock outstanding - basic have been adjusted for unvested restricted stock awards.
CARVANA CO. AND SUBSIDIARIES
CONSOLIDATED STATEMENTS OF CASH FLOWS
(In millions) | | | | | | | | | | | | | | | | | |
| For the Years Ended December 31, |
| 2023 | | 2022 | | 2021 |
| Cash Flows from Operating Activities: | | | | | |
| Net income (loss) | $ | 150 | | | $ | (2,894) | | | $ | (287) | |
| Adjustments to reconcile net income (loss) to net cash provided by (used in) operating activities: | | | | | |
| Depreciation and amortization expense | 352 | | | 261 | | | 105 | |
| Goodwill impairment | — | | | 847 | | | — | |
| Equity-based compensation expense | 73 | | | 69 | | | 39 | |
| Loss on disposal of property and equipment | 8 | | | 14 | | | 1 | |
| Gain on debt extinguishment | (878) | | | — | | | — | |
| Payment-in-kind interest expense | 184 | | | — | | | — | |
| Provision for bad debt and valuation allowance | 38 | | | 23 | | | 28 | |
| Amortization and write-off of debt issuance costs | 24 | | | 27 | | | 11 | |
| | | | | |
| Unrealized (gain) loss on warrants to acquire Root Class A common stock | (3) | | | 80 | | | 24 | |
| Unrealized gain on beneficial interests in securitizations | (14) | | | (6) | | | (7) | |
| Changes in finance receivable related assets: | | | | | |
| Originations of finance receivables | (6,041) | | | (7,214) | | | (7,306) | |
| Proceeds from sale of finance receivables, net | 6,594 | | | 6,297 | | | 7,391 | |
| Gain on loan sales | (434) | | | (411) | | | (717) | |
| Principal payments received on finance receivables held for sale | 186 | | | 190 | | | 206 | |
| | | | | |
| Other changes in assets and liabilities: | | | | | |
| Vehicle inventory | 711 | | | 1,354 | | | (2,086) | |
| Accounts receivable | (22) | | | 145 | | | (148) | |
| Other assets | 39 | | | (83) | | | (105) | |
| Accounts payable and accrued liabilities | (166) | | | (46) | | | 247 | |
| Operating lease right-of-use assets | 81 | | | 21 | | | (213) | |
| Operating lease liabilities | (71) | | | 15 | | | 223 | |
| Other liabilities | (8) | | | (13) | | | — | |
| Net cash provided by (used in) operating activities | 803 | | | (1,324) | | | (2,594) | |
| Cash Flows from Investing Activities: | | | | | |
| Purchases of property and equipment | (87) | | | (512) | | | (557) | |
| Proceeds from disposal of property and equipment | 72 | | | 44 | | | — | |
| Payments for acquisitions, net of cash acquired | (7) | | | (2,196) | | | — | |
| Purchases of investments | — | | | — | | | (126) | |
| Principal payments received on and proceeds from sale of beneficial interests | 53 | | | 81 | | | 56 | |
| Net cash provided by (used in) investing activities | 31 | | | (2,583) | | | (627) | |
| Cash Flows from Financing Activities: | | | | | |
| Proceeds from short-term revolving facilities | 6,709 | | | 12,982 | | | 14,600 | |
| Payments on short-term revolving facilities | (7,575) | | | (13,501) | | | (12,587) | |
| Proceeds from issuance of long-term debt | 132 | | | 3,435 | | | 1,650 | |
| Payments on long-term debt | (503) | | | (165) | | | (73) | |
| | | | | |
| | | | | |
| Payments of debt issuance costs | (69) | | | (75) | | | (24) | |
| Net proceeds from issuance of Class A common stock and LLC Units | 453 | | | 1,227 | | | — | |
| | | | | |
| Proceeds from equity-based compensation plans | — | | | 4 | | | 2 | |
| Tax withholdings related to restricted stock units and awards | (15) | | | (8) | | | (40) | |
| | | | | |
| Net cash (used in) provided by financing activities | (868) | | | 3,899 | | | 3,528 | |
| Net (decrease) increase in cash, cash equivalents and restricted cash | (34) | | | (8) | | | 307 | |
| Cash, cash equivalents, and restricted cash at beginning of period | 628 | | | 636 | | | 329 | |
| Cash, cash equivalents, and restricted cash at end of period | $ | 594 | | | $ | 628 | | | $ | 636 | |
CARVANA CO. AND SUBSIDIARIES
OUTSTANDING SHARES AND LLC UNITS
(Unaudited)
The following table presents potentially dilutive securities, as of the end of the period, excluded from the computations of diluted net earnings (loss) per share of Class A common stock for the three months and years ended December 31, 2023 and 2022, respectively:
| | | | | | | | | | | | | | | | | | | | | | | |
| Three Months Ended December 31, | | Years Ended December 31, |
| 2023 | | 2022 | | 2023 | | 2022 |
| | | | | | | |
| (in thousands) |
Options (1) | 956 | | | 1,265 | | | 976 | | | 1,265 | |
Restricted Stock Units and Awards (1) | 709 | | | 79 | | | 1,308 | | | 64 | |
Class A Units (2) | 85,682 | | | 82,963 | | | — | | | 82,963 | |
Class B Units (2) | 1,630 | | | 832 | | | — | | | 1,559 | |
(1) Represents number of instruments outstanding at the end of the period that were evaluated under the treasury stock method for potentially dilutive effects and were determined to be anti-dilutive.
(2) Represents the weighted-average as-converted LLC units that were evaluated under the if-converted method for potentially dilutive effects and were determined to be anti-dilutive.
CARVANA CO. AND SUBSIDIARIES
RESULTS OF OPERATIONS
(Unaudited)
| | | | | | | | | | | | | | | | | | | | | | | | | | | | | | | | | | | | | | | | | |
| Three Months Ended December 31, | | | | Years Ended
December 31, | | |
| 2023 | | | | | | | | 2022 | | Change | | 2023 | | 2022 | | Change |
| | | | | | | | | | | | | | | | | |
| (dollars in millions, except per unit amounts) | | | | (dollars in millions, except per unit amounts) | | |
| | | | | | | | | |
| Net sales and operating revenues: | | | | | | | | | | | | | | | | | |
| Retail vehicle sales, net | $ | 1,777 | | | | | | | | | $ | 2,068 | | | (14.1) | % | | $ | 7,514 | | | $ | 10,254 | | | (26.7) | % |
Wholesale sales and revenues (1) | 499 | | | | | | | | | 633 | | | (21.2) | % | | 2,504 | | | 2,609 | | | (4.0) | % |
Other sales and revenues (2) | 148 | | | | | | | | | 136 | | | 8.8 | % | | 753 | | | 741 | | | 1.6 | % |
| Total net sales and operating revenues | $ | 2,424 | | | | | | | | | $ | 2,837 | | | (14.6) | % | | $ | 10,771 | | | $ | 13,604 | | | (20.8) | % |
| Gross profit: | | | | | | | | | | | | | | | | | |
Retail vehicle gross profit (3) | $ | 214 | | | | | | | | | $ | 37 | | | 478.4 | % | | $ | 746 | | | $ | 371 | | | 101.1 | % |
Wholesale gross profit (1) | 40 | | | | | | | | | 20 | | | 100.0 | % | | 225 | | | 134 | | | 67.9 | % |
Other gross profit (2) | 148 | | | | | | | | | 136 | | | 8.8 | % | | 753 | | | 741 | | | 1.6 | % |
| Total gross profit | $ | 402 | | | | | | | | | $ | 193 | | | 108.3 | % | | $ | 1,724 | | | $ | 1,246 | | | 38.4 | % |
| | | | | | | | | | | | | | | | | |
| | | | | | | | | | | | | | | | | |
| | | | | | | | | | | | | | | | | |
| | | | | | | | | | | | | | | | | |
| | | | | | | | | | | | | | | | | |
| | | | | | | | | | | | | | | | | |
| | | | | | | | | | | | | | | | | |
| | | | | | | | | | | | | | | | | |
| | | | | | | | | | | | | | | | | |
| Unit sales information: | | | | | | | | | | | | | | | | | |
| Retail vehicle unit sales | 76,090 | | | | | | | | | 86,977 | | | (12.5) | % | | 312,847 | | | 412,296 | | | (24.1) | % |
| Wholesale vehicle unit sales | 34,096 | | | | | | | | | 39,918 | | | (14.6) | % | | 156,545 | | | 193,260 | | | (19.0) | % |
| Per unit selling prices: | | | | | | | | | | | | | | | | | |
| Retail vehicles | $ | 23,354 | | | | | | | | | $ | 23,776 | | | (1.8) | % | | $ | 24,018 | | | $ | 24,870 | | | (3.4) | % |
Wholesale vehicles (4) | $ | 8,623 | | | | | | | | | $ | 11,123 | | | (22.5) | % | | $ | 10,527 | | | $ | 10,965 | | | (4.0) | % |
| Per retail unit gross profit: | | | | | | | | | | | | | | | | | |
Retail vehicle gross profit (5) | $ | 2,812 | | | | | | | | | $ | 425 | | | 561.6 | % | | $ | 2,385 | | | $ | 900 | | | 165.0 | % |
| Wholesale gross profit | 526 | | | | | | | | | 230 | | | 128.7 | % | | 719 | | | 325 | | | 121.2 | % |
| Other gross profit | 1,945 | | | | | | | | | 1,564 | | | 24.4 | % | | 2,407 | | | 1,797 | | | 33.9 | % |
| Total gross profit | $ | 5,283 | | | | | | | | | $ | 2,219 | | | 138.1 | % | | $ | 5,511 | | | $ | 3,022 | | | 82.4 | % |
| Per wholesale unit gross profit: | | | | | | | | | | | | | | | | | |
Wholesale vehicle gross profit (6) | $ | 821 | | | | | | | | | $ | 401 | | | 104.7 | % | | $ | 888 | | | $ | 580 | | | 53.1 | % |
| Wholesale marketplace: | | | | | | | | | | | | | | | | | |
| Wholesale marketplace units sold | 208,370 | | | | | | | | | 180,389 | | | 15.5 | % | | 871,200 | | | 485,333 | | | NM |
| Wholesale marketplace revenues | $ | 205 | | | | | | | | | $ | 189 | | | 8.5 | % | | $ | 856 | | | $ | 490 | | | NM |
Wholesale marketplace gross profit (7) | $ | 12 | | | | | | | | | $ | 4 | | | 200.0 | % | | $ | 86 | | | $ | 22 | | | NM |
| | | | | | | | |
| | | | | | | | |
| | | | | | | | |
| | | | | | |
(1) Includes $5, $5, $19, and $32, respectively, of wholesale sales and revenues from related parties.
(2) Includes $41, $39, $145, and $176, respectively, of other sales and revenues from related parties.
(3) Includes $0, $0, $0 and $16, respectively, of share-based compensation expense related to a commitment by the Company’s CEO, Ernest Garcia III to grant all employees as of January 5, 2022, 23 shares of Class A common stock from his personal
shareholdings once employees reach their two-year employment anniversary (the “CEO Milestone Gift” or the “Gift”).
(4) Excludes wholesale marketplace revenues and wholesale marketplace units sold.
(5) Includes $0, $0, $0 and $39, respectively, of share-based compensation expense related to the CEO Milestone Gift.
(6) Excludes wholesale marketplace gross profit and wholesale marketplace units sold.
(7) Includes $25, $25, $102 and $62, respectively, of depreciation and amortization expense.
NM = Not Meaningful (For the twelve months ended December 31, 2022, only includes wholesale marketplace data from the date of the ADESA Acquisition of May 9, 2022.)
CARVANA CO. AND SUBSIDIARIES
COMPONENTS OF SG&A
(Unaudited)
| | | | | | | | | | | | | | | | | | | | | | | | | | | | | | | | | | | |
| | | | | | | Three Months Ended |
| | | | | | | Dec 31, 2022 | | Mar 31, 2023 | | Jun 30, 2023 | | Sep 30, 2023 | | Dec 31, 2023 |
| | | | | | | | | | | | | | | |
| | | | | | | (in millions) |
Compensation and benefits (1) | | | | | | | $ | 212 | | | $ | 177 | | | $ | 163 | | | $ | 160 | | | $ | 162 | |
CEO Milestone Gift (2) | | | | | | | — | | | (1) | | | — | | | — | | | — | |
| Advertising | | | | | | | 87 | | | 56 | | | 57 | | | 56 | | | 59 | |
Market occupancy (3) | | | | | | | 23 | | | 21 | | | 18 | | | 16 | | | 16 | |
Logistics (4) | | | | | | | 51 | | | 35 | | | 29 | | | 29 | | | 26 | |
Other (5) | | | | | | | 259 | | | 184 | | | 185 | | | 172 | | | 176 | |
| Total | | | | | | | $ | 632 | | | $ | 472 | | | $ | 452 | | | $ | 433 | | | $ | 439 | |
(1) Compensation and benefits includes all payroll and related costs, including benefits, payroll taxes, and equity-based compensation, except those related to preparing vehicles for sale, which are included in cost of sales, and those related to the development of software products for internal use, which are capitalized to software and depreciated over the estimated useful lives of the related assets.
(2) CEO Milestone Gift includes all equity-based compensation and payroll tax costs associated with the Gift, except those Gift costs related to preparing vehicles for sale, which are included in cost of sales.
(3) Market occupancy costs includes occupancy costs of our vending machine and hubs. It excludes occupancy costs related to reconditioning vehicles which are included in cost of sales and the portion related to corporate occupancy which are included in other costs.
(4) Logistics includes fuel, maintenance and depreciation related to operating our own transportation fleet, and third-party transportation fees, except the portion related to inbound transportation, which is included in cost of sales.
(5) Other costs include all other selling, general and administrative expenses such as IT expenses, corporate occupancy, professional services and insurance, limited warranty, and title and registration.
CARVANA CO. AND SUBSIDIARIES
LIQUIDITY RESOURCES
(Unaudited)
We had the following committed liquidity resources as well as pledging and other basket capacity available as of December 31, 2023 and 2022:
| | | | | | | | | | | |
| December 31, |
| 2023 | | 2022 |
| | | |
| (in millions) |
| Cash and cash equivalents | $ | 530 | | | $ | 434 | |
Availability under short-term revolving facilities (1) | 1,006 | | | 1,314 | |
| | | |
| Committed liquidity resources available | $ | 1,536 | | | $ | 1,748 | |
Unpledged real estate not included above (2) | — | | | 1,971 | |
Super senior debt capacity (3) | 1,262 | | | — | |
Pari passu senior debt capacity (3) | 250 | | | — | |
Unpledged beneficial interests in securitizations (4) | 80 | | | 69 | |
Total liquidity resources (5) | $ | 3,128 | | | $ | 3,788 | |
(1) Availability under short-term revolving facilities is the available amount we can borrow under our existing vehicle inventory floor plan and finance receivable facilities based on the pledgeable value of vehicle inventory and finance receivables on our balance sheet on the period end date. Availability under short-term revolving facilities is distinct from the total commitment amount of these facilities because it represents the currently borrowable amount, rather than committed future amounts that could be borrowed to finance future additional assets.
(2) As of December 31, 2022, unpledged real estate assets include real estate acquired as part of the ADESA Acquisition, and IRC, vending machine, and hub real estate assets that had not been sold and were not pledged on the period end date. Since our first sale-leaseback transaction in 2017, we have historically had flexible access to real estate financing and may continue to use various forms of real estate financing in the future, subject to the indentures governing the Senior Secured Notes. As of December 31, 2023, substantially all real estate was pledged as security for the Senior Secured Notes.
(3) Super senior debt capacity and pari passu senior debt capacity represents basket capacity to incur additional debt that could be senior or pari passu in lien priority as to the collateral securing the obligations under the Senior Secured Notes, subject to the terms and conditions set forth in the indentures governing the Senior Secured Notes. The availability of such additional sources depends on many factors and there can be no assurance that financing alternatives will be available to us in the future.
(4) Unpledged beneficial interests in securitizations includes retained beneficial interests in securitizations that have not been previously pledged or sold. We historically have financed the majority of our retained beneficial interests in securitizations and expect to continue to do so in the future.
(5) Our total liquidity resources are composed of cash and cash equivalents, availability under existing credit facilities, and additional unpledged assets, including real estate and securities, on our balance sheet that can be financed using traditional asset-based financing sources, and additional capacity under the indentures governing our Senior Secured Notes, which allow us to incur additional debt that can be senior or pari passu in lien priority as to the collateral securing the obligations under the Senior Secured Notes.
CARVANA CO. AND SUBSIDIARIES
RECONCILIATION OF GAAP TO NON-GAAP FINANCIAL MEASURES
(Unaudited)
Adjusted EBITDA; Adjusted EBITDA margin; Gross profit, non-GAAP; Total gross profit per retail unit, non-GAAP; SG&A, non-GAAP; and Total SG&A per retail unit, non-GAAP
Adjusted EBITDA; Adjusted EBITDA margin; Gross profit, non-GAAP; Total gross profit per retail unit, non-GAAP; SG&A, non-GAAP; and Total SG&A per retail unit, non-GAAP are supplemental measures of operating performance that do not represent and should not be considered an alternative to net income (loss), gross profit, or SG&A, as determined by GAAP.
Adjusted EBITDA is defined as net income (loss) plus income tax provision, interest expense, other (income) expense, net, depreciation and amortization in cost of sales and SG&A, goodwill impairment, share-based compensation including the CEO Milestone Gift in cost of sales and SG&A, and restructuring costs, minus revenue related to our Root Warrants and gain on debt extinguishment. Following the ADESA Acquisition, we are also excluding depreciation and amortization in cost of sales, which was historically only a small component of cost of sales. Adjusted EBITDA margin is Adjusted EBITDA as a percentage of total revenues.
Gross profit, non-GAAP is defined as GAAP gross profit plus depreciation and amortization in cost of sales, share-based compensation including the CEO Milestone Gift in cost of sales, and restructuring costs, minus revenue related to our Root Warrants. Total gross profit per retail unit, non-GAAP is Gross profit, non-GAAP divided by retail vehicle unit sales.
SG&A, non-GAAP is defined as GAAP SG&A minus depreciation and amortization in SG&A, share-based compensation including the CEO Milestone Gift in SG&A, and restructuring costs. Total SG&A per retail unit, non-GAAP is SG&A, non-GAAP divided by retail vehicle unit sales.
We use these non-GAAP measures to measure the operating performance of our business as a whole and relative to our total revenues and retail vehicle unit sales. We believe that these metrics are useful measures to us and to our investors because they exclude certain financial, capital structure, and non-cash items that we do not believe directly reflect our core operations and may not be indicative of our recurring operations, in part because they may vary widely across time and within our industry independent of the performance of our core operations. We believe that excluding these items enables us to more effectively evaluate our performance period-over-period and relative to our competitors. Adjusted EBITDA; Adjusted EBITDA margin; Gross profit, non-GAAP; Total gross profit per retail unit, non-GAAP; SG&A, non-GAAP; and Total SG&A per retail unit, non-GAAP may not be comparable to similarly titled measures provided by other companies due to potential differences in methods of calculations.
A reconciliation of Adjusted EBITDA to net income (loss), Gross profit, non-GAAP to gross profit, and SG&A, non-GAAP to SG&A, which are the most directly comparable GAAP measures, and calculations of Adjusted EBITDA margin, Total gross profit per retail unit, non-GAAP, and Total SG&A per retail unit, non-GAAP is as follows:
| | | | | | | | | | | | | | | | | | | | | | | | | | | | | |
| For the Three Months Ended |
| (dollars in millions, except per unit amounts) | Dec 31, 2022 | | Mar 31, 2023 | | Jun 30, 2023 | | Sep 30, 2023 | | Dec 31, 2023 |
| Net (loss) income | $ | (1,441) | | | $ | (286) | | | $ | (105) | | | $ | 741 | | | $ | (200) | |
| Income tax (benefit) provision | — | | | (2) | | | — | | | 29 | | | (2) | |
| Interest expense | 153 | | | 159 | | | 155 | | | 153 | | | 165 | |
| Other expense (income), net | 2 | | | (2) | | | (3) | | | 4 | | | — | |
| Depreciation and amortization expense in cost of sales | 43 | | | 44 | | | 44 | | | 42 | | | 39 | |
| Depreciation and amortization expense in SG&A | 57 | | | 49 | | | 46 | | | 45 | | | 43 | |
| | | | | | | | | |
| Share-based compensation expense in SG&A | 12 | | | 15 | | | 20 | | | 18 | | | 20 | |
| Goodwill impairment | 847 | | | — | | | — | | | — | | | — | |
| Root warrant revenue | (7) | | | (5) | | | (5) | | | (6) | | | (5) | |
| Gain on debt extinguishment | — | | | — | | | — | | | (878) | | | — | |
Restructuring (1) | 43 | | | 4 | | | 3 | | | — | | | — | |
| Adjusted EBITDA | $ | (291) | | | $ | (24) | | | $ | 155 | | | $ | 148 | | | $ | 60 | |
| | | | | | | | | |
| Total revenues | $ | 2,837 | | | $ | 2,606 | | | $ | 2,968 | | | $ | 2,773 | | | $ | 2,424 | |
| Net (loss) income margin | (50.8) | % | | (11.0) | % | | (3.5) | % | | 26.7 | % | | (8.3) | % |
| Adjusted EBITDA margin | (10.3) | % | | (0.9) | % | | 5.2 | % | | 5.3 | % | | 2.5 | % |
| | | | | | | | | |
| Gross profit | $ | 193 | | | $ | 341 | | | $ | 499 | | | $ | 482 | | | $ | 402 | |
| Depreciation and amortization expense in cost of sales | 43 | | | 44 | | | 44 | | | 42 | | | 39 | |
| | | | | | | | | |
| Root warrant revenue | (7) | | | (5) | | | (5) | | | (6) | | | (5) | |
Restructuring (1) | 3 | | | — | | | — | | | — | | | — | |
| Gross profit, non-GAAP | $ | 232 | | | $ | 380 | | | $ | 538 | | | $ | 518 | | | $ | 436 | |
| | | | | | | | | |
| Retail vehicle unit sales | 86,977 | | | 79,240 | | | 76,530 | | | 80,987 | | | 76,090 | |
| Total gross profit per retail unit | $ | 2,219 | | | $ | 4,303 | | | $ | 6,520 | | | $ | 5,952 | | | $ | 5,283 | |
| Total gross profit per retail unit, non-GAAP | $ | 2,667 | | | $ | 4,796 | | | $ | 7,030 | | | $ | 6,396 | | | $ | 5,730 | |
| | | | | | | | | |
| SG&A | $ | 632 | | | $ | 472 | | | $ | 452 | | | $ | 433 | | | $ | 439 | |
| Depreciation and amortization expense in SG&A | 57 | | | 49 | | | 46 | | | 45 | | | 43 | |
| Share-based compensation expense in SG&A | 12 | | | 15 | | | 20 | | | 18 | | | 20 | |
Restructuring (1) | 40 | | | 4 | | | 3 | | | — | | | — | |
| SG&A, non-GAAP | $ | 523 | | | $ | 404 | | | $ | 383 | | | $ | 370 | | | $ | 376 | |
| | | | | | | | | |
| Retail vehicle unit sales | 86,977 | | | 79,240 | | | 76,530 | | | 80,987 | | | 76,090 | |
| Total SG&A per retail unit | $ | 7,266 | | | $ | 5,957 | | | $ | 5,906 | | | $ | 5,347 | | | $ | 5,769 | |
| Total SG&A per retail unit, non-GAAP | $ | 6,013 | | | $ | 5,098 | | | $ | 5,005 | | | $ | 4,569 | | | $ | 4,942 | |
(1) Restructuring includes costs related to our November 2022 reduction in force, as well as lease termination and other restructuring expenses.
| | | | | | | | | | | | | | | | | | | | | | | | | | | | | | | | | | | | | | | | | | | | | | | | | | | | | |
| For the Year Ended | | For the Three Months Ended |
| (dollars in millions, except per unit amounts) | Dec 31, 2021 | | Mar 31, 2022 | | Jun 30, 2022 | | Sep 30, 2022 | | Dec 31, 2022 | | Mar 31, 2023 | | Jun 30, 2023 | | Sep 30, 2023 | | Dec 31, 2023 |
| Retail gross profit | $ | 697 | | | $ | 85 | | | $ | 133 | | | $ | 116 | | | $ | 37 | | | $ | 110 | | | $ | 204 | | | $ | 218 | | | $ | 214 | |
| Depreciation and amortization expense in cost of sales | 20 | | | 7 | | | 11 | | | 12 | | | 15 | | | 16 | | | 15 | | | 15 | | | 12 | |
| Share-based compensation expense in cost of sales | — | | | 8 | | | 6 | | | 2 | | | — | | | — | | | — | | | — | | | — | |
| Restructuring | — | | | — | | | 4 | | | — | | | 3 | | | — | | | — | | | — | | | — | |
| Retail gross profit, non-GAAP | $ | 717 | | | $ | 100 | | | $ | 154 | | | $ | 130 | | | $ | 55 | | | $ | 126 | | | $ | 219 | | | $ | 233 | | | $ | 226 | |
| | | | | | | | | | | | | | | | | |
| Retail vehicle unit sales | 425,237 | | | 105,185 | | | 117,564 | | | 102,570 | | | 86,977 | | | 79,240 | | | 76,530 | | | 80,987 | | | 76,090 | |
| Retail gross profit per retail unit | $ | 1,639 | | | $ | 808 | | | $ | 1,131 | | | $ | 1,131 | | | $ | 425 | | | $ | 1,388 | | | $ | 2,666 | | | $ | 2,692 | | | $ | 2,812 | |
| Retail gross profit per retail unit, non-GAAP | $ | 1,686 | | | $ | 950 | | | $ | 1,309 | | | $ | 1,268 | | | $ | 632 | | | $ | 1,591 | | | $ | 2,862 | | | $ | 2,877 | | | $ | 2,970 | |
| | | | | | | | | | | | | | | | | |
| Wholesale vehicle gross profit | $ | 189 | | | $ | 23 | | | $ | 40 | | | $ | 33 | | | $ | 16 | | | $ | 44 | | | $ | 39 | | | $ | 28 | | | $ | 28 | |
| Depreciation and amortization expense in cost of sales | 4 | | | 1 | | | 1 | | | 2 | | | 3 | | | 2 | | | 3 | | | 2 | | | 2 | |
| Wholesale vehicle gross profit, non-GAAP | $ | 193 | | | $ | 24 | | | $ | 41 | | | $ | 35 | | | $ | 19 | | | $ | 46 | | | $ | 42 | | | $ | 30 | | | $ | 30 | |
| | | | | | | | | | | | | | | | | |
| Retail vehicle unit sales | 425,237 | | | 105,185 | | | 117,564 | | | 102,570 | | | 86,977 | | | 79,240 | | | 76,530 | | | 80,987 | | | 76,090 | |
| Wholesale vehicle gross profit per retail unit | $ | 445 | | | $ | 219 | | | $ | 340 | | | $ | 321 | | | $ | 184 | | | $ | 555 | | | $ | 509 | | | $ | 347 | | | $ | 368 | |
| Wholesale vehicle gross profit per retail unit, non-GAAP | $ | 454 | | | $ | 229 | | | $ | 349 | | | $ | 340 | | | $ | 218 | | | $ | 580 | | | $ | 548 | | | $ | 372 | | | $ | 394 | |
| | | | | | | | | | | | | | | | | |
| Wholesale marketplace gross profit | $ | — | | | $ | — | | | $ | 5 | | | $ | 13 | | | $ | 4 | | | $ | 26 | | | $ | 26 | | | $ | 22 | | | $ | 12 | |
| Depreciation and amortization expense in cost of sales | — | | | — | | | 15 | | | 22 | | | 25 | | | 26 | | | 26 | | | 25 | | | 25 | |
| Wholesale marketplace gross profit, non-GAAP | $ | — | | | $ | — | | | $ | 20 | | | $ | 35 | | | $ | 29 | | | $ | 52 | | | $ | 52 | | | $ | 47 | | | $ | 37 | |
| | | | | | | | | | | | | | | | | |
| Retail vehicle unit sales | 425,237 | | | 105,185 | | | 117,564 | | | 102,570 | | | 86,977 | | | 79,240 | | | 76,530 | | | 80,987 | | | 76,090 | |
| Wholesale marketplace gross profit per retail unit | $ | — | | | $ | — | | | $ | 43 | | | $ | 127 | | | $ | 46 | | | $ | 328 | | | $ | 340 | | | $ | 271 | | | $ | 158 | |
| Wholesale marketplace gross profit per retail unit, non-GAAP | $ | — | | | $ | — | | | $ | 171 | | | $ | 341 | | | $ | 333 | | | $ | 656 | | | $ | 680 | | | $ | 579 | | | $ | 487 | |
| | | | | | | | | | | | | | | | | |
| Other gross profit | $ | 1,043 | | | $ | 190 | | | $ | 218 | | | $ | 197 | | | $ | 136 | | | $ | 161 | | | $ | 230 | | | $ | 214 | | | $ | 148 | |
| Root warrant revenue | — | | | — | | | — | | | — | | | (7) | | | (5) | | | (5) | | | (6) | | | (5) | |
| Other gross profit, non-GAAP | $ | 1,043 | | | $ | 190 | | | $ | 218 | | | $ | 197 | | | $ | 129 | | | $ | 156 | | | $ | 225 | | | $ | 208 | | | $ | 143 | |
| | | | | | | | | | | | | | | | | |
| Retail vehicle unit sales | 425,237 | | | 105,185 | | | 117,564 | | | 102,570 | | | 86,977 | | | 79,240 | | | 76,530 | | | 80,987 | | | 76,090 | |
| Other gross profit per retail unit | $ | 2,453 | | | $ | 1,806 | | | $ | 1,854 | | | $ | 1,921 | | | $ | 1,564 | | | $ | 2,032 | | | $ | 3,005 | | | $ | 2,642 | | | $ | 1,945 | |
| Other gross profit per retail unit, non-GAAP | $ | 2,453 | | | $ | 1,806 | | | $ | 1,854 | | | $ | 1,921 | | | $ | 1,483 | | | $ | 1,969 | | | $ | 2,940 | | | $ | 2,568 | | | $ | 1,879 | |
| | | | | | | | | | | | | | | | | | | | | | | | | | | | | | | | | | | | | | | | | | | | | | | | | | | | | | | | | | | |
| For the Years Ended December 31, |
| (dollars in millions, except per unit amounts) | 2014 | | 2015 | | 2016 | | 2017 | | 2018 | | 2019 | | 2020 | | 2021 | | 2022 | | 2023 |
| Net income (loss) | $ | (15) | | | $ | (37) | | | $ | (93) | | | $ | (164) | | | $ | (255) | | | $ | (365) | | | $ | (462) | | | $ | (287) | | | $ | (2,894) | | | $ | 150 | |
| Income tax provision | — | | | — | | | — | | | — | | | — | | | — | | | — | | | 1 | | | 1 | | | 25 | |
| Interest expense | — | | | 1 | | | 4 | | | 8 | | | 25 | | | 81 | | | 131 | | | 176 | | | 486 | | | 632 | |
| Other (income) expense, net | — | | | — | | | — | | | 1 | | | 1 | | | 4 | | | (1) | | | 6 | | | 70 | | | (1) | |
| Depreciation and amortization expense in cost of sales | — | | | — | | | — | | | — | | | — | | | — | | | 10 | | | 24 | | | 114 | | | 169 | |
| Depreciation and amortization expense in SG&A | 2 | | | 3 | | | 4 | | | 11 | | | 24 | | | 41 | | | 74 | | | 105 | | | 200 | | | 183 | |
| Share-based compensation expense in cost of sales | — | | | — | | | — | | | — | | | 4 | | | 5 | | | 1 | | | — | | | 16 | | | — | |
| Share-based compensation expense in SG&A | — | | | 1 | | | 1 | | | 6 | | | 21 | | | 30 | | | 25 | | | 39 | | | 69 | | | 73 | |
| Goodwill impairment | — | | | — | | | — | | | — | | | — | | | — | | | — | | | — | | | 847 | | | — | |
| Root warrant revenue | — | | | — | | | — | | | — | | | — | | | — | | | — | | | — | | | (7) | | | (21) | |
| Gain on debt extinguishment | — | | | — | | | — | | | — | | | — | | | — | | | — | | | — | | | — | | | (878) | |
Restructuring (1) | — | | | — | | | — | | | — | | | — | | | — | | | — | | | — | | | 57 | | | 7 | |
| Adjusted EBITDA | $ | (13) | | | $ | (32) | | | $ | (84) | | | $ | (138) | | | $ | (180) | | | $ | (204) | | | $ | (222) | | | $ | 64 | | | $ | (1,041) | | | $ | 339 | |
| | | | | | | | | | | | | | | | | | | |
| Total revenues | $ | 42 | | | $ | 130 | | | $ | 365 | | | $ | 859 | | | $ | 1,955 | | | $ | 3,940 | | | $ | 5,587 | | | $ | 12,814 | | | $ | 13,604 | | | $ | 10,771 | |
| Net income (loss) margin | (36.6) | % | | (28.2) | % | | (25.5) | % | | (19.1) | % | | (13.0) | % | | (9.3) | % | | (8.3) | % | | (2.2) | % | | (21.3) | % | | 1.4 | % |
| Adjusted EBITDA margin | (31.0) | % | | (24.6) | % | | (23.0) | % | | (16.1) | % | | (9.2) | % | | (5.2) | % | | (4.0) | % | | 0.5 | % | | (7.7) | % | | 3.1 | % |
| | | | | | | | | | | | | | | | | | | |
| Gross profit | $ | — | | | $ | 1 | | | $ | 19 | | | $ | 68 | | | $ | 197 | | | $ | 506 | | | $ | 794 | | | $ | 1,929 | | | $ | 1,246 | | | $ | 1,724 | |
| Depreciation and amortization expense in cost of sales | — | | | — | | | — | | | — | | | — | | | — | | | 10 | | | 24 | | | 114 | | | 169 | |
| Share-based compensation expense in cost of sales | — | | | — | | | — | | | — | | | 4 | | | 5 | | | 1 | | | — | | | 16 | | | — | |
| Root warrant revenue | — | | | — | | | — | | | — | | | — | | | — | | | — | | | — | | | (7) | | | (21) | |
Restructuring (1) | — | | | — | | | — | | | — | | | — | | | — | | | — | | | — | | | 7 | | | — | |
| Gross profit, non-GAAP | $ | — | | | $ | 1 | | | $ | 19 | | | $ | 68 | | | $ | 201 | | | $ | 511 | | | $ | 805 | | | $ | 1,953 | | | $ | 1,376 | | | $ | 1,872 | |
| | | | | | | | | | | | | | | | | | | |
| Retail vehicle unit sales | 2,105 | | | 6,523 | | | 18,761 | | | 44,252 | | | 94,108 | | | 177,549 | | | 244,111 | | | 425,237 | | | 412,296 | | | 312,847 | |
| Total gross profit per retail unit | $ | (201) | | | $ | 206 | | | $ | 1,023 | | | $ | 1,539 | | | $ | 2,090 | | | $ | 2,852 | | | $ | 3,253 | | | $ | 4,537 | | | $ | 3,022 | | | $ | 5,511 | |
| Total gross profit per retail unit, non-GAAP | $ | (201) | | | $ | 206 | | | $ | 1,013 | | | $ | 1,537 | | | $ | 2,136 | | | $ | 2,878 | | | $ | 3,298 | | | $ | 4,593 | | | $ | 3,337 | | | $ | 5,984 | |
| | | | | | | | | | | | | | | | | | | |
| SG&A | $ | 15 | | | $ | 37 | | | $ | 109 | | | $ | 223 | | | $ | 425 | | | $ | 787 | | | $ | 1,126 | | | $ | 2,033 | | | $ | 2,736 | | | $ | 1,796 | |
| Depreciation and amortization expense in SG&A | 2 | | | 3 | | | 4 | | | 11 | | | 24 | | | 41 | | | 74 | | | 105 | | | 200 | | | 183 | |
| Share-based compensation expense in SG&A | — | | | 1 | | | 1 | | | 6 | | | 21 | | | 30 | | | 25 | | | 39 | | | 69 | | | 73 | |
Restructuring (1) | — | | | — | | | — | | | — | | | — | | | — | | | — | | | — | | | 50 | | | 7 | |
| SG&A, non-GAAP | $ | 13 | | | $ | 33 | | | $ | 104 | | | $ | 206 | | | $ | 380 | | | $ | 716 | | | $ | 1,027 | | | $ | 1,889 | | | $ | 2,417 | | | $ | 1,533 | |
| | | | | | | | | | | | | | | | | | | |
| Retail vehicle unit sales | 2,105 | | | 6,523 | | | 18,761 | | | 44,252 | | | 94,108 | | | 177,549 | | | 244,111 | | | 425,237 | | | 412,296 | | | 312,847 | |
| Total SG&A per retail unit | $ | 6,976 | | | $ | 5,623 | | | $ | 5,810 | | | $ | 5,039 | | | $ | 4,516 | | | $ | 4,433 | | | $ | 4,613 | | | $ | 4,781 | | | $ | 6,636 | | | $ | 5,741 | |
| Total SG&A per retail unit, non-GAAP | $ | 6,166 | | | $ | 5,119 | | | $ | 5,543 | | | $ | 4,655 | | | $ | 4,038 | | | $ | 4,033 | | | $ | 4,207 | | | $ | 4,442 | | | $ | 5,862 | | | $ | 4,900 | |
(1) Restructuring includes costs related to our May 2022 and November 2022 reductions in force, as well as lease termination and other restructuring expenses.
| | | | | | | | | | | | | | | | | | | | | | | | | | | | | | | | | | | | | | | | | | | | | | | | | | | | | | | | | | | | | | | | | |
| For the Years Ended December 31, | | |
| (dollars in millions, except per unit amounts) | 2014 | | 2015 | | 2016 | | 2017 | | 2018 | | 2019 | | 2020 | | 2021 | | 2022 | | 2023 | | 2H 2023 |
| Retail gross profit | $ | — | | | $ | — | | | $ | 6 | | | $ | 32 | | | $ | 94 | | | $ | 238 | | | $ | 359 | | | $ | 697 | | | $ | 371 | | | $ | 746 | | | $ | 432 | |
| Depreciation and amortization in cost of sales | — | | | — | | | — | | | — | | | — | | | — | | | 10 | | | 20 | | | 45 | | | 58 | | | 27 | |
| Share-based compensation expense in cost of sales | — | | | — | | | — | | | — | | | 4 | | | 5 | | | 1 | | | — | | | 16 | | | — | | | — | |
| Restructuring | — | | | — | | | — | | | — | | | — | | | — | | | — | | | — | | | 7 | | | — | | | — | |
| Retail gross profit, non-GAAP | $ | — | | | $ | — | | | $ | 6 | | | $ | 32 | | | $ | 98 | | | $ | 243 | | | $ | 370 | | | $ | 717 | | | $ | 439 | | | $ | 804 | | | $ | 459 | |
| | | | | | | | | | | | | | | | | | | | | |
| Retail vehicle unit sales | 2,105 | | | 6,523 | | | 18,761 | | | 44,252 | | | 94,108 | | | 177,549 | | | 244,111 | | | 425,237 | | | 412,296 | | | 312,847 | | | 157,077 | |
| Retail gross profit per retail unit | $ | (283) | | | $ | 8 | | | $ | 320 | | | $ | 723 | | | $ | 999 | | | $ | 1,340 | | | $ | 1,471 | | | $ | 1,639 | | | $ | 900 | | | $ | 2,385 | | | $ | 2,750 | |
| Retail gross profit per retail unit, non-GAAP | $ | (283) | | | $ | 8 | | | $ | 310 | | | $ | 721 | | | $ | 1,045 | | | $ | 1,366 | | | $ | 1,516 | | | $ | 1,686 | | | $ | 1,065 | | | $ | 2,570 | | | $ | 2,922 | |
| | | | | | | | | | | | | | | | | | | | | | | | | | | | | | | | | | | | | | | | | | | | | | | | | | | | | | | | | | | |
| For the Year Ended December 31, |
| (dollars in millions, except per unit amounts) | 2014 | | 2015 | | 2016 | | 2017 | | 2018 | | 2019 | | 2020 | | 2021 | | 2022 | | 2023 |
| Net income (loss) | $ | (15) | | | $ | (37) | | | $ | (93) | | | $ | (164) | | | $ | (255) | | | $ | (365) | | | $ | (462) | | | $ | (287) | | | $ | (2,894) | | | $ | 150 | |
| Adjusted EBITDA | $ | (13) | | | $ | (32) | | | $ | (84) | | | $ | (138) | | | $ | (180) | | | $ | (204) | | | $ | (222) | | | $ | 64 | | | $ | (1,041) | | | $ | 339 | |
| | | | | | | | | | | | | | | | | | | |
| Retail vehicle unit sales | 2,105 | | | 6,523 | | | 18,761 | | | 44,252 | | | 94,108 | | | 177,549 | | | 244,111 | | | 425,237 | | | 412,296 | | | 312,847 | |
| Net income (loss) per unit | $ | (7,126) | | | $ | (5,672) | | | $ | (4,957) | | | $ | (3,706) | | | $ | (2,710) | | | $ | (2,056) | | | $ | (1,893) | | | $ | (675) | | | $ | (7,019) | | | $ | 479 | |
| Adjusted EBITDA per unit | $ | (6,176) | | | $ | (4,906) | | | $ | (4,477) | | | $ | (3,119) | | | $ | (1,913) | | | $ | (1,149) | | | $ | (909) | | | $ | 151 | | | $ | (2,525) | | | $ | 1,084 | |